Embed Size (px)
Citation preview

ARM ® DS-5™
Version 5.18
Debugger User Guide
Copyright © 2010-2014 ARM. All rights reserved.ARM DUI0446R

ARM ® DS-5™
Debugger User GuideCopyright © 2010-2014 ARM. All rights reserved.
Release Information
Document History
Issue Date Confidentiality Change
A 30 June 2010 Non-Confidential First release
B 30 September 2010 Non-Confidential Update for DS-5 version 5.2
C 30 November 2010 Non-Confidential Update for DS-5 version 5.3
D 30 January 2011 Non-Confidential Update for DS-5 version 5.4
E 30 May 2011 Non-Confidential Update for DS-5 version 5.5
F 30 July 2011 Non-Confidential Update for DS-5 version 5.6
G 30 September 2011 Non-Confidential Update for DS-5 version 5.7
H 30 November 2012 Non-Confidential Update for DS-5 version 5.8
I 28 February 2012 Non-Confidential Update for DS-5 version 5.9
J 30 May 2012 Non-Confidential Update for DS-5 version 5.10
K 30 July 2012 Non-Confidential Update for DS-5 version 5.11
L 30 October 2012 Non-Confidential Update for DS-5 version 5.12
M 15 December 2012 Non-Confidential Update for DS-5 version 5.13
N 15 March 2013 Non-Confidential Update for DS-5 version 5.14
O 14 June 2013 Non-Confidential Update for DS-5 version 5.15
P 13 September 2013 Non-Confidential Update for DS-5 version 5.16
Q 13 December 2013 Non-Confidential Update for DS-5 version 5.17
R 14 March 2014 Non-Confidential Update for DS-5 version 5.18
Proprietary Notice
Words and logos marked with ® or ™ are registered trademarks or trademarks of ARM ® in the EU and other countries, except asotherwise stated below in this proprietary notice. Other brands and names mentioned herein may be the trademarks of theirrespective owners.
Neither the whole nor any part of the information contained in, or the product described in, this document may be adapted orreproduced in any material form except with the prior written permission of the copyright holder.
The product described in this document is subject to continuous developments and improvements. All particulars of the product andits use contained in this document are given by ARM in good faith. However, all warranties implied or expressed, including but notlimited to implied warranties of merchantability, or fitness for purpose, are excluded.
This document is intended only to assist the reader in the use of the product. ARM shall not be liable for any loss or damage arisingfrom the use of any information in this document, or any error or omission in such information, or any incorrect use of the product.
Where the term ARM is used it means “ARM or any of its subsidiaries as appropriate”.
Confidentiality Status
This document is Non-Confidential. The right to use, copy and disclose this document may be subject to license restrictions inaccordance with the terms of the agreement entered into by ARM and the party that ARM delivered this document to.
Unrestricted Access is an ARM internal classification.
Product Status
The information in this document is Final, that is for a developed product.
ARM ® DS-5™
ARM DUI0446R Copyright © 2010-2014 ARM. All rights reserved. 2Non-Confidential

Web Address
http://www.arm.com
ARM ® DS-5™
ARM DUI0446R Copyright © 2010-2014 ARM. All rights reserved. 3Non-Confidential

ContentsARM ® DS-5™ Debugger User Guide
PrefaceAbout this book ..................................................... ..................................................... 15
Chapter 1 Getting started with DS-5™ Debugger1.1 About the debugger ................................................ ................................................ 1-191.2 Debugger concepts ................................................ ................................................ 1-201.3 Launching the debugger from Eclipse .................................. .................................. 1-221.4 About DS-5™ headless command-line debugger .......................... .......................... 1-231.5 Headless command-line debugger options .............................. .............................. 1-241.6 Specifying a custom configuration database using the headless command-line
debugger ........................................................ ........................................................ 1-271.7 DS-5™ Debug perspective keyboard shortcuts ........................................................ 1-291.8 DS-5™ Debugger command-line console keyboard shortcuts ................ ................ 1-301.9 Standards compliance in DS-5™ Debugger .............................. .............................. 1-31
Chapter 2 Configuring and connecting to a target2.1 Types of target connections .......................................... .......................................... 2-332.2 Configuring a connection to a Linux target using gdbserver ................. ................. 2-342.3 Configuring a connection to a Fixed Virtual Platform (FVP) for Linux application
debug ........................................................... ........................................................... 2-362.4 Adding a custom model ............................................. ............................................. 2-382.5 Configuring a connection to a Linux Kernel .............................. .............................. 2-402.6 About configuring connections to a Linux target using Application Debug with Rewind
Support .................................................................................................................... 2-42
ARM DUI0446R Copyright © 2010-2014 ARM. All rights reserved. 4Non-Confidential

2.7 About configuring connections to an Android target using Native Application/LibraryDebug with Rewind Support .................................................................................... 2-47
2.8 Configuring a connection to a bare-metal target .......................... .......................... 2-502.9 Configuring an Event Viewer connection to a bare-metal target .............. .............. 2-522.10 About the target configuration import utility .............................. .............................. 2-542.11 Adding a new platform .............................................. .............................................. 2-562.12 Adding a new configuration database to DS-5 ............................ ............................ 2-582.13 Exporting an existing launch configuration .............................................................. 2-602.14 Importing an existing launch configuration ............................... ............................... 2-632.15 Disconnecting from a target .......................................... .......................................... 2-65
Chapter 3 Working with the target configuration editor3.1 About the target configuration editor ................................... ................................... 3-673.2 Target configuration editor - Overview tab ............................... ............................... 3-683.3 Target configuration editor - Memory tab ................................ ................................ 3-703.4 Target configuration editor - Peripherals tab ............................. ............................. 3-723.5 Target configuration editor - Registers tab ............................... ............................... 3-743.6 Target configuration editor - Group View tab ............................. ............................. 3-763.7 Target configuration editor - Enumerations tab ........................... ........................... 3-783.8 Target configuration editor - Configurations tab ........................... ........................... 3-803.9 Scenario demonstrating how to create a new target configuration file .................... 3-823.10 Creating a power domain for a target ...................................................................... 3-943.11 Creating a Group list ................................................................................................ 3-953.12 Importing an existing target configuration file .......................................................... 3-973.13 Exporting a target configuration file .................................... .................................... 3-99
Chapter 4 Controlling execution4.1 About loading an image on to the target ................................................................ 4-1024.2 About loading debug information into the debugger .............................................. 4-1044.3 About passing arguments to main() ................................... ................................... 4-1064.4 Running an image ................................................ ................................................ 4-1074.5 Working with breakpoints and watchpoints ............................. ............................. 4-1084.6 Working with conditional breakpoints .................................. .................................. 4-1154.7 About pending breakpoints and watchpoints ............................ ............................ 4-1194.8 Setting a tracepoint ................................................................................................ 4-1204.9 Setting Streamline start and stop points ................................................................ 4-1214.10 Stepping through an application ............................................................................ 4-1224.11 Handling Unix signals ............................................................................................ 4-1244.12 Handling processor exceptions ...................................... ...................................... 4-1264.13 Configuring the debugger path substitution rules .................................................. 4-128
Chapter 5 Examining the target5.1 Examining the target execution environment ............................ ............................ 5-1315.2 Examining the call stack ........................................................................................ 5-1335.3 About trace support ............................................... ............................................... 5-1345.4 About post-mortem debugging of trace data ............................ ............................ 5-137
Chapter 6 Debugging embedded systems6.1 About endianness .................................................................................................. 6-1396.2 About accessing AHB, APB, and AXI buses ............................ ............................ 6-1406.3 About virtual and physical memory ........................................................................ 6-141
ARM DUI0446R Copyright © 2010-2014 ARM. All rights reserved. 5Non-Confidential

6.4 About debugging hypervisors ................................................................................ 6-1426.5 About debugging big.LITTLE systems ................................. ................................. 6-1436.6 About debugging bare-metal symmetric multiprocessing systems ........................ 6-1446.7 About debugging multi-threaded applications ........................... ........................... 6-1466.8 About debugging shared libraries .......................................................................... 6-1476.9 About debugging a Linux kernel ............................................................................ 6-1496.10 About debugging Linux kernel modules ................................ ................................ 6-1516.11 About debugging FreeRTOS ™ ...................................... ...................................... 6-1536.12 About debugging TrustZone enabled targets ............................ ............................ 6-1546.13 About debugging a Unified Extensible Firmware Interface (UEFI) ........................ 6-1566.14 About application rewind ........................................... ........................................... 6-1576.15 About debugging ThreadX .......................................... .......................................... 6-1596.16 About DTSL (Debug and Trace Service Layer) .......................... .......................... 6-1606.17 About CoreSight™ Target Access Library ............................... ............................... 6-1616.18 About debugging caches ........................................... ........................................... 6-162
Chapter 7 Controlling runtime messages7.1 About semihosting and top of memory .................................................................. 7-1667.2 Working with semihosting ...................................................................................... 7-1687.3 Enabling automatic semihosting support in the debugger .................. .................. 7-1697.4 Controlling semihosting messages using the command-line console ......... ......... 7-1707.5 Controlling the output of logging messages ............................. ............................. 7-1717.6 About Log4j configuration files ....................................... ....................................... 7-1727.7 Customizing the output of logging messages from the debugger ............ ............ 7-173
Chapter 8 Debugging with scripts8.1 Exporting DS-5 Debugger commands generated during a debug session ..... ..... 8-1778.2 Creating a DS-5 Debugger script ..................................... ..................................... 8-1788.3 Creating a CMM-style script ......................................... ......................................... 8-1798.4 About Jython scripts ............................................... ............................................... 8-1808.5 Jython script concepts and interfaces ................................. ................................. 8-1828.6 Creating Jython projects in Eclipse for DS-5™ ........................... ........................... 8-1838.7 Creating a Jython script ............................................ ............................................ 8-1868.8 Running a script .................................................. .................................................. 8-188
Chapter 9 Working with the Snapshot Viewer9.1 About the Snapshot Viewer ......................................... ......................................... 9-1919.2 Components of a Snapshot Viewer initialization file .............................................. 9-1939.3 Connecting to the Snapshot Viewer ................................... ................................... 9-1969.4 Considerations when creating debugger scripts for the Snapshot Viewer ...... ...... 9-197
Chapter 10 DS-5 Debug perspectives and views10.1 App Console view ................................................................................................ 10-20010.2 ARM Asm Info view .............................................. .............................................. 10-20210.3 ARM assembler editor ............................................ ............................................ 10-20310.4 Breakpoints view ................................................ ................................................ 10-20610.5 C/C++ editor .................................................... .................................................... 10-21010.6 Commands view .................................................................................................. 10-21310.7 Debug Control view .............................................. .............................................. 10-21610.8 Disassembly view ................................................................................................ 10-22010.9 Events view .................................................... .................................................... 10-224
ARM DUI0446R Copyright © 2010-2014 ARM. All rights reserved. 6Non-Confidential

10.10 Event Viewer Settings dialog box ........................................................................ 10-22610.11 Expressions view ................................................ ................................................ 10-22910.12 Functions view .................................................. .................................................. 10-23210.13 History view .................................................... .................................................... 10-23410.14 Memory view ................................................... ................................................... 10-23610.15 Modules view ................................................... ................................................... 10-24010.16 Registers view .................................................. .................................................. 10-24310.17 OS Data view ................................................... ................................................... 10-24610.18 Cache Data view ................................................ ................................................ 10-24710.19 Screen view .................................................... .................................................... 10-24910.20 Scripts view .................................................... .................................................... 10-25210.21 Target Console view ............................................................................................ 10-25410.22 Target view .......................................................................................................... 10-25510.23 Trace view ..................................................... ..................................................... 10-25710.24 Trace Control view ............................................... ............................................... 10-26110.25 Variables view .................................................. .................................................. 10-26310.26 Auto Refresh Properties dialog box .................................. .................................. 10-26610.27 Memory Exporter dialog box ................................................................................ 10-26710.28 Memory Importer dialog box ................................................................................ 10-26810.29 Fill Memory dialog box ............................................ ............................................ 10-26910.30 Export trace report dialog box ...................................... ...................................... 10-27010.31 Breakpoint properties dialog box .................................... .................................... 10-27210.32 Watchpoint properties dialog box .................................... .................................... 10-27610.33 Tracepoint properties dialog box .................................... .................................... 10-27710.34 Manage Signals dialog box ........................................ ........................................ 10-27810.35 Functions Filter dialog box ......................................... ......................................... 10-28010.36 Jython Script Parameters dialog box ................................. ................................. 10-28110.37 Debug Configurations - Connection tab ............................... ............................... 10-28210.38 Debug Configurations - Files tab .................................... .................................... 10-28510.39 Debug Configurations - Debugger tab ................................ ................................ 10-28910.40 Debug Configurations - OS Awareness tab ............................ ............................ 10-29210.41 Debug Configurations - Arguments tab ............................... ............................... 10-29310.42 Debug Configurations - Environment tab .............................. .............................. 10-29510.43 DTSL Configuration Editor dialog box ................................ ................................ 10-29710.44 Configuration database panel .............................................................................. 10-29910.45 About the Remote System Explorer .................................. .................................. 10-30110.46 Remote Systems view ........................................................................................ 10-30210.47 Remote System Details view ....................................... ....................................... 10-30310.48 Target management terminal for serial and SSH connections ............................ 10-30410.49 Remote Scratchpad view .......................................... .......................................... 10-30510.50 Remote Systems terminal for SSH connections .................................................. 10-30610.51 New Terminal Connection dialog box .................................................................. 10-30710.52 Debug Hardware Configure IP view .................................. .................................. 10-30910.53 Debug Hardware Firmware Installer view ............................................................ 10-31110.54 Connection Browser dialog box ..................................... ..................................... 10-31310.55 DS-5 Debugger menu and toolbar icons .............................. .............................. 10-314
Chapter 11 Troubleshooting11.1 ARM Linux problems and solutions .................................. .................................. 11-31811.2 Enabling internal logging from the debugger ........................... ........................... 11-319
ARM DUI0446R Copyright © 2010-2014 ARM. All rights reserved. 7Non-Confidential

11.3 Target connection problems and solutions .......................................................... 11-320
Chapter 12 File-based flash programming in DS-5™
12.1 About file-based flash programming in DS-5™ .................................................... 12-32212.2 Flash programming configuration ........................................................................ 12-32412.3 Creating an extension database for flash programming ...................................... 12-32612.4 About using or extending the supplied Keil flash method .................................... 12-32712.5 About creating a new flash method .................................. .................................. 12-32912.6 About testing the flash configuration ................................. ................................. 12-33312.7 About flash method parameters ..................................... ..................................... 12-33412.8 About getting data to the flash algorithm .............................. .............................. 12-33512.9 About interacting with the target .......................................................................... 12-336
Chapter 13 Writing OS awareness for DS-5™ Debugger13.1 About Writing operating system awareness for DS-5™ Debugger ........... ........... 13-34413.2 Creating an OS awareness extension ................................ ................................ 13-34513.3 Implementing the OS awareness API .................................................................. 13-34913.4 Enabling the OS awareness ................................................................................ 13-35113.5 Implementing thread awareness .................................... .................................... 13-35513.6 Implementing data views .......................................... .......................................... 13-35813.7 Programming advice and noteworthy information ....................... ....................... 13-361
ARM DUI0446R Copyright © 2010-2014 ARM. All rights reserved. 8Non-Confidential

List of FiguresARM ® DS-5™ Debugger User Guide
Figure 2-1 Adding a new configuration database ................................................................................... 2-59Figure 2-2 Export launch configuration dialog box .................................................................................. 2-60Figure 2-3 Launch configuration selection panels .................................................................................. 2-61Figure 2-4 Import launch configuration dialog box .................................................................................. 2-63Figure 2-5 Launch configuration file selection panels ............................................................................. 2-64Figure 3-1 Target configuration editor - Overview tab ............................................................................ 3-69Figure 3-2 Target configuration editor - Memory tab .............................................................................. 3-71Figure 3-3 Target configuration editor - Peripherals tab ......................................................................... 3-73Figure 3-4 Target configuration editor - Registers tab ............................................................................ 3-75Figure 3-5 Target configuration editor - Group View tab ......................................................................... 3-77Figure 3-6 Target configuration editor - Enumerations tab ..................................................................... 3-78Figure 3-7 Target configuration editor - Configuration tab ...................................................................... 3-81Figure 3-8 LED register and bitfields ...................................................................................................... 3-82Figure 3-9 Core module and LCD control register ................................................................................. 3-83Figure 3-10 Creating a Memory map ........................................................................................................ 3-84Figure 3-11 Creating a peripheral ............................................................................................................. 3-85Figure 3-12 Creating a standalone register .............................................................................................. 3-86Figure 3-13 Creating a peripheral register ................................................................................................ 3-87Figure 3-14 Creating enumerations .......................................................................................................... 3-88Figure 3-15 Assigning enumerations ........................................................................................................ 3-89Figure 3-16 Creating remapping rules ...................................................................................................... 3-90Figure 3-17 Creating a memory region for remapping by a control register ............................................. 3-91Figure 3-18 Applying the Remap_RAM_block1 map rule ......................................................................... 3-92
ARM DUI0446R Copyright © 2010-2014 ARM. All rights reserved. 9Non-Confidential

Figure 3-19 Applying the Remap_ROM map rule ..................................................................................... 3-93Figure 3-20 Power Domain Configurations ............................................................................................... 3-94Figure 3-21 Creating a group list .............................................................................................................. 3-95Figure 3-22 Selecting an existing target configuration file ........................................................................ 3-97Figure 3-23 Importing the target configuration file .................................................................................... 3-98Figure 3-24 Exporting to C header file ...................................................................................................... 3-99Figure 3-25 Selecting the files ............................................................................................................... 3-100Figure 4-1 Load File dialog box ............................................................................................................ 4-102Figure 4-2 Load additional debug information dialog box ..................................................................... 4-105Figure 4-3 Setting an execution breakpoint .......................................................................................... 4-110Figure 4-4 Setting a data watchpoint .................................................................................................... 4-111Figure 4-5 Viewing the properties of a data watchpoint ........................................................................ 4-111Figure 4-6 Breakpoint Properties dialog ............................................................................................... 4-116Figure 4-7 Debug Control view ............................................................................................................. 4-122Figure 4-8 Managing signal handler settings ........................................................................................ 4-124Figure 4-9 Manage exception handler settings ..................................................................................... 4-126Figure 4-10 Path Substitution dialog box ................................................................................................ 4-128Figure 4-11 Edit Substitute Path dialog box ............................................................................................ 4-129Figure 5-1 Target execution environment ............................................................................................. 5-131Figure 5-2 Debug Control view ............................................................................................................. 5-133Figure 6-1 Threading call stacks in the Debug Control view ................................................................. 6-146Figure 6-2 Adding individual shared library files ................................................................................... 6-147Figure 6-3 Modifying the shared library search paths ........................................................................... 6-148Figure 6-4 Cache Data view (showing L1 TLB cache) .......................................................................... 6-162Figure 6-5 DTSL Configuration Editor (Shown with cache read option enabled) ................................. 6-163Figure 7-1 Typical layout between top of memory, stack, and heap ..................................................... 7-166Figure 8-1 Commands generated during a debug session ................................................................... 8-177Figure 8-2 PyDev project wizard ........................................................................................................... 8-183Figure 8-3 PyDev project settings ......................................................................................................... 8-184Figure 8-4 Jython auto-completion and help ......................................................................................... 8-186Figure 8-5 Scripts view ......................................................................................................................... 8-188Figure 10-1 App Console view .............................................................................................................. 10-200Figure 10-2 ARM Asm Info view ........................................................................................................... 10-202Figure 10-3 ARM assembler editor ....................................................................................................... 10-203Figure 10-4 Breakpoints view ............................................................................................................... 10-206Figure 10-5 C/C++ editor ...................................................................................................................... 10-210Figure 10-6 Show disassembly for selected source line ....................................................................... 10-212Figure 10-7 Commands view ................................................................................................................ 10-213Figure 10-8 Set the current working directory ....................................................................................... 10-216Figure 10-9 Debug Control view ........................................................................................................... 10-217Figure 10-10 Disassembly view .............................................................................................................. 10-220Figure 10-11 Events view (Shown with all ports enabled for an ETB:ITM trace source) ....................... 10-224Figure 10-12 Event Viewer Settings (Shown with all Masters and Channels enabled for an ETR:STM trace
source) ............................................................................................................................... 10-227Figure 10-13 Expressions view ............................................................................................................... 10-229Figure 10-14 Functions view ................................................................................................................... 10-232Figure 10-15 History view ....................................................................................................................... 10-234Figure 10-16 Memory view ..................................................................................................................... 10-236Figure 10-17 Modules view showing shared libraries ............................................................................. 10-241Figure 10-18 Modules view showing operating system modules ............................................................ 10-241
ARM DUI0446R Copyright © 2010-2014 ARM. All rights reserved. 10Non-Confidential

Figure 10-19 Registers view ................................................................................................................... 10-243Figure 10-20 OS Data view (showing Keil CMSIS-RTOS RTX Tasks) ................................................... 10-246Figure 10-21 Cache Data view (showing L1 TLB cache) ........................................................................ 10-247Figure 10-22 Screen buffer parameters for the Fireworks example running on a BeagleBoard ............. 10-249Figure 10-23 Screen view ....................................................................................................................... 10-250Figure 10-24 Scripts view ....................................................................................................................... 10-252Figure 10-25 Target view ........................................................................................................................ 10-255Figure 10-26 Trace view with a scale of 1:1 ........................................................................................... 10-258Figure 10-27 Trace Control view ............................................................................................................. 10-261Figure 10-28 Variables view ................................................................................................................... 10-263Figure 10-29 Auto Refresh properties dialog box ................................................................................... 10-266Figure 10-30 Memory Exporter dialog box .............................................................................................. 10-267Figure 10-31 Memory Importer dialog box .............................................................................................. 10-268Figure 10-32 Memory Fill dialog box ....................................................................................................... 10-269Figure 10-33 Export trace report dialog box ........................................................................................... 10-271Figure 10-34 Breakpoint properties dialog box ....................................................................................... 10-273Figure 10-35 Watchpoint properties dialog box ...................................................................................... 10-276Figure 10-36 Tracepoint properties dialog box ....................................................................................... 10-277Figure 10-37 Managing signal handler settings ...................................................................................... 10-279Figure 10-38 Manage exception handler settings ................................................................................... 10-279Figure 10-39 Function filter dialog box .................................................................................................... 10-280Figure 10-40 Jython Script Parameters dialog box ................................................................................. 10-281Figure 10-41 Connection tab (Shown with connection configuration for an FVP with virtual file system support
enabled) ............................................................................................................................. 10-284Figure 10-42 Files tab (Shown with file system configuration for an application on an FVP) ................. 10-286Figure 10-43 Debugger tab (Shown with settings for application starting point and search paths) ........ 10-291Figure 10-44 OS Awareness tab ............................................................................................................. 10-292Figure 10-45 Arguments tab .................................................................................................................. 10-294Figure 10-46 New Environment Variable dialog box ............................................................................... 10-295Figure 10-47 Environment tab (Shown with environment variables configured for an FVP) ................. 10-296Figure 10-48 DTSL Configuration Editor (Shown with Trace capture method set to DSTREAM ) ......... 10-297Figure 10-49 Configuration Database panel .......................................................................................... 10-300Figure 10-50 Remote Systems view ....................................................................................................... 10-302Figure 10-51 Remote System Details view ............................................................................................. 10-303Figure 10-52 Terminal view .................................................................................................................... 10-304Figure 10-53 Remote Scratchpad ........................................................................................................... 10-305Figure 10-54 Remote Systems Terminals view ...................................................................................... 10-306Figure 10-55 Terminal Settings dialog box ............................................................................................. 10-307Figure 10-56 Debug Hardware Configure IP view .................................................................................. 10-309Figure 10-57 Debug Hardware Firmware Installer (Shown with DSTREAM firmware update process) .... 10-
311Figure 10-58 Connection Browser (Showing a USB connected DSTREAM) ......................................... 10-313Figure 12-1 DS-5 File Flash Architecture .............................................................................................. 12-323Figure 13-1 Eclipse preferences for mydb ............................................................................................ 13-346Figure 13-2 Custom OS awareness displayed in Eclipse Debug Configurations dialog ....................... 13-348Figure 13-3 myos No OS Support ......................................................................................................... 13-351Figure 13-4 myos waiting for target to stop .......................................................................................... 13-352Figure 13-5 myos Enabled .................................................................................................................... 13-353Figure 13-6 myos waiting for OS initialization ....................................................................................... 13-354Figure 13-7 myos Debug Control view data .......................................................................................... 13-356
ARM DUI0446R Copyright © 2010-2014 ARM. All rights reserved. 11Non-Confidential

Figure 13-8 myos Empty Tasks table ................................................................................................... 13-359Figure 13-9 myos populated Tasks table .............................................................................................. 13-360
ARM DUI0446R Copyright © 2010-2014 ARM. All rights reserved. 12Non-Confidential

List of TablesARM ® DS-5™ Debugger User Guide
Table 2-1 ETM/PTM versions for each type of processor ..................................................................... 2-55Table 3-1 DMA map register SYS_DMAPSR0 ...................................................................................... 3-82Table 3-2 Control bit that remaps an area of memory ........................................................................... 3-83Table 7-1 Log4j Components .............................................................................................................. 7-172Table 10-1 Files tab options available for each Debug operation ........................................................ 10-285Table 10-2 DS-5 Debugger icons ....................................................................................................... 10-314Table 10-3 Perspective icons ............................................................................................................. 10-315Table 10-4 View icons ........................................................................................................................ 10-315Table 10-5 View markers .................................................................................................................... 10-315Table 10-6 Miscellaneous icons ......................................................................................................... 10-316
ARM DUI0446R Copyright © 2010-2014 ARM. All rights reserved. 13Non-Confidential

Preface
This preface introduces the ARM ® DS-5™ Debugger User Guide.
This section contains the following subsections:
• About this book on page 15.
ARM DUI0446R Copyright © 2010-2014 ARM. All rights reserved. 14Non-Confidential

About this bookThis book describes how to use the debugger to debug Linux applications, bare-metal, Real-TimeOperating System (RTOS), Linux, and Android platforms.
Using this book
This book is organized into the following chapters:
Chapter 1 Getting started with DS-5™ Debugger
Gives an introduction to some of the debugger concepts and explains how to launch the debugger.
Chapter 2 Configuring and connecting to a target
Describes how to configure and connect to a debug target using ARM DS-5 Debugger in the EclipseIntegrated Development Environment (IDE).
Chapter 3 Working with the target configuration editor
Describes how to use the editor when developing a project for an ARM target.
Chapter 4 Controlling execution
Describes how to stop the target execution when certain events occur, and when certain conditions aremet.
Chapter 5 Examining the target
This chapter describes how to examine registers, variables, memory, and the call stack.
Chapter 6 Debugging embedded systems
Gives an introduction to debugging embedded systems.
Chapter 7 Controlling runtime messages
Describes semihosting and how to control runtime messages.
Chapter 8 Debugging with scripts
Describes how to use scripts containing debugger commands to enable you to automate debuggingoperations.
Chapter 9 Working with the Snapshot Viewer
This chapter describes how to work with the Snapshot Viewer.
Chapter 10 DS-5 Debug perspectives and views
Describes the DS-5 Debug perspective and related views in the Eclipse Integrated DevelopmentEnvironment (IDE).
Chapter 11 Troubleshooting
Describes how to diagnose problems when debugging applications using DS-5 Debugger.
Chapter 12 File-based flash programming in DS-5™
Describes the file-based flash programming options available in DS-5.
Chapter 13 Writing OS awareness for DS-5™ Debugger
Preface About this book
ARM DUI0446R Copyright © 2010-2014 ARM. All rights reserved. 15Non-Confidential

Describes the OS awareness feature available in DS-5.
Glossary
The ARM Glossary is a list of terms used in ARM documentation, together with definitions for thoseterms. The ARM Glossary does not contain terms that are industry standard unless the ARM meaningdiffers from the generally accepted meaning.
See the ARM Glossary for more information.
Typographic conventions
italicIntroduces special terminology, denotes cross-references, and citations.
boldHighlights interface elements, such as menu names. Denotes signal names. Also used for termsin descriptive lists, where appropriate.
monospaceDenotes text that you can enter at the keyboard, such as commands, file and program names,and source code.
monospaceDenotes a permitted abbreviation for a command or option. You can enter the underlined textinstead of the full command or option name.
monospace italicDenotes arguments to monospace text where the argument is to be replaced by a specific value.
monospace boldDenotes language keywords when used outside example code.
<and>Encloses replaceable terms for assembler syntax where they appear in code or code fragments.For example:
MRC p15, 0 <Rd>, <CRn>, <CRm>, <Opcode_2>
SMALL CAPITALS
Used in body text for a few terms that have specific technical meanings, that are defined in theARM glossary. For example, IMPLEMENTATION DEFINED, IMPLEMENTATION SPECIFIC, UNKNOWN, andUNPREDICTABLE.
Feedback
Feedback on this product
If you have any comments or suggestions about this product, contact your supplier and give:
• The product name.• The product revision or version.• An explanation with as much information as you can provide. Include symptoms and diagnostic
procedures if appropriate.
Feedback on content
If you have comments on content then send an e-mail to [email protected]. Give:
• The title.• The number ARM DUI0446R.• The page number(s) to which your comments refer.• A concise explanation of your comments.
ARM also welcomes general suggestions for additions and improvements.
Preface About this book
ARM DUI0446R Copyright © 2010-2014 ARM. All rights reserved. 16Non-Confidential

Note
ARM tests the PDF only in Adobe Acrobat and Acrobat Reader, and cannot guarantee the quality of therepresented document when used with any other PDF reader.
Other information
• ARM Information Center.• ARM Technical Support Knowledge Articles.• Support and Maintenance.• ARM Glossary.
Preface About this book
ARM DUI0446R Copyright © 2010-2014 ARM. All rights reserved. 17Non-Confidential

Chapter 1Getting started with DS-5™ Debugger
Gives an introduction to some of the debugger concepts and explains how to launch the debugger.It contains the following sections:
• 1.1 About the debugger on page 1-19.• 1.2 Debugger concepts on page 1-20.• 1.3 Launching the debugger from Eclipse on page 1-22.• 1.4 About DS-5™ headless command-line debugger on page 1-23.• 1.5 Headless command-line debugger options on page 1-24.• 1.6 Specifying a custom configuration database using the headless command-line debugger
on page 1-27.• 1.7 DS-5™ Debug perspective keyboard shortcuts on page 1-29.• 1.8 DS-5™ Debugger command-line console keyboard shortcuts on page 1-30.• 1.9 Standards compliance in DS-5™ Debugger on page 1-31.
ARM DUI0446R Copyright © 2010-2014 ARM. All rights reserved. 1-18Non-Confidential

1.1 About the debuggerDS-5™ Debugger provides a powerful tool for debugging applications on both hardware targets andmodels using ARM ® architecture-based processors.
Using DS-5 Debugger, you can have complete control over the flow of the execution so that you canquickly isolate and correct errors.
The following features are provided:
• Loading images and symbols.• Running images.• Breakpoints and watchpoints.• Source and instruction level stepping.• Accessing variables and register values.• Navigating the call stack.• Support for handling exceptions and Linux signals.
• Debugging multi-threaded Linux applications.• Debugging Linux kernel modules, boot code, and kernel porting.• Debugging bare-metal Symmetric MultiProcessing (SMP) systems.
The debugger supports a comprehensive set of DS-5 Debugger commands that can be executed in theEclipse Integrated Development Environment (IDE), script files, or a command-line console. In addition,there is a small subset of CMM-style commands sufficient for running target initialization scripts. CMMis a scripting language supported by some third-party debuggers. To execute CMM-style commands, youmust create a debugger script file containing the CMM-style commands and then use the DS-5 Debuggersource command to run the script.
To help you get started, there are some tutorials that you can follow showing you how to run and debugapplications using DS-5 tools.
Related references2.1 Types of target connections on page 2-33.1.2 Debugger concepts on page 1-20.
Related informationARM DS-5 tutorials.DS-5 Debugger commands.CMM-style commands supported by the debugger.
1 Getting started with DS-5™ Debugger1.1 About the debugger
ARM DUI0446R Copyright © 2010-2014 ARM. All rights reserved. 1-19Non-Confidential

1.2 Debugger conceptsLists the main concepts involved when debugging applications.
DebuggerA debugger is software running on a host computer that enables you to make use of a debugadapter to examine and control the execution of software running on a debug target.
Debug sessionA debug session begins when you connect the debugger to a target or a model for debuggingsoftware running on the target and ends when you disconnect the host software from the target.
Debug targetAt an early stage of product development there might be no hardware so the expected behaviorof the hardware is simulated by software. This is referred to in the debugger documentation as amodel. Even though you might run a model on the same computer as the debugger, it is useful tothink of the target as a separate piece of hardware.
Alternatively, you can build a prototype product on a printed circuit board, including one ormore processors on which you run and debug the application. This is referred to in the debuggerdocumentation as a hardware target.
Debug adapterA debug adapter performs the actions requested by the debugger on the target.
For example:
• Setting breakpoints.• Reading from memory.• Writing to memory.
The debug adapter is not the application being debugged, nor the debugger itself.
Examples include:
• Debug hardware adapter:
— ARM DSTREAM™ unit.— ARM RVI™ unit.— ARM VSTREAM™ unit.
• Debug software adapter:
— gdbserver.
Configuration databaseThe configuration database is where DS-5 Debugger stores information about the processors,devices, and boards it can connect to.
The database exists as a series of XML files, python scripts, and other miscellaneous files withinthe <DS-5 installation directory>/sw/debugger/configdb/directory.
DS-5 comes pre-configured with support for a wide variety of devices out-of-the-box, and youcan view these within the Debug Configuration dialog within Eclipse IDE.
You can also add support for your own devices using the cdbimport tool.
1 Getting started with DS-5™ Debugger1.2 Debugger concepts
ARM DUI0446R Copyright © 2010-2014 ARM. All rights reserved. 1-20Non-Confidential

ContextsEach processor in the target can have a process currently in execution. Each process uses valuesstored in variables, registers, and other memory locations. These values can change during theexecution of the process.
The context of a process describes its current state, as defined principally by the call stack thatlists all the currently active calls.
The context changes when:
• A function is called.• A function returns.• An interrupt or an exception occurs.
Because variables can have class, local, or global scope, the context determines which variablesare currently accessible. Every process has its own context. When execution of a process stops,you can examine and change values in its current context.
ScopeThe scope of a variable is determined by the point within an application at which it is defined.
Variables can have values that are relevant within:
• A specific class only (class).• A specific function only (local).• A specific file only (static global).• The entire application (global).
Related concepts1.4 About DS-5™ headless command-line debugger on page 1-23.
Related tasks2.6.1 Connecting to an existing application and application rewind session on page 2-42.2.6.2 Downloading your application and application rewind server on the target system on page 2-44.2.6.3 Starting the application rewind server and debugging the target-resident applicationon page 2-45.2.3 Configuring a connection to a Fixed Virtual Platform (FVP) for Linux application debugon page 2-36.2.2 Configuring a connection to a Linux target using gdbserver on page 2-34.2.5 Configuring a connection to a Linux Kernel on page 2-40.2.8 Configuring a connection to a bare-metal target on page 2-50.2.9 Configuring an Event Viewer connection to a bare-metal target on page 2-52.1.6 Specifying a custom configuration database using the headless command-line debuggeron page 1-27.
Related informationSetting up the ARM DSTREAM Hardware.Setting up the ARM RVI Hardware.
1 Getting started with DS-5™ Debugger1.2 Debugger concepts
ARM DUI0446R Copyright © 2010-2014 ARM. All rights reserved. 1-21Non-Confidential

1.3 Launching the debugger from EclipseDescribes how to launch Eclipse and select the DS-5 Debug perspective.
Procedure
1. Launch Eclipse:
• On Windows, select Start > All Programs > ARM DS-5 > Eclipse for DS-5.• On Linux:
— If you installed the shortcut during installation, you can select Eclipse for DS-5 in theApplications menu.
— If you did not install the shortcut during installation:
1. Add the install_directory/bin directory to your PATH environment variable. If it isalready configured then you can skip this step.
2. Open Unix bash shell.3. Enter eclipse at the prompt.
2. Select Window > Open Perspective > DS-5 Debug from the main menu.3. To connect to the target:
• If you have not run a debug session before then you must configure a connection between thedebugger and the target before you can start any debugging tasks.
• If you have run a debug session before then you can select a target connection in the DebugControl view and click on the Connect to Target toolbar icon.
Related tasks1.5 Headless command-line debugger options on page 1-24.2.6.1 Connecting to an existing application and application rewind session on page 2-42.2.6.2 Downloading your application and application rewind server on the target system on page 2-44.2.6.3 Starting the application rewind server and debugging the target-resident applicationon page 2-45.2.3 Configuring a connection to a Fixed Virtual Platform (FVP) for Linux application debugon page 2-36.2.2 Configuring a connection to a Linux target using gdbserver on page 2-34.2.5 Configuring a connection to a Linux Kernel on page 2-40.2.8 Configuring a connection to a bare-metal target on page 2-50.2.9 Configuring an Event Viewer connection to a bare-metal target on page 2-52.
Related references2.1 Types of target connections on page 2-33.10.37 Debug Configurations - Connection tab on page 10-282.10.38 Debug Configurations - Files tab on page 10-285.10.39 Debug Configurations - Debugger tab on page 10-289.10.41 Debug Configurations - Arguments tab on page 10-293.10.42 Debug Configurations - Environment tab on page 10-295.10 DS-5 Debug perspectives and views on page 10-198.10.7 Debug Control view on page 10-216.
1 Getting started with DS-5™ Debugger1.3 Launching the debugger from Eclipse
ARM DUI0446R Copyright © 2010-2014 ARM. All rights reserved. 1-22Non-Confidential

1.4 About DS-5™ headless command-line debuggerDS-5 Debugger can operate in a headless command-line mode.
You launch DS-5 headless command-line debugger using the DS-5 Command Prompt or Unix shell withthe required environment variables set. You must provide command-line arguments to the debugger toselect which target to connect to from those available in the debugger's configuration database.
1 Getting started with DS-5™ Debugger1.4 About DS-5™ headless command-line debugger
ARM DUI0446R Copyright © 2010-2014 ARM. All rights reserved. 1-23Non-Confidential
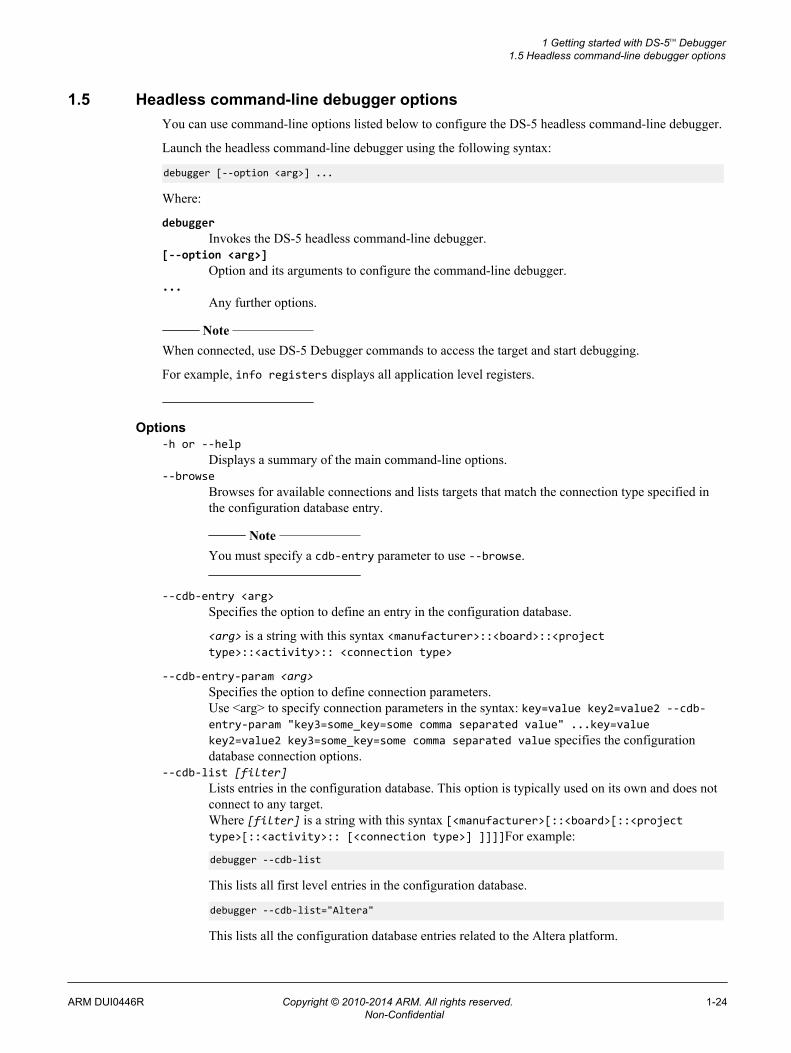
1.5 Headless command-line debugger optionsYou can use command-line options listed below to configure the DS-5 headless command-line debugger.
Launch the headless command-line debugger using the following syntax:
debugger [--option <arg>] ...
Where:
debuggerInvokes the DS-5 headless command-line debugger.
[--option <arg>]Option and its arguments to configure the command-line debugger.
...Any further options.
Note
When connected, use DS-5 Debugger commands to access the target and start debugging.
For example, info registers displays all application level registers.
Options-h or --help
Displays a summary of the main command-line options.--browse
Browses for available connections and lists targets that match the connection type specified inthe configuration database entry.
Note
You must specify a cdb-entry parameter to use --browse.
--cdb-entry <arg>Specifies the option to define an entry in the configuration database.
<arg> is a string with this syntax <manufacturer>::<board>::<projecttype>::<activity>:: <connection type>
--cdb-entry-param <arg>Specifies the option to define connection parameters.Use <arg> to specify connection parameters in the syntax: key=value key2=value2 --cdb-entry-param "key3=some_key=some comma separated value" ...key=valuekey2=value2 key3=some_key=some comma separated value specifies the configurationdatabase connection options.
--cdb-list [filter]Lists entries in the configuration database. This option is typically used on its own and does notconnect to any target.Where [filter] is a string with this syntax [<manufacturer>[::<board>[::<projecttype>[::<activity>:: [<connection type>] ]]]]For example:
debugger --cdb-list
This lists all first level entries in the configuration database.
debugger --cdb-list="Altera"
This lists all the configuration database entries related to the Altera platform.
1 Getting started with DS-5™ Debugger1.5 Headless command-line debugger options
ARM DUI0446R Copyright © 2010-2014 ARM. All rights reserved. 1-24Non-Confidential

--cdb-root <arg>Specifies configuration database locations in addition to the debugger's default configurationdatabase.
Note
If you do not need any data from the default configuration database, use the additional commandline option --cdb-root-ignore-default to tell the debugger not to use the defaultconfiguration database.
Note
The order in which configuration database roots are specified is important when the sameinformation is available in different databases. That is, the data in the location typed last (nearestto the end of full command line) overrides data in locations before it.
--cdb-root-ignore-defaultIgnores the default configuration database.
--continue_on_error=true | falseSpecifies whether the debugger stops the target and exits the current script when an error occurs.
The default is --continue_on_error=false.
--stop_on_connect=true | falseSpecifies whether the debugger stops the target when it connects to the target device. To leavethe target unmodified on connection, you must specify false. The default is --stop_on_connect=true.
--disable-semihostingDisables semihosting operations.
--disable_semihosting_consoleDisables all semihosting operations to the debugger console.
--enable-semihostingEnables semihosting operations.
-i <arg> or --semihosting-input <arg>Specifies a file to read semihosting stdin.
-o <arg> or --semihosting-output <arg>Specifies a file to write semihosting stdout.
-e <arg> or --semihosting-error <arg>Specifies a file to write semihosting stderr.
--top_mem=addressSpecifies the stack base, also known as the top of memory. Top of memory is only used forsemihosting operations.
-b=filename or --image=filenameSpecifies the image file for the debugger to load when it connects to the target.
--interactiveSpecifies interactive mode that redirects standard input and output to the debugger from thecurrent command-line console, for example, Windows Command Prompt or Unix shell.
Note
This is the default if no script file is specified.
1 Getting started with DS-5™ Debugger1.5 Headless command-line debugger options
ARM DUI0446R Copyright © 2010-2014 ARM. All rights reserved. 1-25Non-Confidential

--log_config=<arg>Specifies the type of logging configuration to output runtime messages from the debugger.The <arg> can be:<info> - Output messages using the predefined INFO level configuration. This level does notoutput debug messages. This is the default.<debug> - Output messages using the predefined DEBUG level configuration. This option outputsboth INFO level and DEBUG level messages.<filename> - Specifies a user-defined logging configuration file to customize the output ofmessages. The debugger supports log4j configuration files.
--log_file=filenameSpecifies an output file to receive runtime messages from the debugger. If this option is not usedthen output messages are redirected to the console.
--script=filenameSpecifies a script file containing debugger commands to control and debug your target. You canrepeat this option if you have several script files. The scripts are run in the order specified andthe debugger quits after the last script finishes. Add the --interactive option to the command-line if you want the debugger to remain in interactive mode after the last script finishes.
Related concepts7.6 About Log4j configuration files on page 7-172.
Related tasks1.3 Launching the debugger from Eclipse on page 1-22.
Related references1.8 DS-5™ Debugger command-line console keyboard shortcuts on page 1-30.8.1 Exporting DS-5 Debugger commands generated during a debug session on page 8-177.7.1 About semihosting and top of memory on page 7-166.
Related informationLog4j in Apache Logging Services.DS-5 Debugger commands.
1 Getting started with DS-5™ Debugger1.5 Headless command-line debugger options
ARM DUI0446R Copyright © 2010-2014 ARM. All rights reserved. 1-26Non-Confidential

1.6 Specifying a custom configuration database using the headless command-line debugger
You can use the headless command-line debugger to specify a custom configuration database.
To specify a custom configuration database using the headless command-line debugger:
Procedure
1. Launch a DS-5 command-line console.
• On Windows, select Start > All Programs > ARM DS-5 > DS-5 Command Prompt.• On Linux:
— Add the install_directory/bin directory to your PATH environment variable. If it is alreadyconfigured, then you can skip this step.
— Open a Unix bash shell.2. Specify a configuration database location using the following command-line syntax:
debugger ... --cdb-root /path/to/cdb[:/;/path/to/another/cdb]
Where:
--cdb-root
Is the option to define the path to the configuration database.
/path/to/cdb[:/;/path/to/another/cdb]
Specifies the path to a configuration database or, if needed, additional configuration databases.
Note
DS-5 processes the databases from top to bottom with the information in the lower databasesreplacing information in the higher databases. For example, if you want to produce a modifiedCortex™-A15 processor definition with different registers, then those changes can be added to a newdatabase that resides lower down in the list.
Note
If you do not need any data from the default configuration database, use the additional command lineoption --cdb-root-ignore-default to tell the debugger not to use the default configurationdatabase.
3. Specify a configuration database entry using the following command-line syntax:debugger --cdb-entry "<manufacturer>::<board>::<projecttype>::<execution_environment>::<activity>::<connection type>"
Where:
--cdb-entry
Specifies the option to define a configuration database entry.
<manufacturer> <board> <project type> <activity> <connection type>
4. If connection parameters are required, specify them using the following command-line syntax afterthe "..." which denotes the configuration database entry.debugger --cdb-entry "..." --cdb-entry-param key=value key2=value2 --cdb-entry-param "key3=some_key=some comma separated value" ...
Where:
--cdb-entry "..."
1 Getting started with DS-5™ Debugger1.6 Specifying a custom configuration database using the headless command-line debugger
ARM DUI0446R Copyright © 2010-2014 ARM. All rights reserved. 1-27Non-Confidential

Specifies the configuration database entry.
--cdb-entry-param
Specifies the option to define connection parameters.
key=value key2=value2 key3=some_key=some comma separated value
Specifies the configuration database connection options.
1 Getting started with DS-5™ Debugger1.6 Specifying a custom configuration database using the headless command-line debugger
ARM DUI0446R Copyright © 2010-2014 ARM. All rights reserved. 1-28Non-Confidential

1.7 DS-5™ Debug perspective keyboard shortcutsLists the keyboard shortcuts that you can use in the DS-5 Debug perspective.
In any view or dialog box you can access the dynamic help by using the following:
• On Windows, F1 key• On Linux for example, Shift+F1 key combination.
The following keyboard shortcuts are available when you connect to a target:
Commands viewYou can use:
Ctrl+SpaceAccess the content assist for autocompletion of commands.
EnterExecute the command that is entered in the adjacent field.
DOWN arrowNavigate down through the command history.
UP arrowNavigate up through the command history.
Debug Control viewYou can use:
F5Step at source or instruction level including stepping into all function calls where thereis debug information. You can also use ALT+F5 to step in the opposite mode. Forexample, if you are in source level stepping mode then using ALT+F5 performs aninstruction level step.
F6Step at source or instruction level but stepping over all function calls.
F7Continue running to the next instruction after the selected stack frame finishes.
F8Continue running the target.
Note
A Connect only connection might require setting the PC register to the start of theimage before running it.
F9Interrupt the target and stop the current application if it is running.
Related tasks1.3 Launching the debugger from Eclipse on page 1-22.
Related references10.6 Commands view on page 10-213.10.7 Debug Control view on page 10-216.
1 Getting started with DS-5™ Debugger1.7 DS-5™ Debug perspective keyboard shortcuts
ARM DUI0446R Copyright © 2010-2014 ARM. All rights reserved. 1-29Non-Confidential
1.8 DS-5™ Debugger command-line console keyboard shortcutsLists the line editing features provided, including a command history and some common keyboardshortcuts
Each command you enter is stored in the command history. Use the UP and DOWN arrow keys tonavigate through the command history, to find and reissue a previous command.
To make editing commands and navigating the command history easier, the following special keyboardshortcuts are available:
Ctrl+AMove the cursor to the start of the line.
Ctrl+DQuit the debugger console.
Ctrl+EMove the cursor to the end of the line.
Ctrl+NSearch forward through the command history for the currently entered text.
Ctrl+PSearch back through the command history for the currently entered text.
Ctrl+WDelete the last word.
DOWN arrowNavigate down through the command history.
UP arrowNavigate up through the command history.
Related tasks1.5 Headless command-line debugger options on page 1-24.
1 Getting started with DS-5™ Debugger1.8 DS-5™ Debugger command-line console keyboard shortcuts
ARM DUI0446R Copyright © 2010-2014 ARM. All rights reserved. 1-30Non-Confidential

1.9 Standards compliance in DS-5™ DebuggerLists the level of compliance that DS-5 Debugger conforms to.
ELFThe debugger can read executable images in ELF format.
DWARFThe debugger can read debug information from ELF images in the DWARF 2, DWARF 3, andDWARF 4 formats.
Trace ProtocolsThe debugger can interpret trace that complies with the ETMv3.4, ETMv3.5, ETMv4, ITM, andSTM protocols.
Note
The DWARF 2 and DWARF 3 standard is ambiguous in some areas such as debug frame data. Thismeans that there is no guarantee that the debugger can consume the DWARF produced by all third-partytools.
Related informationELF for the ARM Architecture.DWARF for the ARM Architecture.The DWARF Debugging Standard.International Organization for Standardization.
1 Getting started with DS-5™ Debugger1.9 Standards compliance in DS-5™ Debugger
ARM DUI0446R Copyright © 2010-2014 ARM. All rights reserved. 1-31Non-Confidential

Chapter 2Configuring and connecting to a target
Describes how to configure and connect to a debug target using ARM DS-5 Debugger in the EclipseIntegrated Development Environment (IDE).It contains the following sections:
• 2.1 Types of target connections on page 2-33.• 2.2 Configuring a connection to a Linux target using gdbserver on page 2-34.• 2.3 Configuring a connection to a Fixed Virtual Platform (FVP) for Linux application debug
on page 2-36.• 2.4 Adding a custom model on page 2-38.• 2.5 Configuring a connection to a Linux Kernel on page 2-40.• 2.6 About configuring connections to a Linux target using Application Debug with Rewind Support
on page 2-42.• 2.7 About configuring connections to an Android target using Native Application/Library Debug with
Rewind Support on page 2-47.• 2.8 Configuring a connection to a bare-metal target on page 2-50.• 2.9 Configuring an Event Viewer connection to a bare-metal target on page 2-52.• 2.10 About the target configuration import utility on page 2-54.• 2.11 Adding a new platform on page 2-56.• 2.12 Adding a new configuration database to DS-5 on page 2-58.• 2.13 Exporting an existing launch configuration on page 2-60.• 2.14 Importing an existing launch configuration on page 2-63.• 2.15 Disconnecting from a target on page 2-65.
ARM DUI0446R Copyright © 2010-2014 ARM. All rights reserved. 2-32Non-Confidential

2.1 Types of target connectionsTo debug an application using DS-5, you must set up a connection between the host workstation runningthe debugger and the target.
There are several types of connections supported by the debugger:
Linux applicationsTo debug a Linux application you can use a TCP or serial connection to:
• gdbserver running on a model that is pre-configured to boot ARM Embedded Linux.• gdbserver running on a hardware target.• Application rewind server running on a hardware target.
This type of development requires gdbserver or the application rewind server to be installedand running on the target.
Note
• If gdbserver is not installed on the target, either see the documentation for your Linuxdistribution or check with your provider. Alternatively, you might be able to use thegdbserver from the DS-5 installation at install_directory/arm.
• The application rewind server file undodb-server can be found in the install_directory\DS-5\arm\undodb\linux folder.
Bare-metal and Linux kernelTo debug an application running on a bare-metal target, a Linux kernel, or a kernel devicedriver, you can use:
• A debug hardware adapter connected to the host workstation and the target.• A CADI-compliant connection between the debugger and a model.
Snapshot ViewerThe Snapshot Viewer enables you to debug a read-only representation of your application usingpreviously captured state.
Note
Currently DS-5 only supports DS-5 Debugger connections to the Snapshot Viewer using thecommand-line console.
Related concepts9.1 About the Snapshot Viewer on page 9-191.6.14 About application rewind on page 6-157.
Related tasks2.6.1 Connecting to an existing application and application rewind session on page 2-42.2.6.2 Downloading your application and application rewind server on the target system on page 2-44.2.6.3 Starting the application rewind server and debugging the target-resident applicationon page 2-45.2.7.1 Attaching to a running Android application on page 2-47.2.7.2 Downloading and debugging an Android application on page 2-48.
2 Configuring and connecting to a target2.1 Types of target connections
ARM DUI0446R Copyright © 2010-2014 ARM. All rights reserved. 2-33Non-Confidential

2.2 Configuring a connection to a Linux target using gdbserverDescribes how to connect to a Linux target using gdbserver.
Prerequisites
Before connecting you must:
1. Set up the target with an Operating System (OS) installed and booted. See the documentationsupplied with the target for more information.
2. Obtain the target IP address or name.3. If required, set up a Remote Systems Explorer (RSE) connection to the target.
If you are connecting to an already running gdbserver you must ensure that you have:
1. gdbserver installed and running on the target.
To run gdbserver and the application on the target you can use:
gdbserver port path/myApplication
Where:
• port is the connection port between gdbserver and the application.• path/myApplication is the application that you want to debug.
2. An application image loaded and running on the target.
Procedure
1. Select Window > Open Perspective > DS-5 Debug from the main menu.2. Select Debug Configurations... from the Run menu.3. Select DS-5 Debugger from the configuration tree and then click on New to create a new
configuration.4. In the Name field, enter a suitable name for the new configuration.5. Click on the Connection tab to configure a DS-5 Debugger target connection:
a) Select the required platform, Linux Application Debug project type and the required debugoperation.
b) Configure the connection between the debugger and gdbserver.6. Click on the Files tab to define the target environment and select debug versions of the application
file and libraries on the host that you want the debugger to use.a) In the Target Configuration panel, select the application on the host that you want to download to
the target and specify the location on the target where you want to download the selected file.b) In the Files panel, select the files on the host that you want the debugger to use to load the debug
information. If required, you can also specify other files on the host that you want to download tothe target.
Note
Options in the Files tab are dependent on the type of debug operation that you select.
7. Click on the Debugger tab to configure the debugger settings.a) In the Run control panel, specify the actions that you want the debugger to do after connection to
the target.b) Configure the host working directory or use the default.c) In the Paths panel, specify any source or library search directories on the host that the debugger
uses when it displays source code.
2 Configuring and connecting to a target2.2 Configuring a connection to a Linux target using gdbserver
ARM DUI0446R Copyright © 2010-2014 ARM. All rights reserved. 2-34Non-Confidential

8. If required, click on the Arguments tab to enter arguments that are passed to the application whenthe debug session starts.
9. If required, click on the Environment tab to create and configure the target environment variablesthat are passed to the application when the debug session starts.
10. Click on Apply to save the configuration settings.11. Click on Debug to connect to the target.12. Debugging requires the DS-5 Debug perspective. If the Confirm Perspective Switch dialog box
opens, click Yes to switch perspective.
When connected and the DS-5 Debug perspective opens you are presented with all the relevant viewsand editors.
For more information on these options, use the dynamic help.
Related tasks2.13 Exporting an existing launch configuration on page 2-60.2.14 Importing an existing launch configuration on page 2-63.2.3 Configuring a connection to a Fixed Virtual Platform (FVP) for Linux application debugon page 2-36.2.5 Configuring a connection to a Linux Kernel on page 2-40.2.8 Configuring a connection to a bare-metal target on page 2-50.2.9 Configuring an Event Viewer connection to a bare-metal target on page 2-52.
Related references10.37 Debug Configurations - Connection tab on page 10-282.10.38 Debug Configurations - Files tab on page 10-285.10.39 Debug Configurations - Debugger tab on page 10-289.10.40 Debug Configurations - OS Awareness tab on page 10-292.10.41 Debug Configurations - Arguments tab on page 10-293.10.42 Debug Configurations - Environment tab on page 10-295.10.48 Target management terminal for serial and SSH connections on page 10-304.11.1 ARM Linux problems and solutions on page 11-318.11.3 Target connection problems and solutions on page 11-320.
2 Configuring and connecting to a target2.2 Configuring a connection to a Linux target using gdbserver
ARM DUI0446R Copyright © 2010-2014 ARM. All rights reserved. 2-35Non-Confidential

2.3 Configuring a connection to a Fixed Virtual Platform (FVP) for Linuxapplication debug
DS-5 supports connecting to an FVP. Use the described options to configure your connection to theCortex ®-A8 (preconfigured to boot ARM embedded Linux) FVP supplied with DS-5.
Procedure
1. From the main menu, select Window > Open Perspective > DS-5 Debug.2. Select Debug Configurations... from the Run menu.3. Select DS-5 Debugger from the configuration tree and then click New to create a new configuration.4. In the Name field, enter a suitable name for the new configuration.5. Click on the Connection tab to configure a DS-5 Debugger target connection:
a) Select the required FVP platform, Linux Application Debug project type and the required debugoperation. For example, if you are using a VFS, then select Debug target resident application.
b) In the Connections panel, a serial connection is automatically configured.c) If you are using VFS, select Enable virtual file system support. The default VFS mounting
point maps the Eclipse workspace root directory to the /writeable directory on the model. Leavethe default or change as required.
Note
VFS is only set-up on initialization of the model. Changes to the VFS directory structure mightrequire restarting the model.
6. Click on the Files tab to define the target environment and select debug versions of the applicationfile and libraries on the host that you want the debugger to use.a) In the Target Configuration panel, specify the location of the application on the target. You can
also specify the target working directory if required.b) In the Files panel, select the files on the host that you want the debugger to use to load the debug
information.
Note
Options in the Files tab are dependent on the type of debug operation that you select.
7. Click on the Debugger tab to configure the debugger settings.a) Specify the actions that you want the debugger to do after connection to the target.b) Configure the host working directory or use the default.c) Configure the search paths on the host used by the debugger when it displays source code.
8. If required, click on the Arguments tab to enter arguments that are passed to the application whenthe debug session starts.
9. If required, click on the Environment tab to create and configure the target environment variablesthat are passed to the application when the debug session starts.
10. Click on Apply to save the configuration settings.11. Click on Debug if you want to connect to the target and begin debugging immediately.
Alternatively, click on Close to close the Debug Configurations dialog box. Use the Debug Controlview to connect to the target associated with this debug configuration.
12. Debugging requires the DS-5 Debug perspective. If the Confirm Perspective Switch dialog boxopens, click Yes to switch perspective.
When connected and the DS-5 Debug perspective opens you are presented with all the relevant viewsand editors.
For more information on these options, use the dynamic help.
2 Configuring and connecting to a target2.3 Configuring a connection to a Fixed Virtual Platform (FVP) for Linux application debug
ARM DUI0446R Copyright © 2010-2014 ARM. All rights reserved. 2-36Non-Confidential

Related tasks2.13 Exporting an existing launch configuration on page 2-60.2.14 Importing an existing launch configuration on page 2-63.2.2 Configuring a connection to a Linux target using gdbserver on page 2-34.2.5 Configuring a connection to a Linux Kernel on page 2-40.2.8 Configuring a connection to a bare-metal target on page 2-50.2.9 Configuring an Event Viewer connection to a bare-metal target on page 2-52.
Related references10.37 Debug Configurations - Connection tab on page 10-282.10.38 Debug Configurations - Files tab on page 10-285.10.39 Debug Configurations - Debugger tab on page 10-289.10.40 Debug Configurations - OS Awareness tab on page 10-292.10.41 Debug Configurations - Arguments tab on page 10-293.10.42 Debug Configurations - Environment tab on page 10-295.
Related informationModel Shell options for Fast Models.
2 Configuring and connecting to a target2.3 Configuring a connection to a Fixed Virtual Platform (FVP) for Linux application debug
ARM DUI0446R Copyright © 2010-2014 ARM. All rights reserved. 2-37Non-Confidential

2.4 Adding a custom modelIf you have built your own custom CADI-compliant model, to connect to it using DS-5, you have tocreate a new entry in the DS-5 configuration database. Depending on how the model is defined in theconfiguration database, DS-5 can either launch the model or can connect to an already running model.
Note
FVPs not provided with DS-5 installation should be defined in the PATH environment variable of your OSto be available for DS-5.
Add the <DS-5 install directory>/bin directory to your PATH environment variable and restartEclipse.
• For Windows, enter set PATH=<your model path>\bin;%PATH%• For Linux, enter export PATH=<your model path>/bin:$PATH
To make the change permanent, so that the modified path is available in future sessions:
• For Windows, right-click My Computer > Properties > Advanced system settings > EnvironmentVariables and under User Variables, create a PATH variable with the value <your model path>\bin, or else append ;<your model path>\bin to any existing PATH variable.
• For Linux, set up the PATH in the appropriate shell configuration file. For example, in .bashrc, addthe line export PATH=<your model path>/bin:$PATH
For the models you build yourself, follow the instructions as described in this topic.
Procedure
1. Launch your model and start the CADI server.
• If your model is a library file:
— On Windows, select Start > All Programs > DS-5 > DS-5 Command Prompt and entermodel_shell -m <your model path and name> -S.
— On Linux, open a new terminal and run: <DS-5 installation folder>/bin/model_shell-m <your model path and name> -S
• If your model is an executable file, at the command prompt, enter <your model path and name>-S.
Note
For more information about options available with the model_shell utility in DS-5, entermodel_shell --help at the DS-5 command prompt.
2. Launch the cdbimporter utility and use it to create a new entry in the configuration database.a) On Windows, at the DS-5 command prompt, enter cdbimporter -m to launch the cdbimporter
utility and import the model.b) Enter the DS-5 source configuration path. If accepting the default source path, press Enter on
your keyboard.c) Enter the DS-5 destination configuration path. If accepting the default configuration path, press
Enter on your keyboard.d) If there is more than one active CADI-compliant model simulation, DS-5 lists the available
connections. Select the one you want to connect to. If accepting the default model connection,press Enter on your keyboard.
e) If needed, select a core to modify. If accepting the default, press Enter on your keyboard.f) If needed, enter the name of the Platform Manufacturer. If accepting the default, press Enter on
your keyboard.
2 Configuring and connecting to a target2.4 Adding a custom model
ARM DUI0446R Copyright © 2010-2014 ARM. All rights reserved. 2-38Non-Confidential

Note
If you do not enter a name for the platform manufacturer, you can find the platform you addedlisted under Imported in the list of platforms in the Debug Configurations dialog.
g) Enter the name of the Platform. If accepting the default, press Enter on your keyboard.h) If you want to enable DS-5 to launch the model when starting a debug session, enter the path to
your model. If you plan to launch the model separately, enter n at the prompt.3. Launch DS-5 and rebuild the debugger database:
• From the DS-5 menu, select Window > Preferences > DS-5 > Configuration Database andclick Rebuild database.
Your model is now available as one of the targets in the configuration database. Use the DebugConfigurations dialog to create, manage, and run configurations for this target.
Related concepts2.1 Types of target connections on page 2-33.2.10 About the target configuration import utility on page 2-54.
Related tasks2.3 Configuring a connection to a Fixed Virtual Platform (FVP) for Linux application debugon page 2-36.2.2 Configuring a connection to a Linux target using gdbserver on page 2-34.2.5 Configuring a connection to a Linux Kernel on page 2-40.2.8 Configuring a connection to a bare-metal target on page 2-50.1.6 Specifying a custom configuration database using the headless command-line debuggeron page 1-27.
Related informationComponent Architecture Debug Interface Developer Guide.
2 Configuring and connecting to a target2.4 Adding a custom model
ARM DUI0446R Copyright © 2010-2014 ARM. All rights reserved. 2-39Non-Confidential

2.5 Configuring a connection to a Linux KernelDescribes how to configure a connection to a Linux target, load the Linux Kernel into secure memory,and also how to add a pre-built loadable module to the target.
You can connect to running target using a debug hardware adapter.
Note
By default for this type of connection, all processor exceptions are handled by Linux on the target. Youcan use the Manage Signals dialog box in the Breakpoints view menu to modify the default handlersettings.
Prerequisites
Before connecting you must ensure that you have the target IP address or name for the connectionbetween the debugger and the debug hardware adapter.
Procedure
1. Select Window > Open Perspective > DS-5 Debug from the main menu.2. Select Debug Configurations... from the Run menu.3. Select DS-5 Debugger from the configuration tree and then click on New to create a new
configuration.4. In the Name field, enter a suitable name for the new configuration.5. Click on the Connection tab to configure a DS-5 Debugger target connection:
a) Select the required platform, Linux Kernel and/or Devices Driver Debug project type and therequired debug operation.
b) Configure the connection between the debugger and the debug hardware adapter.6. Click on the Debugger tab to configure the debugger settings.
a) In the Run control panel, select Connect only and set up initialization scripts as required.
Note
Operating System (OS) support is automatically enabled when a Linux kernel image is loaded intothe debugger from the DS-5 Debugger launch configuration. However, you can manually controlthis by using the set os command.
For example, if you want to delay the activation of OS support until after the kernel has bootedand the Memory Management Unit (MMU) is initialized then you can configure a connection thatuses a target initialization script to disable OS support. To debug the kernel, OS support must beenabled in the debugger.
b) Select the Execute debugger commands checkbox.c) In the field provided, enter the following commands:
add-symbol-file <path>/vmlinux S:0add-symbol-file <path>/modex.ko
Note
The path to the vmlinux must be the same as your build environment.
d) Configure the host working directory or use the default.e) In the Paths panel, specify any source search directories on the host that the debugger uses when it
displays source code.7. Click on Apply to save the configuration settings.
2 Configuring and connecting to a target2.5 Configuring a connection to a Linux Kernel
ARM DUI0446R Copyright © 2010-2014 ARM. All rights reserved. 2-40Non-Confidential

8. Click on Debug to connect to the target.9. Debugging requires the DS-5 Debug perspective. If the Confirm Perspective Switch dialog box
opens, click Yes to switch perspective.
When connected and the DS-5 Debug perspective opens you are presented with all the relevant viewsand editors.
For more information on these options, use the dynamic help.
Related concepts6.9 About debugging a Linux kernel on page 6-149.6.10 About debugging Linux kernel modules on page 6-151.
Related tasks2.13 Exporting an existing launch configuration on page 2-60.2.14 Importing an existing launch configuration on page 2-63.2.3 Configuring a connection to a Fixed Virtual Platform (FVP) for Linux application debugon page 2-36.2.2 Configuring a connection to a Linux target using gdbserver on page 2-34.2.8 Configuring a connection to a bare-metal target on page 2-50.2.9 Configuring an Event Viewer connection to a bare-metal target on page 2-52.
Related references10.37 Debug Configurations - Connection tab on page 10-282.10.38 Debug Configurations - Files tab on page 10-285.10.39 Debug Configurations - Debugger tab on page 10-289.10.40 Debug Configurations - OS Awareness tab on page 10-292.10.41 Debug Configurations - Arguments tab on page 10-293.10.42 Debug Configurations - Environment tab on page 10-295.10.48 Target management terminal for serial and SSH connections on page 10-304.11.1 ARM Linux problems and solutions on page 11-318.11.3 Target connection problems and solutions on page 11-320.
Related informationDebugging a loadable kernel module.
2 Configuring and connecting to a target2.5 Configuring a connection to a Linux Kernel
ARM DUI0446R Copyright © 2010-2014 ARM. All rights reserved. 2-41Non-Confidential

2.6 About configuring connections to a Linux target using Application Debugwith Rewind Support
Use the options available under Application Debug with Rewind Support in the Debug Configurationsdialog to connect to Linux targets.
Note
• Application rewind does not follow forked processes.• When debugging backwards, you can only view the contents of recorded memory, registers, or
variables. You cannot edit or change them.• Application rewind supports architecture ARMv5TE targets and later, except for the 64-bit ARMv8
architecture.
The options are:
• Connect to already running application.This option requires you to load your application and theapplication rewind server on your target and start the application rewind server manually beforeattempting a connection between DS-5 and your target.
• Start undodb-server and debug target-resident application.This option requires you to load yourapplication and the application rewind server on your target manually. When a connection isestablished, DS-5 starts a new application rewind server session on your target to debug yourapplication.
• Download and debug application.When a connection is established using this option, DS-5downloads your application and the application rewind server on to the target system, and starts anew application rewind server session to debug your application.
Note
The application rewind feature in DS-5 Debugger is license managed. Contact your supportrepresentative for details about this feature.
This section contains the following subsections:
• 2.6.1 Connecting to an existing application and application rewind session on page 2-42.• 2.6.2 Downloading your application and application rewind server on the target system
on page 2-44.• 2.6.3 Starting the application rewind server and debugging the target-resident application
on page 2-45.
2.6.1 Connecting to an existing application and application rewind sessionUse the Connect to already running application option to set up a connection to an existing applicationand application rewind server session on your target.
Prerequisites
Before connecting to an existing application rewind server session, you must ensure that:
• The undodb-server file found in the install_directory\DS-5\arm\undodb\linux folder iscopied to your target.
• The application that you want to debug is copied to the target.• The application rewind server session is running and connected to your application.
Note
To run the application rewind server and the application on the target, use:
undodb-server --connect-port port path/myApplication
2 Configuring and connecting to a target2.6 About configuring connections to a Linux target using Application Debug with Rewind Support
ARM DUI0446R Copyright © 2010-2014 ARM. All rights reserved. 2-42Non-Confidential

Where:
port is a TCP/IP port number of your choice that is used by application rewind server to communicatewith DS-5 Debugger.
path/myApplication is the application that you want to debug.
Procedure
1. From the main menu, select Window > Open Perspective > Other > DS-5 Debug to switch to theDS-5 debug perspective.
2. From the Run menu, select Debug Configurations....3. Select DS-5 Debugger from the configuration tree and then click New launch configuration to
create a new configuration.4. In the Name field, enter a suitable name for the new configuration.5. Select the Connection tab to configure the target connection:
a) In the Select target panel, select Linux Application Debug > Application Debug with RewindSupport > Connections via undodb-server > Connect to already running application.
b) Enter the Address of the connection you want to connect to.c) Enter the UndoDB-server (TCP) Port that you want to connect to.
6. Select the Files tab and in the Files panel, select the files on the host that you want the debugger touse to load the debug information from. If required, you can also specify other files on the host thatyou want to download to the target.
7. Select the Debugger tab to configure the debugger settings.a) In the Run control panel, specify the actions that you want the debugger to perform after
connecting to the target.b) In the Host working directory panel, configure the host working directory or use the default.c) In the Paths panel, specify any source or library search directories on the host that the debugger
uses when it displays source code.8. Click Apply to save the configuration settings.9. Click Debug to connect to the target.
When connected, and the DS-5 Debug perspective opens, you are presented with all the relevant viewsand editors.
For more information on these options, use the dynamic help.
Related concepts6.14 About application rewind on page 6-157.
Related references10.37 Debug Configurations - Connection tab on page 10-282.10.38 Debug Configurations - Files tab on page 10-285.10.39 Debug Configurations - Debugger tab on page 10-289.10.40 Debug Configurations - OS Awareness tab on page 10-292.10.41 Debug Configurations - Arguments tab on page 10-293.10.42 Debug Configurations - Environment tab on page 10-295.2.1 Types of target connections on page 2-33.
2 Configuring and connecting to a target2.6 About configuring connections to a Linux target using Application Debug with Rewind Support
ARM DUI0446R Copyright © 2010-2014 ARM. All rights reserved. 2-43Non-Confidential
2.6.2 Downloading your application and application rewind server on the target systemUse the Download and debug application option to download your application and application rewindserver to the target system and start a new application rewind session.
Prerequisites
Before connecting, you must:
• Set up the target with an Operating System (OS) installed and booted. See the documentationsupplied with the target for more information.
• Obtain the IP address or name of the target.• Set up a Remote Systems Explorer (RSE) connection to the target.
Procedure
1. From the main menu, select Window > Open Perspective > Other > DS-5 Debug to switch to theDS-5 debug perspective.
2. From the Run menu, select Debug Configurations....3. Select DS-5 Debugger from the configuration tree and then click New launch configuration to
create a new configuration.4. In the Name field, enter a suitable name for the new configuration.5. Select the Connection tab to configure the target connection:
a) In the Select target panel, select Linux Application Debug > Application Debug with RewindSupport > Connections via undodb-server > Download and debug application.
b) Select your RSE connection from the list.c) Accept the default values for the UndoDB-server (TCP) Port.
6. Select the Files tab to define the application file and libraries.a) In the Target Configuration panel, select the application on the host that you want to download to
the target and specify the location on the target where you want to download the selected file.b) In the Files panel, select the files on the host that you want the debugger to use to load the debug
information. If required, you can also specify other files on the host that you want to download tothe target.
Note
Options in the Files tab are dependent on the type of debug operation that you select.
7. Select the Debugger tab to configure the debugger settings.a) In the Run control panel, specify the actions that you want the debugger to perform after
connecting to the target.b) In the Host working directory panel, configure the host working directory or use the default.c) In the Paths panel, specify any source or library search directories on the host that the debugger
uses when it displays source code.8. If required, use the Arguments tab to enter arguments that are passed to the application when the
debug session starts.9. If required, use the Environment tab to create and configure the target environment variables that are
passed to the application when the debug session starts.10. Click Apply to save the configuration settings.11. Click Debug to connect to the target.
When connected, and the DS-5 Debug perspective opens, you are presented with all the relevant viewsand editors.
For more information on these options, use the dynamic help.
2 Configuring and connecting to a target2.6 About configuring connections to a Linux target using Application Debug with Rewind Support
ARM DUI0446R Copyright © 2010-2014 ARM. All rights reserved. 2-44Non-Confidential

Related concepts6.14 About application rewind on page 6-157.
Related references10.37 Debug Configurations - Connection tab on page 10-282.10.38 Debug Configurations - Files tab on page 10-285.10.39 Debug Configurations - Debugger tab on page 10-289.10.40 Debug Configurations - OS Awareness tab on page 10-292.10.41 Debug Configurations - Arguments tab on page 10-293.10.42 Debug Configurations - Environment tab on page 10-295.2.1 Types of target connections on page 2-33.
2.6.3 Starting the application rewind server and debugging the target-resident applicationUse the Start undodb-server and debug target-resident application option to start the applicationrewind server on the target system and debug an existing application.
Prerequisites
Before connecting, you must:
• Set up the target with an Operating System (OS) installed and booted. See the documentationsupplied with the target for more information.
• Obtain the IP address or name of the target.• Set up a Remote Systems Explorer (RSE) connection to the target.• Ensure that the application rewind server is available on your target and is added to your PATH
environment variable.• Ensure that the application you want to debug is available on the target.
Procedure
1. From the main menu, select Window > Open Perspective > Other > DS-5 Debug to switch to theDS-5 debug perspective.
2. From the Run menu, select Debug Configurations....3. Select DS-5 Debugger from the configuration tree and then click New launch configuration to
create a new configuration.4. In the Name field, enter a suitable name for the new configuration.5. Select the Connection tab to configure the target connection:
a) In the Select target panel, select Linux Application Debug > Application Debug with RewindSupport > Connections via undodb-server > Start undodb-server and debug target-residentapplication.
b) Select your RSE connection from the list.c) Accept the default values for the UndoDB-server (TCP) Port.
6. Select the Files tab to define the location of the Application on target, Target working directory, andadditional Files.a) In the Target Configuration panel, enter the location of the Application on target and the Target
working directory.b) In the Files panel, enter or select the location of the files on the target that you want the debugger
to use to load additional debug information. If required, you can also specify other files on thehost that you want to download to the target.
Note
Options in the Files tab are dependent on the type of debug operation that you select.
7. Select the Debugger tab to configure the debugger settings.
2 Configuring and connecting to a target2.6 About configuring connections to a Linux target using Application Debug with Rewind Support
ARM DUI0446R Copyright © 2010-2014 ARM. All rights reserved. 2-45Non-Confidential

a) In the Run control panel, specify the actions that you want the debugger to perform afterconnecting to the target.
b) In the Host working directory panel, configure the host working directory or use the default.c) In the Paths panel, specify any source or library search directories on the host that the debugger
uses when it displays source code.8. If required, use the Arguments tab to enter arguments that are passed to the application when the
debug session starts.9. If required, use the Environment tab to create and configure the target environment variables that are
passed to the application when the debug session starts.10. Click Apply to save the configuration settings.11. Click Debug to connect to the target.
Related concepts6.14 About application rewind on page 6-157.
Related references10.37 Debug Configurations - Connection tab on page 10-282.10.38 Debug Configurations - Files tab on page 10-285.10.39 Debug Configurations - Debugger tab on page 10-289.10.40 Debug Configurations - OS Awareness tab on page 10-292.10.41 Debug Configurations - Arguments tab on page 10-293.10.42 Debug Configurations - Environment tab on page 10-295.2.1 Types of target connections on page 2-33.
2 Configuring and connecting to a target2.6 About configuring connections to a Linux target using Application Debug with Rewind Support
ARM DUI0446R Copyright © 2010-2014 ARM. All rights reserved. 2-46Non-Confidential

2.7 About configuring connections to an Android target using NativeApplication/Library Debug with Rewind Support
Use the options available under Native Application/Library Debug with Rewind Support in theDebug Configurations dialog to connect to Android targets.
Note
• Application rewind does not follow forked processes.• When debugging backwards, you can only view the contents of recorded memory, registers, or
variables. You cannot edit or change them.• Application rewind supports architecture ARMv5TE targets and later, except for the 64-bit ARMv8
architecture.
The options are:
• Attach to a running Android application.This option requires you to load your application on yourAndroid target manually before attempting to attach the DS-5 debug session. Once attached, DS-5starts a new application rewind server session to debug your application.
• Download and debug an Android application. When a connection is established using this option,DS-5 downloads your application and the application rewind server on to the Android target, andstarts a new application rewind server session to debug your application.
This section contains the following subsections:
• 2.7.1 Attaching to a running Android application on page 2-47.• 2.7.2 Downloading and debugging an Android application on page 2-48.
2.7.1 Attaching to a running Android applicationUse the Attach to a running Android application option to set up a connection to an existingapplication and application rewind server session on your target.
Prerequisites
Before connecting, you must:
• Ensure that the ADB application bundle is available under the PATH environment variable on yourworkstation.
• Obtain root access on the Android device.• Ensure that the Android target is booted up and running.• Ensure that your application is installed and running on the Android target.
Procedure
1. From the main menu, select Window > Open Perspective > Other > DS-5 Debug to switch to theDS-5 debug perspective.
2. From the Run menu, select Debug Configurations....3. Select DS-5 Debugger from the configuration tree and then click New launch configuration to
create a new configuration.4. In the Name field, enter a suitable name for the new configuration.5. Select the Connection tab to configure the target connection:
a) In the Select target panel, select Android Application Debug > Native Application/LibraryDebug with Rewind Support > APK Native Library Debug via undodb-server > Attach to arunning Android application.
b) Select your device from the Connections panel.c) Accept the default values for the UndoDB-server (TCP) Port.
2 Configuring and connecting to a target2.7 About configuring connections to an Android target using Native Application/Library Debug with Rewind Support
ARM DUI0446R Copyright © 2010-2014 ARM. All rights reserved. 2-47Non-Confidential

6. Select the Files tab to define the application file and libraries.a) In the Android panel, select the Project directory and APK file that you want to use. The
Process and Activity fields are populated by the AndroidManifest.xml file.b) In the Files panel, select the files on the host that you want the debugger to use to load the debug
information.
Note
Options in the Files tab are dependent on the type of debug operation that you select.
7. Select the Debugger tab to configure the debugger settings.a) In the Run control panel, select Connect only.b) In the Host working directory panel, configure the host working directory or use the default.c) In the Paths panel, specify any source or library search directories on the host that the debugger
uses when it displays source code.8. Click Apply to save the configuration settings.9. Click Debug to connect to the target.
Related concepts6.14 About application rewind on page 6-157.
Related references2.1 Types of target connections on page 2-33.
2.7.2 Downloading and debugging an Android applicationUse the Download and debug an Android application option to download and install your applicationon the Android target and load and start an application rewind debug session.
Prerequisites
Before connecting, you must:
• Ensure that the ADB application bundle is available under the PATH environment variable on yourworkstation.
• Obtain root access on the Android device.• Ensure that the Android target is booted up and running.
Procedure
1. From the main menu, select Window > Open Perspective > Other > DS-5 Debug to switch to theDS-5 debug perspective.
2. From the Run menu, select Debug Configurations....3. Select DS-5 Debugger from the configuration tree and then click New launch configuration to
create a new configuration.4. In the Name field, enter a suitable name for the new configuration.5. Select the Connection tab to configure the target connection:
a) In the Select target panel, select Android Application Debug > Native Application/LibraryDebug with Rewind Support > APK Native Library Debug via undodb-server > Downloadand debug an Android application.
b) Select your device from the Connections panel.c) Accept the default values for the UndoDB-server (TCP) Port.
6. Select the Files tab to define the application file and libraries.a) In the Android panel, select the Project directory and APK file that you want to use. The
Process and Activity fields are populated by the AndroidManifest.xml file. If needed, select adifferent Activity.
2 Configuring and connecting to a target2.7 About configuring connections to an Android target using Native Application/Library Debug with Rewind Support
ARM DUI0446R Copyright © 2010-2014 ARM. All rights reserved. 2-48Non-Confidential

b) In the Files panel, select the files on the host that you want the debugger to use to load the debuginformation.
Note
Options in the Files tab are dependent on the type of debug operation that you select.
7. Select the Debugger tab to configure the debugger settings.a) In the Run control panel, select Connect only.b) In the Host working directory panel, configure the host working directory or use the default.c) In the Paths panel, specify any source or library search directories on the host that the debugger
uses when it displays source code.8. Click Apply to save the configuration settings.9. Click Debug to connect to the target.
Related concepts6.14 About application rewind on page 6-157.
Related references2.1 Types of target connections on page 2-33.
2 Configuring and connecting to a target2.7 About configuring connections to an Android target using Native Application/Library Debug with Rewind Support
ARM DUI0446R Copyright © 2010-2014 ARM. All rights reserved. 2-49Non-Confidential

2.8 Configuring a connection to a bare-metal targetDescribes how to download and connect to an application running on a target using a debug hardwareadapter.
Prerequisites
Before connecting you must ensure that you have the target IP address or name for the connectionbetween the debugger and the debug hardware adapter.
Procedure
1. Select Window > Open Perspective > DS-5 Debug from the main menu.2. Select Debug Configurations... from the Run menu.3. Select DS-5 Debugger from the configuration tree and then click on New to create a new
configuration.4. In the Name field, enter a suitable name for the new configuration.5. Click on the Connection tab to configure a DS-5 Debugger target connection:
a) Select the required platform. For example, ARM-Versatile Express A9x4, Bare Metal Debug,Debug and Trace Cortex-A9x4 SMP via DSTREAM.
b) Configure the connection between the debugger and the debug hardware adapter.6. Click on the Files tab to define the target environment and select debug versions of the application
file and libraries on the host that you want the debugger to use.a) In the Target Configuration panel, select the application on the host that you want to download to
the target.7. Click on the Debugger tab to configure the debugger settings.
a) In the Run control panel, specify the actions that you want the debugger to do after connection tothe target.
b) Configure the host working directory or use the default.c) In the Paths panel, specify any source search directories on the host that the debugger uses when it
displays source code.8. If required, click on the Arguments tab to enter arguments that are passed, using semihosting, to the
application when the debug session starts.9. Click on Apply to save the configuration settings.10. Click on Debug to connect to the target.11. Debugging requires the DS-5 Debug perspective. If the Confirm Perspective Switch dialog box
opens, click Yes to switch perspective.
When connected and the DS-5 Debug perspective opens you are presented with all the relevant viewsand editors.
For more information on these options, use the dynamic help.
Related tasks2.13 Exporting an existing launch configuration on page 2-60.2.14 Importing an existing launch configuration on page 2-63.2.3 Configuring a connection to a Fixed Virtual Platform (FVP) for Linux application debugon page 2-36.2.2 Configuring a connection to a Linux target using gdbserver on page 2-34.2.5 Configuring a connection to a Linux Kernel on page 2-40.2.9 Configuring an Event Viewer connection to a bare-metal target on page 2-52.
2 Configuring and connecting to a target2.8 Configuring a connection to a bare-metal target
ARM DUI0446R Copyright © 2010-2014 ARM. All rights reserved. 2-50Non-Confidential

Related references10.37 Debug Configurations - Connection tab on page 10-282.10.38 Debug Configurations - Files tab on page 10-285.10.39 Debug Configurations - Debugger tab on page 10-289.10.40 Debug Configurations - OS Awareness tab on page 10-292.10.41 Debug Configurations - Arguments tab on page 10-293.10.42 Debug Configurations - Environment tab on page 10-295.
2 Configuring and connecting to a target2.8 Configuring a connection to a bare-metal target
ARM DUI0446R Copyright © 2010-2014 ARM. All rights reserved. 2-51Non-Confidential

2.9 Configuring an Event Viewer connection to a bare-metal targetDescribes how to connect to a bare-metal target.
The Event Viewer allows you to capture and view textual logging information from bare-metalapplications. Logging is captured from your application using annotations that you must add to thesource code.
Note
The Event Viewer tab in the Debug Configurations dialog box is only enabled for targets where SystemTrace Macrocell (STM) and Instrumentation Trace Macrocell (ITM) capture is supported.
Prerequisites
Before connecting you must ensure that you:
• Have the target IP address or name for the connection between the debugger and the debug hardwareagent.
• Annotate your application source code with logging points and recompile it. See the ITM and EventViewer Example for Versatile Express A9x4 provided with DS-5 for more information.
Procedure
1. Select Window > Open Perspective > DS-5 Debug from the main menu.2. Select Debug Configurations... from the Run menu.3. Select DS-5 Debugger from the configuration tree and then click on New to create a new
configuration.4. In the Name field, enter a suitable name for the new configuration.5. Click on the Connection tab to configure a DS-5 Debugger target connection:
a) Select the required platform. For example, ARM-Versatile Express A9x4, Bare Metal Debug,Debug and Trace Cortex-A9x4 SMP via DSTREAM.
b) Configure the connection between the debugger and the debug hardware agent.6. Click on the Files tab to define the target environment and select debug versions of the application
file and libraries on the host that you want the debugger to use.a) In the Target Configuration panel, select the application on the host that you want to download to
the target.7. Click on the Debugger tab to configure the debugger settings.
a) In the Run control panel, specify the actions that you want the debugger to do after connection tothe target.
b) Configure the host working directory or use the default.c) In the Paths panel, specify any source search directories on the host that the debugger uses when it
displays source code.8. If required, click on the Arguments tab to enter arguments that are passed, using semihosting, to the
application when the debug session starts.9. Click on the Event Viewer tab to configure the ITM capture settings.
a) Select Enable Event Viewer for ITM events.b) Enter the maximum size of the trace buffer. For example, you can enter 100MB for a DSTREAM
connection. Be aware that larger buffers have a performance impact by taking longer to processbut collect more trace data.
10. Click on Apply to save the configuration settings.11. Click on Debug to connect to the target.
2 Configuring and connecting to a target2.9 Configuring an Event Viewer connection to a bare-metal target
ARM DUI0446R Copyright © 2010-2014 ARM. All rights reserved. 2-52Non-Confidential

12. Debugging requires the DS-5 Debug perspective. If the Confirm Perspective Switch dialog boxopens, click Yes to switch perspective.
When connected and the DS-5 Debug perspective opens you are presented with all the relevant Channeleditors for the Event Viewer.
For more information on these options, use the dynamic help.
Related tasks2.13 Exporting an existing launch configuration on page 2-60.2.14 Importing an existing launch configuration on page 2-63.2.3 Configuring a connection to a Fixed Virtual Platform (FVP) for Linux application debugon page 2-36.2.2 Configuring a connection to a Linux target using gdbserver on page 2-34.2.5 Configuring a connection to a Linux Kernel on page 2-40.2.8 Configuring a connection to a bare-metal target on page 2-50.
Related references10.37 Debug Configurations - Connection tab on page 10-282.10.38 Debug Configurations - Files tab on page 10-285.10.39 Debug Configurations - Debugger tab on page 10-289.10.40 Debug Configurations - OS Awareness tab on page 10-292.10.41 Debug Configurations - Arguments tab on page 10-293.10.42 Debug Configurations - Environment tab on page 10-295.
2 Configuring and connecting to a target2.9 Configuring an Event Viewer connection to a bare-metal target
ARM DUI0446R Copyright © 2010-2014 ARM. All rights reserved. 2-53Non-Confidential

2.10 About the target configuration import utilityThe import utility, cdbimporter, aims to provide an easy method to import platform information intoDS-5, and so provide limited debug and trace support for the platform through RVI , DSTREAM ,VSTREAM, or model connections.
A database holds the target configuration and connection settings in DS-5. The import utility createsplatform entries in a new configuration database using information from:
• A configuration file created and saved using the Debug Hardware Configuration utility, dbghwconfigor rviconfig.
Note
DS-5 is not yet capable of creating a configuration file from within Eclipse.
• A model that provides a CADI server. The model can be already running or you can specify the pathand filename to the executable file in the command-line options.
The import utility creates the following debug operations:
• Single processor and Symmetric MultiProcessing (SMP) bare-metal debug for hardware and models.• Single processor and SMP Linux kernel debug for hardware.• Linux application debug configurations for hardware.• big.LITTLE™ configurations for cores that support big.LITTLE operation, such as Cortex-A15/
Cortex-A7.
For hardware targets where a trace subsystem is present, appropriate Debug and Trace Services Layer(DTSL) options are produced. These can include:
• Selection of on-chip (Embedded Trace Buffer (ETB), Micro Trace Buffer (MTB), Trace MemoryController (TMC) or other on-chip buffer) or off-chip ( DSTREAM trace buffer) trace capture.
• Cycle-accurate trace capture.• Trace capture range.• Configuration and capture of Instruction Trace Macrocell (ITM) trace to be handled by the DS-5
Event Viewer.
The import utility does not create debug operations that configure non-instruction trace macrocells otherthan ITM.
For SMP configurations, the Cross Trigger Interface (CTI) synchronization is used on targets where asuitable CTI is present.
Using a CTI produces a much tighter synchronization with a very low latency in the order of cycles butthe CTI must be fully implemented and connected in line with the reference designs, and must not beused for any other purpose. Synchronization without using a CTI has a much higher latency, but makesno assumptions about implementation or usage.
You might have to manually configure off-chip TPIU trace for multiplexed pins and also performcalibrations to cope with signal timing issues.
If you experience any problems or need to produce other configurations, contact your supportrepresentative.
Assumptions
The import utility makes the following assumptions when creating debug operations:
• There is a linear mapping between trace macrocells and CoreSight™ trace funnel ports.• The Embedded Trace Macrocell (ETM)/Program Trace Macrocell (PTM) versions are fixed for each
type of processor.
2 Configuring and connecting to a target2.10 About the target configuration import utility
ARM DUI0446R Copyright © 2010-2014 ARM. All rights reserved. 2-54Non-Confidential
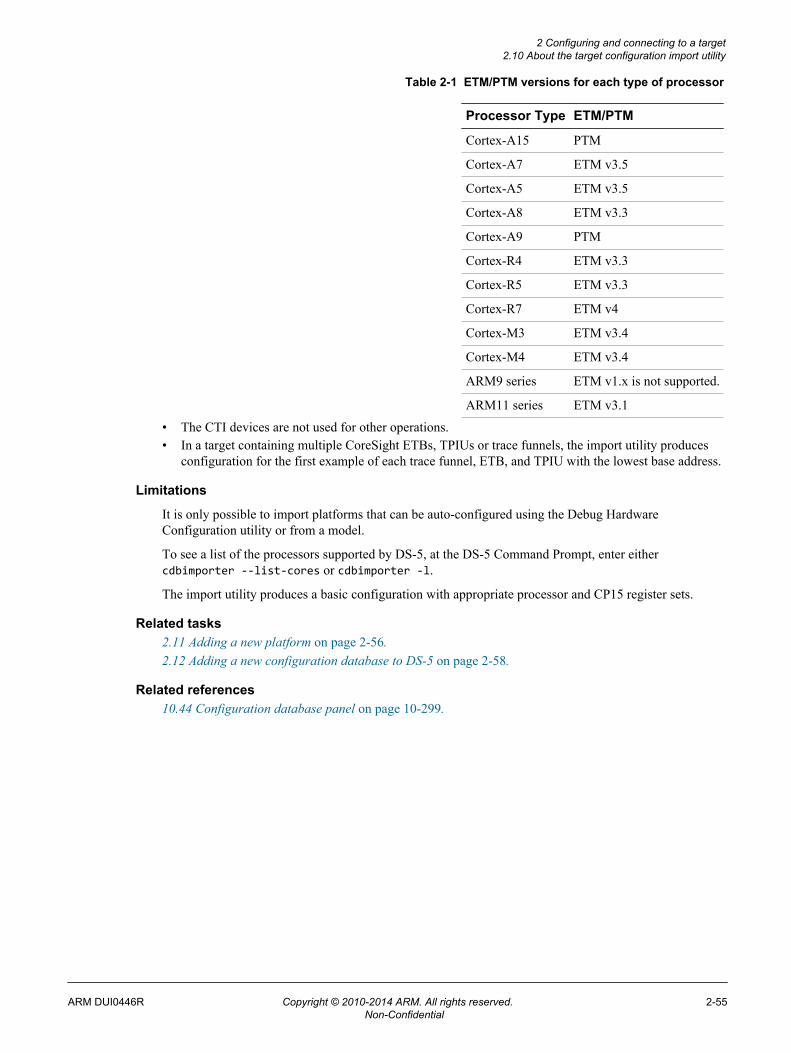
Table 2-1 ETM/PTM versions for each type of processor
Processor Type ETM/PTM
Cortex-A15 PTM
Cortex-A7 ETM v3.5
Cortex-A5 ETM v3.5
Cortex-A8 ETM v3.3
Cortex-A9 PTM
Cortex-R4 ETM v3.3
Cortex-R5 ETM v3.3
Cortex-R7 ETM v4
Cortex-M3 ETM v3.4
Cortex-M4 ETM v3.4
ARM9 series ETM v1.x is not supported.
ARM11 series ETM v3.1
• The CTI devices are not used for other operations.• In a target containing multiple CoreSight ETBs, TPIUs or trace funnels, the import utility produces
configuration for the first example of each trace funnel, ETB, and TPIU with the lowest base address.
Limitations
It is only possible to import platforms that can be auto-configured using the Debug HardwareConfiguration utility or from a model.
To see a list of the processors supported by DS-5, at the DS-5 Command Prompt, enter eithercdbimporter --list-cores or cdbimporter -l.
The import utility produces a basic configuration with appropriate processor and CP15 register sets.
Related tasks2.11 Adding a new platform on page 2-56.2.12 Adding a new configuration database to DS-5 on page 2-58.
Related references10.44 Configuration database panel on page 10-299.
2 Configuring and connecting to a target2.10 About the target configuration import utility
ARM DUI0446R Copyright © 2010-2014 ARM. All rights reserved. 2-55Non-Confidential
2.11 Adding a new platformDescribes how to create a new configuration database containing a new platform for use with DS-5.
Procedure
1. Launch a command-line console:
• On Windows, select Start > All Programs > ARM DS-5 > DS-5 Command Prompt.• On Linux:
1. Add the DS-5 install directory/bin directory to your PATH environment variable. If it isalready configured then you can skip this step.
2. Open a Unix bash shell.2. Launch the import utility using the following command-line syntax:
cdbimporter --helpcdbimporter [--cdb=cdbpath] --list-corescdbimporter [--cdb=cdbpath] [--target-cdb=targetpath] {file.rvc | --model[=modelpath]} [option]...
where:--help
Displays a summary of the main command-line options.--list-cores
lists all the processors defined by the database supplied in the --cdb option.--cdb=cdbpath
Specifies a path to the source configuration database (as shipped in DS-5) containingprocessor and register definitions to identify the target.
--target-cdb=targetpathDirectory where the destination database is to reside. ARM recommends that you buildseparate configuration databases in your own workspace to avoid accidental loss of datawhen updating DS-5. You can specify multiple configuration databases in DS-5 using thePreferences dialog. This enables platforms in the new database to use existing processor andregister definitions.
file.rvcImports from a configuration file (.rvc). You can use the Debug Hardware Configurationutility, dbghwconfig or rviconfig to connect to the target and save the information in a file.The resultant file contains limited debug and trace support for the platform that can be usedto populate the DS-5 configuration database.
--model=modelpathImports from a model that provides a CADI server.
• If you supply the modelpath to the model executable, the utility launches the model forinterrogation so that it can determine the connection settings that DS-5 uses toautomatically launch the model on connection.
• If you do not supply the modelpath to the model executable, you can force the utility tosearch for a running model to interrogate. You can then manually enter the data for theconnection to the model. For example, processors names, IDs, and processor definitions.If you use this option then you must launch the model manually before connecting DS-5to it.
optionWhere option can be any of the following:--no-ctis
Disables the use of Cross Trigger Interface (CTI) synchronization in the resultingplatform.
--no-traceDisables the use of trace components in the resulting platform.
2 Configuring and connecting to a target2.11 Adding a new platform
ARM DUI0446R Copyright © 2010-2014 ARM. All rights reserved. 2-56Non-Confidential

--use-defaultsDisplays default input when the database requires a user input. This does not applyto the output database path.
--toolkit=keySpecifies a comma separated list of toolkits.
3. During the import process, the import utility enables you to modify details about the processors of thenew platform. Follow the instructions in the command-line prompts.
On successful completion a new configuration database is created containing the new platform that canbe added to DS-5.
Related concepts2.10 About the target configuration import utility on page 2-54.
Related tasks2.12 Adding a new configuration database to DS-5 on page 2-58.
Related references10.44 Configuration database panel on page 10-299.
2 Configuring and connecting to a target2.11 Adding a new platform
ARM DUI0446R Copyright © 2010-2014 ARM. All rights reserved. 2-57Non-Confidential

2.12 Adding a new configuration database to DS-5Describes how to add a new configuration database to DS-5.
Procedure
1. Launch Eclipse.2. Select Preferences from Windows menu.3. Expand the DS-5 configuration group.4. Select Configuration Database.5. Click Add... to locate the new database:
a) Select the entire directory.b) Click OK to close the dialog box.
6. Position the new database:a) Select the new database.b) Click Up or Down as required.
Note
DS-5 provides built-in databases containing a default set of target configurations. You can enableor disable these but not delete them.
7. Click Rebuild database....8. Click OK to close the dialog box and save the settings.
2 Configuring and connecting to a target2.12 Adding a new configuration database to DS-5
ARM DUI0446R Copyright © 2010-2014 ARM. All rights reserved. 2-58Non-Confidential

Figure 2-1 Adding a new configuration database
Note
DS-5 processes the databases from top to bottom with the information in the lower databasesreplacing information in the higher databases. For example, if you want to produce a modifiedCortex-A15 processor definition with different registers then those changes can be added to a newdatabase that resides lower down in the list.
Related concepts2.10 About the target configuration import utility on page 2-54.
Related tasks2.11 Adding a new platform on page 2-56.
Related references10.44 Configuration database panel on page 10-299.
2 Configuring and connecting to a target2.12 Adding a new configuration database to DS-5
ARM DUI0446R Copyright © 2010-2014 ARM. All rights reserved. 2-59Non-Confidential

2.13 Exporting an existing launch configurationDescribes how to export an existing launch configuration.
Procedure
1. Select Export... from the File menu.2. In the Export dialog box, expand the Run/Debug group and select Launch Configurations.
Figure 2-2 Export launch configuration dialog box3. Click on Next.4. In the Export Launch Configurations dialog box:
a) Expand the DS-5 Debugger group and then select one or more launch configurations.b) Click on Browse... to select the required location in the local file system.c) Select the folder and then click OK.
2 Configuring and connecting to a target2.13 Exporting an existing launch configuration
ARM DUI0446R Copyright © 2010-2014 ARM. All rights reserved. 2-60Non-Confidential

Figure 2-3 Launch configuration selection panels5. If required, select Overwrite existing file(s) without warning.6. Click on Finish.
Related tasks2.14 Importing an existing launch configuration on page 2-63.2.3 Configuring a connection to a Fixed Virtual Platform (FVP) for Linux application debugon page 2-36.2.2 Configuring a connection to a Linux target using gdbserver on page 2-34.2.5 Configuring a connection to a Linux Kernel on page 2-40.
2 Configuring and connecting to a target2.13 Exporting an existing launch configuration
ARM DUI0446R Copyright © 2010-2014 ARM. All rights reserved. 2-61Non-Confidential

2.8 Configuring a connection to a bare-metal target on page 2-50.2.9 Configuring an Event Viewer connection to a bare-metal target on page 2-52.
2 Configuring and connecting to a target2.13 Exporting an existing launch configuration
ARM DUI0446R Copyright © 2010-2014 ARM. All rights reserved. 2-62Non-Confidential

2.14 Importing an existing launch configurationDescribes how to import an existing launch configuration into Eclipse.
Procedure
1. Select Import... from the File menu.2. In the Import dialog box, expand the Run/Debug group and select Launch Configurations.
Figure 2-4 Import launch configuration dialog box3. Click on Next.4. Click on Browse... to select the required location in the local file system.5. Select the folder containing the launch files and then click OK.6. Select the checkboxes for the required folder and launch file(s).
2 Configuring and connecting to a target2.14 Importing an existing launch configuration
ARM DUI0446R Copyright © 2010-2014 ARM. All rights reserved. 2-63Non-Confidential

Figure 2-5 Launch configuration file selection panels7. If you are replacing an existing configuration with the same name then select Overwrite existing
launch configurations without warning.8. Click on Finish.
Related tasks2.13 Exporting an existing launch configuration on page 2-60.2.3 Configuring a connection to a Fixed Virtual Platform (FVP) for Linux application debugon page 2-36.2.2 Configuring a connection to a Linux target using gdbserver on page 2-34.2.5 Configuring a connection to a Linux Kernel on page 2-40.2.8 Configuring a connection to a bare-metal target on page 2-50.2.9 Configuring an Event Viewer connection to a bare-metal target on page 2-52.
2 Configuring and connecting to a target2.14 Importing an existing launch configuration
ARM DUI0446R Copyright © 2010-2014 ARM. All rights reserved. 2-64Non-Confidential

2.15 Disconnecting from a targetDescribes how to disconnect from a target using the DS-5 Debug perspective.
Procedure
You can use either the Debug Control or Commands view as follows:
• Click on the Disconnect from Target toolbar icon in the Debug Control view.• Alternatively, in the Commands view you can:
1. Enter quit in the Command field.2. Click Submit.
Related references10.6 Commands view on page 10-213.10.7 Debug Control view on page 10-216.10.55 DS-5 Debugger menu and toolbar icons on page 10-314.
Related informationDS-5 Debugger commands.
2 Configuring and connecting to a target2.15 Disconnecting from a target
ARM DUI0446R Copyright © 2010-2014 ARM. All rights reserved. 2-65Non-Confidential

Chapter 3Working with the target configuration editor
Describes how to use the editor when developing a project for an ARM target.It contains the following sections:
• 3.1 About the target configuration editor on page 3-67.• 3.2 Target configuration editor - Overview tab on page 3-68.• 3.3 Target configuration editor - Memory tab on page 3-70.• 3.4 Target configuration editor - Peripherals tab on page 3-72.• 3.5 Target configuration editor - Registers tab on page 3-74.• 3.6 Target configuration editor - Group View tab on page 3-76.• 3.7 Target configuration editor - Enumerations tab on page 3-78.• 3.8 Target configuration editor - Configurations tab on page 3-80.• 3.9 Scenario demonstrating how to create a new target configuration file on page 3-82.• 3.10 Creating a power domain for a target on page 3-94.• 3.11 Creating a Group list on page 3-95.• 3.12 Importing an existing target configuration file on page 3-97.• 3.13 Exporting a target configuration file on page 3-99.
ARM DUI0446R Copyright © 2010-2014 ARM. All rights reserved. 3-66Non-Confidential

3.1 About the target configuration editor
The target configuration editor provides forms and graphical views to easily create and edit TargetConfiguration Files (TCF) describing memory mapped peripheral registers present on a device. It alsoprovides import and export wizards for compatibility with the file formats used in μVision SystemViewer.
TCF files must have the file extension .tcf to invoke this editor.
If this is not the default editor, right-click on your source file in the Project Explorer view and selectOpen With > Target Configuration Editor from the context menu.
The target configuration editor also provides a hierarchical tree using the Outline view. Click on anentry in the Outline view to move the focus of the editor to the relevant tab and selected field. If thisview is not visible, select Window > Show View > Outline from the main menu.
Directories containing TCF files can be specified in DS-5 Debugger launch configurations.
Related references3.2 Target configuration editor - Overview tab on page 3-68.3.3 Target configuration editor - Memory tab on page 3-70.3.4 Target configuration editor - Peripherals tab on page 3-72.3.5 Target configuration editor - Registers tab on page 3-74.3.6 Target configuration editor - Group View tab on page 3-76.3.7 Target configuration editor - Enumerations tab on page 3-78.3.8 Target configuration editor - Configurations tab on page 3-80.10.38 Debug Configurations - Files tab on page 10-285.3.9 Scenario demonstrating how to create a new target configuration file on page 3-82.
3 Working with the target configuration editor3.1 About the target configuration editor
ARM DUI0446R Copyright © 2010-2014 ARM. All rights reserved. 3-67Non-Confidential

3.2 Target configuration editor - Overview tab
A graphical view showing general information about the current target and summary information for allthe tabs.
General Information
Unique NameUnique board name (mandatory).
CategoryName of the manufacturer.
InheritsName of the board, memory region or peripheral to inherit data from. You must use theIncludes panel to populate this drop-down menu.
EndiannessByte order of the target.
TrustZoneTrustZone support for the target. If supported, the Memory and Peripheral tabs aredisplayed with a TrustZone Address Type field.
Power DomainPower Domain support for the target. If supported, the Memory and Peripheral tabsare displayed with a Power Domain Address Type field. Also, the Configurations tabincludes an additional Power Domain Configurations group.
DescriptionBoard description.
IncludesInclude files for use when inheriting target data that is defined in an external file. Populates theInherits drop-down menu.
The Overview tab also provides a summary of the other tabs available in this view, together with thetotal number of items defined in that view.
3 Working with the target configuration editor3.2 Target configuration editor - Overview tab
ARM DUI0446R Copyright © 2010-2014 ARM. All rights reserved. 3-68Non-Confidential

Figure 3-1 Target configuration editor - Overview tab
Mandatory fields are indicated by an asterisk. Toolbar buttons and error messages are displayed in theheader panel as appropriate.
Related concepts3.1 About the target configuration editor on page 3-67.
Related tasks3.10 Creating a power domain for a target on page 3-94.
Related references3.3 Target configuration editor - Memory tab on page 3-70.3.4 Target configuration editor - Peripherals tab on page 3-72.3.5 Target configuration editor - Registers tab on page 3-74.3.6 Target configuration editor - Group View tab on page 3-76.3.7 Target configuration editor - Enumerations tab on page 3-78.3.8 Target configuration editor - Configurations tab on page 3-80.3.9 Scenario demonstrating how to create a new target configuration file on page 3-82.
3 Working with the target configuration editor3.2 Target configuration editor - Overview tab
ARM DUI0446R Copyright © 2010-2014 ARM. All rights reserved. 3-69Non-Confidential

3.3 Target configuration editor - Memory tab
A graphical view or tabular view that enables you to define the attributes for each of the block ofmemory on your target. These memory blocks are used to ensure that your debugger accesses thememory on your target in the right way.
Graphical view
In the graphical view, the following display options are available:
View by Map RuleFilter the graphical view based on the selected rule.
View by Address TypeFilter the graphical view based on secure or non-secure addresses. Available only whenTrustZone is supported. You can select TrustZone support in the Overview tab.
View by Power DomainFilter the graphical view based on the power domain. Available only when Power Domain issupported. You can select Power Domain support in the Overview tab.
Add buttonAdd a new memory region.
Remove buttonRemove the selected memory region.
Graphical and tabular views
In both the graphical view and the tabular view, the following settings are available:
Unique NameName of the selected memory region (mandatory).
NameUser-friendly name for the selected memory region.
DescriptionDetailed description of the selected memory region.
Base AddressAbsolute address or the Name of the memory region to use as a base address. The default is anabsolute starting address of 0x0.
OffsetOffset that is added to the base address (mandatory).
SizeSize of the selected memory region in bytes (mandatory).
WidthAccess width of the selected memory region.
AccessAccess mode for the selected memory region.
Apply Map Rule (graphical view) Map Rule (tablular view)Mapping rule to be applied to the selected memory region. You can use the Map Rules tab tocreate and modify rules for control registers.
More... (tablular view)In the tabular view, the ... button is displayed when you select More... cell. Click the ... buttonto display the Context and Parameters dialog box.
ContextDebugger plug-in. If you want to pass parameters to a specific debugger, select a plug-in andenter the associated parameters.
ParametersParameters associated with the selected debugger plug-in. Select the required debugger plug-infrom the Context drop-down menu to enter parameters for that debugger plug-in.
3 Working with the target configuration editor3.3 Target configuration editor - Memory tab
ARM DUI0446R Copyright © 2010-2014 ARM. All rights reserved. 3-70Non-Confidential

Figure 3-2 Target configuration editor - Memory tab
Mandatory fields are indicated by an asterisk. Toolbar buttons and error messages are displayed in theheader panel as appropriate.
Related concepts3.1 About the target configuration editor on page 3-67.
Related tasks3.9.1 Creating a memory map on page 3-83.3.9.8 Creating a memory region for remapping by a control register on page 3-90.3.9.9 Applying the map rules to the overlapping memory regions on page 3-91.
Related references3.2 Target configuration editor - Overview tab on page 3-68.3.4 Target configuration editor - Peripherals tab on page 3-72.3.5 Target configuration editor - Registers tab on page 3-74.3.6 Target configuration editor - Group View tab on page 3-76.3.7 Target configuration editor - Enumerations tab on page 3-78.3.8 Target configuration editor - Configurations tab on page 3-80.
3 Working with the target configuration editor3.3 Target configuration editor - Memory tab
ARM DUI0446R Copyright © 2010-2014 ARM. All rights reserved. 3-71Non-Confidential

3.4 Target configuration editor - Peripherals tab
A graphical view or tabular view that enables you to define peripherals on your target. They can then bemapped in memory, for display and control, and accessed for block data, when available. You define theperipheral in terms of the area of memory it occupies.
Graphical view
In the graphical view, the following display options are available:
View by Address TypeFilter the graphical view based on secure or non-secure addresses. Available only whenTrustZone is supported. You can select TrustZone support in the Overview tab.
View by Power DomainFilter the graphical view based on the power domain. Available only when Power Domain issupported. You can select Power Domain support in the Overview tab.
Add buttonAdd a new peripheral.
Remove buttonRemove the selected peripheral and, if required, the associated registers.
Graphical and tabular views
In both the graphical view and the tabular view, the following settings are available:
Unique NameName of the selected peripheral (mandatory).
NameUser-friendly name for the selected peripheral.
DescriptionDetailed description of the selected peripheral.
Base AddressAbsolute address or the Name of the memory region to use as a base address. The default is anabsolute starting address of 0x0.
OffsetOffset that is added to the base address (mandatory).
SizeSize of the selected peripheral in bytes.
WidthAccess width of the selected peripheral in bytes.
AccessAccess mode for the selected peripheral.
3 Working with the target configuration editor3.4 Target configuration editor - Peripherals tab
ARM DUI0446R Copyright © 2010-2014 ARM. All rights reserved. 3-72Non-Confidential

Figure 3-3 Target configuration editor - Peripherals tab
Mandatory fields are indicated by an asterisk. Toolbar buttons and error messages are displayed in theheader panel as appropriate.
Related concepts3.1 About the target configuration editor on page 3-67.
Related tasks3.9.2 Creating a peripheral on page 3-84.
Related references3.2 Target configuration editor - Overview tab on page 3-68.3.3 Target configuration editor - Memory tab on page 3-70.3.5 Target configuration editor - Registers tab on page 3-74.3.6 Target configuration editor - Group View tab on page 3-76.3.7 Target configuration editor - Enumerations tab on page 3-78.3.8 Target configuration editor - Configurations tab on page 3-80.
3 Working with the target configuration editor3.4 Target configuration editor - Peripherals tab
ARM DUI0446R Copyright © 2010-2014 ARM. All rights reserved. 3-73Non-Confidential

3.5 Target configuration editor - Registers tab
A tabular view that enables you to define memory mapped registers for your target. Each register isnamed and typed and can be subdivided into bit fields (any number of bits) which act as subregisters.
Unique NameName of the register (mandatory).
NameUser-friendly name for the register.
Base AddressAbsolute address or the Name of the memory region to use as a base address. The default is anabsolute starting address of 0x0.
OffsetOffset that is added to the base address (mandatory).
SizeSize of the register in bytes (mandatory).
Access sizeAccess width of the register in bytes.
AccessAccess mode for the selected register.
DescriptionDetailed description of the register.
PeripheralAssociated peripheral, if applicable.
The Bitfield button opens a table displaying the following information:
Unique NameName of the selected bitfield (mandatory).
NameUser-friendly name for the selected bitfield.
Low BitZero indexed low bit number for the selected bitfield (mandatory).
High BitZero indexed high bit number for the selected bitfield (mandatory).
AccessAccess mode for the selected bitfield.
DescriptionDetailed description of the selected bitfield.
EnumerationAssociated enumeration for the selected bitfield, if applicable.
3 Working with the target configuration editor3.5 Target configuration editor - Registers tab
ARM DUI0446R Copyright © 2010-2014 ARM. All rights reserved. 3-74Non-Confidential

Figure 3-4 Target configuration editor - Registers tab
Mandatory fields are indicated by an asterisk. Toolbar buttons and error messages are displayed in theheader panel as appropriate.
Related concepts3.1 About the target configuration editor on page 3-67.
Related tasks3.9.3 Creating a standalone register on page 3-85.3.9.4 Creating a peripheral register on page 3-86.3.9.6 Assigning enumerations to a peripheral register on page 3-88.3.9.5 Creating enumerations for use with a peripheral register on page 3-87.3.9.6 Assigning enumerations to a peripheral register on page 3-88.
Related references3.2 Target configuration editor - Overview tab on page 3-68.3.3 Target configuration editor - Memory tab on page 3-70.3.4 Target configuration editor - Peripherals tab on page 3-72.3.6 Target configuration editor - Group View tab on page 3-76.3.7 Target configuration editor - Enumerations tab on page 3-78.3.8 Target configuration editor - Configurations tab on page 3-80.
3 Working with the target configuration editor3.5 Target configuration editor - Registers tab
ARM DUI0446R Copyright © 2010-2014 ARM. All rights reserved. 3-75Non-Confidential

3.6 Target configuration editor - Group View tab
A list view that enables you to select peripherals for use by the debugger.
Group View ListEmpty list that enables you to add frequently used peripherals to the debugger.
Add a new groupCreates a group that you can personalize with peripherals.
Remove the selected groupRemoves a group from the list.
Available Peripheral ListA list of the available peripherals. You can select peripherals from this view to add to theGroup View List.
3 Working with the target configuration editor3.6 Target configuration editor - Group View tab
ARM DUI0446R Copyright © 2010-2014 ARM. All rights reserved. 3-76Non-Confidential
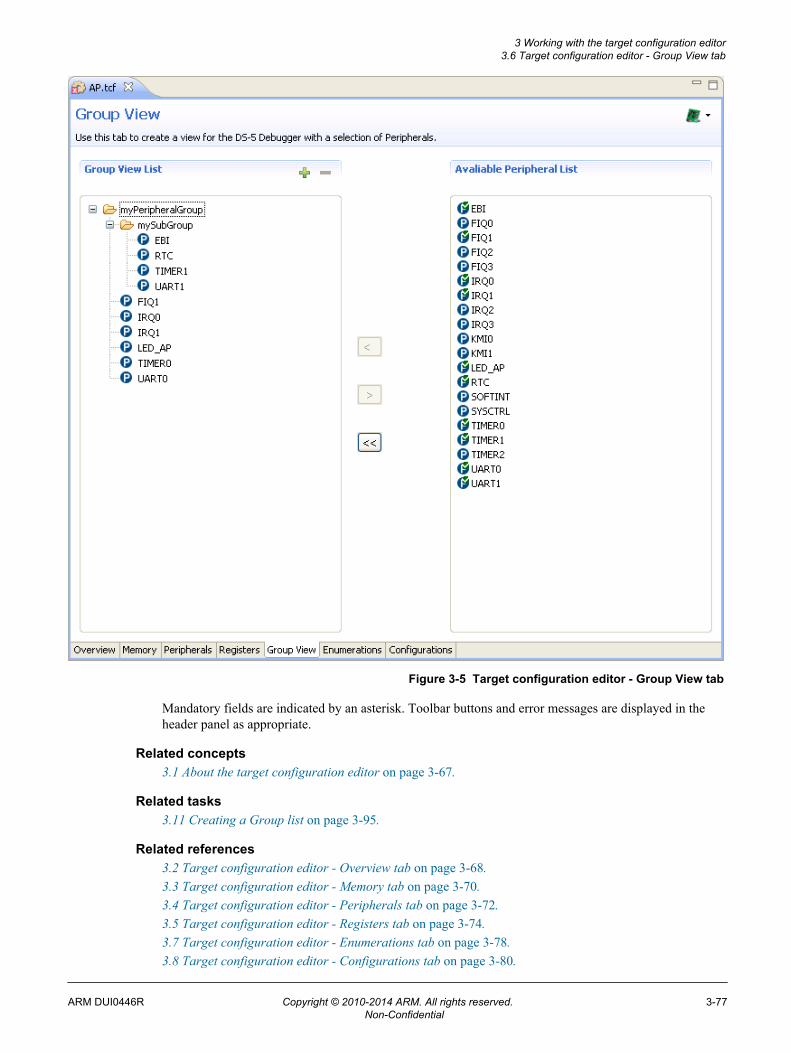
Figure 3-5 Target configuration editor - Group View tab
Mandatory fields are indicated by an asterisk. Toolbar buttons and error messages are displayed in theheader panel as appropriate.
Related concepts3.1 About the target configuration editor on page 3-67.
Related tasks3.11 Creating a Group list on page 3-95.
Related references3.2 Target configuration editor - Overview tab on page 3-68.3.3 Target configuration editor - Memory tab on page 3-70.3.4 Target configuration editor - Peripherals tab on page 3-72.3.5 Target configuration editor - Registers tab on page 3-74.3.7 Target configuration editor - Enumerations tab on page 3-78.3.8 Target configuration editor - Configurations tab on page 3-80.
3 Working with the target configuration editor3.6 Target configuration editor - Group View tab
ARM DUI0446R Copyright © 2010-2014 ARM. All rights reserved. 3-77Non-Confidential

3.7 Target configuration editor - Enumerations tab
A tabular view that enables you to assign values to meaningful names for use by registers you havedefined. Enumerations can be used, instead of values, when a register is displayed in the Registers view.This setting enables you to define the names associated with different values. Names defined in thisgroup are displayed in the Registers view, and can be used to change register values.
Register bit fields are numbered 0, 1, 2,... regardless of their position in the register.
For example, you might want to define ENABLED as 1 and DISABLED as 0.
The following settings are available:
Unique NameName of the selected enumeration (mandatory).
ValueDefinitions specified as comma separated values for selection in the Registers tab (mandatory).
DescriptionDetailed description of the selected enumeration.
Figure 3-6 Target configuration editor - Enumerations tab
Mandatory fields are indicated by an asterisk. Toolbar buttons and error messages are displayed in theheader panel as appropriate.
Related concepts3.1 About the target configuration editor on page 3-67.
3 Working with the target configuration editor3.7 Target configuration editor - Enumerations tab
ARM DUI0446R Copyright © 2010-2014 ARM. All rights reserved. 3-78Non-Confidential

Related tasks3.9.5 Creating enumerations for use with a peripheral register on page 3-87.3.9.6 Assigning enumerations to a peripheral register on page 3-88.
Related references3.2 Target configuration editor - Overview tab on page 3-68.3.3 Target configuration editor - Memory tab on page 3-70.3.4 Target configuration editor - Peripherals tab on page 3-72.3.5 Target configuration editor - Registers tab on page 3-74.3.6 Target configuration editor - Group View tab on page 3-76.3.8 Target configuration editor - Configurations tab on page 3-80.
3 Working with the target configuration editor3.7 Target configuration editor - Enumerations tab
ARM DUI0446R Copyright © 2010-2014 ARM. All rights reserved. 3-79Non-Confidential

3.8 Target configuration editor - Configurations tab
A tabular view that enables you to:
• Define rules to control the enabling and disabling of memory blocks using target registers. Youspecify a register to be monitored, and when the contents match a given value, a set of memoryblocks is enabled. You can define several map rules, one for each of several memory blocks.
• Define power domains that are supported on your target.
Memory Map Configurations group
The following settings are available in the Memory Map Configurations group:
Unique NameName of the rule (mandatory).
NameUser-friendly name for the rule.
RegisterAssociated control register (mandatory).
MaskMask value (mandatory).
ValueValue for a condition (mandatory).
TriggerCondition that changes the control register mapping (mandatory).
Power Domain Configurations group
The Power Domain Configurations group
The following settings are available in this group, and all are mandatory:
Unique NameName of the power domain.
Wake-up ConditionsUser-friendly name for the rule:
RegisterAn associated control register that you have previously created.
MaskMask value.
ValueValue for a condition.
Power StateThe power state of the power domain:
• Active.• Inactive.• Retention.• Off.
3 Working with the target configuration editor3.8 Target configuration editor - Configurations tab
ARM DUI0446R Copyright © 2010-2014 ARM. All rights reserved. 3-80Non-Confidential

Figure 3-7 Target configuration editor - Configuration tab
Mandatory fields are indicated by an asterisk. Toolbar buttons and error messages are displayed in theheader panel as appropriate.
Related concepts3.1 About the target configuration editor on page 3-67.
Related tasks3.9.3 Creating a standalone register on page 3-85.3.9.7 Creating remapping rules for a control register on page 3-89.3.10 Creating a power domain for a target on page 3-94.
Related references3.2 Target configuration editor - Overview tab on page 3-68.3.3 Target configuration editor - Memory tab on page 3-70.3.4 Target configuration editor - Peripherals tab on page 3-72.3.5 Target configuration editor - Registers tab on page 3-74.3.6 Target configuration editor - Group View tab on page 3-76.3.7 Target configuration editor - Enumerations tab on page 3-78.
3 Working with the target configuration editor3.8 Target configuration editor - Configurations tab
ARM DUI0446R Copyright © 2010-2014 ARM. All rights reserved. 3-81Non-Confidential

3.9 Scenario demonstrating how to create a new target configuration file
This is a ficticious scenario to demonstrate how to create a new Target Configuration File (TCF)containing the following memory map and register definitions. The individual tasks required to completeeach step of this tutorial are listed below.
• Boot ROM: 0x0 - 0x8000• SRAM: 0x0 - 0x8000• Internal RAM: 0x8000 - 0x28000• System Registers that contain memory mapped peripherals:
0x10000000 - 0x10001000.
— A basic standalone LED register. This register is located at 0x10000008 and is used to write ahexadecimal value that sets the corresponding bits to 1 to illuminate the respective LEDs.
1Reserved
31 8 7 0
8 7 6 5 4 3 2
LED
Figure 3-8 LED register and bitfields— DMA map register. This register is located at 0x10000064 and controls the mapping of external
peripheral DMA request and acknowledge signals to DMA channel 0.
Table 3-1 DMA map register SYS_DMAPSR0
Bits [31:8] - Reserved. Use read-modify-write to preserve value
Bit [7] Read/Write Set to 1 to enable mapping of external peripheral DMA signals to the DMAcontroller channel.
Bits [6:5] - Reserved. Use read-modify-write to preserve value
Bits [4:0] Read/Write FPGA peripheral mapped to this channel
b00000 = AACI Txb00001 = AACI Rxb00010 = USB Ab00011 = USB Bb00100 = MCI 0
— The core module and LCD control register. This register is located at 0x1000000C and controls anumber of user-configurable features of the core module and the display interface on thebaseboard.
3 Working with the target configuration editor3.9 Scenario demonstrating how to create a new target configuration file
ARM DUI0446R Copyright © 2010-2014 ARM. All rights reserved. 3-82Non-Confidential

LED
31 24 23 21 20 19 8 7 4 3 2 1 0
LCD control Reserved
ReservedEBI_WP
RESETREMAP
nMBDETLED
Figure 3-9 Core module and LCD control register
This register uses bit 2 to control the remapping of an area of memory as shown in the followingtable.
Table 3-2 Control bit that remaps an area of memory
Bits Name Access Function
[2] REMAP Read/Write 0 = Flash ROM at address 0 1 = SRAM at address 0.
• Clearing bit 2 (CM_CTRL = 0) generates the following memory map:
— 0x0000 - 0x8000 Boot_ROM
— 0x8000 - 0x28000 32bit_RAM
• Setting bit 2 (CM_CTRL = 1) generates the following memory map:
— 0x0000 - 0x8000 32bit_RAM_block1_alias
— 0x8000 - 0x28000 32bit_RAM
This section contains the following subsections:
• 3.9.1 Creating a memory map on page 3-83.• 3.9.2 Creating a peripheral on page 3-84.• 3.9.3 Creating a standalone register on page 3-85.• 3.9.4 Creating a peripheral register on page 3-86.• 3.9.5 Creating enumerations for use with a peripheral register on page 3-87.• 3.9.6 Assigning enumerations to a peripheral register on page 3-88.• 3.9.7 Creating remapping rules for a control register on page 3-89.• 3.9.8 Creating a memory region for remapping by a control register on page 3-90.• 3.9.9 Applying the map rules to the overlapping memory regions on page 3-91.
3.9.1 Creating a memory mapDescribes how to create a new memory map.
Procedure
1. Add a new file with the .tcf file extension to an open project.The editor opens with the Overview tab activated.
2. Click on the Overview tab, enter a unique board name, for example: My-Dev-Board.3. Click on the Memory tab.4. Click the Switch to table button in the top right of the view.5. Enter the data as shown in the following figure.
3 Working with the target configuration editor3.9 Scenario demonstrating how to create a new target configuration file
ARM DUI0446R Copyright © 2010-2014 ARM. All rights reserved. 3-83Non-Confidential

Figure 3-10 Creating a Memory map
On completion, you can switch back to the graphical view to see the color coded stack of memoryregions.
Related tasks3.9.2 Creating a peripheral on page 3-84.3.9.3 Creating a standalone register on page 3-85.3.9.4 Creating a peripheral register on page 3-86.3.9.5 Creating enumerations for use with a peripheral register on page 3-87.3.9.6 Assigning enumerations to a peripheral register on page 3-88.3.9.7 Creating remapping rules for a control register on page 3-89.3.9.8 Creating a memory region for remapping by a control register on page 3-90.3.9.9 Applying the map rules to the overlapping memory regions on page 3-91.
Related references3.9 Scenario demonstrating how to create a new target configuration file on page 3-82.3.3 Target configuration editor - Memory tab on page 3-70.
3.9.2 Creating a peripheralDescribes how to create a peripheral.
Procedure
1. Click on the Peripherals tab.2. Click the Switch to table button in the top right of the view.3. Enter the data as shown in the following figure.
3 Working with the target configuration editor3.9 Scenario demonstrating how to create a new target configuration file
ARM DUI0446R Copyright © 2010-2014 ARM. All rights reserved. 3-84Non-Confidential

Figure 3-11 Creating a peripheral
On completion, you can switch back to the graphical view to see the color coded stack of peripherals.
Related tasks3.9.1 Creating a memory map on page 3-83.3.9.3 Creating a standalone register on page 3-85.3.9.4 Creating a peripheral register on page 3-86.3.9.5 Creating enumerations for use with a peripheral register on page 3-87.3.9.6 Assigning enumerations to a peripheral register on page 3-88.3.9.7 Creating remapping rules for a control register on page 3-89.3.9.8 Creating a memory region for remapping by a control register on page 3-90.3.9.9 Applying the map rules to the overlapping memory regions on page 3-91.
Related references3.9 Scenario demonstrating how to create a new target configuration file on page 3-82.3.4 Target configuration editor - Peripherals tab on page 3-72.
3.9.3 Creating a standalone registerDescribes how to create a basic standalone register.
Procedure
1. Click on the Registers tab.2. Enter the register data as shown in the following figure.3. Bitfield data is entered in a floating table associated with the selected register. Select the Unique
name field containing the register name, BRD_SYS_LED.4. Click on the Edit Bitfield button in the top right corner of the view.5. In the floating Bitfield table, enter the data as shown in the following figure. If required, you can
dock this table below the register table by clicking on the title bar of the Bitfield table and dragging itto the base of the register table.
3 Working with the target configuration editor3.9 Scenario demonstrating how to create a new target configuration file
ARM DUI0446R Copyright © 2010-2014 ARM. All rights reserved. 3-85Non-Confidential

Figure 3-12 Creating a standalone register
On completion, close the floating table.
Related tasks3.9.1 Creating a memory map on page 3-83.3.9.2 Creating a peripheral on page 3-84.3.9.4 Creating a peripheral register on page 3-86.3.9.5 Creating enumerations for use with a peripheral register on page 3-87.3.9.6 Assigning enumerations to a peripheral register on page 3-88.3.9.7 Creating remapping rules for a control register on page 3-89.3.9.8 Creating a memory region for remapping by a control register on page 3-90.3.9.9 Applying the map rules to the overlapping memory regions on page 3-91.
Related references3.9 Scenario demonstrating how to create a new target configuration file on page 3-82.3.5 Target configuration editor - Registers tab on page 3-74.3.8 Target configuration editor - Configurations tab on page 3-80.
3.9.4 Creating a peripheral registerDescribes how to create a peripheral register.
Procedure
1. Click on the Registers tab, if it is not already active.2. Enter the peripheral register and associated bitfield data as shown in the following figure.
3 Working with the target configuration editor3.9 Scenario demonstrating how to create a new target configuration file
ARM DUI0446R Copyright © 2010-2014 ARM. All rights reserved. 3-86Non-Confidential

Figure 3-13 Creating a peripheral register
Related tasks3.9.1 Creating a memory map on page 3-83.3.9.2 Creating a peripheral on page 3-84.3.9.3 Creating a standalone register on page 3-85.3.9.5 Creating enumerations for use with a peripheral register on page 3-87.3.9.6 Assigning enumerations to a peripheral register on page 3-88.3.9.7 Creating remapping rules for a control register on page 3-89.3.9.8 Creating a memory region for remapping by a control register on page 3-90.3.9.9 Applying the map rules to the overlapping memory regions on page 3-91.
Related references3.9 Scenario demonstrating how to create a new target configuration file on page 3-82.3.5 Target configuration editor - Registers tab on page 3-74.
3.9.5 Creating enumerations for use with a peripheral registerDescribes how to create enumerations for use with a peripheral.
With more complex peripherals it can be useful to create and assign enumerations to particular peripheralbit patterns so that you can select from a list of enumerated values rather than write the equivalenthexadecimal value. (For example: Enabled/Disabled, On/Off).
Procedure
1. Click on the Enumerations tab.2. Enter the data as shown in the following figure.
3 Working with the target configuration editor3.9 Scenario demonstrating how to create a new target configuration file
ARM DUI0446R Copyright © 2010-2014 ARM. All rights reserved. 3-87Non-Confidential

Figure 3-14 Creating enumerations
Related tasks3.9.1 Creating a memory map on page 3-83.3.9.2 Creating a peripheral on page 3-84.3.9.3 Creating a standalone register on page 3-85.3.9.4 Creating a peripheral register on page 3-86.3.9.6 Assigning enumerations to a peripheral register on page 3-88.3.9.7 Creating remapping rules for a control register on page 3-89.3.9.8 Creating a memory region for remapping by a control register on page 3-90.3.9.9 Applying the map rules to the overlapping memory regions on page 3-91.
Related references3.9 Scenario demonstrating how to create a new target configuration file on page 3-82.3.5 Target configuration editor - Registers tab on page 3-74.3.7 Target configuration editor - Enumerations tab on page 3-78.
3.9.6 Assigning enumerations to a peripheral registerDescribes how to assign enumerations to a peripheral register.
Procedure
1. Click on the Registers tab2. Open the relevant Bitfield table for the DMA peripheral.3. Assign enumerations as shown in the following figure.
3 Working with the target configuration editor3.9 Scenario demonstrating how to create a new target configuration file
ARM DUI0446R Copyright © 2010-2014 ARM. All rights reserved. 3-88Non-Confidential

Figure 3-15 Assigning enumerations
Related tasks3.9.1 Creating a memory map on page 3-83.3.9.2 Creating a peripheral on page 3-84.3.9.3 Creating a standalone register on page 3-85.3.9.4 Creating a peripheral register on page 3-86.3.9.5 Creating enumerations for use with a peripheral register on page 3-87.3.9.7 Creating remapping rules for a control register on page 3-89.3.9.8 Creating a memory region for remapping by a control register on page 3-90.3.9.9 Applying the map rules to the overlapping memory regions on page 3-91.
Related references3.9 Scenario demonstrating how to create a new target configuration file on page 3-82.3.5 Target configuration editor - Registers tab on page 3-74.3.5 Target configuration editor - Registers tab on page 3-74.3.7 Target configuration editor - Enumerations tab on page 3-78.
3.9.7 Creating remapping rules for a control registerDescribes how to create remapping rules for the core module and LCD control register.
Procedure
1. Click on the Configurations tab.2. Enter the data as shown in the following figure.
3 Working with the target configuration editor3.9 Scenario demonstrating how to create a new target configuration file
ARM DUI0446R Copyright © 2010-2014 ARM. All rights reserved. 3-89Non-Confidential

Figure 3-16 Creating remapping rules
Related tasks3.9.1 Creating a memory map on page 3-83.3.9.2 Creating a peripheral on page 3-84.3.9.3 Creating a standalone register on page 3-85.3.9.4 Creating a peripheral register on page 3-86.3.9.5 Creating enumerations for use with a peripheral register on page 3-87.3.9.6 Assigning enumerations to a peripheral register on page 3-88.3.9.8 Creating a memory region for remapping by a control register on page 3-90.3.9.9 Applying the map rules to the overlapping memory regions on page 3-91.
Related references3.9 Scenario demonstrating how to create a new target configuration file on page 3-82.3.8 Target configuration editor - Configurations tab on page 3-80.
3.9.8 Creating a memory region for remapping by a control registerDescribes how to create a new memory region that can be used for remapping when bit 2 of the controlregister is set.
Procedure
1. Click on the Memory tab.2. Switch to the table view by clicking on the relevant button in the top corner.3. Enter the data as shown in the following figure.
3 Working with the target configuration editor3.9 Scenario demonstrating how to create a new target configuration file
ARM DUI0446R Copyright © 2010-2014 ARM. All rights reserved. 3-90Non-Confidential

Figure 3-17 Creating a memory region for remapping by a control register
Related tasks3.9.1 Creating a memory map on page 3-83.3.9.2 Creating a peripheral on page 3-84.3.9.3 Creating a standalone register on page 3-85.3.9.4 Creating a peripheral register on page 3-86.3.9.5 Creating enumerations for use with a peripheral register on page 3-87.3.9.6 Assigning enumerations to a peripheral register on page 3-88.3.9.7 Creating remapping rules for a control register on page 3-89.3.9.9 Applying the map rules to the overlapping memory regions on page 3-91.
Related references3.9 Scenario demonstrating how to create a new target configuration file on page 3-82.3.3 Target configuration editor - Memory tab on page 3-70.
3.9.9 Applying the map rules to the overlapping memory regionsDescribes how to apply the map rules to the overlapping memory regions.
Procedure
1. Switch back to the graphic view by clicking on the relevant button in the top corner.2. Select the overlapping memory region M32bit_RAM_block1_alias and then select
Remap_RAM_block1 from the Apply Map Rule drop-down menu as shown in the following figure.
3 Working with the target configuration editor3.9 Scenario demonstrating how to create a new target configuration file
ARM DUI0446R Copyright © 2010-2014 ARM. All rights reserved. 3-91Non-Confidential

Figure 3-18 Applying the Remap_RAM_block1 map rule3. To apply the other map rule you must select Remap_ROM in the the View by Map Rule drop-down
menu at the top of the stack view.4. Select the overlapping memory region Boot_ROM and then select Remap_ROM from the Apply
Map Rule drop-down menu as shown in the following figure.
3 Working with the target configuration editor3.9 Scenario demonstrating how to create a new target configuration file
ARM DUI0446R Copyright © 2010-2014 ARM. All rights reserved. 3-92Non-Confidential

Figure 3-19 Applying the Remap_ROM map rule5. Save the file.
Related tasks3.9.1 Creating a memory map on page 3-83.3.9.2 Creating a peripheral on page 3-84.3.9.3 Creating a standalone register on page 3-85.3.9.4 Creating a peripheral register on page 3-86.3.9.5 Creating enumerations for use with a peripheral register on page 3-87.3.9.6 Assigning enumerations to a peripheral register on page 3-88.3.9.7 Creating remapping rules for a control register on page 3-89.3.9.8 Creating a memory region for remapping by a control register on page 3-90.
Related references3.9 Scenario demonstrating how to create a new target configuration file on page 3-82.3.3 Target configuration editor - Memory tab on page 3-70.
3 Working with the target configuration editor3.9 Scenario demonstrating how to create a new target configuration file
ARM DUI0446R Copyright © 2010-2014 ARM. All rights reserved. 3-93Non-Confidential
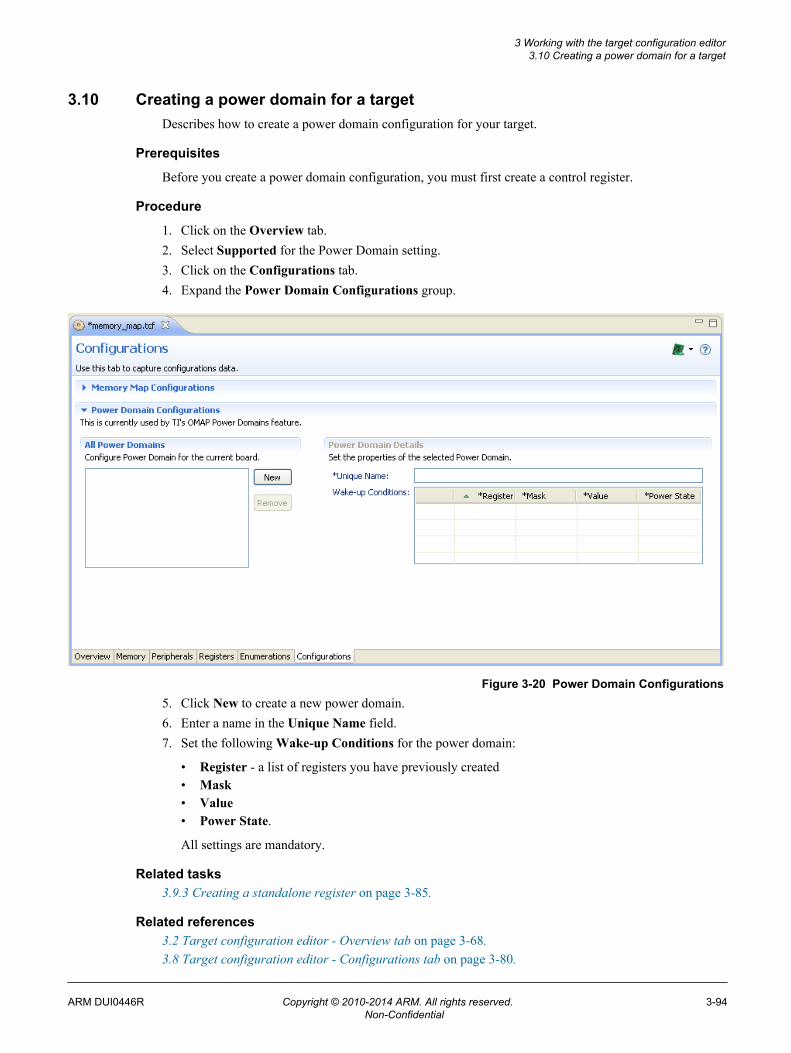
3.10 Creating a power domain for a targetDescribes how to create a power domain configuration for your target.
Prerequisites
Before you create a power domain configuration, you must first create a control register.
Procedure
1. Click on the Overview tab.2. Select Supported for the Power Domain setting.3. Click on the Configurations tab.4. Expand the Power Domain Configurations group.
Figure 3-20 Power Domain Configurations5. Click New to create a new power domain.6. Enter a name in the Unique Name field.7. Set the following Wake-up Conditions for the power domain:
• Register - a list of registers you have previously created• Mask• Value• Power State.
All settings are mandatory.
Related tasks3.9.3 Creating a standalone register on page 3-85.
Related references3.2 Target configuration editor - Overview tab on page 3-68.3.8 Target configuration editor - Configurations tab on page 3-80.
3 Working with the target configuration editor3.10 Creating a power domain for a target
ARM DUI0446R Copyright © 2010-2014 ARM. All rights reserved. 3-94Non-Confidential

3.11 Creating a Group listDescribes how to create a new group list.
Procedure
1. Click on the Group View tab.2. Click Add a new group in the Group View List.3. Select the new group.
Note
You can create a subgroup by selecting a group and clicking Add.
4. Select peripherals and registers from the Available Peripheral List.5. Press the << Add button to add the selected peripherals to the Group View List.6. Click the Save icon in the toolbar.
Figure 3-21 Creating a group list
3 Working with the target configuration editor3.11 Creating a Group list
ARM DUI0446R Copyright © 2010-2014 ARM. All rights reserved. 3-95Non-Confidential

Related references3.6 Target configuration editor - Group View tab on page 3-76.
3 Working with the target configuration editor3.11 Creating a Group list
ARM DUI0446R Copyright © 2010-2014 ARM. All rights reserved. 3-96Non-Confidential

3.12 Importing an existing target configuration fileDescribes how to import an existing target configuration file into the workspace.
Procedure
1. Select Import from the File menu.2. Expand the Target Configuration Editor group.3. Select the required file type.
Figure 3-22 Selecting an existing target configuration file4. Click on Next.5. In the Import dialog box, click Browse... to select the folder containing the file.
3 Working with the target configuration editor3.12 Importing an existing target configuration file
ARM DUI0446R Copyright © 2010-2014 ARM. All rights reserved. 3-97Non-Confidential

Figure 3-23 Importing the target configuration file6. By default, all the files that can be imported are displayed. If the selection panel shows more than one
file, select the files that you want to import.7. Select the file that you want to automatically open in the editor.8. In the Into destination folder field, click Browse... to select an existing project.9. Click Finish.
The new Target Configuration Files (TCF) is visible in the Project Explorer view.
Related tasks3.13 Exporting a target configuration file on page 3-99.
3 Working with the target configuration editor3.12 Importing an existing target configuration file
ARM DUI0446R Copyright © 2010-2014 ARM. All rights reserved. 3-98Non-Confidential

3.13 Exporting a target configuration fileDescribes how to export a target configuration file from a project in the workspace to a C header file.
Note
Before using the export wizard, you must ensure that the Target Configuration File (TCF) is open in theeditor view.
Procedure
1. Select Export from the File menu.2. Expand the Target Configuration Editor group.3. Select C Header file.
Figure 3-24 Exporting to C header file4. Click on Next.5. By default, the active files that are open in the editor are displayed. If the selection panel shows more
than one file, select the files that you want to export.6. Click Browse... to select a destination path.7. If required, select Overwrite existing files without warning.8. Click on Next.
3 Working with the target configuration editor3.13 Exporting a target configuration file
ARM DUI0446R Copyright © 2010-2014 ARM. All rights reserved. 3-99Non-Confidential

Figure 3-25 Selecting the files9. If the TCF file has multiple boards, select the board that you want to configure the data for.10. Select the data that you want to export.11. Select required export options.12. Click Finish to create the C header file.
Related tasks3.12 Importing an existing target configuration file on page 3-97.
3 Working with the target configuration editor3.13 Exporting a target configuration file
ARM DUI0446R Copyright © 2010-2014 ARM. All rights reserved. 3-100Non-Confidential

Chapter 4Controlling execution
Describes how to stop the target execution when certain events occur, and when certain conditions aremet.It contains the following sections:
• 4.1 About loading an image on to the target on page 4-102.• 4.2 About loading debug information into the debugger on page 4-104.• 4.3 About passing arguments to main() on page 4-106.• 4.4 Running an image on page 4-107.• 4.5 Working with breakpoints and watchpoints on page 4-108.• 4.6 Working with conditional breakpoints on page 4-115.• 4.7 About pending breakpoints and watchpoints on page 4-119.• 4.8 Setting a tracepoint on page 4-120.• 4.9 Setting Streamline start and stop points on page 4-121.• 4.10 Stepping through an application on page 4-122.• 4.11 Handling Unix signals on page 4-124.• 4.12 Handling processor exceptions on page 4-126.• 4.13 Configuring the debugger path substitution rules on page 4-128.
ARM DUI0446R Copyright © 2010-2014 ARM. All rights reserved. 4-101Non-Confidential

4.1 About loading an image on to the target
Before you can start debugging your application image, you must load the files on to the target. The fileson your target must be the same as those on your local host workstation. The code layout must beidentical, but the files on your target do require debug information.
You can manually load the files on to the target or you can configure a debugger connection toautomatically do this after a connection is established. Some target connections do not support loadoperations and the relevant menu options are therefore disabled.
After connecting to the target you can also use the Debug Control view menu entry Load... to load filesas required. The following options for loading an image are available:
Load Image OnlyLoads the application image on to the target.
Load Image and Debug InfoLoads the application image on to the target and debug information from the same image intothe debugger.
Load OffsetSpecifies a decimal or hexadecimal offset that is added to all addresses within the image. Ahexadecimal offset must be prefixed with 0x.
Enable on-demand loadingSpecifies how you want the debugger to load debug information. Enabling this option canprovide a faster load and use less memory but debugging might be slower.
Figure 4-1 Load File dialog box
Related concepts4.2 About loading debug information into the debugger on page 4-104.
Related tasks2.3 Configuring a connection to a Fixed Virtual Platform (FVP) for Linux application debugon page 2-36.2.2 Configuring a connection to a Linux target using gdbserver on page 2-34.2.5 Configuring a connection to a Linux Kernel on page 2-40.2.8 Configuring a connection to a bare-metal target on page 2-50.2.9 Configuring an Event Viewer connection to a bare-metal target on page 2-52.
4 Controlling execution4.1 About loading an image on to the target
ARM DUI0446R Copyright © 2010-2014 ARM. All rights reserved. 4-102Non-Confidential

Related references10.6 Commands view on page 10-213.10.7 Debug Control view on page 10-216.
Related informationDS-5 Debugger commands.
4 Controlling execution4.1 About loading an image on to the target
ARM DUI0446R Copyright © 2010-2014 ARM. All rights reserved. 4-103Non-Confidential

4.2 About loading debug information into the debugger
An executable image contains symbolic references, such as function and variable names, in addition tothe application code and data. These symbolic references are generally referred to as debug information.Without this information the debugger is unable to debug at the source level.
To debug an application at source level, the image file and shared object files must be compiled withdebug information, and a suitable level of optimization. For example, when compiling with either theARM or the GNU compiler you can use the following options:
-g -O0
Debug information is not loaded when a file is loaded, but is a separate action. A typical load sequenceis:
1. Load the main application image.2. Load any shared objects.3. Load the symbols for the main application image4. Load the symbols for shared objects on-demand.
Images and shared objects might be preloaded onto the target, such as an image in a ROM device or anOS-aware target. The corresponding image file and any shared object files must contain debuginformation, and be accessible from your local host workstation. You can then configure a connection tothe target loading only the debug information from these files. Use the Load symbols from file optionon the debug configuration Files tab as appropriate for the target environment.
After connecting to the target you can also use the view menu entry Load... in the Debug Control viewto load files as required. The following options for loading debug information are available:
Add Symbols FileLoads additional debug information into the debugger.
Load Debug InfoLoads debug information into the debugger.
Load Image and Debug InfoLoads the application image on to the target and debug information from the same images intothe debugger.
Load OffsetSpecifies a decimal or hexadecimal offset that is added to all addresses within the image. Ahexadecimal offset must be prefixed with 0x.
Enable on-demand loadingSpecifies how you want the debugger to load debug information. Enabling this option canprovide a faster load and use less memory but debugging might be slower.
4 Controlling execution4.2 About loading debug information into the debugger
ARM DUI0446R Copyright © 2010-2014 ARM. All rights reserved. 4-104Non-Confidential

Figure 4-2 Load additional debug information dialog box
The debug information in an image or shared object also contains the path of the sources used to build it.When execution stops at an address in the image or shared object, the debugger attempts to open thecorresponding source file. If this path is not present or the required source file is not found, then youmust inform the debugger where the source file is located. You do this by setting up a substitution rule toassociate the path obtained from the image with the path to the required source file that is accessiblefrom your local host workstation.
Related concepts4.1 About loading an image on to the target on page 4-102.
Related tasks2.3 Configuring a connection to a Fixed Virtual Platform (FVP) for Linux application debugon page 2-36.2.2 Configuring a connection to a Linux target using gdbserver on page 2-34.2.5 Configuring a connection to a Linux Kernel on page 2-40.2.8 Configuring a connection to a bare-metal target on page 2-50.2.9 Configuring an Event Viewer connection to a bare-metal target on page 2-52.
Related references10.6 Commands view on page 10-213.10.7 Debug Control view on page 10-216.4.13 Configuring the debugger path substitution rules on page 4-128.
Related informationDS-5 Debugger commands.
4 Controlling execution4.2 About loading debug information into the debugger
ARM DUI0446R Copyright © 2010-2014 ARM. All rights reserved. 4-105Non-Confidential

4.3 About passing arguments to main()
ARM DS-5 Debugger enables you to pass arguments to the main() function of your application with oneof the following methods:
• using the Arguments tab in the Debug Configuration dialog box.• on the command-line (or in a script), you can use either:
— set semihosting args <arguments>— run <arguments>.
Note
Semihosting must be active for these to work with bare-metal images.
Related references7.1 About semihosting and top of memory on page 7-166.7.2 Working with semihosting on page 7-168.7.3 Enabling automatic semihosting support in the debugger on page 7-169.7.4 Controlling semihosting messages using the command-line console on page 7-170.10.41 Debug Configurations - Arguments tab on page 10-293.
Related informationDS-5 Debugger commands.
4 Controlling execution4.3 About passing arguments to main()
ARM DUI0446R Copyright © 2010-2014 ARM. All rights reserved. 4-106Non-Confidential

4.4 Running an imageDescribes how to run an application image so that you can monitor how it executes on a target.
Use the Debug Configurations dialog box to set up a connection and define the run control options thatyou want the debugger to do after connection. To do this select Debug Configurations... from the Runmenu.
After connection, you can control the debug session by using the toolbar icons in the Debug Controlview.
Prerequisites
Before you can run an image it must be loaded onto the target. An image can either be preloaded on atarget or loaded onto the target as part of the debug session.
Note
The files that resides on the target do not have to contain debug information, however, to be able todebug them you must have the corresponding files with debug information on your local hostworkstation.
Related references10.6 Commands view on page 10-213.10.7 Debug Control view on page 10-216.10.37 Debug Configurations - Connection tab on page 10-282.10.38 Debug Configurations - Files tab on page 10-285.10.39 Debug Configurations - Debugger tab on page 10-289.10.41 Debug Configurations - Arguments tab on page 10-293.10.42 Debug Configurations - Environment tab on page 10-295.Debug Configurations - Event Viewer tab.
Related informationDS-5 Debugger commands.
4 Controlling execution4.4 Running an image
ARM DUI0446R Copyright © 2010-2014 ARM. All rights reserved. 4-107Non-Confidential

4.5 Working with breakpoints and watchpointsBreakpoints and watchpoints enable you to stop the target when certain events occur, and when certainconditions are met. When execution stops, you can choose to examine the contents of memory, registers,or variables, or you specify other actions to be taken before resuming execution.
Breakpoints
A breakpoint enables you to interrupt your application when execution reaches a specific address. Abreakpoint is always related to a particular memory address, regardless of what might be stored there.When execution reaches the breakpoint, normal execution stops before any instruction stored there isperformed.
You can set:
• Software breakpoints that trigger when a particular instruction is executed at a specific address.• Hardware breakpoints that trigger when the processor attempts to execute an instruction that is
fetched from a specific memory address.• Conditional breakpoints that trigger when an expression evaluates to true or when an ignore counter
is reached.• Temporary software or hardware breakpoints that are subsequently deleted when the breakpoint is
hit.
Note
The type of breakpoints you can set depends on the:
• Memory region and the related access attributes.• Hardware support provided by your target processor.• Debug interface used to maintain the target connection.• Running state if you are debugging an OS-aware application.
Watchpoints
A watchpoint is similar to a breakpoint, but it is the address or value of a data access that is monitoredrather than an instruction being executed from a specific address. You specify a register or a memoryaddress to identify a location that is to have its contents tested. Watchpoints are sometimes known asdata breakpoints, emphasizing that they are data dependent. Execution of your application stops when theaddress being monitored is accessed by your application.
You can set:
• Watchpoints that trigger when a particular memory location is accessed in a particular way.• Conditional watchpoints that trigger when an expression evaluates to true or when an ignore counter
is reached.
Note
• Depending on the target, it is possible that a few additional instructions, after the instruction thataccessed the variable, may also be executed.
• Watchpoints are only supported on scalar values.• The number of watchpoints that can be set at the same time depends on the target and the debug
connection being used. Some targets do not support watchpoints.
Considerations when setting breakpoints and watchpoints
Be aware of the following when setting breakpoints and watchpoints:
4 Controlling execution4.5 Working with breakpoints and watchpoints
ARM DUI0446R Copyright © 2010-2014 ARM. All rights reserved. 4-108Non-Confidential

• The number of hardware breakpoints available depends on the target.• If an image is compiled with a high optimization level or perhaps contains C++ templates then the
effect of setting a breakpoint in the source code depends on where you set the breakpoint. Forexample, if you set a breakpoint on an inlined function or a C++ template, then a breakpoint iscreated for each instance of that function or template. Therefore the target can run out of breakpointresources.
• Enabling a Memory Management Unit (MMU) might set a memory region to read-only. If thatmemory region contains a software breakpoint, then that software breakpoint cannot be removed.Therefore, make sure you clear software breakpoints before enabling the MMU.
• Watchpoints are only supported on global/static data symbols because they are always in scope.Local variables are not available when you step out of a function.
• Some targets do not support watchpoints. Currently you can only use watchpoint commands on ahardware target using a debug hardware adapter.
• The address of the instruction that triggers the watchpoint might not be the address shown in the PCregister. This is because of pipelining effects in the processor.
• When debugging an application that uses shared objects, breakpoints that are set within a sharedobject are re-evaluated when the shared object is unloaded. Those with addresses that can be resolvedare set and the others remain pending.
• If a breakpoint is set by function name then only inline instances that have been already demandloaded are found. To find all the inline instances of a function you must disable on-demand loading.
This section contains the following subsections:
• 4.5.1 Setting or deleting an execution breakpoint on page 4-109.• 4.5.2 Setting or removing a data watchpoint on page 4-111.• 4.5.3 Viewing the properties of a data watchpoint on page 4-111.• 4.5.4 Importing DS-5™ breakpoint settings from a file on page 4-112.• 4.5.5 Exporting DS-5™ breakpoint settings to a file on page 4-113.
4.5.1 Setting or deleting an execution breakpointThe debugger enables you to set software or hardware breakpoints depending on your target memorytype.
Software breakpoints are implemented by the debugger replacing the instruction at the breakpointaddress with a special instruction opcode. Because the debugger requires write access to applicationmemory, software breakpoints can only be set in RAM.
Hardware breakpoints are implemented by EmbeddedICE ® logic that monitors the address and databuses of your processor. For simulated targets, hardware breakpoints are implemented by your simulatorsoftware.
Procedure
• To set an execution breakpoint, double-click in the left-hand marker bar of the C/C++ editor or theDisassembly view at the position where you want to set the breakpoint.
• To delete a breakpoint, double-click on the breakpoint marker.
The following figure shows how breakpoints are displayed in the C/C++ editor, the Disassembly view,and the Breakpoints view.
4 Controlling execution4.5 Working with breakpoints and watchpoints
ARM DUI0446R Copyright © 2010-2014 ARM. All rights reserved. 4-109Non-Confidential
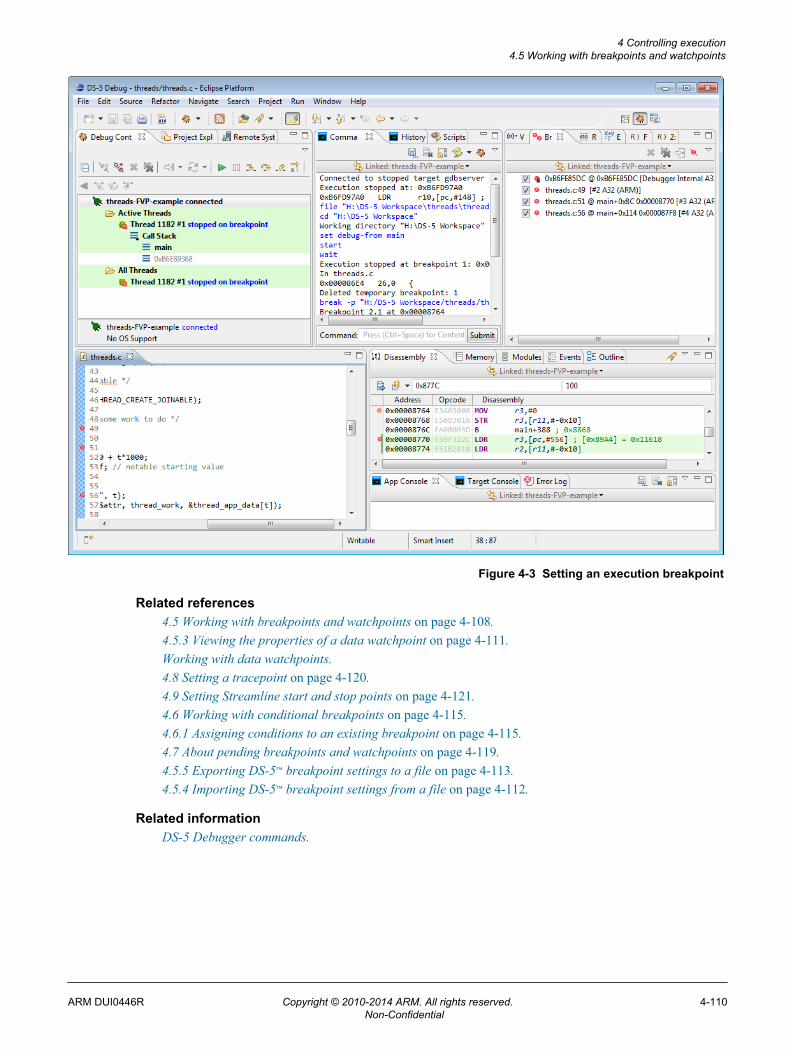
Figure 4-3 Setting an execution breakpoint
Related references4.5 Working with breakpoints and watchpoints on page 4-108.4.5.3 Viewing the properties of a data watchpoint on page 4-111.Working with data watchpoints.4.8 Setting a tracepoint on page 4-120.4.9 Setting Streamline start and stop points on page 4-121.4.6 Working with conditional breakpoints on page 4-115.4.6.1 Assigning conditions to an existing breakpoint on page 4-115.4.7 About pending breakpoints and watchpoints on page 4-119.4.5.5 Exporting DS-5™ breakpoint settings to a file on page 4-113.4.5.4 Importing DS-5™ breakpoint settings from a file on page 4-112.
Related informationDS-5 Debugger commands.
4 Controlling execution4.5 Working with breakpoints and watchpoints
ARM DUI0446R Copyright © 2010-2014 ARM. All rights reserved. 4-110Non-Confidential

4.5.2 Setting or removing a data watchpointLike breakpoints, watchpoints can be used to stop the target. Watchpoints stop the target when aparticular variable is accessed no matter which function is executing.
Procedure
1. To set a data watchpoint, in the Variables view, right-click on a data symbol and select ToggleWatchpoint to display the Add Watchpoint dialog.
Figure 4-4 Setting a data watchpoint2. Select the required Access Type, and then click OK. You can view the created watchpoint in the
Variables view and also in the Breakpoints view. You can view the created watchpoint in theVariables view and also in the Breakpoints view.
• To remove a data watchpoint, in the Variables view, right-click a watchpoint and select ToggleWatchpoint.
4.5.3 Viewing the properties of a data watchpointOnce a data watchpoint is set, you can view its properties.
To view the properties of a data watchpoint, either:
Procedure
• In the Variables view, right-click a watchpoint and select Watchpoint Properties.• In the Breakpoints view, right-click a watchpoint and select Properties....
This displays the Watchpoint Properties dialog:
Figure 4-5 Viewing the properties of a data watchpoint
• Use the options available in the Type options to change the watchpoint type.• If the target supports virtualization, you can use the Break on Virtual Machine ID field to enter a
virtual machine ID. This allows the watchpoint to stop only at the virtual machine ID you specify.
4 Controlling execution4.5 Working with breakpoints and watchpoints
ARM DUI0446R Copyright © 2010-2014 ARM. All rights reserved. 4-111Non-Confidential
Related references4.5 Working with breakpoints and watchpoints on page 4-108.4.5.1 Setting or deleting an execution breakpoint on page 4-109.Working with data watchpoints.4.8 Setting a tracepoint on page 4-120.4.9 Setting Streamline start and stop points on page 4-121.4.6 Working with conditional breakpoints on page 4-115.4.6.1 Assigning conditions to an existing breakpoint on page 4-115.4.7 About pending breakpoints and watchpoints on page 4-119.4.5.5 Exporting DS-5™ breakpoint settings to a file on page 4-113.4.5.4 Importing DS-5™ breakpoint settings from a file on page 4-112.
Related informationDS-5 Debugger commands.
4.5.4 Importing DS-5™ breakpoint settings from a fileYou can import DS-5 breakpoints and watchpoints using the Breakpoints view. This makes it possible towork with breakpoints and watchpoints created in a different workspace.
To import breakpoint settings from a file:
Procedure
1. In the DS-5 debug perspective, select Import Breakpoints from the Breakpoints view menu.2. In the Open window which appears, browse and select the file which contains the breakpoints
settings.3. Click Open.
Note
Existing breakpoints and watchpoints settings for the current connection is deleted and replaced bythe settings from the imported file.
Related references4.5 Working with breakpoints and watchpoints on page 4-108.4.5.1 Setting or deleting an execution breakpoint on page 4-109.4.5.3 Viewing the properties of a data watchpoint on page 4-111.Working with data watchpoints.4.8 Setting a tracepoint on page 4-120.4.9 Setting Streamline start and stop points on page 4-121.4.6 Working with conditional breakpoints on page 4-115.4.6.1 Assigning conditions to an existing breakpoint on page 4-115.4.7 About pending breakpoints and watchpoints on page 4-119.4.5.5 Exporting DS-5™ breakpoint settings to a file on page 4-113.10.3 ARM assembler editor on page 10-203.10.4 Breakpoints view on page 10-206.10.5 C/C++ editor on page 10-210.10.6 Commands view on page 10-213.10.8 Disassembly view on page 10-220.10.11 Expressions view on page 10-229.10.14 Memory view on page 10-236.
4 Controlling execution4.5 Working with breakpoints and watchpoints
ARM DUI0446R Copyright © 2010-2014 ARM. All rights reserved. 4-112Non-Confidential

10.16 Registers view on page 10-243.10.25 Variables view on page 10-263.
Related informationDS-5 Debugger commands.
4.5.5 Exporting DS-5™ breakpoint settings to a fileYou can export DS-5 breakpoints and watchpoints from the Breakpoints view. This makes it possible toexport your current breakpoints and watchpoints to a different workspace.
To export the breakpoint settings to a file:
Procedure
1. In the DS-5 debug perspective, select Export Breakpoints from the Breakpoints view menu.2. In the Save As window which appears, enter a filename and browse and select the location where you
want to save the file.3. Click Save.
Note
All breakpoints and watchpoints shown in the Breakpoints view are saved.
Related references4.5 Working with breakpoints and watchpoints on page 4-108.4.5.1 Setting or deleting an execution breakpoint on page 4-109.4.5.3 Viewing the properties of a data watchpoint on page 4-111.Working with data watchpoints.4.8 Setting a tracepoint on page 4-120.4.9 Setting Streamline start and stop points on page 4-121.4.6 Working with conditional breakpoints on page 4-115.4.6.1 Assigning conditions to an existing breakpoint on page 4-115.4.7 About pending breakpoints and watchpoints on page 4-119.4.5.4 Importing DS-5™ breakpoint settings from a file on page 4-112.10.3 ARM assembler editor on page 10-203.10.4 Breakpoints view on page 10-206.10.5 C/C++ editor on page 10-210.10.6 Commands view on page 10-213.10.8 Disassembly view on page 10-220.10.11 Expressions view on page 10-229.10.14 Memory view on page 10-236.10.16 Registers view on page 10-243.10.25 Variables view on page 10-263.
Related informationDS-5 Debugger commands.
Related references4.5.1 Setting or deleting an execution breakpoint on page 4-109.4.5.3 Viewing the properties of a data watchpoint on page 4-111.Working with data watchpoints.4.8 Setting a tracepoint on page 4-120.4.9 Setting Streamline start and stop points on page 4-121.
4 Controlling execution4.5 Working with breakpoints and watchpoints
ARM DUI0446R Copyright © 2010-2014 ARM. All rights reserved. 4-113Non-Confidential

4.6 Working with conditional breakpoints on page 4-115.4.6.1 Assigning conditions to an existing breakpoint on page 4-115.4.7 About pending breakpoints and watchpoints on page 4-119.4.5.5 Exporting DS-5™ breakpoint settings to a file on page 4-113.4.5.4 Importing DS-5™ breakpoint settings from a file on page 4-112.
Related informationDS-5 Debugger commands.
4 Controlling execution4.5 Working with breakpoints and watchpoints
ARM DUI0446R Copyright © 2010-2014 ARM. All rights reserved. 4-114Non-Confidential

4.6 Working with conditional breakpointsConditional breakpoints have properties assigned to test for conditions that must be satisfied to triggerthe breakpoint.
For example, using conditional breakpoints, you can:
• Test a variable for a given value.• Execute a function a set number of times.• Trigger a breakpoint only on a specific thread or processor.
During execution, the specified condition is checked and if it evaluates to true, then the target remains inthe stopped state, otherwise execution resumes.
Note
• Conditional breakpoints can be very intrusive and lower the performance if they are hit frequentlysince the debugger stops the target every time the breakpoint triggers.
• You must not assign a script to a breakpoint that has sub-breakpoints. If you do, the debuggerattempts to execute the script for each sub-breakpoint. If this occurs, an error message is displayed.
Breakpoints that are set on a single line of source code with multiple statements are assigned as sub-breakpoints to a parent breakpoint. You can enable, disable, and view the properties of each sub-breakpoint in the same way as a single statement breakpoint. Conditions are assigned to top levelbreakpoints only and therefore affect both the parent breakpoint and sub-breakpoints.
Considerations when setting multiple conditions on a breakpoint
Be aware of the following when setting multiple conditions on a breakpoint:
• If you set a Stop Condition and an Ignore Count, then the Ignore Count is not decremented until theStop Condition is met. For example, you might have a breakpoint in a loop that is controlled by thevariable c and has 10 iterations .If you set the Stop Condition c==5 and the Ignore Count to 3, thenthe breakpoint might not activate until it has been hit with c==5 for the fourth time. It subsequentlyactivates every time it is hit with c==5.
• If you choose to break on a selected thread or processor, then the Stop Condition and Ignore Countare checked only for the selected thread or processor.
• Conditions are evaluated in the following order:
1. Thread or processor.2. Condition.3. Ignore count.
This section contains the following subsections:
• 4.6.1 Assigning conditions to an existing breakpoint on page 4-115.
4.6.1 Assigning conditions to an existing breakpointUsing the options available on the Breakpoint Properties dialog, you can specify different conditions fora specific breakpoint.
For example, you can set a breakpoint to be applicable to only specific threads or processors, schedule torun a script when a selected breakpoint is triggered, delay hitting a breakpoint, or specify a conditionalexpression for a specific breakpoint.
Procedure
1. In the Breakpoints view, select the breakpoint that you want to modify and right-click to display thecontext menu.
2. Select Properties... to display the Breakpoint Properties dialog box.
4 Controlling execution4.6 Working with conditional breakpoints
ARM DUI0446R Copyright © 2010-2014 ARM. All rights reserved. 4-115Non-Confidential

Figure 4-6 Breakpoint Properties dialog3. Breakpoints apply to all threads by default, but you can modify the properties for a breakpoint to
restrict it to a specific thread.a) Select the Break on Selected Threads option to view and select individual threads.b) Select the checkbox for each thread that you want to assign the breakpoint to.
Note
If you set a breakpoint for a specific thread, then any conditions you set for the breakpoint arechecked only for that thread.
4. If you want to set a conditional expression for a specific breakpoint, then:a) In the Stop Condition field, enter a C-style expression. For example, if your application has a
variable x, then you can specify:x == 105. If you want the debugger to delay hitting the breakpoint until a specific number of passes has
occurred, then:a) In the Ignore Count field, enter the number of passes. For example, if you have a loop that
performs 100 iterations, and you want a breakpoint in that loop to be hit after 50 passes, then enter50.
6. If you want to run a script when the selected breakpoint is triggered, then:
4 Controlling execution4.6 Working with conditional breakpoints
ARM DUI0446R Copyright © 2010-2014 ARM. All rights reserved. 4-116Non-Confidential

a) In the On break, run script field, specify the script file.Click File System... to locate the file in an external directory from the workspace or clickWorkspace... to locate the file within the workspace.
Note
Take care with commands used in a script file that is attached to a breakpoint. For example, if thescript file contains the quit command, the debugger disconnects from the target when thebreakpoint is hit.
b) Select Continue Execution if you want to enable the debugger to automatically continue runningthe application on completion of all the breakpoint actions. Alternatively, you can enter thecontinue command as the last command in a script file, that is attached to a breakpoint.
7. Once you have selected the required options, click OK to save your changes.
Related references4.5 Working with breakpoints and watchpoints on page 4-108.4.5.1 Setting or deleting an execution breakpoint on page 4-109.4.5.3 Viewing the properties of a data watchpoint on page 4-111.Working with data watchpoints.4.8 Setting a tracepoint on page 4-120.4.9 Setting Streamline start and stop points on page 4-121.4.6 Working with conditional breakpoints on page 4-115.4.7 About pending breakpoints and watchpoints on page 4-119.4.5.5 Exporting DS-5™ breakpoint settings to a file on page 4-113.4.5.4 Importing DS-5™ breakpoint settings from a file on page 4-112.10.3 ARM assembler editor on page 10-203.10.4 Breakpoints view on page 10-206.10.5 C/C++ editor on page 10-210.10.6 Commands view on page 10-213.10.8 Disassembly view on page 10-220.10.11 Expressions view on page 10-229.10.14 Memory view on page 10-236.10.16 Registers view on page 10-243.10.25 Variables view on page 10-263.
Related informationDS-5 Debugger commands.
Related references4.5 Working with breakpoints and watchpoints on page 4-108.4.5.1 Setting or deleting an execution breakpoint on page 4-109.4.5.3 Viewing the properties of a data watchpoint on page 4-111.Working with data watchpoints.4.8 Setting a tracepoint on page 4-120.4.9 Setting Streamline start and stop points on page 4-121.4.6.1 Assigning conditions to an existing breakpoint on page 4-115.4.7 About pending breakpoints and watchpoints on page 4-119.4.5.5 Exporting DS-5™ breakpoint settings to a file on page 4-113.4.5.4 Importing DS-5™ breakpoint settings from a file on page 4-112.10.3 ARM assembler editor on page 10-203.10.4 Breakpoints view on page 10-206.
4 Controlling execution4.6 Working with conditional breakpoints
ARM DUI0446R Copyright © 2010-2014 ARM. All rights reserved. 4-117Non-Confidential

10.5 C/C++ editor on page 10-210.10.6 Commands view on page 10-213.10.8 Disassembly view on page 10-220.10.11 Expressions view on page 10-229.10.14 Memory view on page 10-236.10.16 Registers view on page 10-243.10.25 Variables view on page 10-263.
Related informationDS-5 Debugger commands.
4 Controlling execution4.6 Working with conditional breakpoints
ARM DUI0446R Copyright © 2010-2014 ARM. All rights reserved. 4-118Non-Confidential

4.7 About pending breakpoints and watchpointsBreakpoints and watchpoints are typically set when debug information is available. Pending breakpointsand watchpoints however, enable you to set breakpoints and watchpoints before the associated debuginformation is available.
The debugger automatically re-evaluates all pending breakpoints and watchpoints when debuginformation changes. Those with addresses that can be resolved are set and the others remain pending.
In the Breakpoints view, you can force the resolution of a pending breakpoint or watchpoint. Forexample, this might be useful if you have manually modified the shared library search paths. To do this:
1. Right-click on the pending breakpoint or watchpoint that you want to resolve.2. Click on Resolve to attempt to find the address and set the breakpoint or watchpoint.
Examples
To manually set a pendable breakpoint or watchpoint you can use the -p option with any of thesecommands, advance, awatch, break, hbreak, rwatch, tbreak, thbreak, and watch. You can enterdebugger commands in the Commands view.
break -p lib.c:20 # Sets a pending breakpoint at line 20 in lib.cawatch -p *0x80D4 # Sets a pending read/write watchpoint on address 0x80D4
Related references4.5 Working with breakpoints and watchpoints on page 4-108.4.5.1 Setting or deleting an execution breakpoint on page 4-109.4.5.3 Viewing the properties of a data watchpoint on page 4-111.Working with data watchpoints.4.8 Setting a tracepoint on page 4-120.4.9 Setting Streamline start and stop points on page 4-121.4.6 Working with conditional breakpoints on page 4-115.4.6.1 Assigning conditions to an existing breakpoint on page 4-115.4.5.5 Exporting DS-5™ breakpoint settings to a file on page 4-113.4.5.4 Importing DS-5™ breakpoint settings from a file on page 4-112.10.3 ARM assembler editor on page 10-203.10.4 Breakpoints view on page 10-206.10.5 C/C++ editor on page 10-210.10.6 Commands view on page 10-213.10.8 Disassembly view on page 10-220.10.11 Expressions view on page 10-229.10.14 Memory view on page 10-236.10.16 Registers view on page 10-243.10.25 Variables view on page 10-263.
Related informationDS-5 Debugger commands.
4 Controlling execution4.7 About pending breakpoints and watchpoints
ARM DUI0446R Copyright © 2010-2014 ARM. All rights reserved. 4-119Non-Confidential

4.8 Setting a tracepoint
Tracepoints are memory locations that are used to trigger behavior in a trace capture device whenrunning an application. A tracepoint is hit when the processor executes an instruction at a specificaddress. Depending on the type, trace capture is either enabled or disabled.
Tracepoints can be set from the following:
• ARM Assembler editor.• C/C++ editor.• Disassembly view.• Functions view.• Memory view.• Disassembly panel of the Trace view.
To set a tracepoint, right-click in the left-hand marker bar at the position where you want to set thetracepoint and select either Toggle Trace Start Point, Toggle Trace Stop Point, or Toggle TraceTrigger Point from the context menu. To remove a tracepoint, repeat this procedure on the sametracepoint or delete it from the Breakpoints view.
Tracepoints are stored on a per connection basis. If the active connection is disconnected then tracepointscan only be created from the source editor.
All tracepoints are visible in the Breakpoints view.
Related references4.5 Working with breakpoints and watchpoints on page 4-108.4.5.1 Setting or deleting an execution breakpoint on page 4-109.4.5.3 Viewing the properties of a data watchpoint on page 4-111.Working with data watchpoints.4.9 Setting Streamline start and stop points on page 4-121.4.6 Working with conditional breakpoints on page 4-115.4.6.1 Assigning conditions to an existing breakpoint on page 4-115.4.7 About pending breakpoints and watchpoints on page 4-119.4.5.5 Exporting DS-5™ breakpoint settings to a file on page 4-113.4.5.4 Importing DS-5™ breakpoint settings from a file on page 4-112.10.3 ARM assembler editor on page 10-203.10.4 Breakpoints view on page 10-206.10.5 C/C++ editor on page 10-210.10.6 Commands view on page 10-213.10.8 Disassembly view on page 10-220.10.11 Expressions view on page 10-229.10.14 Memory view on page 10-236.10.16 Registers view on page 10-243.10.25 Variables view on page 10-263.
Related informationDS-5 Debugger commands.
4 Controlling execution4.8 Setting a tracepoint
ARM DUI0446R Copyright © 2010-2014 ARM. All rights reserved. 4-120Non-Confidential

4.9 Setting Streamline start and stop points
Streamline start and stop points are locations in source or assembly code that are used to enable ordisable Streamline capture in a running application. A Streamline start and stop point is hit when theprocessor executes an instruction at a specific address.
Streamline start and stop points can be set from the following views:
• ARM Assembler editor.• C/C++ editor.
To set a Streamline start and stop point, right-click in the left-hand marker bar at the position where youwant to set the start and stop point and select either Toggle Streamline Start or Toggle StreamlineStop from the DS-5 Breakpoints context menu. To remove a start and stop point, repeat this procedureon the same start and stop point.
Related references4.5 Working with breakpoints and watchpoints on page 4-108.4.5.1 Setting or deleting an execution breakpoint on page 4-109.4.5.3 Viewing the properties of a data watchpoint on page 4-111.Working with data watchpoints.4.8 Setting a tracepoint on page 4-120.4.6 Working with conditional breakpoints on page 4-115.4.6.1 Assigning conditions to an existing breakpoint on page 4-115.4.7 About pending breakpoints and watchpoints on page 4-119.4.5.5 Exporting DS-5™ breakpoint settings to a file on page 4-113.4.5.4 Importing DS-5™ breakpoint settings from a file on page 4-112.10.3 ARM assembler editor on page 10-203.10.5 C/C++ editor on page 10-210.
Related informationDS-5 Debugger commands.Using ARM Streamline.
4 Controlling execution4.9 Setting Streamline start and stop points
ARM DUI0446R Copyright © 2010-2014 ARM. All rights reserved. 4-121Non-Confidential

4.10 Stepping through an application
The debugger enables you to finely control the execution of an image by sequentially stepping throughan application at the source level or the instruction level.
Note
You must compile your code with debug information to use the source level stepping commands. Bydefault, source level calls to functions with no debug information are stepped over. Use the set step-mode command to change the default setting.
There are several ways to step through an application. You can choose to step:
• Into or over all function calls.• At source level or instruction level.• Through multiple statements in a single line of source code, for example a for loop.
Be aware that when stepping at the source level, the debugger uses temporary breakpoints to stopexecution at the specified location. These temporary breakpoints might require the use of hardwarebreakpoints, especially when stepping through code in ROM or Flash. If there are not enough hardwarebreakpoint resources available, then the debugger displays an error message.
You can use the stepping toolbar in the Debug Control view to step through the application either bysource line or instruction.
Figure 4-7 Debug Control view
Examples
To step a specified number of times you must use the Commands view to manually execute one of thestepping commands with a number. For example:
steps 5 # Execute five source statementsstepi 5 # Execute five instructions
4 Controlling execution4.10 Stepping through an application
ARM DUI0446R Copyright © 2010-2014 ARM. All rights reserved. 4-122Non-Confidential

Related concepts6.8 About debugging shared libraries on page 6-147.6.9 About debugging a Linux kernel on page 6-149.6.10 About debugging Linux kernel modules on page 6-151.
Related references5.1 Examining the target execution environment on page 5-131.5.2 Examining the call stack on page 5-133.4.11 Handling Unix signals on page 4-124.4.12 Handling processor exceptions on page 4-126.
4 Controlling execution4.10 Stepping through an application
ARM DUI0446R Copyright © 2010-2014 ARM. All rights reserved. 4-123Non-Confidential

4.11 Handling Unix signals
For Linux applications, ARM processors have the facility to trap Unix signals. These are managed in thedebugger by selecting Manage Signals from the Breakpoints view menu or you can use the handlecommand. You can also use the info signals command to display the current handler settings.
The default handler settings are dependent on the type of debug activity. For example, by default on aLinux kernel connection, all signals are handled by Linux on the target.
Figure 4-8 Managing signal handler settings
Note
Unix signals SIGINT and SIGTRAP cannot be debugged in the same way as other signals because they areused internally by the debugger for asynchronous stopping of the process and breakpoints respectively.
Examples
If you want the application to ignore a signal but log the event when it is triggered then you must enablestopping on a signal. In the following example, a SIGHUP signal occurs causing the debugger to stop andprint a message. No signal handler is invoked when using this setting and the application being debuggedignores the signal and continues.
4 Controlling execution4.11 Handling Unix signals
ARM DUI0446R Copyright © 2010-2014 ARM. All rights reserved. 4-124Non-Confidential

Ignoring a SIGHUP signal
handle SIGHUP stop print # Enable stop and print on SIGHUP signal
The following example shows how to debug a signal handler. To do this you must disable stopping on asignal and then set a breakpoint in the signal handler. This is because if stopping on a signal is disabledthen the handling of that signal is performed by the process that passes signal to the registered handler. Ifno handler is registered then the default handler runs and the application generally exits.
Debugging a SIGHUP signal
handle SIGHUP nostop noprint # Disable stop and print on SIGHUP signal
Related concepts6.8 About debugging shared libraries on page 6-147.6.9 About debugging a Linux kernel on page 6-149.6.10 About debugging Linux kernel modules on page 6-151.
Related references4.10 Stepping through an application on page 4-122.5.1 Examining the target execution environment on page 5-131.5.2 Examining the call stack on page 5-133.4.12 Handling processor exceptions on page 4-126.10.4 Breakpoints view on page 10-206.10.6 Commands view on page 10-213.10.34 Manage Signals dialog box on page 10-278.
Related informationDS-5 Debugger commands.
4 Controlling execution4.11 Handling Unix signals
ARM DUI0446R Copyright © 2010-2014 ARM. All rights reserved. 4-125Non-Confidential

4.12 Handling processor exceptions
ARM processors handle exceptional events by jumping to one of a set of fixed addresses known asexception vectors. Except for a Supervisor Call (SVC), these events are not part of normal program flowand can happen unexpectedly because of a software bug. For this reason most ARM processors include avector catch feature to trap these exceptions. This is most useful for bare-metal projects, or projects at anearly stage of development. When an OS is running it might use these exceptions for legitimate purposes,for example virtual memory.
When vector catch is enabled, the effect is similar to placing a breakpoint on the selected vector tableentry, except that vector catches use dedicated hardware in the processor and do not use up valuablebreakpoint resources. To manage vector catch in the debugger either select Manage Signals from theBreakpoints view menu or use the handle command. You can also use the info signals command todisplay the current handler settings.
The vector catch events that are available are dependent on the exact processor that you are connected to.
Figure 4-9 Manage exception handler settings
Examples
If you want the debugger to catch the exception, log the event, and stop the application when theexception occurs then you must enable stopping on an exception. In the following example, a NON-SECURE_FIQ exception occurs causing the debugger to stop and print a message. You can then step or runto the handler, if present.
Debugging an exception handler
handle NON-SECURE_FIQ stop # Enable stop and print on a NON-SECURE_FIQ exception
If you want the exception to invoke the handler without stopping then you must disable stopping on anexception.
Ignoring an exception
handle NON-SECURE_FIQ nostop # Disable stop on a NON-SECURE_FIQ exception
4 Controlling execution4.12 Handling processor exceptions
ARM DUI0446R Copyright © 2010-2014 ARM. All rights reserved. 4-126Non-Confidential

Related concepts6.8 About debugging shared libraries on page 6-147.6.9 About debugging a Linux kernel on page 6-149.6.10 About debugging Linux kernel modules on page 6-151.
Related references4.10 Stepping through an application on page 4-122.5.1 Examining the target execution environment on page 5-131.5.2 Examining the call stack on page 5-133.4.11 Handling Unix signals on page 4-124.10.4 Breakpoints view on page 10-206.10.6 Commands view on page 10-213.10.34 Manage Signals dialog box on page 10-278.
Related informationDS-5 Debugger commands.
4 Controlling execution4.12 Handling processor exceptions
ARM DUI0446R Copyright © 2010-2014 ARM. All rights reserved. 4-127Non-Confidential

4.13 Configuring the debugger path substitution rules
The debugger might not be able to locate the source file when debug information is loaded because:
• The path specified in the debug information is not present on your workstation, or that path does notcontain the required source file.
• The source file is not in the same location on your workstation as the image containing the debuginformation. The debugger attempts to use the same path as this image by default.
Therefore, you must modify the search paths used by the debugger when it executes any of thecommands that look up and display source code.
To modify the search paths:
1. Open the Path Substitution dialog box:
• If a source file cannot be located, a warning is displayed in the C/C++ editor. Click on Set PathSubstitution.
• In the Debug Control view, select Path Substitution from the view menu.
Figure 4-10 Path Substitution dialog box2. Click on the toolbar icons in the Path Substitution dialog box to add, edit, or duplicate substitution
rules:
a. Enter the original path for the source files in the Image Path field or click on Select... to selectfrom the compilation paths.
b. Enter the current location of the source files in the Host Path field or click on:
• File System... to locate the source files in an external folder.• Workspace... to locate the source files in a workspace project.
c. Click OK.
4 Controlling execution4.13 Configuring the debugger path substitution rules
ARM DUI0446R Copyright © 2010-2014 ARM. All rights reserved. 4-128Non-Confidential

Figure 4-11 Edit Substitute Path dialog box3. If required, you can use the toolbar icons in the Path Substitution dialog box to change the order of
the substitution rules or delete rules that are no longer required.4. Click OK to pass the substitution rules to the debugger and close the dialog box.
Related concepts4.2 About loading debug information into the debugger on page 4-104.
4 Controlling execution4.13 Configuring the debugger path substitution rules
ARM DUI0446R Copyright © 2010-2014 ARM. All rights reserved. 4-129Non-Confidential

Chapter 5Examining the target
This chapter describes how to examine registers, variables, memory, and the call stack.It contains the following sections:
• 5.1 Examining the target execution environment on page 5-131.• 5.2 Examining the call stack on page 5-133.• 5.3 About trace support on page 5-134.• 5.4 About post-mortem debugging of trace data on page 5-137.
ARM DUI0446R Copyright © 2010-2014 ARM. All rights reserved. 5-130Non-Confidential

5.1 Examining the target execution environmentDuring a debug session, you might want to display the value of a register or variable, the address of asymbol, the data type of a variable, or the content of memory. The DS-5 Debug perspective providesessential debugger views showing the current values.
As you step through the application, all the views associated with the active connection are updated. Inthe perspective, you can move any of the views to a different position by clicking on the tab anddragging the view to a new position. You can also double-click on a tab to maximize or reset a view forcloser analysis of the contents in the view.
Figure 5-1 Target execution environment
Alternatively, you can use debugger commands to display the required information. In the Commandsview, you can execute individual commands or you can execute a sequence of commands by using ascript file.
Related concepts6.8 About debugging shared libraries on page 6-147.6.9 About debugging a Linux kernel on page 6-149.6.10 About debugging Linux kernel modules on page 6-151.
Related references4.10 Stepping through an application on page 4-122.5.2 Examining the call stack on page 5-133.
5 Examining the target5.1 Examining the target execution environment
ARM DUI0446R Copyright © 2010-2014 ARM. All rights reserved. 5-131Non-Confidential

4.11 Handling Unix signals on page 4-124.4.12 Handling processor exceptions on page 4-126.
5 Examining the target5.1 Examining the target execution environment
ARM DUI0446R Copyright © 2010-2014 ARM. All rights reserved. 5-132Non-Confidential

5.2 Examining the call stack
The call stack, or runtime stack, is an area of memory used to store function return information and localvariables. As each function is called, a record is created on the call stack. This record is commonlyknown as a stack frame.
The debugger can display the calling sequence of any functions that are still in the execution pathbecause their calling addresses are still on the call stack. However:
• When a function completes execution the associated stack frame is removed from the call stack andthe information is no longer available to the debugger.
• If the call stack contains a function for which there is no debug information, the debugger might notbe able to trace back up the calling stack frames. Therefore you must compile all your code withdebug information to successfully view the full call stack.
If you are debugging multi-threaded applications, a separate call stack is maintained for each thread.
All the views in the DS-5 Debug perspective are associated with the current stack frame and are updatedwhen you select another frame. The current stack frame is shown in bold text.
Figure 5-2 Debug Control view
Related concepts6.8 About debugging shared libraries on page 6-147.6.9 About debugging a Linux kernel on page 6-149.6.10 About debugging Linux kernel modules on page 6-151.
Related references4.10 Stepping through an application on page 4-122.5.1 Examining the target execution environment on page 5-131.4.11 Handling Unix signals on page 4-124.4.12 Handling processor exceptions on page 4-126.
5 Examining the target5.2 Examining the call stack
ARM DUI0446R Copyright © 2010-2014 ARM. All rights reserved. 5-133Non-Confidential

5.3 About trace support
ARM DS-5 enables you to perform tracing on your application or system. Tracing is the ability tocapture in real-time a historical, non-invasive debug of instructions and data accesses. It is a powerfultool that enables you to investigate problems while the system runs at full speed. These problems can beintermittent, and are difficult to identify through traditional debugging methods that require starting andstopping the processor. Tracing is also useful when trying to identify potential bottlenecks or to improveperformance-critical areas of your application.
Before the debugger can trace function executions in your application you must ensure that:
• you have a debug hardware agent, such as an ARM DSTREAM \VSTREAM unit with a connectionto a trace stream
• the debugger is connected to the debug hardware agent.
Trace hardware
Trace is typically provided by an external hardware block connected to the processor. This is known asan Embedded Trace Macrocell (ETM) or Program Trace Macrocell (PTM) and is an optional part of anARM architecture-based system. System-on-chip designers might omit this block from their silicon toreduce costs. These blocks observe (but do not affect) the processor behavior and are able to monitorinstruction execution and data accesses.
There are two main problems with capturing trace. The first is that with very high processor clockspeeds, even a few seconds of operation can mean billions of cycles of execution. Clearly, to look at thisvolume of information would be extremely difficult. The second, related problem is that modernprocessors could potentially perform one or more 64-bit cache accesses per cycle and to record both thedata address and data values might require large bandwidth. This presents a problem in that typically,only a few pins are provided on the chip and these outputs might be able to be switched at significantlylower rates than the processor can be clocked at. It is very easy to exceed the capacity of the trace port.To solve this latter problem, the trace macrocell tries to compress information to reduce the bandwidthrequired. However, the main method to deal with these issues is to control the trace block so that onlyselected trace information is gathered. For example, trace only execution, without recording data values,or trace only data accesses to a particular peripheral or during execution of a particular function.
In addition, it is common to store trace information in an on-chip memory buffer, the Embedded TraceBuffer (ETB). This alleviates the problem of getting information off-chip at speed, but has an additionalcost in terms of silicon area and also provides a fixed limit on the amount of trace that can be captured.
The ETB stores the compressed trace information in a circular fashion, continuously capturing traceinformation until stopped. The size of the ETB varies between chip implementations, but a buffer of 8 or16kB is typically enough to hold a few thousand lines of program trace.
When a program fails, and the trace buffer is enabled, you can see a portion of program history. With thisprogram history, it is easier to walk back through your program to see what happened just before thepoint of failure. This is particularly useful for investigating intermittent and real-time failures, which canbe difficult to identify through traditional debug methods that require stopping and starting the processor.The use of hardware tracing can significantly reduce the amount of time required to find these failures,because the trace shows exactly what was executed.
Trace Ranges
Trace ranges enable you to restrict the capture of trace to a linear range of memory. A trace range has astart and end address in virtual memory, and any execution within this address range is captured. Incontrast to trace start and end points, any function calls made within a trace range are only captured if thetarget of the function call is also within the specified address range. The number of trace ranges that canbe enabled is determined by the debug hardware in your processor.
5 Examining the target5.3 About trace support
ARM DUI0446R Copyright © 2010-2014 ARM. All rights reserved. 5-134Non-Confidential

Trace capture is enabled by default when no trace ranges are set. Trace capture is disabled by defaultwhen any trace ranges are set, and is only enabled when within the defined ranges.
You can configure trace ranges using the Ranges tab in the Trace view. The start and end address foreach range can either be an absolute address or an expression, such as the name of a function. Be awarethat optimizing compilers might rearrange or minimize code in memory from that in the associatedsource code. This can lead to code being unexpectedly included or excluded from the trace capture.
Trace Points
Trace points enable you to control precisely where in your program trace is captured. Trace points arenon-intrusive and do not require stopping the system to process. The maximum number of trace pointsthat can be set is determined by the debug hardware in your processor. The following types of tracepoints are available:To set trace points in the source view, right-click in the margin and select therequired option from the DS-5 Breakpoints context menu. To set trace points in the Disassembly view,right-click on an instruction and select the required option from the DS-5 Breakpoints context menu.Trace points are listed in the Breakpoints view.
Trace Start PointEnables trace capture when execution reaches the selected address.
Trace Stop PointDisables trace capture when execution reaches the selected address
Trace Trigger PointMarks this point in the trace so that you can more easily locate it in the Trace view.
Trace Start Points and Trace Stop Points enable and disable capture of trace respectively. Trace points donot take account of nesting. For example, if you hit two Trace Start Points in a row, followed by twoTrace Stop Points, then the trace is disabled immediately when the first Trace Stop Point is reached, notthe second. With no Trace Start Points set then trace is enabled all the time by default. If you have anyTrace Start Points set, then trace is disabled by default and is only enabled when the first Trace StartPoint is hit.
Trace trigger points enable you to mark interesting locations in the trace so that you can easily find themlater in the Trace view. The first time a Trigger Point is hit a Trace Trigger Event record is inserted intothe trace buffer. Only the first Trigger Point to be hit inserts the trigger event record. To configure thedebugger so that it stops collecting trace when a trace trigger point is hit, use the Stop Trace CaptureOn Trigger checkbox in the Properties tab of the Trace view.
Note
This does not stop the target. It only stops the trace capture. The target continues running normally untilit hits a breakpoint or until you click the Interrupt icon in the Debug Control view.
When this is set you can configure the amount of trace that is captured before and after a trace triggerpoint using the Post-Trigger Capture Size field in the Properties tab of the Trace view. If you set thisfield to:
0%The trace capture stops as soon as possible after the first trigger point is hit. The trigger eventrecord can be found towards the end of the trace buffer.
50%The trace capture stops after the first trigger point is hit and an additional 50% of the buffer isfilled. The trigger event record can be found towards the middle of the trace buffer.
99%The trace capture stops after the first trigger point is hit and an additional 99% of the buffer isfilled. The trigger event record can be found towards the beginning of the trace buffer.
Note
Due to target timing constraints the trigger event record might get pushed out of the trace buffer.
5 Examining the target5.3 About trace support
ARM DUI0446R Copyright © 2010-2014 ARM. All rights reserved. 5-135Non-Confidential

Being able to limit trace capture to the precise areas of interest is especially helpful when using a capturedevice such as an ETB, where the quantity of trace that can be captured is very small.
Select the Find Trigger Event record option in the view menu to locate Trigger Event record in thetrace buffer.
Note
Trace trigger functionality is dependent on the target platform being able to signal to the trace capturehardware, such as ETB or VSTREAM, that a trigger condition has occurred. If this hardware signal isnot present or not configured correctly then it might not be possible to automatically stop trace capturearound trigger points.
Related concepts5.4 About post-mortem debugging of trace data on page 5-137.1.4 About DS-5™ headless command-line debugger on page 1-23.
Related tasks1.6 Specifying a custom configuration database using the headless command-line debuggeron page 1-27.
Related references1.5 Headless command-line debugger options on page 1-24.
5 Examining the target5.3 About trace support
ARM DUI0446R Copyright © 2010-2014 ARM. All rights reserved. 5-136Non-Confidential

5.4 About post-mortem debugging of trace dataYou can decode previously captured trace data. You must have files available containing the capturedtrace, as well as any other files, such as configuration and images, that are needed to process and decodethat trace data.
Once the trace data and other files are ready, you configure the headless command-line debugger toconnect to the post-mortem debug configuration from the configuration database.
You can then inspect the state of the data at the time of the trace capture.
Note
• The memory and registers are read-only.• You can add more debug information using additional files.• You can also decode trace and dump the output to files.
The basic steps for post-mortem debugging using the headless command-line debugger are:
1. Generate trace data files.2. Use --cdb-list to list the platforms and parameters available in the configuration database.3. Use --cdb-entry to specify a platform entry in the configuration database.4. If you need to specify additional parameters, use the --cdb-entry-param option to specify the
parameters.
Note
At the DS-5 command prompt, enter debugger --help to view the list of available options.
Related concepts5.3 About trace support on page 5-134.1.4 About DS-5™ headless command-line debugger on page 1-23.
Related tasks1.6 Specifying a custom configuration database using the headless command-line debuggeron page 1-27.
Related references1.5 Headless command-line debugger options on page 1-24.
5 Examining the target5.4 About post-mortem debugging of trace data
ARM DUI0446R Copyright © 2010-2014 ARM. All rights reserved. 5-137Non-Confidential

Chapter 6Debugging embedded systems
Gives an introduction to debugging embedded systems.It contains the following sections:
• 6.1 About endianness on page 6-139.• 6.2 About accessing AHB, APB, and AXI buses on page 6-140.• 6.3 About virtual and physical memory on page 6-141.• 6.4 About debugging hypervisors on page 6-142.• 6.5 About debugging big.LITTLE systems on page 6-143.• 6.6 About debugging bare-metal symmetric multiprocessing systems on page 6-144.• 6.7 About debugging multi-threaded applications on page 6-146.• 6.8 About debugging shared libraries on page 6-147.• 6.9 About debugging a Linux kernel on page 6-149.• 6.10 About debugging Linux kernel modules on page 6-151.• 6.11 About debugging FreeRTOS ™ on page 6-153.• 6.12 About debugging TrustZone enabled targets on page 6-154.• 6.13 About debugging a Unified Extensible Firmware Interface (UEFI) on page 6-156.• 6.14 About application rewind on page 6-157.• 6.15 About debugging ThreadX on page 6-159.• 6.16 About DTSL (Debug and Trace Service Layer) on page 6-160.• 6.17 About CoreSight™ Target Access Library on page 6-161.• 6.18 About debugging caches on page 6-162.
ARM DUI0446R Copyright © 2010-2014 ARM. All rights reserved. 6-138Non-Confidential

6.1 About endianness
The term endianness is used to describe the ordering of individually addressable quantities, which meansbytes and halfwords in the ARM architecture. The term byte-ordering can also be used rather thanendian.
If an image is loaded to the target on connection, the debugger automatically selects the endianness ofthe image otherwise it selects the current endianness of the target. If the debugger detects a conflict thena warning message is generated.
You can use the set endian command to modify the default debugger setting.
Related informationDS-5 Debugger commands.
6 Debugging embedded systems6.1 About endianness
ARM DUI0446R Copyright © 2010-2014 ARM. All rights reserved. 6-139Non-Confidential

6.2 About accessing AHB, APB, and AXI buses-based systems connect the processors, memories and peripherals using buses. Examples of common bustypes include AMBA High-performance Bus (AHB), Advanced Peripheral Bus (APB), and AdvancedeXtensible Interface (AXI).
In some systems, these buses are accessible from the debug interface. Where this is the case, then DS-5Debugger provides access to these buses when performing bare-metal or kernel debugging. Buses areexposed within the debugger as additional address spaces. Accesses to these buses are available when theprocessor is running.
Within a debug session in DS-5 Debugger you can discover which buses are available using the infomemory command. The address and description columns in the output of this command explain whateach address space represents and how the debugger accesses it.
You can use AHB:, APB:, and AXI: address prefixes for these buses anywhere in the debugger where younormally enter an address or expression. For example, assuming that the debugger provides an APBaddress space, then you can print the contents of address zero using the following command:
x/1 APB:0x0
Each address space has a size, which is the number of bits that comprise the address. Common addressspace size on embedded and low-end devices is 32-bits, higher-end devices that require more memorymight use > 32-bits. As an example, some devices based around architecture ARMv7 make use of LPAE(Large Physical Address Extensions) to extend physical addresses on the AXI bus to 40-bits, eventhough virtual addresses within the processor are 32-bits.
The exact topology of the buses and their connection to the debug interface is dependent on your system.See the CoreSight specifications for your hardware for more information. Typically, the debug access tothese buses bypass the processor, and so does not take into account memory mappings or caches withinthe processor itself. It is implementation dependent on whether accesses to the buses occur before or afterany other caches in the system, such as L2 or L3 caches. The debugger does not attempt to achievecoherency between caches in your system when accessing these buses and it is your responsibility to takethis into account and manually perform any clean or flush operations as required.
For example, to achieve cache coherency when debugging an image with the processors level 1 cacheenabled, you must clean and invalidate portions of the L1 cache prior to modifying any of yourapplication code or data using the AHB address space. This ensures that any existing changes in thecache are written out to memory before writing to that address space, and that the processor correctlyreads your modification when execution resumes.
The behavior when accessing unallocated addresses is undefined, and depending on your system can leadto locking up the buses. It is recommended that you only access those specific addresses that are definedin your system. You can use the memory command to redefine the memory regions within the debuggerand modifying access rights to control the addresses. You can use the x command with the count optionto limit the amount of memory that is read.
Related references10.6 Commands view on page 10-213.10.7 Debug Control view on page 10-216.
Related informationDS-5 Debugger commands.
6 Debugging embedded systems6.2 About accessing AHB, APB, and AXI buses
ARM DUI0446R Copyright © 2010-2014 ARM. All rights reserved. 6-140Non-Confidential
6.3 About virtual and physical memory
Processors that contain a Memory Management Unit (MMU) provide two views of memory, virtual andphysical. The virtual address is the address prior to address translation in the MMU and the physicaladdress is the address after translation. Normally when the debugger accesses memory, it uses virtualaddresses. However, if the MMU is disabled then the mapping is flat and the virtual address is the sameas the physical address. To force the debugger to use physical addresses prefix an addresses with P:. Forexample:
P:0x8000P:0+main creates a physical address with the address offset of main()
If your processor additionally contains TrustZone technology, then you have access to Secure andNormal worlds, each with their own separate virtual and physical address mappings. In this case, theaddress prefix P: is not available, and instead you must use NP: for normal physical and SP: for securephysical.
Note
Physical address access is not enabled for all operations. For example, the ARM hardware does notprovide support for setting breakpoints via a physical address.
When memory is accessed via a physical address the caches are not flushed. Hence, results might differdepending on whether you view memory through the physical or virtual addresses (assuming they areaddressing the same memory addresses).
Related references10.6 Commands view on page 10-213.10.7 Debug Control view on page 10-216.
Related informationDS-5 Debugger commands.
6 Debugging embedded systems6.3 About virtual and physical memory
ARM DUI0446R Copyright © 2010-2014 ARM. All rights reserved. 6-141Non-Confidential

6.4 About debugging hypervisors
ARM processors that support virtualization extensions have the ability to run multiple guest operatingsystems beneath a hypervisor. The hypervisor is the software that arbitrates amongst the guest operatingsystems and controls access to the hardware.
DS-5 Debugger provides basic support for bare-metal hypervisor debugging. When connected to aprocessor that supports virtualization extensions, the debugger enables you to distinguish betweenhypervisor and guest memory, and to set breakpoints that only apply when in hypervisor mode or withina specific guest operating system.
A hypervisor typically provides separate address spaces for itself as well as for each guest operatingsystem. Unless informed otherwise, all memory accesses by the debugger occur in the current context. Ifyou are stopped in hypervisor mode then memory accesses use the hypervisor memory space, and ifstopped in a guest operating system then memory accesses use the address space of the guest operatingsystem. To force access to a particular address space you must prefix the address with either H: forhypervisor or N: for guest operating system. Note that it is only possible to access the address space ofthe guest operating system that is currently scheduled to run within the hypervisor. It is not possible tospecify a different guest operating system.
Similarly, hardware and software breakpoints can be configured to match on hypervisor or guestoperating systems using the same address prefixes. If no address prefix is used then the breakpointapplies to the address space that is current when the breakpoint is first set. For example, if a softwarebreakpoint is set in memory that is shared between hypervisor and a guest operating system, then thepossibility exists for the breakpoint to be hit from the wrong mode, and in this case the debugger may notrecognize your breakpoint as the reason for stopping.
For hardware breakpoints only, not software breakpoints, you can additionally configure them to matchonly within a specific guest operating system. This feature uses the architecturally defined VirtualMachine ID (VMID) register to spot when a specific guest operating system is executing. The hypervisoris responsible for assigning unique VMIDs to each guest operating system setting this in the VMIDregister when that guest operating system executes. In using this feature, it is your responsibility tounderstand which VMID is associated with each guest operating system that you want to debug.Assuming a VMID is known, you can apply a breakpoint to it within the Breakpoints view or by usingthe break-stop-on-vmid command.
When debugging a system that is running multiple guest operating systems, you can optionally enablethe set print current-vmid setting to receive notifications in the console when the debugger stopsand the current VMID changes. You can also obtain the VMID within DS-5 scripts using the $vmiddebugger variable.
Related references10.6 Commands view on page 10-213.10.7 Debug Control view on page 10-216.
Related informationDS-5 Debugger commands.
6 Debugging embedded systems6.4 About debugging hypervisors
ARM DUI0446R Copyright © 2010-2014 ARM. All rights reserved. 6-142Non-Confidential

6.5 About debugging big.LITTLE systems
A big.LITTLE system is designed to optimize both high performance and low power consumption over awide variety of workloads. It achieves this by including one or more high performance processorsalongside one or more low power processors. The system transitions the workload between theprocessors as necessary to achieve this goal.
big.LITTLE systems are typically configured in a Symmetric MultiProcessing (SMP) configuration. Anoperating system or hypervisor controls which processors are powered up or down at any given time andassists in migrating tasks between them.
For bare-metal debugging on big.LITTLE systems, you can establish an SMP connection within DS-5Debugger. In this case all the processors in the system are brought under the control of the debugger. Thedebugger monitors the power state of each processor as it runs and displays it in the Debug Controlview and on the command -line. Processors that are powered-down are visible to the debugger but cannotbe accessed.
For Linux application debugging on big.LITTLE systems, you can establish a gdbserver connectionwithin DS-5 Debugger. Linux applications are typically unaware of whether they are running on a bigprocessor or a little processor because this is hidden by the operating system. There is therefore nodifference within the debugger when debugging a Linux application on a big.LITTLE system ascompared to application debug on any other system.
Related concepts6.6 About debugging bare-metal symmetric multiprocessing systems on page 6-144.
Related references10.6 Commands view on page 10-213.10.7 Debug Control view on page 10-216.
Related informationDS-5 Debugger commands.
6 Debugging embedded systems6.5 About debugging big.LITTLE systems
ARM DUI0446R Copyright © 2010-2014 ARM. All rights reserved. 6-143Non-Confidential

6.6 About debugging bare-metal symmetric multiprocessing systems
DS-5 Debugger supports debugging bare-metal Symmetric MultiProcessing (SMP) systems. Thedebugger expects an SMP system to meet the following requirements:
• The same ELF image running on all processors.• All processors must have identical debug hardware. For example, the number of hardware breakpoint
and watchpoint resources must be identical.• Breakpoints and watchpoints must only be set in regions where all processors have identical memory
maps, both physical and virtual. Processors with different instance of identical peripherals mapped atthe same address are considered to meet this requirement, as in the case of the private peripherals ofARM multicore processors.
Configuring and connecting
To enable SMP support in the debugger you must first configure a debug session in the DebugConfigurations dialog. Targets that support SMP debugging are identified by having SMP mentioned inthe Debug operation drop-down list.
Configuring a single SMP connection is all you require to enable SMP support in the debugger. Onconnection, you can then debug all of the SMP processors in your system by selecting them in the DebugControl view.
Image and symbol loading
When debugging an SMP system, image and symbol loading operations apply to all the SMP processors.For image loading, this means that the image code and data are written to memory once through one ofthe processors, and are assumed to be accessible through the other processors at the same addressbecause they share the same memory. For symbol loading, this means that debug information is loadedonce and is available when debugging any of the processors.
Running, stopping and stepping
When debugging an SMP system, attempting to run one processor automatically starts running all theother processors in the system. Similarly, when one processor stops (either because you requested it orbecause of an event such as a breakpoint being hit), then all processors in the system stop.
For instruction level single-stepping (stepi and nexti commands), then the currently selected processorsteps one instruction. The exception to this is when a nexti operation is required to step over a functioncall in which case the debugger sets a breakpoint and then runs all processors. All other steppingcommands affect all processors.
Depending on your system, there might be a delay between one processor running or stopping andanother processor running or stopping. This delay can be very large because the debugger must manuallyrun and stop all the processors individually.
In rare cases, one processor might stop and one or more of the others fails to stop in response. This canoccur, for example, when a processor running code in secure mode has temporarily disabled debugability. When this occurs, the Debug Control view displays the individual state of each processor(running or stopped), so that you can see which ones have failed to stop. Subsequent run and stepoperations might not operate correctly until all the processors stop.
Breakpoints, watchpoints, and signals
By default, when debugging an SMP system, breakpoint, watchpoint, and signal (vector catch)operations apply to all processors. This means that you can set one breakpoint to trigger when any of theprocessors execute code that meets the criteria. When the debugger stops due to a breakpoint,watchpoint, or signal, then the processor that causes the event is listed in the Commands view.
6 Debugging embedded systems6.6 About debugging bare-metal symmetric multiprocessing systems
ARM DUI0446R Copyright © 2010-2014 ARM. All rights reserved. 6-144Non-Confidential

Breakpoints or watchpoints can be configured for one or more processors by selecting the requiredprocessor in the relevant Properties dialog box. Alternatively, you can use the break-stop-on-corescommand. This feature is not available for signals.
Examining target state
Views of the target state, including registers, call stack, memory, disassembly, expressions, and variablescontain content that is specific to a processor.
Views such as breakpoints, signals and commands are shared by all the processors in the SMP system,and display the same contents regardless of which processor is currently selected.
Trace
When you are using a connection that enables trace support then you are able to view trace for each ofthe processors in your system. By default, the Trace view shows trace for the processor that is currentlyselected in the Debug Control view. Alternatively, you can choose to link a Trace view to a specificprocessor by using the Linked: context toolbar option for that Trace view. Creating multiple Traceviews linked to specific processors enables you to view the trace from multiple processors at the sametime. The indexes in the Trace views do not necessarily represent the same point in time for differentprocessors.
Related concepts6.5 About debugging big.LITTLE systems on page 6-143.4.1 About loading an image on to the target on page 4-102.4.2 About loading debug information into the debugger on page 4-104.
Related references4.5 Working with breakpoints and watchpoints on page 4-108.Working with data watchpoints.4.8 Setting a tracepoint on page 4-120.4.9 Setting Streamline start and stop points on page 4-121.4.6 Working with conditional breakpoints on page 4-115.4.6.1 Assigning conditions to an existing breakpoint on page 4-115.4.7 About pending breakpoints and watchpoints on page 4-119.4.10 Stepping through an application on page 4-122.10.4 Breakpoints view on page 10-206.10.6 Commands view on page 10-213.10.7 Debug Control view on page 10-216.10.8 Disassembly view on page 10-220.10.14 Memory view on page 10-236.10.15 Modules view on page 10-240.10.16 Registers view on page 10-243.10.25 Variables view on page 10-263.
Related informationDS-5 Debugger commands.
6 Debugging embedded systems6.6 About debugging bare-metal symmetric multiprocessing systems
ARM DUI0446R Copyright © 2010-2014 ARM. All rights reserved. 6-145Non-Confidential

6.7 About debugging multi-threaded applications
The debugger tracks the current thread using the debugger variable, $thread. You can use this variablein print commands or in expressions. Threads are displayed in the Debug Control view with a unique IDthat is used by the debugger and a unique ID from the Operating System (OS) :
Thread 1086 #1 stopped (PID 1086)
where #1 is the unique ID used by the debugger and PID 1086 is the ID from the OS.
A separate call stack is maintained for each thread and the selected stack frame is shown in bold text. Allthe views in the DS-5 Debug perspective are associated with the selected stack frame and are updatedwhen you select another frame.
Figure 6-1 Threading call stacks in the Debug Control view
Related references10.4 Breakpoints view on page 10-206.10.6 Commands view on page 10-213.10.7 Debug Control view on page 10-216.10.8 Disassembly view on page 10-220.10.14 Memory view on page 10-236.10.15 Modules view on page 10-240.10.16 Registers view on page 10-243.10.25 Variables view on page 10-263.
6 Debugging embedded systems6.7 About debugging multi-threaded applications
ARM DUI0446R Copyright © 2010-2014 ARM. All rights reserved. 6-146Non-Confidential

6.8 About debugging shared libraries
Shared libraries enable parts of your application to be dynamically loaded at runtime. You must ensurethat the shared libraries on your target are the same as those on your host. The code layout must beidentical, but the shared libraries on your target do not require debug information.
You can set standard execution breakpoints in a shared library but not until it is loaded by the applicationand the debug information is loaded into the debugger. Pending breakpoints however, enable you to setexecution breakpoints in a shared library before it is loaded by the application.
When a new shared library is loaded the debugger re-evaluates all pending breakpoints, and those withaddresses that it can resolve are set as standard execution breakpoints. Unresolved addresses remain aspending breakpoints.
The debugger automatically changes any breakpoints in a shared library to a pending breakpoint whenthe library is unloaded by your application.
You can load shared libraries in the Debug Configurations dialog box. If you have one library file thenyou can use the Load symbols from file option in the Files tab.
Figure 6-2 Adding individual shared library files
Alternatively if you have multiple library files then it is probably more efficient to modify the searchpaths in use by the debugger when searching for shared libraries. To do this you can use the Sharedlibrary search directory option in the Paths panel of the Debugger tab.
6 Debugging embedded systems6.8 About debugging shared libraries
ARM DUI0446R Copyright © 2010-2014 ARM. All rights reserved. 6-147Non-Confidential

Figure 6-3 Modifying the shared library search paths
For more information on the options in the Debug Configurations dialog box, use the dynamic help.
Related references4.10 Stepping through an application on page 4-122.5.1 Examining the target execution environment on page 5-131.5.2 Examining the call stack on page 5-133.4.11 Handling Unix signals on page 4-124.4.12 Handling processor exceptions on page 4-126.10.4 Breakpoints view on page 10-206.10.6 Commands view on page 10-213.10.7 Debug Control view on page 10-216.10.8 Disassembly view on page 10-220.10.14 Memory view on page 10-236.10.15 Modules view on page 10-240.10.16 Registers view on page 10-243.10.25 Variables view on page 10-263.
6 Debugging embedded systems6.8 About debugging shared libraries
ARM DUI0446R Copyright © 2010-2014 ARM. All rights reserved. 6-148Non-Confidential

6.9 About debugging a Linux kernel
DS-5 supports source level debugging of a Linux kernel. The Linux kernel (and associated devicedrivers) can be debugged in the same way as a standard ELF format executable. For example, you can setbreakpoints in the kernel code, step through the source, inspect the call stack, and watch variables.
Note
User space parameters (marked __user) that are not currently mapped in cannot be read by the debugger.
To debug the kernel:
1. Compile the kernel source using the following options:
• CONFIG_DEBUG_KERNEL=y
• CONFIG_DEBUG_INFO=y
• Other options might be required depending on the type of debugging you want to perform.
Compiling the kernel source generates a Linux kernel image and symbol files containing debuginformation.
Note
Be aware that a Linux kernel is always compiled with full optimizations and inlining enabled,therefore:
• stepping through code might not work as expected due to the possible reordering of someinstructions
• some variables might be optimized out by the compiler and therefore not be available for thedebugger.
2. Load the Linux kernel on to the target3. Load kernel debug information into the debugger4. Debug the kernel as required.
Related concepts6.10 About debugging Linux kernel modules on page 6-151.
Related tasks2.5 Configuring a connection to a Linux Kernel on page 2-40.
Related references4.10 Stepping through an application on page 4-122.5.1 Examining the target execution environment on page 5-131.5.2 Examining the call stack on page 5-133.4.11 Handling Unix signals on page 4-124.4.12 Handling processor exceptions on page 4-126.10.38 Debug Configurations - Files tab on page 10-285.10.39 Debug Configurations - Debugger tab on page 10-289.10.4 Breakpoints view on page 10-206.10.6 Commands view on page 10-213.10.7 Debug Control view on page 10-216.10.8 Disassembly view on page 10-220.10.14 Memory view on page 10-236.
6 Debugging embedded systems6.9 About debugging a Linux kernel
ARM DUI0446R Copyright © 2010-2014 ARM. All rights reserved. 6-149Non-Confidential

10.15 Modules view on page 10-240.10.16 Registers view on page 10-243.10.25 Variables view on page 10-263.
Related informationDebugging a loadable kernel module.
6 Debugging embedded systems6.9 About debugging a Linux kernel
ARM DUI0446R Copyright © 2010-2014 ARM. All rights reserved. 6-150Non-Confidential

6.10 About debugging Linux kernel modules
Linux kernel modules provide a way to extend the functionality of the kernel, and are typically used forthings such as device and file system drivers. Modules can either be built into the kernel or can becompiled as a loadable module and then dynamically inserted and removed from a running kernel duringdevelopment without having to frequently recompile the kernel. However, some modules must be builtinto the kernel and are not suitable for loading dynamically. An example of a built-in module is one thatis required during kernel boot and must be available prior to the root file system being mounted.
You can set source-level breakpoints in a module provided that the debug information is loaded into thedebugger. Attempts to set a breakpoint in a module before it is inserted into the kernel results in thebreakpoint being pended.
When debugging a module, you must ensure that the module on your target is the same as that on yourhost. The code layout must be identical, but the module on your target does not require debuginformation.
Built-in module
To debug a module that has been built into the kernel, the procedure is the same as for debugging thekernel itself:
1. Compile the kernel together with the module.2. Load the kernel image on to the target.3. Load the related kernel image with debug information into the debugger4. Debug the module as you would for any other kernel code.
Built-in (statically linked) modules are indistinguishable from the rest of the kernel code, so are not listedby the info os-modules command and do not appear in the Modules view.
Loadable module
The procedure for debugging a loadable kernel module is more complex. From a Linux terminal shell,you can use the insmod and rmmod commands to insert and remove a module. Debug information forboth the kernel and the loadable module must be loaded into the debugger. When you insert and removea module the debugger automatically resolves memory locations for debug information and existingbreakpoints. To do this, the debugger intercepts calls within the kernel to insert and remove modules.This introduces a small delay for each action whilst the debugger stops the kernel to interrogate variousdata structures. For more information on debugging a loadable kernel module, see the tutorial in GettingStarted with DS-5.
Note
A connection must be established and Operating System (OS) support enabled within the debuggerbefore a loadable module can be detected. OS support is automatically enabled when a Linux kernelimage is loaded into the debugger. However, you can manually control this by using the set oscommand.
Related concepts6.9 About debugging a Linux kernel on page 6-149.
Related tasks2.5 Configuring a connection to a Linux Kernel on page 2-40.
Related references4.10 Stepping through an application on page 4-122.5.1 Examining the target execution environment on page 5-131.
6 Debugging embedded systems6.10 About debugging Linux kernel modules
ARM DUI0446R Copyright © 2010-2014 ARM. All rights reserved. 6-151Non-Confidential

5.2 Examining the call stack on page 5-133.4.11 Handling Unix signals on page 4-124.4.12 Handling processor exceptions on page 4-126.10.4 Breakpoints view on page 10-206.10.6 Commands view on page 10-213.10.7 Debug Control view on page 10-216.10.8 Disassembly view on page 10-220.10.14 Memory view on page 10-236.10.15 Modules view on page 10-240.10.16 Registers view on page 10-243.10.25 Variables view on page 10-263.
Related informationDebugging a loadable kernel module.
6 Debugging embedded systems6.10 About debugging Linux kernel modules
ARM DUI0446R Copyright © 2010-2014 ARM. All rights reserved. 6-152Non-Confidential

6.11 About debugging FreeRTOS ™FreeRTOS is an open-source real-time operating system.
DS-5 Debugger provides the following support for debugging FreeRTOS:
• Supports FreeRTOS on Cortex-M cores.• View FreeRTOS tasks in the Debug Control view.• View FreeRTOS tasks and queues in the RTOS Data view.
To enable FreeRTOS support in DS-5 Debugger, in the Debug Configuration dialog, select FreeRTOS inthe OS tab. Debugger support is activated when FreeRTOS is initialized on the target device.
Note
Operating system support in the debugger is activated only when OS-specific debug symbols are loaded.Ensure that the debug symbols for the operating system are loaded before using any of the OS-specificviews and commands.
When building your FreeRTOS image, ensure that the following compiler flags are set:
• -DportREMOVE_STATIC_QUALIFIER• -DINCLUDE_xTaskGetIdleTaskHandle• -DconfigQUEUE_REGISTRY_SIZE=n (where n >= 1)
If these flags are set incorrectly, FreeRTOS support might fail to activate in DS-5 Debugger. See thedocumentation supplied with FreeRTOS to view the details of these flags.
6 Debugging embedded systems6.11 About debugging FreeRTOS ™
ARM DUI0446R Copyright © 2010-2014 ARM. All rights reserved. 6-153Non-Confidential

6.12 About debugging TrustZone enabled targets
ARM TrustZone ® is a security technology designed into some ARM processors. For example, theCortex-A class processors. It segments execution and resources such as memory and peripherals intosecure and normal worlds.
When connected to a target that supports TrustZone and where access to the secure world is permitted,then the debugger provides access to both secure and normal worlds. In this case, all addresses andaddress-related operations are specific to a single world. This means that any commands you use thatrequire an address or expression must also specify the world that they apply to. : 0x1000
Where:
N:For an address in Normal World memory.
S:For an address in Secure World memory.
If you want to specify an address in the current world, then you can omit the prefix.
When loading images and debug information it is important that you load them into the correct world.The debug launcher panel does not provide a way to directly specify an address world for images anddebug information, so to achieve this you must use scripting commands instead. The Debugger tab in thedebugger launcher panel provides an option to run a debug initialization script or a set of arbitrarydebugger commands on connection. Here are some example commands:
• Load image only to normal world (applying zero offset to addresses in the image)
load myimage.axf N:0
• Load debug information only to secure world (applying zero offset to addresses in the debuginformation)
file myimage.axf S:0
• Load image and debug information to secure world (applying zero offset to addresses)
loadfile myimage.axf S:0
When an operation such as loading debug symbols or setting a breakpoint needs to apply to both normaland secure worlds then you must perform the operation twice, once for the normal world and once for thesecure world.
Registers such as $PC have no world. To access the content of memory from an address in a register thatis not in the current world, you can use an expression, N:0+$PC. This is generally not necessary forexpressions involving debug information, because these are associated with a world when they areloaded.
Related references10.4 Breakpoints view on page 10-206.10.6 Commands view on page 10-213.10.7 Debug Control view on page 10-216.10.8 Disassembly view on page 10-220.10.14 Memory view on page 10-236.10.15 Modules view on page 10-240.10.16 Registers view on page 10-243.10.25 Variables view on page 10-263.
Related informationDS-5 Debugger commands.
6 Debugging embedded systems6.12 About debugging TrustZone enabled targets
ARM DUI0446R Copyright © 2010-2014 ARM. All rights reserved. 6-154Non-Confidential

ARM Security Technology Building a Secure System using TrustZone Technology.Technical Reference Manual.Architecture Reference Manual.
6 Debugging embedded systems6.12 About debugging TrustZone enabled targets
ARM DUI0446R Copyright © 2010-2014 ARM. All rights reserved. 6-155Non-Confidential

6.13 About debugging a Unified Extensible Firmware Interface (UEFI)UEFI defines a software interface to control the start-up of complex microprocessor systems. UEFI onARM allows you to control the booting of ARM-based servers and client computing devices.
DS-5 provides a complete UEFI development environment which enables you to:
• Fetch the UEFI source code via the Eclipse Git plug-in (available as a separate download from theEclipse website).
• Build the source code using the ARM Compiler.• Download the executables to a software model (a Cortex-A9x4 FVP is provided with DS-5) or to a
hardware target (available separately).• Run/debug the code using the DS-5 Debugger.• Debug dynamically loaded modules at source-level using Jython scripts.
To download the UEFI source code and Jython scripts, search for "SourceForge.net: ArmPlatformPkg/ArmVExpressPkg" in your preferred search engine.
For more information, see this blog: UEFI Debug Made Easy
6 Debugging embedded systems6.13 About debugging a Unified Extensible Firmware Interface (UEFI)
ARM DUI0446R Copyright © 2010-2014 ARM. All rights reserved. 6-156Non-Confidential

6.14 About application rewindApplication rewind is a DS-5 Debugger feature that allows you to debug backwards as well as forwardsthrough the execution of Linux and Android applications.
Note
The application rewind feature in DS-5 Debugger is license managed. Contact your supportrepresentative for details about this feature.
Debugging backwards is useful to help track down how an application reached a particular state, withouthaving to repeatedly rerun your application from the beginning. Using this feature, you can both run andstep, including hitting breakpoints and watchpoints. You can also view the contents of recorded memory,registers, and variables at any point in your application's execution.
Note
• Application rewind does not follow forked processes.• When debugging backwards, you can only view the contents of recorded memory, registers, or
variables. You cannot edit or change them.• Application rewind supports architecture ARMv5TE targets and later, except for the 64-bit ARMv8
architecture.
Application rewind uses a custom debug agent that records the execution of your application as it runs.This custom debug agent implements a buffer on the target to store history for recorded executions. Thedefault is a straight buffer, which records events until the buffer limit is reached, and then stops theexecution. At this point, you can either increase the size of the buffer or change the buffer to be circular.When using a circular buffer, once the limit of a circular buffer is reached, instead of stopping execution,the data wraps around and overwrites old content. A circular buffer ensures that execution does not stopwhen the buffer limit is reached, but you lose the execution history beyond the point where data wrappedaround.
• To change buffer limits, use the command set debug-agent history-buffer-size "size"Where size specifies the amount of memory. You can specify the value in kilobytes (K), megabytes(M), or gigabytes (G).
For example, set debug-agent history-buffer-size "256.00 M"
• To change buffer type, use the command set debug-agent history-buffer-type "type" Wheretype specifies the type of buffer, which is either straight or circular.
For example, set debug-agent history-buffer-type "circular"
Note
Debugging your application using application rewind results in increased memory consumption on yourtarget and might slow down your application. The exact impact is dependent on the behavior of yourapplication. Applications that perform large amounts of I/O are likely to experience increased memoryconsumption during the recording process.
Related tasks2.6.1 Connecting to an existing application and application rewind session on page 2-42.2.6.2 Downloading your application and application rewind server on the target system on page 2-44.2.6.3 Starting the application rewind server and debugging the target-resident application on page 2-45.2.7.1 Attaching to a running Android application on page 2-47.2.7.2 Downloading and debugging an Android application on page 2-48.
6 Debugging embedded systems6.14 About application rewind
ARM DUI0446R Copyright © 2010-2014 ARM. All rights reserved. 6-157Non-Confidential

Related references2.1 Types of target connections on page 2-33.
6 Debugging embedded systems6.14 About application rewind
ARM DUI0446R Copyright © 2010-2014 ARM. All rights reserved. 6-158Non-Confidential

6.15 About debugging ThreadXThreadX is a real-time operating system from Express Logic, Inc.
DS-5 Debugger provides the following ThreadX RTOS visibility:
• Comprehensive thread list with thread status and objects on which the threads are blocked/suspended.• All major ThreadX objects including semaphores, mutexes, memory pools, message queues, event
flags, and timers.• Stack usage for individual threads.• Call frames and local variables for all threads.
To enable ThreadX support in DS-5 Debugger, in the Debug Configuration dialog, select ThreadX inthe OS Awareness tab. ThreadX OS awareness is activated when ThreadX is initialized on the targetdevice.
6 Debugging embedded systems6.15 About debugging ThreadX
ARM DUI0446R Copyright © 2010-2014 ARM. All rights reserved. 6-159Non-Confidential

6.16 About DTSL (Debug and Trace Service Layer)DTSL (Debug and Trace Service Layer) is a software layer within the DS-5 Debugger stack.
DTSL is implemented as a set of Java classes which are typically implemented (and possibly extended)by Jython scripts. A typical DTSL instance is a combination of Java and Jython.
Note
DTSL Jython Scripting should not be confused with DS-5 Debugger Jython Scripting. They both useJython but operate at different levels within the software stack. It is however possible for a debuggerJython Script to use DTSL functionality.
DTSL takes responsibility for:
• Low level debugger component creation and configuration. For example, CoreSight componentconfiguration (and sometimes live re-configuration).
• Target access and debug control.• Capture and control of trace data - both in-target trace capture components, like ETB and any off-
target trace capture device, like DSTREAM.• Delivery of trace streams to the debugger or other 3rd party trace consumers.
ARM has made DTSL available for your own use so that you can create programs (Java or Jython) toaccess/control the target platform.
For details, see the DTSL documents and files provided with DS-5 here:
<DS-5 Install folder>\sw\DTSL
6 Debugging embedded systems6.16 About DTSL (Debug and Trace Service Layer)
ARM DUI0446R Copyright © 2010-2014 ARM. All rights reserved. 6-160Non-Confidential

6.17 About CoreSight™ Target Access LibraryCoreSight on-target access library allows you to interact directly with CoreSight devices. This supportsuse-cases such as enabling flight-recorder trace in a production system without the need to connect anexternal debugger.
The library offers a flexible programming interface allowing a variety of use cases and experimentation.
It also offers some advantages compared to a register-level interface. For example, it can:
• Manage any unlocking and locking of CoreSight devices via the lock register, OS Lock register,programming bit, power-down bit.
• Attempt to ensure that the devices are programmed correctly and in a suitable sequence.• Handle variations between devices, and where necessary, work around known issues. For example,
between variants of ETM/PTMs.• Become aware of the trace bus topology and will generally manage trace links automatically. For
example enabling only funnel ports in use• Manage “claim bits” that coordinate internal and external use of CoreSight devices.
For details, see the CoreSight example provided with DS-5 here:
<installdir>/examples/CoreSight_Access_Library.zip
6 Debugging embedded systems6.17 About CoreSight™ Target Access Library
ARM DUI0446R Copyright © 2010-2014 ARM. All rights reserved. 6-161Non-Confidential

6.18 About debugging cachesDS-5 Debugger allows you to view contents of caches in your system. For example, L1 cache or TLBcache.
You can either view information about the caches in the Cache Data view or by using the cache listand cache print commands in the Commands view.
Figure 6-4 Cache Data view (showing L1 TLB cache)
Note
Cache awareness is dependent on the exact device and connection method.
By default, the cache is read on demand by the debugger. You can use the Enable reading of CacheRAMs on stop option in the DTSL Configuration Editor dialog to control when cache RAMs are read. Ifthis option is selected, then the cache RAMs are read every time the target stops.
Note
When using the default option, the information presented might be less accurate due to debuggerinteractions with the target. For the most accurate results, select the Enable reading of Cache RAMs onstop option in the DTSL Configuration Editor dialog.
6 Debugging embedded systems6.18 About debugging caches
ARM DUI0446R Copyright © 2010-2014 ARM. All rights reserved. 6-162Non-Confidential

Figure 6-5 DTSL Configuration Editor (Shown with cache read option enabled)
You can either enable the options prior to connecting to the target from the Debug Configurations dialog,or after connecting from the Debug Control view context menu.
Note
On some devices, reading cache data can be very slow. To avoid issues, do not enable DTSL optionswhich are not required. Also, if not required, close any cache views in the user interface.
6 Debugging embedded systems6.18 About debugging caches
ARM DUI0446R Copyright © 2010-2014 ARM. All rights reserved. 6-163Non-Confidential

Related references10.18 Cache Data view on page 10-247.10.43 DTSL Configuration Editor dialog box on page 10-297.
Related informationDS-5 Debugger cache commands.
6 Debugging embedded systems6.18 About debugging caches
ARM DUI0446R Copyright © 2010-2014 ARM. All rights reserved. 6-164Non-Confidential

Chapter 7Controlling runtime messages
Describes semihosting and how to control runtime messages.It contains the following sections:
• 7.1 About semihosting and top of memory on page 7-166.• 7.2 Working with semihosting on page 7-168.• 7.3 Enabling automatic semihosting support in the debugger on page 7-169.• 7.4 Controlling semihosting messages using the command-line console on page 7-170.• 7.5 Controlling the output of logging messages on page 7-171.• 7.6 About Log4j configuration files on page 7-172.• 7.7 Customizing the output of logging messages from the debugger on page 7-173.
ARM DUI0446R Copyright © 2010-2014 ARM. All rights reserved. 7-165Non-Confidential

7.1 About semihosting and top of memorySemihosting is typically used when debugging an application that is using the C library and runningwithout an operating system. This enables functions in the C library, such as printf() and scanf(), touse the screen and keyboard on the host workstation instead of having a screen and keyboard on thetarget system.
Semihosting uses stack base and heap base addresses to determine the location and size of the stack andheap. The stack base, also known as the top of memory, is an address that is by default 64K from the endof the heap base. The heap base is by default contiguous to the application code.
The following figure shows a typical layout for an ARM target.
Stack
Heap
ZI data
RW data
Application code(RO +RW)
End of application
Application base
Heap base
Heap limit
0xFFFFFFFFStack base
(Top of memory)
0x00000000
Figure 7-1 Typical layout between top of memory, stack, and heap
Semihosting implementation
DS-5 supports semihosting for both AArch64 and AArch32 states on software models and real targethardware. DS-5 Debugger handles semihosting by intercepting HLT 0xF000 in AArch64, or SVCinstructions in AArch32 (either SVC 0x123456 in ARM state or SVC 0xAB in Thumb state).
• For AArch64 code running on real target hardware, the target halts on the HLT instruction and thedebugger handles the semihosting automatically.
• For AArch32 code running on real target hardware or when using a software model in eitherAArch32 or AArch64 states, you must explicitly set a semihosting trap. Otherwise the debuggerreports this error: ERROR(TAB180): The semihosting breakpoint address has not beenspecified.This error is reported when the debugger tries to enable semihosting, either when animage is loaded that contains the special symbols __auto_semihosting or__semihosting_library_function, or if you explicitly try to enable semihosting using setsemihosting enabled on.
You can set a semihosting trap in the debugger by executing the CLI command: set semihostingvector <trap_address>
7 Controlling runtime messages7.1 About semihosting and top of memory
ARM DUI0446R Copyright © 2010-2014 ARM. All rights reserved. 7-166Non-Confidential

This instructs the debugger to set a breakpoint at this address, and when this breakpoint is hit, thedebugger takes control to perform the semihosting operation.
How execution gets to this address from the HLT (AArch64) or SVC (AArch32) semihosting instructiondepends on the program used, the exception level (EL) the program is executing at, how exceptions areset up to propagate, and similar settings.
It is your responsibility to ensure that execution reaches this address. This is typically done by setting thesemihosting vector address to an appropriate offset in the appropriate vector table, or by creating anexplicit entry in the vector table that, perhaps conditionally, branches to a known offset.
In a mixed AArch64 and AArch32 system, with semihosting used in both execution states, you mustarrange for the trapping to occur at a single AArch64 trap address. The AArch64 trap address must be atan exception level that is higher than the AArch32 semihosting calling code because exceptions can onlybe taken from AArch32 to a higher exception level running in AArch64.
Note
The AArch64 semihosting calling code must be at the same or lower exception level than the AArch64trap address. For example, EL3 AArch64 startup code that switches to EL2 AArch64 then starts anAArch32 application at EL1 could all make use of a semihosting trap in EL3 AArch64.
Related references4.3 About passing arguments to main() on page 4-106.7.2 Working with semihosting on page 7-168.7.3 Enabling automatic semihosting support in the debugger on page 7-169.7.4 Controlling semihosting messages using the command-line console on page 7-170.10.41 Debug Configurations - Arguments tab on page 10-293.10.1 App Console view on page 10-200.
Related informationDS-5 Debugger commands.
7 Controlling runtime messages7.1 About semihosting and top of memory
ARM DUI0446R Copyright © 2010-2014 ARM. All rights reserved. 7-167Non-Confidential

7.2 Working with semihostingGives an overview of semihosting support in the debugger.
Semihosting is supported by the debugger in both the command-line console and in Eclipse.
Command-line consoleBy default all semihosting messages (stdout and stderr) are output to the console. When usingthis console interactively with debugger commands you must use the stdin command to sendinput messages (stdin) to the application.
Alternatively, you can disable semihosting in the console and use a separate telnet session tointeract directly with the application. During start up, the debugger creates a semihosting serversocket and displays the port number to use for the telnet session.
EclipseThe App Console view within the DS-5 Debug perspective controls all the semihosting input/output requests (stdin, stdout, and stderr) between the application code and the debugger.
Related references4.3 About passing arguments to main() on page 4-106.7.1 About semihosting and top of memory on page 7-166.7.3 Enabling automatic semihosting support in the debugger on page 7-169.7.4 Controlling semihosting messages using the command-line console on page 7-170.10.41 Debug Configurations - Arguments tab on page 10-293.10.1 App Console view on page 10-200.
Related informationDS-5 Debugger commands.
7 Controlling runtime messages7.2 Working with semihosting
ARM DUI0446R Copyright © 2010-2014 ARM. All rights reserved. 7-168Non-Confidential

7.3 Enabling automatic semihosting support in the debuggerDescribes how create an ELF symbol to enable semihosting support in the debugger.
By default, semihosting support is disabled in the debugger. However, the debugger can automaticallyenable semihosting on supported targets when you load debug information that contains the ELF symbol__auto_semihosting.
In C code you can easily create the ELF symbol by defining a function with the name__auto_semihosting. To prevent this function generating any additional code or data in your image youcan define it as an alias of another function. This places the required ELF symbol in the debuginformation but does not affect the code and data in the application image.
Note
Creating a special semihosting ELF symbol is not required if you build your application image usingARM Compiler 5.0 and later. The linker automatically adds this symbol if required.
Create a special semihosting ELF symbol with an alias to main()
#include <stdio.h>void __auto_semihosting(void) __attribute__((alias("main"))); //mark as alias for main() to declare //semihosting ELF symbol in debug information onlyint main(void){ printf("Hello world\n"); return 0;}
Related references4.3 About passing arguments to main() on page 4-106.7.1 About semihosting and top of memory on page 7-166.7.2 Working with semihosting on page 7-168.7.4 Controlling semihosting messages using the command-line console on page 7-170.10.41 Debug Configurations - Arguments tab on page 10-293.10.1 App Console view on page 10-200.
Related informationDS-5 Debugger commands.
7 Controlling runtime messages7.3 Enabling automatic semihosting support in the debugger
ARM DUI0446R Copyright © 2010-2014 ARM. All rights reserved. 7-169Non-Confidential

7.4 Controlling semihosting messages using the command-line consoleDescribes the debugger commands you can use to control semihosting messages.
You can control input/output requests from application code to a host workstation running the debugger.These are called semihosting messages.
By default, all messages are output to the command-line console but you can choose to redirect themwhen launching the debugger by using one or more of the following:
--disable_semihostingDisables all semihosting operations.
--disable_semihosting_consoleDisables all semihosting operations to the debugger console.
--semihosting_error=filenameSpecifies a file to write stderr for semihosting operations.
--semihosting_input=filenameSpecifies a file to read stdin for semihosting operations.
--semihosting_output=filenameSpecifies a file to write stdout for semihosting operations.
Related references4.3 About passing arguments to main() on page 4-106.7.1 About semihosting and top of memory on page 7-166.7.2 Working with semihosting on page 7-168.7.3 Enabling automatic semihosting support in the debugger on page 7-169.10.41 Debug Configurations - Arguments tab on page 10-293.10.1 App Console view on page 10-200.
Related informationDS-5 Debugger commands.
7 Controlling runtime messages7.4 Controlling semihosting messages using the command-line console
ARM DUI0446R Copyright © 2010-2014 ARM. All rights reserved. 7-170Non-Confidential

7.5 Controlling the output of logging messagesDescribes the debugger commands you can use to control logging messages.
You can control logging messages from the debugger. By default, all messages are output to the AppConsole view but you can control the output and redirection of logging messages by using the logconfig and log file debugger commands:
log config=optionSpecifies the type of logging configuration to output runtime messages from the debugger:
Where:
optionSpecifies a predefined logging configuration or a user-defined logging configurationfile:info
Output messages using the predefined INFO level configuration. This is thedefault.
debugOutput messages using the predefined DEBUG level configuration.
filenameSpecifies a user-defined logging configuration file to customize the output ofmessages. The debugger supports log4j configuration files.
log file=filenameOutput messages to a file in addition to the console.
Related concepts7.6 About Log4j configuration files on page 7-172.
Related tasks7.7 Customizing the output of logging messages from the debugger on page 7-173.
Related informationLog4j in Apache Logging Services.
7 Controlling runtime messages7.5 Controlling the output of logging messages
ARM DUI0446R Copyright © 2010-2014 ARM. All rights reserved. 7-171Non-Confidential

7.6 About Log4j configuration filesLists the log4j logging levels you can use to control messages.
In general, the predefined logging configurations provided by the debugger are sufficient for mostdebugging tasks. However, if you want finer control then you can specify your own customized loggingconfiguration by creating a log4j configuration file. Log4j is an open source logging system for the Javaplatform and the debugger currently uses version 1.2.
Log4j uses a hierarchy of logging levels to control messages with each level inheriting all lower levels.The following logging levels are currently supported by the debugger:
• DEBUG• INFO• WARN• ERROR• FATAL
Messages are assigned to a specific logging level and can be redirected to different output locations usingone or more of the following log4j components:
Table 7-1 Log4j Components
Component Description
Logger Defines the level of logging.
Appender Defines the output destination.
Layout Defines the message format.
Related tasks7.7 Customizing the output of logging messages from the debugger on page 7-173.
Related references7.5 Controlling the output of logging messages on page 7-171.
Related informationLog4j in Apache Logging Services.
7 Controlling runtime messages7.6 About Log4j configuration files
ARM DUI0446R Copyright © 2010-2014 ARM. All rights reserved. 7-172Non-Confidential

7.7 Customizing the output of logging messages from the debuggerDescribes how to create a customized log4j configuration file.
Procedure
1. Create an Appender instance for the required logging type. The following types are supported:
• ConsoleAppender
• RollingFileAppender.2. Suppress the Threshold logging level, if required.3. If the Appender instance outputs to a file, define the layout for the Appender instance. The following
layouts are supported:PatternLayout
Textual format.HTMLLayout
HTML format.4. If the Appender instance outputs to a file, define the file components. The following components are
supported:File
File nameMaxFileSize
Long integer or string, 10KB.MaxBackupIndex
Maximum number of log files to use. The default is 1.5. If you use the layout PatternLayout, you can enhance the format of a message by using an
additional ConversionPattern component. The following patterns are supported:%c
Logging category%C
Class name%d
Date%F
Filename%l
Caller location%L
Line number%m
Logging message%M
Method name%n
End of line character%p
Logging level. For alignment, you can also supply the number of characters, for example:%-5p.
%rElapsed time (milliseconds)
%tThread name.
6. Define the name component for the Appender instance, if required.7. Define the logging level for the rootLogger and assign to the required Appender instance.
7 Controlling runtime messages7.7 Customizing the output of logging messages from the debugger
ARM DUI0446R Copyright © 2010-2014 ARM. All rights reserved. 7-173Non-Confidential

8. To pass the log4j configuration file to the debugger you can use:
• --log_config=filename command-line option when launching the debugger from thecommand-line console.
• log config filename debugger command if the debugger is already running.
Example showing how to log messages to the console
Example showing how to log messages to a file
Example showing how to combine the logging of messages to the console and a file
The following example shows how to log messages to the console. This sets the default logging level toDEBUG. All the logging for this example is output to the console. However the output of error andwarning messages are sent to the error stream, and debug and info messages are sent to the outputstream.
# Setup logConsole to be a ConsoleAppenderlog4j.appender.logConsole=org.apache.log4j.ConsoleAppenderlog4j.appender.logConsole.layout=org.apache.log4j.PatternLayoutlog4j.appender.logConsole.layout.ConversionPattern=%m%nlog4j.appender.logConsole.name=Console# Send all DEBUG level logs to the consolelog4j.rootLogger=DEBUG, console
The following example shows how to log messages to a file. This sets the default logging level toDEBUG. However some packages only write logs at the INFO level. All the logging for this example isoutput to a file. When the file reaches 10MB, it is renamed by adding .1 file extension and loggingcontinues to write to a new file with the original name. This happens multiple times, but only ten backupfiles are stored.
# Setup logFile to be a RollingFileAppenderlog4j.appender.logFile=org.apache.log4j.RollingFileAppenderlog4j.appender.logFile.File=output.loglog4j.appender.logFile.MaxFileSize=10MBlog4j.appender.logFile.MaxBackupIndex=10log4j.appender.logFile.layout=org.apache.log4j.PatternLayoutlog4j.appender.logFile.layout.ConversionPattern=%d %-5p %t %c - %m%n# Send all DEBUG level logs to a file: logFilelog4j.rootLogger=DEBUG, logFile# Send all INFO level logs in the debug packages to the file: logFilelog4j.logger.com.arm.debug.logging=INFO, logFile
The following example shows a combination of the previous examples. This sets the default logginglevel to INFO. All the INFO level logging for this example is output to the console. However, a selectionof messages are also sending output to two files.
# Setup logConsole to be a ConsoleAppenderlog4j.appender.logConsole=org.apache.log4j.ConsoleAppender# Suppress all logs to the console that are lower than the thresholdlog4j.appender.logConsole.Threshold=INFOlog4j.appender.logConsole.layout=org.apache.log4j.PatternLayoutlog4j.appender.logConsole.layout.ConversionPattern=%m%nlog4j.appender.logConsole.name=Console# Setup logConnFile to be a RollingFileAppenderlog4j.appender.logConnFile=org.apache.log4j.RollingFileAppender# Suppress all logs to the file that are lower than the thresholdlog4j.appender.logConnFile.Threshold.DEBUGlog4j.appender.logConnFile.File=connection.loglog4j.appender.logConnFile.MaxFileSize=10MBlog4j.appender.logConnFile.MaxBackupIndex=10log4j.appender.logConnFile.layout=org.apache.log4j.PatternLayoutlog4j.appender.logConnFile.layout.ConversionPattern=%d %-5p %t %c - %m%n# Setup logTAccessFile to be a RollingFileAppenderlog4j.appender.logTAccessFile=org.apache.log4j.RollingFileAppender# Suppress all logs to the file that are lower than the thresholdlog4j.appender.logTAccessFile.Threshold.DEBUGlog4j.appender.logTAccessFile.File=target_acccess.loglog4j.appender.logTAccessFile.MaxFileSize=10MBlog4j.appender.logTAccessFile.MaxBackupIndex=10log4j.appender.logTAccessFile.layout=org.apache.log4j.PatternLayout
7 Controlling runtime messages7.7 Customizing the output of logging messages from the debugger
ARM DUI0446R Copyright © 2010-2014 ARM. All rights reserved. 7-174Non-Confidential

log4j.appender.logTAccessFile.layout.ConversionPattern=%d %-5p %t %c - %m%n# Send all INFO logs to the consolelog4j.rootLogger=INFO, logConsole# Send all DEBUG logs in the connection package to the file: logConnFilelog4j.logger.com.arm.debug.core.engine.connection=DEBUG, logConnFile# Send all DEBUG logs in the targetaccess package to the file: logTAccessFilelog4j.logger.com.arm.debug.core.targetaccess.rvi=DEBUG, logTAccessFile
Related concepts7.6 About Log4j configuration files on page 7-172.
Related references7.5 Controlling the output of logging messages on page 7-171.
Related informationLog4j in Apache Logging Services.
7 Controlling runtime messages7.7 Customizing the output of logging messages from the debugger
ARM DUI0446R Copyright © 2010-2014 ARM. All rights reserved. 7-175Non-Confidential
Chapter 8Debugging with scripts
Describes how to use scripts containing debugger commands to enable you to automate debuggingoperations.It contains the following sections:
• 8.1 Exporting DS-5 Debugger commands generated during a debug session on page 8-177.• 8.2 Creating a DS-5 Debugger script on page 8-178.• 8.3 Creating a CMM-style script on page 8-179.• 8.4 About Jython scripts on page 8-180.• 8.5 Jython script concepts and interfaces on page 8-182.• 8.6 Creating Jython projects in Eclipse for DS-5™ on page 8-183.• 8.7 Creating a Jython script on page 8-186.• 8.8 Running a script on page 8-188.
ARM DUI0446R Copyright © 2010-2014 ARM. All rights reserved. 8-176Non-Confidential

8.1 Exporting DS-5 Debugger commands generated during a debug sessionShows a typical example of the commands generated by the debugger during a debug sessions.
You can work through a debug session using all the toolbar icons and menu options as required. A fulllist of all the DS-5 Debugger commands generated during the current debug session is recorded in theHistory view. Before closing Eclipse, you can select the commands that you want in your script file andclick on Export the selected lines as a script file to save them to a file.
Figure 8-1 Commands generated during a debug session
8 Debugging with scripts8.1 Exporting DS-5 Debugger commands generated during a debug session
ARM DUI0446R Copyright © 2010-2014 ARM. All rights reserved. 8-177Non-Confidential

8.2 Creating a DS-5 Debugger scriptShows a typical example of a DS-5 Debugger script.
The script file must contain only one command on each line. Each command can be identified withcomments if required. The .ds file extension must be used to identify this type of script.
# Filename: myScript.ds# Initialization commandsload "struct_array.axf" # Load imagefile "struct_array.axf" # Load symbolsbreak main # Set breakpoint at main()break *0x814C # Set breakpoint at address 0x814C# Run to breakpoint and print required valuesrun # Start running devicewait 0.5s # Wait or time-out after half a secondinfo stack # Display call stackinfo registers # Display info for all registers# Continue to next breakpoint and print required valuescontinue # Continue running devicewait 0.5s # Wait or time-out after half a secondinfo functions # Displays info for all functionsinfo registers # Display info for all registersx/3wx 0x8000 # Display 3 words of memory from 0x8000 (hex)...# Shutdown commandsdelete 1 # Delete breakpoint assigned number 1delete 2 # Delete breakpoint assigned number 2
8 Debugging with scripts8.2 Creating a DS-5 Debugger script
ARM DUI0446R Copyright © 2010-2014 ARM. All rights reserved. 8-178Non-Confidential

8.3 Creating a CMM-style scriptShows a typical example of a CMM-style script.
The script file must contain only one command on each line. Each command can be identified withcomments if required. The .cmm or .t32 file extension must be used to identify this type of script.
// Filename: myScript.cmmsystem.up ; Connect to target and devicedata.load.elf "hello.axf" ; Load image and symbols// Setup breakpoints and registersbreak.set main /disable ; Set breakpoint and immediately disabledbreak.set 0x8048 ; Set breakpoint at specified addressbreak.set 0x8060 ; Set breakpoint at specified addressregister.set R0 15 ; Set register R0register.set PC main ; Set PC register to symbol address...break.enable main ; Enable breakpoint at specified symbol// Run to breakpoint and display required valuesgo ; Start running devicevar.print "Value is: " myVar ; Display string and variable valueprint %h r(R0) ; Display register R0 in hexadecimal// Run to breakpoint and print stackgo ; Run to next breakpointvar.frame /locals /caller ; Display all variables and function callers...// Shutdown commandsbreak.delete main ; Delete breakpoint at address of main()break.delete 0x8048 ; Delete breakpoint at addressbreak.delete 0x8060 ; Delete breakpoint at specified addresssystem.down ; Disconnect from target
8 Debugging with scripts8.3 Creating a CMM-style script
ARM DUI0446R Copyright © 2010-2014 ARM. All rights reserved. 8-179Non-Confidential

8.4 About Jython scriptsShows a typical example of a Jython script.
Jython is a Java implementation of the Python scripting language. It provides extensive support for datatypes, conditional execution, loops and organization of code into functions, classes and modules, as wellas access to the standard Jython libraries. Jython is an ideal choice for larger or more complex scripts.These are important concepts that are required in order to write a debugger Jython script.
The .py file extension must be used to identify this type of script.
# Filename: myScript.pyimport sysfrom arm_ds.debugger_v1 import Debuggerfrom arm_ds.debugger_v1 import DebugException# Debugger object for accessing the debuggerdebugger = Debugger()# Initialisation commandsec = debugger.getCurrentExecutionContext()ec.getExecutionService().stop()ec.getExecutionService().waitForStop()# in case the execution context reference is out of dateec = debugger.getCurrentExecutionContext()# load image if provided in script argumentsif len(sys.argv) == 2: image = sys.argv[1] ec.getImageService().loadImage(image) ec.getExecutionService().setExecutionAddressToEntryPoint() ec.getImageService().loadSymbols(image) # we can use all the DS commands available print "Entry point: ", print ec.executeDSCommand("print $ENTRYPOINT") # Sample output: # Entry point: $8 = 32768else: pass # assuming image and symbols are loaded# sets a temporary breakpoint at main and resumesec.getExecutionService().resumeTo("main") # this method is non-blockingtry: ec.getExecutionService().waitForStop(500) # wait for 500msexcept DebugException, e: if e.getErrorCode() == "JYI31": # code of "Wait for stop timed out" message print "Waiting timed out!" sys.exit() else: raise # re-raise the exception if it is a different errorec = debugger.getCurrentExecutionContext()def getRegisterValue(executionContext, name): """Get register value and return string with unsigned hex and signed integer, possibly string "error" if there was a problem reading the register. """ try: value = executionContext.getRegisterService().getValue(name) # the returned value behaves like a numeric type, # and even can be accessed like an array of bytes, e.g. 'print value[:]' return "%s (%d)" % (str(value), int(value)) except DebugException, e: return "error"# print Core registers on all execution contextsfor i in range(debugger.getExecutionContextCount()): ec = debugger.getExecutionContext(i) # filter register names starting with "Core::" coreRegisterNames = filter(lambda name: name.startswith("Core::"), ec.getRegisterService().getRegisterNames()) # using Jython list comprehension get values of all these registers registerInfo = ["%s = %s" % (name, getRegisterValue(ec, name)) for name in coreRegisterNames] registers = ", ".join(registerInfo[:3]) # only first three print "Identifier: %s, Registers: %s" % (ec.getIdentifier(), registers)# Output:# Identifier: 1, Registers: Core::R0 = 0x00000010 (16), Core::R1 = 0x00000000 (0), Core::R2 = 0x0000A4A4 (42148)# ...
Related tasks8.6.1 Creating a new Jython project in Eclipse for DS-5™ on page 8-183.
8 Debugging with scripts8.4 About Jython scripts
ARM DUI0446R Copyright © 2010-2014 ARM. All rights reserved. 8-180Non-Confidential

8.6.2 Configuring an existing project to use the DS-5™ Jython interpreter on page 8-184.8.7 Creating a Jython script on page 8-186.8.8 Running a script on page 8-188.
Related references8.5 Jython script concepts and interfaces on page 8-182.10.20 Scripts view on page 10-252.10.36 Jython Script Parameters dialog box on page 10-281.
8 Debugging with scripts8.4 About Jython scripts
ARM DUI0446R Copyright © 2010-2014 ARM. All rights reserved. 8-181Non-Confidential

8.5 Jython script concepts and interfacesSummary of the important debugger interfaces and concepts.
ImportsThe debugger module provides a Debugger class for initial access to the DS-5 Debugger, withfurther classes, known as services, to access registers and memory. Here is an example showingthe full set of module imports that are typically placed at the top of the jython script:
from arm_ds.debugger_v1 import Debuggerfrom arm_ds.debugger_v1 import DebugException
Execution ContextsMost operations on DS-5 Debugger Jython interfaces require an execution context. Theexecution context represents the state of the target system. Separate execution contexts exist foreach process, thread, or processor that is accessible in the debugger. You can obtain anexecution context from the Debugger class instance, for example:
# Obtain the first execution contextdebugger = Debugger()ec = debugger.getCurrentExecutionContext()
RegistersYou can access processor registers, coprocessor registers and peripheral registers using thedebugger Jython interface. To access a register you must know its name. The name can beobtained from the Registers view in the graphical debugger. The RegisterService enables you toread and write register values, for a given execution context, for example:
# Print the Program Counter (PC) from execution context ecvalue = ec.getRegisterService().getValue('PC')print 'The PC is %s' %value
MemoryYou can access memory using the debugger Jython interface. You must specify an address andthe number of bytes to access. The address and size can be an absolute numeric value or a stringcontaining an expression to be evaluated within the specified execution context. Here is anexample:
# Print 16 bytes at address 0x0 from execution context ecprint ec.getMemoryService().read(0x0, 16)
DS CommandsThe debugger jython interface enables you to execute arbitrary DS-5 commands. This is usefulwhen the required functionality is not directly provided in the Jython interface. You mustspecify the execution context, the command and any arguments that you want to execute. Thereturn value includes the textual output from the command and any errors. Here is an example:
# Execute the DS-5 command 'print $ENTRYPOINT' and print the resultprint ec.executeDSCommand('print $ENTRYPOINT')
Error HandlingThe methods on the debugger Jython interfaces throw DebugException whenever an erroroccurs. You can catch exceptions to handle errors in order to provide more information. Here isan example:
# Catch a DebugException and print the error messagetry: ec.getRegisterService().getValue('ThisRegisterDoesNotExist')except DebugException, de: print "Caught DebugException: %s" % (de.getMessage())
For more information on the DS-5 Debugger Jython API documentation select Help Contents from theHelp menu.
8 Debugging with scripts8.5 Jython script concepts and interfaces
ARM DUI0446R Copyright © 2010-2014 ARM. All rights reserved. 8-182Non-Confidential

8.6 Creating Jython projects in Eclipse for DS-5™
To work with Jython scripts in DS-5, the project must use DS-5 Jython as the interpreter. You can eithercreate a new Jython project in Eclipse for DS-5 with DS-5 Jython set as the interpreter or configure anexisting project to use DS-5 Jython as the interpreter.This section contains the following subsections:
• 8.6.1 Creating a new Jython project in Eclipse for DS-5™ on page 8-183.• 8.6.2 Configuring an existing project to use the DS-5™ Jython interpreter on page 8-184.
8.6.1 Creating a new Jython project in Eclipse for DS-5™
Use these instructions to create a new Jython project and select DS-5 Jython as the intepreter.
Procedure
1. Select File > New > Project... from the main menu.2. Expand the PyDev group.3. Select PyDev Project.
Figure 8-2 PyDev project wizard4. Click Next.5. Enter the project name and select relevant details:
a) In Project name, enter a suitable name for the project.b) In Choose the project type, select Jython.c) In Interpreter, select DS-5 Jython.
8 Debugging with scripts8.6 Creating Jython projects in Eclipse for DS-5™
ARM DUI0446R Copyright © 2010-2014 ARM. All rights reserved. 8-183Non-Confidential

Figure 8-3 PyDev project settings6. Click Finish to create the project.
Related concepts8.4 About Jython scripts on page 8-180.
Related tasks8.6.2 Configuring an existing project to use the DS-5™ Jython interpreter on page 8-184.8.7 Creating a Jython script on page 8-186.8.8 Running a script on page 8-188.
Related references8.5 Jython script concepts and interfaces on page 8-182.10.20 Scripts view on page 10-252.10.36 Jython Script Parameters dialog box on page 10-281.
8.6.2 Configuring an existing project to use the DS-5™ Jython interpreterUse these instructions to configure an existing project to use DS-5 Jython as the intepreter.
Procedure
1. In the Project Explorer view, right-click the project and select PyDev > Set as PyDev Project fromthe context menu.
2. From the Project menu, select Properties to display the properties for the selected project.
8 Debugging with scripts8.6 Creating Jython projects in Eclipse for DS-5™
ARM DUI0446R Copyright © 2010-2014 ARM. All rights reserved. 8-184Non-Confidential

Note
You can also right-click a project and select Properties to display the properties for the selectedproject.
3. In the Properties dialog box, select PyDev - Interpreter/Grammar.4. In Choose the project type, select Jython.5. In Interpreter, select DS-5 Jython.6. Click OK to apply these settings and close the dialog box.7. Add a Python source file to the project.
Note
The .py file extension must be used to identify this type of script.
Related concepts8.4 About Jython scripts on page 8-180.
Related tasks8.6.1 Creating a new Jython project in Eclipse for DS-5™ on page 8-183.8.7 Creating a Jython script on page 8-186.8.8 Running a script on page 8-188.
Related references8.5 Jython script concepts and interfaces on page 8-182.10.20 Scripts view on page 10-252.10.36 Jython Script Parameters dialog box on page 10-281.
8 Debugging with scripts8.6 Creating Jython projects in Eclipse for DS-5™
ARM DUI0446R Copyright © 2010-2014 ARM. All rights reserved. 8-185Non-Confidential

8.7 Creating a Jython scriptShows a typical workflow for creating and running a Jython script in the debugger.
Procedure
1. Create an empty Jython script file.2. Right-click the Jython script file and select Open.3. Add the following code to your file in the editor:
from arm_ds.debugger_v1 import Debuggerfrom arm_ds.debugger_v1 import DebugException
Note
With this minimal code saved in the file you have access to auto-completion list and online help.ARM recommends the use of this code to explore the Jython interface.
Figure 8-4 Jython auto-completion and help4. Edit the file to contain the desired scripting commands.5. Run the script in the debugger.
You can also view an entire Jython interface in the debugger by selecting a debugger object or interfacefollowed by the keyboard and mouse combination Ctrl+Click. This opens the source code thatimplements it.
Related concepts8.4 About Jython scripts on page 8-180.
Related tasks8.6.1 Creating a new Jython project in Eclipse for DS-5™ on page 8-183.8.6.2 Configuring an existing project to use the DS-5™ Jython interpreter on page 8-184.8.8 Running a script on page 8-188.
8 Debugging with scripts8.7 Creating a Jython script
ARM DUI0446R Copyright © 2010-2014 ARM. All rights reserved. 8-186Non-Confidential

Related references8.5 Jython script concepts and interfaces on page 8-182.10.20 Scripts view on page 10-252.10.36 Jython Script Parameters dialog box on page 10-281.
8 Debugging with scripts8.7 Creating a Jython script
ARM DUI0446R Copyright © 2010-2014 ARM. All rights reserved. 8-187Non-Confidential

8.8 Running a scriptDescribes how to run a script from Eclipse.
Procedure
To run a script from Eclipse:
• You can run a script file immediately after the debugger connects to the target.
1. Launch Eclipse.2. Configure a connection to the target. A DS-5 Debugger configuration can include the option to
run a script file immediately after the debugger connects to the target. To do this select thescript file in the Debugger tab of the DS-5 Debug configuration dialog box.
3. Connect to the target.• Run a script file whilst a debug session is in progress.
— In the Scripts view you can use script files:
1. Import one or more script files in the order that you want them to be executed.2. Select the scripts that you want to execute.3. Click on the Execute Selected Scripts toolbar icon.
Figure 8-5 Scripts view— In the Commands view you can use the DS-5 Debugger source command.
Related concepts8.4 About Jython scripts on page 8-180.
Related tasks8.6.1 Creating a new Jython project in Eclipse for DS-5™ on page 8-183.8.6.2 Configuring an existing project to use the DS-5™ Jython interpreter on page 8-184.8.7 Creating a Jython script on page 8-186.
Related references8.1 Exporting DS-5 Debugger commands generated during a debug session on page 8-177.8.2 Creating a DS-5 Debugger script on page 8-178.8.3 Creating a CMM-style script on page 8-179.10.6 Commands view on page 10-213.10.13 History view on page 10-234.10.20 Scripts view on page 10-252.
8 Debugging with scripts8.8 Running a script
ARM DUI0446R Copyright © 2010-2014 ARM. All rights reserved. 8-188Non-Confidential

8.5 Jython script concepts and interfaces on page 8-182.10.20 Scripts view on page 10-252.10.36 Jython Script Parameters dialog box on page 10-281.
Related informationDS-5 Debugger commands.
8 Debugging with scripts8.8 Running a script
ARM DUI0446R Copyright © 2010-2014 ARM. All rights reserved. 8-189Non-Confidential

Chapter 9Working with the Snapshot Viewer
This chapter describes how to work with the Snapshot Viewer.It contains the following sections:
• 9.1 About the Snapshot Viewer on page 9-191.• 9.2 Components of a Snapshot Viewer initialization file on page 9-193.• 9.3 Connecting to the Snapshot Viewer on page 9-196.• 9.4 Considerations when creating debugger scripts for the Snapshot Viewer on page 9-197.
ARM DUI0446R Copyright © 2010-2014 ARM. All rights reserved. 9-190Non-Confidential

9.1 About the Snapshot ViewerUse the Snapshot Viewer to analyze a snapshot representation of the application state of a singleprocessor in scenarios where interactive debugging is not possible.
To enable debugging of an application using the Snapshot Viewer, you must have the following data:
• Register Values.• Memory Values• Debug Symbols.
If you are unable to provide all of this data, then the level of debug that is available is compromised.Capturing this data is specific to your application, and no tools are provided to help with this. You mighthave to install exception or signal handlers to catch erroneous situations in your application and dumpthe required data out.
You must also consider how to get the dumped data from your device onto a workstation that isaccessible by the debugger. Some suggestions on how to do this are to:
• Write the data to a file on the host workstation using semihosting.• Send the data over a UART to a terminal.• Send the data over a socket using TCP/IP.
Note
Currently DS-5 only supports DS-5 Debugger connections to the Snapshot Viewer using the command-line console.
Register values
Register values are used to emulate the state of the original system at a particular point in time. The mostimportant registers are those in the current processor mode. For example, on an ARMv4 architectureprocessor these registers are R0-R15 and also the Program Status Registers (PSRs):
• Current Program Status Register (CPSR)• Application Program Status Register (APSR)• Saved Program Status Register (SPSR).
Be aware that on many ARM processors, an exception, a data abort, causes a switch to a differentprocessor mode. In this case, you must ensure that the register values you use reflect the correct mode inwhich the exception occurred, rather than the register values within your exception handler.
If your application uses floating-point data and your device contains vector floating-point hardware, thenyou must also provide the Snapshot Viewer with the contents of the vector floating-point registers. Theimportant registers to capture are:
• Floating-point Status and Control Register (FPSCR)• Floating-Point EXCeption register (FPEXC)• Single precision registers (Sn)• Double precision registers (Dn)• Quad precision registers (Qn).
Memory values
The majority of the application state is usually stored in memory in the form of global variables, the heapand the stack. Due to size constraints, it is often difficult to provide the Snapshot Viewer with a copy ofthe entire contents of memory. In this case, you must carefully consider the areas of memory that are ofparticular importance.
If you are debugging a crash, the most useful information to find out is often the call stack, because thisshows the calling sequence of each function prior to the exception and the values of all the respective
9 Working with the Snapshot Viewer9.1 About the Snapshot Viewer
ARM DUI0446R Copyright © 2010-2014 ARM. All rights reserved. 9-191Non-Confidential

function parameters. To show the call stack, the debugger must know the current stack pointer and haveaccess to the contents of the memory that contains the stack. By default, on ARM processors, the stackgrows downwards, you must provide the memory starting from the current stack pointer and going up inmemory until the beginning of the stack is reached. If you are unable to provide the entire contents of thestack, then a smaller portion starting at the current stack pointer is still useful because it provides themost recent function calls.
If your application uses global (extern or file static) data, then providing the corresponding memoryvalues enables you to view the variables within the debugger.
If you have local or global variables that point to heap data, then you might want to follow the relevantpointers in the debugger to examine the data. To do this you must have provided the contents of the heapto the Snapshot Viewer. Be aware that heaps can often occupy a large memory range, so it might not bepossible to capture the entire heap. The layout of the heap in memory and the data structures that controlheap allocation are often specific to the application or the C library, see the relevant documentation formore information.
To debug at the disassembly level, the debugger must have access to the memory values where theapplication code is located. It is often not necessary to capture the contents of the memory containing thecode, because identical data can often be extracted directly from the image using processing tools such asfromelf. However, some complications to be aware of are:
• Self-modifying code where the values in the image and memory can vary.• Dynamic relocation of the memory address within the image at runtime.
Debug symbols
The debugger require debug information to display high-level information about your application, forexample:
• Source code.• Variable values and types.• Structures.• Call stack.
This information is stored by the compiler and linker within the application image, so you must ensurethat you have a local debug copy of the same image that you are running on your device. The amount ofdebug information that is stored in the image, and therefore the resulting quality of your debug session,can be affected by the debug and optimization settings passed to the compiler and linker.
It is common to strip out as much of the debug information as possible when running an image on anembedded device. In such cases, try to use the original unstripped image for debugging purposes.
Related tasks9.3 Connecting to the Snapshot Viewer on page 9-196.
Related references9.2 Components of a Snapshot Viewer initialization file on page 9-193.9.4 Considerations when creating debugger scripts for the Snapshot Viewer on page 9-197.
9 Working with the Snapshot Viewer9.1 About the Snapshot Viewer
ARM DUI0446R Copyright © 2010-2014 ARM. All rights reserved. 9-192Non-Confidential

9.2 Components of a Snapshot Viewer initialization fileDescribes the groups and sections used to create a Snapshot Viewer initialization file.
The Snapshot Viewer initialization file is a simple text file consisting of one or more sections thatemulate the state of the original system. Each section uses an option=value structure.
Note
Currently DS-5 only supports DS-5 Debugger connections to the Snapshot Viewer using the command-line console.
Before creating a Snapshot Viewer initialization file you must ensure that you have:
• One or more binary files containing a snapshot of the application that you want to analyze.
Note
The binary files must be formatted correctly in accordance with the following restrictions.
• Details of the type of processor.• Details of the memory region addresses and offset values.• Details of the last known register values.
To create a Snapshot Viewer initialization file, you must add grouped sections as required from thefollowing list and save the file with .ini for the file extension.
[global]A section for global settings. The following option can be used:core
The selected processor, for example, core=Cortex-M3.[dump]
One or more sections for contiguous memory regions stored in a binary file. The followingoptions can be used:file
Location of the binary file.address
Memory start address for the specified region.length
Length of the region. If none specified then the default is the rest of file from the offsetvalue.
offsetOffset of the specified region from the start of the file. If none specified then the defaultis zero.
9 Working with the Snapshot Viewer9.2 Components of a Snapshot Viewer initialization file
ARM DUI0446R Copyright © 2010-2014 ARM. All rights reserved. 9-193Non-Confidential

[regs]A section for standard ARM register names and values, for example, 0x0.
Banked registers can be explicitly specified using their names from the ARM ArchitectureReference Manual, for example, R13_fiq. In addition, the current mode is determined from theProgram Status Registers (PSRs), enabling register names without mode suffixes to be identifiedwith the appropriate banked registers.
The values of the PSRs and PC registers must always be provided. The values of other registersare only required if it is intended to read them from the debugger.
Consider:
[regs]CPSR=0x600000D2 ; IRQSP=0x8000R14_irq=0x1234
Reading the registers named SP, R13, or R13_irq all yield the value 0x8000.
Reading the registers named LR, R14, or R14_irq all yield the value 0x1234.
Note
All registers are 32-bits.
Restrictions
The following restrictions apply:
• If you require a global section then it must be the first in the file.• Consecutive bytes of memory must appear as consecutive bytes in one or more dump files.• Address ranges representing memory regions must not overlap.
Examples
; All sections are optional[global]core=Cortex-M3 ; Selected processor; Location of a contiguous memory region stored in a dump file[dump]file="path/dumpfile1.bin" ; File location (full path must be specified)address=0x8000 ; Memory start address for specific regionlength=0x0090 ; Length of region ; (optional, default is rest of file from offset); Location of another contiguous memory region stored in a dump file[dump]file="path/dumpfile2.bin" ; File locationaddress=0x8090 ; Memory start address for specific regionoffset=0x0024 ; Offset of region from start of file ; (optional, default is 0); ARM registers[regs]R0=0x000080C8R1=0x0007C000R2=0x0007C000R3=0x0007C000R4=0x00000363R5=0x00008EECR6=0x00000000R7=0x00000000R8=0x00000000R9=0xB3532737R10=0x00008DE8R11=0x00000000R12=0x00000000SP=0x0007FFF8LR=0x0000808DPC=0x000080B8
9 Working with the Snapshot Viewer9.2 Components of a Snapshot Viewer initialization file
ARM DUI0446R Copyright © 2010-2014 ARM. All rights reserved. 9-194Non-Confidential

Related concepts9.1 About the Snapshot Viewer on page 9-191.
Related tasks9.3 Connecting to the Snapshot Viewer on page 9-196.
Related references9.4 Considerations when creating debugger scripts for the Snapshot Viewer on page 9-197.
Related informationARM Architecture Reference Manual.
9 Working with the Snapshot Viewer9.2 Components of a Snapshot Viewer initialization file
ARM DUI0446R Copyright © 2010-2014 ARM. All rights reserved. 9-195Non-Confidential
9.3 Connecting to the Snapshot ViewerDescribes how to launch the debugger from a command-line console and connect to the SnapshotViewer.
A Snapshot Viewer provides a virtual target that you can use to analyze a snapshot of a known systemstate using the debugger.
Prerequisites
Before connecting you must ensure that you have a Snapshot Viewer initialization file containing staticinformation about a target at a specific point in time. For example, the contents of registers, memory andprocessor state.
Procedure
• Launch the debugger in the command-line console using --target command-line option to pass theSnapshot Viewer initialization file to the debugger.
debugger --target=int.ini --script=int.cmm
Note
Currently DS-5 only supports DS-5 Debugger connections to the Snapshot Viewer using thecommand-line console.
Related concepts9.1 About the Snapshot Viewer on page 9-191.
Related tasks1.5 Headless command-line debugger options on page 1-24.
Related references9.2 Components of a Snapshot Viewer initialization file on page 9-193.9.4 Considerations when creating debugger scripts for the Snapshot Viewer on page 9-197.1.8 DS-5™ Debugger command-line console keyboard shortcuts on page 1-30.
9 Working with the Snapshot Viewer9.3 Connecting to the Snapshot Viewer
ARM DUI0446R Copyright © 2010-2014 ARM. All rights reserved. 9-196Non-Confidential

9.4 Considerations when creating debugger scripts for the Snapshot ViewerShows a typical example of an initialization file for use with the Snapshot Viewer.
The Snapshot Viewer uses an initialization file that emulates the state of the original system. Thesymbols are loaded from the image using the data.load.elf command with the /nocode /noregarguments.
The snapshot data and registers are read-only and so the commands you can use are limited.
Note
Currently DS-5 only supports DS-5 Debugger connections to the Snapshot Viewer using the command-line console.
The following example shows a script using CMM-style commands to analyze the contents of thetypes_m3.axf image.
var.print "Connect and load symbols:"system.updata.load.elf "types_m3.axf" /nocode /noreg;Arrays and pointers to arraysvar.print ""var.print "Arrays and pointers to arrays:"var.print "Value of i_array[9999] is " i_array[9999]var.print "Value of *(i_array+9999) is " *(i_array+9999)var.print "Value of d_array[1][5] is " d_array[1][5]var.print "Values of *((*d_array)+9) is " *((*d_array)+9)var.print "Values of *((*d_array)) is " *((*d_array))var.print "Value of &d_array[5][5] is " &d_array[5][5];Display 0x100 bytes from address in register PCvar.print ""var.print "Display 0x100 bytes from address in register PC:"data.dump r(PC)++0x100;Structures and bit-fieldsvar.print ""var.print "Structures and bit-fields:"var.print "Value of values2.no is " values2.novar.print "Value of ptr_values->no is " ptr_values->novar.print "Value of values2.name is " values2.namevar.print "Value of ptr_values->name is " ptr_values->namevar.print "Value of values2.name[0] is " values2.name[0]var.print "Value of (*ptr_values).name is " (*ptr_values).namevar.print "Value of values2.f1 is " values2.f1var.print "Value of values2.f2 is " values2.f2var.print "Value of ptr_values->f1 is " ptr_values->f1var.print ""var.print "Disconnect:"system.down
Related concepts9.1 About the Snapshot Viewer on page 9-191.
Related tasks9.3 Connecting to the Snapshot Viewer on page 9-196.
Related references9.2 Components of a Snapshot Viewer initialization file on page 9-193.
9 Working with the Snapshot Viewer9.4 Considerations when creating debugger scripts for the Snapshot Viewer
ARM DUI0446R Copyright © 2010-2014 ARM. All rights reserved. 9-197Non-Confidential

Chapter 10DS-5 Debug perspectives and views
Describes the DS-5 Debug perspective and related views in the Eclipse Integrated DevelopmentEnvironment (IDE).It contains the following sections:
• 10.1 App Console view on page 10-200.• 10.2 ARM Asm Info view on page 10-202.• 10.3 ARM assembler editor on page 10-203.• 10.4 Breakpoints view on page 10-206.• 10.5 C/C++ editor on page 10-210.• 10.6 Commands view on page 10-213.• 10.7 Debug Control view on page 10-216.• 10.8 Disassembly view on page 10-220.• 10.9 Events view on page 10-224.• 10.10 Event Viewer Settings dialog box on page 10-226.• 10.11 Expressions view on page 10-229.• 10.12 Functions view on page 10-232.• 10.13 History view on page 10-234.• 10.14 Memory view on page 10-236.• 10.15 Modules view on page 10-240.• 10.16 Registers view on page 10-243.• 10.17 OS Data view on page 10-246.• 10.18 Cache Data view on page 10-247.• 10.19 Screen view on page 10-249.• 10.20 Scripts view on page 10-252.
ARM DUI0446R Copyright © 2010-2014 ARM. All rights reserved. 10-198Non-Confidential

• 10.21 Target Console view on page 10-254.• 10.22 Target view on page 10-255.• 10.23 Trace view on page 10-257.• 10.24 Trace Control view on page 10-261.• 10.25 Variables view on page 10-263.• 10.26 Auto Refresh Properties dialog box on page 10-266.• 10.27 Memory Exporter dialog box on page 10-267.• 10.28 Memory Importer dialog box on page 10-268.• 10.29 Fill Memory dialog box on page 10-269.• 10.30 Export trace report dialog box on page 10-270.• 10.31 Breakpoint properties dialog box on page 10-272.• 10.32 Watchpoint properties dialog box on page 10-276.• 10.33 Tracepoint properties dialog box on page 10-277.• 10.34 Manage Signals dialog box on page 10-278.• 10.35 Functions Filter dialog box on page 10-280.• 10.36 Jython Script Parameters dialog box on page 10-281.• 10.37 Debug Configurations - Connection tab on page 10-282.• 10.38 Debug Configurations - Files tab on page 10-285.• 10.39 Debug Configurations - Debugger tab on page 10-289.• 10.40 Debug Configurations - OS Awareness tab on page 10-292.• 10.41 Debug Configurations - Arguments tab on page 10-293.• 10.42 Debug Configurations - Environment tab on page 10-295.• 10.43 DTSL Configuration Editor dialog box on page 10-297.• 10.44 Configuration database panel on page 10-299.• 10.45 About the Remote System Explorer on page 10-301.• 10.46 Remote Systems view on page 10-302.• 10.47 Remote System Details view on page 10-303.• 10.48 Target management terminal for serial and SSH connections on page 10-304.• 10.49 Remote Scratchpad view on page 10-305.• 10.50 Remote Systems terminal for SSH connections on page 10-306.• 10.51 New Terminal Connection dialog box on page 10-307.• 10.52 Debug Hardware Configure IP view on page 10-309.• 10.53 Debug Hardware Firmware Installer view on page 10-311.• 10.54 Connection Browser dialog box on page 10-313.• 10.55 DS-5 Debugger menu and toolbar icons on page 10-314.
10 DS-5 Debug perspectives and views
ARM DUI0446R Copyright © 2010-2014 ARM. All rights reserved. 10-199Non-Confidential

10.1 App Console viewDescribes the view content.
This view enables you to interact with the console I/O capabilities provided by the semihostingimplementation in the ARM C libraries. To use this feature, semihosting support must be enabled in thedebugger.
Figure 10-1 App Console view
Note
Default settings for this view are controlled by a DS-5 Debugger setting in the Preferences dialog box.For example, default locations for specific files or the maximum number of lines to display. You canaccess these settings by selecting Preferences from the Window menu.
Toolbar and context menu options
The following options are available from the toolbar or context menu:
Linked: contextLinks this view to the selected connection in the Debug Control view. This is the default.Alternatively you can link the view to a specific connection. If the connection you want is notshown in the drop-down list you might have to select it first in the Debug Control view.
Save Console BufferSaves the contents of the App Console view to a text file.
Clear ConsoleClears the contents of the App Console view.
Scroll LockEnables or disables the automatic scrolling of messages in the App Console view.
10 DS-5 Debug perspectives and views10.1 App Console view
ARM DUI0446R Copyright © 2010-2014 ARM. All rights reserved. 10-200Non-Confidential

View MenuThis menu contains the following option:
New App Console ViewDisplays a new instance of the App Console view.
Bring to Front for WriteIf enabled, the debugger automatically changes the focus to this view when asemihosting application prompts for input.
CopyCopies the selected text.
PastePastes text that you have previously copied. You can paste text only when the applicationdisplays a semihosting prompt.
Select AllSelects all text.
Related references7.1 About semihosting and top of memory on page 7-166.7.2 Working with semihosting on page 7-168.7.3 Enabling automatic semihosting support in the debugger on page 7-169.10 DS-5 Debug perspectives and views on page 10-198.
10 DS-5 Debug perspectives and views10.1 App Console view
ARM DUI0446R Copyright © 2010-2014 ARM. All rights reserved. 10-201Non-Confidential

10.2 ARM Asm Info viewDescribes the view content.
This view enables you to view more information on an ARM or Thumb ® instruction or directive.
When you are editing assembly language source files (.s) using the ARM assembler editor, you canaccess more information by:
1. selecting an instruction or directive2. pressing F3.
The related documentation is displayed in the ARM Asm Info view. The ARM Asm Info view isautomatically displayed when you press F3.
Figure 10-2 ARM Asm Info view
To manually add this view:
1. Ensure that you are in the DS-5 Debug perspective.2. Select Window > Show View > Other... to open the Show View dialog box.3. Select the ARM Asm Info view from the DS-5 Debugger group.
Related references10 DS-5 Debug perspectives and views on page 10-198.10.3 ARM assembler editor on page 10-203.
10 DS-5 Debug perspectives and views10.2 ARM Asm Info view
ARM DUI0446R Copyright © 2010-2014 ARM. All rights reserved. 10-202Non-Confidential

10.3 ARM assembler editorDescribes the view content.
The ARM assembler editor provides syntax highlighting, formatting of code and content assistance forlabels in ARM assembly language source files. This editor enables you to:
• edit source code• view the syntax highlighting• select an instruction or directive and press F3 to view the related ARM assembler reference
information• use content assist for auto-completion• set, remove, enable or disable a breakpoint• set or remove a trace start or stop point• set or remove a Streamline start or stop capture.
Figure 10-3 ARM assembler editor
In the left-hand margin of each editor tab you can find a marker bar that displays view markersassociated with specific lines in the source code.
To set a breakpoint, double-click in the marker bar at the position where you want to set the breakpoint.To delete a breakpoint, double-click on the breakpoint marker.
Action context menu options
Right-click in the marker bar, or the line number column if visible, to display the action context menu forthe ARM assembler editor. The options available include:
10 DS-5 Debug perspectives and views10.3 ARM assembler editor
ARM DUI0446R Copyright © 2010-2014 ARM. All rights reserved. 10-203Non-Confidential

DS-5 Breakpoints menuThe following breakpoint options are available:
Toggle BreakpointAdds a new breakpoint, or remove a selected breakpoint.
Disable Breakpoint, Enable BreakpointDisables or enables the selected breakpoint.
Breakpoint Properties...Displays the Breakpoint Properties dialog box for the selected breakpoint. This enablesyou to control breakpoint activation.
Toggle Trace Start PointSets or removes a trace start point at the selected address.
Toggle Trace Stop PointSets or removes a trace stop point at the selected address.
Toggle Trace Trigger PointStarts a trace trigger point at the selected address.
Toggle Streamline StartSets or removes a Streamline start capture at the selected address.
Toggle Streamline StopSets or removes a Streamline stop capture at the selected address.
Default Breakpoint TypeThe following breakpoint options are available:
C/C++ BreakpointsSelect to use the C/C++ perspective breakpoint scheme.
DS-5 C/C++ BreakpointSelect to use the DS-5 Debug perspective breakpoint scheme. This is the default for theDS-5 Debug perspective.
DS-5 breakpoint markers are red to distinguish them from the blue C/C++ perspectivebreakpoint markers.
Note
The Default Breakpoint Type selected causes the top-level Toggle Breakpoint menu in thiscontext menu and the double-click action in the left-hand ruler to toggle either CDT Breakpointsor DS-5 Breakpoints. This menu is also available from the Run menu in the main menu bar atthe top of the C/C++, Debug, and DS-5 Debug perspectives.
The menu options under DS-5 Breakpoints do not honor this setting and always refer to DS-5Breakpoints.
Show Line NumbersShow or hide line numbers.
For more information on the other options not listed here, see the dynamic help.
Related referencesWorking with data watchpoints.4.8 Setting a tracepoint on page 4-120.4.6 Working with conditional breakpoints on page 4-115.4.6.1 Assigning conditions to an existing breakpoint on page 4-115.4.7 About pending breakpoints and watchpoints on page 4-119.4.5.5 Exporting DS-5™ breakpoint settings to a file on page 4-113.4.5.4 Importing DS-5™ breakpoint settings from a file on page 4-112.4.9 Setting Streamline start and stop points on page 4-121.10 DS-5 Debug perspectives and views on page 10-198.
10 DS-5 Debug perspectives and views10.3 ARM assembler editor
ARM DUI0446R Copyright © 2010-2014 ARM. All rights reserved. 10-204Non-Confidential

5.1 Examining the target execution environment on page 5-131.5.2 Examining the call stack on page 5-133.10.2 ARM Asm Info view on page 10-202.
10 DS-5 Debug perspectives and views10.3 ARM assembler editor
ARM DUI0446R Copyright © 2010-2014 ARM. All rights reserved. 10-205Non-Confidential

10.4 Breakpoints viewDescribes the view content.
This view enables you to:
• disable, enable, or delete breakpoints and watchpoints• import or export a list of breakpoints and watchpoints• display the source file containing the line of code where the selected breakpoint is set• display the disassembly where the selected breakpoint is set• display the memory where the selected watchpoint is set• delay breakpoint activation by setting properties for the breakpoint• control the handling and output of messages for all Unix signals and processor exception handlers• change the access type for the selected watchpoint.
Figure 10-4 Breakpoints view
Syntax
Syntax of a breakpoint entry
A breakpoint entry has the following syntax:
source_file:linenum @ function+offset address [#ID instruction_type, ignore = num/count, nHits hits, (condition)]
where:
source_file:linenumIf the source file is available, the file name and line number in the file where the breakpoint isset, threads.c:115.
function+offsetThe name of the function in which the breakpoint is set and the number of bytes from the startof the function. For example, accumulate()+52 shows that the breakpoint is 52 bytes from thestart of the accumulate() function.
addressThe address where the breakpoint is set.
10 DS-5 Debug perspectives and views10.4 Breakpoints view
ARM DUI0446R Copyright © 2010-2014 ARM. All rights reserved. 10-206Non-Confidential

IDThe breakpoint ID number, #N. In some cases, such as in a for loop, a breakpoint mightcomprise a number of sub-breakpoints. These are identified as N.n, where N is the number of theparent. The description of a sub-breakpoint in this dialog box is shown as
main()+132sub-breakpoint ofmain()+132 @ threads.c:56 [#14 ARM] (threads)
instruction_typeThe type of instruction at the address of the breakpoint, ARM or Thumb.
ignore = num/countAn ignore count if set, where:
num equals count initially, and decrements on each pass until it reaches zero.
count is the value you have specified for the ignore count.
nHits hitsA counter that increments each time the breakpoint is hit. This is not displayed until the first hit.If you set an ignore count, hits count does not start incrementing until the ignore countreaches zero.
conditionThe stop condition you have specified, (i==3).
Syntax
Syntax of a watchpoint entry
A watchpoint entry has the following syntax:
name type[#ID]
where:
nameThe name of the variable where the watchpoint is set.
typeThe access type of the watchpoint.
IDThe watchpoint ID number.
Syntax
Syntax of a tracepoint entry
A tracepoint entry has the following syntax:
source_file:linenum address
where:
addressThe address where the tracepoint is set.
source_file:linenumIf the source file is available, the file name and line number in the file where the tracepoint isset, 0x80000A72.
Toolbar and context menu options
The following options are available from the toolbar or context menu:
Linked: contextLinks this view to the selected connection in the Debug Control view. This is the default.Alternatively you can link the view to a specific connection. If the connection you want is notshown in the drop-down list you might have to select it first in the Debug Control view.
10 DS-5 Debug perspectives and views10.4 Breakpoints view
ARM DUI0446R Copyright © 2010-2014 ARM. All rights reserved. 10-207Non-Confidential

DeleteRemoves the selected breakpoints and watchpoints.
Delete AllRemoves all breakpoints and watchpoints.
Go to FileDisplays the source file containing the line of code where the selected breakpoint is set. Thisoption is disabled for a watchpoint.
Go to DisassemblyDisplays the disassembly where the selected breakpoint is set. This option is disabled for awatchpoint.
Go to MemoryDisplays the memory where the selected watchpoint is set. This option is disabled for abreakpoint.
Skip All BreakpointsDeactivates all breakpoints or watchpoints that are currently set. The debugger remembers theenabled and disabled state of each breakpoint or watchpoint, and restores that state when youreactivate them again.
Enable BreakpointsEnables the selected breakpoints and watchpoints.
Disable BreakpointsDisables the selected breakpoints and watchpoints.
ResolveRe-evaluates the address of the selected breakpoint or watchpoint. If the address can be resolvedthe breakpoint or watchpoint is set, otherwise it remains pending.
Properties...Displays the Properties dialog box for the selected breakpoint, watchpoint or tracepoint. Thisenables you to control activation or change the access type for the selected watchpoint.
CopyCopies the selected breakpoints and watchpoints. You can also use the standard keyboardshortcut to do this.
PastePastes the copied breakpoints and watchpoints. The breakpoints or watchpoints are enabled bydefault. You can also use the standard keyboard shortcut to do this.
Select allSelects all breakpoints or watchpoints. You can also use the standard keyboard shortcut to dothis.
View MenuThe following View Menu options are available:
New Breakpoints ViewDisplays a new instance of the Breakpoints view.
Export BreakpointsExports the current list of breakpoints and watchpoints to a file.
Import BreakpointsImports a list of breakpoints and watchpoints from a file.
Alphanumeric SortSorts the list alphanumerically based on the string displayed in the view.
Ordered SortSorts the list in the order they have been set.
Manage SignalsDisplays the Manage Signal dialog box.
Related concepts6.7 About debugging multi-threaded applications on page 6-146.6.8 About debugging shared libraries on page 6-147.6.9 About debugging a Linux kernel on page 6-149.
10 DS-5 Debug perspectives and views10.4 Breakpoints view
ARM DUI0446R Copyright © 2010-2014 ARM. All rights reserved. 10-208Non-Confidential

6.10 About debugging Linux kernel modules on page 6-151.6.12 About debugging TrustZone enabled targets on page 6-154.
Related referencesWorking with data watchpoints.4.8 Setting a tracepoint on page 4-120.4.6 Working with conditional breakpoints on page 4-115.4.6.1 Assigning conditions to an existing breakpoint on page 4-115.4.7 About pending breakpoints and watchpoints on page 4-119.4.5.5 Exporting DS-5™ breakpoint settings to a file on page 4-113.4.5.4 Importing DS-5™ breakpoint settings from a file on page 4-112.10 DS-5 Debug perspectives and views on page 10-198.5.1 Examining the target execution environment on page 5-131.5.2 Examining the call stack on page 5-133.
10 DS-5 Debug perspectives and views10.4 Breakpoints view
ARM DUI0446R Copyright © 2010-2014 ARM. All rights reserved. 10-209Non-Confidential

10.5 C/C++ editorDescribes the view content.
This editor enables you to:
• Edit source code.• View the syntax highlighting.• View interactive help when hovering over C library functions. For example, printf().• Use content assist (Ctrl+Space) for auto-completion.• Set, remove, enable or disable a breakpoint.• Set or remove a trace start or stop point.• Set or remove a Streamline start or stop capture.
Figure 10-5 C/C++ editor
In the left-hand margin of each editor tab you can find a marker bar that displays view markersassociated with specific lines in the source code.
To set a breakpoint, double-click in the marker bar at the position where you want to set the breakpoint.To delete a breakpoint, double-click on the breakpoint marker.
Note
If you have sub-breakpoints to a parent breakpoint then double-clicking on the marker also deletes therelated sub-breakpoints.
Action context menu options
Right-click in the marker bar, or the line number column if visible, to display the action context menu forthe C/C++ editor. The options available include:
10 DS-5 Debug perspectives and views10.5 C/C++ editor
ARM DUI0446R Copyright © 2010-2014 ARM. All rights reserved. 10-210Non-Confidential

DS-5 Breakpoints menuThe following breakpoint options are available:
Toggle BreakpointSets or removes a breakpoint at the selected address.
Toggle Hardware BreakpointSets or removes a hardware breakpoint at the selected address.
Resolve BreakpointResolves a pending breakpoint at the selected address.
Enable BreakpointEnables the breakpoint at the selected address.
Disable BreakpointDisables the breakpoint at the selected address.
Breakpoint Properties...Displays the Breakpoint Properties dialog box for the selected breakpoint. This enablesyou to control breakpoint activation.
Toggle Trace Start PointSets or removes a trace start point at the selected address.
Toggle Trace Stop PointSets or removes a trace stop point at the selected address.
Toggle Trace Trigger PointStarts a trace trigger point at the selected address.
Toggle Streamline StartSets or removes a Streamline start capture at the selected address.
Toggle Streamline StopSets or removes a Streamline stop capture at the selected address.
Default Breakpoint TypeThe default type causes the top-level context menu entry, Toggle Breakpoint and the double-click action in the marker bar to toggle either CDT Breakpoints or DS-5 Breakpoints. Whenusing DS-5 Debugger you must select DS-5 C/C++ Breakpoint. DS-5 breakpoint markers arered to distinguish them from the blue CDT breakpoint markers.
Show Line NumbersShows or hides line numbers.
For more information on the other options not listed here, see the dynamic help.
Editor context menu
Right-click on any line of source to display the editor context menu for the C/C++ editor. The followingoptions are enabled when you connect to a target:
Set PC to SelectionSets the PC to the address of the selected source line.
Run to SelectionRuns to the selected source line.
10 DS-5 Debug perspectives and views10.5 C/C++ editor
ARM DUI0446R Copyright © 2010-2014 ARM. All rights reserved. 10-211Non-Confidential

Show in DisassemblyThis option:
1. Opens a new instance of the Disassembly view.2. Highlights the addresses and instructions associated with the selected source line. A vertical
bar and shaded highlight shows the related disassembly.
Figure 10-6 Show disassembly for selected source line
For more information on the other options not listed here, see the dynamic help.
Related referencesWorking with data watchpoints.4.8 Setting a tracepoint on page 4-120.4.6 Working with conditional breakpoints on page 4-115.4.6.1 Assigning conditions to an existing breakpoint on page 4-115.4.7 About pending breakpoints and watchpoints on page 4-119.4.5.5 Exporting DS-5™ breakpoint settings to a file on page 4-113.4.5.4 Importing DS-5™ breakpoint settings from a file on page 4-112.4.9 Setting Streamline start and stop points on page 4-121.10 DS-5 Debug perspectives and views on page 10-198.
10 DS-5 Debug perspectives and views10.5 C/C++ editor
ARM DUI0446R Copyright © 2010-2014 ARM. All rights reserved. 10-212Non-Confidential

10.6 Commands viewDescribes the view content.
This view enables you to:
• Enter debugger commands.• Run command scripts.• See messages output by the debugger.• Save the contents to a text file.
Figure 10-7 Commands view
You can execute DS-5 Debugger commands by entering the command in the field provided, then clickSubmit.
Note
This feature is not available until you connect to a target.
You can also use content assist keyboard combinations provided by Eclipse to display a list of DS-5Debugger commands. Filtering is also possible by entering a partial command. For example, enter prfollowed by the content assist keyboard combination to search for the print command.
To display sub-commands, you must filter on the top level command. For example, enter info followedby the content assist keyboard combination to display all the info sub-commands.
See DS-5 Debug perspective keyboard shortcuts in the Related reference section for details aboutspecific content assist keyboard combinations available in DS-5 Debugger.
10 DS-5 Debug perspectives and views10.6 Commands view
ARM DUI0446R Copyright © 2010-2014 ARM. All rights reserved. 10-213Non-Confidential

Note
Default settings for this view are controlled by a DS-5 Debugger setting in the Preferences dialog box.For example, default locations for specific files or the maximum number of lines to display. You canaccess these settings by selecting Preferences from the Window menu.
Toolbar and context menu options
The following options are available from the toolbar or context menu:
Linked: contextLinks this view to the selected connection in theDebug Control view. This is the default.Alternatively you can link the view to a specific connection. If the connection you want is notshown in the drop-down list you might have to select it first in the Debug Control view.
Save Console BufferSaves the contents of the Commands view to a text file.
Clear ConsoleClears the contents of the Commands view.
Scroll LockEnables or disables the automatic scrolling of messages in the Commands view.
Script menuA menu of options that enable you to manage and run command scripts:
<Recent scripts list>A list of the recently run scripts.
<Recent favorites list>A list of the scripts you have added to your favorites list.
Run Script File...Displays the Open dialog box to select and run a script file.
Organize Favorites...Displays the Scripts view, where you can organize your scripts.
Show Command History ViewDisplays the History view.
CopyCopies the selected commands. You can also use the standard keyboard shortcut to do this.
PastePastes the command that you have previously copied into the Command field. You can also usethe standard keyboard shortcut to do this.
Select allSelects all output in the Commands view. You can also use the standard keyboard shortcut todo this.
Save the selected lines as a script...Displays the Save As dialog box to save the selected commands to a script file.
When you click Save on the Save As dialog box, you are given the option to add the script fileto your favorites list. Click OK to add the script to your favorites list. Favorites are displayed inthe Scripts view.
Execute selected linesRuns the selected commands.
New Commands ViewDisplays a new instance of the Commands view.
Related concepts6.7 About debugging multi-threaded applications on page 6-146.6.8 About debugging shared libraries on page 6-147.6.9 About debugging a Linux kernel on page 6-149.
10 DS-5 Debug perspectives and views10.6 Commands view
ARM DUI0446R Copyright © 2010-2014 ARM. All rights reserved. 10-214Non-Confidential

6.10 About debugging Linux kernel modules on page 6-151.6.12 About debugging TrustZone enabled targets on page 6-154.
Related references1.7 DS-5™ Debug perspective keyboard shortcuts on page 1-29.10.7 Debug Control view on page 10-216.Working with data watchpoints.4.8 Setting a tracepoint on page 4-120.4.6 Working with conditional breakpoints on page 4-115.4.6.1 Assigning conditions to an existing breakpoint on page 4-115.4.7 About pending breakpoints and watchpoints on page 4-119.4.5.5 Exporting DS-5™ breakpoint settings to a file on page 4-113.4.5.4 Importing DS-5™ breakpoint settings from a file on page 4-112.10 DS-5 Debug perspectives and views on page 10-198.
Related informationDS-5 Debugger commands.
10 DS-5 Debug perspectives and views10.6 Commands view
ARM DUI0446R Copyright © 2010-2014 ARM. All rights reserved. 10-215Non-Confidential

10.7 Debug Control viewDescribes the view content.
This view enables you to:The Debug Control view displays target connections with a hierarchical layoutof running threads, user space processes, and related call stacks. Call stack information is gathered whenthe system is stopped.
• view a list of running threads and user space processes as applicable• view the call stack showing stack elements for each thread or process as applicable• connect to and disconnect from a target• load an application image on to the target• load debug information when required by the debugger• start the application• run the application• stop the application• reset the target• continue running the application after a breakpoint is hit or the target is suspended• control the execution of an image by sequentially stepping through an application at the source or
instruction level• modify the search paths used by the debugger when it executes any of the commands that look up and
display source code• set the current working directory.
Figure 10-8 Set the current working directory
On Linux Kernel connections, the hierarchical nodes Active Threads and All Threads are displayed.Active Threads shows each thread that is currently scheduled on a processor. All Threads shows everythread in the system, including those presently scheduled on a processor. On gdbserver connections, thehierarchical nodes Active Threads and All Threads are displayed, but the scope is limited to theapplication under debug. Active Threads shows only application threads that are currently scheduled.All Threads shows all application threads, including ones that are currently scheduled.
Some of the views in the DS-5 Debug perspective are associated with the currently selected stack frame.Other views are associated with editors or target connections. Each associated view is synchronizedaccordingly.
Connection states are identified with different icons and background highlighting and are also displayedin the view status bar. The following example shows a connection in the connected state. If you want toadd another configuration to the view then you can use the Debug Control view menu.
10 DS-5 Debug perspectives and views10.7 Debug Control view
ARM DUI0446R Copyright © 2010-2014 ARM. All rights reserved. 10-216Non-Confidential

Figure 10-9 Debug Control view
Toolbar and context menu options
The following options are available from the toolbar or context menu:
Collapse AllCollapses all expanded stack trace configurations.
Connect to TargetConnects to the selected target using the same launch configuration settings as the previousconnection.
Disconnect from TargetDisconnects from the selected target.
Debug Configurations...Displays the Debug Configurations dialog box, with the configuration for the selectedconnection displayed.
Launch in backgroundDisplays the Progress Information dialog box if disabled.
Remove ConnectionRemoves the selected target connection from the Debug Control view.
Debug from menuThis menu lists the different types of actions that you can perform when a connection isestablished.
Reset menuThis menu lists the different types of reset that are available on your target.
ContinueContinues running the target.
Note
A Connect only connection might require setting the PC register to the start of the image beforerunning it.
InterruptInterrupts the target and stops the current application.
10 DS-5 Debug perspectives and views10.7 Debug Control view
ARM DUI0446R Copyright © 2010-2014 ARM. All rights reserved. 10-217Non-Confidential

Step Source LineStep Instruction
This option depends on the stepping mode selected:
• If source line mode is selected, steps at the source level including stepping into all functioncalls where there is debug information.
• If instruction mode is selected, steps at the instruction level including stepping into allfunction calls.
Step Over Source LineStep Over Instruction
This option depends on the stepping mode selected:
• If source line mode is selected, steps at the source level but stepping over all function calls.• If instruction mode is selected, steps at the instruction level but stepping over all function
calls.
Step OutContinues running to the next instruction after the selected stack frame finishes.
Stepping by Source Line (press to step by instruction)Stepping by Instruction (press to step by source line)
Toggles the stepping mode between source line and instruction.
The Disassembly view and the source editor view are automatically displayed when you step ininstruction mode.
The source editor view is automatically displayed when you step in source line mode. If thetarget stops in code such as a shared library, and the corresponding source is not available, thenthe source editor view is not displayed.
Step Out to This FrameContinues running to the selected stack frame.
Change Connection ColorEnables you to change the color of the connection icon.
View MenuThe following options are available:
Add Configuration (without connecting)...Displays the Add Launch Configuration dialog box. The dialog box lists anyconfigurations that are not already listed in the Debug Control view.
Select one or more configurations, then click OK. The selected configurations areadded to the Debug Control view, but remain unconnected.
Load...Displays a dialog box where you can select whether to load an image, debuginformation, an image and debug information, or additional debug information. Thisoption might be disabled for targets where this functionality is not supported.
Set Working Directory...Displays the Current Working Directory dialog box. Enter a new location for thecurrent working directory, then click OK.
Path Substitution...Displays the Path Substitution and Edit Substitute Path dialog box.
Use the Edit Substitute Path dialog box to associate the image path with a source filepath on the host. Click OK. The image and host paths are added to the PathSubstitution dialog box. Click OK when finished.
Reset DS-5 Views to ‘Linked’Resets DS-5 views to link to the selected connection in the Debug Control view.
Threads PresentationDisplays either a flat or hierarchical presentation of the threads in the stack trace.
10 DS-5 Debug perspectives and views10.7 Debug Control view
ARM DUI0446R Copyright © 2010-2014 ARM. All rights reserved. 10-218Non-Confidential

Auto Expand StackControls whether to automatically display an expanded stack when selecting aconnection.
Always Show CoresDisplays the available processors.
Related concepts6.7 About debugging multi-threaded applications on page 6-146.6.8 About debugging shared libraries on page 6-147.6.9 About debugging a Linux kernel on page 6-149.6.10 About debugging Linux kernel modules on page 6-151.6.12 About debugging TrustZone enabled targets on page 6-154.
Related references1.7 DS-5™ Debug perspective keyboard shortcuts on page 1-29.10.6 Commands view on page 10-213.10 DS-5 Debug perspectives and views on page 10-198.
10 DS-5 Debug perspectives and views10.7 Debug Control view
ARM DUI0446R Copyright © 2010-2014 ARM. All rights reserved. 10-219Non-Confidential

10.8 Disassembly viewDescribes the view content.
This view enables you to:
• See a disassembly of the target memory• Specify the start address for the Disassembly view. You can use expressions in this field, $r3, or
drag and drop a register from the Registers view into the Disassembly view to see the disassembly atthe address in that register.
• Select the instruction set for the Disassembly view• Create, delete, enable or disable a breakpoint or watchpoint at a memory location• Freeze the selected view to prevent the values being updated by a running target.
Figure 10-10 Disassembly view
Gradient shading in the Disassembly view shows the start of each function.
Solid shading in the Disassembly view shows the instruction at the address of the current PC registerfollowed by any related instructions that correspond to the current source line.
In the left-hand margin of the Disassembly view you can find a marker bar that displays view markersassociated with specific locations in the disassembly code.
10 DS-5 Debug perspectives and views10.8 Disassembly view
ARM DUI0446R Copyright © 2010-2014 ARM. All rights reserved. 10-220Non-Confidential

To set a breakpoint, double-click in the marker bar at the position where you want to set the breakpoint.To delete a breakpoint, double-click on the breakpoint marker.
Note
If you have sub-breakpoints to a parent breakpoint then double-clicking on the marker also deletes therelated sub-breakpoints.
Toolbar and context menu options
The following options are available from the toolbar or context menu:
Linked: contextLinks this view to the selected connection in the Debug Control view. This is the default.Alternatively you can link the view to a specific connection. If the connection you want is notshown in the drop-down list you might have to select it first in the Debug Control view.
Back, ForwardNavigates through the history list.
<Next Instruction>Navigates to the selected stack frame in the Debug Control view.
$LRNavigates to the LR register.
expressionNavigates to the address specified by an expression. $PC+256.
addressNavigates to the specified address.
HistoryAddresses and expressions you specify in the Address field are added to the drop down box, andpersist until you clear the history list or exit Eclipse. If you want to keep an expression for lateruse, add it to the Expressions view.
Address fieldEnter the address where you want to view the disassembly.
Context menu options are available for editing this field.
Size fieldThe number of instructions to display before and after the location pointed to by the programcounter.
Context menu options are available for editing this field.
SearchSearches through debug information for symbols.
View MenuThe following View Menu options are available:
New Disassembly ViewDisplays a new instance of the Disassembly view.
Instruction SetThe instruction set to show in the view by default. Select one of the following:
[AUTO]Auto detect the instruction set from the image.
ARMARM instruction set.
ThumbThumb instruction set.
Byte OrderSelects the byte order of the memory. The default is Auto(LE).
10 DS-5 Debug perspectives and views10.8 Disassembly view
ARM DUI0446R Copyright © 2010-2014 ARM. All rights reserved. 10-221Non-Confidential

Clear HistoryClears the list of addresses and expressions in the History drop-down box.
RefreshRefreshes the view.
Freeze DataToggles the freezing of data in the current view. This also disables and enables the Sizeand Type fields and the Refresh option.
Action context menuWhen you right-click in the left margin, the corresponding address and instruction is selectedand this context menu is displayed. The available options are:
CopyCopies the selected address.
PastePastes into the Address field the last address that you copied.
Select AllSelects all disassembly in the range specified by the Size field.
If you want to copy the selected lines of disassembly, you cannot use the Copy optionon this menu. Instead, use the copy keyboard shortcut for your host, Ctrl+C onWindows.
Run to SelectionRuns to the selected address
Set PC to SelectionSets the PC register to the selected address.
Show in sourceIf source code is available:
1. Opens the corresponding source file in the C/C++ source editor view, if necessary.2. Highlights the line of source associated with the selected address.
Show in registersIf the memory address corresponds to a register, then displays the Registers view withthe related register selected.
Show in functionsIf the memory address corresponds to a function, then displays the Functions viewwith the related function selected.
Toggle BreakpointSets or removes a breakpoint at the selected address.
Toggle Hardware BreakpointSets or removes a hardware breakpoint at the selected address.
Resolve BreakpointResolves a pending breakpoint at the selected address.
Enable BreakpointEnables the breakpoint at the selected address.
Disable BreakpointDisables the breakpoint at the selected address.
Toggle Trace Start PointSets or removes a trace start point at the selected address.
Toggle Trace Stop PointSets or removes a trace stop point at the selected address.
Toggle Trace Trigger PointStarts a trace trigger point at the selected address.
Editing context menu optionsThe following options are available on the context menu when you select the Address field orSize field for editing:
10 DS-5 Debug perspectives and views10.8 Disassembly view
ARM DUI0446R Copyright © 2010-2014 ARM. All rights reserved. 10-222Non-Confidential

CutCopies and deletes the selected text.
CopyCopies the selected text.
PastePastes text that you previously cut or copied.
DeleteDeletes the selected text.
UndoReverts the last change.
Select AllSelects all the text.
Related concepts6.7 About debugging multi-threaded applications on page 6-146.6.8 About debugging shared libraries on page 6-147.6.9 About debugging a Linux kernel on page 6-149.6.10 About debugging Linux kernel modules on page 6-151.6.12 About debugging TrustZone enabled targets on page 6-154.
Related referencesWorking with data watchpoints.4.8 Setting a tracepoint on page 4-120.4.6 Working with conditional breakpoints on page 4-115.4.6.1 Assigning conditions to an existing breakpoint on page 4-115.4.7 About pending breakpoints and watchpoints on page 4-119.4.5.5 Exporting DS-5™ breakpoint settings to a file on page 4-113.4.5.4 Importing DS-5™ breakpoint settings from a file on page 4-112.10 DS-5 Debug perspectives and views on page 10-198.
10 DS-5 Debug perspectives and views10.8 Disassembly view
ARM DUI0446R Copyright © 2010-2014 ARM. All rights reserved. 10-223Non-Confidential

10.9 Events viewThe Events view enables you to view the output generated by the System Trace Macrocell (STM) andInstruction Trace Macrocell (ITM) events.
Data is captured from your application when it runs. However, no data appears in the Events view untilyou stop the application.
To stop the target, either click the Interrupt icon in the Debug Control view, or use the stop commandin the Commands view. When your application stops, any captured logging information is automaticallyappended to the open views.
Figure 10-11 Events view (Shown with all ports enabled for an ETB:ITM trace source)
Note
Use the Event Viewer Settings dialog to select a Trace Source as well as to set up Ports (if ITM is thetrace source) or Masters (if STM is the trace source) to display in the view.
Toolbar and context menu options
The following options are available from the toolbar or context menu:
Linked: contextLinks this view to the selected connection in the Debug Control view. This is the default.Alternatively you can link the view to a specific connection. If the connection you want is notshown in the drop-down list, you might have to select it first in the Debug Control view.
Clear TraceClears the debug hardware device buffer and all trace sources. The views might retain data, butafter clearing trace, refreshing the views clears them as well.
Start of pageDisplays events from the beginning of the trace buffer.
Page backMoves one page back in the trace buffer.
Page forwardMoves one page forward in the trace buffer.
End of pageDisplays events from the end of the trace buffer.
View Menu
10 DS-5 Debug perspectives and views10.9 Events view
ARM DUI0446R Copyright © 2010-2014 ARM. All rights reserved. 10-224Non-Confidential

The following View Menu options are available:
New Events ViewDisplays a new instance of the Events view.
Find TimestampDisplays the Search by Timestamp dialog which allows you to search through the entiretrace buffer. The search results opens up the page where the timestamp is found andselects the closest timestamp.
RefreshRefreshes the view.
Freeze DataToggles the freezing of data in the current view.
Events SettingsDisplays the Settings dialog where you can select a trace source and set options for theselected trace source.
Open Trace Control ViewOpens the Trace Control View.
Events content menuTimestamps
Timestamps represent the approximate time when events are generated.Synchronize Timestamps
Synchronizes all Trace and Events views to display data around the same timestamp.Set Timestamp Origin
Sets the selected event record as the timestamp origin.
Note
For a given connection, the timestamp origin is global for all Trace and Events views.
Clear Timestamp OriginClears the timestamp origin.
Timestamp Format: NumericSets the timestamp in numeric format. This is the raw timestamp value received from theITM/STM protocol.
Timestamp Format: (h:m:s)Sets the timestamp in hour:minute:second format.
Related references10 DS-5 Debug perspectives and views on page 10-198.10.10 Event Viewer Settings dialog box on page 10-226.
Related informationCoreSight™ Components Technical Reference Manual.CoreSight™ System Trace Macrocell Technical Reference Manual.
10 DS-5 Debug perspectives and views10.9 Events view
ARM DUI0446R Copyright © 2010-2014 ARM. All rights reserved. 10-225Non-Confidential

10.10 Event Viewer Settings dialog boxUse the Event Viewer Settings dialog to select a Trace Source as well as to set up Ports (if ITM is thetrace source) or Masters (if STM is the trace source) to display in the Events view.
General settingsSelect a Trace Source
Selects the required trace source from the list.
HeightThe number of lines to display per results page. The default is 100 lines.
WidthThe number of characters to display per line. The default is 80 lines.
ImportImports an existing Event Viewer Settings configuration file. This file contains details about theTrace Source and Ports (in the case of ITM trace) or Masters and Channels (in the case ofSTM trace) used to create the configuration.
ExportExports the currently displayed Event Viewer Settings configuration to use with a differentEvents view.
OKReorganizes the current channels into a canonical form, saves the settings, and closes the dialogbox.
CancelEnables you to cancel unsaved changes.
10 DS-5 Debug perspectives and views10.10 Event Viewer Settings dialog box
ARM DUI0446R Copyright © 2010-2014 ARM. All rights reserved. 10-226Non-Confidential

Figure 10-12 Event Viewer Settings (Shown with all Masters and Channels enabled for anETR:STM trace source)
For ITM trace sourcesPorts
Click to add or delete a Port.Encoding
Select the type of encoding you want for the data associated with the port. The options availableare Binary, Text, and TAE.
ResetClick Reset to display and enable all available Ports for the selected ITM trace source.
Note
This clears any custom settings.
ClearClick to clear all Ports.
For STM trace sourcesMasters
Click to add or delete Masters and Channels that you want to display in the Events view.
Note
Masters are only available for STM trace.
EncodingSelect the type of encoding you want for the data associated with the channels. The optionsavailable are Binary and Text.
10 DS-5 Debug perspectives and views10.10 Event Viewer Settings dialog box
ARM DUI0446R Copyright © 2010-2014 ARM. All rights reserved. 10-227Non-Confidential

ResetClick Reset to display and enable all available Masters and Channels for the selected STMtrace source.
Note
This clears any custom settings.
ClearClick to clear all Masters and Channels.
Related references10.9 Events view on page 10-224.
Related informationCoreSight™ Components Technical Reference Manual.CoreSight™ System Trace Macrocell Technical Reference Manual.
10 DS-5 Debug perspectives and views10.10 Event Viewer Settings dialog box
ARM DUI0446R Copyright © 2010-2014 ARM. All rights reserved. 10-228Non-Confidential

10.11 Expressions viewDescribes the view content.
This view enables you to:
• add expressions that you use regularly or that you want to examine in more detail• edit, and delete expressions• freeze the selected view to prevent the values being updated by a running target.
Figure 10-13 Expressions view
Note
If your expression contains side-effects when evaluating the expression, the results are unpredictable.Side-effects occur when the state of one or more inputs to the expression changes when the expression isevaluated.
For example, instead of x++ or x+=1 you must use x+1.
Right-click on the column headers to select the columns that you want displayed:
NameAn expression that resolves to an address, such as main+1024.
ValueThe value of the expression. You can modify a value that has a white background. A yellowbackground indicates the value has changed.
If you freeze the view, then you cannot change a value.
TypeThe type associated with the value at the address identified by the expression.
CountThe number of array or pointer elements. You can edit a pointer element count.
SizeThe size of expression in bits.
10 DS-5 Debug perspectives and views10.11 Expressions view
ARM DUI0446R Copyright © 2010-2014 ARM. All rights reserved. 10-229Non-Confidential

LocationThe address in hexadecimal identified by the expression, or the name of a register, if expressioncontains only a single register name.
AccessThe access type of expression.
All columns are displayed by default.
Toolbar and context menu options
The following options are available from the toolbar or context menu:
Linked: contextLinks this view to the selected connection in the Debug Control view. This is the default.Alternatively you can link the view to a specific connection. If the connection you want is notshown in the drop-down list you might have to select it first in the Debug Control view.
Add New ExpressionAdds a new expression to the expression list.
Remove Selected ExpressionRemoves the selected expression from the list.
Remove All ExpressionsRemoves all expressions from the list.
SearchSearches the data in the current view for an expression.
CutCopies and removes the selected expression.
CopyCopies the selected expression.
To copy an expression for use in the Disassembly view or Memory view, first select theexpression in the Name field.
PastePastes expressions that you have previously cut or copied.
DeleteDeletes the selected expression.
Select AllSelects all expressions.
Show in memory viewWhere enabled, displays the Memory view with the address set to either:
• the value of the selected expression, if the expression translates to an address, the address ofan array, &name
• the location of the expression, the name of an array, name.
The memory size is set to the size of the variable, using the sizeof keyword.
Show in register viewIf the expression corresponds to a register, then displays the Registers view with that registerselected. This might be:
• an expression that consists only of a single register, $pc• a variable that is currently held in a register, For example, the variable t might be held in
register R5.
Send to SelectionEnables you to add register filters to an Expression view. Displays a sub menu that enables youto add to a specific Expressions view.
format listA list of formats you can use for the expression value.
View Menu
10 DS-5 Debug perspectives and views10.11 Expressions view
ARM DUI0446R Copyright © 2010-2014 ARM. All rights reserved. 10-230Non-Confidential

The following View Menu options are available:
New Expression ViewDisplays a new instance of the Expressions view.
RefreshRefreshes the view.
Freeze DataToggles the freezing of data in the current view. This also disables and enables theRefresh option.
Related referencesWorking with data watchpoints.4.8 Setting a tracepoint on page 4-120.4.6 Working with conditional breakpoints on page 4-115.4.6.1 Assigning conditions to an existing breakpoint on page 4-115.4.7 About pending breakpoints and watchpoints on page 4-119.4.5.5 Exporting DS-5™ breakpoint settings to a file on page 4-113.4.5.4 Importing DS-5™ breakpoint settings from a file on page 4-112.10 DS-5 Debug perspectives and views on page 10-198.
10 DS-5 Debug perspectives and views10.11 Expressions view
ARM DUI0446R Copyright © 2010-2014 ARM. All rights reserved. 10-231Non-Confidential

10.12 Functions viewThis section describes the Functions view.
This view enables you to:
• See the ELF data associated with function symbols for all loaded images.• Freeze the selected view to prevent the information being updated by a running target.
Figure 10-14 Functions view
Right-click on the column headers to select the columns that you want displayed:
NameThe name of the function.
Mangled NameThe C++ mangled name of the function.
Base AddressThe function entry point.
Start AddressThe start address of the function.
End AddressThe end address of the function.
SizeThe size of the function in bytes.
Compilation UnitThe location of the compilation unit containing the function.
ImageThe location of the ELF image containing the function.
The Name, Start Address, End Address, Compilation Unit, and Image columns are displayed bydefault.
Toolbar and context menu options
The following options are available from the toolbar or context menu:
10 DS-5 Debug perspectives and views10.12 Functions view
ARM DUI0446R Copyright © 2010-2014 ARM. All rights reserved. 10-232Non-Confidential

Linked: contextLinks this view to the selected connection in the Debug Control view. This is the default.Alternatively you can link the view to a specific connection. If the connection you want is notshown in the drop-down list you might have to select it first in the Debug Control view.
SearchSearches the data in the current view for a function.
CopyCopies the selected functions.
Select AllSelects all the functions in the view.
Run to SelectionRuns to the selected address
Set PC to SelectionSets the PC register to the start address of the selected function.
Show in SourceIf source code is available:
1. Opens the corresponding source file in the C/C++ editor view, if necessary.2. Highlights the line of source associated with the selected address.
Show in MemoryDisplays the Memory view starting at the address of the selected function.
Show in DisassemblyDisplays the Disassembly view starting at the address of the selected function.
Toggle BreakpointSets or removes a breakpoint at the selected address.
Resolve BreakpointResolves a pending breakpoint at the selected address.
Enable BreakpointEnables the breakpoint at the selected address.
Disable BreakpointDisables the breakpoint at the selected address.
Toggle Trace Start PointSets or removes a trace start point at the selected address.
Toggle Trace Stop PointSets or removes a trace stop point at the selected address.
Toggle Trace Trigger PointStarts a trace trigger point at the selected address.
View MenuThe following View Menu options are available:
New Function ViewDisplays a new instance of the Functions view.
RefreshRefreshes the view.
Freeze DataToggles the freezing of data in the current view. This also disables or enables theRefresh option.
Filter...Displays the Filter dialog box.
Related references10 DS-5 Debug perspectives and views on page 10-198.
10 DS-5 Debug perspectives and views10.12 Functions view
ARM DUI0446R Copyright © 2010-2014 ARM. All rights reserved. 10-233Non-Confidential

10.13 History viewDescribes the view content.
This view enables you to:
• See a full list of commands generated during the current debug session.• Clear the contents of the view.• Save the selected commands to a script file. You can also add the script file to your favorites list
when you click Save. Favorites are displayed in the Scripts view.• Enable or disable the automatic scrolling of messages in the History view.
Figure 10-15 History view
Note
Default settings for this view are controlled by a DS-5 Debugger setting in the Preferences dialog box.For example, default locations for specific files. You can access these settings by selecting Preferencesfrom the Window menu.
Toolbar and context menu options
The following options are available from the toolbar or context menu:
Linked: contextLinks this view to the selected connection in the Debug Control view. This is the default.Alternatively you can link the view to a specific connection. If the connection you want is notshown in the drop-down list you might have to select it first in the Debug Control view.
10 DS-5 Debug perspectives and views10.13 History view
ARM DUI0446R Copyright © 2010-2014 ARM. All rights reserved. 10-234Non-Confidential

Exports the selected lines as a scriptDisplays the Save As dialog box to save the selected commands to a script file.
When you click Save on the Save As dialog box, you are given the option to add the script fileto your favorites list. Click OK to add the script to your favorites list. Favorites are displayed inthe Scripts view.
Clear ConsoleClears the contents of the History view.
Toggles Scroll LockEnables or disables the automatic scrolling of messages in the History view.
CopyCopies the selected commands.
Select AllSelects all commands.
Save the selected lines as a script...Displays the Save As dialog box to save the selected commands to a script file.
When you click Save on the Save As dialog box, you are given the option to add the script fileto your favorites list. Click OK to add the script to your favorites list. Favorites are displayed inthe Scripts view.
Execute selected linesRuns the selected commands.
New History ViewDisplays a new instance of the History view.
Related references10 DS-5 Debug perspectives and views on page 10-198.
10 DS-5 Debug perspectives and views10.13 History view
ARM DUI0446R Copyright © 2010-2014 ARM. All rights reserved. 10-235Non-Confidential

10.14 Memory viewDescribes the view content.
This view enables you to:
• Modify memory content.• Specify the start address for the Memory view, either as an absolute address or as an expression, $pc.
Previous entries are listed in the drop-down list. This list is cleared when you exit Eclipse.• Specify the display size of the Memory view in bytes, either as an offset value from the start address,
or as an address held in a register by dragging and dropping the register from the Registers view intothe Memory view.
• Specify the format of the memory cell values. The default is hexadecimal.• Set the width of the memory cells in the Memory view. The default is four bytes.• Display the ASCII character equivalent of the memory values.• Freeze the selected view to prevent the view being updated by a running target.
Figure 10-16 Memory view
The Memory view only provides the facility to modify how memory is displayed in this view. It is notpossible to specify the use of byte, half-word, word or double read/write instructions to access memoryfrom the Memory view. To control the memory access width you can use:
• the memory command to configure access widths for a region of memory, followed by the x commandto read memory according to those access widths and display the contents
10 DS-5 Debug perspectives and views10.14 Memory view
ARM DUI0446R Copyright © 2010-2014 ARM. All rights reserved. 10-236Non-Confidential

• the memory set command to write to memory with an explicit access width.
Toolbar and context menu options
The following options are available from the toolbar or context menu:
Linked: contextLinks this view to the selected connection in the Debug Control view. This is the default.Alternatively you can link the view to a specific connection. If the connection you want is notshown in the drop-down list you might have to select it first in the Debug Control view.
Back, ForwardNavigates through the history list.
HistoryAddresses and expressions you specify in the Address field are added to the drop down box, andpersist until you clear the history list or exit Eclipse. If you want to keep an expression for lateruse, add it to the Expressions view.
Timed auto refresh is offCannot update
This option opens a dialog box where you can specify refresh intervals:
• If timed auto refresh is off mode is selected, the auto refresh is off.• If the cannot update mode is selected , the auto refresh is blocked.
Display WidthClick to cycle through the memory cell widths in the Memory view, or select a width from thedrop-down menu. The default is four bytes.
FormatClick to cycle through the memory cell formats, or select a format from the drop-down menu.The default is hexadecimal.
Showing characters - click to hide the character displayNot showing characters - click to show the character display
Toggles the display of ASCII character equivalents for the memory values.Address field
Enter the address where you want to start viewing the target memory. Alternatively, you canenter an expression that evaluates to an address. $PC+256.
Addresses and expressions you specify are added to the drop down list, and persist until you exitEclipse. If you want to keep an expression for later use, add it to the Expressions view.
Context menu options are available for editing this field.
Size fieldThe number of bytes to display.
Context menu options are available for editing this field.
SearchSearches through debug information for symbols.
View MenuThe following View Menu options are available:
New Memory ViewDisplays a new instance of the Memory view.
Show TooltipsToggles the display of tooltips on memory cell values.
Byte OrderSelects the byte order of the memory. The default is Auto(LE).
Clear HistoryClears the list of addresses and expressions in the History drop-down box.
Import MemoryReads data from a file and writes it to memory.
10 DS-5 Debug perspectives and views10.14 Memory view
ARM DUI0446R Copyright © 2010-2014 ARM. All rights reserved. 10-237Non-Confidential

Export MemoryReads data from memory and writes it to a file.
Fill MemoryWrites a specific pattern of bytes to memory.
RefreshRefreshes the view.
Freeze DataToggles the freezing of data in the current view. This also disables or enables theAddress and Size fields and the Refresh option.
Editing context menu optionsThe following options are available on the context menu when you select a memory cell value,the Address field, or the Size field for editing:
CutCopies and deletes the selected value.
CopyCopies the selected value.
PastePastes a value that you have previously cut or copied into the selected memory cell orfield.
DeleteDeletes the selected value.
UndoReverts the last change you made to the selected memory cell or field. This is disabledfor the Address field.
Select AllSelects all the address.
Toggle BreakpointSets or removes a breakpoint at the selected address.
Resolve BreakpointResolves a pending breakpoint at the selected address.
Enable BreakpointEnables the breakpoint at the selected address.
Disable BreakpointDisables the breakpoint at the selected address.
Toggle Trace Start PointSets or removes a trace start point at the selected address.
Toggle Trace Stop PointSets or removes a trace stop point at the selected address.
Toggle Trace Trigger PointStarts a trace trigger point at the selected address.
Related concepts6.7 About debugging multi-threaded applications on page 6-146.6.8 About debugging shared libraries on page 6-147.6.9 About debugging a Linux kernel on page 6-149.6.10 About debugging Linux kernel modules on page 6-151.6.12 About debugging TrustZone enabled targets on page 6-154.
Related referencesWorking with data watchpoints.4.8 Setting a tracepoint on page 4-120.4.6 Working with conditional breakpoints on page 4-115.4.6.1 Assigning conditions to an existing breakpoint on page 4-115.4.7 About pending breakpoints and watchpoints on page 4-119.
10 DS-5 Debug perspectives and views10.14 Memory view
ARM DUI0446R Copyright © 2010-2014 ARM. All rights reserved. 10-238Non-Confidential

4.5.5 Exporting DS-5™ breakpoint settings to a file on page 4-113.4.5.4 Importing DS-5™ breakpoint settings from a file on page 4-112.10 DS-5 Debug perspectives and views on page 10-198.
10 DS-5 Debug perspectives and views10.14 Memory view
ARM DUI0446R Copyright © 2010-2014 ARM. All rights reserved. 10-239Non-Confidential

10.15 Modules viewDescribes the view content.
This view is only populated when connected to a Linux target. It enables you to:
• see a tabular view of the shared libraries used by the application• see a tabular view of dynamically loaded Operating System (OS) modules• load and unload debug information for a specific module or shared library.
10 DS-5 Debug perspectives and views10.15 Modules view
ARM DUI0446R Copyright © 2010-2014 ARM. All rights reserved. 10-240Non-Confidential
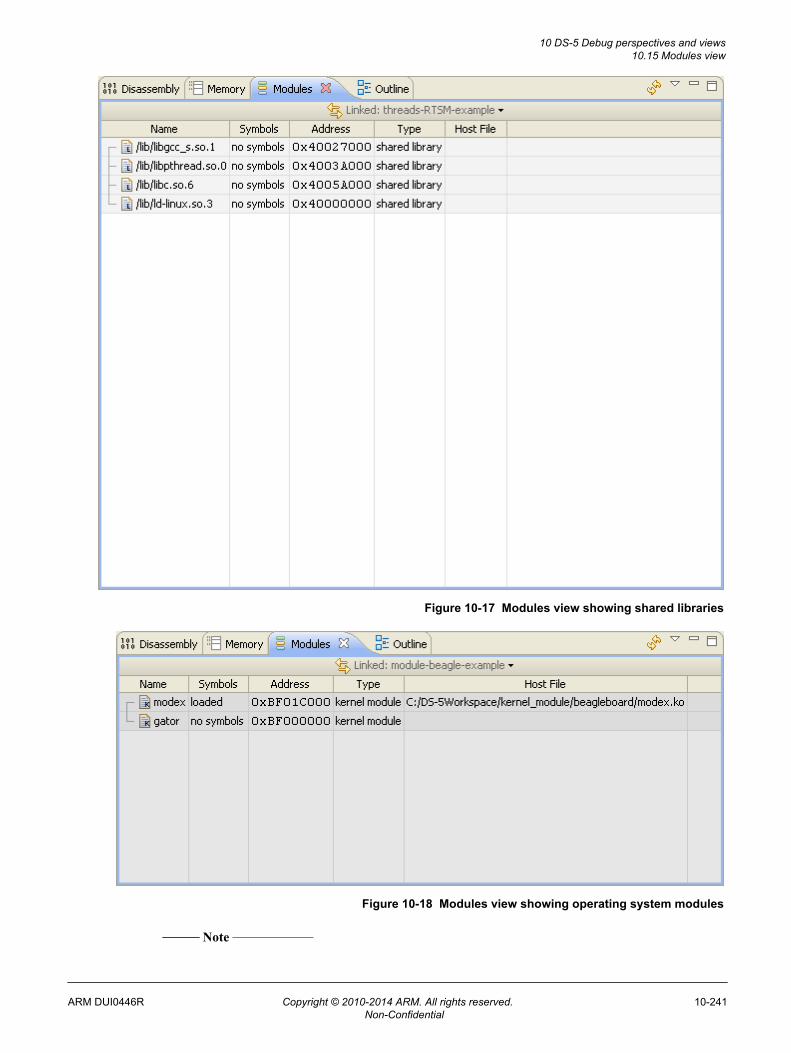
Figure 10-17 Modules view showing shared libraries
Figure 10-18 Modules view showing operating system modules
Note
10 DS-5 Debug perspectives and views10.15 Modules view
ARM DUI0446R Copyright © 2010-2014 ARM. All rights reserved. 10-241Non-Confidential

A connection must be established and OS support enabled within the debugger before a loadable modulecan be detected. OS support is automatically enabled when a Linux kernel image is loaded into thedebugger. However, you can manually control this by using the set os command.
Right-click on the column headers to select the columns that you want displayed:
NameDisplays the name and location of the component on the target.
SymbolsDisplays whether the symbols are currently loaded for each object.
AddressDisplays the load address of the object.
SizeDisplays the size of the object.
KindDisplays the component type. For example, shared library or OS module.
Host FileDisplays the name and location of the component on the host workstation.
The Name, Symbols, Address, Kind, and Host File columns are displayed by default.
Toolbar and context menu options
The following options are available from the toolbar or context menu:
Linked: contextLinks this view to the selected connection in the Debug Control view. This is the default.Alternatively you can link the view to a specific connection. If the connection you want is notshown in the drop-down list you might have to select it first in the Debug Control view.
RefreshRefreshes the view.
CopyCopies the selected data.
Select AllSelects all the displayed data.
Load SymbolsLoads debug information into the debugger from the source file displayed in the Host Filecolumn. This option is disabled if the host file is unknown. before the file is loaded.
Add Symbol File...Opens a dialog box where you can select a file from the host workstation containing the debuginformation required by the debugger.
Discard SymbolsDiscards debug information relating to the selected file.
Show in MemoryDisplays the Memory view starting at the load address of the selected object.
Show in DisassemblyDisplays the Disassembly view starting at the load address of the selected object.
Related concepts6.7 About debugging multi-threaded applications on page 6-146.6.8 About debugging shared libraries on page 6-147.6.9 About debugging a Linux kernel on page 6-149.6.10 About debugging Linux kernel modules on page 6-151.6.12 About debugging TrustZone enabled targets on page 6-154.
Related references10 DS-5 Debug perspectives and views on page 10-198.
10 DS-5 Debug perspectives and views10.15 Modules view
ARM DUI0446R Copyright © 2010-2014 ARM. All rights reserved. 10-242Non-Confidential

10.16 Registers viewDescribes the view content.
This view enables you to:
• See the contents of target registers.• Change the values for registers that have write access. When a register value changes, the register
value background changes to yellow.• Change the display format of register values. The Program Status Registers (PSRs) also enable you
to set the format using individual bits.• Freeze the selected view to prevent the values being updated by a running target.• Drag and drop an address held in a register, such as R3, from the Registers view either into the
Memory view to see the memory at that address, or into the Disassembly view to disassemble fromthat address.
Figure 10-19 Registers view
Right-click on the column headers to select the columns that you want displayed:
NameThe name of the register.
Use $register_name to reference a register. To refer to a register that has bitfields, such as aPSR, specify $register_name.bitfield_name. For example, to print the value of the M bitfieldof $CPSR, enter the following command in the Commands view:
print $CPSR.M$1 = USR
ValueThe value of the register. A shaded background indicates the value has changed.
If you freeze the view, then you cannot change a register value.
TypeThe type of the register value.
CountThe number of array or pointer elements.
10 DS-5 Debug perspectives and views10.16 Registers view
ARM DUI0446R Copyright © 2010-2014 ARM. All rights reserved. 10-243Non-Confidential

SizeThe size of the register in bits.
LocationThe name of the register or the bitmap of the bitfield of a PSR. For example, bitfield M of theCPSR is displayed as $CPSR[0..4].
The Name, Value, and Size columns are displayed by default.
Toolbar and context menu options
The following options are available from the toolbar or context menu:
Linked: contextLinks this view to the selected connection in the Debug Control view. This is the default.Alternatively you can link the view to a specific connection. If the connection you want is notshown in the drop-down list you might have to select it first in the Debug Control view.
SearchSearches the data in the current view for a register.
CopyCopies the selected registers. To copy the bitfields of a PSR, you must first expand the PSR.
This is useful if you want to copy the selected registers to a text editor and compare the valueswhen execution stops at another location.
Select AllSelects all registers currently expanded in the view.
Show Memory Pointed to By register_nameWhere enabled, displays the Memory view starting at the address held in the register.
Show Disassembly Pointed to By register_nameWhere enabled, displays the Disassembly view starting at the address held in the register.
Send to SelectionEnables you to add register filters to an Expression view. Displays a sub menu that enables youto add to a specific Expressions view.
format listA list of formats you can use for the register values. The default is Hexadecimal.
View MenuThe following View Menu options are available:
New Register ViewCreates a new instance of the Registers view.
RefreshRefreshes the view.
Freeze DataToggles the freezing of data in the current view. This also disables or enables theRefresh option.
Editing context menu optionsThe following options are available on the context menu when you select a register value forediting:
CutCopies and deletes the selected value.
CopyCopies the selected value.
PastePastes a value that you have previously cut or copied into the selected register value.
DeleteDeletes the selected value.
UndoReverts the last change you made to the selected value.
10 DS-5 Debug perspectives and views10.16 Registers view
ARM DUI0446R Copyright © 2010-2014 ARM. All rights reserved. 10-244Non-Confidential

Related concepts6.7 About debugging multi-threaded applications on page 6-146.6.8 About debugging shared libraries on page 6-147.6.9 About debugging a Linux kernel on page 6-149.6.10 About debugging Linux kernel modules on page 6-151.6.12 About debugging TrustZone enabled targets on page 6-154.
Related referencesWorking with data watchpoints.4.8 Setting a tracepoint on page 4-120.4.6 Working with conditional breakpoints on page 4-115.4.6.1 Assigning conditions to an existing breakpoint on page 4-115.4.7 About pending breakpoints and watchpoints on page 4-119.4.5.5 Exporting DS-5™ breakpoint settings to a file on page 4-113.4.5.4 Importing DS-5™ breakpoint settings from a file on page 4-112.10 DS-5 Debug perspectives and views on page 10-198.
10 DS-5 Debug perspectives and views10.16 Registers view
ARM DUI0446R Copyright © 2010-2014 ARM. All rights reserved. 10-245Non-Confidential

10.17 OS Data viewUse the OS Data view to display system information about the operating system. For example, tasks,semaphores, mutexes, and mailboxes.
To view the information, select a table from the list.
Figure 10-20 OS Data view (showing Keil CMSIS-RTOS RTX Tasks)
Note
Data in the OS Data view is dependent on the selected data source.
Toolbar and context menu optionsLinked: context
Links this view to the selected connection in the Debug Control view. This is the default.Alternatively you can link the view to a specific connection. If the connection you want is notshown in the drop-down list you might have to select it first in the Debug Control view.
Show linked data in other viewsShows selected data in a view that is linked to another view.
View MenuThis menu contains the following option:
New OS Data ViewDisplays a new instance of the OS Data view.
RefreshRefreshes the view.
Freeze DataToggles the freezing of data in the current view. Also, the value of a variable cannotchange if the data is frozen.
Editing context menu optionsThe following options are available on the context menu when you select a variable value forediting:
CopyCopies the selected value.
Select AllSelects all text.
10 DS-5 Debug perspectives and views10.17 OS Data view
ARM DUI0446R Copyright © 2010-2014 ARM. All rights reserved. 10-246Non-Confidential

10.18 Cache Data viewUse the Cache Data view to examine contents of caches in your system. For example, L1 cache or TLBcache.
By default, the cache is read on demand by the debugger. You can use the Enable reading of CacheRAMs on stop option in the DTSL Configuration Editor dialog to control when cache RAMs are read. Ifthis option is selected, then the cache RAMs are read every time the target stops.
Note
When using the default option, the information presented might be less accurate due to debuggerinteractions with the target. For the most accurate results, select the Enable reading of Cache RAMs onstop option in the DTSL Configuration Editor dialog.
Figure 10-21 Cache Data view (showing L1 TLB cache)
You can either view information about the caches in the Cache Data view or by using the cache listand cache print commands in the Commands view.
Note
Cache awareness is dependent on the exact device and connection method.
10 DS-5 Debug perspectives and views10.18 Cache Data view
ARM DUI0446R Copyright © 2010-2014 ARM. All rights reserved. 10-247Non-Confidential

Toolbar and context menu optionsLinked: context
Links this view to the selected connection in the Cache Data view. This is the default.Alternatively, you can link the view to a specific connection. If the connection you want is notshown in the drop-down list you might have to select it first in the Cache Data view.
Show linked data in other viewsShows selected data in a view that is linked to another view.
View MenuThis menu contains the following option:
New Cache Data ViewDisplays a new instance of the Cache Data view.
RefreshRefreshes the view.
Freeze DataToggles the freezing of data in the current view. Also, the value of a variable cannotchange if the data is frozen.
Editing context menu optionsThe following options are available on the context menu when you right-click a value:
CopyCopies the selected value.
Select AllSelects all text.
Related concepts6.18 About debugging caches on page 6-162.
Related references10.43 DTSL Configuration Editor dialog box on page 10-297.
Related informationDS-5 Debugger cache commands.
10 DS-5 Debug perspectives and views10.18 Cache Data view
ARM DUI0446R Copyright © 2010-2014 ARM. All rights reserved. 10-248Non-Confidential

10.19 Screen viewDescribes the view content.
This view enables you to:
• See the contents of the screen buffer on the target. This view only updates when the target stops.• Set the screen buffer parameters appropriate for the target. :
Figure 10-22 Screen buffer parameters for the Fireworks example running on a BeagleBoard• Freeze the selected view to prevent the screen display being updated by the running target when it
next stops.
10 DS-5 Debug perspectives and views10.19 Screen view
ARM DUI0446R Copyright © 2010-2014 ARM. All rights reserved. 10-249Non-Confidential

Figure 10-23 Screen view
Toolbar options
The following toolbar options are available:
Linked: contextLinks this view to the selected connection in the Debug Control view. This is the default.Alternatively you can link the view to a specific connection. If the connection you want is notshown in the drop-down list you might have to select it first in the Debug Control view.
Timed auto refresh is offCannot update
This option opens a dialog box where you can specify refresh intervals:
• If timed auto refresh is off mode is selected, the auto refresh is off.• If the cannot update mode is selected , the auto refresh is blocked.
RefreshRefreshes the view.
Set Screen Buffer ParametersDisplays the Screen Buffer Parameters dialog box. The dialog box contains the followingparameters:
Base AddressSets the base address of the screen buffer.
Screen WidthSets the width of the screen in pixels.
10 DS-5 Debug perspectives and views10.19 Screen view
ARM DUI0446R Copyright © 2010-2014 ARM. All rights reserved. 10-250Non-Confidential

Screen HeightSets the height of the screen in pixels.
Scan Line AlignmentSets the byte alignment required for each scan line.
Pixel TypeSelects the pixel type.
Pixel Byte OrderSelects the byte order of the pixels within the data.
Click Apply to save the settings and close the dialog box.
Click Cancel to close the dialog box without saving.
Freeze DataToggles the freezing of data in the current view. This also disables or enables the Refreshoption.
New Screen Buffer ViewCreates a new instance of the Screen view.
The Screen view is not visible by default. To add this view:
1. Ensure that you are in the DS-5 Debug perspective.2. Select Window > Show View to open the Show View dialog box.3. Select Screen view.
Related references10 DS-5 Debug perspectives and views on page 10-198.
10 DS-5 Debug perspectives and views10.19 Screen view
ARM DUI0446R Copyright © 2010-2014 ARM. All rights reserved. 10-251Non-Confidential

10.20 Scripts viewDescribes the view content.
This view contains your favorite scripts. You can run, edit, or remove one or more of your favoritescripts. Scripts can be added to this view when you save commands in the History view.
Multiple selections are executed in the order listed in the view. To change the order, remove the scriptsfrom the view and import them in the required order.
Figure 10-24 Scripts view
Note
Default settings for this view are controlled by a DS-5 Debugger setting in the Preferences dialog box.For example, default locations for script files. You can access these settings by selecting Preferencesfrom the Window menu.
Toolbar and context menu options
The following options are available from the toolbar or context menu:
Creates a new scriptCreates a new empty script. To specify the script contents after it is created, select the script andclick Edit Selected Script.
Execute Selected ScriptsRuns the selected scripts. If you select multiple scripts, the debugger runs them in the orderlisted in the Scripts view.
Edit Selected ScriptsEnables you to edit the selected scripts. The scripts are opened in the C/C++ editor view.
Delete Selected ScriptsDeletes the selected scripts from the favorites list. You are also prompted to delete the scriptfrom the file system.
Import Script...Imports a script file and add it to the favorites list.
Script ParametersEnables you to pass parameters to scripts. The parameters can be any combination of fixedstrings and variables including file and folder prompts. Using file and folder prompts, you canselect items within standard file and folder dialogs.
Note
Select a script to enable the Script Parameters button.
10 DS-5 Debug perspectives and views10.20 Scripts view
ARM DUI0446R Copyright © 2010-2014 ARM. All rights reserved. 10-252Non-Confidential

CutCopies and removes the selected script filename. You are also prompted to delete the script fromfile system.
CopyCopies the selected script.
PastePastes a script filename that you have previously cut or copied.
If you deleted the file from the file system as part of a cut operation, the file contents are notrestored. You must edit the file to add new commands.
If you did not delete the file as part of a cut operation, the debugger links the filename to the filein the file system.
DeleteDeletes the selected script from the favorites list. You are also prompted to delete the scriptfrom file system.
Select AllSelects all script files.
Related references10 DS-5 Debug perspectives and views on page 10-198.
10 DS-5 Debug perspectives and views10.20 Scripts view
ARM DUI0446R Copyright © 2010-2014 ARM. All rights reserved. 10-253Non-Confidential

10.21 Target Console viewDescribes the view content.
This view enables you to receive messages from the target setup scripts.
Note
Default settings for this view are controlled by a DS-5 Debugger setting in the Preferences dialog box.For example, default locations for specific files or the maximum number of lines to display. You canaccess these settings by selecting Preferences from the Window menu.
Toolbar and context menu options
The following options are available from the toolbar or context menu:
Linked: contextLinks this view to the selected connection in the Debug Control view. This is the default.Alternatively you can link the view to a specific connection. If the connection you want is notshown in the drop-down list you might have to select it first in the Debug Control view.
Save Console BufferSaves the contents of the Target Console view to a text file.
Clear ConsoleClears the contents of the Target Console view.
Scroll LockEnables or disables the automatic scrolling of messages in the Target Console view.
View MenuThis menu contains the following option:
New Target ConsoleDisplays a new instance of the Target Console view.
Bring to Front for WriteIf enabled, the debugger automatically changes the focus to this view when a targetscript prompts for input.
CopyCopies the selected text.
PastePastes text that you have previously copied.
Select AllSelects all text.
Related references10 DS-5 Debug perspectives and views on page 10-198.
10 DS-5 Debug perspectives and views10.21 Target Console view
ARM DUI0446R Copyright © 2010-2014 ARM. All rights reserved. 10-254Non-Confidential

10.22 Target viewDescribes the view content.
This view enables you to examine the debug capabilities supported by the target, such as:
• breakpoint types supported• reset types supported• memory access types supported.
All capabilities are read-only.
Figure 10-25 Target view
Right-click on the column headers to select the columns that you want displayed:
NameThe name of the target capability.
ValueThe value of the target capability.
KeyThe name of the target capability. This is used by some commands in the Commands view.
DescriptionA brief description of the target capability.
The Name, Value, and Description columns are displayed by default.
The Target view is not visible by default. To add this view:
1. Ensure that you are in the DS-5 Debug perspective.2. Select Window > Show View to open the Show View dialog box.3. Select Target view.
10 DS-5 Debug perspectives and views10.22 Target view
ARM DUI0446R Copyright © 2010-2014 ARM. All rights reserved. 10-255Non-Confidential

Toolbar and context menu options
The following options are available from the toolbar or context menu:
Linked: contextLinks this view to the selected connection in the Debug Control view. This is the default.Alternatively you can link the view to a specific connection. If the connection you want is notshown in the drop-down list you might have to select it first in the Debug Control view.
Refresh the Target CapabilitiesRefreshes the view.
CopyCopies the selected capabilities. To copy the capabilities in a group such as Memorycapabilities, you must first expand that group.
This is useful if you want to copy the selected capabilities to a text editor and save them forfuture reference.
Select AllSelects all capabilities currently expanded in the view.
Related references10 DS-5 Debug perspectives and views on page 10-198.
10 DS-5 Debug perspectives and views10.22 Target view
ARM DUI0446R Copyright © 2010-2014 ARM. All rights reserved. 10-256Non-Confidential
10.23 Trace viewDescribes the view content.
When the trace has been captured the debugger extracts the information from the trace stream anddecompresses it to provide a full disassembly, with symbols, of the executed code.
This view shows a graphical navigation chart that displays function executions with a navigationaltimeline. In addition, the disassembly trace shows function calls with associated addresses and ifselected, instructions. Clicking on a specific time in the chart synchronizes the Disassembly view.
In the left-hand column of the chart, percentages are shown for each function of the total trace. Forexample, if a total of 1000 instructions are executed and 300 of these instructions are associated withmyFunction() then this function is displayed with 30%.
In the navigational timeline, the color coding is a "heat" map showing the executed instructions and theamount of instructions each function executes in each timeline. The darker red color showing moreinstructions and the lighter yellow color showing less instructions. At a scale of 1:1 however, the colorscheme changes to display memory access instructions as a darker red color, branch instructions as amedium orange color, and all the other instructions as a lighter green color.
10 DS-5 Debug perspectives and views10.23 Trace view
ARM DUI0446R Copyright © 2010-2014 ARM. All rights reserved. 10-257Non-Confidential

Figure 10-26 Trace view with a scale of 1:1
The Trace view might not be visible by default. To add this view:
1. Ensure that you are in the DS-5 Debug perspective.2. Select Window > Show View to open the Show View dialog box.3. Select Trace view.
The Trace view contains several tabs:
• Trace tab showing the graphical timeline and disassembly.
Right-click on the column headers to select the columns that you want displayed.
The Breakpoint, Index, Address, Opcode, Info and Disassembly columns are displayed by default.
Toolbar and context menu options
The following options are available from the toolbar or context menu:
10 DS-5 Debug perspectives and views10.23 Trace view
ARM DUI0446R Copyright © 2010-2014 ARM. All rights reserved. 10-258Non-Confidential

Linked: contextLinks this view to the selected connection in the Debug Control view. This is the default.Alternatively you can link the view to a specific connection or processor in an SymmetricMultiProcessing (SMP) connection. If the connection you want is not shown in the drop-downlist you might have to select it first in the Debug Control view.
Show Next MatchMoves the focus of the navigation chart and disassembly trace to the next matching occurrencefor the selected function or instruction.
Show Previous MatchMoves the focus of the navigation chart and disassembly trace to the previous matchingoccurrence for the selected function or instruction.
Don’t mark other occurrences - click to start marking, Mark other occurrences - click to stopmarking
When function trace is selected, marks all occurrences of the selected function with a shadedhighlight. This is disabled when instruction trace is selected.
Clear TraceClears the raw trace data that is currently contained in the trace buffer and the trace view.
Showing instruction trace - click to switch to functions, Showing function trace - click to switch toinstructions
Toggles the disassembly trace between instruction trace or function trace.Export Trace Report
Displays the Export Trace Report dialog box to save the trace data to a file.Home
Where enabled, moves the trace view to the beginning of the trace buffer. Changes might not bevisible if the trace buffer is too small.
Page BackWhere enabled, moves the trace view back one page. You can change the page size bymodifying the Set Maximum Instruction Depth setting.
Page ForwardWhere enabled, moves the trace view forward one page. You can change the page size bymodifying the Set Maximum Instruction Depth setting.
EndWhere enabled, moves the trace view to the end of the trace buffer. Changes might not bevisible if the trace buffer is too small.
Switch between navigation resolutionsChanges the timeline resolution in the navigation chart.
Switch between alternate viewsChanges the view to display the navigation chart, disassembly trace or both.
Focus HereAt the top of the list, displays the function being executed in the selected time slot. Theremaining functions are listed in the order that they are executed after the selected point in time.Any functions that do not appear after that point in time are placed at the bottom and ordered bytotal time.
Order By Total TimeDisplays the functions ordered by the total time spent within the function. This is the defaultordering.
View MenuThe following View Menu options are available:
New Trace ViewDisplays a new instance of the Trace view.
Set Trace Page Size...Displays a dialog box where you can enter the maximum number of instructions todisplay in the disassembly trace. The number must be within the range of one thousandto one million instructions.
Find Trace Trigger EventEnables you to search for trigger events in the trace capture buffer.
10 DS-5 Debug perspectives and views10.23 Trace view
ARM DUI0446R Copyright © 2010-2014 ARM. All rights reserved. 10-259Non-Confidential

Find Timestamp...Displays a dialog box where you can enter either a numeric timestamp as a 64 bit valueor in the h:m:s format.
DTSL Options...Displays a dialog box where you can add, edit or choose a DTSL configuration.
Note
This will clear the trace buffer.
RefreshDiscards all the data in the view and rereads it from the current trace buffer.
Freeze DataToggles the freezing of data in the current view.
Trace Filter Settings...Displays a dialog box where you can select the trace record types that you want to seein the Trace view.
Related references10 DS-5 Debug perspectives and views on page 10-198.
10 DS-5 Debug perspectives and views10.23 Trace view
ARM DUI0446R Copyright © 2010-2014 ARM. All rights reserved. 10-260Non-Confidential

10.24 Trace Control viewUsing the Trace Control view, you can start or stop trace capture, and clear the trace buffer on aspecified trace capture device.
The Trace Control view additionally displays information about the trace capture device, the tracesource used, the status of the trace, and the size of the trace buffer.
Figure 10-27 Trace Control view
The trace capture device and trace sources available in the trace capture device is displayed on the lefthand side of the view. Select any trace source to view additional information. The following informationis displayed in the view:
Trace Capture Device informationTrace Capture Device - The name of the trace capture device.Capture Status - The trace capture status. On when capturing trace data, Off when notcapturing trace data.Trigger Position - The location of the trigger within the buffer.Buffer Size - The capacity of the trace buffer.Buffer Used - The status and amount of trace data currently in the buffer.Buffer Wrapped - The trace buffer capacity and data wraparound status.Persistent Trace - The persistent trace data status.
10 DS-5 Debug perspectives and views10.24 Trace Control view
ARM DUI0446R Copyright © 2010-2014 ARM. All rights reserved. 10-261Non-Confidential

Trace Source informationTrace Source - The name of the selected trace source.Source ID - The unique ID of the selected trace source.Source Encoding - The trace encoding format.Core - The core associated with the trace source.Context IDs - The tracing context IDs availability status.Cycle Accurate Trace - The cycle accurate trace support status.Virtualization Extensions- The virtualization extensions availability status.Timestamps - Timestamp availability status for the trace.Trace Triggers - Trace triggers support status.Trace Start Points - Trace start points support status.Trace Stop Points - Trace stop points support status.Trace Ranges - Trace ranges support status.
Note
The information displayed varies depending on the trace source.
Trace Control view optionsStart Capture
Click Start Capture to start trace capture on the trace capture device. This is the same as thetrace start command.
Stop CaptureClick Stop Capture to stop trace capture on the trace capture device. This is the same as thetrace stop command.
Clear Trace BufferClick Clear Trace Buffer to empty the trace buffer on the trace capture device. This is the sameas the trace clear command.
Automatically start trace capture when target restarts (after a stop)Select this option to automatically start trace capture after a target restarts after a stop.
Automatically stop trace capture when target stopsSelect this option to automatically stop trace capture when a target stops.
Stop trace capture on triggerSelect this option to stop trace capturing after a trace capture trigger has been hit.
Post-trigger capture sizeUse this option to control the percentage of trace buffer that should be reserved for after atrigger point is hit. The range is from 0 to 99.
Note
The trace start and trace stop commands, and the automatic start and stop trace options act asmaster switches. Trace triggers cannot override them.
Toolbar and context menu options
The following options are available from the toolbar or context menu:
Linked: contextLinks this view to the selected connection in the Debug Control view. This is the default.Alternatively you can link the view to a specific connection or processor in an SymmetricMultiProcessing (SMP) connection. If the connection you want is not shown in the drop-downlist, you might have to select it first in the Debug Control view.
10 DS-5 Debug perspectives and views10.24 Trace Control view
ARM DUI0446R Copyright © 2010-2014 ARM. All rights reserved. 10-262Non-Confidential

10.25 Variables viewDescribes the view content.
This view enables you to:
• see the contents of variables that are currently in scope• change the values for variables that are currently in scope• freeze the selected view to prevent the values being updated by a running target.
Figure 10-28 Variables view
Right-click on the column headers to select the columns that you want displayed:
NameThe name of the variable.
ValueThe value of the variable.
Read-only values are displayed with a grey background. Any other color means that you canedit the value.
A value that you can edit is initially shown with a white background. If the value changes, eitherby performing a debug action such as stepping or by you editing the value directly, thebackground changes to yellow.
If you freeze the view, then you cannot change a value.
TypeThe type of the variable.
CountThe number of array or pointer elements.
SizeThe size of the variable in bits.
LocationThe address of the variable.
All columns are displayed by default.
10 DS-5 Debug perspectives and views10.25 Variables view
ARM DUI0446R Copyright © 2010-2014 ARM. All rights reserved. 10-263Non-Confidential

Toolbar and context menu options
The following options are available from the toolbar or context menu:
Linked: contextLinks this view to the selected connection in the Debug Control view. This is the default.Alternatively you can link the view to a specific connection. If the connection you want is notshown in the drop-down list you might have to select it first in the Debug Control view.
SearchSearches the data in the current view for a variable.
CopyCopies the selected variables. To copy the contents of an item such as a structure or an array,you must first expand that item.
This is useful if you want to copy the selected variables to a text editor and compare the valueswhen execution stops at another location.
Select AllSelects all capabilities currently expanded in the view.
Show in MemoryWhere enabled, displays the Memory view with the address set to either:
• the value of the selected variable, if the variable translates to an address, the address of anarray, &name
• the location of the variable, the name of an array, name.
The memory size is set to the size of the variable, using the sizeof keyword.
Show in RegistersIf the selected variable is currently held in a register, then displays the Registers view with thatregister selected. For example, the variable t might be held in register R5.
Show Dereference in MemoryIf the selected variable is a pointer, then displays the Memory view with the address where thevariable is pointing to in memory, selected.
Send to SelectionEnables you to add variable filters to an Expressions view. Displays a sub menu that enablesyou to add to a specific Expressions view.
format listA list of formats you can use for the variable value. The default is Unsigned Decimal.
View MenuThe following View Menu options are available:
New Variable ViewDisplays a new instance of the Variables view.
RefreshRefreshes the view.
Freeze DataToggles the freezing of data in the current view. This also disables or enables theRefresh Variable View option. Also, you cannot modify the value of a variable if thedata is frozen.
If you freeze the data before you expand an item, such as an array, for the first time, theview might show Pending... items. Unfreeze the data to see the items.
Editing context menu optionsThe following options are available on the context menu when you select a variable value forediting:
CutCopies and deletes the selected value.
CopyCopies the selected value.
10 DS-5 Debug perspectives and views10.25 Variables view
ARM DUI0446R Copyright © 2010-2014 ARM. All rights reserved. 10-264Non-Confidential

PastePastes a value that you have previously cut or copied into the selected variable value.
DeleteDeletes the selected value.
UndoReverts the last change you made to the selected value.
Right to left reading orderSets the reading order for the selected variable value to be left or right justified.
Show unicode control charactersShows any unicode control characters in the selected variable value.
Insert unicode control characterSelects the unicode control character to insert into the selected variable value.
Related concepts6.7 About debugging multi-threaded applications on page 6-146.6.8 About debugging shared libraries on page 6-147.6.9 About debugging a Linux kernel on page 6-149.6.10 About debugging Linux kernel modules on page 6-151.6.12 About debugging TrustZone enabled targets on page 6-154.
Related referencesWorking with data watchpoints.4.8 Setting a tracepoint on page 4-120.4.6 Working with conditional breakpoints on page 4-115.4.6.1 Assigning conditions to an existing breakpoint on page 4-115.4.7 About pending breakpoints and watchpoints on page 4-119.4.5.5 Exporting DS-5™ breakpoint settings to a file on page 4-113.4.5.4 Importing DS-5™ breakpoint settings from a file on page 4-112.10 DS-5 Debug perspectives and views on page 10-198.
10 DS-5 Debug perspectives and views10.25 Variables view
ARM DUI0446R Copyright © 2010-2014 ARM. All rights reserved. 10-265Non-Confidential

10.26 Auto Refresh Properties dialog boxDescribes the dialog box content.
The dialog box enables you to modify the update intervals settings.
Refresh Off/BlockedEnables you to modify the stop/block auto refresh.
Update IntervalSpecifies the auto refresh interval in seconds.
Update WhenEnables you to specify when you want auto refresh to update:Running
Refreshes the Memory view while the target is running.Stopped
Refreshes the Memory view while the target is stopped.Always
Always refreshes the Memory view.
Note
When using the Running or Always selections, the Memory and Screen views are only updated if thetarget supports access to that memory when running. For example, some CoreSight targets supportaccess to physical memory at any time via the Debug Access Port (DAP) to the Advanced High-performance Bus Access Port (AHB-AP) bridge. In those cases, add the AHB: prefix to the addressselected in the Memory or Screen views. This type of access bypasses any cache on the CPU core, sothe memory content returned might be different to the value that the core reads.
Figure 10-29 Auto Refresh properties dialog box
10 DS-5 Debug perspectives and views10.26 Auto Refresh Properties dialog box
ARM DUI0446R Copyright © 2010-2014 ARM. All rights reserved. 10-266Non-Confidential

10.27 Memory Exporter dialog boxDescribes the dialog box content.
This dialog box enables you to generate a a text file containing the data from a specific region ofmemory.
Memory BoundsSpecifies the memory region:Start Address
Specifies the start address for the memory.End Address
Specifies the inclusive end address for the memory.Length in Bytes
Specifies the number of bytes.Output Format
Specifies the output format:
• Binary. This is the default.• Intel Hex-32.• Motorola 32-bit (S-records).• Byte oriented hexadecimal (Verilog Memory Model).
Export FilenameEnter the current location of the output file in the field provided or click on:
• File System... to locate the output file in an external folder• Workspace... to locate the output file in a workspace project.
Figure 10-30 Memory Exporter dialog box
10 DS-5 Debug perspectives and views10.27 Memory Exporter dialog box
ARM DUI0446R Copyright © 2010-2014 ARM. All rights reserved. 10-267Non-Confidential

10.28 Memory Importer dialog boxDescribes the dialog box content.
This dialog box enables you to generate a a text file containing the data from a specific region ofmemory.
Offset to Embedded AddressSpecifies an offset that is added to all addresses in the image prior to writing to memory. Someimage formats do not contain embedded addresses and in this case the offset is the absoluteaddress where the image is restored
Memory LimitEnables you to define a specific region of memory that you want to import:
Limit to memory rangeSelect to specify an address range.
StartSpecifies the minimum address that can be written to. Any data prior to this address isnot written. If no address is given then the default is address zero.
EndSpecifies the maximum address that can be written to. Any data after this address is notwritten. If no address is given then the default is the end of the address space.
Import FilenameSelect Import file as binary image if the file format is a binary file.
Enter the current location of the output file in the field provided or click on:
• File System... to locate the output file in an external folder• Workspace... to locate the output file in a workspace project.
Figure 10-31 Memory Importer dialog box
10 DS-5 Debug perspectives and views10.28 Memory Importer dialog box
ARM DUI0446R Copyright © 2010-2014 ARM. All rights reserved. 10-268Non-Confidential

10.29 Fill Memory dialog boxDescribes the dialog box content.
This dialog box enables you to write a specific pattern of bytes to memory.
Memory BoundsSpecifies the memory region:Start Address
Specifies the start address for the memory.End Address
Specifies the inclusive end address for the memory.Length in Bytes
Specifies the number of bytes.Data Pattern
Specifles the fill size and pattern of bytes.Fill size
Specifies the fill size in bytes.Pattern
Enter the specific pattern of bytes.
Figure 10-32 Memory Fill dialog box
10 DS-5 Debug perspectives and views10.29 Fill Memory dialog box
ARM DUI0446R Copyright © 2010-2014 ARM. All rights reserved. 10-269Non-Confidential

10.30 Export trace report dialog boxDescribes the dialog box content.
This dialog box enables you to generate a trace report.
Report NameEnter the report location and name.
Base FilenameEnter the report name.
Output FolderEnter the report folder location.
BrowseSelects the report location in the file system.
Include coreEnables you to add the core name in the report filename.
Include date time stampEnables you to add the date time stamp to the report filename.
Select source for trace reportSelects the required trace data:
Use trace view as report sourceInstructions that are currently visible in the trace view.
Use trace buffer as report sourceTrace data that is currently contained in the trace buffer.
Note
When specifying a range, ensure that the range is large enough otherwise you might notget any trace output. This is due to the trace packing format used in the buffer.
Report FormatConfigures the report:
Output FormatSelects the output format.
Include column headersEnables you to add column headers in the first line of the report.
Select columns to exportEnables you to filter the trace data in the report.
Record FiltersEnables or disables trace filters.
Check AllEnables you to select all the trace filters.
Uncheck AllEnables you to unselect all the trace filters.
10 DS-5 Debug perspectives and views10.30 Export trace report dialog box
ARM DUI0446R Copyright © 2010-2014 ARM. All rights reserved. 10-270Non-Confidential

Figure 10-33 Export trace report dialog box
10 DS-5 Debug perspectives and views10.30 Export trace report dialog box
ARM DUI0446R Copyright © 2010-2014 ARM. All rights reserved. 10-271Non-Confidential

10.31 Breakpoint properties dialog boxDescribes the dialog box content.
This dialog box enables you to:
• display the properties of a selected breakpoint• set a conditional expression for a specific breakpoint• set an ignore counter for a specific breakpoint• specify a script file to run when the selected breakpoint is hit• enable the debugger to automatically continue running on completion of all the breakpoint actions• assign a breakpoint action to a specific thread or processor, if available.
10 DS-5 Debug perspectives and views10.31 Breakpoint properties dialog box
ARM DUI0446R Copyright © 2010-2014 ARM. All rights reserved. 10-272Non-Confidential

Figure 10-34 Breakpoint properties dialog box
Breakpoint information
The breakpoint information shows the basic properties of a breakpoint:
10 DS-5 Debug perspectives and views10.31 Breakpoint properties dialog box
ARM DUI0446R Copyright © 2010-2014 ARM. All rights reserved. 10-273Non-Confidential

DescriptionA description of the breakpoint as displayed in the Breakpoints view. This comprises:
• The name of the function in which the breakpoint is set and the number of bytes from thestart of the function. For example, accumulate()+52 shows that the breakpoint is 52 bytesfrom the start of the accumulate() function.
• If the source file is available, the file name and line number in the file where the breakpointis set, threads.c:115.
• A breakpoint ID number, #N. In some cases, such as in a for loop, a breakpoint mightcomprise a number of sub-breakpoints. These are identified as N.n, where N is the number ofthe parent. The description of a sub-breakpoint in this dialog box is shown as
main()+132sub-breakpoint ofmain()+132 @ threads.c:56 [#14 ARM] (threads)
• The type of instruction at the address of the breakpoint, ARM or Thumb.• An ignore count, if set. The display format is:
ignore = num/count
num equals count initially, and decrements on each pass until it reaches zero.
count is the value you have specified for the ignore count.• A hits count that increments each time the breakpoint is hit. This is not displayed until the
first hit. If you set an ignore count, hits count does not start incrementing until the ignorecount reaches zero.
• The stop condition you have specified, (i==3).• The name of the image.
:
accumulate()+52 @ threads.c:115 [#1 ARM, ignore = 3/3, 3 hits, (i==3)] (threads)
LocationThe location of the source file containing the address where the breakpoint is set, for example:
C:/Myprojects/Eclipse/workspace_ds5/threads/threads.c:115.0
If no source file is available, then Unknown is displayed.
TypeThis shows:
• whether or not the source file is available for the code at the breakpoint address, SourceLevel if available or Address Level if not available
• if the breakpoint is on code in a shared object, Auto indicates that the breakpoint isautomatically set when that shared object is loaded
• if the breakpoint is Active, the type of breakpoint, either Software Breakpoint orHardware Breakpoint
• the type of instruction at the address of the breakpoint, ARM or Thumb.
:
Source Level Software Breakpoint [ARM]
StateIndicates one of the following:
ActiveThe image or shared object containing the address of the breakpoint is loaded, and thebreakpoint is set.
No ConnectionThe breakpoint is in an application on a target that is not connected.
10 DS-5 Debug perspectives and views10.31 Breakpoint properties dialog box
ARM DUI0446R Copyright © 2010-2014 ARM. All rights reserved. 10-274Non-Confidential

PendingThe image or shared object containing the address of the breakpoint has not yet beenloaded. The breakpoint becomes active when the image or shared object is loaded.
AddressA dialog box that displays one or more breakpoint or sub-breakpoint addresses with check boxeswhere you can enable or disable them.
TemporaryShows true if this is a temporary breakpoint. Otherwise, shows false.
Breakpoint options
The following options are available for you to set:
Stop ConditionSpecify a C-style conditional expression for the selected breakpoint. For example, to activate thebreakpoint when the value of x equals 10, specify x==10.
Ignore CountSpecify the number of times the selected breakpoint is ignored before it is activated.
The debugger decrements the counter on each pass until it reaches zero, for example:
main()+140 @ threads.c:51 [#1 ARM, ignore = 2/3] (threads)
When the value reaches zero the breakpoint activates. Each subsequent pass causes thebreakpoint to activate.
Select the Reset Ignore Count option from the context menu to reset the counter to the valueyou have set and delay activation again.
On break, run scriptSpecify a script file to run when the selected breakpoint is activated.
Note
Take care with the commands you use in a script that is attached to a breakpoint. For example, ifyou use the quit command in a script, the debugger disconnects from the target when thebreakpoint is hit.
Continue ExecutionSelect this option if you want to continue running the target after the breakpoint is activated.
SilentControls the printing of stop messages for the selected breakpoint.
Break on Selected Threads or CoresSelect this option if you want to set a breakpoint for a specific thread or processor. This optionis disabled if none are available.
When a breakpoint activates, the debugger does the following:
• displays a message in the Commands view, for example:
Execution stopped at breakpoint 1: 0x00008850In thread 1 (OS thread id 1078)0x00008850 51,0 thread_app_data[t].thread = t;
• increments a hit count for the breakpoint, for example:
main()+140 @ threads.c:51 [#1 ARM, ignore = 0/3, 2 hits] (threads)
10 DS-5 Debug perspectives and views10.31 Breakpoint properties dialog box
ARM DUI0446R Copyright © 2010-2014 ARM. All rights reserved. 10-275Non-Confidential

10.32 Watchpoint properties dialog boxDescribes the dialog box content.
This dialog box enables you to:
• display the properties of a selected watchpoint• change the watchpoint type.
Figure 10-35 Watchpoint properties dialog box
The following types are available:
READThe debugger stops the target when the memory is read
WRITEThe debugger stops the target when the memory is written
ACCESSThe debugger stops the target when the memory is read or written.
10 DS-5 Debug perspectives and views10.32 Watchpoint properties dialog box
ARM DUI0446R Copyright © 2010-2014 ARM. All rights reserved. 10-276Non-Confidential

10.33 Tracepoint properties dialog boxDescribes the dialog box content.
This dialog box enables you to display the properties of a selected tracepoint.
Figure 10-36 Tracepoint properties dialog box
The following types are available:
Trace Start PointEnables trace capture when it is hit.
Trace Stop PointDisables trace capture when it is hit.
Trace Trigger PointStarts trace capture when it is hit.
Note
Tracepoint behavior might vary depending on the selected target.
10 DS-5 Debug perspectives and views10.33 Tracepoint properties dialog box
ARM DUI0446R Copyright © 2010-2014 ARM. All rights reserved. 10-277Non-Confidential

10.34 Manage Signals dialog boxDescribes the dialog box content.
This dialog box enables you to control the handler (vector catch) settings for one or more signals orprocessor exceptions. When a signal or processor exception occurs you can choose to stop execution,print a message, or both. Stop and Print are selected for all signals by default.
Note
When connected to an application running on a remote target using gdbserver, the debugger handlesUnix signals but on bare-metal targets with no operating system it handles processor exceptions.
10 DS-5 Debug perspectives and views10.34 Manage Signals dialog box
ARM DUI0446R Copyright © 2010-2014 ARM. All rights reserved. 10-278Non-Confidential

Figure 10-37 Managing signal handler settings
Figure 10-38 Manage exception handler settings
10 DS-5 Debug perspectives and views10.34 Manage Signals dialog box
ARM DUI0446R Copyright © 2010-2014 ARM. All rights reserved. 10-279Non-Confidential

10.35 Functions Filter dialog boxDescribes the dialog box content.
This dialog box enables you to filter the list of symbols that are displayed in the Functions view.
Figure 10-39 Function filter dialog box
10 DS-5 Debug perspectives and views10.35 Functions Filter dialog box
ARM DUI0446R Copyright © 2010-2014 ARM. All rights reserved. 10-280Non-Confidential

10.36 Jython Script Parameters dialog boxDescribes the dialog box content.
This dialog box enables you to specify script parameters.
Script ParametersEnter parameters for the selected script in the text field. Parameters must be space delimited.
Variables...This button opens the Select Variable dialog box where you can select variables that are passedto the application when the debug session starts. For more information on Eclipse variables, usethe dynamic help.
OKSaves the current parameters and closes the Jython Script Parameters dialog box.
CancelCloses the Jython Script Parameters dialog box without saving the parameters.
Figure 10-40 Jython Script Parameters dialog box
10 DS-5 Debug perspectives and views10.36 Jython Script Parameters dialog box
ARM DUI0446R Copyright © 2010-2014 ARM. All rights reserved. 10-281Non-Confidential

10.37 Debug Configurations - Connection tabThe Connection tab in the Debug Configurations dialog box enables you to configure DS-5 Debuggertarget connections. Each configuration you create is associated with a single target processor.
If the development platform has multiple processors, then you must create a separate configuration foreach processor. Be aware that when connecting to multiple targets you cannot perform synchronizationor cross-triggering operations.
Note
Options in the Connection tab are dependent on the type of platform that you select.
Select targetThese options enable you to select the target manufacturer, board, project type, and debugoperation.
DTSL OptionsSelect Edit... to open a dialog box to configure additional debug and trace settings.
ConnectionsThese options enable you to configure the connection between the debugger and the target:
RSE connectionA list of Remote Systems Explorer (RSE) configurations that you have previously setup. Select the required RSE configuration that you want to use for this debugconfiguration.
Android devicesA list of Android devices that you have previously configured. Select the requireddevice that you want to use for this debug configuration.
Connect as rootSelect to give root access when starting gdbserver. This option is dependent on theselected debug operation and might not be available.
gdbserver (TCP)Specify the target IP address or name and the associated port number for the connectionbetween the debugger and gdbserver.
The following options might also be available, depending on the debug operation youselected:
• Select the Use Extended Mode checkbox if you want to restart an application underdebug. Be aware that this might not be fully implemented by gdbserver on alltargets.
• Select the Terminate gdbserver on disconnect checkbox to terminate gdbserverwhen you disconnect from the target.
• Select the Use RSE Host checkbox to connect to gdbserver using the RSEconfigured host.
gdbserver (serial)Specify the local serial port and connection speed for the serial connection between thedebugger and gdbserver.
For model connections, details for gdbserver are obtained automatically from thetarget.
Select the Use Extended Mode checkbox if you want to restart an application underdebug. Be aware that this might not be fully implemented by gdbserver on all targets.
Bare Metal DebugSpecify the target IP address or name of the debug hardware adapter. You can alsoclick on Browse... to display all the available debug hardware adapters on your localsubnet or USB connections.
10 DS-5 Debug perspectives and views10.37 Debug Configurations - Connection tab
ARM DUI0446R Copyright © 2010-2014 ARM. All rights reserved. 10-282Non-Confidential

Model parametersSpecify the parameter for launching the model.
Model parameters (pre-configured to boot ARM Embedded application)These options are only enabled for the pre-configured option that boots an ARM EmbeddedFixed Virtual Platform.
You can configure a Virtual File System (VFS) that enables a model to run an application andrelated shared library files from a directory on the local host. Alternatively, you can disable VFSand manually transfer the files to a directory on the model.
Enable virtual file system supportEnable or disable the use of Virtual File System (VFS).
Host mount pointSpecify the location of the file system on the local host. You can:
• Enter the location in the field provided.• Click File System... to locate the directory in an external location from the
workspace.• Click Workspace... to locate the directory within your workspace.
Remote target mount pointDisplays the default location of the file system on the model. The default is the /writeable directory.
ApplySave the current configuration. This does not connect to the target.
RevertUndo any changes and revert to the last saved configuration.
DebugConnect to the target and close the Debug Configurations dialog box.
CloseClose the Debug Configurations dialog box.
10 DS-5 Debug perspectives and views10.37 Debug Configurations - Connection tab
ARM DUI0446R Copyright © 2010-2014 ARM. All rights reserved. 10-283Non-Confidential

Figure 10-41 Connection tab (Shown with connection configuration for an FVP with virtual filesystem support enabled)
10 DS-5 Debug perspectives and views10.37 Debug Configurations - Connection tab
ARM DUI0446R Copyright © 2010-2014 ARM. All rights reserved. 10-284Non-Confidential

10.38 Debug Configurations - Files tabThe Files tab in the Debug Configurations dialog box enables you to select debug versions of theapplication file and libraries on the host that you want the debugger to use.
You can also specify the target file system folder to which files can be transferred if required.
Note
Options in the Files tab depend on the type of platform and debug operation that you select.
FilesThese options enable you to configure the target file system and select files on the host that youwant to download to the target or use by the debugger. The Files tab options available for eachDebug operation are:
Table 10-1 Files tab options available for each Debug operation
Download and
debugapplication
Debug target
residentapplication
Connect toalready
runninggdbserver
Debug viaDSTREAM\RVI
Debug andETB Trace viaDSTREAM\RVI
Application on host todownload
Yes - - Yes Yes
Application on target - Yes - - -
Target downloaddirectory
Yes - - - -
Target workingdirectory
Yes Yes - - -
Load symbols from file Yes Yes Yes Yes Yes
Other file on host todownload
Yes - - - -
Path to target systemroot directory
Yes Yes Yes - -
ApplySave the current configuration. This does not connect to the target.
RevertUndo any changes and revert to the last saved configuration.
DebugConnect to the target and close the Debug Configurations dialog box.
CloseClose the Debug Configurations dialog box.
10 DS-5 Debug perspectives and views10.38 Debug Configurations - Files tab
ARM DUI0446R Copyright © 2010-2014 ARM. All rights reserved. 10-285Non-Confidential

Figure 10-42 Files tab (Shown with file system configuration for an application on an FVP)
Files options summary
The Files options available depend on the debug operation you selected on the Connection tab. Thepossible options are:
Application on host to downloadSpecify the application image file on the host that you want to download to the target:
• Enter the host location and file name in the field provided.• Click on File System... to locate the file in an external directory from the Eclipse workspace.• Click on Workspace... to locate the file in an project directory or sub-directory within the
Eclipse workspace.
For example, to download the stripped (no debug) Gnometris application image select thegnometris/stripped/gnometris file.
Select Load symbols to load the debug symbols from the specified image.
Select Enable on-demand loading to specify how you want the debugger to load debuginformation. Enabling this option can provide a faster load and use less memory but debuggingmight be slower.
Project directorySpecify the Android project directory on the host:
• Enter the host location in the field provided.• Click on File System... to locate the project directory in an external location from the
Eclipse workspace.• Click on Workspace... to locate the project directory from within the Eclipse workspace.
10 DS-5 Debug perspectives and views10.38 Debug Configurations - Files tab
ARM DUI0446R Copyright © 2010-2014 ARM. All rights reserved. 10-286Non-Confidential

APK fileSpecify the Android APK file on the host that you want to download to the target:
• Cnter the host location and file name in the field provided.• Click on File System... to locate the file in an external directory from the Eclipse workspace.• Click on Workspace... to locate the file in an project directory or sub-directory within the
Eclipse workspace.
ProcessThis field is automatically populated from the AndroidManifest.xml file.
ActivityThis field is automatically populated from the AndroidManifest.xml file.
Application on targetSpecify the location of the application on the target. gdbserver uses this to launch theapplication.
For example, to use the stripped (no debug) Gnometris application image when using a modeland VFS is configured to mount the host workspace as /writeable on the target, specify thefollowing in the field provided:
/writeable/gnometris/stripped/gnometris.
Target download directoryIf the target has a preloaded image, then you might have to specify the location of thecorresponding image on your host.
The debugger uses the location of the application image on the target as the default currentworking directory. To change the default setting for the application that you are debugging,enter the location in the field provided. The current working directory is used whenever theapplication references a file using a relative path.
Load symbolsSpecify the application image containing the debug information to load:
• Enter the host location and file name in the field provided.• Click on File System... to locate the file in an external directory from the workspace.• Click on Workspace... to locate the file in a project directory or sub-directory within the
workspace.
For example, to load the debug version of Gnometris you must select the gnometris applicationimage that is available in the gnometris project root directory.
Although you can specify shared library files here, the usual method is to specify a path to yourshared libraries with the Shared library search directory option on the Debugger tab.
Note
Load symbols is enabled by default.
Add peripheral description files from directoryA directory with configuration files defining peripherals that must be added before connectingto the target.
Other file on host to downloadSpecify other files that you want to download to the target:
• Enter the host location and file name in the field provided.• Click on File System... to locate the file in an external directory from the workspace.• Click on Workspace... to locate the file in a project directory or sub-directory within the
workspace.
For example, to download the stripped (no debug) Gnometris shared library to the target you canselect the gnometris/stripped/libgames-support.so file.
10 DS-5 Debug perspectives and views10.38 Debug Configurations - Files tab
ARM DUI0446R Copyright © 2010-2014 ARM. All rights reserved. 10-287Non-Confidential

Path to target system root directorySpecifies the system root directory to search for shared library symbols.
The debugger uses this directory to search for a copy of the debug versions of target sharedlibraries. The system root on the host workstation must contain an exact representation of thelibraries on the target root filesystem.
Target working directoryIf this field is not specified, the debugger uses the location of the application image on the targetas the default current working directory. To change the default setting for the application thatyou are debugging, enter the location in the field provided. The current working directory isused whenever the application refers to a file using a relative path.
Remove this resource from the listTo remove a resource from the configuration settings, click this button next to the resource thatyou want to remove.
Add a new resource to the listTo add a new resource to the file settings, click this button and then configure the options asrequired.
Related concepts6.9 About debugging a Linux kernel on page 6-149.
10 DS-5 Debug perspectives and views10.38 Debug Configurations - Files tab
ARM DUI0446R Copyright © 2010-2014 ARM. All rights reserved. 10-288Non-Confidential

10.39 Debug Configurations - Debugger tabThe Debugger tab in the Debug Configurations dialog box enables you to specify the actions that youwant the debugger to do after connection to the target.
Run ControlThese options enable you to define the running state of the target when you connect:
Connect onlyConnect to the target, but do not run the application.
Note
The PC register is not set and pending breakpoints or watchpoints are subsequentlydisabled when a connection is established.
Debug from entry pointRun the application when a connection is established, then stop at the image entrypoint.
Debug from symbolRun the application when a connection is established, then stop at the address of thespecified symbol. The debugger must be able to resolve the symbol. If you specify a Cor C++ function name, then do not use the () suffix.
If the symbol can be resolved, execution stops at the address of that symbol.
If the symbol cannot be resolved, a message is displayed in the Commands viewwarning that the symbol cannot be found. The debugger then attempts to stop at theimage entry point.
Run target initialization debugger script (.ds)Select this option to execute target initialization scripts (a file containing debuggercommands) immediately after connection. To select a file:
• Enter the location and file name in the field provided.• Click on File System... to locate the file in an external directory from the
workspace.• Click on Workspace... to locate the file in a project directory or sub-directory
within the workspace.
Run debug initialization debugger script (.ds)Select this option to execute debug initialization scripts (a file containing debuggercommands) after execution of any target initialization scripts and also running to animage entry point or symbol, if selected. To select a file:
• Enter the location and file name in the field provided.• Click on File System... to locate the file in an external directory from the
workspace.• Click on Workspace... to locate the file in a project directory or sub-directory
within the workspace.
Note
You might have to insert a wait command before a run or continue command toenable the debugger to connect and run the application to the specified function.
Execute debugger commandsEnter debugger commands in the field provided if you want to automatically executespecific debugger commands that run on completion of any initialization scripts. Eachline must contain only one debugger command.
10 DS-5 Debug perspectives and views10.39 Debug Configurations - Debugger tab
ARM DUI0446R Copyright © 2010-2014 ARM. All rights reserved. 10-289Non-Confidential

Host working directoryThe debugger uses the Eclipse workspace as the default working directory on the host.To change the default setting for the application that you are debugging, deselect theUse default check box and then:
• Enter the location in the field provided.• Click on File System... to locate the external directory.• Click on Workspace... to locate the project directory.
PathsYou can modify the search paths on the host used by the debugger when it displays source code.
Source search directorySpecify a directory to search for source files:
• Enter the location and file name in the field provided.• Click on File System... to locate the directory in an external location from the
workspace.• Click on Workspace... to locate the directory within the workspace.
Shared library search directorySpecify a directory to search for shared libraries:
• Enter the location in the field provided.• Click on File System... to locate the directory in an external location from the
workspace.• Click on Workspace... to locate the directory within the workspace.
Remove this resource from the listTo remove a search path from the configuration settings, click this button next to theresource that you want to remove.
Add a new resource to the listTo add a new search path to the configuration settings, click this button and thenconfigure the options as required.
ApplySave the current configuration. This does not connect to the target.
RevertUndo any changes and revert to the last saved configuration.
DebugConnect to the target and close the Debug Configurations dialog box.
CloseClose the Debug Configurations dialog box.
10 DS-5 Debug perspectives and views10.39 Debug Configurations - Debugger tab
ARM DUI0446R Copyright © 2010-2014 ARM. All rights reserved. 10-290Non-Confidential

Figure 10-43 Debugger tab (Shown with settings for application starting point and search paths)
Related concepts6.9 About debugging a Linux kernel on page 6-149.
10 DS-5 Debug perspectives and views10.39 Debug Configurations - Debugger tab
ARM DUI0446R Copyright © 2010-2014 ARM. All rights reserved. 10-291Non-Confidential

10.40 Debug Configurations - OS Awareness tabThe OS Awareness tab in the Debug Configurations dialog box enables you to inform the debugger ofthe Operating system (OS) the target is running. This enables the debugger to provide additionalfunctionality specific to the selected OS.
Multiple options are available in the drop-down box and its content is controlled by the selected platformand connection type in the Connection tab. OS awareness depends on having debug symbols for the OSloaded within the debugger.
Note
Linux OS awareness is not currently available in this tab, and remains in the Connection tab as aseparate debug operation.
Figure 10-44 OS Awareness tab
10 DS-5 Debug perspectives and views10.40 Debug Configurations - OS Awareness tab
ARM DUI0446R Copyright © 2010-2014 ARM. All rights reserved. 10-292Non-Confidential

10.41 Debug Configurations - Arguments tabIf your application accepts command-line arguments to main(), using the Arguments tab in the DebugConfigurations dialog box, you can specify the values to pass to the application when execution starts.
The Arguments tab contains the following elements:
Note
These settings only apply if the target supports semihosting and they cannot be changed while the targetis running.
Program ArgumentsThis panel enables you to enter the arguments. Arguments are passed to the target applicationunmodified except when the text is an eclipse argument variable of the form ${var_name}where Eclipse replaces it with the related value.
For a Linux target, you might have to escape some characters using a backslash (\)character.For example, the @, (, ), ", and # characters must be escaped.
Variables...This button opens the Select Variable dialog box where you can select variables that are passedto the application when the debug session starts. For more information on variables, use thedynamic help.
ApplySave the current configuration. This does not connect to the target.
RevertUndo any changes and revert to the last saved configuration.
DebugConnect to the target and close the Debug Configurations dialog box.
CloseClose the Debug Configurations dialog box.
10 DS-5 Debug perspectives and views10.41 Debug Configurations - Arguments tab
ARM DUI0446R Copyright © 2010-2014 ARM. All rights reserved. 10-293Non-Confidential

Figure 10-45 Arguments tab
Related references4.3 About passing arguments to main() on page 4-106.7.1 About semihosting and top of memory on page 7-166.7.2 Working with semihosting on page 7-168.7.3 Enabling automatic semihosting support in the debugger on page 7-169.7.4 Controlling semihosting messages using the command-line console on page 7-170.
Related informationDS-5 Debugger commands.
10 DS-5 Debug perspectives and views10.41 Debug Configurations - Arguments tab
ARM DUI0446R Copyright © 2010-2014 ARM. All rights reserved. 10-294Non-Confidential

10.42 Debug Configurations - Environment tabThe Environment tab in the Debug Configurations dialog box enables you to create and configure thetarget environment variables that are passed to the application when the debug session starts.
The Environment tab contains the following elements:
Note
The settings in this tab are not used for connections that use the Connect to already running gdbserverdebug operation.
Target environment variables to setThis panel displays the current target environment variables in use by the debugger.
New...This button opens the New Environment Variable dialog box where you can create a new targetenvironment variable.
For example, to debug the Gnometris application on a model you must create a targetenvironment variable for the DISPLAY setting.
Figure 10-46 New Environment Variable dialog box
Edit...This button opens the Edit Environment Variable dialog box where you can edit the propertiesfor the selected target environment variable.
RemoveThis button removes the select target environment variables from the list.
ApplySave the current configuration. This does not connect to the target.
RevertUndo any changes and revert to the last saved configuration.
DebugConnect to the target and close the Debug Configurations dialog box.
CloseClose the Debug Configurations dialog box.
10 DS-5 Debug perspectives and views10.42 Debug Configurations - Environment tab
ARM DUI0446R Copyright © 2010-2014 ARM. All rights reserved. 10-295Non-Confidential

Figure 10-47 Environment tab (Shown with environment variables configured for an FVP)
10 DS-5 Debug perspectives and views10.42 Debug Configurations - Environment tab
ARM DUI0446R Copyright © 2010-2014 ARM. All rights reserved. 10-296Non-Confidential

10.43 DTSL Configuration Editor dialog boxThe Debug and Trace Services Layer (DTSL) Configuration Editor enables you to configure additionaldebug and trace settings. The available configuration options depend on the capabilities of the target, andtypically enable configuration of the trace collection method and the trace that is generated.
A typical set of configuration options might include:
Trace capture methodSelect the collection method that you want to use for this debug configuration. The availabletrace collection methods depend on the target and trace capture unit but can include EmbeddedTrace Buffer (ETB)/Micro Trace Buffer (MTB) (trace collected from an on-chip buffer) orDSTREAM (trace collected from the DSTREAM trace buffer). If no trace collection method isselected then no trace can be collected, even if the trace capture for processors and InstructionTrace Macrocell (ITM) are enabled.
Enable core traceEnable or disable trace collection. If enabled then the following options are available:
Enable core n traceSpecify trace capture for specific processors.
Cycle accurateEnable or disable cycle accurate trace.
Trace capture rangeSpecify an address range to limit the trace capture.
Enable ITM traceEnable or disable trace collection from the ITM unit.
Named DTSL configuration profiles can be saved for later use.
Figure 10-48 DTSL Configuration Editor (Shown with Trace capture method set to DSTREAM )
Related concepts6.18 About debugging caches on page 6-162.
10 DS-5 Debug perspectives and views10.43 DTSL Configuration Editor dialog box
ARM DUI0446R Copyright © 2010-2014 ARM. All rights reserved. 10-297Non-Confidential

Related references10.18 Cache Data view on page 10-247.
Related informationDS-5 Debugger cache commands.
10 DS-5 Debug perspectives and views10.43 DTSL Configuration Editor dialog box
ARM DUI0446R Copyright © 2010-2014 ARM. All rights reserved. 10-298Non-Confidential

10.44 Configuration database panelDescribes the dialog box content.
This panel enables you to manage the configuration database settings.
Default Target DatabaseProvides you with the default DS-5 configuration databases.
Note
ARM recommends that you do not disable these.
User Target DatabaseEnables you to add your own configuration database.
Add...Opens a dialog box where you can select the new configuration database folder.
EditOpens a dialog box where you can modify the existing name and location for theselected configuration database.
RemoveRemoves the selected configuration database.
UpMoves the selected configuration database up the list.
DownMoves the selected configuration database down the list.
Note
Databases process from top to bottom with information in the lower databases replacinginformation in higher databases. For example, if you produced a modified coredefinition with different registers, you would add it to the database at the bottom of thelist so that the database uses it instead of the core definitions in the shipped database.
Rebuild database...Rebuild the configuration database.
Restore DefaultsRemoves all the configuration databases from the field text that do not belong to the DS-5default system.
ApplySaves the current configuration database configuration settings.
10 DS-5 Debug perspectives and views10.44 Configuration database panel
ARM DUI0446R Copyright © 2010-2014 ARM. All rights reserved. 10-299Non-Confidential

Figure 10-49 Configuration Database panel
Related concepts2.10 About the target configuration import utility on page 2-54.
Related tasks2.11 Adding a new platform on page 2-56.2.12 Adding a new configuration database to DS-5 on page 2-58.
10 DS-5 Debug perspectives and views10.44 Configuration database panel
ARM DUI0446R Copyright © 2010-2014 ARM. All rights reserved. 10-300Non-Confidential

10.45 About the Remote System ExplorerDescribes the tab content.
The Remote Systems Explorer (RSE) enables you to:
• set up Linux SSH connections to remote targets using TCP/IP• create, copy, delete, and rename resources• set the read, write, and execute permissions for resources• edit files by double-clicking to open in the C/C++ editor view• execute commands on the remote target• view and kill running processes• transfer files between the host workstation and remote targets• launch terminal views.
Useful RSE views that can be added to the DS-5 Debug perspective are:
• Remote Systems• Remote System Details• Remote Scratchpad• Terminals.
To add a view to the DS-5 Debug perspective:
1. Ensure that you are in the DS-5 perspective. You can change perspective by using the perspectivetoolbar or you can select Window > Open perspective from the main menu.
2. Select Window > Show View > Other... to open the Show View dialog box.3. Select the required view from the Remote Systems group.4. Click OK.
10 DS-5 Debug perspectives and views10.45 About the Remote System Explorer
ARM DUI0446R Copyright © 2010-2014 ARM. All rights reserved. 10-301Non-Confidential

10.46 Remote Systems viewDescribes the tab content.
This hierarchical tree view enables you to:
• set up a Linux connection to a remote target using the Secure SHell (SSH) protocol• access resources on the host workstation and remote targets• display a selected file in the C/C++ editor view• open the Remote System Details view and show the selected connection configuration details in a
table• open the Remote Monitor view and show the selected connection configuration details• import and export the selected connection configuration details• connect to the selected target• delete all passwords for the selected connection• open the Properties dialog box and display the current connection details for the selected target.
Figure 10-50 Remote Systems view
10 DS-5 Debug perspectives and views10.46 Remote Systems view
ARM DUI0446R Copyright © 2010-2014 ARM. All rights reserved. 10-302Non-Confidential

10.47 Remote System Details viewDescribes the tab content.
This tabular view enables you to:
• set up a Linux connection to a remote target using the Secure SHell (SSH) protocol• access resources on the host workstation and remote targets• display a selected file in the C/C++ editor view• open the Remote Systems view and show the selected connection configuration details in a
hierarchical tree• open the Remote Monitor view and show the selected connection configuration details• import and export the selected connection configuration details• connect to the selected target• delete all passwords for the selected connection• open the Properties dialog box and display the current connection details for the selected target.
Figure 10-51 Remote System Details view
The Remote System Details view is not visible by default. To add this view:
1. Select Window > Show View > Other... to open the Show View dialog box.2. Expand the Remote Systems group and select Remote System Details.3. Click OK.
10 DS-5 Debug perspectives and views10.47 Remote System Details view
ARM DUI0446R Copyright © 2010-2014 ARM. All rights reserved. 10-303Non-Confidential

10.48 Target management terminal for serial and SSH connectionsDescribes the tab content.
The target management terminal enables you to enter shell commands directly on the target withoutlaunching any external application. For example you can browse remote files and folders by entering thels or pwd commands in the same way as you would in a Linux terminal.
Figure 10-52 Terminal view
The Terminal view is not visible by default. To add this view:
1. Select Window > Show View > Other... to open the Show View dialog box.2. Expand the Terminal group and select Terminal3. Click OK.4. In the Terminal view, click on the Settings5. Select the required connection type.6. Enter the appropriate information in the Settings dialog box7. Click OK.
Related tasks2.2 Configuring a connection to a Linux target using gdbserver on page 2-34.2.5 Configuring a connection to a Linux Kernel on page 2-40.
10 DS-5 Debug perspectives and views10.48 Target management terminal for serial and SSH connections
ARM DUI0446R Copyright © 2010-2014 ARM. All rights reserved. 10-304Non-Confidential

10.49 Remote Scratchpad viewDescribes the tab content.
The Remote Scratchpad view is an electronic clipboard where you can copy and paste or drag and dropuseful files and folders into this view for use at a later point in time. This enables you to keep a list ofresources from any connection in one place.
Note
Be aware that although the scratchpad only shows links, any changes made to a linked resource alsochanges it in the original file system.
Figure 10-53 Remote Scratchpad
The Remote Scratchpad view is not visible by default. To add this view:
1. Select Window > Show View > Other... to open the Show View dialog box.2. Expand the Remote Systems group and select Remote Scratchpad.3. Click OK.
10 DS-5 Debug perspectives and views10.49 Remote Scratchpad view
ARM DUI0446R Copyright © 2010-2014 ARM. All rights reserved. 10-305Non-Confidential

10.50 Remote Systems terminal for SSH connectionsDescribes the tab content.
The Remote Systems terminal enables you to enter shell commands directly on the target withoutlaunching any external application. For example you can browse remote files and folders by entering thels or pwd commands in the same way as you would in a Linux terminal.
Figure 10-54 Remote Systems Terminals view
The Terminals view is not visible by default. To add this view:
1. Select Window > Show View > Other... to open the Show View dialog box.2. Expand the Remote Systems group and select Remote Systems.3. Click OK.4. In the Remote Systems view:
a. Click on the toolbar icon Define a connection to a remote system and configure an Secure SHell(SSH) connection to the target.
b. Right-click on the connection and select Connect from the context menu.c. Enter the User ID and password in the relevant fields.d. Click OK to connect to the target.e. Right-click on Ssh Terminals.
5. Select Launch Terminal to open a terminal shell that is connected to the target.
10 DS-5 Debug perspectives and views10.50 Remote Systems terminal for SSH connections
ARM DUI0446R Copyright © 2010-2014 ARM. All rights reserved. 10-306Non-Confidential

10.51 New Terminal Connection dialog boxDescribes the dialog box content.
The dialog box enables you to:
• change the view title• select the connection type• set the connection settings.
Figure 10-55 Terminal Settings dialog box
View SettingsEnables you to give a name to the Terminal view.
View TitleEnter a name for the Terminal view.
Connection TypeSpecifies a connection type. Either Serial or Secure SHell (SSH).
SettingsEnables you to configure the connection settings.
PortSpecifies the port that the target is connected to.
Baud RateSpecifies the connections baud rate.
Data BitsSpecifies the number of data bits.
Stop BitsSpecifies the number of stop bits for each character.
10 DS-5 Debug perspectives and views10.51 New Terminal Connection dialog box
ARM DUI0446R Copyright © 2010-2014 ARM. All rights reserved. 10-307Non-Confidential

ParitySpecifies the parity type:
• None. This is the default.• Even.• Odd.• Mark.• Space.
Flow ControlSpecifies the flow control of the connection:
• None. This is the default.• RTS/CTS.• Xon/Xoff.
Timeout (sec)Specifies the connections timeout in seconds.
10 DS-5 Debug perspectives and views10.51 New Terminal Connection dialog box
ARM DUI0446R Copyright © 2010-2014 ARM. All rights reserved. 10-308Non-Confidential
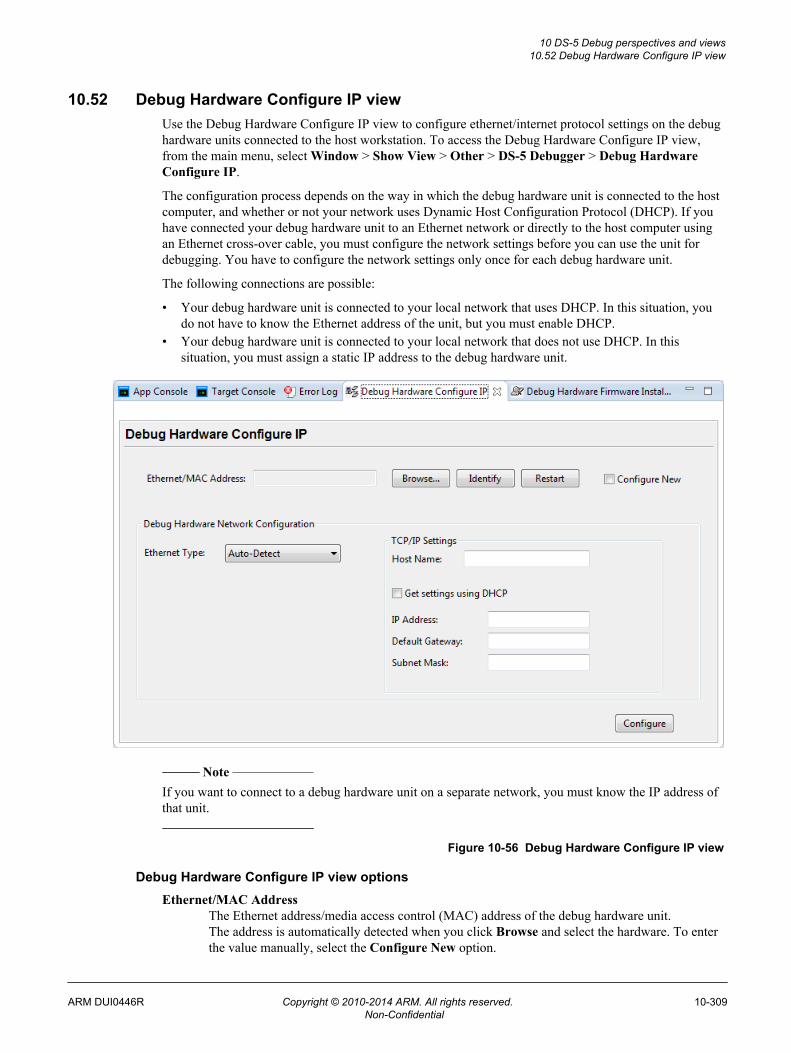
10.52 Debug Hardware Configure IP viewUse the Debug Hardware Configure IP view to configure ethernet/internet protocol settings on the debughardware units connected to the host workstation. To access the Debug Hardware Configure IP view,from the main menu, select Window > Show View > Other > DS-5 Debugger > Debug HardwareConfigure IP.
The configuration process depends on the way in which the debug hardware unit is connected to the hostcomputer, and whether or not your network uses Dynamic Host Configuration Protocol (DHCP). If youhave connected your debug hardware unit to an Ethernet network or directly to the host computer usingan Ethernet cross-over cable, you must configure the network settings before you can use the unit fordebugging. You have to configure the network settings only once for each debug hardware unit.
The following connections are possible:
• Your debug hardware unit is connected to your local network that uses DHCP. In this situation, youdo not have to know the Ethernet address of the unit, but you must enable DHCP.
• Your debug hardware unit is connected to your local network that does not use DHCP. In thissituation, you must assign a static IP address to the debug hardware unit.
Note
If you want to connect to a debug hardware unit on a separate network, you must know the IP address ofthat unit.
Figure 10-56 Debug Hardware Configure IP view
Debug Hardware Configure IP view optionsEthernet/MAC Address
The Ethernet address/media access control (MAC) address of the debug hardware unit.The address is automatically detected when you click Browse and select the hardware. To enterthe value manually, select the Configure New option.
10 DS-5 Debug perspectives and views10.52 Debug Hardware Configure IP view
ARM DUI0446R Copyright © 2010-2014 ARM. All rights reserved. 10-309Non-Confidential

BrowseClick to display the Connection Browser dialog. Use it to browse and select the debug hardwareunit in your local network or one that is connected to a USB port on the host workstation.
IdentifyClick to visually identify your debug hardware unit using the indicators available on the debughardware. On RVI , all LEDs on the front panel flash during identification. On DSTREAM , theDSTREAM logo flashes during identification.
RestartClick to restart the selected debug hardware unit.
Configure NewSelect this option to manually configure a debug hardware unit that is not previously configuredor is on a different subnet.
Ethernet TypeSelect the type of Ethernet you are connecting to. Auto-Detect is the default option. The otheravailable options are: 10-MBit Half Duplex, 10-MBit Full Duplex, 100-MBit Half Duplex,100-MBit Full Duplex.
TCP/IP SettingsHost Name - The name of the debug hardware unit. This must contain only the alphanumericcharacters (A to Z, a to z, and 0 to 9) and the - character, and must be no more than 39characters long.Get settings using DHCP - Enables or disables the Dynamic Host Configuration Protocol(DHCP) on the debug hardware unit. If using DHCP, you must specify the hostname for yourdebug hardware unit.IP Address - The static IP address to use.Default Gateway - The default gateway to use.Subnet Mask - The subnet mask to use.
ConfigureClick to apply changes to the debug hardware unit.
Related references10.53 Debug Hardware Firmware Installer view on page 10-311.10.54 Connection Browser dialog box on page 10-313.
10 DS-5 Debug perspectives and views10.52 Debug Hardware Configure IP view
ARM DUI0446R Copyright © 2010-2014 ARM. All rights reserved. 10-310Non-Confidential

10.53 Debug Hardware Firmware Installer viewUse the Debug Hardware Firmware Installer view to update the firmware for your debug hardware.To access the Debug Hardware Firmware Installer view, from the main menu, select Window > ShowView > Other > DS-5 Debugger > Debug Hardware Firmware Installer.
A debug hardware unit stores templates for each supported device. Each template defines how tocommunicate with the device and the settings that you can configure for that device. The templates areprovided in a firmware file.
ARM periodically releases updates and patches to the firmware that is installed on a debug hardwareunit. Each update or patch is released as a firmware file. These updates or patches might extend thecapabilities of your debug hardware, or might fix an issue that has become apparent.
In DS-5, the latest firmware files are available at: <DS-5 install directory>DS-5\sw\debughw\firmware\
Figure 10-57 Debug Hardware Firmware Installer (Shown with DSTREAM firmware updateprocess)
Debug Hardware Firmware Installer view optionsSelect Debug Hardware
The currently selected debug hardware. You can either enter the IP address or host name of thedebug hardware unit, or use the Browse button and select the debug hardware unit.
BrowseClick to display the Connection Browser dialog. Use it to browse and select the debug hardwareunit in your local network or one that is connected to a USB port on the host workstation.
IdentifyClick to visually identify your debug hardware unit using the indicators available on the debughardware. On RVI , all LEDs on the front panel flash during identification. On DSTREAM , theDSTREAM logo flashes during identification.
ConnectClick to connect to your debug hardware. Once connected, the dialog shows the currentfirmware status.
Select Firmware Update FileUse the Browse button and select the firmware file. Once the file is selected, the dialog showsthe selected firmware update file details.
10 DS-5 Debug perspectives and views10.53 Debug Hardware Firmware Installer view
ARM DUI0446R Copyright © 2010-2014 ARM. All rights reserved. 10-311Non-Confidential

BrowseClick to browse and select the firmware file.
ClearClick to clear the currently selected debug hardware and firmware file.
InstallClick to install the firmware file on the selected debug hardware.
Firmware file format
Firmware files have the following syntax: ARM-RVI-N.n.p-bld-type.unit
N.n.pIs the version of the firmware. For example, 4.5.0 is the first release of firmware version 4.5.
buildIs a build number.
TypeIs either:
• base - The first release of the firmware for version N.n.• patch - Updates to the corresponding N.n release of the firmware.
unitIdentifies the debug hardware unit, and is one of:
• dstream for a DSTREAM debug and trace unit.• rvi for an RVI debug unit.
Related references10.52 Debug Hardware Configure IP view on page 10-309.10.54 Connection Browser dialog box on page 10-313.
10 DS-5 Debug perspectives and views10.53 Debug Hardware Firmware Installer view
ARM DUI0446R Copyright © 2010-2014 ARM. All rights reserved. 10-312Non-Confidential

10.54 Connection Browser dialog boxUse the Connection Browser dialog box to browse and select a debug hardware unit in your localnetwork or one that is connected to a USB port on the host workstation. When the Connection Browserdialog box finds a unit, it is added to the list of available units.
To view the Connection Browser dialog, click Browse from the Debug Hardware Configure IP or DebugHardware Firmware Installer views.
To connect to the debug hardware, select the hardware from the list, and click Select.
Note
• If debug hardware units do not appear in the list, check your network and setup of your debug unit.• Debug hardware units connected to different networks do not appear in the Connection Browser
dialog box. If you want to connect to a debug hardware unit on a separate network, you must knowthe IP address of that unit.
• Any unit shown in light gray has responded to browse requests but does not have a valid IP address.You cannot connect to that unit by TCP/IP until you have configured it for use on your network.
• Only appropriate debug hardware units are shown. VSTREAM connections are not shown.
Figure 10-58 Connection Browser (Showing a USB connected DSTREAM)
Related references10.52 Debug Hardware Configure IP view on page 10-309.10.53 Debug Hardware Firmware Installer view on page 10-311.
10 DS-5 Debug perspectives and views10.54 Connection Browser dialog box
ARM DUI0446R Copyright © 2010-2014 ARM. All rights reserved. 10-313Non-Confidential

10.55 DS-5 Debugger menu and toolbar iconsDescribes the menus and toolbar icons used in the DS-5 Debug perspective.
These tables list the most common menu and toolbar icons available for use with DS-5 Debugger. Forinformation on icons, markers, and buttons not listed in the following tables, see the standard WorkbenchUser Guide or the C/C++ Development User Guide in the Help > Help Contents window.
If you leave the mouse pointer positioned on a toolbar icon for a few seconds without clicking, a tooltipappears informing you of the purpose of the icon.
Table 10-2 DS-5 Debugger icons
Icon Description Icon Description
Connect to target Connected to target
Disconnect from target Delete connection
Start application and run to main Start application and run to entry point
Run application from entry point Restart the application
Continue running application Stop application
Step into Step over
Step out Toggle stepping mode
Continue running application backwards Reverse step source line
Reverse step over source line Reverse step out source line
Collapse all configurations in stack trace Call stack
Thread Process
Kernel module Define a new RSE connection
Refresh the RSE resource tree Save view contents to a file
Clear view contents Switch to History view
Synchronize view contents Toggle scroll lock
Run commands from a script file Export commands to a script file
Remove selected breakpoint, watchpoints, orexpression (view dependent)
Remove all breakpoints, watchpoints, orexpressions (view dependent)
Display breakpoint location in source file Deactivate all breakpoints and watchpoints
Import from a file Export to a file
Create new script file or add new expression (viewdependent)
Run select script file
Open selected file for editing Delete the selected files
Set display width Set display format
Toggle the display of ASCII characters Toggle freeze mode
10 DS-5 Debug perspectives and views10.55 DS-5 Debugger menu and toolbar icons
ARM DUI0446R Copyright © 2010-2014 ARM. All rights reserved. 10-314Non-Confidential

Table 10-2 DS-5 Debugger icons (continued)
Icon Description Icon Description
Edit Screen view parameters Add new Screen view
Add new Disassembly view Add new Variables view
Add new Registers view Add new Memory view
Add new Expression view Add new Trace view
Add Functions view View update in progress
Toggle trace marker Show next match
Show previous match Show instruction trace
Show function trace Toggle navigation resolution
Toggle the views Application rewind information displayed in view
Perspective icons
Table 10-3 Perspective icons
Icon Description Icon Description
Open new perspective C/C++ perspective
DS-5 Debug perspective Fast view bar
View icons
Table 10-4 View icons
Button Description Button Description
Display drop-down menu Synchronize view contents
Minimize Maximize
Restore Close
View markers
Table 10-5 View markers
Icon Description Icon Description
Software breakpoint enabled Hardware breakpoint enabled
Access watchpoint enabled Read watchpoint enabled
Write watchpoint enabled Software breakpoint disabled
Hardware breakpoint disabled Access watchpoint disabled
10 DS-5 Debug perspectives and views10.55 DS-5 Debugger menu and toolbar icons
ARM DUI0446R Copyright © 2010-2014 ARM. All rights reserved. 10-315Non-Confidential

Table 10-5 View markers (continued)
Icon Description Icon Description
Read watchpoint disabled Write watchpoint disabled
Software breakpoint pending Hardware breakpoint pending
Access watchpoint pending Read watchpoint pending
Write watchpoint pending Software breakpoint disconnected
Hardware breakpoint disconnected Access watchpoint disconnected
Read watchpoint disconnected Write watchpoint disconnected
Multiple-statement software breakpoint enabled Multiple-statement software breakpoint disabled
Error Current location
Warning Bookmark
Information Task
Search result
Miscellaneous icons
Table 10-6 Miscellaneous icons
Icon Description Icon Description
Open a new resource wizard Open new project wizard
Open new folder wizard Open new file wizard
Open search dialog box Display context-sensitive help
Open import wizard Open export wizard
10 DS-5 Debug perspectives and views10.55 DS-5 Debugger menu and toolbar icons
ARM DUI0446R Copyright © 2010-2014 ARM. All rights reserved. 10-316Non-Confidential

Chapter 11Troubleshooting
Describes how to diagnose problems when debugging applications using DS-5 Debugger.It contains the following sections:
• 11.1 ARM Linux problems and solutions on page 11-318.• 11.2 Enabling internal logging from the debugger on page 11-319.• 11.3 Target connection problems and solutions on page 11-320.
ARM DUI0446R Copyright © 2010-2014 ARM. All rights reserved. 11-317Non-Confidential

11.1 ARM Linux problems and solutionsLists possible problems when debugging a Linux application.
You might encounter the following problems when debugging a Linux application.
ARM Linux permission problem
If you receive a permission denied error message when starting an application on the target then youmight have to change the execute permissions on the application. :
chmod +x myImage
A breakpoint is not being hit
You must ensure that the application and shared libraries on your target are the same as those on yourhost. The code layout must be identical, but the application and shared libraries on your target do notrequire debug information.
Operating system support is not active
When Operating System (OS) support is required, the debugger activates it automatically where possible.If OS support is required but cannot be activated, the debugger produces an error. :
ERROR(CMD16-LKN36):! Failed to load image "gator.ko"! Unable to parse module because the operating system support is not active
OS support cannot be activated if:
• debug information in the vmlinux file does not correctly match the data structures in the kernelrunning on the target
• it is manually disabled by using the set os enabled off command.
To determine whether the kernel versions match:
• stop the target after loading the vmlinux image• enter the print init_nsproxy.uts_ns->name command• verify that the $1 output is correct. :
$1 = {sysname = "Linux", nodename = "(none)", release = "3.4.0-rc3", version = "#1 SMP Thu Jan 24 00:46:06 GMT 2013", machine = "arm", domainname = "(none)"}
Related tasks2.2 Configuring a connection to a Linux target using gdbserver on page 2-34.2.5 Configuring a connection to a Linux Kernel on page 2-40.
11 Troubleshooting11.1 ARM Linux problems and solutions
ARM DUI0446R Copyright © 2010-2014 ARM. All rights reserved. 11-318Non-Confidential
11.2 Enabling internal logging from the debuggerDescribes how to enable internal logging to help diagnose error messages.
On rare occasions an internal error might occur causing the debugger to generate an error messagesuggesting that you report it to your local support representatives. You can help to improve the debuggerby giving feedback with an internal log that captures the stacktrace and shows where in the debugger theerror occurs. To obtain the current version of DS-5, you can select About ARM DS-5 from the Helpmenu in Eclipse or open the product release notes.
To enable internal logging within Eclipse, enter the following in the Commands view of the DS-5 Debugperspective:
1. To enable the output of logging messages from the debugger using the predefined DEBUG levelconfiguration:
log config debug
2. To redirect all logging messages from the debugger to a file:
log file debug.log
Note
Enabling internal logging can produce very large files and slow down the debugger significantly. Onlyenable internal logging when there is a problem.
Related references10.6 Commands view on page 10-213.7.5 Controlling the output of logging messages on page 7-171.
11 Troubleshooting11.2 Enabling internal logging from the debugger
ARM DUI0446R Copyright © 2010-2014 ARM. All rights reserved. 11-319Non-Confidential

11.3 Target connection problems and solutionsLists possible problems when connecting to a target.
Failing to make a connection
The debugger might fail to connect to the selected debug target because of the following reasons:
• you do not have a valid license to use the debug target• the debug target is not installed or the connection is disabled• the target hardware is in use by another user• the connection has been left open by software that exited incorrectly• the target has not been configured, or a configuration file cannot be located• the target hardware is not powered up ready for use• the target is on a scan chain that has been claimed for use by something else• the target hardware is not connected• you want to connect through gdbserver but the target is not running gdbserver• there is no ethernet connection from the host to the target• the port number in use by the host and the target are incorrect
Check the target connections and power up state, then try and reconnect to the target.
Debugger connection settings
When debugging a bare-metal target the debugger might fail to connect because of the following reasons:
• Heap Base address is incorrect• Stack Base (top of memory) address is incorrect• Heap Limit address is incorrect• Incorrect vector catch settings.
Check that the memory map settings are correct for the selected target. If set incorrectly, the applicationmight crash because of stack corruption or because the application overwrites its own code.
Related tasks2.2 Configuring a connection to a Linux target using gdbserver on page 2-34.2.5 Configuring a connection to a Linux Kernel on page 2-40.
11 Troubleshooting11.3 Target connection problems and solutions
ARM DUI0446R Copyright © 2010-2014 ARM. All rights reserved. 11-320Non-Confidential

Chapter 12File-based flash programming in DS-5™
Describes the file-based flash programming options available in DS-5.It contains the following sections:
• 12.1 About file-based flash programming in DS-5™ on page 12-322.• 12.2 Flash programming configuration on page 12-324.• 12.3 Creating an extension database for flash programming on page 12-326.• 12.4 About using or extending the supplied Keil flash method on page 12-327.• 12.5 About creating a new flash method on page 12-329.• 12.6 About testing the flash configuration on page 12-333.• 12.7 About flash method parameters on page 12-334.• 12.8 About getting data to the flash algorithm on page 12-335.• 12.9 About interacting with the target on page 12-336.
ARM DUI0446R Copyright © 2010-2014 ARM. All rights reserved. 12-321Non-Confidential

12.1 About file-based flash programming in DS-5™
The DS-5 configdb platform entry for a board can contain a flash definition section. This section candefine one or more areas of flash, each with its own flash method and configuration parameters.
Flash methods are implemented in Jython and are typically located within the configdb. Each flashmethod is implemented with a specific technique of programming flash.
These techniques might involve:
• Running an external program supplied by a third party to program a file into flash.• Copying a file to a file system mount point. For example, as implemented in the Versatile Express
designs.• Download a code algorithm into the target system and to keep running that algorithm on a data set
(typically a flash sector) until the entire flash device has been programmed.
Note
You can use the DS-5 Debugger info flash command to view the flash configuration for your board.
Examples of downloading a code algorithm into the target system are the Keil flash programmingalgorithms which are fully supported by DS-5 Debugger. For the Keil flash method, one of the methodconfiguration items is the algorithm to use to perform the flash programming. These algorithms allfollow the same top level software interface and so the same DS-5 Keil flash method can be used toprogram different types of flash. This means that DS-5 Debugger should be able to make direct use ofany existing Keil flash algorithm.
Note
All flash methods which directly interact with the target should do so using the DS-5 Debugger's DTSLconnection.
Flash programming supported features
The following features are available in file flash programming operations:
• Supports ELF files (.axf) programming into flash.• Supports ELF files containing multiple flash areas which can each be programmed into a flash device
or possible several different flash devices.• Supports many and varied flash programming methods.• Supports all Keil flash programming algorithms.• Supports target board setup and teardown to prepare it for flash programming.• Supports DS-5 configuration database to learn about target flash devices and the options required for
flash programming on a specific board or system on chip.• Supports default flash options modification.• Supports graphical progress reporting within Eclipse and on a text only type console when used with
the debugger outside Eclipse, along with the ability to cancel the programming operation.• Supports a simple flash programming user interface where you can specify minimal configurations or
options.• Supports displaying warning and error messages to the user.
Note
An example, flash_example-FVP-A9x4, is provided with DS-5. This example shows two ways ofprogramming flash devices using DS-5, one using a Keil Flash Method and the other using a CustomFlash Method written in Jython. For convenience, the Cortex-A9x4 FVP model supplied with DS-5 is
12 File-based flash programming in DS-5™
12.1 About file-based flash programming in DS-5™
ARM DUI0446R Copyright © 2010-2014 ARM. All rights reserved. 12-322Non-Confidential

used as the target device. This example can be used as a template for creating new flash algorithms. Thereadme.html provided with the example contains basic information on how to use the example.
DS-5™ File Flash Architecture
Figure 12-1 DS-5 File Flash Architecture
Related informationFlash commands.
12 File-based flash programming in DS-5™
12.1 About file-based flash programming in DS-5™
ARM DUI0446R Copyright © 2010-2014 ARM. All rights reserved. 12-323Non-Confidential
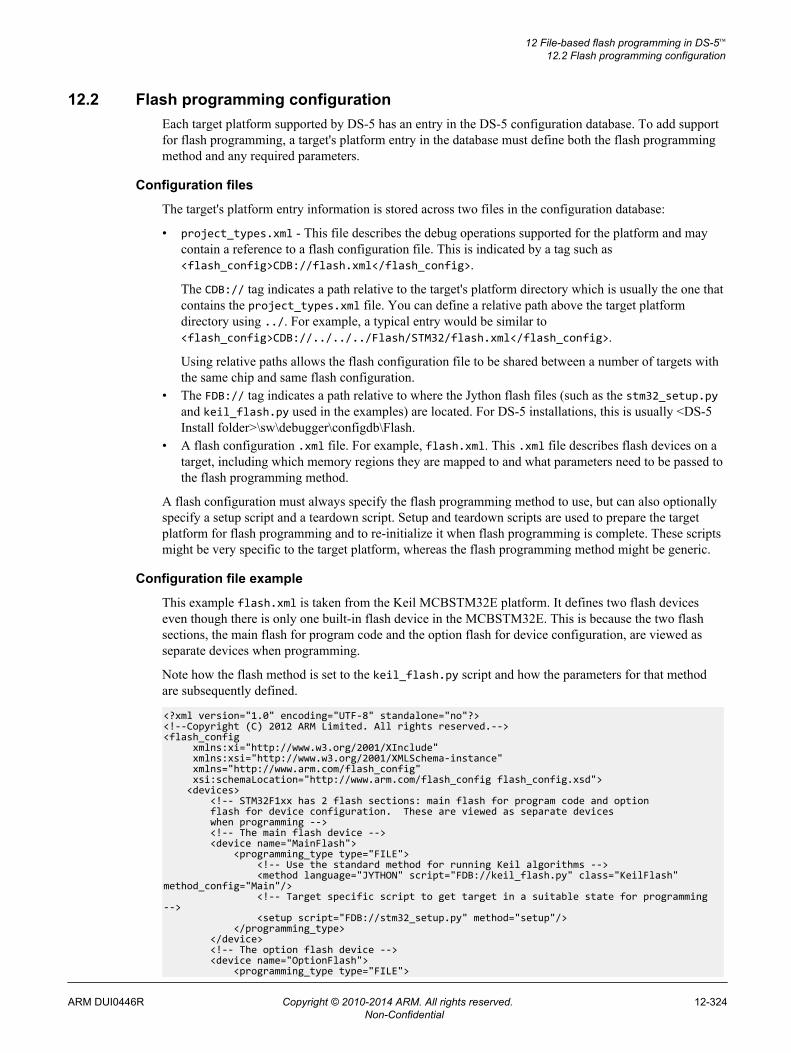
12.2 Flash programming configurationEach target platform supported by DS-5 has an entry in the DS-5 configuration database. To add supportfor flash programming, a target's platform entry in the database must define both the flash programmingmethod and any required parameters.
Configuration files
The target's platform entry information is stored across two files in the configuration database:
• project_types.xml - This file describes the debug operations supported for the platform and maycontain a reference to a flash configuration file. This is indicated by a tag such as<flash_config>CDB://flash.xml</flash_config>.
The CDB:// tag indicates a path relative to the target's platform directory which is usually the one thatcontains the project_types.xml file. You can define a relative path above the target platformdirectory using ../. For example, a typical entry would be similar to<flash_config>CDB://../../../Flash/STM32/flash.xml</flash_config>.
Using relative paths allows the flash configuration file to be shared between a number of targets withthe same chip and same flash configuration.
• The FDB:// tag indicates a path relative to where the Jython flash files (such as the stm32_setup.pyand keil_flash.py used in the examples) are located. For DS-5 installations, this is usually <DS-5Install folder>\sw\debugger\configdb\Flash.
• A flash configuration .xml file. For example, flash.xml. This .xml file describes flash devices on atarget, including which memory regions they are mapped to and what parameters need to be passed tothe flash programming method.
A flash configuration must always specify the flash programming method to use, but can also optionallyspecify a setup script and a teardown script. Setup and teardown scripts are used to prepare the targetplatform for flash programming and to re-initialize it when flash programming is complete. These scriptsmight be very specific to the target platform, whereas the flash programming method might be generic.
Configuration file example
This example flash.xml is taken from the Keil MCBSTM32E platform. It defines two flash deviceseven though there is only one built-in flash device in the MCBSTM32E. This is because the two flashsections, the main flash for program code and the option flash for device configuration, are viewed asseparate devices when programming.
Note how the flash method is set to the keil_flash.py script and how the parameters for that methodare subsequently defined.
<?xml version="1.0" encoding="UTF-8" standalone="no"?><!--Copyright (C) 2012 ARM Limited. All rights reserved.--><flash_config xmlns:xi="http://www.w3.org/2001/XInclude" xmlns:xsi="http://www.w3.org/2001/XMLSchema-instance" xmlns="http://www.arm.com/flash_config" xsi:schemaLocation="http://www.arm.com/flash_config flash_config.xsd"> <devices> <!-- STM32F1xx has 2 flash sections: main flash for program code and option flash for device configuration. These are viewed as separate devices when programming --> <!-- The main flash device --> <device name="MainFlash"> <programming_type type="FILE"> <!-- Use the standard method for running Keil algorithms --> <method language="JYTHON" script="FDB://keil_flash.py" class="KeilFlash" method_config="Main"/> <!-- Target specific script to get target in a suitable state for programming --> <setup script="FDB://stm32_setup.py" method="setup"/> </programming_type> </device> <!-- The option flash device --> <device name="OptionFlash"> <programming_type type="FILE">
12 File-based flash programming in DS-5™
12.2 Flash programming configuration
ARM DUI0446R Copyright © 2010-2014 ARM. All rights reserved. 12-324Non-Confidential

<method language="JYTHON" script="FDB://keil_flash.py" class="KeilFlash" method_config="Option"/> <setup script="FDB://stm32_setup.py" method="setup"/> </programming_type> </device> </devices> <method_configs> <!-- Parameters for programming the main flash --> <method_config id="Main"> <params> <!-- Programming algorithm binary to load to target --> <param name="algorithm" type="string" value="FDB://algorithms/STM32F10x_512.FLM"/> <!-- The core in the target to run the algorithm --> <param name="coreName" type="string" value="Cortex-M3"/> <!-- RAM location & size for algorithm code and write buffers --> <param name="ramAddress" type="integer" value="0x20000000"/> <param name="ramSize" type="integer" value="0x10000"/> <!-- Allow timeouts to be disabled --> <param name="disableTimeouts" type="string" value="false"/> <!-- Set to false to skip the verification stage --> <param name="verify" type="string" value="true"/> </params> </method_config> <!-- Parameters for programming the option flash --> <method_config id="Option"> <params> <!-- Programming algorithm binary to load to target --> <param name="algorithm" type="string" value="FDB://algorithms/STM32F10x_OPT.FLM"/> <!-- The core in the target to run the algorithm --> <param name="coreName" type="string" value="Cortex-M3"/> <!-- RAM location & size for algorithm code and write buffers --> <param name="ramAddress" type="integer" value="0x20000000"/> <param name="ramSize" type="integer" value="0x10000"/> <!-- Allow timeouts to be disabled --> <param name="disableTimeouts" type="string" value="false"/> <!-- Set to false to skip the verification stage --> <param name="verify" type="string" value="true"/> </params> </method_config> </method_configs></flash_config>
Related tasks12.3 Creating an extension database for flash programming on page 12-326.
12 File-based flash programming in DS-5™
12.2 Flash programming configuration
ARM DUI0446R Copyright © 2010-2014 ARM. All rights reserved. 12-325Non-Confidential

12.3 Creating an extension database for flash programmingIn certain scenarios, it might not be desirable or possible to modify the default DS-5 configurationdatabase. In this case, you can create your own configuration databases and use them to extend thedefault installed database.
To create an extension configuration database:
Procedure
1. At your preferred location, create a new directory with the name of your choice for the extensiondatabase.
2. In your new directory, create two subdirectories and name them Boards and Flash respectively.a) In the Boards directory, create a subdirectory for the board manufacturer.b) In the board manufacturer subdirectory, create another directory for the board.c) In the Flash directory, create a subdirectory and name it Algorithms.
For example, for a manufacturer MegaSoc-Co who makes Acme-Board-2000, the directorystructure would look similar to this:
Boards \---> MegaSoc-Co \---> Acme-Board-2000 project_types.xml
Flash \---> Algorithms Acme-Board-2000.flm Acme-Board-2000-Flash.py
3. From the main menu in DS-5, select Window > Preferences > DS-5 > Configuration Database.a) In the User Configuration Databases area, click Add.b) In the Add configuration database location dialog, enter the Name and Location of the your
configuration database and click OK.4. In the Preferences dialog, click OK to confirm your changes.
Within the project_types.xml file for your platform, any reference to a CDB:// location will nowresolve to the Boards/<manufacturer>/<board> directory and any reference to a FDB:// locationwill resolve to the Flash directory.
12 File-based flash programming in DS-5™
12.3 Creating an extension database for flash programming
ARM DUI0446R Copyright © 2010-2014 ARM. All rights reserved. 12-326Non-Confidential

12.4 About using or extending the supplied Keil flash methodDS-5 Debugger contains a full implementation of the Keil flash programming method. This may be usedto program any flash device supported by Keil's MDK product. It may also be used to support any futuredevice for which a Keil flash programming algorithm can be created.
For details on creating new Keil Flash Programming algorithms (these links apply to the Keil uVisionproduct), see:
Algorithm Functions
Creating New Algorithms
To aid in the creation of new Keil flash programming algorithms within DS-5, DS-5 Debugger contains afull platform flash example for the Keil MCBSTM32E board. This can be used as a template for newflash support.
Note
An example, flash_example-FVP-A9x4, is provided with DS-5. This example shows two ways ofprogramming flash devices using DS-5, one using a Keil Flash Method and the other using a CustomFlash Method written in Jython. For convenience, the Cortex-A9x4 FVP model supplied with DS-5 isused as the target device. This example can be used as a template for creating new flash algorithms. Thereadme.html provided with the example contains basic information on how to use the example.
This section describes how to add flash support to an existing platform using an existing Keil flashprogram, and how to add flash support to an existing platform using a new Keil flash algorithm.
This section contains the following subsections:
• 12.4.1 Adding flash support to an existing platform using an existing Keil flash algorithmon page 12-327.
• 12.4.2 Adding flash support to an existing target platform using a new Keil flash algorithmon page 12-328.
12.4.1 Adding flash support to an existing platform using an existing Keil flash algorithmTo use the Keil MDK flash algorithms within DS-5, the algorithm binary needs to be imported into thetarget configuration database and the flash configuration files created to reference the keil_flash.pyscript.
This example uses the flash configuration for the Keil MCBSTM32E board example in Flashprogramming configuration as a template to add support to a board called the Acme-Board-2000 madeby MegaSoc-Co.
Procedure
1. Copy the algorithm binary .FLM into your configuration database Flash/Algorithms directory.2. Copy the flash configuration file from Boards/Keil/MCBSTM32E/keil-mcbstm32e_flash.xml to
Boards/MegaSoc-Co/Acme-Board-2000/flash.xml.3. Edit the platform's project_types.xml to reference the flash.xml file by inserting
<flash_config>CDB://flash.xml</flash_config> below platform_data entry, for example:
<?xml version="1.0" encoding="UTF-8" standalone="no"?><!--Copyright (C) 2009-2012 ARM Limited. All rights reserved.--><platform_data xmlns="http://www.arm.com/project_type" xmlns:peripheral="http://com.arm.targetconfigurationeditor" xmlns:xi="http://www.w3.org/2001/XInclude" xmlns:xsi="http://www.w3.org/2001/XMLSchema-instance"type="HARDWARE" xsi:schemaLocation="http://www.arm.com/project_type../../../Schemas/platform_data-1.xsd"> <flash_config>CDB://flash.xml</flash_config>
4. Edit the devices section, and create a <device> block for each flash device on the target.
12 File-based flash programming in DS-5™
12.4 About using or extending the supplied Keil flash method
ARM DUI0446R Copyright © 2010-2014 ARM. All rights reserved. 12-327Non-Confidential

Note
The method_config attribute should refer to a unique <method_config> block for that device in the<method_configs> section.
5. Optionally, create and then reference any setup or teardown script required for your board. If yourboard does not need these, then do not add these lines to your configuration.
<setup script="FDB://Acme-Board-2000-Flash.py" method="setup"/><teardown script="FDB://Acme-Board-2000-Flash.py" method="teardown"/>
6. Edit the method_configs section, creating a <method_config> block for each device.
Note
• The value for the algorithm parameter should be changed to the path to the algorithm copied inStep 1. The FDB:// prefix is used to indicate the file can be found in the configuration databaseFlash directory.
• The coreName parameter should be the name of the core on the target that will run the algorithm.This must be the same name as used in the <core> definition within project_types.xml. Forexample, <core connection_id ="Cortex-M3" core_definition ="Cortex-M3"/>.
• The ramAddress and ramSize parameters should be set to an area of RAM that the algorithm canbe downloaded in to and used as working RAM. It should be big enough to hold the algorithm,stack plus scratch areas required to run the algorithm, and a sufficiently big area to downloadimage data.
• The other parameters do not normally need to be changed.
12.4.2 Adding flash support to an existing target platform using a new Keil flash algorithmDS-5 ships with a complete Keil flash algorithm example for the STM32 device family. You can use thisas a template for creating and building your new flash algorithm.
Locate the Bare-metal_examples_ARMv7.zip file within the DS-5/Examples directory. Extract theDS-5Examples\flash_algo-STM32F10x directory to your file system and then import this project intoyour DS-5 Eclipse Workspace. Using this as your template, create a new project, copy the content fromthe example into your new project and modify as needed.
Once you have successfully built your .FLM file(s), proceed as explained in the Adding flash support toan existing platform using an existing Keil flash algorithm topic.
Related tasks12.4.1 Adding flash support to an existing platform using an existing Keil flash algorithmon page 12-327.
12 File-based flash programming in DS-5™
12.4 About using or extending the supplied Keil flash method
ARM DUI0446R Copyright © 2010-2014 ARM. All rights reserved. 12-328Non-Confidential

12.5 About creating a new flash methodIf the Keil flash method is inappropriate for your requirements, it is necessary to create a new customflash method for your use.
Programming methods are implemented in Jython (Python, utilizing the Jython runtime). The use ofJython allows access to the DTSL APIs used by the DS-5 Debugger. DS-5 includes the PyDev tools toassist in writing Python scripts.
In a DS-5 install, the configdb\Flash\flashprogrammer directory holds a number of Python fileswhich contain utility methods used in the examples.
This section describes a default implementation of com.arm.debug.flashprogrammer.FlashMethodv1and creating a flash method using a Python script.
This section contains the following subsections:
• 12.5.1 About using the default implementation FlashMethodv1 on page 12-329.• 12.5.2 About creating the flash method Python script on page 12-329.
12.5.1 About using the default implementation FlashMethodv1Flash programming methods are written as Python classes that are required to implement thecom.arm.debug.flashprogrammer.IFlashMethod interface. This interface defines the methods theflash programming layer of DS-5 Debugger might invoke.
See the flash_method_v1.py file in the <Install folder>\DS-5\sw\debugger\configdb\Flash\flashprogrammer for a default implementation ofcom.arm.debug.flashprogrammer.FlashMethodv1. This has empty implementations of all functions -this allows a Python class derived from this object to only implement the required functions.
Running a flash programming method is split into three phases:
1. Setup - the setup() function prepares the target for performing flash programming. This mightinvolve:
• Reading and validating parameters passed from the configuration file.• Opening a connection to the target.• Preparing the target state, for example, to initialize the flash controller.• Loading any flash programming algorithms to the target.
2. Programming - the program() function is called for each section of data to be written. Images mighthave multiple load regions, so the program() function might be called several times. The data towrite is passed to this function and the method writes the data into flash at this stage.
3. Teardown - the teardown() function is called after all sections have been programmed. At this stage,the target state can be restored (for example, take the flash controller out of write mode or reset thetarget) and any debug connection closed.
Note
The setup() and teardown() functions are not to be confused with the target platform optionalsetup() and teardown() scripts. The setup() and teardown() functions defined in the flashmethod class are for the method itself and not the board.
12.5.2 About creating the flash method Python scriptFor the purposes of this example the Python script is called example_flash.py.
• Start by importing the objects required in the script:
from flashprogrammer.flash_method_v1 import FlashMethodv1from com.arm.debug.flashprogrammer import TargetStatus
12 File-based flash programming in DS-5™
12.5 About creating a new flash method
ARM DUI0446R Copyright © 2010-2014 ARM. All rights reserved. 12-329Non-Confidential

• Then, define the class implementing the method:
class ExampleFlashWriter(FlashMethodv1): def __init__(self, methodServices): FlashMethodv1.__init__(self, methodServices) def setup(self): # perform any setup for the method here pass def teardown(self): # perform any clean up for the method here # return the target status return TargetStatus.STATE_RETAINED def program(self, regionID, offset, data): # program a block of data to the flash # regionID indicates the region within the device (as defined in the flash configuration file) # offset is the byte offset within the region # perform programming here # return the target status return TargetStatus.STATE_RETAINED
Note
• The __init__ function is the constructor and is called when the class instance is created.• methodServices allows the method to make calls into the flash programmer - it should not be
accessed directly.• FlashMethodv1 provides functions that the method can call while programming.• The program() and teardown() methods should return a value that describes the state the target has
been left in. This can be one of:
— STATE_RETAINED - The target state has not been altered from the state when programming started.In this state, the register and memory contents have been preserved or restored.
— STATE_LOST - Register and memory contents have been altered, but a system reset is not required.— RESET_REQUIRED - It is recommended or required that the target be reset.— POWER_CYCLE_REQUIRED - It is required that the target be manually power cycled. For example,
when a debugger-driven reset is not possible or not sufficient to reinitialize the target.
Creating the target platform setup and teardown scripts
If the hardware platform requires some setup (operations to be performed before flash programming)and/or teardown (operations to be performed after flash programming) functionality, you must create oneor more scripts which contain setup() and teardown() functions. These can be in separate script filesor you can combine them into a single file. This file should be placed into the configdb Flash directoryso that it can be referenced using a FDB:// prefix in the flash configuration file.
For example, the contents of a single file which contains both the setup() and teardown() functionswould be similar to:
from com.arm.debug.flashprogrammer.IFlashClient import MessageLevel from flashprogrammer.device import ensureDeviceOpen from flashprogrammer.execution import ensureDeviceStopped from flashprogrammer.device_memory import writeToTarget
def setup(client, services): # get a connection to the core conn = services.getConnection() dev = conn.getDeviceInterfaces().get("Cortex-M3") ensureDeviceOpen(dev) ensureDeviceStopped(dev) # Perform some target writes to enable flash programming writeToTarget(dev, FLASH_EN, intToBytes(0x81))
def teardown(client, services): # get a connection to the core conn = services.getConnection()
12 File-based flash programming in DS-5™
12.5 About creating a new flash method
ARM DUI0446R Copyright © 2010-2014 ARM. All rights reserved. 12-330Non-Confidential

dev = conn.getDeviceInterfaces().get("Cortex-M3") ensureDeviceOpen(dev) ensureDeviceStopped(dev) # Perform some target writes to disable flash programming writeToTarget(dev, FLASH_EN, intToBytes(0))
Creating the flash configuration file
To use the method to program flash, a configuration file must be created that describes the flash device,the method to use and any parameters or other information required. This is an .xml file and is typicallystored in the same directory as the target's other configuration files ( Boards/<Manufacturer>/<Boardname> ) as it contains target-specific information.
<?xml version="1.0" encoding="UTF-8" standalone="no"?> <flash_config xmlns:xi="http://www.w3.org/2001/XInclude" xmlns:xsi="http://www.w3.org/2001/XMLSchema-instance" xmlns="http://www.arm.com/flash_config" xsi:schemaLocation="http://www.arm.com/flash_config flash_config.xsd"> <devices> <device name="Example"> <regions> <region address="0x8000" size="0x10000"/> </regions> <programming_type type="FILE"> <method language="JYTHON" script="FDB://example_flash.py" class="ExampleFlashWriter" method_config="Default"/> <setup script="FDB://file_target.py" method="setup"/> <teardown script="FDB://file_target.py" method="teardown"/> </programming_type> </device> </devices> <method_configs> <method_config id="Default"> <params> <!-- Use last 2K of RAM --> <param name="ramAddress" type="integer" value="0x00100000"/> <param name="ramSize" type="integer" value="0x800"/> </params> </method_config> </method_configs> </flash_config>
• The flash_config tag defines used XML spaces and schemas. This does not usually need to bechanged. Under the flash_config tag, a devices tag is required. This contains a number of devicetags, each representing one flash device on the target. The device tag defines the name of the device -this is the name reported by the info flash command and is used only when programming to aspecific device. It also defines a number of regions where the flash device appears in the target'smemory - the addresses of each region are matched against the address of each load region of theimage being programmed.
• The programming_type tag defines the programming method and setup/teardown scripts to be usedfor a flash programming operation. Currently, only FILE is supported.
• The method tag defines the script which implements the programming method. Currently, onlyJYTHON is supported for the language attribute. The script and class attributes define which script fileto load and the name of the class that implements the programming method within the script. Themethod_config attributes define which set of parameters are used by the device. This allows multipledevices to share a set of parameters.
• The programming_type may also have optional setup and teardown tags. These define a script and amethod within that script to call before or after flash programming.
• Within the method_configs tag, the parameters for each device are contained within method_configtags.
• Parameters must have a unique name and a default value. You can override the value passed to themethod. See the help for the flash load command within the DS-5 Debugger.
• Where the configuration file references another file, for example, the script files, the FDB:// prefixindicates that the file is located in the Flash subdirectory of the configuration database. If there aremultiple databases, then the Flash subdirectory of each database is searched until the file is found.
12 File-based flash programming in DS-5™
12.5 About creating a new flash method
ARM DUI0446R Copyright © 2010-2014 ARM. All rights reserved. 12-331Non-Confidential

• The last file that needs to be changed is the project_types.xml file in the target's directory to tellDS-5 that the flash configuration can be found in the file created above. The following line should beadded under the top-level platform_data tag:
<flash_config>CDB://flash.xml</flash_config>
The CDB:// prefix tells DS-5 that the flash.xml file is located in the same directory as theproject_types.xml file.
12 File-based flash programming in DS-5™
12.5 About creating a new flash method
ARM DUI0446R Copyright © 2010-2014 ARM. All rights reserved. 12-332Non-Confidential
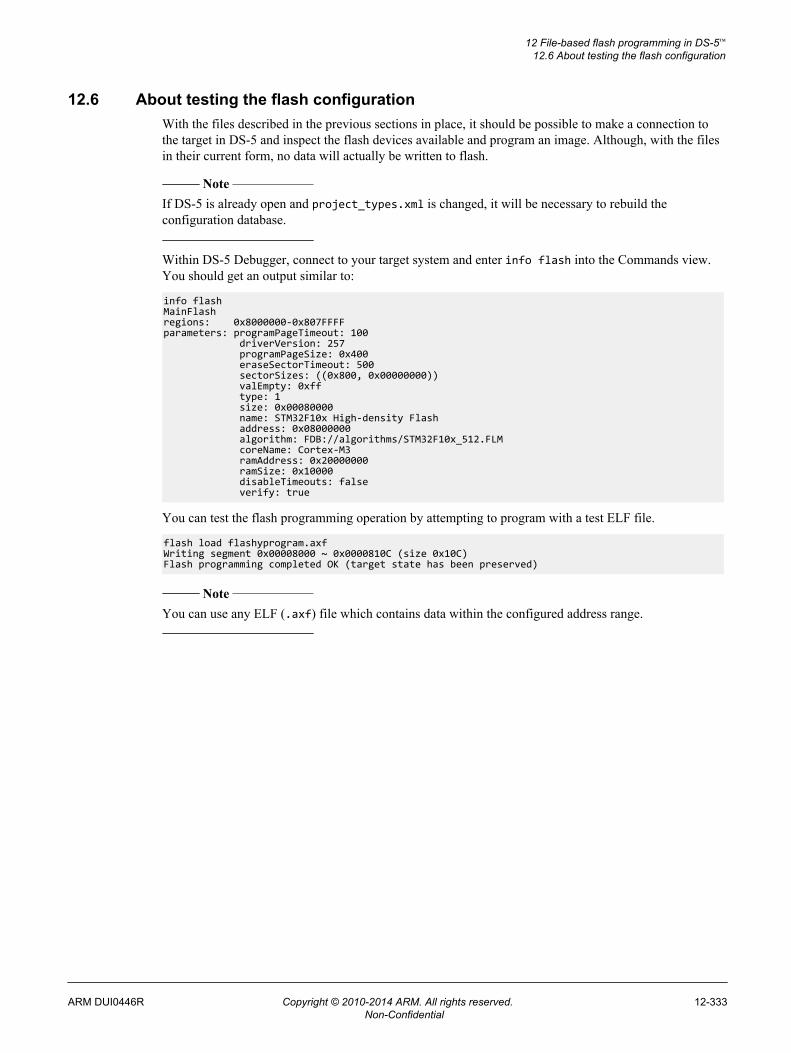
12.6 About testing the flash configurationWith the files described in the previous sections in place, it should be possible to make a connection tothe target in DS-5 and inspect the flash devices available and program an image. Although, with the filesin their current form, no data will actually be written to flash.
Note
If DS-5 is already open and project_types.xml is changed, it will be necessary to rebuild theconfiguration database.
Within DS-5 Debugger, connect to your target system and enter info flash into the Commands view.You should get an output similar to:
info flashMainFlashregions: 0x8000000-0x807FFFFparameters: programPageTimeout: 100 driverVersion: 257 programPageSize: 0x400 eraseSectorTimeout: 500 sectorSizes: ((0x800, 0x00000000)) valEmpty: 0xff type: 1 size: 0x00080000 name: STM32F10x High-density Flash address: 0x08000000 algorithm: FDB://algorithms/STM32F10x_512.FLM coreName: Cortex-M3 ramAddress: 0x20000000 ramSize: 0x10000 disableTimeouts: false verify: true
You can test the flash programming operation by attempting to program with a test ELF file.
flash load flashyprogram.axfWriting segment 0x00008000 ~ 0x0000810C (size 0x10C)Flash programming completed OK (target state has been preserved)
Note
You can use any ELF (.axf) file which contains data within the configured address range.
12 File-based flash programming in DS-5™
12.6 About testing the flash configuration
ARM DUI0446R Copyright © 2010-2014 ARM. All rights reserved. 12-333Non-Confidential

12.7 About flash method parametersProgramming methods can take parameters that serve to change the behavior of the flash programmingoperation.
Example parameters could be:
• The programming algorithm image to load, for example, the Keil Flash Algorithm file.• The location & size of RAM the method can use for running code, buffers, and similar items.• Clock speeds.• Timeouts.• Programming and erase page sizes.
The default values of the parameters are taken from the flash configuration file.
Note
You can override the parameters from the DS-5 command line.
The programming method can obtain the value of the parameters with:
• getParameter(name) returns the value of a parameter as a string. The method can convert this toanother type, such as integers, as required. None is returned if no value is set for this parameter.
• getParameters() returns a map of all parameters to values. Values can then be obtained with the []operator.
For example:
def setup(self): # get the name of the core to connect to coreName = self.getParameter("coreName") # get parameters for working RAM self.ramAddr = int(self.getParameter("ramAddress"), 0) self.ramSize = int(self.getParameter("ramSize"), 0)
12 File-based flash programming in DS-5™
12.7 About flash method parameters
ARM DUI0446R Copyright © 2010-2014 ARM. All rights reserved. 12-334Non-Confidential

12.8 About getting data to the flash algorithmData is passed to the program() function by the data parameter.
A data parameter is an object that provides the following functions:
• getSize() returns the amount of data available in bytes.• getData(sz) returns a buffer of up to sz data bytes. This may be less, for example, at the end of the
data. The read position is advanced.• seek(pos) move the read position.• getUnderlyingFile() gets the file containing the data. (None, if not backed by a file). This allows
the method to pass the file to an external tool.
The method can process the data with:
def program(self, regionID, offset, data): data.seek(0) bytesWritten = 0 while bytesWritten < data.getSize(): # get next block of data buf = data.getData(self.pageSize) # write buf to flash bytesWritten += len(buf)
12 File-based flash programming in DS-5™
12.8 About getting data to the flash algorithm
ARM DUI0446R Copyright © 2010-2014 ARM. All rights reserved. 12-335Non-Confidential

12.9 About interacting with the targetTo perform flash programming, the programming method might need to access the target.
The flash programmer provides access to the DTSL APIs for this and the programming method can thenget a connection with the getConnection() function of class FlashMethodv1.
This is called from the setup() function of the programming method. If there is already an openconnection, for example, from the DS-5 Debugger, this will be re-used.
def setup(self): # connect to core self.conn = self.getConnection()
Note
An example, flash_example-FVP-A9x4, is provided with DS-5. This example shows two ways ofprogramming flash devices using DS-5, one using a Keil Flash Method and the other using a CustomFlash Method written in Jython. For convenience, the Cortex-A9x4 FVP model supplied with DS-5 isused as the target device. This example can be used as a template for creating new flash algorithms. Thereadme.html provided with the example contains basic information on how to use the example.
Accessing the core
When interacting with the target, it might be necessary to open a connection to the core. If the debuggeralready has an open connection, a new connection might not be always possible. A utility function,ensureDeviceOpen(), is provided that will open the connection only if required. It will return true ifthe connection is open and so should be closed after programming in the teardown() function.
To access the core's registers and memory, the core has to be stopped. Use the ensureDeviceStopped()function to assist with this.
def setup(self): # connect to core & stop self.conn = self.getConnection() coreName = self.getParameter("coreName") self.dev = self.conn.getDeviceInterfaces().get(coreName) self.deviceOpened = ensureDeviceOpen(self.dev) ensureDeviceStopped(self.dev) def teardown(self): if self.deviceOpened: # close device connection if opened by this script self.dev.closeConn()
Reading/writing memory
The core's memory can be accessed using the memWrite(), memFill(), and memRead() functions of thedev object (IDevice).
from com.arm.rddi import RDDI from com.arm.rddi import RDDI_ACC_SIZE from jarray import zeros ... def program(self): ... self.dev.memFill(0, addr, RDDI_ACC_SIZE.RDDI_ACC_WORD, RDDI.RDDI_MRUL_NORMAL, False, words, 0) self.dev.memWrite(0, addr, RDDI_ACC_SIZE.RDDI_ACC_WORD, RDDI.RDDI_MRUL_NORMAL, False, len(buf), buf) ... def verify(self): ... readBuf = zeros(len(buf), 'b') self.dev.memRead(0, addr, RDDI_ACC_SIZE.RDDI_ACC_WORD, RDDI.RDDI_MRUL_NORMAL, len(readBuf), readBuf) ...
12 File-based flash programming in DS-5™
12.9 About interacting with the target
ARM DUI0446R Copyright © 2010-2014 ARM. All rights reserved. 12-336Non-Confidential

Utility routines to make the method code clearer are provided in device_memory:
from flashprogrammer.device_memory import writeToTarget, readFromTarget ... def program(self): ... writeToTarget(self.dev, address, buf) ... def verify(self): ... readBuf = readFromTarget(self.dev, addr, count) ...
Reading and writing registers
The core's registers can be read using the regReadList() and written using the regWriteList()functions of Idevice.
Note
You must be careful to only pass integer values and not long values.
These registers are accessed by using numeric IDs. These IDs are target specific. For example, R0 isregister 1 on a Cortex-A device, but register 0 on a Cortex-M device.
execution.py provides functions that map register names to numbers and allow reading or writing byname.
• writeRegs(device, regs) writes a number of registers to a device. regs is a list of (name, value)pairs. For example:
writeRegs (self.dev, [ ("R0", 0), ("R1", 1234), ("PC", 0x8000) ]
will set R0, R1, and PC (R15).• readReg(device, reg) reads a named register. For example:
value = readReg ("R0")
will read R0 and return its value.
Running code on the core
The core can be started and stopped via the go() and stop() functions. Breakpoints can be set with thesetSWBreak() or setHWBreak() functions and cleared with the clearSWBreak() or clearHWBreak()functions. As it may take some time to reach the breakpoint, before accessing the target further, the scriptshould wait for the breakpoint to be hit and the core stopped.
execution.py provides utility methods to assist with running code on the target.
• To request the core to stop and wait for the stop status event to be received, and raise an error if noevent is received before timeout elapses.
stopDevice(device, timeout=1.0):
• To check the device's status and calls stopDevice() if it is not stopped.
ensureDeviceStopped(device, timeout=1.0):
• To start the core and wait for it to stop, forces the core to stop and raise an error if it doesn't stopbefore timeout elapses. The caller must set the registers appropriately and have set a breakpoint orvector catch to cause the core to stop at the desired address.
runAndWaitForStop(device, timeout=1.0):
12 File-based flash programming in DS-5™
12.9 About interacting with the target
ARM DUI0446R Copyright © 2010-2014 ARM. All rights reserved. 12-337Non-Confidential

• To set a software breakpoint at addr, start the core and wait for it to stop by callingrunAndWaitForStop(). The caller must set the registers appropriately.
runToBreakpoint(device, addr, bpFlags = RDDI.RDDI_BRUL_STD, timeout=1.0):
Flash programming algorithms are often implemented as functions that are run on the target itself. Thesefunctions may take parameters where the parameters are passed through registers.
funcCall() allows methods to call functions that follow AAPCS (with some restrictions):
• Up to the first four parameters are passed in registers R0-R3.• Any parameters above this are passed via the stack.• Only integers up to 32-bit or pointer parameters are supported. Floating point or 64-bit integers are
not supported.• The result is returned in R0.
We can use the above to simulate flash programming by writing the data to RAM. Seeexample_method_1.py. This:
• Connects to the target on setup().• Fills the destination RAM with 0s to simulate erase.• Writes data to a write buffer in working RAM.• Runs a routine that copies the data from the write buffer to the destination RAM.• Verifies the write by reading from the destination RAM.
Loading programming algorithm images onto the target
Programming algorithms are often compiled into .elf images.
FlashMethodv1.locateFile() locates a file for example, from a parameter, resolving any FDB://prefix to absolute paths.
symfile.py provides a class, SymbolFileReader, that allows the programming method to load an imagefile and get the locations of symbols. For example, to get the location of a function:
# load the algorithm image algorithmFile = self.locateFile(self.getParameter('algorithm')) algoReader = SymbolFileReader(algorithmFile) # Find the address of the Program() function funcInfo = algoReader.getFunctionInfo()['Program'] programAddr = funcInfo['address'] if funcInfo['thumb']: # set bit 0 if symbol is thumb programAddr |= 1
image_loader.py provides routines to load the image to the target:
# load algorithm into working RAM algoAddr = self.ramAddr + 0x1000 # allow space for stack, buffers etc loadAllCodeSegmentsToTarget(self.dev, algoReader, algoAddr)
If the algorithm binary was linked as position independent, the addresses of the symbols are relative tothe load address and this offset should be applied when running the code on the target:
programAddr += algoAddr args = [ writeBuffer, destAddr, pageSize ] funcCall(self.dev, programAddr, args, self.stackTop)
Progress reporting
Flash programming can be a slow process, so it is desirable to have progress reporting features. Themethod can do this by calling operationStarted(). This returns an object with functions:
• progress() - update the reported progress.• complete() - report the operation as completed, with a success or failure.
12 File-based flash programming in DS-5™
12.9 About interacting with the target
ARM DUI0446R Copyright © 2010-2014 ARM. All rights reserved. 12-338Non-Confidential

Progress reporting can be added to the program() function in the previous example:
def program(self, regionID, offset, data): # calculate the address to write to region = self.getRegion(regionID) addr = region.getAddress() + offset # Report progress, assuming erase takes 20% of the time, program 50% # and verify 30% progress = self.operationStarted( 'Programming 0x%x bytes to 0x%08x' % (data.getSize(), addr), 100) self.doErase(addr, data.getSize()) progress.progress('Erasing completed', 20) self.doWrite(addr, data) progress.progress('Writing completed', 20+50) self.doVerify(addr, data) progress.progress('Verifying completed', 20+50+30) progress.completed(OperationResult.SUCCESS, 'All done') # register values have been changed return TargetStatus.STATE_LOST
The above example only has coarse progress reporting, only reporting at the end of each phase. Betterresolution can be achieved by allowing each sub-task to have a progress monitor. subOperation()creates a child progress monitor.
Care should be taken to ensure completed() is called on the progress monitor when an error occurs. It isrecommended that a try: except: block is placed around the code after a progress monitor is created.
import java.lang.Exception def program(self, regionID, offset, data): progress = self.operationStarted( 'Programming 0x%x bytes to 0x%08x' % (data.getSize(), addr), 100) try: # Do programming except (Exception, java.lang.Exception), e: # exceptions may be derived from Java Exception or Python Exception # report failure to progress monitor & rethrow progress.completed(OperationResult.FAILURE, 'Failed') raise
Note
import java.lang.Exception - If you omit import and a Java exception is thrown, you may get aconfusing error report from Jython indicating that it cannot find the Java namespace. Further, the pythonline location indicated as the source of the error will not be accurate.
Cancellation
If you wish to abort a long-running flash operation, programming methods can call isCancelled() tocheck if the operation is cancelled. If this returns true, the method stops programming.
Note
The teardown() functions are still called.
Messages
The programming method can report messages by calling the following:
• warning() - reports a warning message.• info() - reports an informational message.• debug() - reports a debug message - not normally displayed.
12 File-based flash programming in DS-5™
12.9 About interacting with the target
ARM DUI0446R Copyright © 2010-2014 ARM. All rights reserved. 12-339Non-Confidential

Locating and resolving files
FlashMethodv1.locateFile() locates a file for example, from a parameter, resolving any FDB://prefix to absolute paths.
This searches paths of all flash subdirectories of every configuration database configured in DS-5.
For example:
<DS5_INSTALL_DIR>/sw/debugger/configdb/Flash/
c:\MyDB\Flash
Error handling
Exceptions are thrown when errors occur. Errors from the API calls made by the programming methodwill be com.arm.debug.flashprogrammer.FlashProgrammerException (or derived from this).Methods may also report errors using Python's raise keyword. For example, if verification fails:
# compare contentsres = compareBuffers(buf, readBuf)if res != len(buf): raise FlashProgrammerRuntimeException, "Verify failed at address: %08x" %(addr + res)
If a programming method needs to ensure that a cleanup occurs when an exception is thrown, thefollowing code forms a template:
import java.lang.Exception ... try: # Do programming except (Exception, java.lang.Exception), e: # exceptions may be derived from Java Exception or Python Exception # report failure to progress monitor & rethrow # Handle errors here # Rethrow original exception raise finally: # This is always executed on success or failure # Close resources here
See the Progress handler section for example usage.
Note
import java.lang.Exception - If you omit import and a Java exception is thrown, you may get aconfusing error report from Jython indicating that it cannot find the Java namespace. Further, the pythonline location indicated as the source of the error will not be accurate.
Running an external tool
Some targets may already have a standalone flash programming tool. It is possible to create a DS-5Debugger programming method to call this tool, passing it to the path of the image to load. Thefollowing example shows how to do this, using the fromelf tool in place of a real flash programmingtool.
from flashprogrammer.flash_method_v1 import FlashMethodv1 from com.arm.debug.flashprogrammer.IProgress import OperationResult from com.arm.debug.flashprogrammer import TargetStatus import java.lang.Exception import subprocess class RunProgrammer(FlashMethodv1): def __init__(self, methodServices): FlashMethodv1.__init__(self, methodServices) def program(self, regionID, offset, data):
12 File-based flash programming in DS-5™
12.9 About interacting with the target
ARM DUI0446R Copyright © 2010-2014 ARM. All rights reserved. 12-340Non-Confidential

progress = self.operationStarted( 'Programming 0x%x bytes with command %s' % (data.getSize(), ' '.join(cmd)), 100) try: # Get the path of the image file file = data.getUnderlyingFile().getCanonicalPath() cmd = [ 'fromelf', file ] self.info("Running %s" % ' '.join(cmd)) # run command proc = subprocess.Popen(cmd, stdout=subprocess.PIPE) out, err = proc.communicate() # pass command output to user as info message self.info(out) progress.progress('Completed', 100) progress.completed(OperationResult.SUCCESS, 'All done') except (Exception, java.lang.Exception), e: # exceptions may be derived from Java Exception or Python Exception # report failure to progress monitor & rethrow progress.completed(OperationResult.FAILURE, 'Failed') raise return TargetStatus.STATE_RETAINED
os.environ can be used to lookup environment variables, for example, the location of a target'stoolchain:
programmerTool = os.path.join(os.environ['TOOLCHAIN_INSTALL'], 'flashprogrammer')
Setup and teardown
The flash configuration file can specify scripts to be run before and after flash programming. These aretermed setup and teardown scripts and are defined using setup and teardown tags. The setup script shouldput the target into a state ready for flash programming.
This might involve one or more of:
• Reset the target.• Disable interrupts.• Disable peripherals that might interfere with flash programming.• Setup DRAM.• Enable flash control.• Setup clocks appropriately.
The teardown script should return the target to a usable state following flash programming.
In both cases, it may be necessary to reset the target. The following code can be used to stop the core onthe reset vector.
Note
This example code assumes that the core supports the RSET vector catch feature.
def setup(client, services): # get a connection to the core conn = services.getConnection() dev = conn.getDeviceInterfaces().get("Cortex-M3") ensureDeviceOpen(dev) ensureDeviceStopped(dev) dev.setProcBreak("RSET") dev.systemReset(0) # TODO: wait for stop! dev.clearProcBreak("RSET")
12 File-based flash programming in DS-5™
12.9 About interacting with the target
ARM DUI0446R Copyright © 2010-2014 ARM. All rights reserved. 12-341Non-Confidential

Other ways of providing flash method parameters
The flash configuration file can provide flash region information and flash parameter informationencoded into the XML. However, for some methods, this information may need to be extracted from theflash algorithm itself.
Programming methods can extend any information in the flash configuration file (if any) with addressregions and parameters for the method by overriding a pair of class methods - getDefaultRegions()and getDefaultParameters().
getDefaultParameters(). from com.arm.debug.flashprogrammer import FlashRegion ... class ProgrammingMethod(FlashMethodv1): ... def getDefaultRegions(self): return [ FlashRegion(0x00100000, 0x10000), FlashRegion(0x00200000, 0x10000) ] def getDefaultParameters(self): params = {} params['param1'] = "DefaultValue1" params['param2'] = "DefaultValue2" return params
The above code defines two 64kB regions at 0x00100000 and 0x00200000. Regions supplied by thismethod are only used if no regions are specified for the device in the configuration file. The above codedefines 2 extra parameters. These parameters are added to the parameters in the flash configuration. If aparameter is defined in both, the default value in the flash configuration file is used. This region andparameter information can be extracted from the algorithm binary itself (rather than being hard-coded asin the above example). The Keil algorithm images contain a data structure defining regions covered bythe device and the programming parameters for the device. The Keil programming method loads thealgorithm binary (specified by a parameter in the configuration file) and extracts this information toreturn in these calls.
12 File-based flash programming in DS-5™
12.9 About interacting with the target
ARM DUI0446R Copyright © 2010-2014 ARM. All rights reserved. 12-342Non-Confidential

Chapter 13Writing OS awareness for DS-5™ Debugger
Describes the OS awareness feature available in DS-5.It contains the following sections:
• 13.1 About Writing operating system awareness for DS-5™ Debugger on page 13-344.• 13.2 Creating an OS awareness extension on page 13-345.• 13.3 Implementing the OS awareness API on page 13-349.• 13.4 Enabling the OS awareness on page 13-351.• 13.5 Implementing thread awareness on page 13-355.• 13.6 Implementing data views on page 13-358.• 13.7 Programming advice and noteworthy information on page 13-361.
ARM DUI0446R Copyright © 2010-2014 ARM. All rights reserved. 13-343Non-Confidential

13.1 About Writing operating system awareness for DS-5™ DebuggerDS-5 Debugger offers an Application Programming Interface (API) for third parties to contributeawareness for their operating systems (OS).
The OS awareness extends the debugger to provide a representation of the OS threads - or tasks - andother relevant data structures, typically semaphores, mutexes, or queues.
Thread-awareness, in particular, enables the following features in the debugger:
• Setting breakpoints for a particular thread, or a group of threads.• Displaying the call stack for a specific thread.• For any given thread, inspecting local variables and register values at a selected stack frame.
To illustrate different stages of the implementation, this chapter explains how to add support for afictional OS named myos.
The steps can be summarized as follows:
1. Create a new configuration database folder to host the OS awareness extension and add it to the DS-5Debugger preferences in Eclipse.
2. Create the files extension.xml and messages.properties so that the extension appears on the OSAwareness tab in the Debug configuration dialog.
3. Add provider.py and implement the awareness enablement logic.4. Add contexts.py and implement the thread awareness.5. Add tasks.py to contribute a table to the RTOS Data view, showing detailed information about
tasks.
13 Writing OS awareness for DS-5™ Debugger13.1 About Writing operating system awareness for DS-5™ Debugger
ARM DUI0446R Copyright © 2010-2014 ARM. All rights reserved. 13-344Non-Confidential

13.2 Creating an OS awareness extensionThe debugger searches for OS awareness extensions in its configuration database. All files pertaining toa particular extension must be located in a folder or at the root of a Java Archive (JAR) file in theconfiguration database OS/ folder.
The actual name of the folder or JAR file is not relevant and is not shown anywhere. Within this folderor JAR file, the debugger looks for a file named extension.xml to discover the OS awareness extension.
The actual name of the folder or JAR file is not relevant and is not shown anywhere. Within this folderor JAR file, the debugger looks for a file named extension.xml to discover the OS awareness extension.
This file contains the following information:
• The OS name, description, and, optionally, a logo to display in the OS Awareness selection pane.• The root Python script or Java class providing the actual implementation.• The details of cores, architectures, or platforms this implementation applies to.
You can create a new OS awareness extension by directly modifying the configuration database in theDS-5 installation folder with appropriate access privilages, but this is not recommended.
Instead, create a new configuration database folder, containing an empty folder named OS (upper case):
<some folder> /mydb /OS
Then, add mydb to the known configuration databases in the Eclipse preferences panel for DS-5.
1. In Eclipse, go to menu Windows > Preferences, then expand the DS-5 node and selectConfiguration Database.
2. Then click Add and enter the path to mydb.
13 Writing OS awareness for DS-5™ Debugger13.2 Creating an OS awareness extension
ARM DUI0446R Copyright © 2010-2014 ARM. All rights reserved. 13-345Non-Confidential

Figure 13-1 Eclipse preferences for mydb
Note
The some folder entry is represented by /work/home in Figure 1.
3. Now, add the OS awareness extension in mydb/OS. To do so, create a new folder named myoscontaining the following files:
<some folder> /mydb /OS /myos /extension.xml /messages.properties
As explained earlier, extension.xml declares the OS awareness extension. The schema describingthe structure of file extension.xml can be found in the DS-5 installation folder at sw/debugger/configdb/Schemas/os_extension.xsd.
The file messages.properties contains all user-visible strings. The file format is documented here:
http://docs.oracle.com/javase/7/docs/api/java/util/Properties.html#load(java.io.Reader)
13 Writing OS awareness for DS-5™ Debugger13.2 Creating an OS awareness extension
ARM DUI0446R Copyright © 2010-2014 ARM. All rights reserved. 13-346Non-Confidential

Having user-visible strings in a separate file allows them to be translated. The debugger searches fortranslations in the following order in the named files:
• First messages_<language code>_<country code>.properties,• Then messages_<language code>.properties,• And finally in messages.properties.
Language and country codes are defined here respectively:
• http://www.loc.gov/standards/iso639-2/englangn.html• http://www.iso.ch/iso/en/prods-services/iso3166ma/02iso-3166-code-lists/list-en1.html
4. Consider the following content to start adding support for myos:
• extension.xml
<?xml version="1.0" encoding="UTF-8"?><os id="myos" version="5.15" xmlns="http://www.arm.com/os_extension"> <name>myos.title</name> <description>myos.desc</description> <provider><!-- todo --></provider></os>
Note
The version attribute in the OS element refers to the API version, which is aligned with the version ofDS-5 the API was made public with. There currently is a unique API version: 5.15. In the future,there may be higher versions as the API evolves. Backwards compatibility will be maintained asmuch as possible, until earlier versions start being unsupported. The debugger will no longer loadextensions built against an unsupported version of the API.
• messages.properties
myos.title=My OSmyos.desc=This is My OS.myos.help=Displays information about My OS.
This is sufficient for the OS awareness extension to appear in the Eclipse debug configuration, eventhough the implementation is obviously not complete and would cause errors if it is used for an actualdebugger connection at this stage:
13 Writing OS awareness for DS-5™ Debugger13.2 Creating an OS awareness extension
ARM DUI0446R Copyright © 2010-2014 ARM. All rights reserved. 13-347Non-Confidential

The myos.help string is only visible from the debugger's command line interface, for instance, whentyping help myos once connected.
Using the extension.xml, you can include a reference to an image file to be shown above thedescription in the OS Awareness tab. Supported image formats are .BMP, .GIF, .JPEG, .PNG,and .TIFF.
Also, it is possible to control the targets for which the OS awareness extension is available.
The complete XML schema for extension.xml file is available in [DS-5 install folder]/sw/debugger/configdb/Schemas/os_extension.xsd.
Figure 13-2 Custom OS awareness displayed in Eclipse Debug Configurations dialog
13 Writing OS awareness for DS-5™ Debugger13.2 Creating an OS awareness extension
ARM DUI0446R Copyright © 2010-2014 ARM. All rights reserved. 13-348Non-Confidential

13.3 Implementing the OS awareness APIThe OS awareness API consists of callbacks that the debugger makes at specific times. For eachcallback, the debugger provides a means for the implementation to retrieve information about the targetand resolve variables and pointers, through an expression evaluator.
The API exists primarily as a set of Java interfaces since the debugger itself is written in Java. However,the debugger provides a Python interpreter and bindings to translate calls between Python and Java,allowing the Java interfaces to be implemented by Python scripts. This section and the next ones refer tothe Java interfaces but explain how to implement the extension in Python.
Note
A Python implementation does not require any particular build or compilation environment, as opposedto a Java implementation. On the other hand, investigating problems within Python code is moredifficult, and you are advised to read the Programming advice and noteworthy information sectionbefore starting to write your own Python implementation.
The detailed Java interfaces to implement are available in the DS-5 installation folder under sw/eclipse/dropins/plugins, within the com.arm.debug.extension.source_<version>.jar file.
Note
You are encouraged to read the Javadoc documentation on Java interfaces as it contains essentialinformation that is not presented here.
The Java interface of immediate interest at this point is IOSProvider, in the packagecom.arm.debug.extension.os. This interface must be implemented by the provider instance that wasleft out with a todo comment in extension.xml.
First, add the simplest implementation to the configuration database entry:
<some folder> /mydb /OS /myos /extension.xml /messages.properties /provider.py
• extension.xml
<?xml version="1.0" encoding="UTF-8"?><os id="myos" version="5.15" xmlns="http://www.arm.com/os_extension"> <name>myos.title</name> <description>myos.desc</description> <provider>provider.py</provider></os>
• provider.py
# this script implements the Java interface IOSProviderdef areOSSymbolsLoaded(debugger): return False
def isOSInitialised(debugger): return False
def getOSContextProvider(): return None
def getDataModel(): return None
This is enough to make the OS awareness implementation valid, and a debug configuration with this OSawareness selected will work, although this would not add anything on top of a plain bare-metalconnection. However, this illustrates the logical lifecycle of the OS awareness:
13 Writing OS awareness for DS-5™ Debugger13.3 Implementing the OS awareness API
ARM DUI0446R Copyright © 2010-2014 ARM. All rights reserved. 13-349Non-Confidential

1. Ensure debug information for the OS is available. On loading symbols, the debugger callsareOSSymbolsLoaded(); the implementation returns true if it recognizes symbols as belonging tothe OS, enabling the next callback.
2. Ensure the OS is initialized. Once the symbols for the OS are available, the debugger callsisOSInitialised(), immediately if the target is stopped or whenever the target stops next. This isan opportunity for the awareness implementation to check that the OS has reached a state wherethreads and other data structures are ready to be read, enabling the next two callbacks.
3. Retrieve information about threads and other data structures. Once the OS is initialized, the debuggercalls out to getOSContextProvider() and getDataModel() to read information from the target. Inreality, the debugger may call out to getOSContextProvider() and getDataModel() earlier on, butdoes not use the returned objects to read from the target until areOSSymbolsLoaded() andisOSInitialised() both returned true.
13 Writing OS awareness for DS-5™ Debugger13.3 Implementing the OS awareness API
ARM DUI0446R Copyright © 2010-2014 ARM. All rights reserved. 13-350Non-Confidential

13.4 Enabling the OS awarenessThe below implementation in provider.py, assumes myos has a global variable called tasks listing theOS tasks in an array and another global variable scheduler_running indicating that the OS has startedscheduling tasks.
# this script implements the Java interface IOSProviderfrom osapi import DebugSessionException
def areOSSymbolsLoaded(debugger): return debugger.symbolExists("tasks") \ and debugger.symbolExists("scheduler_running")
def isOSInitialised(debugger): try: result = debugger.evaluateExpression("scheduler_running") return result.readAsNumber() == 1 except DebugSessionException: return False
def getOSContextProvider(): return None
def getDataModel(): return None
The osapi module in the import statement at the top of provider.py is a collection of wrappers aroundJava objects and utility functions. The file osapi.py itself can be found in JAR filecom.arm.debug.extension_<version>.jar.
Connecting to a running target and loading symbols manually for the OS shows bothareOSSymbolsLoaded() and isOSInitialised() stages distinctly.
• On connecting to the target running the OS, without loading symbols, the Debug Control viewdisplays No OS Support.
Figure 13-3 myos No OS Support
13 Writing OS awareness for DS-5™ Debugger13.4 Enabling the OS awareness
ARM DUI0446R Copyright © 2010-2014 ARM. All rights reserved. 13-351Non-Confidential

• After loading symbols for the OS, with the target still running, the Debug Control view now displaysWaiting for the target to stop. At this point, areOSSymbolsLoaded() has been called and returnedtrue, and the debugger is now waiting for the target to stop to call isOSInitialised().
Figure 13-4 myos waiting for target to stop• As soon as the target is stopped, the Debug Control view updates to show the OS awareness is
enabled. At this point, isOSInitialised() has been called and returned true.
13 Writing OS awareness for DS-5™ Debugger13.4 Enabling the OS awareness
ARM DUI0446R Copyright © 2010-2014 ARM. All rights reserved. 13-352Non-Confidential

Figure 13-5 myos Enabled• Another case worth mentioning is where areOSSymbolsLoaded() returns true but
isOSInitialised() returns false. This can happen for instance when connecting to a stoppedtarget, loading both the kernel image to the target and associated symbols in the debugger and startingdebugging from a point in time earlier than the OS initialization, for example, debugging from theimage entry point. In this case, the Debug Control view shows Waiting for the OS to be initialisedas scheduler_running is not set to 1 yet, but symbols are loaded:
13 Writing OS awareness for DS-5™ Debugger13.4 Enabling the OS awareness
ARM DUI0446R Copyright © 2010-2014 ARM. All rights reserved. 13-353Non-Confidential

Figure 13-6 myos waiting for OS initialization
Without the call to isOSInitialised() the debugger lets the awareness implementation start readingpotentially uninitialized memory, which is why this callback exists. The debugger keeps calling backto isOSInitialised() on subsequent stops until it returns true, and the OS awareness can finally beenabled.
13 Writing OS awareness for DS-5™ Debugger13.4 Enabling the OS awareness
ARM DUI0446R Copyright © 2010-2014 ARM. All rights reserved. 13-354Non-Confidential

13.5 Implementing thread awarenessThread awareness is probably the most significant part of the implementation.
The corresponding call on the API is getOSContextProvider(), where context here means executioncontext, as in a thread or a task. The API expects an instance of the Java interfaceIOSContextProvider to be returned by getOSContextProvider(). This interface can be found inpackage com.arm.debug.extension.os.context within the same JAR file as IOSProvider mentionedearlier.
Given the following C types for myos tasks:
typedef enum { UNINITIALIZED = 0, READY} tstatus_t ;
typedef struct { uint32_t id; char *name; volatile tstatus_t status; uint32_t stack[STACK_SIZE]; uint32_t *sp;} task_t;
And assuming the OS always stores the currently running task at the first element of the tasks array,further callbacks can be implemented to return the currently running (or scheduled) task and all the tasks(both scheduled and unscheduled) in a new contexts.py file:
<some folder> /mydb /OS /myos /extension.xml /messages.properties /provider.py /contexts.py
• provider.py
# this script implements the Java interface IOSProviderfrom osapi import DebugSessionExceptionfrom contexts import ContextsProvider
def areOSSymbolsLoaded(debugger): […]
def isOSInitialised(debugger): […]
def getOSContextProvider(): # returns an instance of the Java interface IOSContextProvider return ContextsProvider()
def getDataModel(): […]
• contexts.py
from osapi import ExecutionContextfrom osapi import ExecutionContextsProvider
# this class implements the Java interface IOSContextProviderclass ContextsProvider(ExecutionContextsProvider): def getCurrentOSContext(self, debugger): task = debugger.evaluateExpression("tasks[0]") return self.createContext(debugger, task) def getAllOSContexts(self, debugger): tasks = debugger.evaluateExpression("tasks").getArrayElements() contexts = [] for task in tasks: if task.getStructureMembers()["status"].readAsNumber() > 0: contexts.append(self.createContext(debugger, task)) return contexts def getOSContextSavedRegister(self, debugger, context, name):
13 Writing OS awareness for DS-5™ Debugger13.5 Implementing thread awareness
ARM DUI0446R Copyright © 2010-2014 ARM. All rights reserved. 13-355Non-Confidential

return None
def createContext(self, debugger, task): members = task.getStructureMembers() id = members["id"].readAsNumber() name = members["name"].readAsNullTerminatedString() context = ExecutionContext(id, name, None) return context
Although getOSContextSavedRegister() is not yet implemented, this is enough for the debugger tonow populate the Debug Control view with the OS tasks as soon as the OS awareness is enabled:
Figure 13-7 myos Debug Control view data
Decoding the call stack of the currently running task and inspecting local variables at specific stackframes for that task works without further changes since the task's registers values are read straight fromthe core's registers. For unscheduled tasks, however, getOSContextSavedRegister() must beimplemented to read the registers values saved by the OS on switching contexts. How to read thosevalues depends entirely on the OS context switching logic.
Here is the implementation for myos, based on a typical context switching routine for M-class ARMprocessors where registers are pushed onto the stack when a task is switched out by the OS scheduler:
from osapi import ExecutionContextfrom osapi import ExecutionContextsProvider
STACK_POINTER = "stack pointer"REGISTER_OFFSET_MAP = {"R4":0L, "R5":4L, "R6":8L, "R7":12L, "R8":16L, "R9":20L, "R10":24L, "R11":28L, "R0":32L, "R1":36L, "R2":40L, "R3":44L, "R12":48L, "LR":52L, "PC":56L, "XPSR":60L, "SP":64L}
# this class implements the Java interface IOSContextProviderclass ContextsProvider(ExecutionContextsProvider):
def getCurrentOSContext(self, debugger): […]
def getAllOSContexts(self, debugger): […]
def getOSContextSavedRegister(self, debugger, context, name):
13 Writing OS awareness for DS-5™ Debugger13.5 Implementing thread awareness
ARM DUI0446R Copyright © 2010-2014 ARM. All rights reserved. 13-356Non-Confidential

offset = REGISTER_OFFSET_MAP.get(name) base = context.getAdditionalData()[STACK_POINTER] addr = base.addOffset(offset)
if name == "SP": # SP itself isn’t pushed onto the stack: return its computed value return debugger.evaluateExpression("(long)" + str(addr)) else: # for any other register, return the value at the computed address return debugger.evaluateExpression("(long*)" + str(addr))
def createContext(self, debugger, task): members = task.getStructureMembers() id = members["id"].readAsNumber() name = members["name"].readAsNullTerminatedString() context = ExecutionContext(id, name, None) # record the stack address for this task in the context’s # additional data; this saves having to look it up later in # getOSContextSavedRegister() stackPointer = members["sp"].readAsAddress() context.getAdditionalData()[STACK_POINTER] = stackPointer return context
The debugger can now get the values of saved registers, allowing unwinding the stack of unscheduledtasks.
Note
Enter info threads in the Commands view to display similar information as displayed in the DebugControl view.
13 Writing OS awareness for DS-5™ Debugger13.5 Implementing thread awareness
ARM DUI0446R Copyright © 2010-2014 ARM. All rights reserved. 13-357Non-Confidential

13.6 Implementing data viewsAlong with threads, OS awareness can provide arbitrary tabular data, which the debugger shows in theRTOS Data view.
The corresponding callback on the API is getDataModel(). It must return an instance of the Javainterface com.arm.debug.extension.datamodel.IDataModel, which sources can be found incom.arm.debug.extension.source_<version>.jar.
This section demonstrates how to implement a view, listing the tasks, including all available information.The following additions to the implementation creates an empty Tasks table in the RTOS Data view:
<some folder> /mydb /OS /myos /extension.xml /messages.properties /provider.py /contexts.py /tasks.py
• provider.py
# this script implements the Java interface IOSProviderfrom osapi import DebugSessionExceptionfrom osapi import Modelfrom contexts import ContextsProviderfrom tasks import Tasks
def areOSSymbolsLoaded(debugger): […]
def isOSInitialised(debugger): […]
def getOSContextProvider(): […]
def getDataModel(): # returns an instance of the Java interface IDataModel return Model("myos", [Tasks()])
• messages.properties
myos.title=My OSmyos.desc=This is My OS.myos.help=Displays information about My OS.
tasks.title=Taskstasks.desc=This table shows all tasks, including uninitialized onestasks.help=Displays tasks defined within the OS and their current status.
tasks.id.title=Tasktasks.id.desc=The task identifiertasks.name.title=Nametasks.name.desc=The task nametasks.status.title=Statustasks.status.desc=The task statustasks.priority.title=Prioritytasks.priority.desc=The task prioritytasks.sp.title=Stack pointertasks.sp.desc=This task's stack address
• tasks.py
from osapi import Tablefrom osapi import createFieldfrom osapi import DECIMAL, TEXT, ADDRESS
# this class implements the Java interface IDataModelTableclass Tasks(Table): def __init__(self): id = "tasks" fields = [createField(id, "id", DECIMAL), createField(id, "name", TEXT), createField(id, "status", TEXT), createField(id, "priority", DECIMAL), createField(id, "sp", ADDRESS)]
13 Writing OS awareness for DS-5™ Debugger13.6 Implementing data views
ARM DUI0446R Copyright © 2010-2014 ARM. All rights reserved. 13-358Non-Confidential

Table.__init__(self, id, fields)
def getRecords(self, debugger): records = [] # todo
Functions createField and Table.__init__() automatically build up the keys to look for at run-time in the messages.properties file. Any key that is not found in messages.properties isprinted as is.
The above modifications create a new empty Tasks table:
Figure 13-8 myos Empty Tasks table
To populate the table, getRecords() in tasks.py must be implemented:
from osapi import Tablefrom osapi import createFieldfrom osapi import createNumberCell, createTextCell, createAddressCellfrom osapi import DECIMAL, TEXT, ADDRESS
# this class implements the Java interface IDataModelTableclass Tasks(Table): def __init__(self): […]
def readTask(self, task, first): members = task.getStructureMembers() id = members["id"].readAsNumber()
if (members["status"].readAsNumber() == 0): status = "Uninitialized" name = None sp = None priority = None else: if (first): status = "Running" else: status = "Ready"
name = members["name"].readAsNullTerminatedString() sp = members["sp"].readAsAddress() priority = members["priority"].readAsNumber()
cells = [createNumberCell(id), createTextCell(name), createTextCell(status), createNumberCell(priority), createAddressCell(sp)]
13 Writing OS awareness for DS-5™ Debugger13.6 Implementing data views
ARM DUI0446R Copyright © 2010-2014 ARM. All rights reserved. 13-359Non-Confidential

return self.createRecord(cells) def getRecords(self, debugger): records = [] tasks = debugger.evaluateExpression("tasks").getArrayElements() first = True for task in tasks: records.append(self.readTask(task, first)) first = False return records
With this implementation, the Tasks table now shows the following values:
Figure 13-9 myos populated Tasks table
Note
The debugger command info myos tasks prints the same information in the Commands view.
13 Writing OS awareness for DS-5™ Debugger13.6 Implementing data views
ARM DUI0446R Copyright © 2010-2014 ARM. All rights reserved. 13-360Non-Confidential

13.7 Programming advice and noteworthy informationInvestigating issues in Python code for an OS awareness extension can sometimes be difficult.
Here are a few recommendations to make debugging easier:
• Start Eclipse from a console.Python print statements go to the Eclipse process standard output/errorstreams, which are not visible unless Eclipse is started from a console.
— On Linux, open a new terminal and run:
<DS-5 installation folder>/bin/eclipse
— On Windows, open command prompt and run:
<DS-5 installation folder>\bin\eclipsec
Note the trailing c in eclipsec.• Use the Error Log view.Most errors that occur in the debugger are logged in details in the Error
Log view. The full stack trace of an error is particularly useful as it often contains references to thelocation in the source files that generated the error.
• Turn on verbose error logging in the debugger
Although most errors are logged in the Error Log view, any error happening in the debugger eventprocessing logic is not. One alternative is to turn on verbose error logging to print the full stack traceof errors in the Console view.
To turn on verbose error logging, execute the following command early in the debug session:
log config infoex
Note
— It is worth understanding that an OS awareness implementation interacts at the deepest level withthe debugger, and some errors may cause the debugger to lose control of the target.
— Also note that semihosting is not available when OS awareness is specified.
13 Writing OS awareness for DS-5™ Debugger13.7 Programming advice and noteworthy information
ARM DUI0446R Copyright © 2010-2014 ARM. All rights reserved. 13-361Non-Confidential