Embed Size (px)
Citation preview
261 2008-09 End of Year Report_060409 DataSet
1
Lodi Unified School District2008-09 Year-End Benchmark
Assessment Results (Student Achievement Monitoring)
Prepared by the Educational Services Division
September 1, 2009
261 2008-09 End of Year Report_060409 DataSet 2
Executive Summary The district’s system of benchmark assessments helps the district meet its
obligation to monitor student progress using curriculum-embedded assessments. [Essential Program Component #5]
K-8 English Language Arts Results More than 50% of the students tested during each quarter in 3 of the 9 grades
(grades K,1, and 2) exhibited a proficient mastery of English Language Arts as measured by the benchmark assessments.
More than 50% of the students tested in 2 of the 7 numerically significant ethnic subgroups (Filipino and White) were proficient on each of the quarter’s benchmark assessment.
K-8 Mathematics Results. K-6 proficiency rates were higher for students using the new adoption
(enVision) math curriculum and assessments than those using the old adoption (Harcourt) math curriculum and assessments.
There appeared to be a drop off in middle school math proficiency rates throughout the year as the fourth quarter’s results were generally lower than first quarter’s results for each middle school math benchmark assessment.
However, for the K-8 grade segment, there was an increase in the percentage of proficient students in each of the numerically significant ethnic subgroups throughout the school year except for Pacific Islander students.
261 2008-09 End of Year Report_060409 DataSet 3
Executive Summary 9-12 English Language Arts Results
Proficiency rates were generally higher in grades 9 and 10 and lower in grades 11 and 12 throughout the school year.
Additionally, there was a general drop off in proficiency rates from the first quarter’s results to the fourth quarter’s results for each grade level and numerically significant ethnic subgroup.
9-12 Mathematics Results Similar to the English Language Arts’ results, there
appeared to be a general drop off in proficiency rates from the first quarter’s results to the fourth quarter’s results for each high school math benchmark assessment.
Algebra Readiness Algebra
261 2008-09 End of Year Report_060409 DataSet 4
General Purpose of Benchmark Assessments To align instruction across the district, and ensure that
instruction is aligned to the adopted standards-based core curriculum.
To inform teachers and administrators on student progress and effectiveness of instruction in the adopted standards-based core curriculum.
To provide timely data to teachers and administrators to make decisions that will improve instruction and student achievement.
To provide data to identify students who need interventions.
To assist in the monitoring of individual student progress.
261 2008-09 End of Year Report_060409 DataSet 5
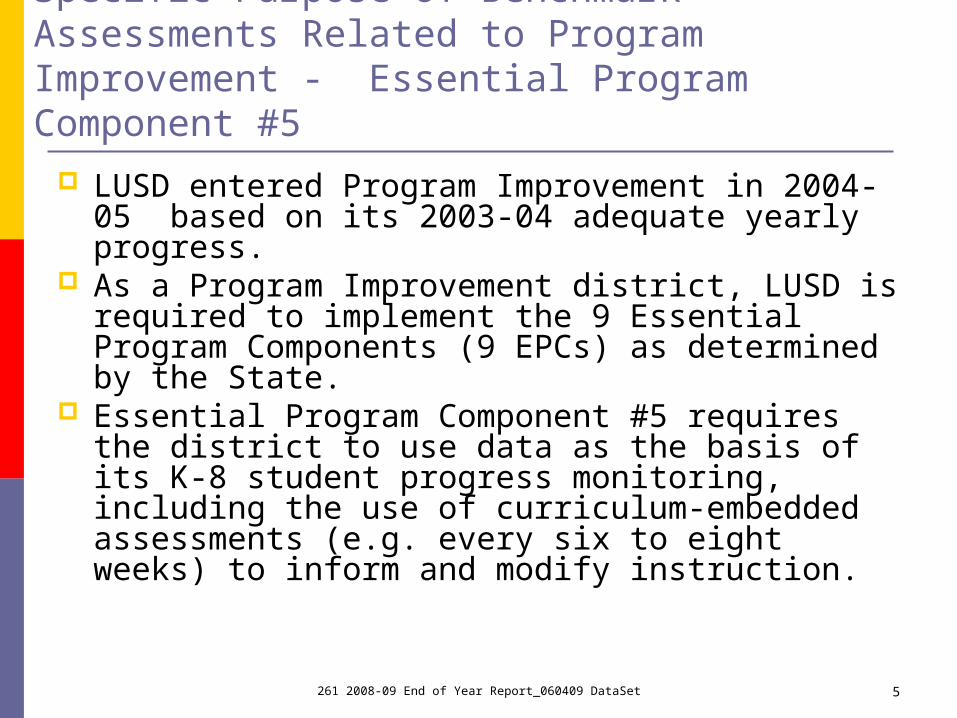
Specific Purpose of Benchmark Assessments Related to Program Improvement - Essential Program Component #5
LUSD entered Program Improvement in 2004-05 based on its 2003-04 adequate yearly progress.
As a Program Improvement district, LUSD is required to implement the 9 Essential Program Components (9 EPCs) as determined by the State.
Essential Program Component #5 requires the district to use data as the basis of its K-8 student progress monitoring, including the use of curriculum-embedded assessments (e.g. every six to eight weeks) to inform and modify instruction.
261 2008-09 End of Year Report_060409 DataSet 6
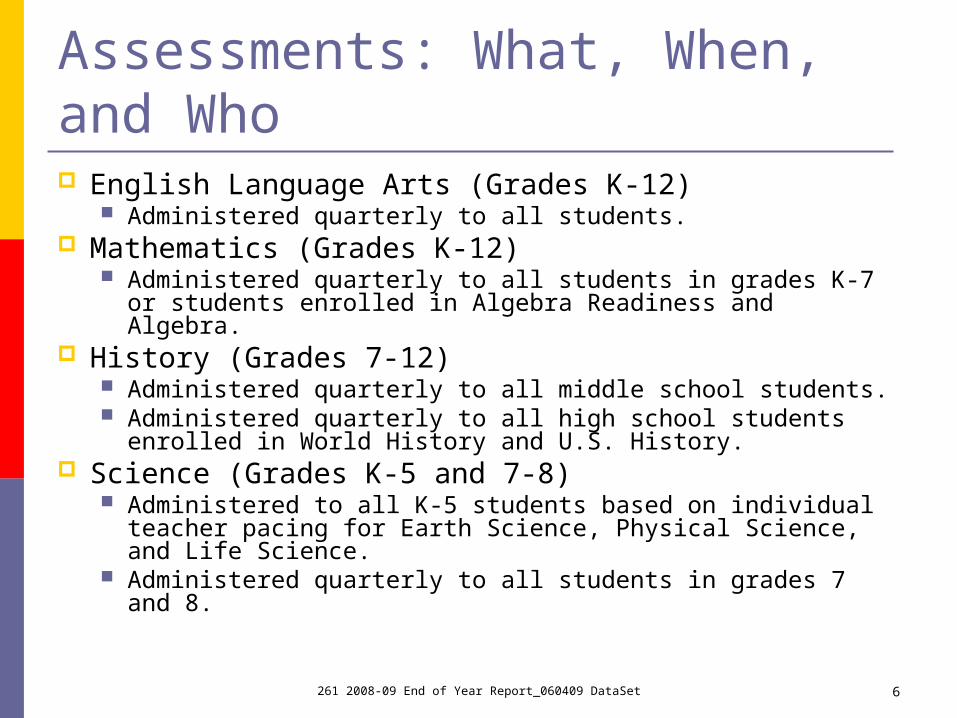
Assessments: What, When, and Who English Language Arts (Grades K-12)
Administered quarterly to all students. Mathematics (Grades K-12)
Administered quarterly to all students in grades K-7 or students enrolled in Algebra Readiness and Algebra.
History (Grades 7-12) Administered quarterly to all middle school students. Administered quarterly to all high school students
enrolled in World History and U.S. History. Science (Grades K-5 and 7-8)
Administered to all K-5 students based on individual teacher pacing for Earth Science, Physical Science, and Life Science.
Administered quarterly to all students in grades 7 and 8.
261 2008-09 End of Year Report_060409 DataSet
7
Grades K-8 Benchmark
Assessment Results
261 2008-09 End of Year Report_060409 DataSet 8
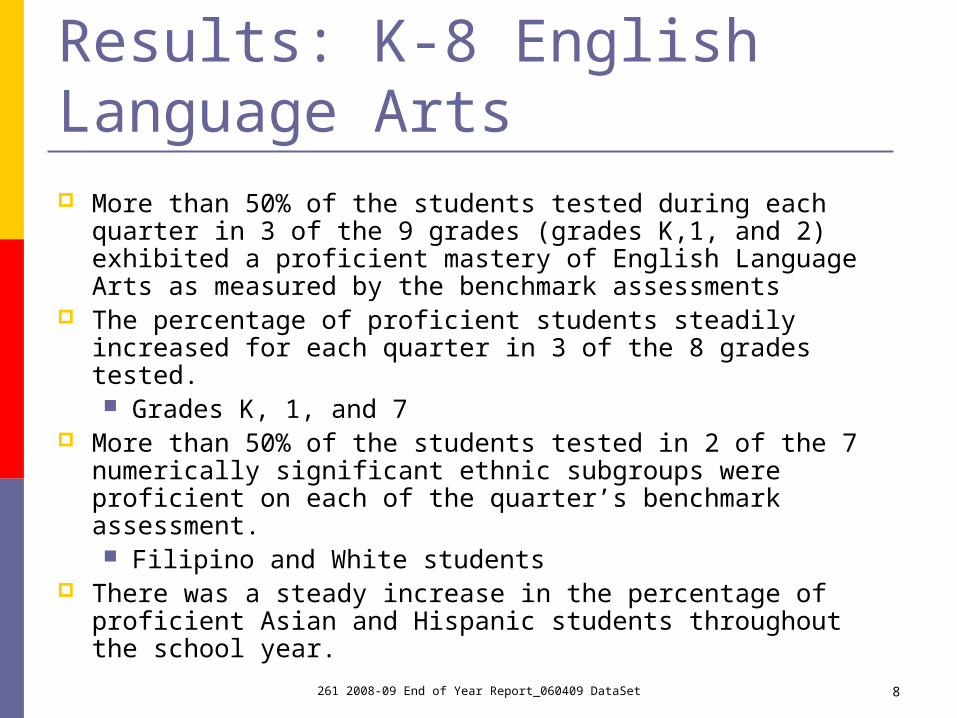
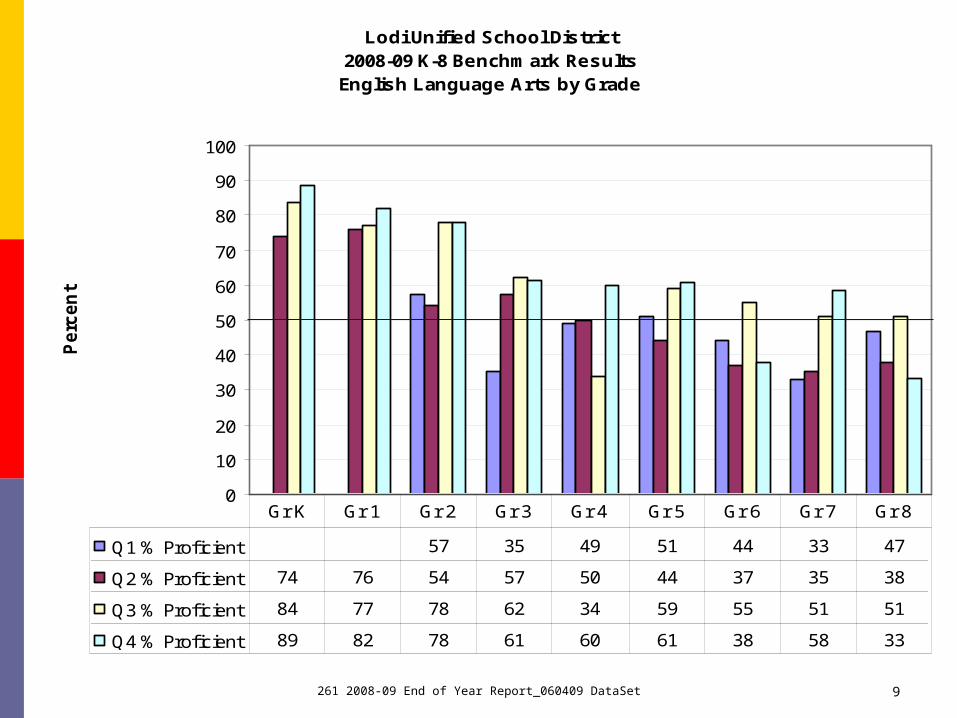
Results: K-8 English Language Arts More than 50% of the students tested during each quarter
in 3 of the 9 grades (grades K,1, and 2) exhibited a proficient mastery of English Language Arts as measured by the benchmark assessments
The percentage of proficient students steadily increased for each quarter in 3 of the 8 grades tested. Grades K, 1, and 7
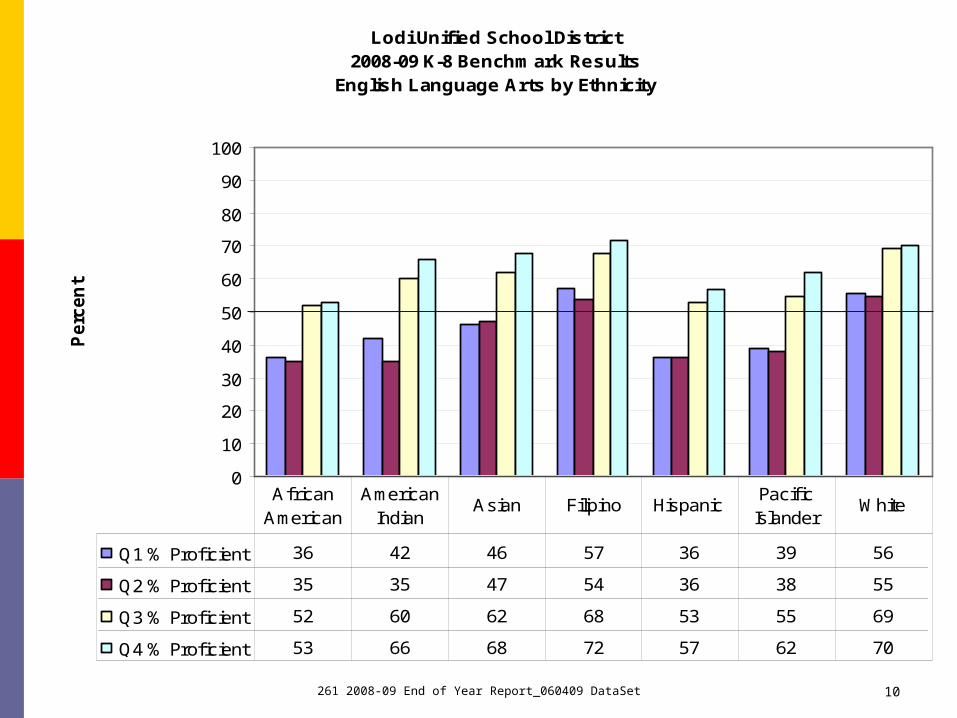
More than 50% of the students tested in 2 of the 7 numerically significant ethnic subgroups were proficient on each of the quarter’s benchmark assessment. Filipino and White students
There was a steady increase in the percentage of proficient Asian and Hispanic students throughout the school year.
261 2008-09 End of Year Report_060409 DataSet 9
Lodi Unified School District 2008-09 K-8 Benchmark ResultsEnglish Language Arts by Grade
0
10
20
30
40
50
60
70
80
90
100
Perc
en
t
Q1 % Proficient 57 35 49 51 44 33 47
Q2 % Proficient 74 76 54 57 50 44 37 35 38
Q3 % Proficient 84 77 78 62 34 59 55 51 51
Q4 % Proficient 89 82 78 61 60 61 38 58 33
Gr K Gr 1 Gr 2 Gr 3 Gr 4 Gr 5 Gr 6 Gr 7 Gr 8
261 2008-09 End of Year Report_060409 DataSet 10
Lodi Unified School District 2008-09 K-8 Benchmark Results
English Language Arts by Ethnicity
0
10
20
30
40
50
60
70
80
90
100
Perc
en
t
Q1 % Proficient 36 42 46 57 36 39 56
Q2 % Proficient 35 35 47 54 36 38 55
Q3 % Proficient 52 60 62 68 53 55 69
Q4 % Proficient 53 66 68 72 57 62 70
African American
American Indian
Asian Filipino HispanicPacif ic Islander
White
261 2008-09 End of Year Report_060409 DataSet 11
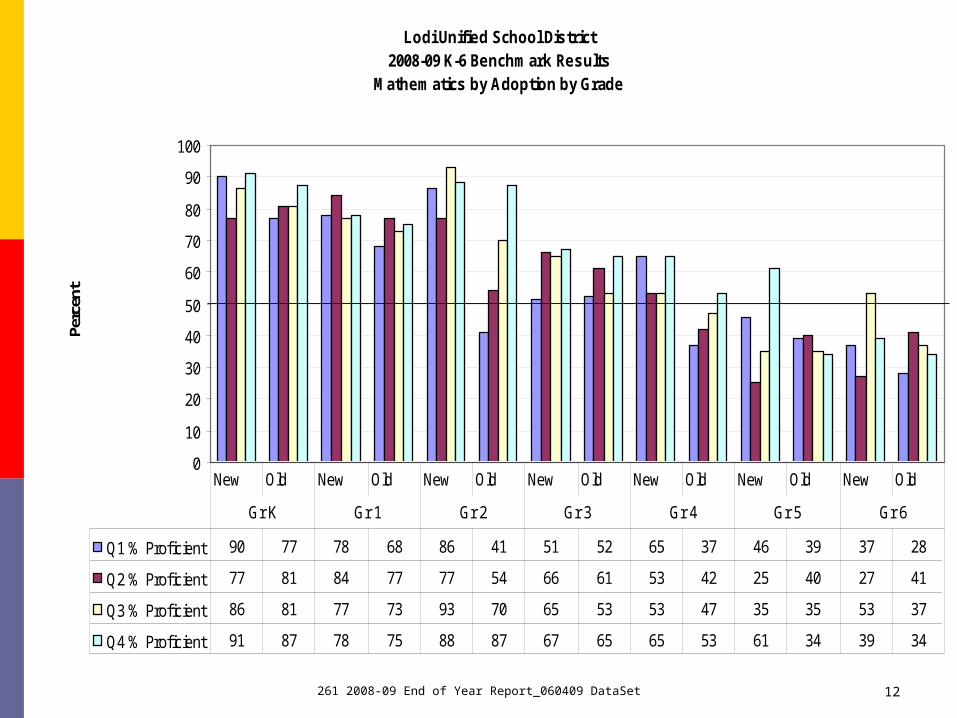
Results: K-8 Mathematics K-6 Results
Proficiency rates were higher for students using the K-6 new adoption (enVision) math curriculum and assessments than those using the old adoption (Harcourt) math curriculum and assessments.
In 6 of the 7 grades in which students were tested, both the first and fourth guarter results were higher for K-6 students using the new adoption than for students using the old adoption.
Grades K, 1, 2, 4, 5, and 6 Also, students in lower grade levels tended to exhibit higher
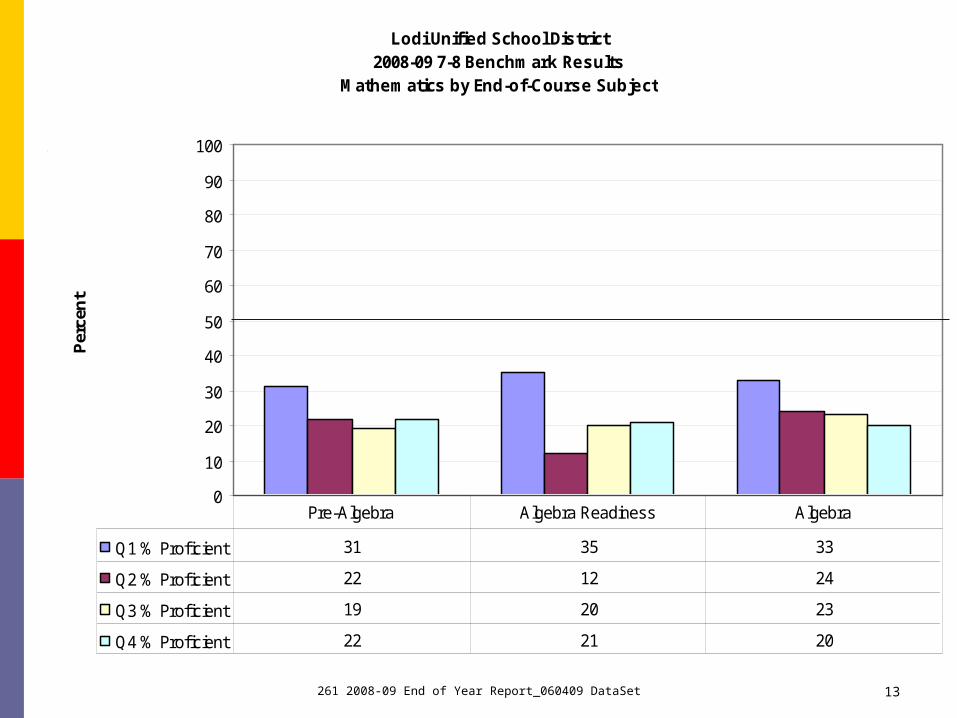
proficiency rates than students in higher grade levels. 7-8 Results – Pre-Algebra, Algebra Readiness, and Algebra I
There appeared to be a drop off in proficiency rates throughout the year as the fourth quarter’s were generally lower than first quarter’s for each middle school math benchmark assessment.
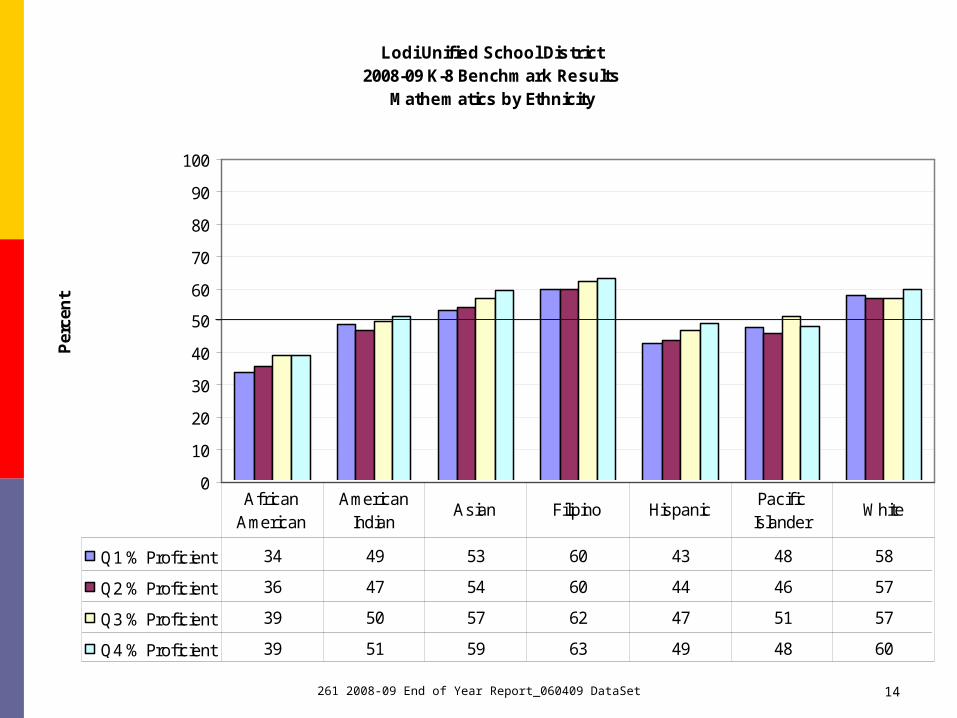
However, for the K-8 grade segment, there was an increase in the percentage of proficient students in each of the numerically significant ethnic subgroups throughout the school year except for Pacific Islander students. Pacific Islander students had the same proficiency rate in both the
first and fourth quarters.16
261 2008-09 End of Year Report_060409 DataSet 12
Lodi Unified School District 2008-09 K-6 Benchmark Results
Mathematics by Adoption by Grade
0
10
20
30
40
50
60
70
80
90
100
Perc
ent
Q1 % Proficient 90 77 78 68 86 41 51 52 65 37 46 39 37 28
Q2 % Proficient 77 81 84 77 77 54 66 61 53 42 25 40 27 41
Q3 % Proficient 86 81 77 73 93 70 65 53 53 47 35 35 53 37
Q4 % Proficient 91 87 78 75 88 87 67 65 65 53 61 34 39 34
New Old New Old New Old New Old New Old New Old New Old
Gr K Gr 1 Gr 2 Gr 3 Gr 4 Gr 5 Gr 6
261 2008-09 End of Year Report_060409 DataSet 13
Lodi Unified School District 2008-09 7-8 Benchmark Results
Mathematics by End-of-Course Subject
0
10
20
30
40
50
60
70
80
90
100
Per
cen
t
Q1 % Proficient 31 35 33
Q2 % Proficient 22 12 24
Q3 % Proficient 19 20 23
Q4 % Proficient 22 21 20
Pre-Algebra Algebra Readiness Algebra
261 2008-09 End of Year Report_060409 DataSet 14
Lodi Unified School District 2008-09 K-8 Benchmark Results
Mathematics by Ethnicity
0
10
20
30
40
50
60
70
80
90
100
Per
cen
t
Q1 % Proficient 34 49 53 60 43 48 58
Q2 % Proficient 36 47 54 60 44 46 57
Q3 % Proficient 39 50 57 62 47 51 57
Q4 % Proficient 39 51 59 63 49 48 60
African American
American Indian
Asian Filipino HispanicPacif ic Islander
White
261 2008-09 End of Year Report_060409 DataSet 15
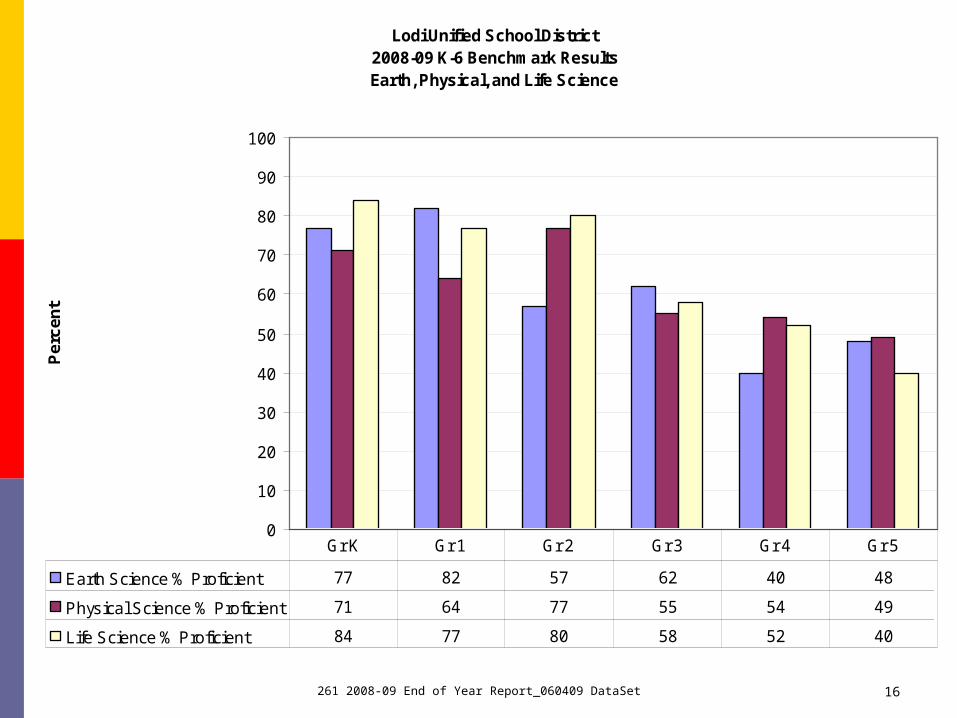
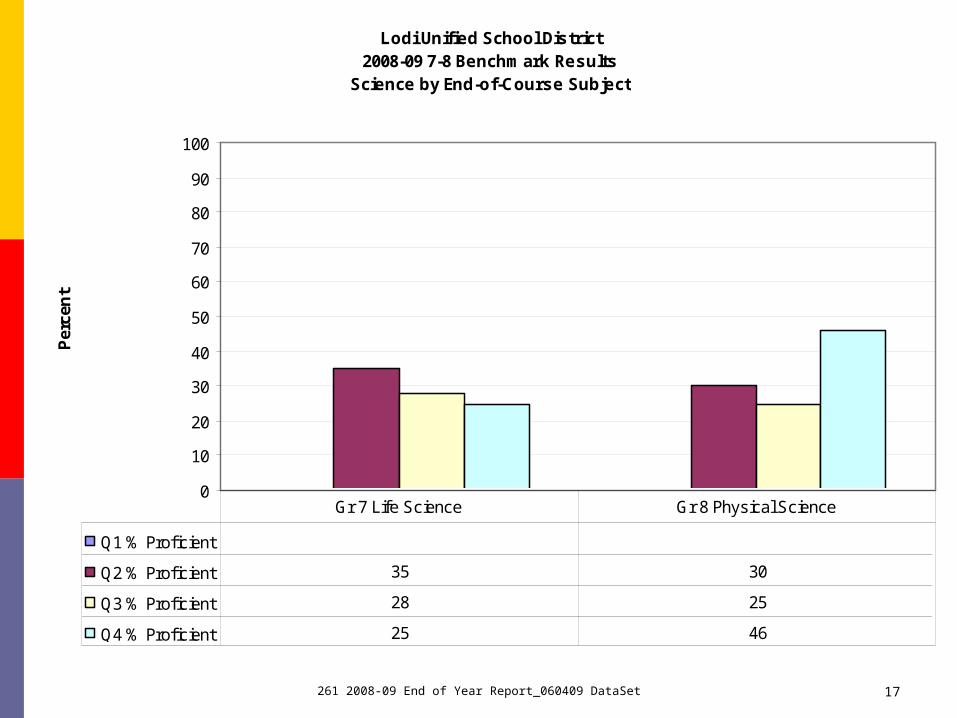
Results: K-8 Science K-5 Science – Earth, Physical, and Life
Although we could not identify a trend in performance between the topics assessed, we did notice that students in lower grade levels tended to exhibit higher proficiency rates than students in higher grade levels.
Grade 7 Life Science and Grade 8 Physical Science There was a general increase in the percentage
of proficient grade 8 students assessed with the Physical Science benchmark assessment.
261 2008-09 End of Year Report_060409 DataSet 16
Lodi Unified School District 2008-09 K-6 Benchmark ResultsEarth, Physical, and Life Science
0
10
20
30
40
50
60
70
80
90
100
Pe
rce
nt
Earth Science % Proficient 77 82 57 62 40 48
Physical Science % Proficient 71 64 77 55 54 49
Life Science % Proficient 84 77 80 58 52 40
Gr K Gr 1 Gr 2 Gr 3 Gr 4 Gr 5
261 2008-09 End of Year Report_060409 DataSet 17
Lodi Unified School District 2008-09 7-8 Benchmark Results
Science by End-of-Course Subject
0
10
20
30
40
50
60
70
80
90
100
Per
cen
t
Q1 % Proficient
Q2 % Proficient 35 30
Q3 % Proficient 28 25
Q4 % Proficient 25 46
Gr 7 Life Science Gr 8 Physical Science
261 2008-09 End of Year Report_060409 DataSet 18
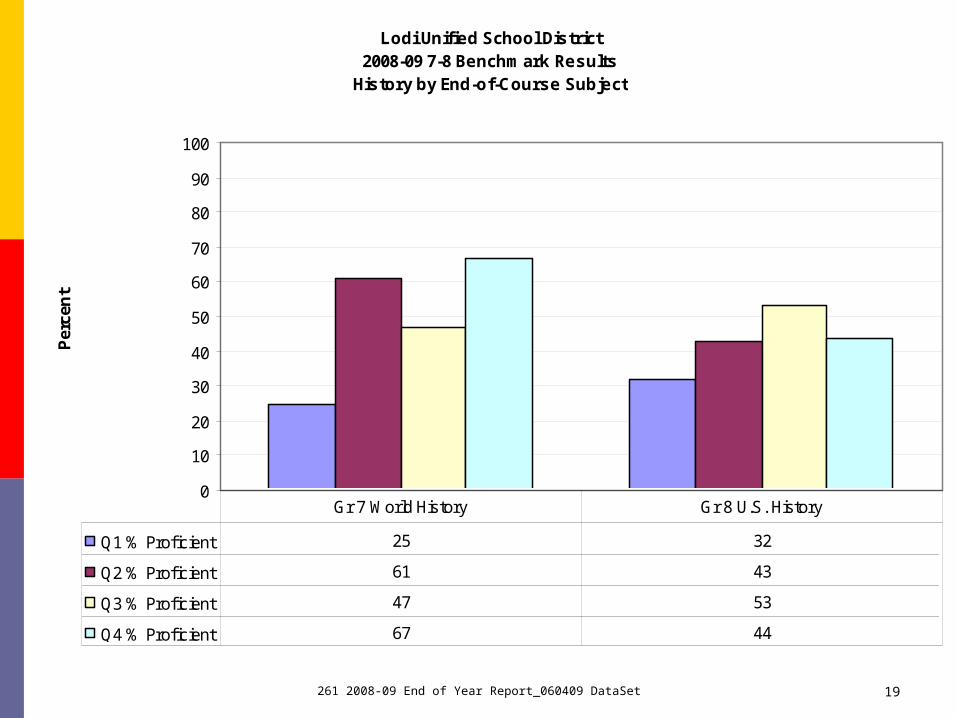
Results: 7-8 History Grade 7 World History and Grade 8 U.S.
History There were general increases in the percentage
of proficient students in both middle school history courses.
261 2008-09 End of Year Report_060409 DataSet 19
Lodi Unified School District 2008-09 7-8 Benchmark Results
History by End-of-Course Subject
0
10
20
30
40
50
60
70
80
90
100
Per
cen
t
Q1 % Proficient 25 32
Q2 % Proficient 61 43
Q3 % Proficient 47 53
Q4 % Proficient 67 44
Gr 7 World History Gr 8 U.S. History

261 2008-09 End of Year Report_060409 DataSet
20
Grades 9-12 Benchmark
Assessment Results
261 2008-09 End of Year Report_060409 DataSet 21
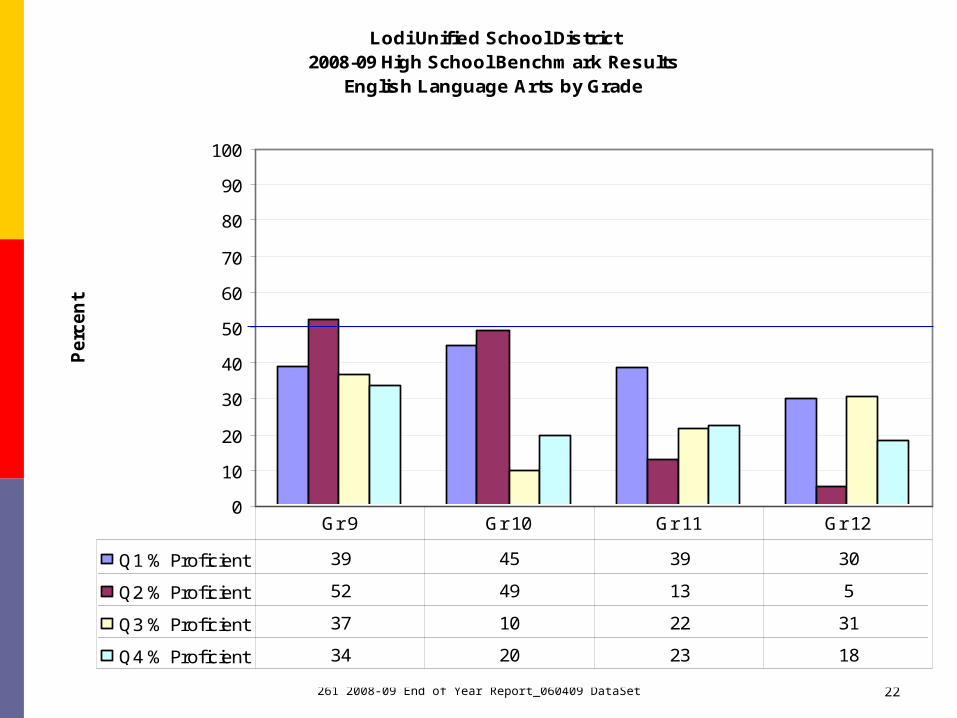
Results: High School English Language Arts
Proficiency rates were generally higher in grades 9 and 10 and lower in grades 11 and 12.
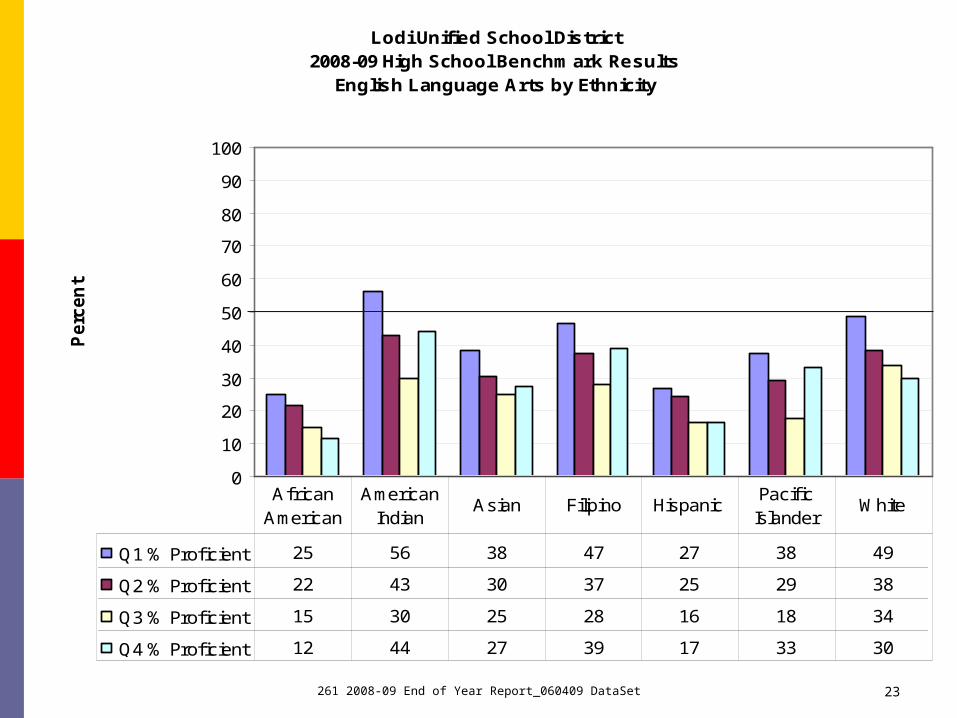
Additionally, there was a general drop off in proficiency rates from the first quarter’s results to the fourth quarter’s results for each grade level and numerically significant ethnic subgroup.
261 2008-09 End of Year Report_060409 DataSet 22
Lodi Unified School District 2008-09 High School Benchmark Results
English Language Arts by Grade
0
10
20
30
40
50
60
70
80
90
100
Perc
en
t
Q1 % Proficient 39 45 39 30
Q2 % Proficient 52 49 13 5
Q3 % Proficient 37 10 22 31
Q4 % Proficient 34 20 23 18
Gr 9 Gr 10 Gr 11 Gr 12
261 2008-09 End of Year Report_060409 DataSet 23
Lodi Unified School District 2008-09 High School Benchmark Results
English Language Arts by Ethnicity
0
10
20
30
40
50
60
70
80
90
100
Perc
en
t
Q1 % Proficient 25 56 38 47 27 38 49
Q2 % Proficient 22 43 30 37 25 29 38
Q3 % Proficient 15 30 25 28 16 18 34
Q4 % Proficient 12 44 27 39 17 33 30
African American
American Indian
Asian Filipino HispanicPacif ic Islander
White
261 2008-09 End of Year Report_060409 DataSet 24
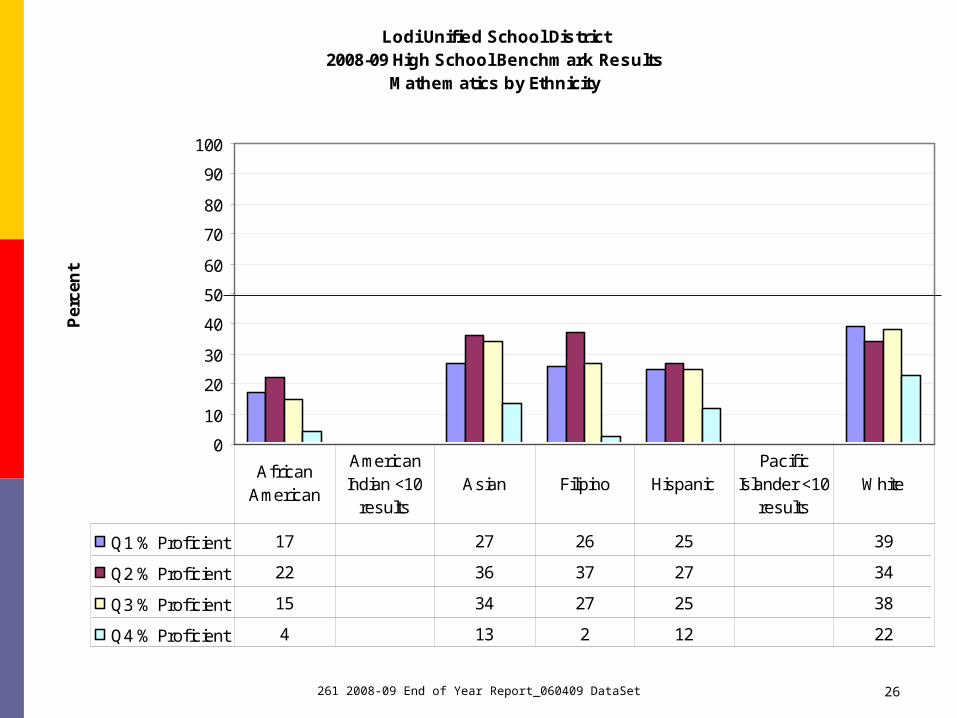
Results: High School Mathematics – Algebra Readiness & Algebra
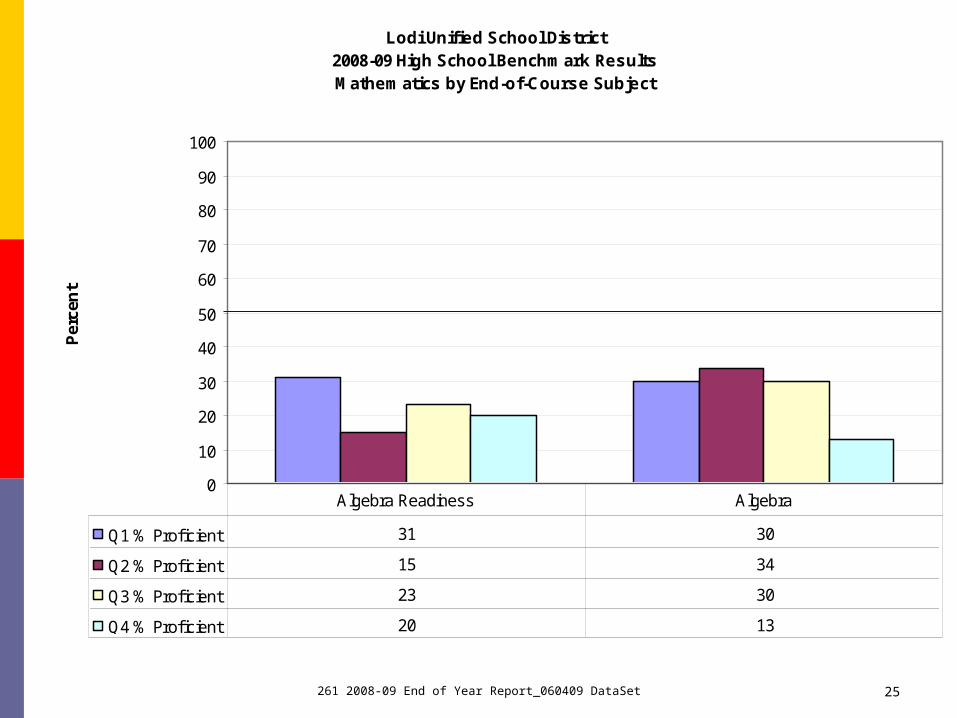
Similar to the English Language Arts’ results, there appeared to be a general drop off in proficiency rates from the first quarter’s results to the fourth quarter’s results for each high school math benchmark assessment.
The decrease in proficiency was also evident for each numerically significant ethnic subgroup throughout the school year as well.
261 2008-09 End of Year Report_060409 DataSet 25
Lodi Unified School District 2008-09 High School Benchmark ResultsMathematics by End-of-Course Subject
0
10
20
30
40
50
60
70
80
90
100
Per
cen
t
Q1 % Proficient 31 30
Q2 % Proficient 15 34
Q3 % Proficient 23 30
Q4 % Proficient 20 13
Algebra Readiness Algebra
261 2008-09 End of Year Report_060409 DataSet 26
Lodi Unified School District 2008-09 High School Benchmark Results
Mathematics by Ethnicity
0
10
20
30
40
50
60
70
80
90
100
Per
cen
t
Q1 % Proficient 17 27 26 25 39
Q2 % Proficient 22 36 37 27 34
Q3 % Proficient 15 34 27 25 38
Q4 % Proficient 4 13 2 12 22
African American
American Indian <10
resultsAsian Filipino Hispanic
Pacif ic Islander <10
resultsWhite
261 2008-09 End of Year Report_060409 DataSet 27
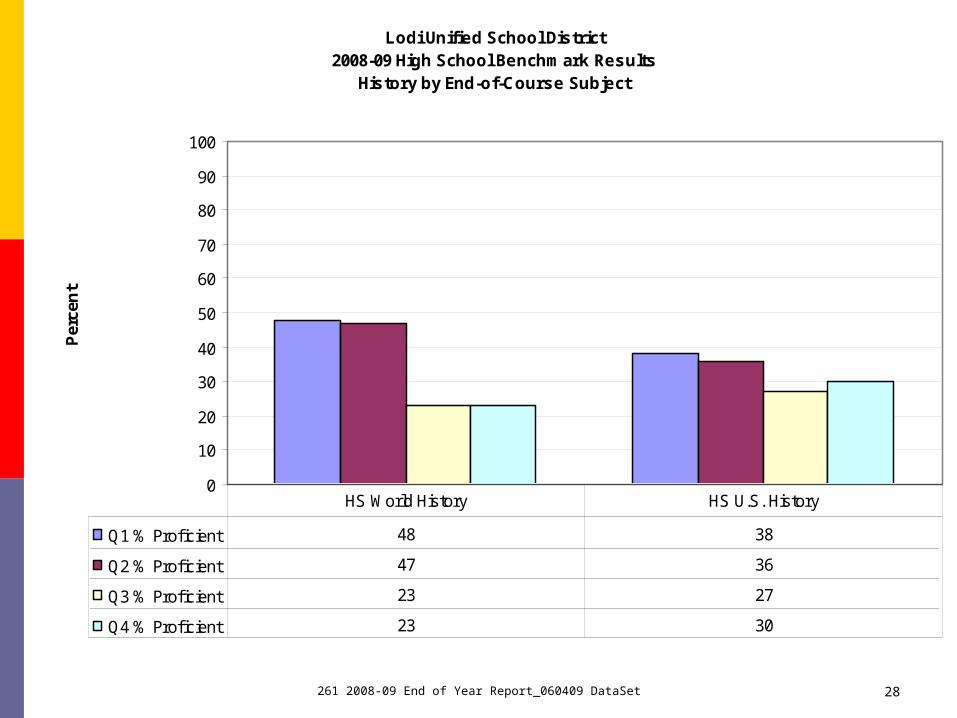
Results: High School History
World History and U.S. HistoryThere were general decreases in the percentage of
proficient students in both middle school history courses.
261 2008-09 End of Year Report_060409 DataSet 28
Lodi Unified School District 2008-09 High School Benchmark Results
History by End-of-Course Subject
0
10
20
30
40
50
60
70
80
90
100
Per
cen
t
Q1 % Proficient 48 38
Q2 % Proficient 47 36
Q3 % Proficient 23 27
Q4 % Proficient 23 30
HS World History HS U.S. History