Embed Size (px)
Citation preview

Tréhu, A.M., Bohrmann, G., Torres, M.E., and Colwell, F.S. (Eds.)Proceedings of the Ocean Drilling Program, Scientific Results Volume 204
27. DATA REPORT: NUCLEAR MAGNETIC RESONANCE LOGGING WHILE DRILLING, ODP LEG 2041
Timothy S. Collett,2 Myung W. Lee,2 David S. Goldberg,3 Frank R. Rack,4 and Trevor Williams3
ABSTRACT
Most published gas hydrate volumetric estimates have of necessitybeen made by broad extrapolation based on only general knowledge oflocal geologic conditions. The amount of gas that might be stored in agas hydrate accumulation is dependent on a number of reservoir pa-rameters, including the areal extent and thickness of the gas hydrate oc-currence, sediment porosities, and the degree of gas hydrate saturation.Downhole logs often serve as a source of critical gas hydrate reservoirdata. Before Ocean Drilling Program (ODP) Leg 204, however, onlyabout seven gas hydrate occurrences had been sampled and surveyedwith open hole well logging devices. From 16 July through 25 July2002, a complex logging-while-drilling (LWD) and measurement-while-drilling program was conducted on Hydrate Ridge during ODP Leg 204.During the cruise, and for the first time during ODP, the LWD toolstring included Schlumberger’s Nuclear Magnetic Resonance WhileDrilling tool (proVision).
Postcruise research with the proVision data has consisted of estimat-ing bound fluid volumes and total fluid porosities, along with compar-ing nuclear magnetic resonance (NMR)-derived porosities with thosederived from downhole measured neutron and density logs and coremeasurements. These efforts have focused on calculating gas hydrateconcentrations by indirect methods using NMR data. It has been shownthat it is possible to obtain gas hydrate saturations (percent of porespace occupied by gas hydrate) from downhole logging–measured NMRporosities. In this study, porosities derived from the NMR proVision
1Collett, T.S., Lee, M.W., Goldberg, D.S., Rack, F.R., and Williams, T., 2006. Data report: nuclear magnetic resonance logging while drilling, ODP Leg 204. In Tréhu, A.M., Bohrmann, G., Torres, M.E., and Colwell, F.S. (Eds.), Proc. ODP, Sci. Results, 204: College Station, TX (Ocean Drilling Program), 1–22. doi:10.2973/odp.proc.sr.204.106.20062U.S. Geological Survey, Denver Federal Center, Denver CO 80225, USA. [email protected] Research Group, Lamont-Doherty Earth Observatory of Columbia University, Palisades NY 10964, USA.4Joint Oceanographic Institutions, Inc., 1755 Massachusetts Avenue Northwest, Suite 700, Washington DC 20036, USA. Present address: ANDRILL Science Management Office, University of Nebraska-Lincoln, 126 Bessey Hall, Lincoln NE 68588-0341, USA.
Initial receipt: 14 January 2005Acceptance: 24 July 2005Web publication: 17 October 2006Ms 204SR-106
T.S. COLLETT ET AL.DATA REPORT: NMR LOGGING WHILE DRILLING 2
tool were used along with porosity data from the Azimuthal VisionDensity Neutron tool to calculate gas hydrate saturations at all nineLWD logging sites on Hydrate Ridge. The NMR-density-porosity rela-tion yielded gas hydrate saturations ranging from high values near thecrest of the ridge of ~50% and higher in Hole 1249A to much lower val-ues along the flanks of the ridge.
INTRODUCTION
Leg 204 Operations
One of the primary goals of Ocean Drilling Program (ODP) Leg 204was to determine the distribution and concentration of gas hydrates be-neath Hydrate Ridge, which is located ~90 km off the coast of Oregon(USA). After coring the first site (Site 1244), logging-while-drilling(LWD) data were acquired from an additional 10 holes at 8 respectivesites (Table T1). The LWD data confirmed the general position of keyseismic stratigraphic horizons and yielded estimates of gas hydrate con-centrations through various downhole logging proxies. These recordsproved to be of great value in planning subsequent coring. After com-pleting the 10-day LWD program, the LWD tools were removed fromthe ship by an open-ocean small boat transfer. The remaining portionof the cruise dealt with coring more than 45 holes at 9 sites on HydrateRidge. Eight of these sites were the same sites that were already drilledand logged during the LWD program. The Hydrate Ridge coring pro-gram also included acquisition of conventional wireline logs from anadditional six holes.
LWD Program
The downhole logging program during Leg 204 was specifically de-signed to obtain the data needed to assess the occurrence and concen-tration of gas hydrates on Hydrate Ridge. During Leg 204, four LWDand measurement-while-drilling (MWD) tools were deployed at eightsites on southern Hydrate Ridge (Table T1; Fig. F1). These tools wereprovided by Schlumberger Drilling Services of Youngsville, Louisiana(USA), under contract with the Lamont-Doherty Earth Observatory(LDEO) Borehole Research Group in Palisades, New York (USA).
Leg 204 LWD operations began on 16 July 2002 with initial bottom-hole assembly (BHA) makeup and spudding of Hole 1244D. Figure F2shows the configuration of the LWD/MWD BHA used during Leg 204.The tools (6¾-in collars) deployed in nine of the ten LWD logged holesduring Leg 204 included the GeoVision resistivity-at-the-bit or “RAB”tool with a 9 -in button sleeve, a Power-Pulse MWD tool, the NuclearMagnetic Resonance While Drilling tool (proVision), and the Azi-muthal Vision Density Neutron (VDN) tool. Table T1 contains a de-tailed listing of the LWD data acquired during Leg 204. This was thefirst time that any downhole magnetic resonance device (proVision)was used during ODP. As shown in Table T1, the proVision was de-ployed a total of nine times during Leg 204, and in all cases the qualityof acquired data was very good.
LWD measurements are made shortly after the hole is drilled and be-fore extended pumping and coring operations adversely affect in situhole condition and all subsequent downhole measurements. Fluid inva-sion into the borehole wall is also reduced relative to wireline logging
T1. Leg 204 holes surveyed with LWD and MWD tools, p. 22.
0021
00110001
009
008
Site 1244
Site 1251
Site1245
Site 1246
Site1250
Site 1249
Site 1247Site1248
Site 1252
44°36'N
44°33'125°09'W 125°06' 125°03'
F1. Map of Hydrate Ridge, p. 11.
14.95 Antenna 114.29 Antenna 2
24.24
12.84
3.86 Shallow resistivity5.36
3.74 Medium resistivity3.56 Deep resistivity3.39 Ring resistivity3.03 Gamma ray
1.26 Bit resistivity
0.00
0.27
1.92
27.01 Ultrasonic sensor
27.39 Gamma sensor (long)27.48 Gamma sensor (short)
28.35 Neutron sensor (near)28.50 Neutron sensor (far)
VDN
proVision
MWD
GVR6
30.40
Bit
Bit sub
27.62 Gamma source28.05 Neutron source
17.1 cm (6-3/4 in)
25.1 cm (9-7/8 in)
Distanceabove bit (m)
18.11 Read-out port
Turbine
Magnets
F2. LWD drill configuration on Leg 204, p. 12.1 8⁄

T.S. COLLETT ET AL.DATA REPORT: NMR LOGGING WHILE DRILLING 3
because of the shorter elapsed time between drilling and taking themeasurements. The LWD equipment is partially battery powered anduses erasable/programmable read-only memory chips to store loggingdata until they are downloaded. The LWD tools take measurements atevenly spaced time intervals and are synchronized with a system on therig floor that monitors time and drilling depth. After drilling, the LWDtools are retrieved and the data downloaded from each tool through anRS-232 serial link to a computer. Synchronization of the uphole anddownhole clocks allows merging of the time-depth data (from the sur-face system) and the downhole time-measurement data (from the tools)into depth-measurement data files. The resulting depth-measurementdata, like the traditional wireline well logs, are transferred to the pro-cessing systems in the Downhole Measurements Laboratory on boardthe JOIDES Resolution for reduction, analysis, and transfer. Differingfrom wireline logging, however, the merged LWD depth-measurementdata are not spaced at even depth intervals, although they vary onlyslightly in many instances where the drilling rate is well controlled.
METHODS
Nuclear Magnetic Resonance Logging
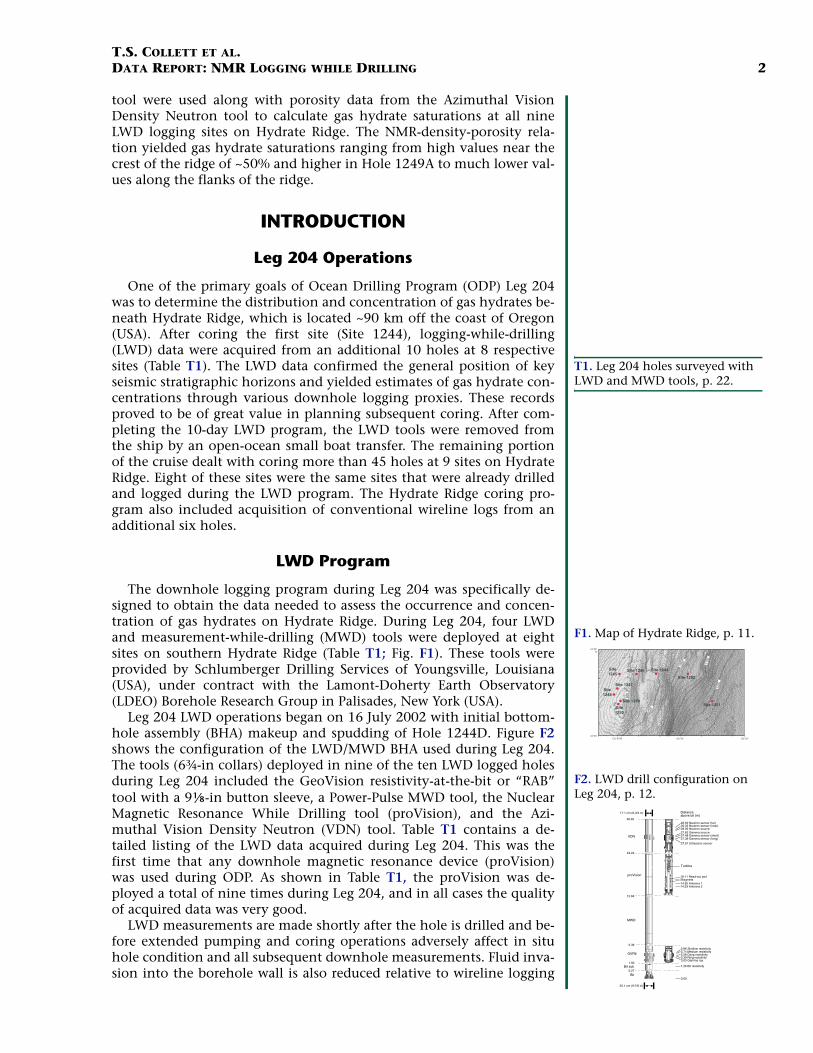
The U.S. Department of Energy provided funding support to deploythe proVision tool during Leg 204. The basic technology behind thistool is similar to modern wireline nuclear magnetic resonance (NMR)technology (Kleinberg et al., 2003; Horkowitz et al., 2002), based onmeasurement of the relaxation time of the magnetically induced pre-cession of polarized protons. A combination of magnets and directionalantennas are used to focus a pulsed, polarizing field into the formation.Figure F3 shows a schematic of the proVision tool. The antennas on theproVision tool measure the relaxation times of polarized molecules inthe formation, which can be used to assess sediment porosities.
During Leg 204, the proVision tool acquired formation and engineer-ing information in memory and transmitted some data to the surfacevia MWD. The relaxation time spectra were recorded downhole and po-rosity estimates were transmitted to the surface in real time. These spec-tra were stacked in postprocessing to improve the measurementprecision. Data were also acquired while pulling the tool upward (slid-ing, not rotating) over short open-hole intervals to compare measure-ments with and without the effect of lateral vibrations induced whiledrilling and rotating.
NMR Logging Fundamentals
In recent years there have been significant developments in the fieldof NMR well logging (reviewed by Horkowitz et al., 2002). Similar toneutron porosity devices, NMR tools primarily respond to the presenceof hydrogen molecules in the pore fluids in rock formation. Unlike neu-tron porosity tools, however, NMR tools use the electromagnetic prop-erties of hydrogen molecules to analyze the nature of atomicinteractions within pore fluids. Relative to other pore-filling constitu-ents, gas hydrates exhibit unique chemical structures and hydrogenconcentrations. In theory, therefore, it should be possible to developNMR well logging evaluation techniques that would yield accurate res-
Turbine
Magnets
Stabilizer
Wear bands
10.92
8.21
5.28 Read-out port
2.12 Antenna 1
1.47 Antenna 2
0.00
11.40
6-3/4 inDistance fromtool bottom (m)
Diameter
F3. Schlumberger proVision tool, p. 13.

T.S. COLLETT ET AL.DATA REPORT: NMR LOGGING WHILE DRILLING 4
ervoir porosities and water saturations in gas hydrate–bearing sedi-ments.
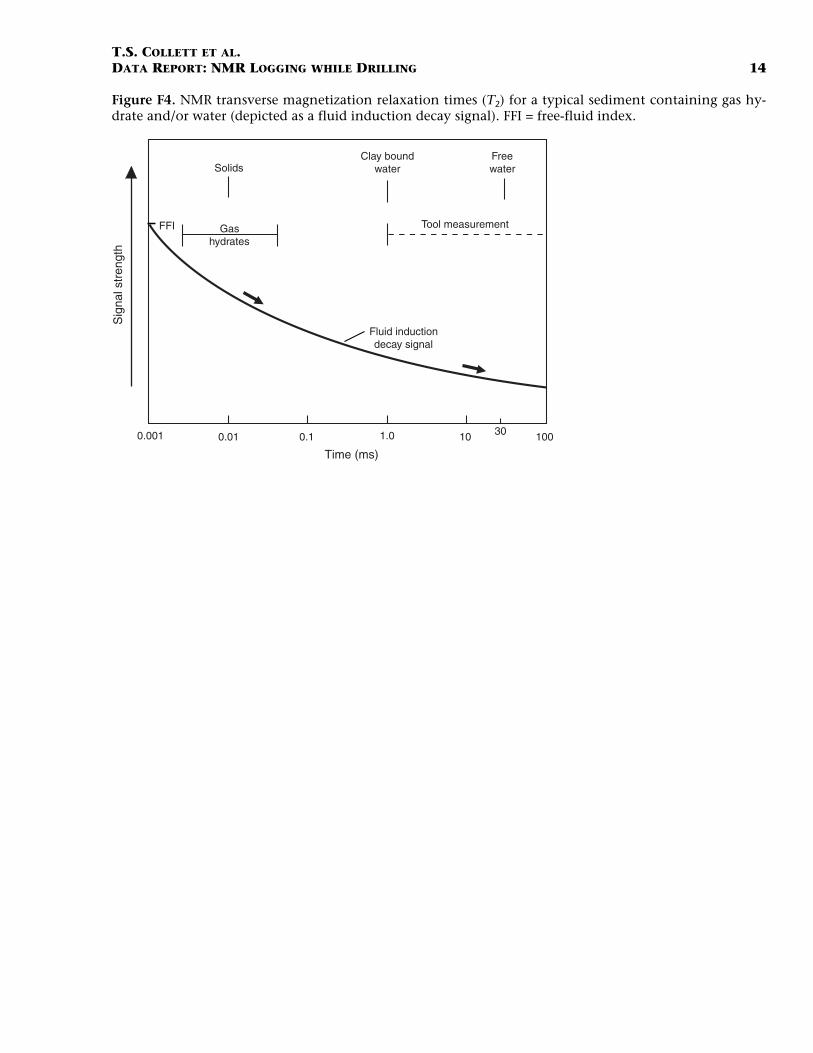
Under the effect of a strong magnetic field, hydrogen nuclei tend toalign with the induced magnetic field. A certain amount of time, calledthe longitudinal magnetization decay time (T1), is required for thisalignment. When the magnetic field is pulsed, the hydrogen nuclei re-turns to a disordered state with a characteristic relaxation time, calledthe transverse magnetization relaxation time (T2). T2 depends on the re-laxation characteristics of the hydrogen-bearing substances in the rockformation. For example (Fig. F4), T2 for hydrogen nuclei in solids is veryshort, however, T2 for hydrogen nuclei in fluids can vary from tens tohundreds of milliseconds depending on fluid viscosities and interac-tions with nearby surfaces (reviewed by Kleinberg et al., 2003).
When deployed in the LWD tool configuration, the NMR measure-ment represents the in situ NMR properties of hydrogen in the forma-tion. Initially, the hydrogen atoms are aligned in the direction of astatic magnetic field (B0). The hydrogen atoms are then tipped by ashort burst from an oscillating magnetic field that is designed so thatthey precess in resonance in a plane perpendicular to B0. The precessionof the hydrogen atoms induces a signal in the tool’s antenna, and thedecay of this signal is measured from the echo amplitudes in the pulsesequence from which T2 is calculated. Because the formation containshydrogen in different forms (in water in large pores and small pores,bound in clay minerals, and in gas hydrate), there is a distribution of T2
times; for Leg 204 sites, T2 times were recorded in a range set between 3ms and 3 s.
NMR Log Quality
The proVision signal investigates an ~15-cm cylindrical volume ofthe borehole, and for a 9 -in bit size, the depth of investigation of themeasurement is ~5 cm into the formation. In most cases, drilling withthe LWD tools proceeded at ~25 m/hr. Using this relatively slow averagepenetration rate, enhanced NMR spectral resolution and a data sam-pling rate of approximately one sample per 15-cm depth interval wasachieved. This high data density improved NMR spectral resolution af-ter postprocess stacking and enhanced the overall logging data quality.
Lateral tool motion may reduce proVision data quality in some cir-cumstances. Thus, accelerometers and magnetometers are contained inthe tool to measure downhole motion and to evaluate data quality. Themaximum resolvable relaxation time can be computed from this infor-mation. In addition, after reaching the total depth in three of the LWDholes on Hydrate Ridge (Holes 1244D, 1246A, and 1250B), the LWDtools were pulled upward while sliding (without rotating) for ~30 m tocompare the measurements while drilling downward over the same in-terval. Comparing the proVision spectra with and without the effect ofthe lateral vibration due to drilling allowed further refinement of themeasurement resolution. Table T1 shows the holes in which slidingtests were conducted. The sliding data were not processed; they wereused by the logging engineer to verify the quality of the proVision spec-tra being collected during drilling.
The proVision data quality is high throughout most of the logged in-terval in all nine holes drilled during Leg 204. ProVision data quality isdegraded, however, when the distance between the tool sensor and thewall of the borehole is greater than 1 in. To evaluate this, the differen-
Sig
nal s
tren
gth
0.001 0.01 0.1 1.0 10 100
FFI
30
Tool measurementGashydrates
Fluid inductiondecay signal
SolidsClay bound
waterFreewater
Time (ms)
F4. NMR T2 for a typical sediment, p. 14.
78⁄
T.S. COLLETT ET AL.DATA REPORT: NMR LOGGING WHILE DRILLING 5
tial caliper log (DCAL) is recorded by the LWD density tool and pro-vides a measure of this distance. DCALs from the LWD drill holesmeasure values <1 in over 90%–95% of the total interval drilled in allnine LWD holes. In each hole, however, the uppermost 10–30 metersbelow seafloor (mbsf) was typically washed out to >1 in because of drill-ing disturbance of the softer subseafloor sediments. Deeper intervals inonly one hole (Hole 1244D) show deflections of the DCAL measure-ment of up to 1 in where borehole breakouts occurred below 250-mdepth. NMR measurements may be degraded in these particular inter-vals.
LWD Data Processing
During ODP, some shipboard data processing is conducted in orderto verify data content and quality. In addition, both real-time andmemory data from LWD and conventional wireline logging data aretransmitted via Inmarsat B satellite from the JOIDES Resolution to LDEOand, in some cases, then transferred to Schlumberger for reprocessingand data quality assessment. The general data processing for the LWDlogging data from Leg 204 followed the steps as described below (formore detailed description of the Leg 204 logging data processing effort,see the processing documentation notes under each site entry on theODP Logging Services Web site: www.ldeo.columbia.edu/BRG/ODP/DATABASE /DATA/search.html):
1. Depth shift: Original logs are first depth-shifted to the seafloor.The seafloor depth was determined by the step in gamma rayand resistivity values at the sediment/water interface.
2. Neutron porosity data processing: The neutron porosity mea-surements are corrected for bit size, temperature, mud salinity,and mud hydrogen index (mud pressure, temperature, andweight).
3. Density data processing: Density data are processed to correctfor the irregular borehole using a technique called “rotationalprocessing,” which is particularly useful in deviated or enlargedboreholes with irregular or elliptical shapes. This statisticalmethod measures the density variation while the tool rotates inthe borehole, estimates the standoff (distance between the tooland the borehole wall), and corrects the density reading.
4. Resistivity data: The resistivity curves are sampled at a 0.0304-m (1.2 in) sampling rate.
5. NMR: The T2 distribution is the basic output of NMR measure-ment. It is further processed to give the total pore volume (thetotal porosity) and pore volumes within different ranges of T2,such as the bound- and free-fluid volumes. However, it is impor-tant to note that in a gas hydrate–bearing section, the NMR toolonly measures the liquid-filled portion of the porosity. The NMRtool used during Leg 204 was an experimental tool; the process-ing was performed on shore by Schlumberger.

T.S. COLLETT ET AL.DATA REPORT: NMR LOGGING WHILE DRILLING 6
DATA AND RESULTS
Leg 204 Well Logging Data Access
The ODP Logging Database contains the majority of the logging datacollected during ODP and all of the downhole logging data collectedduring Leg 204; it can be accessed and searched through the ODP Log-ging Services Web site: www.ldeo.columbia.edu/BRG/ODP/DATA-BASE/DATA/search.html. The Web site provides convenient methodsfor downloading large amounts of data, as well as information aboutthe applications of logging data to scientific problems. In addition, log-ging data are also distributed on a CD-ROM included in the Leg 204 Ini-tial Reports volume (Tréhu, Bohrmann, Rack, Torres, et al., 2003).
The NMR LWD data from Leg 204 as presented on the ODP LoggingService Web site is stored in two ASCII files.
1. Files named like 1249A-nmr.dat contain the following one-di-mensional NMR log data:DEPTH (mbsf) = Subbottom depth,MRP (%) = Magnetic resonance porosity,BFV (%) = Bound-fluid volume,FFV (%) = Free-fluid volume, and T2LM (ms) = Log mean T2 relaxation time.
2. Files named like 1249A-t2dist.dat contain the T2 distribution(spectra):DEPTH (mbsf) = Subbottom depth and T2 (%) = At each depth, values of percent volume are
given for 30 T2s ranging from 3 to 3000 ms. The scale is loga-rithmic, and T2 is given both in milliseconds and as the log10
of the time in milliseconds
NMR Properties of Gas Hydrate
Because gas hydrates are solids consisting of weakly interacting hostand guest molecules, NMR methods of analysis, which are sensitive tothe mobility of the guest and host molecules, are useful in establishingthe presence of gas hydrates in high-resolution laboratory studies(Davidson and Ripmeester, 1984). Moreover, the high-resolution capa-bilities of modern NMR laboratory devices can provide valuable infor-mation about clathrate structures. No laboratory experiments, however,have been conducted to analyze the response of wellbore NMR devicesto the presence of gas hydrate.
There are numerous studies in which laboratory apparatuses havebeen used to characterize the nuclear magnetic properties of gas hy-drates. Results of these laboratory NMR studies were summarized byRipmeester and Ratcliffe (1989), from which most of the following dis-cussion has been obtained. In Davidson et al. (1986), NMR line shapeswere obtained from a Gulf of Mexico gas hydrate sample. These labora-tory experiments clearly showed that the sample contained substantialamounts of gas hydrate. Davidson et al. (1986) did not report any gashydrate relaxation times or free-fluid indexes (FFIs); however, they didpublish several gas hydrate NMR spectrums from which it is possible toobtain relaxation times.
If published NMR line shapes for Structure I methane hydrates are as-sumed to be Gaussian in nature, it can also be assumed that the free in-

T.S. COLLETT ET AL.DATA REPORT: NMR LOGGING WHILE DRILLING 7
duction decay is also Gaussian and the second moment (or meansquare line width) is then inversely related to T2 (J.A. Ripmeester, pers.comm., National Research Council Canada, 1999). Thus, if a NMR sec-ond moment of ~33 Gauss is assumed, T2 of the water molecules in theStructure I gas hydrate is ~0.01 ms.
The example free-fluid induction decay signal plot in Figure F4shows that the gas hydrate clathrate T2 of 0.01 ms is very similar to therelaxation times of other solids such as the rock matrix. T2s on the orderof 0.01 ms are sufficiently short to be lost in the “dead time” (below thedetectable limit of the tool) of standard NMR borehole instruments.Gas hydrates, therefore, cannot be directly detected with today’s down-hole NMR technology. It is possible, however, that existing NMR welllogs could still yield very accurate gas hydrate saturation data. In the-ory, due to the short T2s of the water molecules in the clathrate, gas hy-drates would not be “seen” by the NMR tool and the in situ gas hydratewould be assumed to be part of the solid matrix. Thus, the NMR-calcu-lated FFI and associated porosity estimate in a gas hydrate–bearing sedi-ment would be apparently lower than the actual porosity. With anindependent source of accurate in situ total porosities, such as densityor neutron porosity logging measurements, it would be possible to ac-curately estimate gas hydrate saturations by comparing the apparentNMR-derived porosities with the actual total porosities. The above-de-scribed calculations were originally presented by Collett (2000); morerecently Kleinberg et al. (2003) have been able to demonstrate the useof this approach with acquired field data.
NMR Log-Derived Porosities
Data from the LWD NMR logs have been used to calculate sedimentporosities in all nine Leg 204 holes surveyed with the proVision tool(Fig. F5A, F5B). Core-derived physical property data have also beenused to both calibrate and evaluate the proVision-derived sediment po-rosities. The sediment porosities derived by the proVision in all nineholes ranged from ~80% near the seafloor to ~35% near the bottom ofone the deepest holes on Hydrate Ridge (Hole 1245A).
In studies of downhole logging data it is common to compare poros-ity data from different sources to evaluate the results of particular mea-surements. The comparison of core-derived and proVision log-derivedporosities in Figure F5A and F5B reveals that the proVision porositiesare generally similar to the core-derived porosities. Dissimilarities occurin the upper portion of several holes where the proVision porosity log isdegraded by washouts. In numerous cases, the proVision porosity logsalso exhibit anomalous low-porosity zones within the interval of ex-pected gas hydrate stability. The differences between the proVision po-rosity log and core values and other porosity logs (not shown) may alsobe due to the effects of elastic rebound (e.g., Hamilton, 1976; Goldberg,1997), excessive lateral motion of the tool (Horkowitz et al., 2002), andthe distinctive physical properties of gas hydrates (e.g., Collett, 2000;Kleinberg et al., 2003). The response of the proVision porosity log inthe gas hydrate–bearing sediments on Hydrate Ridge was one of the pri-mary focuses of the postcruise research activities as discussed below.
0
50
100
150
200
250
Dep
th (
mbs
f)
0
50
100
150
200
250
300
350
0
50
100
150
200
250
300
350
20
40
60
80
100
120
140
160
180
Hole 1247AHole 1246AHole 1245AHole 1244D
NMR porosityNMR porosityNMR porosityNMR porosity
Porosity from corePorosity from corePorosity from corePorosity from core
0 1 0 1 0 1 0 100FractionFractionFractionFraction
0 1 0 1 0 1 0 1FractionFractionFractionFraction
A
0
F5. ProVision- and core-derived porosity, p. 15.

T.S. COLLETT ET AL.DATA REPORT: NMR LOGGING WHILE DRILLING 8
NMR Logging-Derived Gas Hydrate Saturations
The presence of gas hydrate at most of the sites drilled during Leg204 was documented by direct sampling, with pieces of gas hydrate be-ing recovered from cores (Shipboard Scientific Party, 2002). Gas hy-drates were also inferred to occur in every hole drilled on Hydrate Ridgeduring Leg 204 based on geochemical core analyses, infrared imageanalysis of cores, and downhole logging data. Gas hydrate occurrencesare generally characterized by increases in logging electrical resistivitiesand acoustic velocities and apparent reductions in NMR porosities (Col-lett, 2000; Kleinberg et al., 2003). Most of the Leg 204 downhole log-ging data from Hydrate Ridge show that the sedimentary section abovethe expected depth of the bottom-simulating reflector (BSR) is charac-terized by distinct zones of elevated values of electrical resistivity andacoustic velocity. In addition, the proVision NMR tool often revealslow-porosity zones within the same high-resistivity intervals, suggest-ing the possible occurrence of gas hydrate. By quantifying this differ-ence, the NMR logging data have been used to estimate the amount ofgas hydrate at each LWD site drilled on Hydrate Ridge during Leg 204(Fig. F6). For the purpose of this discussion, it is assumed that the rela-tively low NMR porosities in comparison to the density-derived porosi-ties above the depth of the BSR at each site (Fig. F6) are due to thepresence of gas hydrate. The simple relationship below between densityporosity (DPHI) and NMR porosity (TNMR) was used to calculate gashydrate saturations in each LWD hole on Hydrate Ridge:
Sh = (DPHI – TNMR)/DPHI.
A more rigorous result can be obtained by further assessing the effect ofgas hydrate on the density log measurement (Kleinberg et al., 2003).
As shown in Figure F6, the assumed gas hydrate saturations in thesection above the BSR ranges from –10% (erroneous negative values) tovalues approaching 50% at Site 1249. However, the scatter of the NMR-derived values in intervals where free gas and gas hydrate are notpresent (Sh = 0) ranges from –10% to +10%, which probably representsa measure of the relative of uncertainty of the NMR porosity measure-ment. Although large spikes in the NMR-derived gas hydrate concentra-tion reaching 20%–30% are observed above the BSR at most of the Leg204 sites, it appears that the NMR-derived gas hydrate saturations onHydrate Ridge are lower on average than those calculated by the Archiemethod (Collett et al., 2003).
The response of the NMR logging tool to free gas is similar to the re-sponse in gas hydrate (Kleinberg et al., 2003). Both show an apparentreduction in the measured NMR porosity. In Figure F6, we also see “ap-parent” gas hydrate–bearing zones below the depth of the BSR at severalsites, a result that is theoretically impossible. Combining Archie resis-tivity, density, and neutron porosity logging analyses has confirmed theoccurrence of free gas below the BSR on Hydrate Ridge. These zones arealso characterized by low wireline logging acoustic velocities (Ship-board Scientific Party, 2002), another strong indication of the presenceof free gas. Free gas saturations in some of these localized zones havebeen estimated to exceed 50%, such as in the Horizon A turbidite se-quence (Collett et al., 2003; Tréhu et al., 2004). In Figure F6, the estima-tion of gas hydrate concentration from the NMR logs is therefore onlyvalid above the BSR.
Density porosity NMR porosity GH concentration
BS
R
Por
osity
and
con
cent
ratio
n (f
ract
ion)
1.0
0.8
0.6
0.4
0.2
0.0
-0.2
0 100 200 300 400
Depth (m)
Hole 1244DA
BS
R
Por
osity
and
con
cent
ratio
n (f
ract
ion)
0.8
0.6
0.4
0.2
0.0
-0.2
Hole 1245AB
F6. Porosities and derived gas hy-drate saturations, p. 17.
T.S. COLLETT ET AL.DATA REPORT: NMR LOGGING WHILE DRILLING 9
SUMMARY
The downhole logging program during Leg 204 was designed to ob-tain the data needed to assess the occurrence and concentration of gashydrate beneath Hydrate Ridge. It has been shown that it is possible toobtain gas hydrate saturations (percent of pore space occupied by gashydrate) from NMR downhole logging data. In this study, NMR anddensity porosity data from the proVision and VDN density tools wereused to calculate gas hydrate saturations at all eight LWD logging siteson Hydrate Ridge. The downhole logging–inferred distribution of gashydrate beneath Hydrate Ridge and the adjacent slope basin is hetero-geneous, with NMR-density-porosity–derived gas hydrate saturations atSite 1249, located near the crest of the ridge, ranging from 0% to nearly50% in several intervals. In the slope basin sites, however, the NMR-density-porosity–derived gas hydrate saturations are much lower, rang-ing from 0% to a few percent along the flanks of the ridge. NMR-den-sity-porosity logs from Leg 204 LWD logging sites also reveal thepresence of significant free gas occurrence below the depth of the BSRon Hydrate Ridge.
ACKNOWLEDGMENTS
This research used data provided by the Ocean Drilling Program(ODP). ODP is sponsored by the U.S. National Science Foundation(NSF) and participating countries under management of Joint Oceano-graphic Institutions (JOI), Inc. The U.S. Department of Energy (USDOE)provided the funding to support the deployment of the proVision toolduring ODP Leg 204 under a contract to the Lamont-Doherty Earth Ob-servatory (USDOE contract number DE-AP26-02NT20552).
T.S. COLLETT ET AL.DATA REPORT: NMR LOGGING WHILE DRILLING 10
REFERENCES
Collett, T.S., 2000. Quantitative well-log analysis of in-situ natural gas hydrates[Ph.D. dissert.]. Colorado School of Mines, Golden.
Collett, T.S., Goldberg, D.S., Janik, A., and Guerin, G., 2003. Downhole log assess-ment of gas hydrate and free-gas concentrations on Hydrate Ridge. Eos, Trans. Am.Geophys. Union, 84(46):OS51C-0876. (Abstract)
Davidson, D.W., Garg, S.K., Gough, S.R., Handa, Y.P., Ratcliffe, C.I., Ripmeester, J.A.,Tse, J.S., and Lawson, W.F., 1986. Laboratory analysis of a naturally occurring gashydrate from sediment of the Gulf of Mexico. Geochim. Cosmochim. Acta,50(4):619–623. doi:10.1016/0016-7037(86)90110-9
Davidson, D.W., and Ripmeester, J.A., 1984. NMR, NQR and dielectric properties ofclathrates. In Atwood, J.L., Davies, J.E.D., and MacNichol, D.D. (Eds.), InclusionCompounds (Vol. 3): London (Academic Press), 69–127.
Goldberg, D., 1997. The role of downhole measurements in marine geology and geo-physics. Rev. Geophys., 35(3):315–342. doi:10.1029/97RG00221
Hamilton, E.L., 1976. Variations of density and porosity with depth in deep sea sedi-ments. J. Sediment. Petrol., 46:280–300.
Horkowitz, J., Crary, S., Ganesan, K., Heidler, R., Luong, B., Morley, J., Petricola, M.,Prusiecki, C., Poitzsch, M., Scheibal, J.R., and Hashem, M., 2002. Applications of anew magnetic resonance logging-while-drilling tool in a Gulf of Mexico deepwaterdevelopment project. Trans. SPWLA Annu. Logging Symp., 14.
Kleinberg, R.L., Flaum, C., Straley, C., Brewer, P.G., Malby, G.E., Peltzer, E.T., III, Fre-iderich, G., and Yesinowski, J.P., 2003. Seafloor nuclear magnetic resonance assayof methane hydrate in sediment and rock. J. Geophys. Res., 108(B3):2137.doi:10.1029/2001JB000919
Ripmeester, J.A., and Ratcliffe, C.I., 1989. Solid-state NMR studies if inclusion com-pounds. Natl. Res. Counc. Can., [Rep.] NRCC, C1181-89S.
Shipboard Scientific Party, 2002. Leg 204 Preliminary Report. ODP Prelim. Rpt., 204[Online]. Available from World Wide Web: <http://www-odp.tamu.edu/publica-tions/prelim/204_prel/204PREL.PDF>. [Cited 2006-09-21]
Tréhu, A.M, Bohrmann, G., Rack, F.R., Torres, M.E., et al., 2003. Proc. ODP, Init. Repts.,204: College Station, TX (Ocean Drilling Program). doi:10.2973/odp.proc.ir.204.2003
Tréhu, A.M., Flemings, P.B., Bangs, N.L., Chevallier, J., Gràcia, E., Johnson, J.E., Liu,C.-S., Liu, X., Riedel, M., and Torres, M.E., 2004. Feeding methane vents and gashydrate deposits at south Hydrate Ridge. Geophys. Res. Lett., 31:L23310.doi:10.1029/2004GL021286

T.S. COLLETT ET AL.DATA REPORT: NMR LOGGING WHILE DRILLING 11
Figure F1. Map of sites cored and logged during Leg 204 on Hydrate Ridge.
0021
00110001
009
008
Site 1244
Site 1251
Site1245
Site 1246
Site1250
Site 1249
Site 1247Site1248
Site 1252
44°36'N
44°33'125°09'W 125°06' 125°03'

T.S. COLLETT ET AL.DATA REPORT: NMR LOGGING WHILE DRILLING 12
Figure F2. Configuration of the drill string used for LWD operations on ODP Leg 204. VDN = Vision Den-sity Neutron tool. MWD = measurement-while-drilling tool. GVR = GeoVision resistivity-at-the-bit tool.
14.95 Antenna 114.29 Antenna 2
24.24
12.84
3.86 Shallow resistivity5.36
3.74 Medium resistivity3.56 Deep resistivity3.39 Ring resistivity3.03 Gamma ray
1.26 Bit resistivity
0.00
0.27
1.92
27.01 Ultrasonic sensor
27.39 Gamma sensor (long)27.48 Gamma sensor (short)
28.35 Neutron sensor (near)28.50 Neutron sensor (far)
VDN
proVision
MWD
GVR6
30.40
Bit
Bit sub
27.62 Gamma source28.05 Neutron source
17.1 cm (6-3/4 in)
25.1 cm (9-7/8 in)
Distanceabove bit (m)
18.11 Read-out port
Turbine
Magnets

T.S. COLLETT ET AL.DATA REPORT: NMR LOGGING WHILE DRILLING 13
Figure F3. Schematic illustration of the Schlumberger proVision NMR-While-Drilling tool.
Turbine
Magnets
Stabilizer
Wear bands
10.92
8.21
5.28 Read-out port
2.12 Antenna 1
1.47 Antenna 2
0.00
11.40
6-3/4 inDistance fromtool bottom (m)
Diameter
T.S. COLLETT ET AL.DATA REPORT: NMR LOGGING WHILE DRILLING 14
Figure F4. NMR transverse magnetization relaxation times (T2) for a typical sediment containing gas hy-drate and/or water (depicted as a fluid induction decay signal). FFI = free-fluid index.
Sig
nal s
tren
gth
0.001 0.01 0.1 1.0 10 100
FFI
30
Tool measurementGashydrates
Fluid inductiondecay signal
SolidsClay bound
waterFreewater
Time (ms)

T.S. COLLETT ET AL.DATA REPORT: NMR LOGGING WHILE DRILLING 15
Figure F5. A. ProVision- and core-derived porosity from four of nine holes drilled on Hydrate Ridge duringLeg 204 (Holes 1244D, 1245A, 1246A, and 1247A). NMR = nuclear magnetic resonance. (Continued onnext page.)
0
50
100
150
200
250
Dep
th (
mbs
f)
0
50
100
150
200
250
300
350
0
50
100
150
200
250
300
350
20
40
60
80
100
120
140
160
180
Hole 1247AHole 1246AHole 1245AHole 1244D
NMR porosityNMR porosityNMR porosityNMR porosity
Porosity from corePorosity from corePorosity from corePorosity from core
0 1 0 1 0 1 0 100FractionFractionFractionFraction
0 1 0 1 0 1 0 1FractionFractionFractionFraction
A
0

T.S. COLLETT ET AL.DATA REPORT: NMR LOGGING WHILE DRILLING 16
Figure F5 (continued). B. ProVision- and core-derived porosity from five of nine holes drilled on HydrateRidge during Leg 204 (Holes 1248A, 1249A, 1250A, 1250B, and 1251A). NMR = nuclear magnetic reso-nance.
0
20
40
60
80
100
120
140
160
180
200
0 1FractionPorosity from core
0 1Fraction
Dep
th (
mbs
f)
0
10
20
30
40
50
60
70
80
90
00 1
0 1
0 1
0 1
0 1
0
60
100
160
20
40
80
120
140
180
0
50
100
150
200
250
300
350
0 1
0 1
FractionPorosity from core
Fraction
FractionPorosity from core
NMR porosity 1250AFraction
Fraction
Hole 1250AHole 1250B
FractionPorosity from core
FractionNMR porosity NMR porosity NMR porosity 1250B NMR porosity
Hole 1248A Hole 1249A Hole 1251A
B

T.S. COLLETT ET AL.DATA REPORT: NMR LOGGING WHILE DRILLING 17
Figures F6. A–I. ProVision- and density log-derived porosities and derived gas hydrate (GH) saturations(shown as concentrations) for nine holes drilled on Hydrate Ridge during Leg 204 (Holes 1244D, 1245A,1246A, 1247A, 1248A, 1249A, 1250A, 1250B, and 1251A). BSR = bottom-simulating reflector. NMR = nu-clear magnetic resonance. (Continued on next four pages.)
Density porosity NMR porosity GH concentration
BS
R
Por
osity
and
con
cent
ratio
n (f
ract
ion)
1.0
0.8
0.6
0.4
0.2
0.0
-0.2
0 100 200 300 400
Depth (m)
Hole 1244DA
BS
R
Por
osity
and
con
cent
ratio
n (f
ract
ion)
0.8
0.6
0.4
0.2
0.0
-0.2
Hole 1245AB

T.S. COLLETT ET AL.DATA REPORT: NMR LOGGING WHILE DRILLING 18
Figure F6 (continued).
Density porosity NMR porosity GH concentration
BS
R
Por
osity
and
con
cent
ratio
n (f
ract
ion)
1.0
0.8
0.6
0.4
0.2
0.0
-0.20 50 100 150 200
Hole 1246AC
BS
R
Por
osity
and
con
cent
ratio
n (f
ract
ion)
Hole 1247AD1.0
0.8
0.6
0.4
0.2
0.0
-0.20 50 100 150 200
Depth (m)
250

T.S. COLLETT ET AL.DATA REPORT: NMR LOGGING WHILE DRILLING 19
Figure F6 (continued).
Density porosity NMR porosity GH concentration
BS
R
Por
osity
and
con
cent
ratio
n (f
ract
ion)
0 25 50 75
Depth (m)
Hole 1248AEP
oros
ity a
nd c
once
ntra
tion
(fra
ctio
n)
Hole 1249AF
0 50 100 200150
0.8
0.6
0.4
0.2
0.0
-0.2
1.0
0.8
0.6
0.4
0.2
0.0
-0.2

T.S. COLLETT ET AL.DATA REPORT: NMR LOGGING WHILE DRILLING 20
Figure F6 (continued).
Density porosity NMR porosity GH concentration
BS
R
Por
osity
and
con
cent
ratio
n (f
ract
ion)
1.0
0.8
0.6
0.4
0.2
0.0
-0.2
0 100 200
Depth (m)
Hole 1250AG
BS
R
Por
osity
and
con
cent
ratio
n (f
ract
ion)
1.0
0.8
0.6
0.4
0.2
0.0
-0.2
Hole 1250BH

T.S. COLLETT ET AL.DATA REPORT: NMR LOGGING WHILE DRILLING 21
Figure F6 (continued).
Density porosity NMR porosity GH concentration
0 100 200 300 400
Depth (m)
BS
R
Por
osity
and
con
cent
ratio
n (f
ract
ion)
0.8
0.6
0.4
0.2
0.0
-0.2
Hole 1251AI

T.S. COLLETT ET AL.DATA REPORT: NMR LOGGING WHILE DRILLING 22
Table T1. List of ODP Leg 204 sites and holes sur-veyed with logging-while-drilling and measure-ment-while-drilling tools.
Notes: LWD = logging while drilling. — = not LWD logged.
HoleWater depth
(mbrf)LWD interval
(mbsf)proVisiondeployed
proVision sliding test
1244D 906.0 0–380 Yes Yes1245A 882.0 0–380 Yes No1246A 859.0 0–180 Yes Yes1247A 837.0 0–270 Yes No1248A 839.0 0–194 Yes No1249A 787.0 0–90 Yes No1249B 787.0 0–90 No No1250A 806.0 0–210 Yes No1250B 806.0 0–180 Yes Yes1251A 1216.5 0–380 Yes No1252A 1051.0 — — —