Embed Size (px)
Citation preview

28 February 2017
TORUNLAR GROUP OF COMPANIES TODAY (As of 31.12.2016)
AGRIBUSINESS REAL ESTATE ENERGY
▪ A leading company in oilseed, soybean, sunflower, rice and sugarbeet processing
▪ The 2nd
largest REIC in terms of portfolio value and market cap among 31 players
▪ The 2nd
largest natural gas distribution company of Turkey
▪ The largest 187th
industrial company in ISO 500 (Istanbul Chamber of Industry) ranking(2015)
▪ Best and most diversified portfolio ▪ 1.7 million total customers
▪ Competes against such multinationals as Cargill, Bunge and Noble
▪ 8% market share in REIC business ▪ 3.6 billion m³ natural gas sales and distributionvolume
Key Facts
2
million TRY 2015 2016 Change
Total Assets 13,601 15,820 16%
Total Equity 6,226 7,526 21%
Total Sales 3,879 3,837 -1%
Employees 1,057 1,188 12%
Cities of Operation 12 12 0%

Strong sales growth with cumulative 6.1billion TRY within 3 years
Deleveraging from a net debt to a net cash within 2019
Completion of the project pipeline with 1.5billion TRY capex within 3 years
Torunlar REIC Key Overview
3
Strategic Pillars
TRY (000) 2011 2012 2013 2014 2015 2016
Sales 162,909 225,031 343,769 773,240 628,038 665,677
Residence & Office 37,758 84,691 193,451 534,824 249,687 243,273
Mall & Office rental 91,969 102,232 115,990 177,190 309,864 351,652
Other 33,182 38,108 34,328 61,226 68,487 70,752
EBITDA 76,841 133,939 157,623 398,358 368,872 361,922
EBITDA Margin 50.5% 61.9% 47.4% 51.5% 58.7% 54.4%
Net Profit 177,312 336,885 190,556 1,057,892 953,604 1,172,384
Market Cap 889,280 1,610,000 1,380,000 1,725,000 1,625,000 2,075,018
Portfolio Value 3,818,285 4,465,030 5,802,776 6,938,584 8,760,058 9,772,422
Net Asset Value 2,532,906 2,847,035 2,987,591 3,957,423 4,861,088 5,973,549
Capex 206,831 338,872 495,888 578,448 440,241 757,077
Net Debt 444,931 524,529 1,537,415 1,777,147 1,901,906 2,535,224
LTV 14.90% 13.96% 35.75% 30.21% 25.78% 27.30%
3
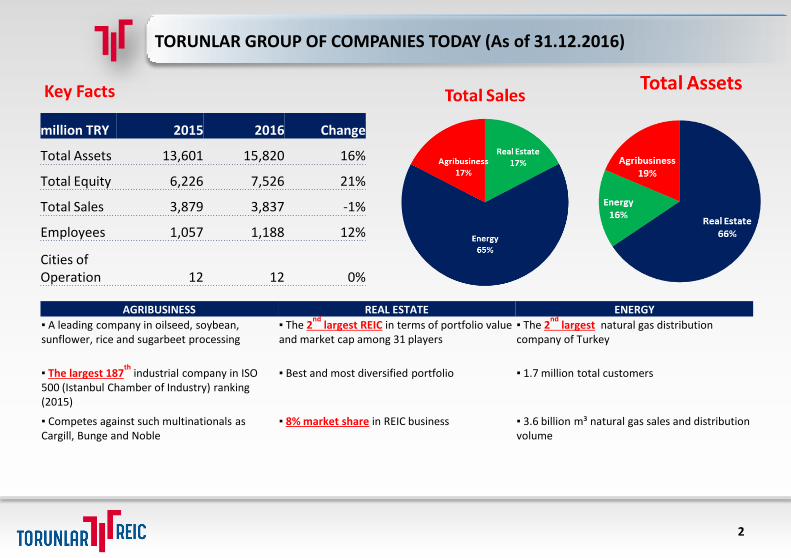
ISTANBUL• Torium Shopping Mall 5. Levent Project• NishIstanbul Mixed-Use Project Mall of İstanbul 2. Phase• Mall of İstanbul Kemankes Land• Torun Tower Kayabasi Land• Torun Center Pasabahce Land
SAMSUN
• Bulvar Samsun Shopping Mall
ANKARA
• ANKAmall Shopping Mall
• Crowne Plaza Hotel
BURSA• Zafer Plaza Shopping Mall• Korupark Shopping Mall• Korupark Residences Phases I-II • Korupark Residences Phase III
MUGLA
• Netsel Marina
ANTALYA
• Deepo Outlet Mall
• Mall of Antalya Project
Project Locations – Turkey –
4

Project Locations – Istanbul –
5
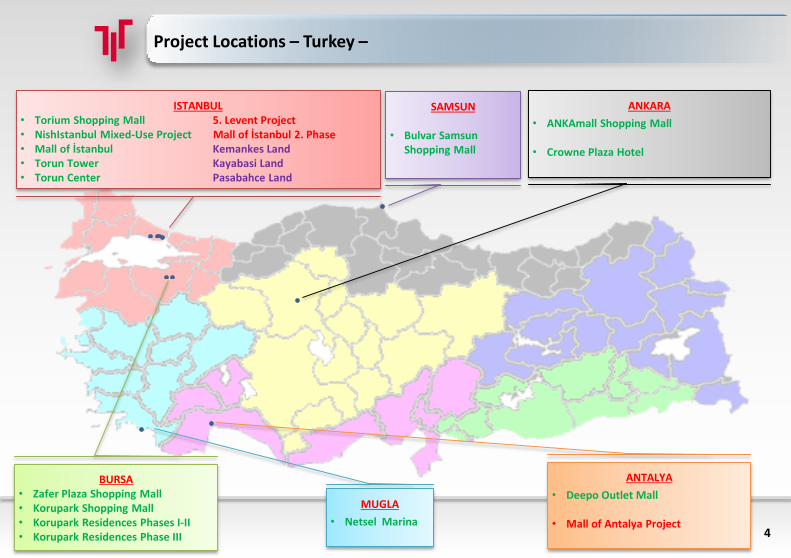
Portfolio size 9.8 billion TRY.
Solid operational performance with 666 million TRY sales revenue, and 362 million TRY EBITDA.
Residential and office deliveries reached 243 million TRY mainly coming from Torun Center.
Rental income at 352 million TRY up by 13.5% y-o-y and like-for-like basis.
Prudent metrics: loan to value at 27.3% and cost of debt in FX is at 4.73%.
Focus on:
obtaining the construction licence of Paşabahçe project,
opening of Mall of Antalya in April 2017,
completing MOI 2nd Phase Hotel and Convention Center project,
delivering some of the residential units at 5th Levent in Q4 2017
destocking of remaining residences and leasing of selected offices and retail area at Torun Center.
Leverage will be ended within the year of 2019.
Consider opportunistic operational asset acquisitions going forward.
2016 Highlights and Forward Strategy
6
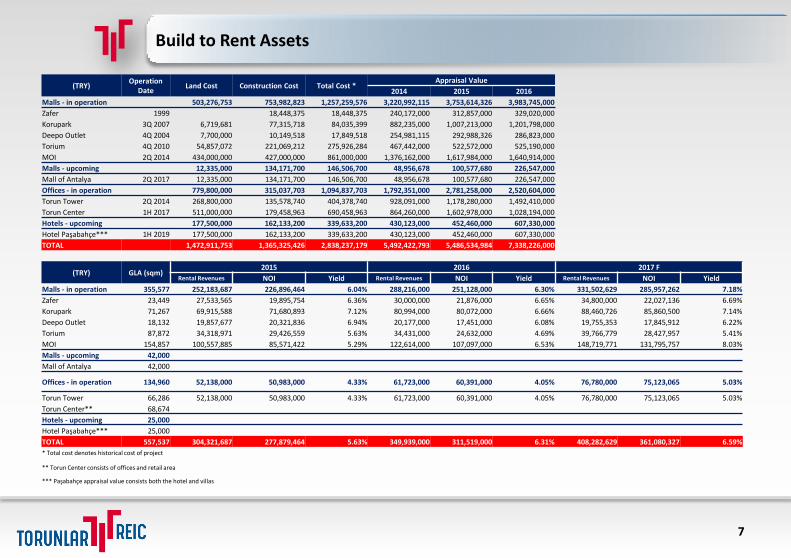
Build to Rent Assets
7
(TRY)Operation
DateLand Cost Construction Cost Total Cost *
Appraisal Value
2014 2015 2016
Malls - in operation 503,276,753 753,982,823 1,257,259,576 3,220,992,115 3,753,614,326 3,983,745,000
Zafer 1999 18,448,375 18,448,375 240,172,000 312,857,000 329,020,000
Korupark 3Q 2007 6,719,681 77,315,718 84,035,399 882,235,000 1,007,213,000 1,201,798,000
Deepo Outlet 4Q 2004 7,700,000 10,149,518 17,849,518 254,981,115 292,988,326 286,823,000
Torium 4Q 2010 54,857,072 221,069,212 275,926,284 467,442,000 522,572,000 525,190,000
MOI 2Q 2014 434,000,000 427,000,000 861,000,000 1,376,162,000 1,617,984,000 1,640,914,000
Malls - upcoming 12,335,000 134,171,700 146,506,700 48,956,678 100,577,680 226,547,000
Mall of Antalya 2Q 2017 12,335,000 134,171,700 146,506,700 48,956,678 100,577,680 226,547,000
Offices - in operation 779,800,000 315,037,703 1,094,837,703 1,792,351,000 2,781,258,000 2,520,604,000
Torun Tower 2Q 2014 268,800,000 135,578,740 404,378,740 928,091,000 1,178,280,000 1,492,410,000
Torun Center 1H 2017 511,000,000 179,458,963 690,458,963 864,260,000 1,602,978,000 1,028,194,000
Hotels - upcoming 177,500,000 162,133,200 339,633,200 430,123,000 452,460,000 607,330,000
Hotel Paşabahçe*** 1H 2019 177,500,000 162,133,200 339,633,200 430,123,000 452,460,000 607,330,000
TOTAL 1,472,911,753 1,365,325,426 2,838,237,179 5,492,422,793 5,486,534,984 7,338,226,000
(TRY) GLA (sqm)2015 2016 2017 F
Rental Revenues NOI Yield Rental Revenues NOI Yield Rental Revenues NOI Yield
Malls - in operation 355,577 252,183,687 226,896,464 6.04% 288,216,000 251,128,000 6.30% 331,502,629 285,957,262 7.18%
Zafer 23,449 27,533,565 19,895,754 6.36% 30,000,000 21,876,000 6.65% 34,800,000 22,027,136 6.69%
Korupark 71,267 69,915,588 71,680,893 7.12% 80,994,000 80,072,000 6.66% 88,460,726 85,860,500 7.14%
Deepo Outlet 18,132 19,857,677 20,321,836 6.94% 20,177,000 17,451,000 6.08% 19,755,353 17,845,912 6.22%
Torium 87,872 34,318,971 29,426,559 5.63% 34,431,000 24,632,000 4.69% 39,766,779 28,427,957 5.41%
MOI 154,857 100,557,885 85,571,422 5.29% 122,614,000 107,097,000 6.53% 148,719,771 131,795,757 8.03%
Malls - upcoming 42,000
Mall of Antalya 42,000
Offices - in operation 134,960 52,138,000 50,983,000 4.33% 61,723,000 60,391,000 4.05% 76,780,000 75,123,065 5.03%
Torun Tower 66,286 52,138,000 50,983,000 4.33% 61,723,000 60,391,000 4.05% 76,780,000 75,123,065 5.03%
Torun Center** 68,674
Hotels - upcoming 25,000
Hotel Paşabahçe*** 25,000
TOTAL 557,537 304,321,687 277,879,464 5.63% 349,939,000 311,519,000 6.31% 408,282,629 361,080,327 6.59%
* Total cost denotes historical cost of project
** Torun Center consists of offices and retail area
*** Paşabahçe appraisal value consists both the hotel and villas
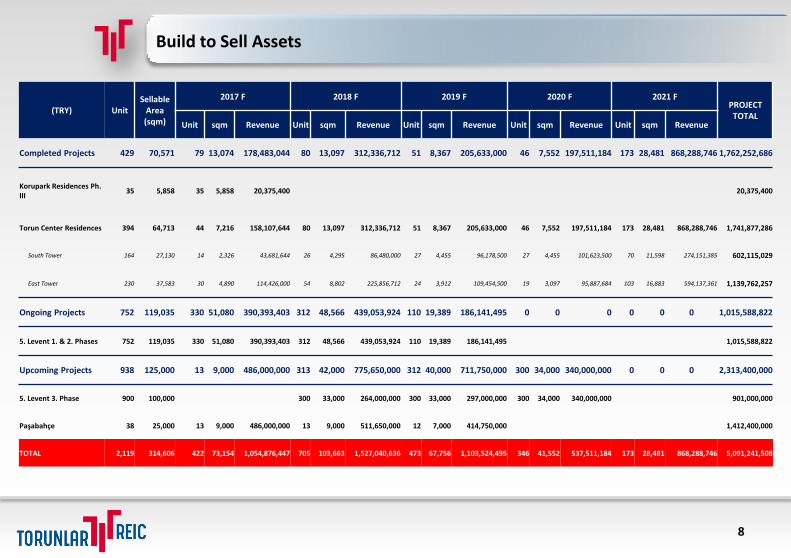
Build to Sell Assets
8
(TRY) UnitSellable
Area (sqm)
2017 F 2018 F 2019 F 2020 F 2021 FPROJECT TOTAL
Unit sqm Revenue Unit sqm Revenue Unit sqm Revenue Unit sqm Revenue Unit sqm Revenue
Completed Projects 429 70,571 79 13,074 178,483,044 80 13,097 312,336,712 51 8,367 205,633,000 46 7,552 197,511,184 173 28,481 868,288,746 1,762,252,686
Korupark Residences Ph. III
35 5,858 35 5,858 20,375,400 20,375,400
Torun Center Residences 394 64,713 44 7,216 158,107,644 80 13,097 312,336,712 51 8,367 205,633,000 46 7,552 197,511,184 173 28,481 868,288,746 1,741,877,286
South Tower 164 27,130 14 2,326 43,681,644 26 4,295 86,480,000 27 4,455 96,178,500 27 4,455 101,623,500 70 11,598 274,151,385 602,115,029
East Tower 230 37,583 30 4,890 114,426,000 54 8,802 225,856,712 24 3,912 109,454,500 19 3,097 95,887,684 103 16,883 594,137,361 1,139,762,257
Ongoing Projects 752 119,035 330 51,080 390,393,403 312 48,566 439,053,924 110 19,389 186,141,495 0 0 0 0 0 0 1,015,588,822
5. Levent 1. & 2. Phases 752 119,035 330 51,080 390,393,403 312 48,566 439,053,924 110 19,389 186,141,495 1,015,588,822
Upcoming Projects 938 125,000 13 9,000 486,000,000 313 42,000 775,650,000 312 40,000 711,750,000 300 34,000 340,000,000 0 0 0 2,313,400,000
5. Levent 3. Phase 900 100,000 300 33,000 264,000,000 300 33,000 297,000,000 300 34,000 340,000,000 901,000,000
Paşabahçe 38 25,000 13 9,000 486,000,000 13 9,000 511,650,000 12 7,000 414,750,000 1,412,400,000
TOTAL 2,119 314,606 422 73,154 1,054,876,447 705 103,663 1,527,040,636 473 67,756 1,103,524,495 346 41,552 537,511,184 173 28,481 868,288,746 5,091,241,508
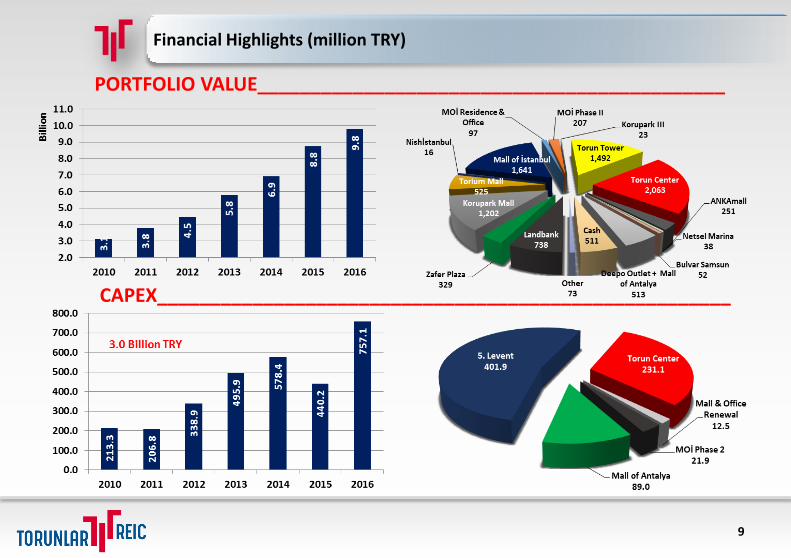
PORTFOLIO VALUE____________________________________________
CAPEX______________________________________________________
Financial Highlights (million TRY)
9
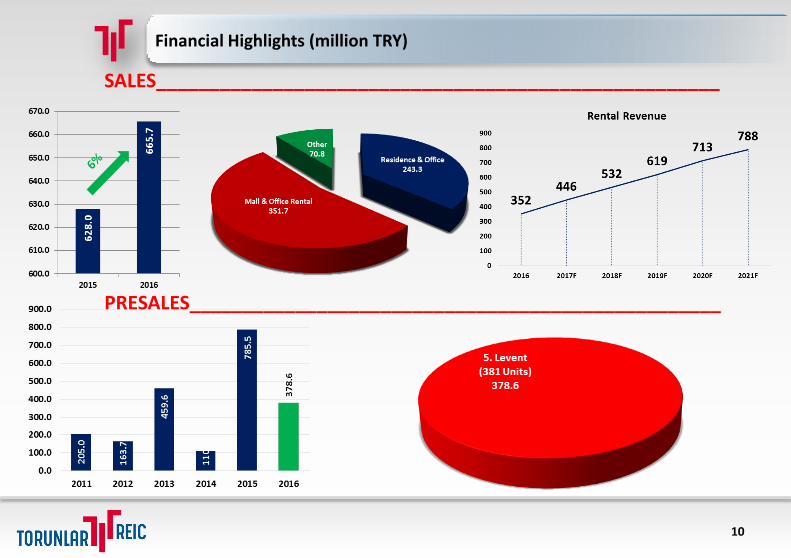
SALES_____________________________________________________
PRESALES__________________________________________________
Financial Highlights (million TRY)
10
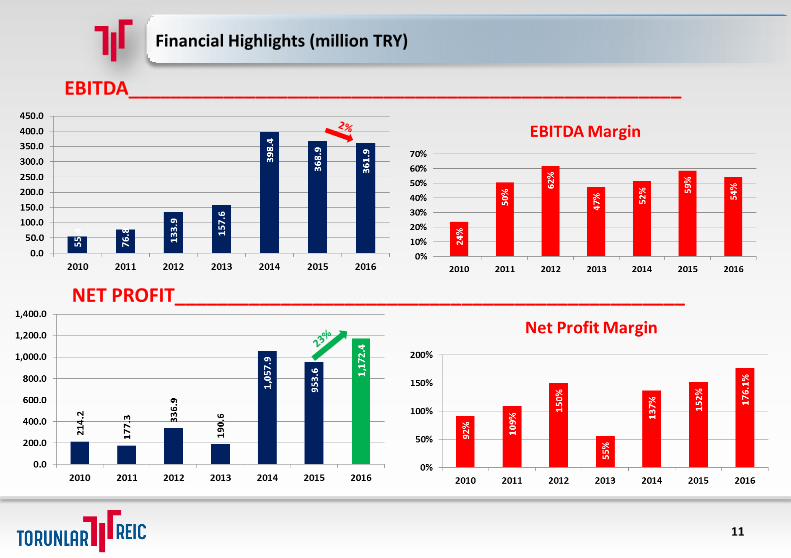
NET PROFIT________________________________________________
EBITDA____________________________________________________
Financial Highlights (million TRY)
11
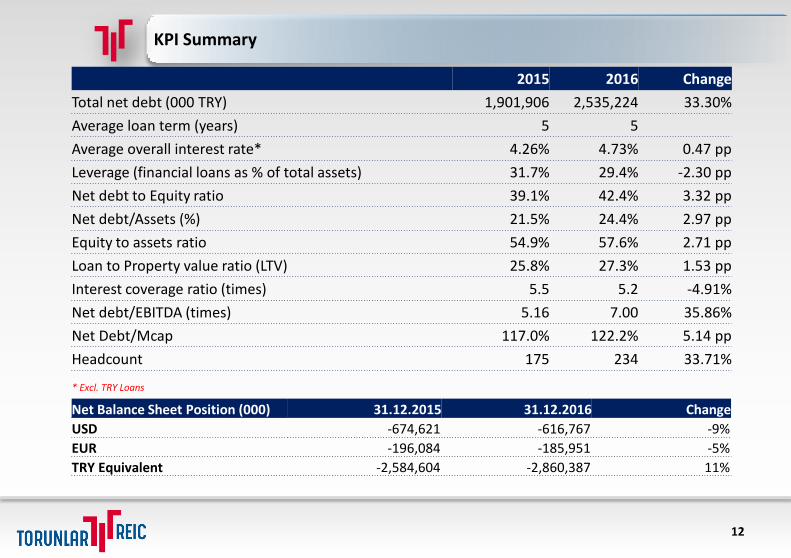
12
KPI Summary
2015 2016 Change
Total net debt (000 TRY) 1,901,906 2,535,224 33.30%
Average loan term (years) 5 5
Average overall interest rate* 4.26% 4.73% 0.47 pp
Leverage (financial loans as % of total assets) 31.7% 29.4% -2.30 pp
Net debt to Equity ratio 39.1% 42.4% 3.32 pp
Net debt/Assets (%) 21.5% 24.4% 2.97 pp
Equity to assets ratio 54.9% 57.6% 2.71 pp
Loan to Property value ratio (LTV) 25.8% 27.3% 1.53 pp
Interest coverage ratio (times) 5.5 5.2 -4.91%
Net debt/EBITDA (times) 5.16 7.00 35.86%
Net Debt/Mcap 117.0% 122.2% 5.14 pp
Headcount 175 234 33.71%
* Excl. TRY Loans
Net Balance Sheet Position (000) 31.12.2015 31.12.2016 Change
USD -674,621 -616,767 -9%
EUR -196,084 -185,951 -5%
TRY Equivalent -2,584,604 -2,860,387 11%
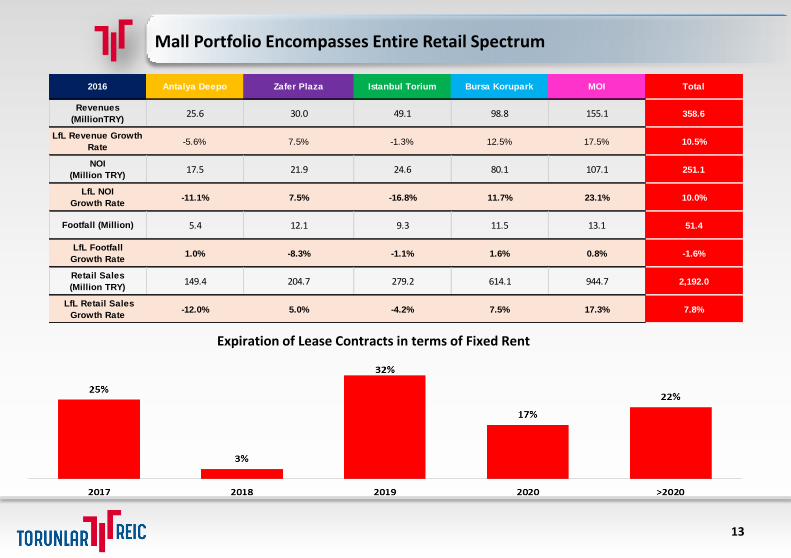
Mall Portfolio Encompasses Entire Retail Spectrum
13
Expiration of Lease Contracts in terms of Fixed Rent
25.6 30.0 49.1 98.8 155.1 358.6
-5.6% 7.5% -1.3% 12.5% 17.5% 10.5%
17.5 21.9 24.6 80.1 107.1 251.1
-11.1% 7.5% -16.8% 11.7% 23.1% 10.0%
5.4 12.1 9.3 11.5 13.1 51.4
1.0% -8.3% -1.1% 1.6% 0.8% -1.6%
149.4 204.7 279.2 614.1 944.7 2,192.0
-12.0% 5.0% -4.2% 7.5% 17.3% 7.8%
Footfall (Million)
2016 Antalya Deepo Zafer Plaza Istanbul Torium Total
Revenues
(MillionTRY)
LfL Revenue Growth
Rate
NOI
(Million TRY)
LfL NOI
Growth Rate
Bursa Korupark MOI
LfL Footfall
Growth Rate
Retail Sales
(Million TRY)
LfL Retail Sales
Growth Rate
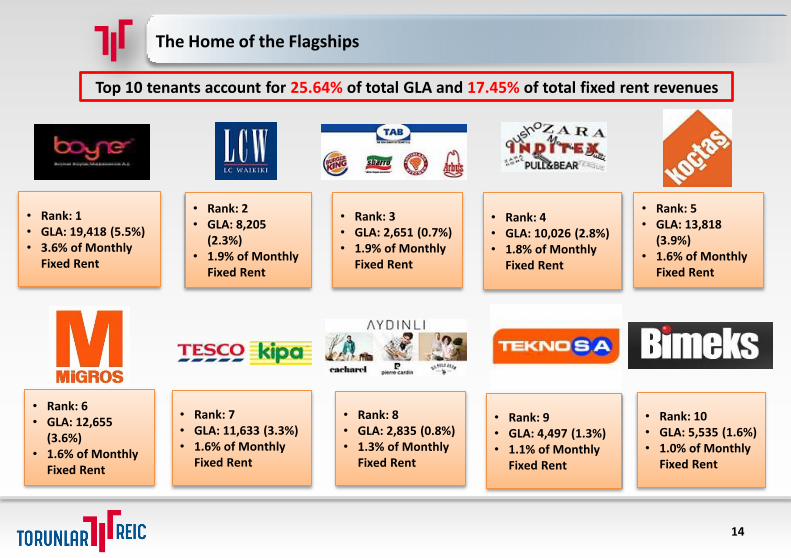
• Rank: 2• GLA: 8,205
(2.3%)• 1.9% of Monthly
Fixed Rent
• Rank: 3• GLA: 2,651 (0.7%)• 1.9% of Monthly
Fixed Rent
• Rank: 4• GLA: 10,026 (2.8%)• 1.8% of Monthly
Fixed Rent
• Rank: 7• GLA: 11,633 (3.3%)• 1.6% of Monthly
Fixed Rent
• Rank: 1• GLA: 19,418 (5.5%)• 3.6% of Monthly
Fixed Rent
• Rank: 10• GLA: 5,535 (1.6%)• 1.0% of Monthly
Fixed Rent
• Rank: 9• GLA: 4,497 (1.3%)• 1.1% of Monthly
Fixed Rent
• Rank: 8• GLA: 2,835 (0.8%)• 1.3% of Monthly
Fixed Rent
• Rank: 5• GLA: 13,818
(3.9%)• 1.6% of Monthly
Fixed Rent
• Rank: 6• GLA: 12,655
(3.6%)• 1.6% of Monthly
Fixed Rent
Top 10 tenants account for 25.64% of total GLA and 17.45% of total fixed rent revenues
The Home of the Flagships
14
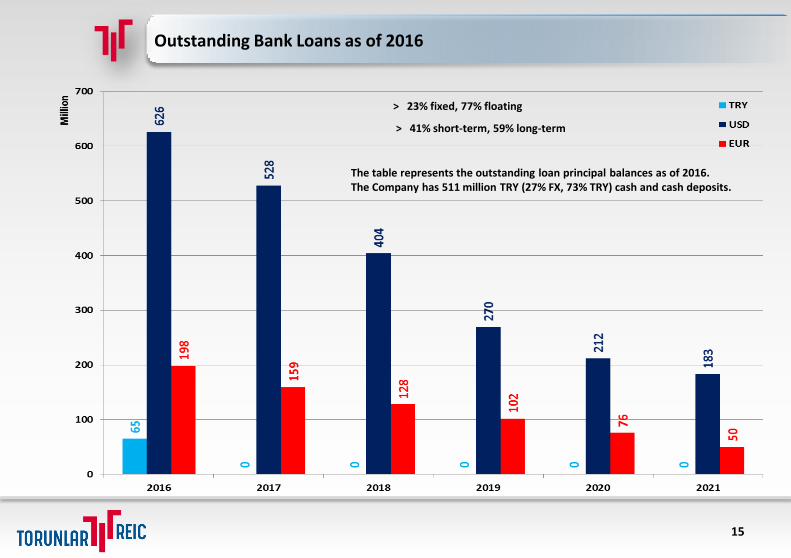
Outstanding Bank Loans as of 2016
15
The table represents the outstanding loan principal balances as of 2016. The Company has 511 million TRY (27% FX, 73% TRY) cash and cash deposits.
> 41% short-term, 59% long-term
> 23% fixed, 77% floating
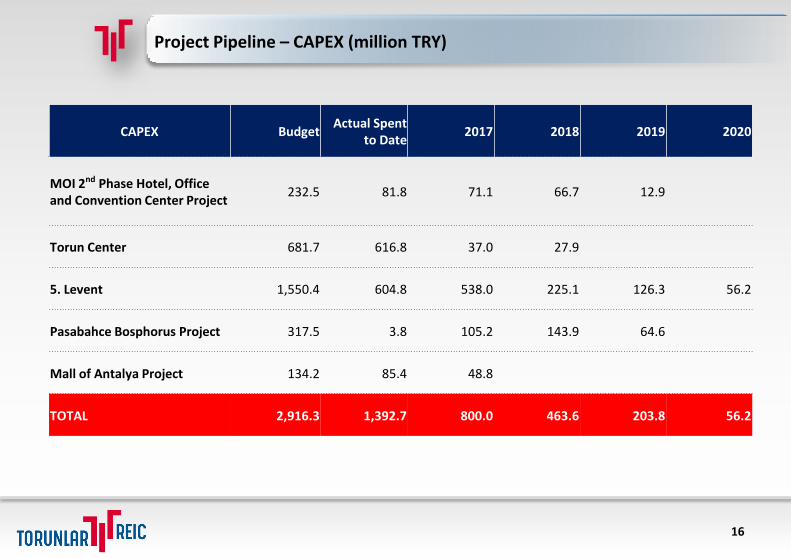
Project Pipeline – CAPEX (million TRY)
16
CAPEX BudgetActual Spent
to Date2017 2018 2019 2020
MOI 2nd Phase Hotel, Office and Convention Center Project
232.5 81.8 71.1 66.7 12.9
Torun Center 681.7 616.8 37.0 27.9
5. Levent 1,550.4 604.8 538.0 225.1 126.3 56.2
Pasabahce Bosphorus Project 317.5 3.8 105.2 143.9 64.6
Mall of Antalya Project 134.2 85.4 48.8
TOTAL 2,916.3 1,392.7 800.0 463.6 203.8 56.2
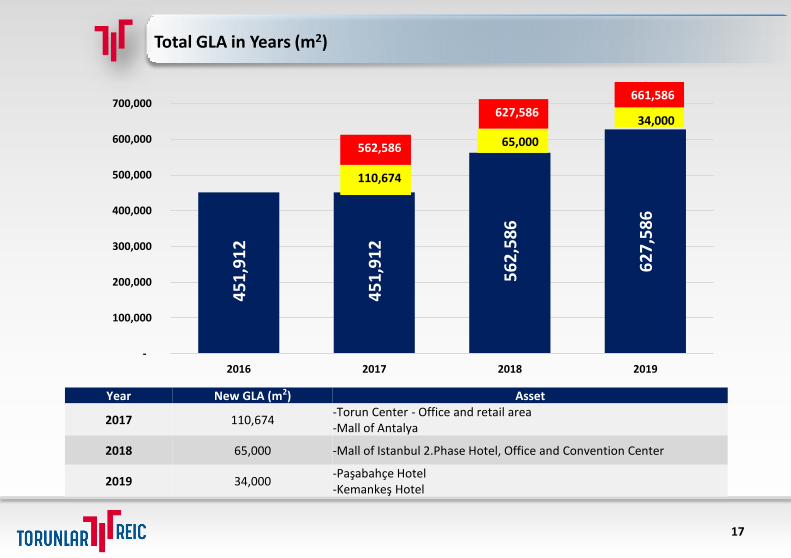
Total GLA in Years (m2)
17
Year New GLA (m2) Asset
2017 110,674-Torun Center - Office and retail area-Mall of Antalya
2018 65,000 -Mall of Istanbul 2.Phase Hotel, Office and Convention Center
2019 34,000-Paşabahçe Hotel-Kemankeş Hotel
45
1,9
12
45
1,9
12
56
2,5
86
62
7,5
86
-
100,000
200,000
300,000
400,000
500,000
600,000
700,000
2016 2017 2018 2019
110,674
65,000562,586
627,586 34,000
661,586
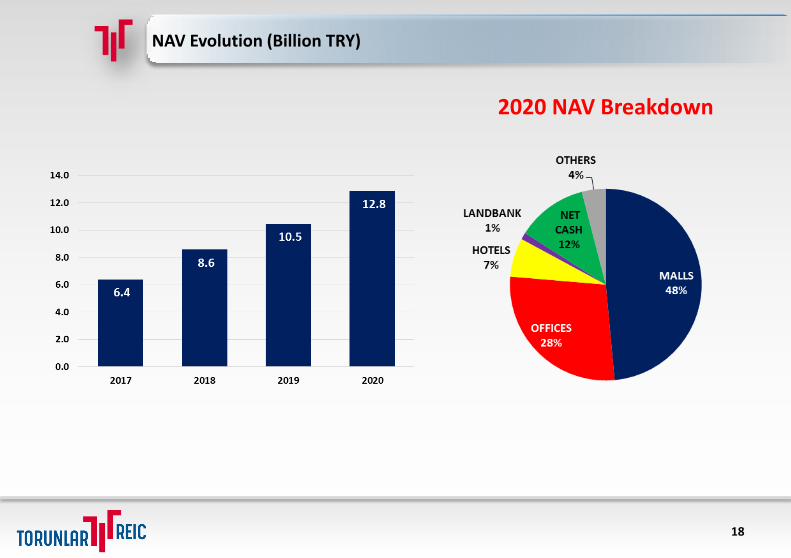
NAV Evolution (Billion TRY)
18
2020 NAV Breakdown
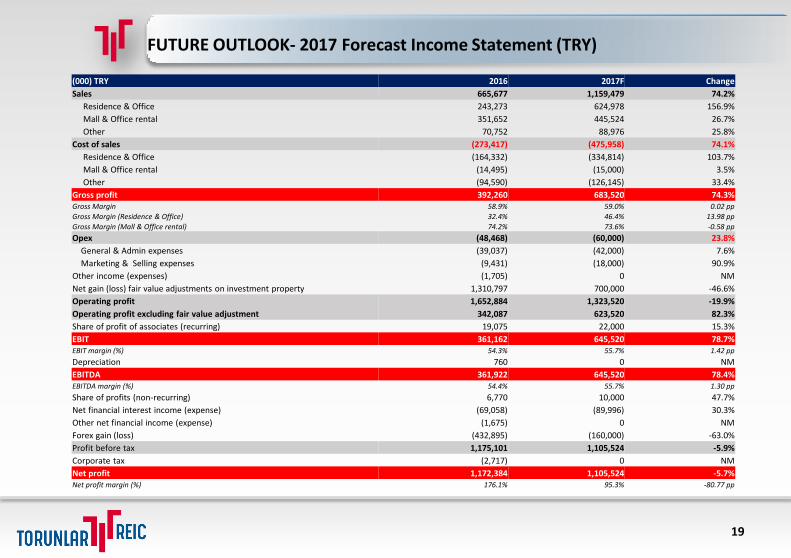
FUTURE OUTLOOK- 2017 Forecast Income Statement (TRY)
19
(000) TRY 2016 2017F Change
Sales 665,677 1,159,479 74.2%
Residence & Office 243,273 624,978 156.9%
Mall & Office rental 351,652 445,524 26.7%
Other 70,752 88,976 25.8%
Cost of sales (273,417) (475,958) 74.1%
Residence & Office (164,332) (334,814) 103.7%
Mall & Office rental (14,495) (15,000) 3.5%
Other (94,590) (126,145) 33.4%
Gross profit 392,260 683,520 74.3%Gross Margin 58.9% 59.0% 0.02 pp
Gross Margin (Residence & Office) 32.4% 46.4% 13.98 pp
Gross Margin (Mall & Office rental) 74.2% 73.6% -0.58 pp
Opex (48,468) (60,000) 23.8%
General & Admin expenses (39,037) (42,000) 7.6%
Marketing & Selling expenses (9,431) (18,000) 90.9%
Other income (expenses) (1,705) 0 NM
Net gain (loss) fair value adjustments on investment property 1,310,797 700,000 -46.6%
Operating profit 1,652,884 1,323,520 -19.9%
Operating profit excluding fair value adjustment 342,087 623,520 82.3%
Share of profit of associates (recurring) 19,075 22,000 15.3%
EBIT 361,162 645,520 78.7%EBIT margin (%) 54.3% 55.7% 1.42 pp
Depreciation 760 0 NM
EBITDA 361,922 645,520 78.4%EBITDA margin (%) 54.4% 55.7% 1.30 pp
Share of profits (non-recurring) 6,770 10,000 47.7%
Net financial interest income (expense) (69,058) (89,996) 30.3%
Other net financial income (expense) (1,675) 0 NM
Forex gain (loss) (432,895) (160,000) -63.0%
Profit before tax 1,175,101 1,105,524 -5.9%
Corporate tax (2,717) 0 NM
Net profit 1,172,384 1,105,524 -5.7%Net profit margin (%) 176.1% 95.3% -80.77 pp
20
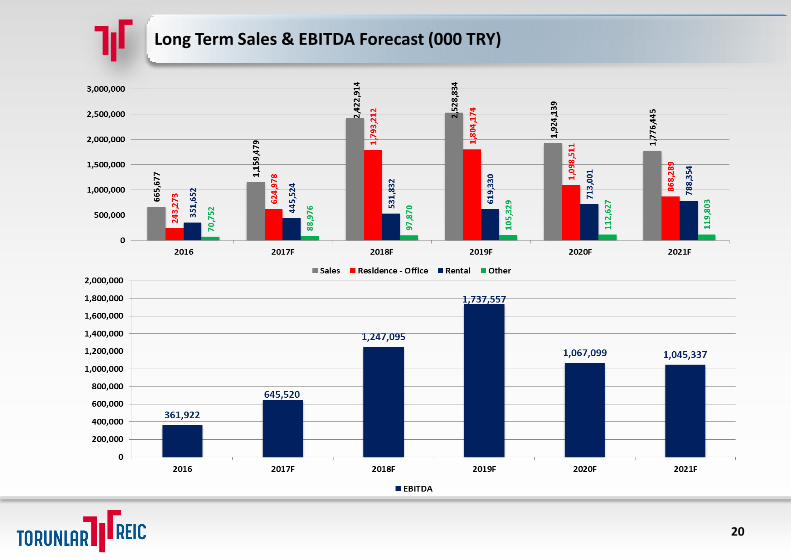
Long Term Sales & EBITDA Forecast (000 TRY)
21
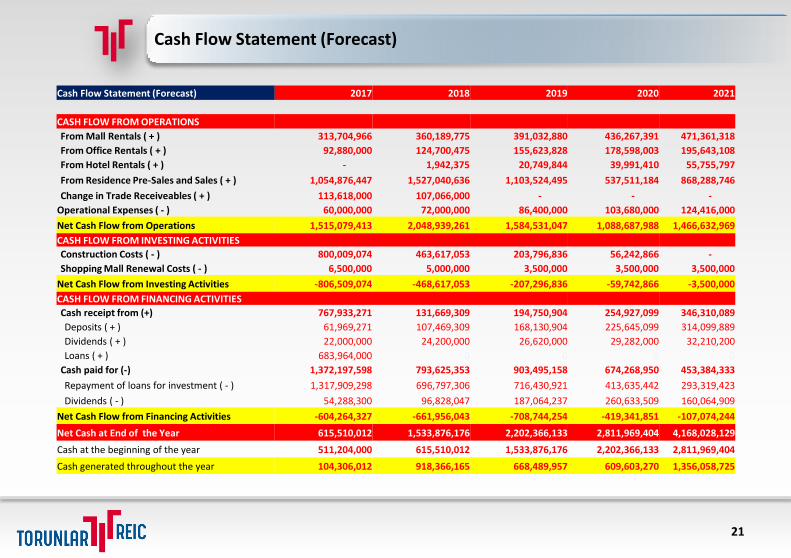
Cash Flow Statement (Forecast)
Cash Flow Statement (Forecast) 2017 2018 2019 2020 2021
CASH FLOW FROM OPERATIONS
From Mall Rentals ( + ) 313,704,966 360,189,775 391,032,880 436,267,391 471,361,318
From Office Rentals ( + ) 92,880,000 124,700,475 155,623,828 178,598,003 195,643,108
From Hotel Rentals ( + ) - 1,942,375 20,749,844 39,991,410 55,755,797
From Residence Pre-Sales and Sales ( + ) 1,054,876,447 1,527,040,636 1,103,524,495 537,511,184 868,288,746
Change in Trade Receiveables ( + ) 113,618,000 107,066,000 - - -
Operational Expenses ( - ) 60,000,000 72,000,000 86,400,000 103,680,000 124,416,000
Net Cash Flow from Operations 1,515,079,413 2,048,939,261 1,584,531,047 1,088,687,988 1,466,632,969
CASH FLOW FROM INVESTING ACTIVITIES
Construction Costs ( - ) 800,009,074 463,617,053 203,796,836 56,242,866 -
Shopping Mall Renewal Costs ( - ) 6,500,000 5,000,000 3,500,000 3,500,000 3,500,000
Net Cash Flow from Investing Activities -806,509,074 -468,617,053 -207,296,836 -59,742,866 -3,500,000
CASH FLOW FROM FINANCING ACTIVITIES
Cash receipt from (+) 767,933,271 131,669,309 194,750,904 254,927,099 346,310,089
Deposits ( + ) 61,969,271 107,469,309 168,130,904 225,645,099 314,099,889
Dividends ( + ) 22,000,000 24,200,000 26,620,000 29,282,000 32,210,200
Loans ( + ) 683,964,000 0 0 0 0
Cash paid for (-) 1,372,197,598 793,625,353 903,495,158 674,268,950 453,384,333
Repayment of loans for investment ( - ) 1,317,909,298 696,797,306 716,430,921 413,635,442 293,319,423
Dividends ( - ) 54,288,300 96,828,047 187,064,237 260,633,509 160,064,909
Net Cash Flow from Financing Activities -604,264,327 -661,956,043 -708,744,254 -419,341,851 -107,074,244
Net Cash at End of the Year 615,510,012 1,533,876,176 2,202,366,133 2,811,969,404 4,168,028,129
Cash at the beginning of the year 511,204,000 615,510,012 1,533,876,176 2,202,366,133 2,811,969,404
Cash generated throughout the year 104,306,012 918,366,165 668,489,957 609,603,270 1,356,058,725
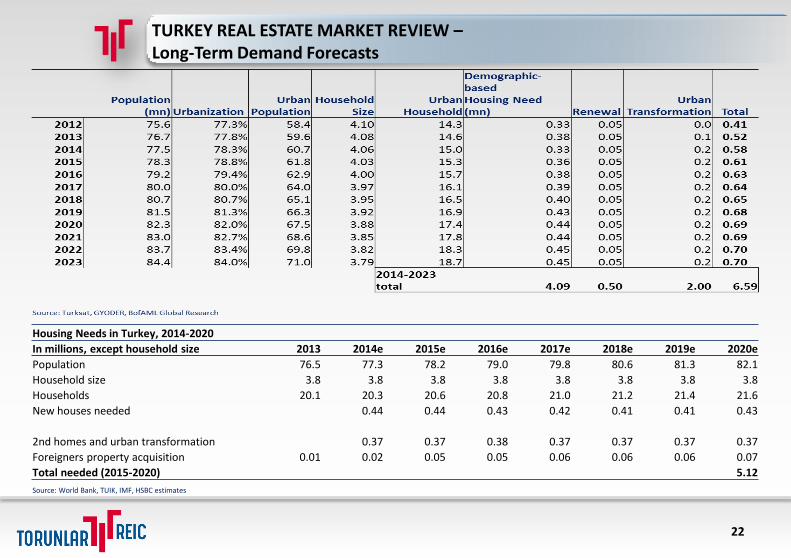
TURKEY REAL ESTATE MARKET REVIEW –Long-Term Demand Forecasts
22
Housing Needs in Turkey, 2014-2020
In millions, except household size 2013 2014e 2015e 2016e 2017e 2018e 2019e 2020e
Population 76.5 77.3 78.2 79.0 79.8 80.6 81.3 82.1
Household size 3.8 3.8 3.8 3.8 3.8 3.8 3.8 3.8
Households 20.1 20.3 20.6 20.8 21.0 21.2 21.4 21.6
New houses needed 0.44 0.44 0.43 0.42 0.41 0.41 0.43
2nd homes and urban transformation 0.37 0.37 0.38 0.37 0.37 0.37 0.37
Foreigners property acquisition 0.01 0.02 0.05 0.05 0.06 0.06 0.06 0.07
Total needed (2015-2020) 5.12
Source: World Bank, TUIK, IMF, HSBC estimates
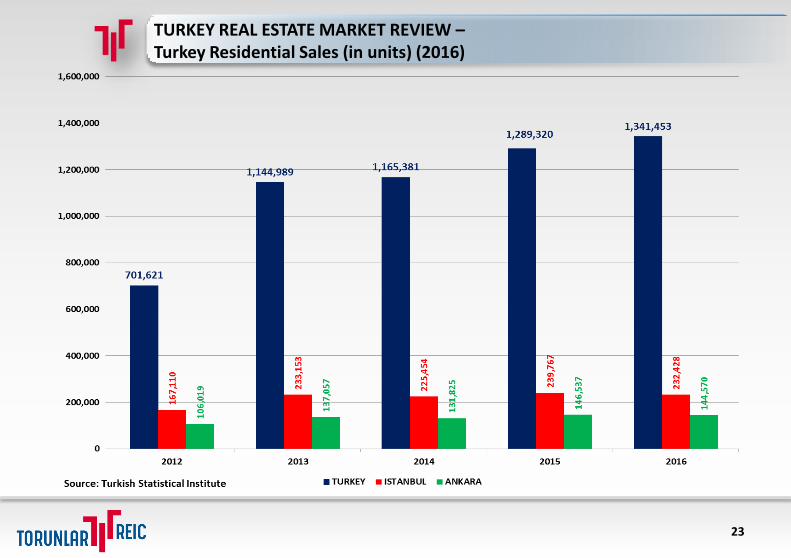
TURKEY REAL ESTATE MARKET REVIEW –Turkey Residential Sales (in units) (2016)
23
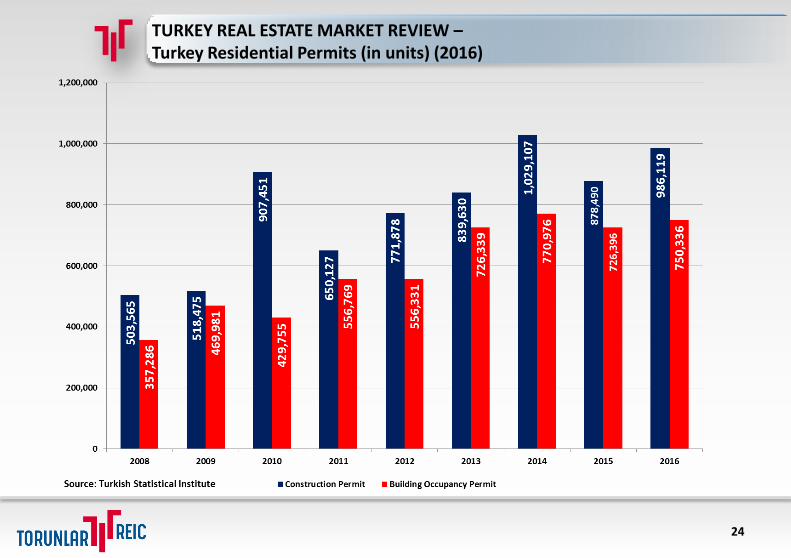
TURKEY REAL ESTATE MARKET REVIEW –Turkey Residential Permits (in units) (2016)
24
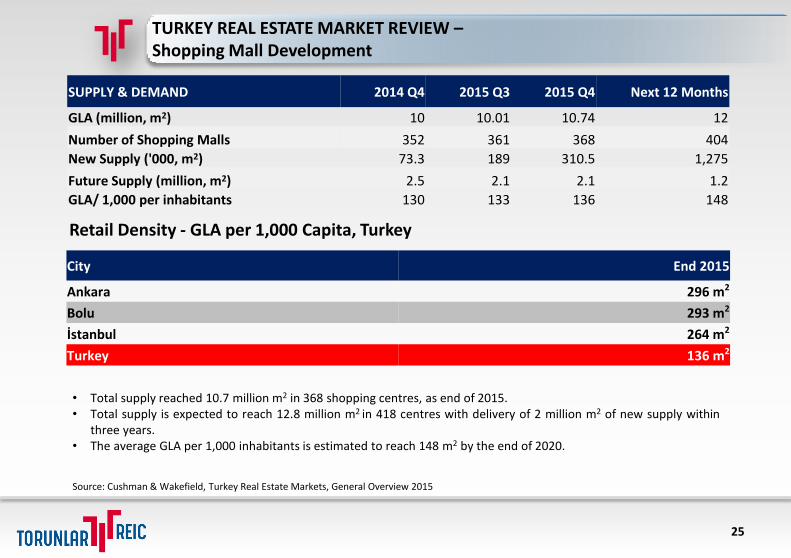
TURKEY REAL ESTATE MARKET REVIEW –Shopping Mall Development
25
Retail Density - GLA per 1,000 Capita, Turkey
Source: Cushman & Wakefield, Turkey Real Estate Markets, General Overview 2015
City End 2015
Ankara 296 m2
Bolu 293 m2
İstanbul 264 m2
Turkey 136 m2
• Total supply reached 10.7 million m2 in 368 shopping centres, as end of 2015.• Total supply is expected to reach 12.8 million m2 in 418 centres with delivery of 2 million m2 of new supply within
three years.• The average GLA per 1,000 inhabitants is estimated to reach 148 m2 by the end of 2020.
SUPPLY & DEMAND 2014 Q4 2015 Q3 2015 Q4 Next 12 Months
GLA (million, m2) 10 10.01 10.74 12
Number of Shopping Malls 352 361 368 404
New Supply ('000, m2) 73.3 189 310.5 1,275
Future Supply (million, m2) 2.5 2.1 2.1 1.2
GLA/ 1,000 per inhabitants 130 133 136 148
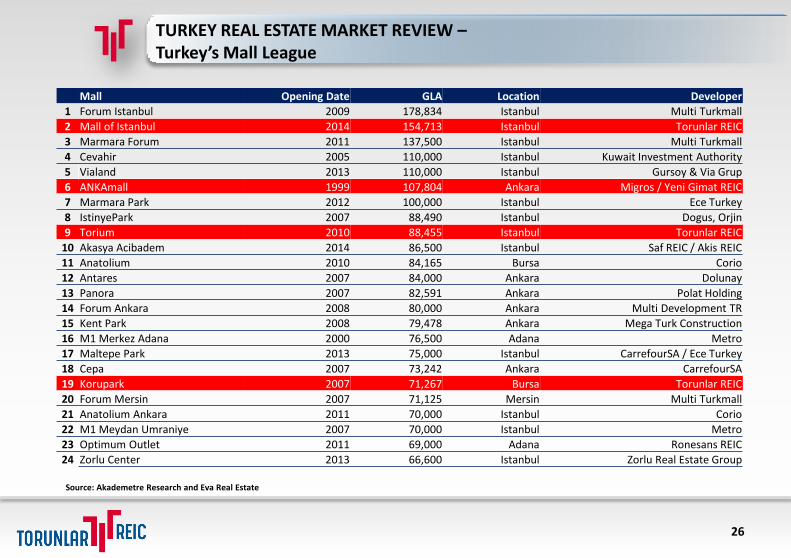
TURKEY REAL ESTATE MARKET REVIEW –Turkey’s Mall League
26
Source: Akademetre Research and Eva Real Estate
Mall Opening Date GLA Location Developer
1 Forum Istanbul 2009 178,834 Istanbul Multi Turkmall
2 Mall of Istanbul 2014 154,713 Istanbul Torunlar REIC
3 Marmara Forum 2011 137,500 Istanbul Multi Turkmall
4 Cevahir 2005 110,000 Istanbul Kuwait Investment Authority
5 Vialand 2013 110,000 Istanbul Gursoy & Via Grup
6 ANKAmall 1999 107,804 Ankara Migros / Yeni Gimat REIC
7 Marmara Park 2012 100,000 Istanbul Ece Turkey
8 IstinyePark 2007 88,490 Istanbul Dogus, Orjin
9 Torium 2010 88,455 Istanbul Torunlar REIC
10 Akasya Acibadem 2014 86,500 Istanbul Saf REIC / Akis REIC
11 Anatolium 2010 84,165 Bursa Corio
12 Antares 2007 84,000 Ankara Dolunay
13 Panora 2007 82,591 Ankara Polat Holding
14 Forum Ankara 2008 80,000 Ankara Multi Development TR
15 Kent Park 2008 79,478 Ankara Mega Turk Construction
16 M1 Merkez Adana 2000 76,500 Adana Metro
17 Maltepe Park 2013 75,000 Istanbul CarrefourSA / Ece Turkey
18 Cepa 2007 73,242 Ankara CarrefourSA
19 Korupark 2007 71,267 Bursa Torunlar REIC
20 Forum Mersin 2007 71,125 Mersin Multi Turkmall
21 Anatolium Ankara 2011 70,000 Istanbul Corio
22 M1 Meydan Umraniye 2007 70,000 Istanbul Metro
23 Optimum Outlet 2011 69,000 Adana Ronesans REIC
24 Zorlu Center 2013 66,600 Istanbul Zorlu Real Estate Group
TURKEY REAL ESTATE MARKET REVIEW –Office Market Overview
27
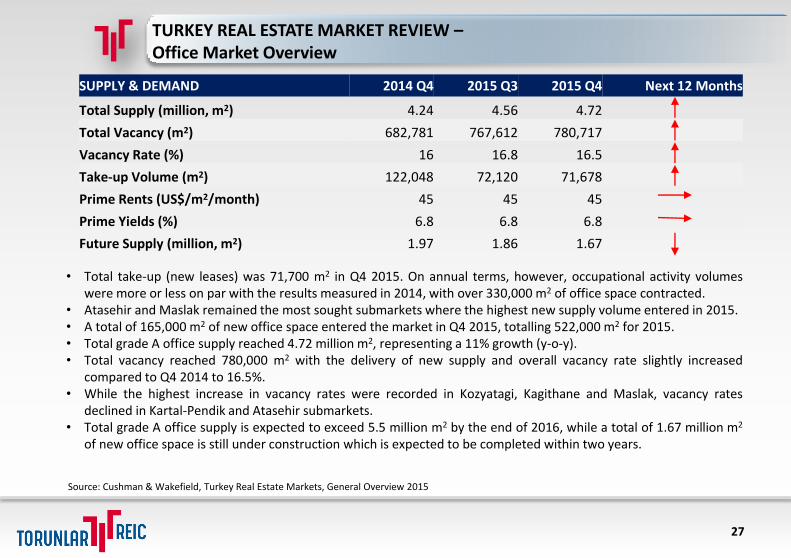
• Total take-up (new leases) was 71,700 m2 in Q4 2015. On annual terms, however, occupational activity volumeswere more or less on par with the results measured in 2014, with over 330,000 m2 of office space contracted.
• Atasehir and Maslak remained the most sought submarkets where the highest new supply volume entered in 2015.• A total of 165,000 m2 of new office space entered the market in Q4 2015, totalling 522,000 m2 for 2015.• Total grade A office supply reached 4.72 million m2, representing a 11% growth (y-o-y).• Total vacancy reached 780,000 m2 with the delivery of new supply and overall vacancy rate slightly increased
compared to Q4 2014 to 16.5%.• While the highest increase in vacancy rates were recorded in Kozyatagi, Kagithane and Maslak, vacancy rates
declined in Kartal-Pendik and Atasehir submarkets.• Total grade A office supply is expected to exceed 5.5 million m2 by the end of 2016, while a total of 1.67 million m2
of new office space is still under construction which is expected to be completed within two years.
Source: Cushman & Wakefield, Turkey Real Estate Markets, General Overview 2015
SUPPLY & DEMAND 2014 Q4 2015 Q3 2015 Q4 Next 12 Months
Total Supply (million, m2) 4.24 4.56 4.72
Total Vacancy (m2) 682,781 767,612 780,717
Vacancy Rate (%) 16 16.8 16.5
Take-up Volume (m2) 122,048 72,120 71,678
Prime Rents (US$/m2/month) 45 45 45
Prime Yields (%) 6.8 6.8 6.8
Future Supply (million, m2) 1.97 1.86 1.67
FINANCIAL STATEMENT - Income Statement
28
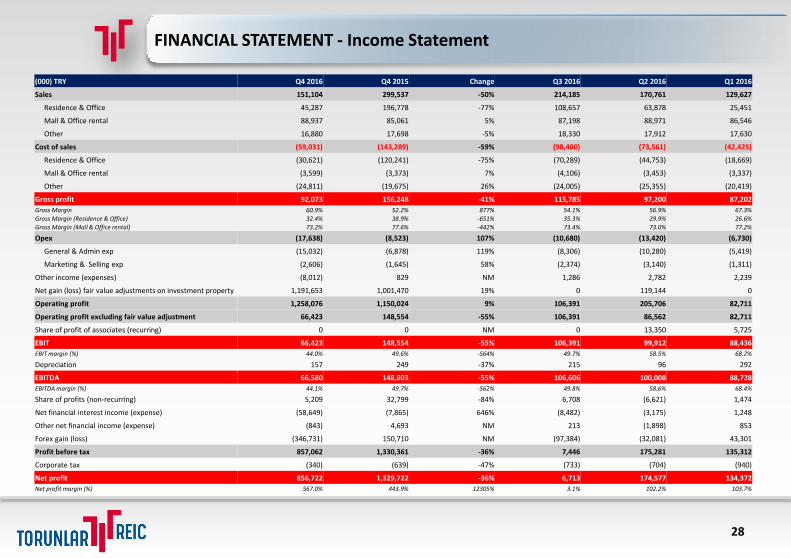
(000) TRY Q4 2016 Q4 2015 Change Q3 2016 Q2 2016 Q1 2016
Sales 151,104 299,537 -50% 214,185 170,761 129,627
Residence & Office 45,287 196,778 -77% 108,657 63,878 25,451
Mall & Office rental 88,937 85,061 5% 87,198 88,971 86,546
Other 16,880 17,698 -5% 18,330 17,912 17,630
Cost of sales (59,031) (143,289) -59% (98,400) (73,561) (42,425)
Residence & Office (30,621) (120,241) -75% (70,289) (44,753) (18,669)
Mall & Office rental (3,599) (3,373) 7% (4,106) (3,453) (3,337)
Other (24,811) (19,675) 26% (24,005) (25,355) (20,419)
Gross profit 92,073 156,248 -41% 115,785 97,200 87,202
Gross Margin 60.9% 52.2% 877% 54.1% 56.9% 67.3%
Gross Margin (Residence & Office) 32.4% 38.9% -651% 35.3% 29.9% 26.6%
Gross Margin (Mall & Office rental) 73.2% 77.6% -442% 73.4% 73.0% 77.2%
Opex (17,638) (8,523) 107% (10,680) (13,420) (6,730)
General & Admin exp (15,032) (6,878) 119% (8,306) (10,280) (5,419)
Marketing & Selling exp (2,606) (1,645) 58% (2,374) (3,140) (1,311)
Other income (expenses) (8,012) 829 NM 1,286 2,782 2,239
Net gain (loss) fair value adjustments on investment property 1,191,653 1,001,470 19% 0 119,144 0
Operating profit 1,258,076 1,150,024 9% 106,391 205,706 82,711
Operating profit excluding fair value adjustment 66,423 148,554 -55% 106,391 86,562 82,711
Share of profit of associates (recurring) 0 0 NM 0 13,350 5,725
EBIT 66,423 148,554 -55% 106,391 99,912 88,436
EBIT margin (%) 44.0% 49.6% -564% 49.7% 58.5% 68.2%
Depreciation 157 249 -37% 215 96 292
EBITDA 66,580 148,803 -55% 106,606 100,008 88,728
EBITDA margin (%) 44.1% 49.7% -562% 49.8% 58.6% 68.4%
Share of profits (non-recurring) 5,209 32,799 -84% 6,708 (6,621) 1,474
Net financial interest income (expense) (58,649) (7,865) 646% (8,482) (3,175) 1,248
Other net financial income (expense) (843) 4,693 NM 213 (1,898) 853
Forex gain (loss) (346,731) 150,710 NM (97,384) (32,081) 43,301
Profit before tax 857,062 1,330,361 -36% 7,446 175,281 135,312
Corporate tax (340) (639) -47% (733) (704) (940)
Net profit 856,722 1,329,722 -36% 6,713 174,577 134,372
Net profit margin (%) 567.0% 443.9% 12305% 3.1% 102.2% 103.7%
FINANCIAL STATEMENT - Income Statement
29
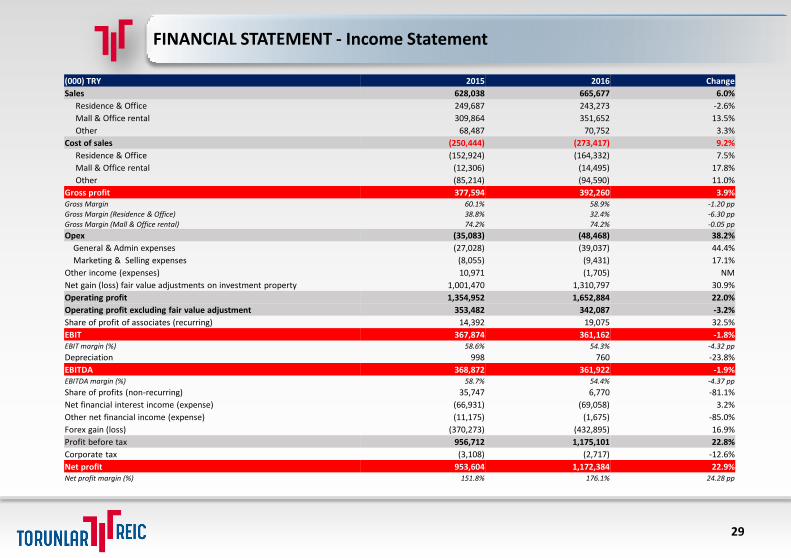
(000) TRY 2015 2016 Change
Sales 628,038 665,677 6.0%
Residence & Office 249,687 243,273 -2.6%
Mall & Office rental 309,864 351,652 13.5%
Other 68,487 70,752 3.3%
Cost of sales (250,444) (273,417) 9.2%
Residence & Office (152,924) (164,332) 7.5%
Mall & Office rental (12,306) (14,495) 17.8%
Other (85,214) (94,590) 11.0%
Gross profit 377,594 392,260 3.9%Gross Margin 60.1% 58.9% -1.20 pp
Gross Margin (Residence & Office) 38.8% 32.4% -6.30 pp
Gross Margin (Mall & Office rental) 74.2% 74.2% -0.05 pp
Opex (35,083) (48,468) 38.2%
General & Admin expenses (27,028) (39,037) 44.4%
Marketing & Selling expenses (8,055) (9,431) 17.1%
Other income (expenses) 10,971 (1,705) NM
Net gain (loss) fair value adjustments on investment property 1,001,470 1,310,797 30.9%
Operating profit 1,354,952 1,652,884 22.0%
Operating profit excluding fair value adjustment 353,482 342,087 -3.2%
Share of profit of associates (recurring) 14,392 19,075 32.5%
EBIT 367,874 361,162 -1.8%EBIT margin (%) 58.6% 54.3% -4.32 pp
Depreciation 998 760 -23.8%
EBITDA 368,872 361,922 -1.9%EBITDA margin (%) 58.7% 54.4% -4.37 pp
Share of profits (non-recurring) 35,747 6,770 -81.1%
Net financial interest income (expense) (66,931) (69,058) 3.2%
Other net financial income (expense) (11,175) (1,675) -85.0%
Forex gain (loss) (370,273) (432,895) 16.9%
Profit before tax 956,712 1,175,101 22.8%
Corporate tax (3,108) (2,717) -12.6%
Net profit 953,604 1,172,384 22.9%Net profit margin (%) 151.8% 176.1% 24.28 pp
FINANCIAL STATEMENT - Balance Sheet
30
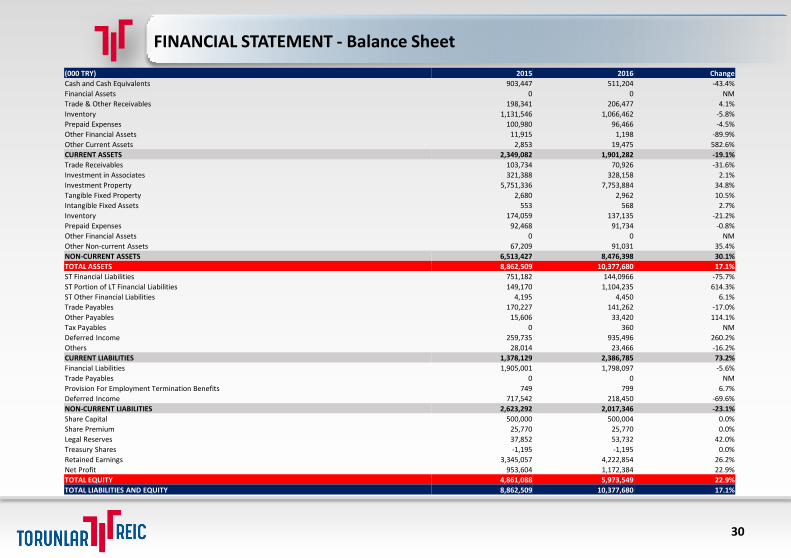
(000 TRY) 2015 2016 Change
Cash and Cash Equivalents 903,447 511,204 -43.4%
Financial Assets 0 0 NM
Trade & Other Receivables 198,341 206,477 4.1%
Inventory 1,131,546 1,066,462 -5.8%
Prepaid Expenses 100,980 96,466 -4.5%
Other Financial Assets 11,915 1,198 -89.9%
Other Current Assets 2,853 19,475 582.6%
CURRENT ASSETS 2,349,082 1,901,282 -19.1%
Trade Receivables 103,734 70,926 -31.6%
Investment in Associates 321,388 328,158 2.1%
Investment Property 5,751,336 7,753,884 34.8%
Tangible Fixed Property 2,680 2,962 10.5%
Intangible Fixed Assets 553 568 2.7%
Inventory 174,059 137,135 -21.2%
Prepaid Expenses 92,468 91,734 -0.8%
Other Financial Assets 0 0 NM
Other Non-current Assets 67,209 91,031 35.4%
NON-CURRENT ASSETS 6,513,427 8,476,398 30.1%
TOTAL ASSETS 8,862,509 10,377,680 17.1%
ST Financial Liabilities 751,182 144,0966 -75.7%
ST Portion of LT Financial Liabilities 149,170 1,104,235 614.3%
ST Other Financial Liabilities 4,195 4,450 6.1%
Trade Payables 170,227 141,262 -17.0%
Other Payables 15,606 33,420 114.1%
Tax Payables 0 360 NM
Deferred Income 259,735 935,496 260.2%
Others 28,014 23,466 -16.2%
CURRENT LIABILITIES 1,378,129 2,386,785 73.2%
Financial Liabilities 1,905,001 1,798,097 -5.6%
Trade Payables 0 0 NM
Provision For Employment Termination Benefits 749 799 6.7%
Deferred Income 717,542 218,450 -69.6%
NON-CURRENT LIABILITIES 2,623,292 2,017,346 -23.1%
Share Capital 500,000 500,004 0.0%
Share Premium 25,770 25,770 0.0%
Legal Reserves 37,852 53,732 42.0%
Treasury Shares -1,195 -1,195 0.0%
Retained Earnings 3,345,057 4,222,854 26.2%
Net Profit 953,604 1,172,384 22.9%
TOTAL EQUITY 4,861,088 5,973,549 22.9%
TOTAL LIABILITIES AND EQUITY 8,862,509 10,377,680 17.1%
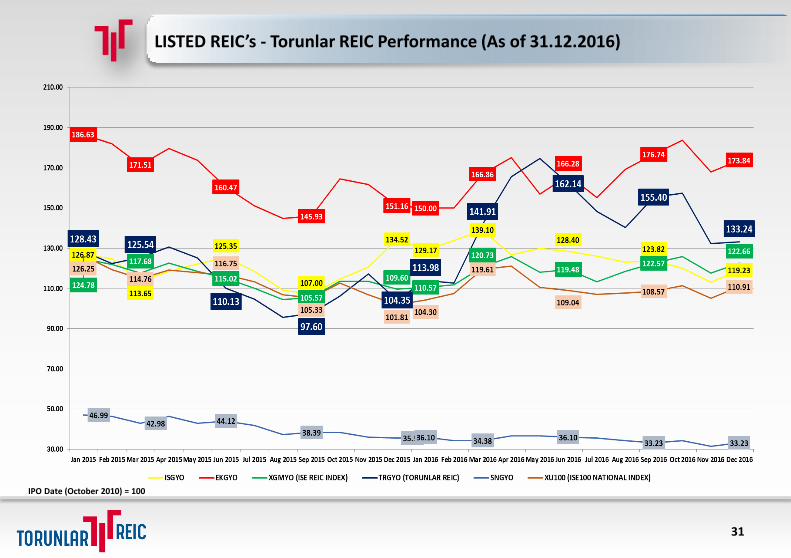
LISTED REIC’s - Torunlar REIC Performance (As of 31.12.2016)
IPO Date (October 2010) = 100
31

Pelin Orsel
Investor Relations / Financial Analyst
Ismail KAZANC
CFO
TORUNLAR REIC (Real Estate Investment Company)Ruzgarlibahce Mah. Ozalp Cikmazi No:4 34805 BeykozIstanbul TURKEYPhone: +90 (216) 425 20 07Fax: +90 (216) 425 59 57
Contacts
This presentation does contain forward-looking statements that reflect the Companymanagement’s current views with respect to certain future events based on the base-caseassumptions. Although it is believed that the expectations reflected in these statements arereasonable, they may be affected by a variety of variables and changes in underlyingassumptions that could cause actual results to differ materially.
Neither Torunlar REIC nor any of its directors, managers or employees nor any other person shallhave any liability whatsoever for any loss arising from the use of this presentation.
Disclaimer