Embed Size (px)
Citation preview
Rea, D.K., Basov, I.A., Scholl, D.W., and Allan, J.F. (Eds.), 1995Proceedings of the Ocean Drilling Program, Scientific Results, Vol. 145
29. SEISMIC STRATIGRAPHY OF CENOZOIC SEDIMENTS FROM NORTH PACIFICSEAMOUNT PLATFORM AND DEEP-SEA SITES, LEG 1451
T.S. Hamilton2
ABSTRACT
High-resolution, digital, single-channel seismic profiles collected aboard the JOIDES Resolution provide a regional strati-graphic context for seven drill sites (881-887) from four locations in the North Pacific. The seismic thickness of the sedimen-tary section varied from > 1 -second two-way traveltime at the Detroit Seamount in the northern Emperor Seamount Chain to<O.l s TWT at the abyssal seafloor Sites 885/886 near the Chinook Trough. The 1-ms data were processed with SIOSEISreceiving mute, deconvolution, gain recovery, and time-varying filters to enhance reflections and correlate to synthetic seismo-grams generated from downhole logs and physical properties data. The reflection sequence at each site was correlated to thelithostratigraphy and impedance contrasts caused by density and velocity variations with an average mistie of about 3 m overseveral hundred meters. A three-part seismic character was recognized at all locations. The uppermost glacial- and ash-influ-enced Pliocene-Pleistocene section had high frequencies and spatial variability characteristic of enhanced hemipelagic sedi-mentation. Miocene diatom oozes dominate the draping and acoustically transparent middle section. Alternating intervals withdiscontinuous high-frequency reflections and more widely correlated moderate-amplitude reflections appear as the high cut andgain are increased. These correspond to alternating intervals of greater and lesser variability in the physical properties. Thebasal sedimentary section tends to be Paleogene and is characterized by moderate to strong reflections that lap and dip withrespect to local basement relief and show evidence of bottom-current influence and downslope slumping and reworking. Thesenear-basement lithologies include claystone, chalk, altered ash, and sediment-sill complexes.
The seismic stratigraphy at Site 881 on the Zenkevich Rise has folds, unconformities, and faults that cut to the top of thesection and show tectonic reactivation on the approach to the Kurile Trench. High-latitude seamount platforms like those sam-pled at the Detroit Seamount sites (882-884) and at Site 887 on the Murray Seamount show great thicknesses and fast rates ofmiddle Tertiary sedimentation. From the high-resolution seismic stratigraphy, the middle Tertiary biosiliceous ooze offers thebest prospect for investigations of paleoclimatic and oceanography cyclicity.
INTRODUCTION
This paper presents selected seismic data acquired aboard theJOIDES Resolution during the site occupancy surveys of OceanDrilling Program (ODP) Leg 145 (North Pacific transect) (Fig. 1).Line ends, lengths, and survey speeds are given along with well pro-jections to the nearest shotpoint in survey tables and location figuresfor each site. Most surveys duplicated a portion of the record used toselect the drill site and crossed back over the site in the shape of a nor-mal or inverted numeral 4. Navigation was by global positioning sys-tem (GPS).
Digital single-channel seismic data was acquired where possibleusing an 80- and a 200-in.3 water gun3 fired simultaneously into a sin-gle-channel, Teledyne hydrophone array.4 Array placement variedsomewhat from survey to survey so offset corrections are given sep-arately for each site. Nominal 10-s records were recorded at firingrates of 11 s in SEG-Y format on 9-track tape. Digitization rates var-ied from survey to survey (either 2, 1, or 0.5 ms) depending on the
1 Rea, D.K., Basov, I.A., Scholl, D.W., and Allan, J.F. (Eds.), 1995. Proc. ODP, Sci.Results, 145: College Station, TX (Ocean Drilling Program).
2 Pacific Geoscience Centre, Geological Survey of Canada, P.O. Box 6000, Sidney,BC V8L 4B2, Canada.
3The seismic sources consisted of Seismic Sources Inc. T water gun S80 Model 03and a Hamco Instrument and Machine HW-200 water gun.
4Teledyne Model 178 Custom Hydrostreamer, consisting of 60 model T-l hydro-phones in a single active grouping 88 m long with an interelement distance of 1.49 m.The elements are all equally weighted and there is no taper to the array.
thickness and depth of the sedimentary section. Other instrumenta-tion included 3.5- and 12-kHz sub-bottom profilers, recorded as ana-log records, and a towed magnetometer.
All seismic records were processed on board using a UNIX-basedversion of the SIOSEIS processing software and Masscomp comput-ers. The objective of the processing was to enhance high-resolutionstratigraphy and remove interbed multiples. The processing sequencetypically included mute to water bottom, time-varying filters thatusually ranged from 50 to 150 Hz and ramped where significant dipsoccurred, mild automatic gain control (AGC) with long design win-dows, and spiking deconvolution using short design windows select-ed from the data. Extensive testing of time-varying filters anddeconvolution parameters resulted in the versions of the lines shown.Detailed processing sequence information and values of SIOSEISprocessing parameters are given in Table 1.
This paper consists of a site-by-site discussion of the seismic dataand the detailed correlation to the stratigraphy. The correlation wasachieved using the physical properties (velocity and density) datagiven in Rea, Basov, Janecek, Palmer-Julson, et al. (1993) to con-struct impedance traces and synthetic seismograms. Detailed assign-ment of reflections depends on velocity and density depth functionswhich occasionally correspond to lithologic variations. Interpreta-tions of the seismic stratigraphy are presented to provide a regionalcontext for the lithostratigraphy, its seismic facies and sense of lap,its variation away from the site, and the significance of each strati-graphic unit and its sedimentation rates. Occasionally, seismic faciessuggest that changes in depositional style do not coincide with theoriginal lithostratigraphic subdivision given in Rea, Basov, Janecek,
437
T.S. HAMILTON
12O°E 150° 180°
55°N
45° k
35C
25C
AJ‰* AleU
^[7jSites883,8844lSites 882
15C
ISrte 881
Φ ^ \
cáár
X ^^ *S1'e*.
150c 120°W
Site 88 7 l
Sites 885, 886
*»,°o,*>*
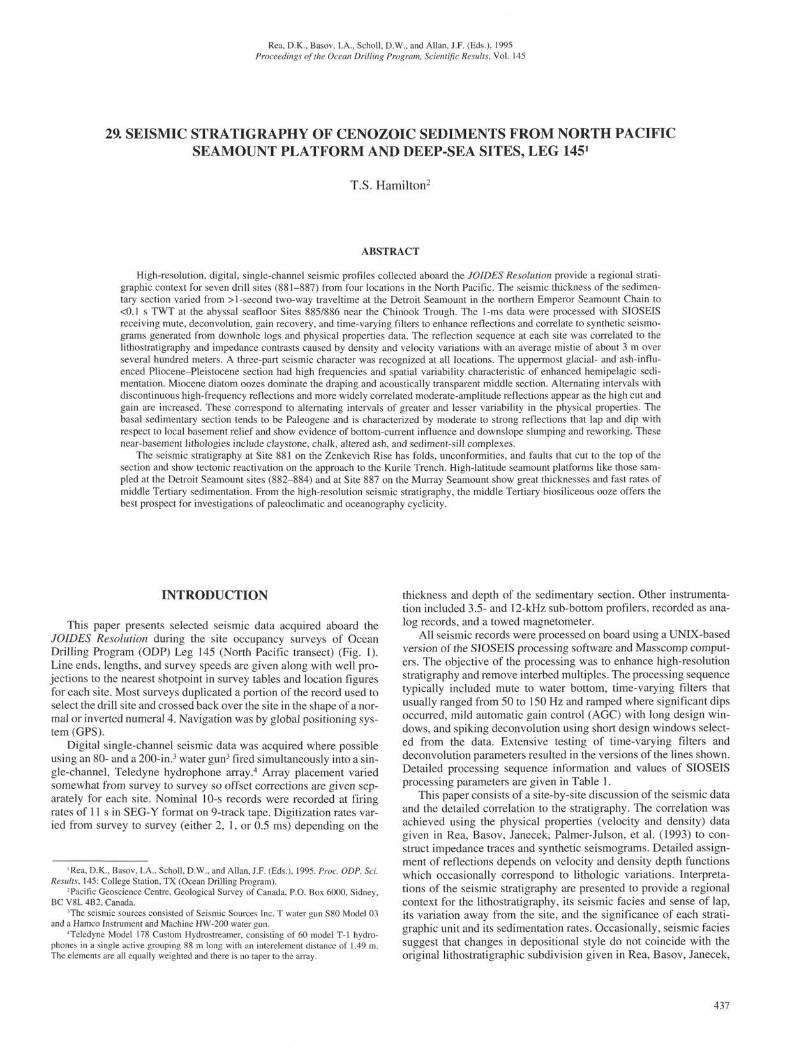
Figure 1. Index to the location of seismic survey figures (figure numbers indicated in boxes) and sites occupied during Leg 145. Prominent geographic featuresare labeled for reference.
Table 1. SIOSEIS processing parameters for Leg 145 seismic data.
Yo-la: 2 ms, MUTE, AVENOR, DECON, FILTER. MIX, AGCDECON: SEDTS -0.0, -0.2; SEATS -0.0, -0.2; FILLEN 0.201; PREWHI 15FILTER: (-0.0, -0.5) (25-200 Hz)
(-0.7,-1.5) (25-55 Hz)MIX 161, AGC Winlen 0.350, STIME 6.9 s
De-2a: 1 ms, MUTE, WBT, WEIGHT, DECON, FILTER, AVENOR, AGC, MIXFILTER: (0.0,4.15) (25-50 Hz) LEN51
(4.30,5.25) (25-500 Hz) LEN 151(5.40, 6.00) (25-100 Hz) LEN 151
DECON: SEDTS -0.0, -0.25; PREWHI 15; LEN 0.201MIX: 161, STIME 4.0 sDe-34a: 1 ms, WBT, MUTE, DECON, FILTER, AVENOR, AGC, MIX
LEN 155 (0.0,0.495)LEN 155 (0.62,0.82)LEN 325 (0.925, 1.358)
3 FILTERS: (0.0,0.43) (25-140 Hz)Ramped (0.55,0.755) (25-100 Hz)Down and across (0.86,1.43) (25-45 Hz)DECON: SEDTS -0.0, -0.25; PREWHI 15; LEN 0.201MIX: 13831, STIME 3.1 s
De-4a: 1 ms, WBT, MUTE, DECON, FILTER, AVENOR, AGC, MIX4 FILTERS: (0.0,0.138) (25-150 Hz) LEN 151 (0.0,0.18)Ramped (0.32,0.41) (25-130 Hz) LEN 131 (0.34,0.43)Down and across (0.54,0.63) (25-55 Hz) LEN 51 (0.55,0.7)
(0.74,1.27) (25-40 Hz) LEN 31 (0.81,1.17)DECON: SEDTS -0.0, -0.25; PREWHI 7.5; FILLEN 0.071:1020, 1450MIX: 131, STIME 5.0 s
De-4c: 1 ms, WBT, MUTE, DECON, FILTER, AVENOR, AGC, MIX4 FILTERS: (0.0,0.161) (25-150 Hz) LEN 155 (0.0,0.146)Ramped (0.315,0.395) (25-130 Hz) LEN 155 (0.38,0.47)Down and across (0.5,0.62) (25-55 Hz) LEN 155 (0.58,0.73)
(0.73,1.27) (25^M)Hz) LEN 155 (0.84,1.18)DECON: SEDTS -0.0, -0.25; PREWHI 7.5; FILLEN 0.071:1720, 1932
(5.06, 5.19)-(5.72, 6.3); (5.13, 5.31)-(5.92, 6.3)AGC len 0.35; MIX: 131, STIME 5.0 s
AP-5a: 1 ms, SHIFT, WBT, MUTE, DECON, FILTER, AGC, MIXSHIFT FFID#(5675-5970) +0.07 s. FFID#5753 0.79, etc.FILTER: (-0.0,-0.61) (25-250 Hz) LEN 151DECON: SEDTS -0.0, -0.251; PREWHI 7.5AGC len 0.155; MIX: 131, STIME 7.4 s
PM-6a: 1 ms, SHIFT, WBT, MUTE, DECON, FILTER, AVENOR, MIXFILTER: (-0.1, -0.2) (25-200 Hz) LEN 151; (-0.3, EOR) (25-55) LEN 91DECON: SEDTS -0.3, -0.5; PREWHI 7.5; FILLEN 0.399MIX: 161, STIME 4.7 s
PM-6c: 1 ms, MUTE, DECON, FILTER, AGC, MIXFILTER: (0.0-0.1, 0.15, 0.35, 0.3) (65-200 Hz) LEN 151 RAMPED(-0.205-0.98, -0.255-0.59, -0.455-0.659, -0.405-0.655) (25-55) LEN 91DECON: SEDTS -0.0, -0.45; PREWHI 6%; FILLEN 0.399AGC: winlen 0.255; MIX: 121, STIME 4.6 s
Palmer-Julson, et al. (1993). In those cases different stratigraphicsubdivisions are suggested. Suggestions are also made for futuredrilling targets to resolve issues raised in this study or to more com-pletely sample the same stratigraphy. Sections are pointed out wherefine-scale cyclicity in the middle Tertiary hemipelagic sedimentationmanifests itself in the seismic record.
RESULTS
Site 881 Seismic Survey Parameters
This site is located in the northwest Pacific on the Zenkevich Rise,between the Kurile Trench and the Emperor Seamount Chain (Fig. 2).A total of 54.4 km of single-channel digital water-gun data was col-lected in three profiles for Site 881 (Table 2) in the shape of the nu-meral 4 on 20 July 1992 immediately before occupying the drill site.With 457 m of tow cable used for the streamer deployment, the depthpoint for the seismic trace is 337 m behind the fix and 378 m behindthe high-resolution sub-bottom profiles. Line Yo-la, 30.7 km long(Table 2; Figs. 2, 3), failed to duplicate a portion of the prefatory sur-vey Line VEMA-2110 (08/27/65 0230-0500 hr), presumably be-cause of navigational inaccuracies in the older data. The site location,on the predetermined coordinates, was somewhat off of the site-sur-vey profiles as indicated for the projected ties (Table 2). The site wassituated adjacent to a Neogene fault within a local graben. While theprocessed seismic records are of reasonable quality, reflections arediscontinuous, and are particularly poorly resolved in the vicinity ofthe site. As a result of this, and of the offset between the drill site andthe survey lines, the tie to the seismic survey is poor for this site.
Site 881 Seismic Stratigraphic Correlation
A portion of the seismic Line Yo-la (Fig. 3) over the site showsapproximately 0.5 s two-way traveltime (s TWT) above the basementreflection, for a local sedimentary thickness of 385 m. The seafloorreflection occurs at 7.342 s TWT, with a strong coherent side lobe orbottom-simulating reflector (BSR) 40 ms later. Shallower than 142ms bsf, the section is reflective but laterally incoherent. The firstprominent sub-bottom reflection occurs at 7.492 s TWT, correspond-ing to 142 ms bsf and a depth of about 113 mbsf. The 142-ms reflec-
SEISMIC STRATIGRAPHY OF CENOZOIC SEDIMENTS
50-N -
48* N
156'E
47*1O'N
ATOO'N
i
7585 / *7600 ^~-^ ,
7700
4
7400
881 I s 7
/7000
/6900
f6800
/6700
6600
7335
17200
00
933
1
-
1
158*E 160*E 16ZE 161'20'E 161*40'E
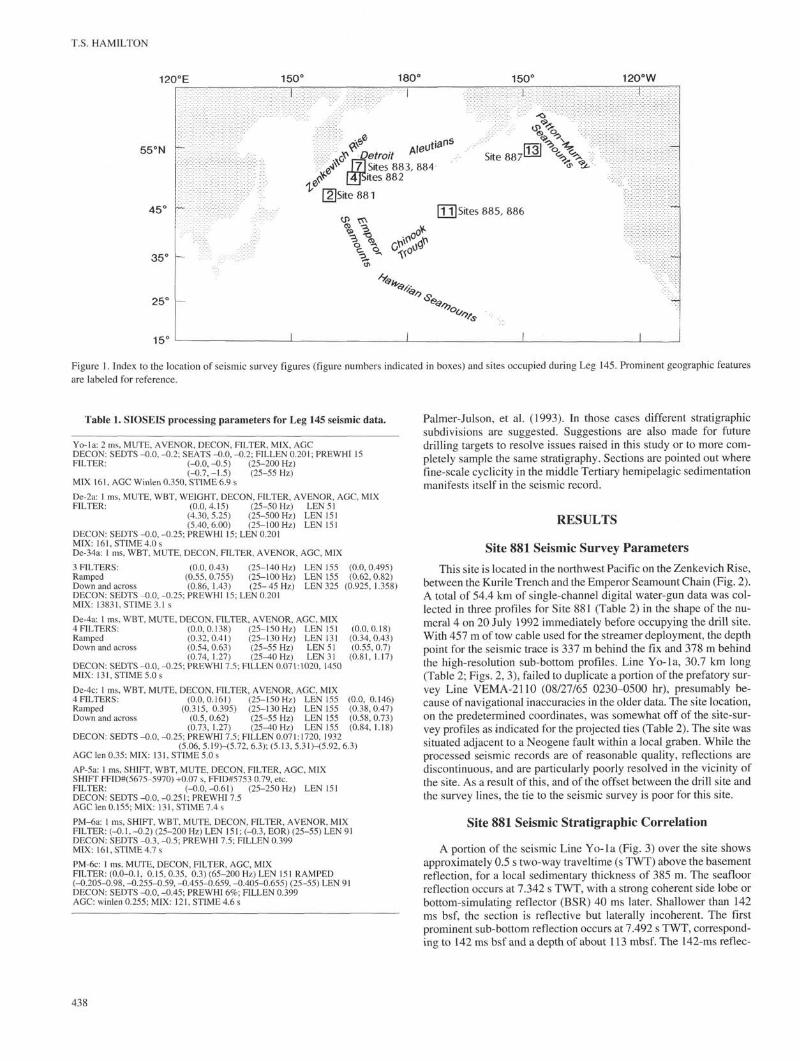
Figure 2. Regional bathymetric setting (left) and location of site occupancy survey for Site 881 (right). Bathymetry after GEBCO Chart 5.02 (Udintsev, 1984).Shotpoint numbers are annotated with time ties provided in Table 2. Shading indicates the portion of the seismic profile shown in Figure 3.
Table 2. Location parameters for seismic survey of Site 881.
Site
881
881
881
Line
-la-lb-lc
Line
Yo-laEOLTIEYo-lbEOLYo-lcEOLTIE
Length(m)
30,65113,58710,153
Day
210
210
Shot
736
348
Time
12001442133614421622162217411726
Shot
65997335682173357585758579337886
Time(min)
16210079
Latitude (N)
46°56.889'47=12.444'±5 shots47° 12.444'47°09.188'47°09.188'47°06.845'1.464 km
Longitude (E)
16F24.648'161°32.888'198 mNW161°32.888'161°23.25T161°23.251'16F30.510'Due south
Seconds/ Meters/ Kilometers/shot shot hr
13.0 41.624.0 54.313.6 29.2
11.48.177.71
tion occurs at a velocity increase and lithologic contrast to theincreasing clay and ash content below the reflection horizon. The sec-tion from 0 to 142 ms bsf (Subunit IA) is double the regional thick-ness, wherein the increased thickness is restricted to a channel orgraben of about 2 km width on the south-southwest side of the faultat shotpoint 6558. The base of a local channel fill and the uppermostof a series of folded reflections of regional significance occur be-tween 7.544 and 7.568 s (194 and 218 ms bsf), corresponding to a 20-m-thick transitional zone at the top of lithologic Subunit IB (155-175mbsf).
The folded high-frequency reflection sequence associated withSubunit IB corresponds to an interval of increasing velocity and de-creasing density, with the lithologic transition to increasing diatomcontent and ash count below. The character of the reflections at thetop of Subunit IB is laterally variable (implying the transitional inter-val is variable also), the horizon can be correlated regionally, despiteits thinning to the south-southwest.
The underlying sedimentary succession to basement has a nearlyconstant thickness of about 220 m. The remainder of the sedimentary
succession penetrated is reflective but still not very coherent, with afew low-frequency and low-amplitude reflections that drape base-ment relief. Two of these draping reflections can be correlated to thecores. The upper one occurs at 7.656 s (306 ms bsf and 248 mbsf),below which density, velocity, and clay content all increase. The low-ermost reflection penetrated by the well occurs at 7.701 s (351 ms bsfand 270 mbsf) at a density decrease corresponding to the top of an-other section of diatomite. Below the maximum depth of penetrationthere is an 80 ms unreflective interval with two strong coherent re-flections in the 50 ms above the basement.
Site 881 Seismic Interpretation
Site 881 (Fig. 3) is situated adjacent to a Neogene fault thatbounds a local graben. The decreasing offset of reflections upsectionresembles growth faulting. The site is situated at the foot of a faultscarp approximately 800 m from the projected fault outcrop. The lo-cation of holes (881A, 881B, and 881C) near a fault causes short-scale facies changes and correlation disparities between holes. Be-cause of the setting for this site, the regional significance of sedimen-tation rates, particularly for the upper unit, should be restricted. Thereflections of greatest lateral extent coincide with transitions in phys-ical properties and lithology. Were the seismic section to provide therule for breaks in the sedimentation curve, these would occur at 113,165, 248, and 270 mbsf. Seismic Line Yo-la (Fig. 3) shows that the160 ms greater sediment thickness on the downthrown block occursin the Pliocene-Pleistocene section of the drill hole.
On the site-survey seismic lines, the folding that affects every-thing downsection from Subunit IB reveals up to 550 m of closureover a distance of 15.3 km, for apparent dips of 4.1° (e.g., to thesouthwest Line Yo-lb; not shown). The episode of folding and fault-ing that affects this site is possibly related to deformation induced asthis segment of seafloor approached the Zenkevich Rise (outer bulgeof the Kurile Trench). Seismic stratigraphy suggests that the signifi-cance of this site is the local enhancement in the uppermost sectionwhich is preserved in a graben. The tectonic reactivation at this siteprovides a natural amplifier that expands the Pliocene-Pleistocene
439
T.S. HAMILTON
SSW Site 881NNE
7.5
8.0 8.0V.E.xβ.25
500m
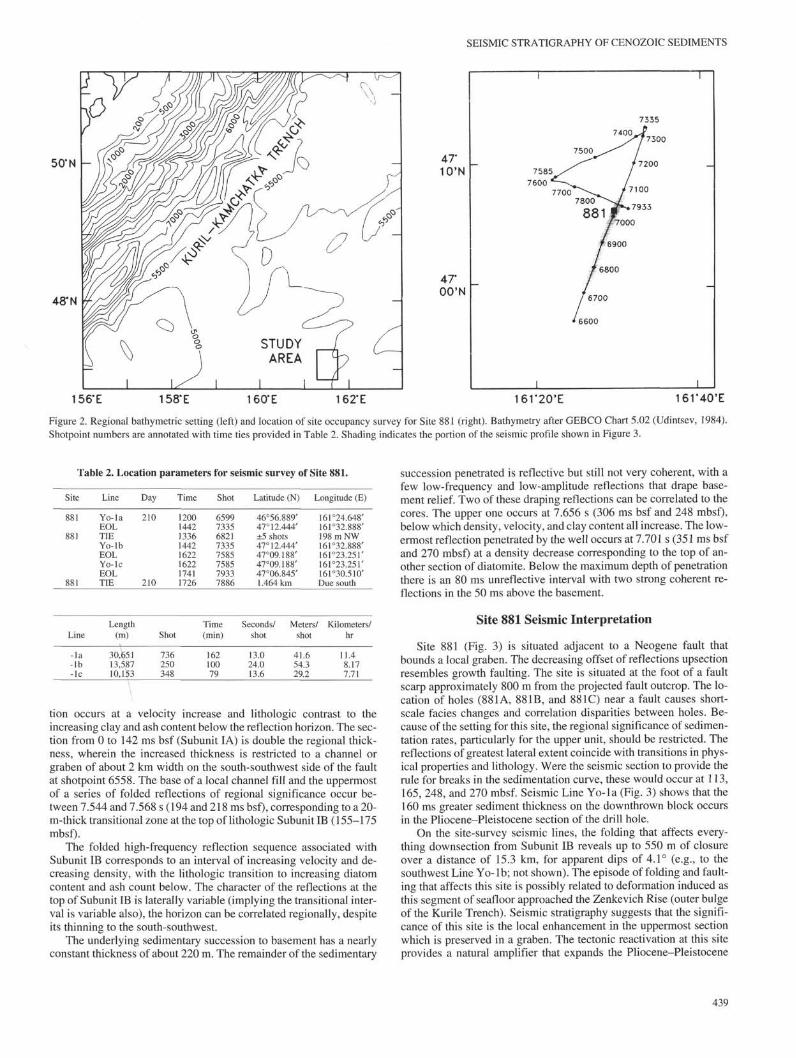
Figure 3. Processed, digital, single-channel seismic Profile YO-la through Site 881 near the Kurile-Zenkevich Rise. Location information is given in Figure 2and Table 2. On this and subsequent seismic profiles, the interpretation is presented on a screened-back version of the processed line shown above. The boldblack line indicates the site location in a local trough. Depth below sea level of the seafloor and maximum depth of penetration are shown. V.E. denotes verticalexaggeration, assuming a seawater velocity of 1500 m/s. For this and subsequent sections, traces are labeled with their field file identification number (FFID),but for convention these are called shotpoints throughout the text. Processing routines in sequence were MUTE, AVENOR, DECON, FILTER, MIX, and AGC,using the parameters listed in Table 1. Lithostratigraphic units and ages are from Rea, Basov, Janecek, Palmer-Julson, et al. (1993).
stratigraphy. Similar sites could be sought along this part of the north-west Pacific-Asian margin to provide other high-resolution recordsfor the past few million years.
The sedimentary reflectors have a pronounced directional anisot-ropy in their coherence and lateral correlation. The greatest continu-ity is in a northwest-southeast direction, which is parallel to the axisof a tongue of sediment extending this direction from the vicinity ofthe Russian Margin (Ludwig and Houtz, 1979; Jacobi and Hayes,1989) near 53.5°N, 163°E. This southeast-directed tongue of sedi-ment at about 0.4 s thickness on the southwest side of the ObruchevRise is probably analogous to the thicker and more extensive MeijiDrift (Scholl et al., 1977) sampled at Site 884 farther to the east.
The seismic stratigraphy and correlation to the site show threeitems of regional significance. First, Subunit IB samples approxi-mately the upper half of a hemipelagic unit of diatom ooze that con-stitutes the bulk of the sedimentary succession between the EmperorRise and the Russian Margin. Second, this unit is folded, faulted, andoverlain by an unconformity that is younger than 2.6 Ma. Above this,the clayey diatom ooze of Subunit IA is highly variable in thicknessand facies. Finally, the site position records an unusually thick suc-cession for this subunit as a channel or graben infilling. Sedimenta-tion rates for this uppermost facies are probably maxima for this partof the northwest Pacific.
Site 882 Seismic Survey Parameters
This survey crossed the southernmost of a pair of sites nearWayne and Detroit seamounts on the northern portion of the EmperorSeamount chain. The survey for Site 882 collected 27.3 km of single-channel water-gun data as one long line (17.6 km) and two short linesin the shape of a backward numeral 4 (Table 3; Fig. 4). With 488 mof tow leader, the offset for the seismic trace is 352 m behind the GPSfix, and 393 m behind the high-resolution sounders. Line De-2a (Fig.5) began with a 2-ms sampling rate and switched to 1-ms rate duringthe line. Line De-2a duplicates a portion of record collected on 13August 1988 by the Thomas Washington. Poor resolution of reflec-tions was noted on Line De-2a during the approach to Site 882, there-fore, at 0340 hr and shotpoint 2028, the streamer was changed andfound to contain air in the leader. The processed record (Fig. 5) showsa phase change at this point, particularly for the reflections at midsec-tion, which is caused by the different responses in the two streamersand is an artifact of acquisition, not of processing or geology. The useof two water guns produced an excellent high-frequency responsethat was better than the single 200-in.3 water gun used on the site se-lection survey.
Despite some thickening and thinning of the sedimentary sectionrelated to persistent channels and basement relief, reflectors are very
44G
SEISMIC STRATIGRAPHY OF CENOZOIC SEDIMENTS
Table 3. Location parameters for seismic survey of Site 882.
Site Line Day Time Shot Latitude (N) Longitude (E)
De-2aEOLTIEDe-2bEOLDe-2cEOLTIE
218
218
02540436041204360519051906040551
18812303215323032525252527522687
50° 15.170'50°23.509'±7 shots50°23.509'50°23.298'50°23.298'50°20.064'±43 shots
167°42.014'167°34.951'294 m SW167°34.951'167°37.735'167°37.735'167°35.847'1585 mNE
LineLength
(m) ShotTime(min)
Seconds/shot
Meters/ Kilometers/shot hr
-2a-2b-2c
17,587 4223,322 2226,400 227
1024345
14.511.61 1.9
41.715.02S.2
10.34.648.53
continuous and highly correlatable. Considerable energy and reflec-tion continuity for reflections with frequencies higher than 140 Hz al-lows the correlation of layering on the scale of 11 m. Thus, theseismic sections have sufficient resolution to carry picks correspond-ing to biostratigraphic zones or single magnetic reversals, accordingto data in Rea, Basov, Janecek, Palmer-Julson, et al. (1993). Specificgeologic times can be assigned to reflections.
Site 882 is highly representative of the regional stratigraphy de-spite nearby relief (Fig. 4) and minor faulting. Within 30 km of Site882 the basement displays up to 1 s (750 m) of relief. This relief andthe shallow basement elevations probably resulted from construc-tional seamount volcanism of the Emperor Seamount Chain. Within10 km of the site the basement relief is only about 300 ms, and mostof the variation in the thickness of the sedimentary section is below450 ms bsf (i.e., below the base of the hole) and related to the su-pertenuous drape of the underlying basement. The total sedimentthickness at the site is about 1.16 s TWT (1000 m); however, the cor-ing penetrated only the upper 580 ms. The nearest modern abyssalchannel is about 13 km from the site, and there is no seismic evidencethat near-bottom currents influenced the upper half of the stratigra-phy that was cored. Two listric faults cut the entire section on LineDe-2c about 0.7 and 1.3 km southwest of the site. Features like thisare rare, however, and do not influence the stratigraphy near the drillhole. Despite lithologic and thickness variations, most of the seismiccharacter can be correlated among the three sites (882, 883 and 884)located near Detroit Seamount.
Site 882 Seismic Stratigraphic Correlation
Although the seismic sections contained frequency informationabove 285 Hz, for correlation to the stratigraphy it was necessary toseverely filter the traces to match the synthetic seismogram (Fig. 6).The downhole variation in density and velocity from the shipboardphysical properties data (Rea, Basov, Janecek, Palmer-Julson, et al.,1993) was used to calculate the impedance functions and the synthet-ic seismogram traces for this and the other sites (Fig. 6). Althoughlower in frequency than the seismic profile, it contains the same basicstructure, permitting a correlation to be made.
The well tie depends on the velocity/depth function, which at Site882 has four distinct zones, each having a different, gentle linear in-crease of velocity with depth. Judging from the underestimation ofvelocities from the gamma-ray attenuation porosity evaluator(GRAPE) and physical property lab data compared to the downholelogs on the other sites (Rea, Basov, Janecek, Palmer-Julson, et al.,1993), because of core rebound expansion, these velocities, althoughlikely to be relatively correct, are probably minimal. There is a slightprogressive error with depth such that the synthetic comes in too slow(too deep). The magnitude of this velocity stretch is 1.66% over 540ms, which makes it noticeable but not worth correcting for, as the av-erage velocities cannot be estimated reproducibly to that accuracy.
50*25'N
50'20'N
50*15'N
I
WAYNESEAMOUNTPLATFORM
2300
_ \
\CH
ooI
I ,
I
22Oθ\
882
2700 /
2752
)0 2500
/2600 /
21OθN
) !
:
2525
\ 2000 // / /
//‰. / /.' 1881 / / /—
\/ / I /
16730'E 167 35'E 167'40'E 16745'E
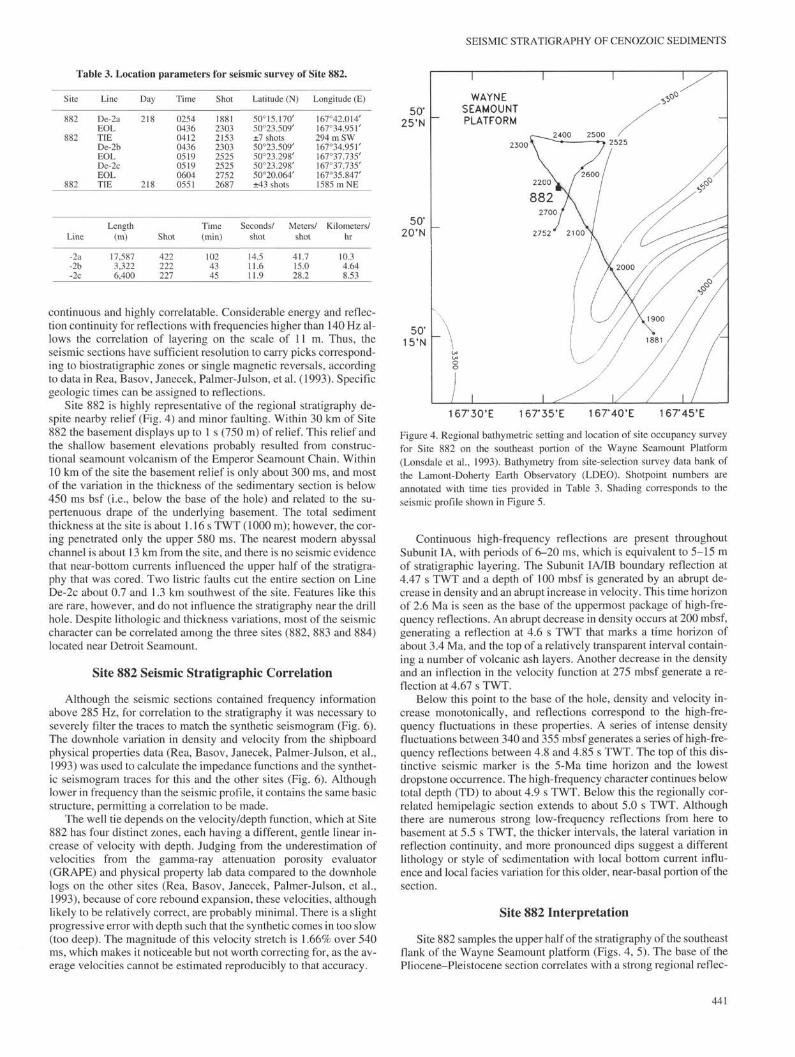
Figure 4. Regional bathymetric setting and location of site occupancy surveyfor Site 882 on the southeast portion of the Wayne Seamount Platform(Lonsdale et al., 1993). Bathymetry from site-selection survey data bank ofthe Lamont-Doherty Earth Observatory (LDEO). Shotpoint numbers areannotated with time ties provided in Table 3. Shading corresponds to theseismic profile shown in Figure 5.
Continuous high-frequency reflections are present throughoutSubunit IA, with periods of 6-20 ms, which is equivalent to 5-15 mof stratigraphic layering. The Subunit IA/IB boundary reflection at4.47 s TWT and a depth of 100 mbsf is generated by an abrupt de-crease in density and an abrupt increase in velocity. This time horizonof 2.6 Ma is seen as the base of the uppermost package of high-fre-quency reflections. An abrupt decrease in density occurs at 200 mbsf,generating a reflection at 4.6 s TWT that marks a time horizon ofabout 3.4 Ma, and the top of a relatively transparent interval contain-ing a number of volcanic ash layers. Another decrease in the densityand an inflection in the velocity function at 275 mbsf generate a re-flection at 4.67 s TWT.
Below this point to the base of the hole, density and velocity in-crease monotonically, and reflections correspond to the high-fre-quency fluctuations in these properties. A series of intense densityfluctuations between 340 and 355 mbsf generates a series of high-fre-quency reflections between 4.8 and 4.85 s TWT. The top of this dis-tinctive seismic marker is the 5-Ma time horizon and the lowestdropstone occurrence. The high-frequency character continues belowtotal depth (TD) to about 4.9 s TWT. Below this the regionally cor-related hemipelagic section extends to about 5.0 s TWT. Althoughthere are numerous strong low-frequency reflections from here tobasement at 5.5 s TWT, the thicker intervals, the lateral variation inreflection continuity, and more pronounced dips suggest a differentlithology or style of sedimentation with local bottom current influ-ence and local facies variation for this older, near-basal portion of thesection.
Site 882 Interpretation
Site 882 samples the upper half of the stratigraphy of the southeastflank of the Wayne Seamount platform (Figs. 4, 5). The base of thePliocene-Pleistocene section correlates with a strong regional reflec-
44 i
T.S. HAMILTON
Site 882
NW
4.5
6.01950 2000 Change 2050 2100
streamer
500m
2150 2200 2250
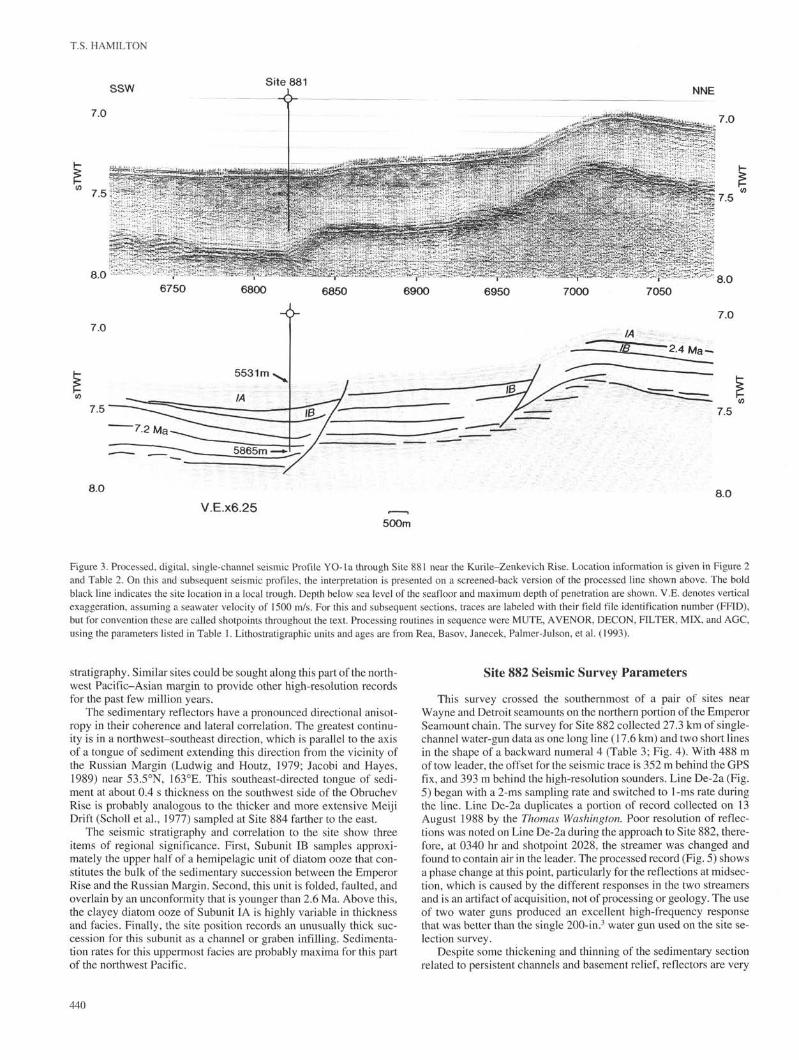
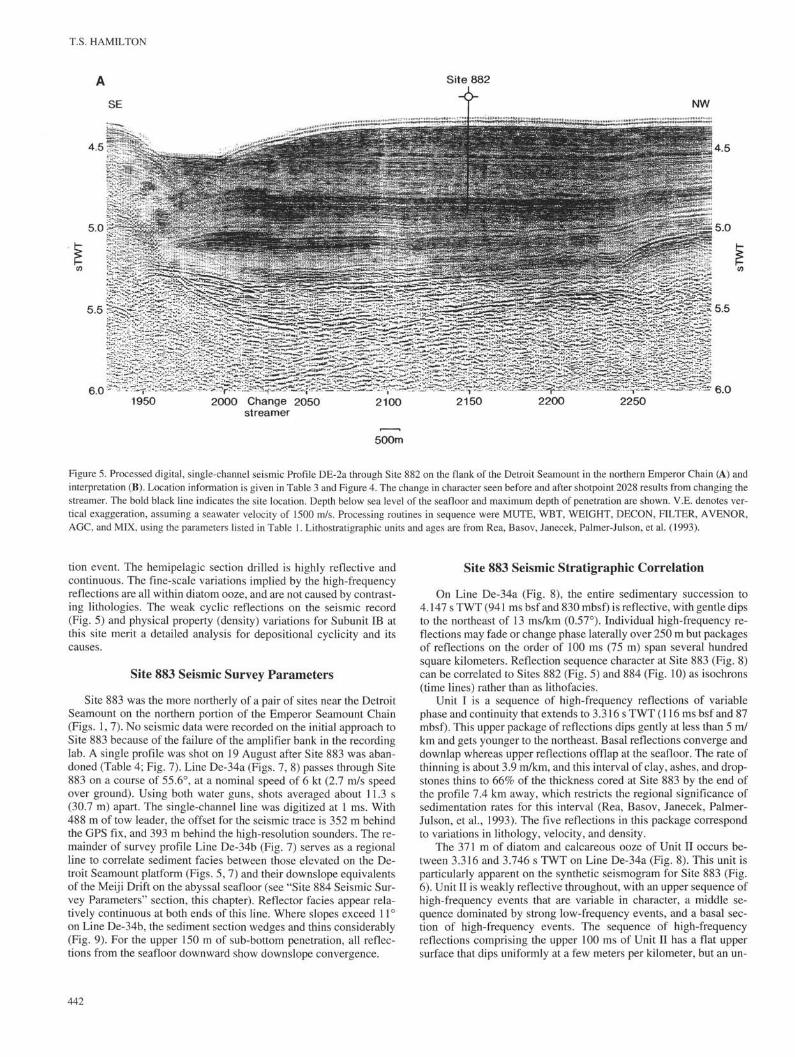
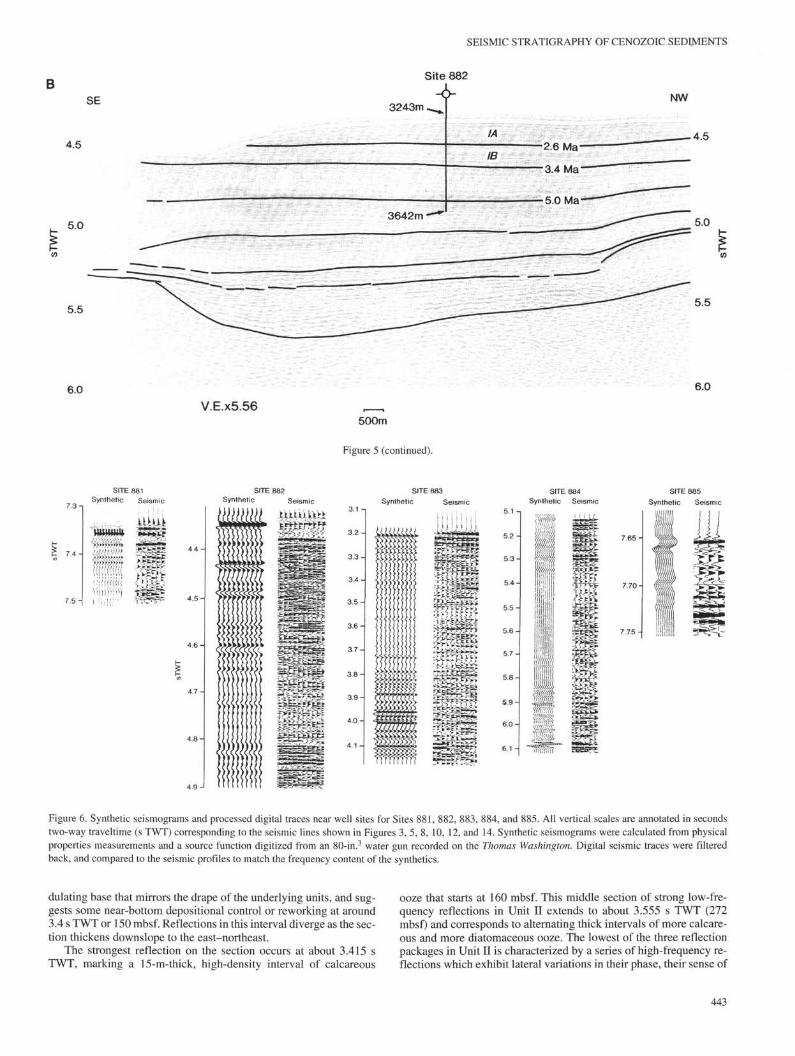
Figure 5. Processed digital, single-channel seismic Profile DE-2a through Site 882 on the flank of the Detroit Seamount in the northern Emperor Chain (A) andinterpretation (B). Location information is given in Table 3 and Figure 4. The change in character seen before and after shotpoint 2028 results from changing thestreamer. The bold black line indicates the site location. Depth below sea level of the seafloor and maximum depth of penetration are shown. V.E. denotes ver-tical exaggeration, assuming a seawater velocity of 1500 m/s. Processing routines in sequence were MUTE, WBT, WEIGHT, DECON, FILTER, AVENOR,AGC, and MIX, using the parameters listed in Table 1. Lithostratigraphic units and ages are from Rea, Basov, Janecek, Palmer-Julson, et al. (1993).
tion event. The hemipelagic section drilled is highly reflective andcontinuous. The fine-scale variations implied by the high-frequencyreflections are all within diatom ooze, and are not caused by contrast-ing lithologies. The weak cyclic reflections on the seismic record(Fig. 5) and physical property (density) variations for Subunit IB atthis site merit a detailed analysis for depositional cyclicity and itscauses.
Site 883 Seismic Survey Parameters
Site 883 was the more northerly of a pair of sites near the DetroitSeamount on the northern portion of the Emperor Seamount Chain(Figs. 1, 7). No seismic data were recorded on the initial approach toSite 883 because of the failure of the amplifier bank in the recordinglab. A single profile was shot on 19 August after Site 883 was aban-doned (Table 4; Fig. 7). Line De-34a (Figs. 7, 8) passes through Site883 on a course of 55.6°, at a nominal speed of 6 kt (2.7 m/s speedover ground). Using both water guns, shots averaged about 11.3 s(30.7 m) apart. The single-channel line was digitized at 1 ms. With488 m of tow leader, the offset for the seismic trace is 352 m behindthe GPS fix, and 393 m behind the high-resolution sounders. The re-mainder of survey profile Line De-34b (Fig. 7) serves as a regionalline to correlate sediment facies between those elevated on the De-troit Seamount platform (Figs. 5, 7) and their downslope equivalentsof the Meiji Drift on the abyssal seafloor (see "Site 884 Seismic Sur-vey Parameters" section, this chapter). Reflector facies appear rela-tively continuous at both ends of this line. Where slopes exceed 11°on Line De-34b, the sediment section wedges and thins considerably(Fig. 9). For the upper 150 m of sub-bottom penetration, all reflec-tions from the seafloor downward show downslope convergence.
Site 883 Seismic Stratigraphic Correlation
On Line De-34a (Fig. 8), the entire sedimentary succession to4.147 s TWT (941 ms bsf and 830 mbsf) is reflective, with gentle dipsto the northeast of 13 ms/km (0.57°). Individual high-frequency re-flections may fade or change phase laterally over 250 m but packagesof reflections on the order of 100 ms (75 m) span several hundredsquare kilometers. Reflection sequence character at Site 883 (Fig. 8)can be correlated to Sites 882 (Fig. 5) and 884 (Fig. 10) as isochrons(time lines) rather than as lithofacies.
Unit I is a sequence of high-frequency reflections of variablephase and continuity that extends to 3.316 s TWT (116 ms bsf and 87mbsf). This upper package of reflections dips gently at less than 5 m/km and gets younger to the northeast. Basal reflections converge anddownlap whereas upper reflections offlap at the seafloor. The rate ofthinning is about 3.9 m/km, and this interval of clay, ashes, and drop-stones thins to 66% of the thickness cored at Site 883 by the end ofthe profile 7.4 km away, which restricts the regional significance ofsedimentation rates for this interval (Rea, Basov, Janecek, Palmer-Julson, et al., 1993). The five reflections in this package correspondto variations in lithology, velocity, and density.
The 371 m of diatom and calcareous ooze of Unit II occurs be-tween 3.316 and 3.746 s TWT on Line De-34a (Fig. 8). This unit isparticularly apparent on the synthetic seismogram for Site 883 (Fig.6). Unit II is weakly reflective throughout, with an upper sequence ofhigh-frequency events that are variable in character, a middle se-quence dominated by strong low-frequency events, and a basal sec-tion of high-frequency events. The sequence of high-frequencyreflections comprising the upper 100 ms of Unit II has a flat uppersurface that dips uniformly at a few meters per kilometer, but an un-
SEISMIC STRATIGRAPHY OF CENOZOIC SEDIMENTS
BSite 882
SE
4.5
3243m ^
3642m—*"
V ; IA
IB
5.0
NW
6.0
V.E.xδ.56500m
Figure 5 (continued).
6.0
SITE 881Synthetic Seismic
uuu
SITE 882Synthetic Seismic
3.1
3.2
3.3
3.4
3.5
3.6
3.7-
3.8-
3.9-
4.0-
SITE 883
Synthetic Seismic
SITE 884
Synthetic Seismic
SITE 885
Synthetic Seismic
5.2
5.3
5.4
5.5
5.6
5.7•
5.8 •
5 . 9 -
6 . 0 -
Figure 6. Synthetic seismograms and processed digital traces near well sites for Sites 881, 882, 883, 884, and 885. All vertical scales are annotated in seconds
two-way traveltime (s TWT) corresponding to the seismic lines shown in Figures 3, 5, 8, 10, 12, and 14. Synthetic seismograms were calculated from physical
properties measurements and a source function digitized from an 80-in.3 water gun recorded on the Thomas Washington. Digital seismic traces were filtered
back, and compared to the seismic profiles to match the frequency content of the synthetics.
dulating base that mirrors the drape of the underlying units, and sug-gests some near-bottom depositional control or reworking at around3.4 s TWT or 150 mbsf. Reflections in this interval diverge as the sec-tion thickens downslope to the east-northeast.
The strongest reflection on the section occurs at about 3.415 sTWT, marking a 15-m-thick, high-density interval of calcareous
ooze that starts at 160 mbsf. This middle section of strong low-fre-quency reflections in Unit II extends to about 3.555 s TWT (272mbsf) and corresponds to alternating thick intervals of more calcare-ous and more diatomaceous ooze. The lowest of the three reflectionpackages in Unit II is characterized by a series of high-frequency re-flections which exhibit lateral variations in their phase, their sense of
T.S. HAMILTON
MEIJIDRIFT
DETROITSEAMOUNTPLATFORM
51°10'N
167'40'E 16700'E 168'20'E
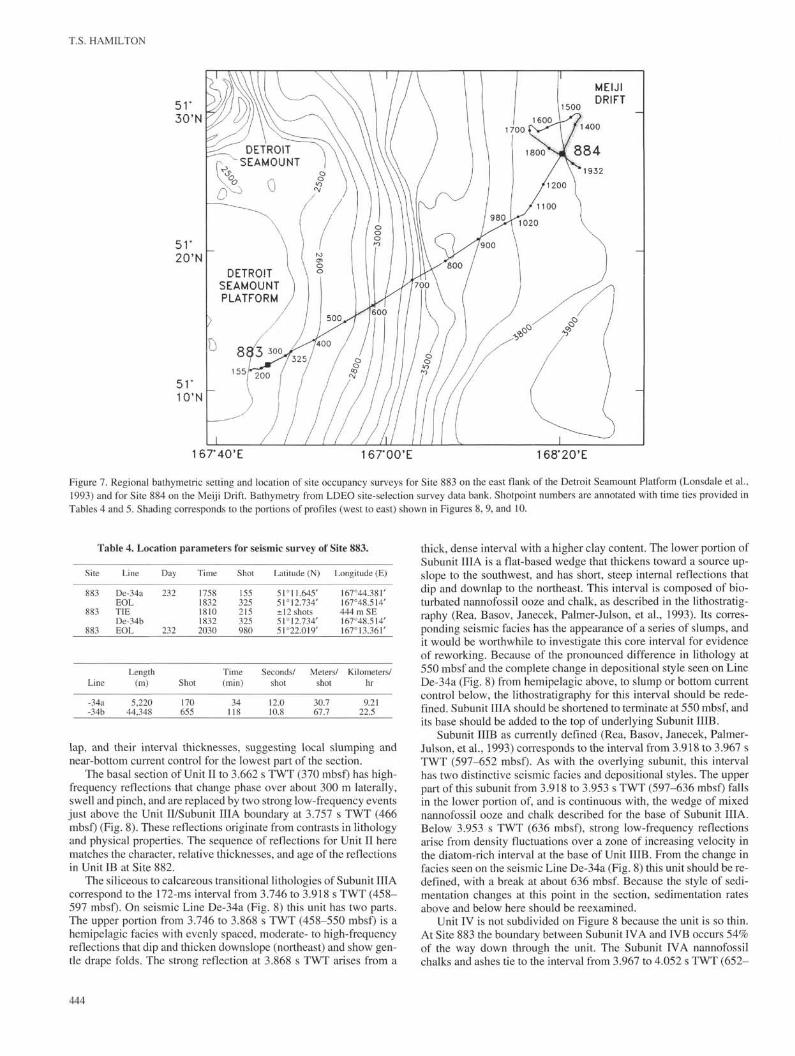
Figure 7. Regional bathymetric setting and location of site occupancy surveys for Site 883 on the east flank of the Detroit Seamount Platform (Lonsdale et al.,1993) and for Site 884 on the Meiji Drift. Bathymetry from LDEO site-selection survey data bank. Shotpoint numbers are annotated with time ties provided inTables 4 and 5. Shading corresponds to the portions of profiles (west to east) shown in Figures 8, 9, and 10.
Table 4. Location parameters for seismic survey of Site 883.
Site
883
883
883
Line
-34a-34b
Line
De-34aEOLTIEDe-34bEOL
Length(m)
5,22044,348
Day
232
232
Shot
170655
Time
17581832181018322030
Shot
155325215325980
Time(min)
34118
Latitude (N)
51°11.645'51° 12.734'±12 shots5F12.734'51°22.019'
Longitude (E)
167°44.381'167°48.514'444 m SE167°48.514'167°13.361'
Seconds/ Meters/ Kilometers/shot shot hr
12.0 30.710.8 67.7
9.2122.5
lap, and their interval thicknesses, suggesting local slumping andnear-bottom current control for the lowest part of the section.
The basal section of Unit II to 3.662 s TWT (370 mbsf) has high-frequency reflections that change phase over about 300 m laterally,swell and pinch, and are replaced by two strong low-frequency eventsjust above the Unit Il/Subunit IIIA boundary at 3.757 s TWT (466mbsf) (Fig. 8). These reflections originate from contrasts in lithologyand physical properties. The sequence of reflections for Unit II herematches the character, relative thicknesses, and age of the reflectionsin Unit IB at Site 882.
The siliceous to calcareous transitional lithologies of Subunit IIIAcorrespond to the 172-ms interval from 3.746 to 3.918 s TWT (458-597 mbsf). On seismic Line De-34a (Fig. 8) this unit has two parts.The upper portion from 3.746 to 3.868 s TWT (458-550 mbsf) is ahemipelagic facies with evenly spaced, moderate- to high-frequencyreflections that dip and thicken downslope (northeast) and show gen-tle drape folds. The strong reflection at 3.868 s TWT arises from a
thick, dense interval with a higher clay content. The lower portion ofSubunit IIIA is a flat-based wedge that thickens toward a source up-slope to the southwest, and has short, steep internal reflections thatdip and downlap to the northeast. This interval is composed of bio-turbated nannofossil ooze and chalk, as described in the lithostratig-raphy (Rea, Basov, Janecek, Palmer-Julson, et al., 1993). Its corres-ponding seismic facies has the appearance of a series of slumps, andit would be worthwhile to investigate this core interval for evidenceof reworking. Because of the pronounced difference in lithology at550 mbsf and the complete change in depositional style seen on LineDe-34a (Fig. 8) from hemipelagic above, to slump or bottom currentcontrol below, the lithostratigraphy for this interval should be rede-fined. Subunit IIIA should be shortened to terminate at 550 mbsf, andits base should be added to the top of underlying Subunit IIIB.
Subunit IIIB as currently defined (Rea, Basov, Janecek, Palmer-Julson, et al., 1993) corresponds to the interval from 3.918 to 3.967 sTWT (597-652 mbsf). As with the overlying subunit, this intervalhas two distinctive seismic facies and depositional styles. The upperpart of this subunit from 3.918 to 3.953 s TWT (597-636 mbsf) fallsin the lower portion of, and is continuous with, the wedge of mixednannofossil ooze and chalk described for the base of Subunit IIIA.Below 3.953 s TWT (636 mbsf), strong low-frequency reflectionsarise from density fluctuations over a zone of increasing velocity inthe diatom-rich interval at the base of Unit IIIB. From the change infacies seen on the seismic Line De-34a (Fig. 8) this unit should be re-defined, with a break at about 636 mbsf. Because the style of sedi-mentation changes at this point in the section, sedimentation ratesabove and below here should be reexamined.
Unit IV is not subdivided on Figure 8 because the unit is so thin.At Site 883 the boundary between Subunit IVA and IVB occurs 54%of the way down through the unit. The Subunit IVA nannofossilchalks and ashes tie to the interval from 3.967 to 4.052 s TWT (652-
444
SEISMIC STRATIGRAPHY OF CENOZOIC SEDIMENTS
ENE3.1
4.5
B3.1
200
2384m
250 300
-6-
3.5 - " —
III AIIIB
4.0
4.5
3225m—
3.1
•2.7Ma-
3.5
'7.1 M a --16 Ma —"40 Ma— 4.0
VI
4.5
V.E.X2.11500m
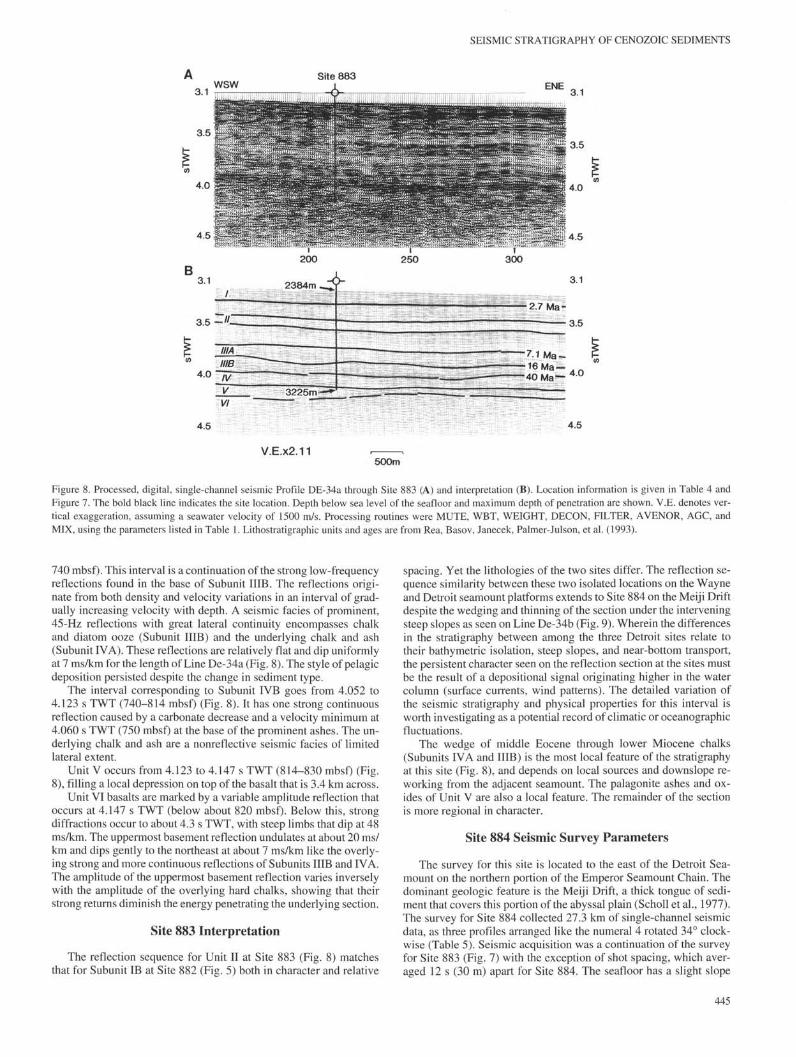
Figure 8. Processed, digital, single-channel seismic Profile DE-34a through Site 883 (A) and interpretation (B). Location information is given in Table 4 andFigure 7. The bold black line indicates the site location. Depth below sea level of the seafloor and maximum depth of penetration are shown. V.E. denotes ver-tical exaggeration, assuming a seawater velocity of 1500 m/s. Processing routines were MUTE, WBT, WEIGHT, DECON, FILTER, AVENOR, AGC, andMIX, using the parameters listed in Table 1. Lithostratigraphic units and ages are from Rea, Basov, Janecek, Palmer-Julson, et al. (1993).
740 mbsf). This interval is a continuation of the strong low-frequencyreflections found in the base of Subunit IIIB. The reflections origi-nate from both density and velocity variations in an interval of grad-ually increasing velocity with depth. A seismic facies of prominent,45-Hz reflections with great lateral continuity encompasses chalkand diatom ooze (Subunit IIIB) and the underlying chalk and ash(Subunit IVA). These reflections are relatively flat and dip uniformlyat 7 ms/km for the length of Line De-34a (Fig. 8). The style of pelagicdeposition persisted despite the change in sediment type.
The interval corresponding to Subunit IVB goes from 4.052 to4.123 s TWT (740-814 mbsf) (Fig. 8). It has one strong continuousreflection caused by a carbonate decrease and a velocity minimum at4.060 s TWT (750 mbsf) at the base of the prominent ashes. The un-derlying chalk and ash are a nonreflective seismic facies of limitedlateral extent.
Unit V occurs from 4.123 to 4.147 s TWT (814-830 mbsf) (Fig.8), filling a local depression on top of the basalt that is 3.4 km across.
Unit VI basalts are marked by a variable amplitude reflection thatoccurs at 4.147 s TWT (below about 820 mbsf). Below this, strongdiffractions occur to about 4.3 s TWT, with steep limbs that dip at 48ms/km. The uppermost basement reflection undulates at about 20 ms/km and dips gently to the northeast at about 7 ms/km like the overly-ing strong and more continuous reflections of Subunits IIIB and IVA.The amplitude of the uppermost basement reflection varies inverselywith the amplitude of the overlying hard chalks, showing that theirstrong returns diminish the energy penetrating the underlying section.
Site 883 Interpretation
The reflection sequence for Unit II at Site 883 (Fig. 8) matchesthat for Subunit IB at Site 882 (Fig. 5) both in character and relative
spacing. Yet the lithologies of the two sites differ. The reflection se-quence similarity between these two isolated locations on the Wayneand Detroit seamount platforms extends to Site 884 on the Meiji Driftdespite the wedging and thinning of the section under the interveningsteep slopes as seen on Line De-34b (Fig. 9). Wherein the differencesin the stratigraphy between among the three Detroit sites relate totheir bathymetric isolation, steep slopes, and near-bottom transport,the persistent character seen on the reflection section at the sites mustbe the result of a depositional signal originating higher in the watercolumn (surface currents, wind patterns). The detailed variation ofthe seismic stratigraphy and physical properties for this interval isworth investigating as a potential record of climatic or Oceanographicfluctuations.
The wedge of middle Eocene through lower Miocene chalks(Subunits IVA and IIIB) is the most local feature of the stratigraphyat this site (Fig. 8), and depends on local sources and downslope re-working from the adjacent seamount. The palagonite ashes and ox-ides of Unit V are also a local feature. The remainder of the sectionis more regional in character.
Site 884 Seismic Survey Parameters
The survey for this site is located to the east of the Detroit Sea-mount on the northern portion of the Emperor Seamount Chain. Thedominant geologic feature is the Meiji Drift, a thick tongue of sedi-ment that covers this portion of the abyssal plain (Scholl et al., 1977).The survey for Site 884 collected 27.3 km of single-channel seismicdata, as three profiles arranged like the numeral 4 rotated 34° clock-wise (Table 5). Seismic acquisition was a continuation of the surveyfor Site 883 (Fig. 7) with the exception of shot spacing, which aver-aged 12 s (30 m) apart for Site 884. The seafloor has a slight slope
445
T.S. HAMILTON
SW NE
I Λ Heave
-*to Site 883
DownslopeWedgeout
-3.50
-3.75
V.E.xδ.02
to Site884-^
-4.00
U 4.25
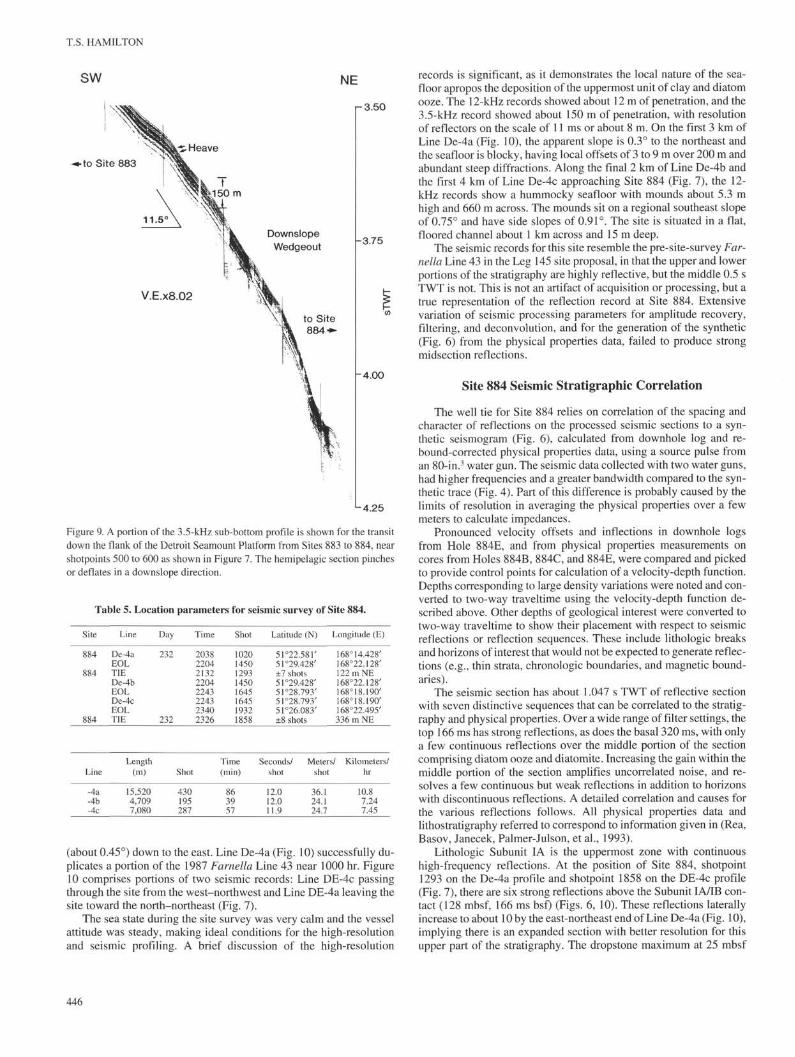
Figure 9. A portion of the 3.5-kHz sub-bottom profile is shown for the transitdown the flank of the Detroit Seamount Platform from Sites 883 to 884, nearshotpoints 500 to 600 as shown in Figure 7. The hemipelagic section pinchesor deflates in a downslope direction.
Table 5. Location parameters for seismic survey of Site 884.
Site Line Day Time Shot Latitude (N) Longitude (E)
De-4aEOLTIEDe-4bEOLDe-4cEOL
232 2038220421322204224322432340
1020145012931450164516451932
51°22.581'51°29.428'±7 shots51°29.428'51°28.793'5T28.793'51°26.083'
168°14.428'168°22.128'122 mNE168°22.128'168°18.190'168° 18.190'168°22.495'
Line
-4a-4b-4c
TIE
Length(m)
15,5204,7097,080
232 2326
Shot
430195287
1858
Time(min)
863957
±8 shots
Seconds/shot
12.012.011.9
336 m NE
Meters/shot
36.124.124.7
Kilometers/hr
10.87.247.45
(about 0.45°) down to the east. Line De-4a (Fig. 10) successfully du-plicates a portion of the 1987 Farnella Line 43 near 1000 hr. Figure10 comprises portions of two seismic records: Line DE-4c passingthrough the site from the west-northwest and Line DE-4a leaving thesite toward the north-northeast (Fig. 7).
The sea state during the site survey was very calm and the vesselattitude was steady, making ideal conditions for the high-resolutionand seismic profiling. A brief discussion of the high-resolution
records is significant, as it demonstrates the local nature of the sea-floor apropos the deposition of the uppermost unit of clay and diatomooze. The 12-kHz records showed about 12 m of penetration, and the3.5-kHz record showed about 150 m of penetration, with resolutionof reflectors on the scale of 11 ms or about 8 m. On the first 3 km ofLine De-4a (Fig. 10), the apparent slope is 0.3° to the northeast andthe seafloor is blocky, having local offsets of 3 to 9 m over 200 m andabundant steep diffractions. Along the final 2 km of Line De-4b andthe first 4 km of Line De-4c approaching Site 884 (Fig. 7), the 12-kHz records show a hummocky seafloor with mounds about 5.3 mhigh and 660 m across. The mounds sit on a regional southeast slopeof 0.75° and have side slopes of 0.91°. The site is situated in a flat,floored channel about 1 km across and 15 m deep.
The seismic records for this site resemble the pre-site-survey Far-nella Line 43 in the Leg 145 site proposal, in that the upper and lowerportions of the stratigraphy are highly reflective, but the middle 0.5 sTWT is not. This is not an artifact of acquisition or processing, but atrue representation of the reflection record at Site 884. Extensivevariation of seismic processing parameters for amplitude recovery,filtering, and deconvolution, and for the generation of the synthetic(Fig. 6) from the physical properties data, failed to produce strongmidsection reflections.
Site 884 Seismic Stratigraphic Correlation
The well tie for Site 884 relies on correlation of the spacing andcharacter of reflections on the processed seismic sections to a syn-thetic seismogram (Fig. 6), calculated from downhole log and re-bound-corrected physical properties data, using a source pulse froman 80-in.3 water gun. The seismic data collected with two water guns,had higher frequencies and a greater bandwidth compared to the syn-thetic trace (Fig. 4). Part of this difference is probably caused by thelimits of resolution in averaging the physical properties over a fewmeters to calculate impedances.
Pronounced velocity offsets and inflections in downhole logsfrom Hole 884E, and from physical properties measurements oncores from Holes 884B, 884C, and 884E, were compared and pickedto provide control points for calculation of a velocity-depth function.Depths corresponding to large density variations were noted and con-verted to two-way traveltime using the velocity-depth function de-scribed above. Other depths of geological interest were converted totwo-way traveltime to show their placement with respect to seismicreflections or reflection sequences. These include lithologic breaksand horizons of interest that would not be expected to generate reflec-tions (e.g., thin strata, chronologic boundaries, and magnetic bound-aries).
The seismic section has about 1.047 s TWT of reflective sectionwith seven distinctive sequences that can be correlated to the stratig-raphy and physical properties. Over a wide range of filter settings, thetop 166 ms has strong reflections, as does the basal 320 ms, with onlya few continuous reflections over the middle portion of the sectioncomprising diatom ooze and diatomite. Increasing the gain within themiddle portion of the section amplifies uncorrelated noise, and re-solves a few continuous but weak reflections in addition to horizonswith discontinuous reflections. A detailed correlation and causes forthe various reflections follows. All physical properties data andlithostratigraphy referred to correspond to information given in (Rea,Basov, Janecek, Palmer-Julson, et al., 1993).
Lithologic Subunit IA is the uppermost zone with continuoushigh-frequency reflections. At the position of Site 884, shotpoint1293 on the De-4a profile and shotpoint 1858 on the DE-4c profile(Fig. 7), there are six strong reflections above the Subunit IA/IB con-tact (128 mbsf, 166 ms bsf) (Figs. 6, 10). These reflections laterallyincrease to about 10 by the east-northeast end of Line De-4a (Fig. 10),implying there is an expanded section with better resolution for thisupper part of the stratigraphy. The dropstone maximum at 25 mbsf
SEISMIC STRATIGRAPHY OF CENOZOIC SEDIMENTS
LINE DE-4cWNW
Site884
Site884
ESE i SSWLINE DE-4a
ENE5.0
6.0 6.0
V.E.xi.43 500mV.E.X1.57
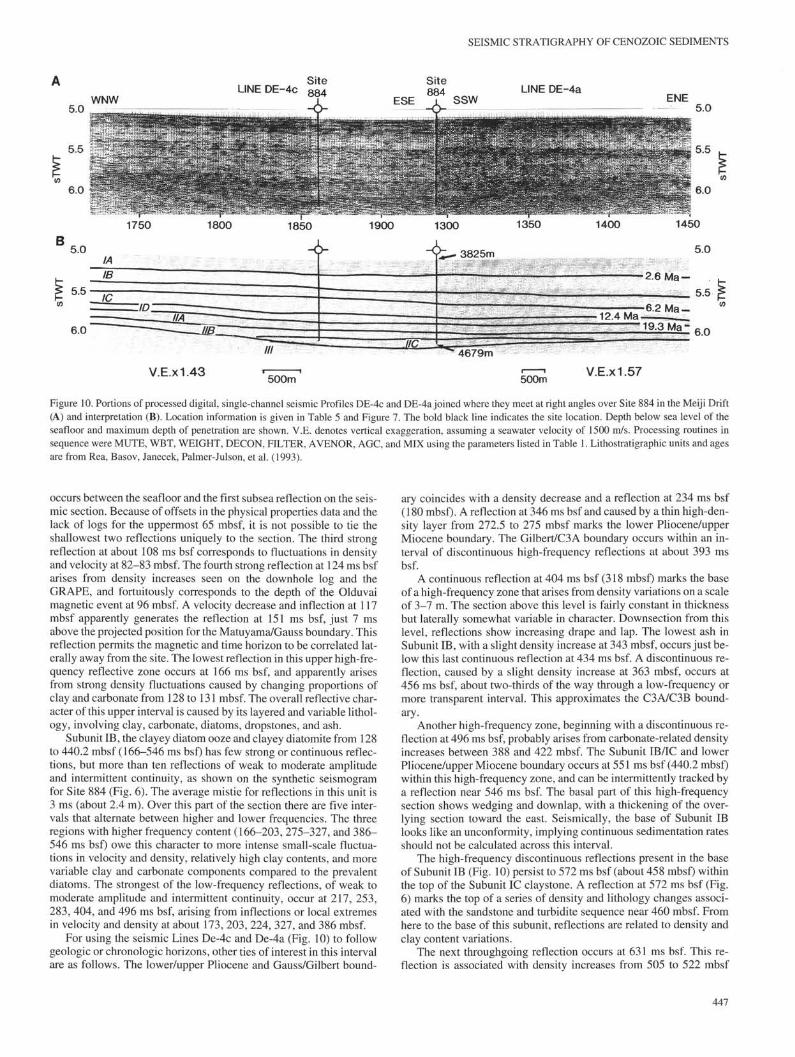
Figure 10. Portions of processed digital, single-channel seismic Profiles DE-4c and DE-4a joined where they meet at right angles over Site 884 in the Meiji Drift(A) and interpretation (B). Location information is given in Table 5 and Figure 7. The bold black line indicates the site location. Depth below sea level of theseafloor and maximum depth of penetration are shown. V.E. denotes vertical exaggeration, assuming a seawater velocity of 1500 m/s. Processing routines insequence were MUTE, WBT, WEIGHT, DECON, FILTER, AVENOR, AGC, and MIX using the parameters listed in Table 1. Lithostratigraphic units and agesare from Rea, Basov, Janecek, Palmer-Julson, et al. (1993).
occurs between the seafloor and the first subsea reflection on the seis-mic section. Because of offsets in the physical properties data and thelack of logs for the uppermost 65 mbsf, it is not possible to tie theshallowest two reflections uniquely to the section. The third strongreflection at about 108 ms bsf corresponds to fluctuations in densityand velocity at 82-83 mbsf. The fourth strong reflection at 124 ms bsfarises from density increases seen on the downhole log and theGRAPE, and fortuitously corresponds to the depth of the Olduvaimagnetic event at 96 mbsf. A velocity decrease and inflection at 117mbsf apparently generates the reflection at 151 ms bsf, just 7 msabove the projected position for the Matuyama/Gauss boundary. Thisreflection permits the magnetic and time horizon to be correlated lat-erally away from the site. The lowest reflection in this upper high-fre-quency reflective zone occurs at 166 ms bsf, and apparently arisesfrom strong density fluctuations caused by changing proportions ofclay and carbonate from 128 to 131 mbsf. The overall reflective char-acter of this upper interval is caused by its layered and variable lithol-ogy, involving clay, carbonate, diatoms, dropstones, and ash.
Subunit IB, the clayey diatom ooze and clayey diatomite from 128to 440.2 mbsf (166-546 ms bsf) has few strong or continuous reflec-tions, but more than ten reflections of weak to moderate amplitudeand intermittent continuity, as shown on the synthetic seismogramfor Site 884 (Fig. 6). The average mistie for reflections in this unit is3 ms (about 2.4 m). Over this part of the section there are five inter-vals that alternate between higher and lower frequencies. The threeregions with higher frequency content (166-203, 275-327, and 386-546 ms bsf) owe this character to more intense small-scale fluctua-tions in velocity and density, relatively high clay contents, and morevariable clay and carbonate components compared to the prevalentdiatoms. The strongest of the low-frequency reflections, of weak tomoderate amplitude and intermittent continuity, occur at 217, 253,283, 404, and 496 ms bsf, arising from inflections or local extremesin velocity and density at about 173, 203, 224, 327, and 386 mbsf.
For using the seismic Lines De-4c and De-4a (Fig. 10) to followgeologic or chronologic horizons, other ties of interest in this intervalare as follows. The lower/upper Pliocene and Gauss/Gilbert bound-
ary coincides with a density decrease and a reflection at 234 ms bsf(180 mbsf). A reflection at 346 ms bsf and caused by a thin high-den-sity layer from 272.5 to 275 mbsf marks the lower Pliocene/upperMiocene boundary. The Gilbert/C3A boundary occurs within an in-terval of discontinuous high-frequency reflections at about 393 msbsf.
A continuous reflection at 404 ms bsf (318 mbsf) marks the baseof a high-frequency zone that arises from density variations on a scaleof 3-7 m. The section above this level is fairly constant in thicknessbut laterally somewhat variable in character. Downsection from thislevel, reflections show increasing drape and lap. The lowest ash inSubunit IB, with a slight density increase at 343 mbsf, occurs just be-low this last continuous reflection at 434 ms bsf. A discontinuous re-flection, caused by a slight density increase at 363 mbsf, occurs at456 ms bsf, about two-thirds of the way through a low-frequency ormore transparent interval. This approximates the C3A/C3B bound-ary.
Another high-frequency zone, beginning with a discontinuous re-flection at 496 ms bsf, probably arises from carbonate-related densityincreases between 388 and 422 mbsf. The Subunit IB/IC and lowerPliocene/upper Miocene boundary occurs at 551 ms bsf (440.2 mbsf)within this high-frequency zone, and can be intermittently tracked bya reflection near 546 ms bsf. The basal part of this high-frequencysection shows wedging and downlap, with a thickening of the over-lying section toward the east. Seismically, the base of Subunit IBlooks like an unconformity, implying continuous sedimentation ratesshould not be calculated across this interval.
The high-frequency discontinuous reflections present in the baseof Subunit IB (Fig. 10) persist to 572 ms bsf (about 458 mbsf) withinthe top of the Subunit IC claystone. A reflection at 572 ms bsf (Fig.6) marks the top of a series of density and lithology changes associ-ated with the sandstone and turbidite sequence near 460 mbsf. Fromhere to the base of this subunit, reflections are related to density andclay content variations.
The next throughgoing reflection occurs at 631 ms bsf. This re-flection is associated with density increases from 505 to 522 mbsf
447
T.S. HAMILTON
and coincidentally marks the upper/middle Miocene boundary andthe shallowest occurrence of metallic copper in Hole 884B. Immedi-ately below this, a somewhat stronger and more coherent reflectionoccurs at 656 ms bsf, fortuitously marking the base of the zone withmetallic copper occurrences at 526.7 mbsf. A weak reflection at 678ms bsf marks the base of Subunit IC at 546.1 mbsf and the base ofanother zone of discontinuous high-frequency reflections.
Subunit ID diatomite (546.1-604.8 mbsf) occurs from 678 to 747ms bsf on the seismic section (Fig. 10). The reflections in this rela-tively transparent zone have low amplitudes and poor continuity. Thereflection at 711 ms bsf is related to a density increase at 576 mbsf.
The section for all of Unit II claystone has dipping, upward-curv-ing convex reflections of moderate to strong amplitude with lateralcontinuity less than 20-30 shots (roughly 600-900 m). This providesa measure of how far the facies and physical properties measured forthis unit in the drill hole apply. The basal part of the sedimentary suc-cession thickens and dips downslope to the southeast on Line De-4cand is thickest in the vicinity of the site on Line De-4a (Fig. 10). Thisseismic facies is local to Site 884 and has the appearance of slumps.The reflection at 747 ms bsf marks the Subunit ID/IIA transition fromdiatomite back into claystone, although the cause of this reflection isprobably a high-density bed at 605.5-607 mbsf, rather than thelithostratigraphic boundary described (Rea, Basov, Janecek, Palmer-Julson, et al., 1993). A strong continuous reflection at 755 ms bsf cor-relates to the turbidite at 608.6 mbsf and to density variations fromhere to 617 mbsf. A more continuous but slightly weaker reflectionat 772 mbsf ties to the large decrease in density downsection associ-ated with the transition from clay to carbonate. The reflection of mod-erate amplitude and continuity at 816 ms bsf originates from theclaystone/chalk boundary at 662 mbsf within the Oligocene portionof Subunit IIA. A reflection at 832 ms bsf originates from intensedensity fluctuations near 673 and 678 mbsf.
The reflection at 850 ms bsf ties to the Subunit IIA/IIB boundarybetween early Miocene claystone and late Eocene chalk. Velocityabruptly increases downsection here, and the GRAPE density showsintense variations throughout this interval. Subunit HB is character-ized by a few low-frequency reflections, with one at 911 ms bsf cor-relating to a diamictic conglomerate at 750 mbsf.
A reflection at 939 ms bsf (771 mbsf) (Figs. 6, 10) marks the Sub-unit IIB/IIC boundary to the underlying early-middle Eocene andolder claystone and altered ash. The lack of downhole logs make as-signment of specific causes in density or velocity uncertain from hereto basement. The basal sedimentary reflections are flat-lying, withmoderate amplitudes and periods of 15-20 ms. This basal section on-laps basement and the section thickens, picking up progressively old-er strata away from the drill site toward the southeast. A reflection<200 m across at 962 ms bsf marks the depth of the conglomeratenoted at 796.4 mbsf. A reflection at 972 ms bsf ties to the base of theturbidites at 799.2 mbsf. The copper noted at 806.1 mbsf projects to978 ms bsf.
The tie to basement is uncertain to within ±75 ms (±260 m). Thelack of downhole logs, the scatter in velocities from core specimens,the offset of the site from the seismic lines, and the complex reflec-tions in this region are all confounding factors. There is a strong re-flection at 995 ms bsf that is overlain by onlapping reflectionsassigned to the turbidites and reworked facies higher upsection. Thislooks like the sediment/basement unconformity on seismic Lines De-4a and De-4c (Fig. 10). Strong intermittent reflections with about a25-ms period persist from here to about 1063 ms bsf.
The seismic character of the lowest part of the sedimentary suc-cession resembles near-basement volcano-sedimentary packages likethose drilled and extensively modelled at Middle Valley on the Juande Fuca Ridge (Rohr and Schmidt, 1994). The reflection at 1019 msbsf can be converted to an equivalent depth of 848.2 mbsf, at whichdepth basalt was found in Holes 884B and 884E. The problem is thatthis reflection is not particularly strong or continuous with respect toneighboring ones and there are reflections as much as 200 ms (600
m?) deeper. The Subunit HC/Unit III boundary, between reworkedclaystone-ash-chalk and basalt, could occur at 995, 1019, 1047, or1063 ms bsf. The favored interpretation from the seismic record isthat the base of this site penetrated a basalt sill or flow in a near-base-ment, interbedded, basalt-sediment facies but did not quite penetratethe Cretaceous ocean crust.
Site 884 Interpretation
The most significant finding for this site is that small-scale varia-tions of reflection character (Fig. 10) and physical properties withinthe clayey diatom ooze of Subunit IB suggest five distinctive cyclesof deposition. This cyclicity manifests itself in the alternating finerand coarser reflections and in corresponding fine to coarse fluctua-tions in density. This cyclic variation is analogous to, but less intensethan that documented for the acoustic stratigraphy of deep-sea car-bonate (Mayer, 1991; Mosher et al, 1993; Bloomer et al., 1995) andmixed carbonate-siliciclastic ooze records (Mayer et al., 1985) fromelsewhere in the Pacific.
The discontinuous high-frequency reflection stripes within theportion of the seismic record attributed to the diatom ooze are a re-gional feature for all three of the seamount and abyssal seafloor sitesat Wayne, Detroit, and Meiji, irrespective of lithologic contrasts be-tween Subunit IB at Site 882 (Fig. 5) and Site 884 (Fig. 10), and UnitII at Site 883 (Fig. 8). This interval holds promise for investigationsof cyclicity in the seismic stratigraphy, downhole logs, and physicalproperties data relating to the Oceanographic, tectonic, and climaticcontrols seen at such sites as Site 574 (Mayer et al., 1985). It also jus-tifies the acquisition of high-resolution digital seismic records inabyssal hemipelagic settings.
Sites 885 and 886 Seismic Survey Parameters
The survey for Sites 885 and 886 is located in the middle of thenorthern Pacific, just to the south of the Chinook Trough and south-west of the Zodiac Fan (Fig. 11). The site was chosen on the basis ofregional information and this survey. There were no site selectionsurvey data for the comparison of records. The survey for Sites 885and 886 collected 45.9 km of single-channel seismic data, as threeprofiles arranged like a backward numeral 4 rotated on its side, withLine AP-5c oriented nearly east-west (Table 6; Fig. 11). The seismicsource consisted of a single 80-in.3 water gun. The shot spacingranged from 24 to 28 m. The single-channel lines were digitized at 1ms and processed as described in Table 1. With 392 m of tow leader,the offset for the seismic trace is 304 m behind the GPS fix, and 325m behind the high-resolution profiles. The time switch for simulatingthe blast phone was inadvertently left on through most of Line AP-5a(Fig. 12). This introduced a static delay of 90 ms, which was dealtwith surgically as a time shift using the routine water bottom time(WBT). As a consequence the two-way traveltimes on the processedversion of Line AP-5a do not coincide with the appropriate waterdepth nor with the remainder of the survey for this site. Compared tothe mud line, Line AP-5a (Fig. 12) comes in 21 ms slow (16 m toodeep).
Because of the thin sedimentary section at this abyssal plain site,the seismic record length was 2 s of which only 0.6 s TWT was pro-cessed. Site 885, in a local lens of sediment, has a good tie, being lo-cated only 63 m off Line AP-5a (Fig. 11). Coring problems causedthe position of the subsequent hole (Site 886) to be shifted 5.4 kmaway, following the seafloor character on a 3.5-kHz sounding profile.The tie for Site 886 relies on correlations between the two holes, rath-er than on a tie to the seismic data. There is about a 6.2 m vertical off-set between the two holes in the physical properties data, with Site886 having that much more young strata on top. The sections havegood resolution, despite the problems in processing such shortrecords with the SIOSEIS system. The biggest limitation in process-ing these sections is that the sediment section is thin compared to the
SEISMIC STRATIGRAPHY OF CENOZOIC SEDIMENTS
B
46'N
44* N
42* N
i l l 1 l\
ZODIAC \
- ° FAN ]
STUDYAREA
I I I I I
\ \l
y -
\̂
1
44*50'N
44*40'N
44*
1
5621 <
57Oθ\
\
58C6960
\ 8 8 5
5900 \
6OOθ\
6100^
I
j 886
6145
I
-
6535*? 6500
^6400300
170'W 168*W 166*W 3 O ' N 168*20'W 168*00'W
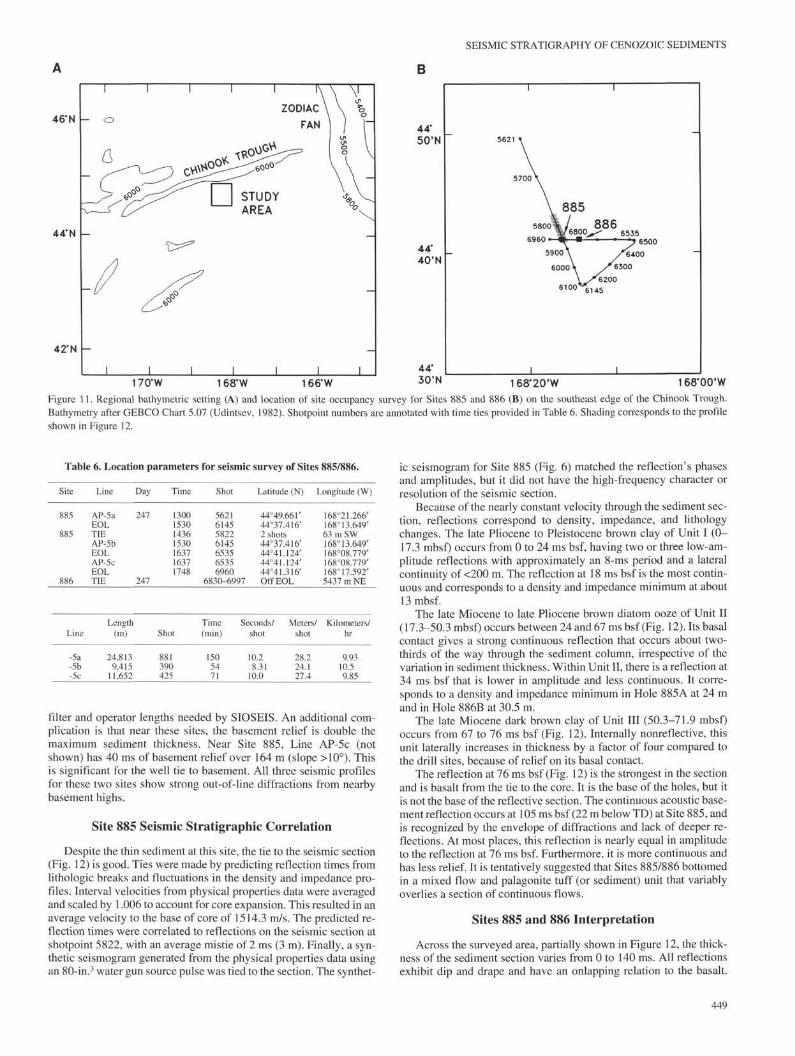
Figure 11. Regional bathymetric setting (A) and location of site occupancy survey for Sites 885 and 886 (B) on the southeast edge of the Chinook Trough.Bathymetry after GEBCO Chart 5.07 (Udintsev, 1982). Shotpoint numbers are annotated with time ties provided in Table 6. Shading corresponds to the profileshown in Figure 12.
Table 6. Location parameters for seismic survey of Sites 885/886.
Site Line Day Time Shot Latitude (N) Longitude (W)
AP-5aEOLTIEAP-5bEOLAP-5cEOL
247 1300153014361530163716371748
5621614558226145653565356960
44°49.66r44°37.416'2 shots44°37.416'44°41.124'44°41.124'44°41.316'
168°21.266'168°13.649'63 m SW168°13.649'168°08.779'168°08.779'168°17.592'
886
Line
-5a-5b-5c
TIE 247
Length(m)
24,8139,415
11,652
Shot
881390425
6830-6997 Off EOL
Time(min)
1505471
Seconds/shot
10.28.31
10.0
Meters/shot
28.224.127.4
5437 m NE
Kilometers/hr
9.9310.59.85
filter and operator lengths needed by SIOSEIS. An additional com-plication is that near these sites, the basement relief is double themaximum sediment thickness. Near Site 885, Line AP-5c (notshown) has 40 ms of basement relief over 164 m (slope >10°). Thisis significant for the well tie to basement. All three seismic profilesfor these two sites show strong out-of-line diffractions from nearbybasement highs.
Site 885 Seismic Stratigraphic Correlation
Despite the thin sediment at this site, the tie to the seismic section(Fig. 12) is good. Ties were made by predicting reflection times fromlithologic breaks and fluctuations in the density and impedance pro-files. Interval velocities from physical properties data were averagedand scaled by 1.006 to account for core expansion. This resulted in anaverage velocity to the base of core of 1514.3 m/s. The predicted re-flection times were correlated to reflections on the seismic section atshotpoint 5822, with an average mistie of 2 ms (3 m). Finally, a syn-thetic seismogram generated from the physical properties data usingan 80-in.3 water gun source pulse was tied to the section. The synthet-
ic seismogram for Site 885 (Fig. 6) matched the reflection^ phasesand amplitudes, but it did not have the high-frequency character orresolution of the seismic section.
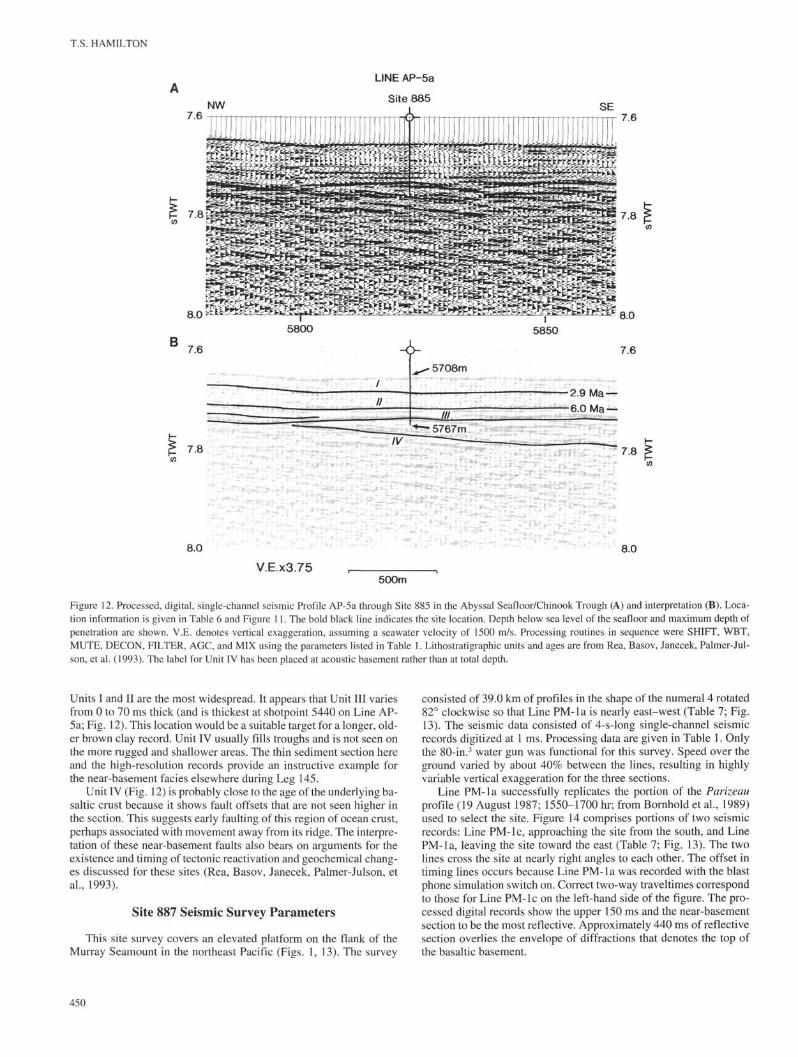
Because of the nearly constant velocity through the sediment sec-tion, reflections correspond to density, impedance, and lithologychanges. The late Pliocene to Pleistocene brown clay of Unit I (0-17.3 mbsf) occurs from 0 to 24 ms bsf, having two or three low-am-plitude reflections with approximately an 8-ms period and a lateralcontinuity of <200 m. The reflection at 18 ms bsf is the most contin-uous and corresponds to a density and impedance minimum at about13 mbsf.
The late Miocene to late Pliocene brown diatom ooze of Unit II(17.3-50.3 mbsf) occurs between 24 and 67 ms bsf (Fig. 12). Its basalcontact gives a strong continuous reflection that occurs about two-thirds of the way through the sediment column, irrespective of thevariation in sediment thickness. Within Unit II, there is a reflection at34 ms bsf that is lower in amplitude and less continuous. It corre-sponds to a density and impedance minimum in Hole 885A at 24 mand in Hole 886B at 30.5 m.
The late Miocene dark brown clay of Unit III (50.3-71.9 mbsf)occurs from 67 to 76 ms bsf (Fig. 12). Internally nonreflective, thisunit laterally increases in thickness by a factor of four compared tothe drill sites, because of relief on its basal contact.
The reflection at 76 ms bsf (Fig. 12) is the strongest in the sectionand is basalt from the tie to the core. It is the base of the holes, but itis not the base of the reflective section. The continuous acoustic base-ment reflection occurs at 105 ms bsf (22 m below TD) at Site 885, andis recognized by the envelope of diffractions and lack of deeper re-flections. At most places, this reflection is nearly equal in amplitudeto the reflection at 76 ms bsf. Furthermore, it is more continuous andhas less relief. It is tentatively suggested that Sites 885/886 bottomedin a mixed flow and palagonite tuff (or sediment) unit that variablyoverlies a section of continuous flows.
Sites 885 and 886 Interpretation
Across the surveyed area, partially shown in Figure 12, the thick-ness of the sediment section varies from 0 to 140 ms. All reflectionsexhibit dip and drape and have an onlapping relation to the basalt.
T.S. HAMILTON
NW
LINE AP-5a
Site 885
7.6
7.8
5800B
5850
7.6 •ò- 7.6
5708m
•2.9 Ma —-6.0 Ma —
7.8
8.0
V.E.X3.75
8.0
500m
Figure 12. Processed, digital, single-channel seismic Profile AP-5a through Site 885 in the Abyssal Seafloor/Chinook Trough (A) and interpretation (B). Loca-tion information is given in Table 6 and Figure 11. The bold black line indicates the site location. Depth below sea level of the seafloor and maximum depth ofpenetration are shown. V.E. denotes vertical exaggeration, assuming a seawater velocity of 1500 m/s. Processing routines in sequence were SHIFT, WBT,MUTE, DECON, FILTER, AGC, and MIX using the parameters listed in Table 1. Lithostratigraphic units and ages are from Rea, Basov, Janecek, Palmer-Jul-son, et al. (1993). The label for Unit IV has been placed at acoustic basement rather than at total depth.
Units I and II are the most widespread. It appears that Unit III variesfrom 0 to 70 ms thick (and is thickest at shotpoint 5440 on Line AP-5a; Fig. 12). This location would be a suitable target for a longer, old-er brown clay record. Unit IV usually fills troughs and is not seen onthe more rugged and shallower areas. The thin sediment section hereand the high-resolution records provide an instructive example forthe near-basement facies elsewhere during Leg 145.
Unit IV (Fig. 12) is probably close to the age of the underlying ba-saltic crust because it shows fault offsets that are not seen higher inthe section. This suggests early faulting of this region of ocean crust,perhaps associated with movement away from its ridge. The interpre-tation of these near-basement faults also bears on arguments for theexistence and timing of tectonic reactivation and geochemical chang-es discussed for these sites (Rea, Basov, Janecek, Palmer-Julson, etal., 1993).
Site 887 Seismic Survey Parameters
This site survey covers an elevated platform on the flank of theMurray Seamount in the northeast Pacific (Figs. 1, 13). The survey
consisted of 39.0 km of profiles in the shape of the numeral 4 rotated82° clockwise so that Line PM-la is nearly east-west (Table 7; Fig.13). The seismic data consisted of 4-s-long single-channel seismicrecords digitized at 1 ms. Processing data are given in Table 1. Onlythe 80-in.3 water gun was functional for this survey. Speed over theground varied by about 40% between the lines, resulting in highlyvariable vertical exaggeration for the three sections.
Line PM-la successfully replicates the portion of the Parizeauprofile (19 August 1987; 1550-1700 hr; from Bornhold et al., 1989)used to select the site. Figure 14 comprises portions of two seismicrecords: Line PM-lc, approaching the site from the south, and LinePM-la, leaving the site toward the east (Table 7; Fig. 13). The twolines cross the site at nearly right angles to each other. The offset intiming lines occurs because Line PM-la was recorded with the blastphone simulation switch on. Correct two-way traveltimes correspondto those for Line PM-lc on the left-hand side of the figure. The pro-cessed digital records show the upper 150 ms and the near-basementsection to be the most reflective. Approximately 440 ms of reflectivesection overlies the envelope of diffractions that denotes the top ofthe basaltic basement.
450

SEISMIC STRATIGRAPHY OF CENOZOIC SEDIMENTS
54"10'N
Table 7. Location parameters for seismic survey of Site 887.
148'40'W 148 20'W
Figure 13. Regional bathymetric setting and location of site occupancy sur-vey for Site 887 on the north flank of Murray Seamount. Bathymetry fromBornhold et al. (1989). Shotpoint numbers are annotated with time ties pro-vided in Table 7. Shading corresponds to the portions of seismic profilesshown in Figure 14.
Site 887 Seismic Stratigraphic Correlation
The well tie for Site 887 has the correct seafloor arrival time towithin 1 ms. This and the successful reflection assignments confirmthat the site is correctly located with respect to the seismic lines. Thewell tie depends on a velocity function derived from the shipboardphysical properties data. Inflections in the trends of the density andvelocity profiles vs. depth, and values showing the largest offsets,were selected as possible reflections. Because of the small number ofvelocity measurements, median velocities for those depth intervalswere used to calculate two-way traveltimes for a list of hypotheticalreflections. This list was compared to the most prominent and contin-uous reflections on the seismic section to provide the following cor-relation.
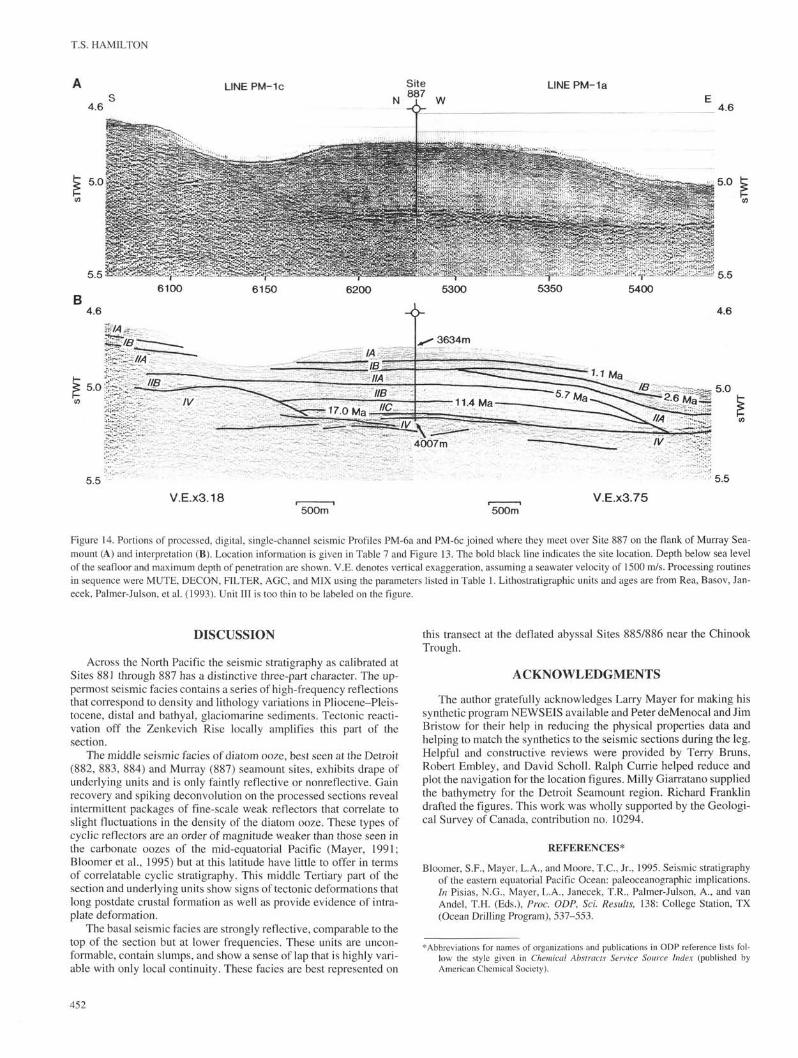
The seafloor and top of the Pleistocene gray clay of Subunit IA(Fig. 14) occurs at 4.861 s TWT. Unit I has 11 or more high-frequen-cy reflections, with the strongest occurring at 4.880 s TWT abouthalfway through the unit. The reflections in the basal half of this unitare more continuous than those in its upper part, implying the upper-most section of Unit I to be laterally variable. The basal reflection inthis uppermost high-frequency zone occurs at 4.916 s TWT, which isonly 3 ms shallower than the predicted contact between Subunits IAand IB, and coincidentally, the Brunhes/Matuyama boundary.
The contact between Subunits IB and IIA (90 mbsf) is a weak re-flection occurring at 4.978 s TWT (Fig. 14). Two stronger and morecontinuous reflections at 4.945 and 4.963 s TWT make distinctivemarkers within the clay-diatom ooze of Subunit IB, approximatingthe base of the Pleistocene and the Matuyama/Gauss boundary, re-spectively, allowing them to be mapped seismically.
The relatively nonreflective middle portion of the seismic sec-tions is the Unit II diatom ooze (90-270 mbsf, 4.978-5.215 s TWT).Subunit IIA (90-174 mbsf, 4.978-5.086 s TWT) is slightly reflectivein its upper 30% but the reflection continuity does not exceed 200 mlaterally. The lower 70% of this interval, below 5.010 s TWT, istransparent.
The time ties for the Gauss/Gilbert and upper/lower Plioceneboundary (5.003 s TWT), the deep 4.6-Ma dropstones (5.029 s
Site
887
887
887
Line
-la-lb-lc
Line
PM-laEOLTIEPM-lbEOLPM-lcEOLTIE
Length(m)
21,2497,434
10,305
Day
253
Shot
761381436
Time
18502110203421102220222023402325
Shot
47345495527854955876587663126231
Time(min)
1407080
Latitude (N)
54°20.967'54°21.820'±29 shots54°21.820'54°17.966'54° 17.966'54°22.941'±8 shots
Longitude (W)
148°41.149'148°21.588'449 m NW148°21.588'148°23.473'148°23.473'148°27.708'230 m NW
Seconds/ Meters/ Kilometers/shot shot hr
11.0 27.911.0 19.511.0 23.6
9.116.377.73
in this nonreflective interval. The calcareous diatom ooze of SubunitHB (174-235 mbsf, 5.086-5.165 s TWT) has one continuous reflec-tion at 5.148 s TWT, which, although a little shallow, is the sole op-portunity the seismic section affords to track the base or toapproximate the thickness of this subunit. The top of the lower ashsuccession, the base of the N. kamtschatica zone, and the C3B/C4magnetostratigraphic boundary occur midway through this unit at5.119 s TWT, just above the solitary 5.148 s TWT reflection notedabove. The clayey siliceous ooze of Subunit HC (235-273.8 mbsf,5.165-5.215 s TWT) has a weak reflection at its top and two slightlystronger reflections at 5.180 and 5.200 s TWT, corresponding to adensity and velocity decrease at about 250 mbsf. These reflectionsare of limited use for correlation in that they extend only about 500m to either side of the site.
The thin, near-basement, brown clay and oxide Unit III (270-289mbsf) is only 6 ms thick on the seismic section. Its predicted base at5.221 s TWT is 3 ms above a prominent, continuous, 100-Hz reflec-tion (Fig. 14). From the lateral relief on this prominent reflection, itis likely that the brown clay varies from 0 to 15 ms (0-32 m) thick.
The base of Unit IV as drilled (373 mbsf) is predicted to be at5.259 s TWT, or about 5 ms too deep for the base of the first strong,near-basement reflection. This is acceptable, considering the varia-tion in velocity measurements from this part of the section. The seis-mic section (Fig. 14) shows deeper reflections at 5.270 and 5.300 sTWT. It is likely, given the lateral character changes in this lower,strong-reflector facies, and given the measured velocities, that thispart of the section is a near-basement sediment/sill complex about175 m thick.
Site 887 Interpretation
The Unit I clays are the most consistent and widespread stratum.They are regional, and they drape relief on underlying units (Fig. 14).Seismically, this Pleistocene gray clay facies is distinctive and repre-sents a different style of sedimentation (e.g., in terms of rates, densi-ty, and lateral heterogeneity) from the underlying Tertiary biogenicooze. The sedimentary section thickens in the vicinity of Site 887, asshown by the isopach map of Bornhold et al. (1989), and thins fartherdown the seamount flanks. This thickness variation depends almostentirely on the midsection diatom oozes. Downslope thinning is apersistent feature of these oozes, and many pairs of reflections can beseen to thin out in a downslope direction. The bounding reflections ofthe Unit II diatom ooze downlap to their basal contact off the sides ofthe platform. The seismic form of these ooze facies suggest that, fromthe middle Miocene to the upper Pliocene over Murray Seamount,there was a higher rate of biogenic sedimentation on top of the sea-mount compared to its flanks and adjacent deeps. This unusual seis-mic facies could be evidence for local upwelling and enhancedproductivity over this and similar high-latitude seamount platforms.
451
T.S. HAMILTON
LINEPM-1a
4.6
5.0
:
5.5
6100 6150 6200 5300 5350 5400
4.6
V.E.X3.18 VE.x3.75500m 500m
Figure 14. Portions of processed, digital, single-channel seismic Profiles PM-6a and PM-6c joined where they meet over Site 887 on the flank of Murray Sea-mount (A) and interpretation (B). Location information is given in Table 7 and Figure 13. The bold black line indicates the site location. Depth below sea levelof the seafloor and maximum depth of penetration are shown. V.E. denotes vertical exaggeration, assuming a seawater velocity of 1500 m/s. Processing routinesin sequence were MUTE, DECON, FILTER, AGC, and MIX using the parameters listed in Table 1. Lithostratigraphic units and ages are from Rea, Basov, Jan-ecek, Palmer-Julson, et al. (1993). Unit III is too thin to be labeled on the figure.
DISCUSSION
Across the North Pacific the seismic stratigraphy as calibrated atSites 881 through 887 has a distinctive three-part character. The up-permost seismic facies contains a series of high-frequency reflectionsthat correspond to density and lithology variations in Pliocene-Pleis-tocene, distal and bathyal, glaciomarine sediments. Tectonic reacti-vation off the Zenkevich Rise locally amplifies this part of thesection.
The middle seismic facies of diatom ooze, best seen at the Detroit(882, 883, 884) and Murray (887) seamount sites, exhibits drape ofunderlying units and is only faintly reflective or nonreflective. Gainrecovery and spiking deconvolution on the processed sections revealintermittent packages of fine-scale weak reflectors that correlate toslight fluctuations in the density of the diatom ooze. These types ofcyclic reflectors are an order of magnitude weaker than those seen inthe carbonate oozes of the mid-equatorial Pacific (Mayer, 1991;Bloomer et al., 1995) but at this latitude have little to offer in termsof correlatable cyclic stratigraphy. This middle Tertiary part of thesection and underlying units show signs of tectonic deformations thatlong postdate crustal formation as well as provide evidence of intra-plate deformation.
The basal seismic facies are strongly reflective, comparable to thetop of the section but at lower frequencies. These units are uncon-formable, contain slumps, and show a sense of lap that is highly vari-able with only local continuity. These facies are best represented on
this transect at the deflated abyssal Sites 885/886 near the ChinookTrough.
ACKNOWLEDGMENTS
The author gratefully acknowledges Larry Mayer for making hissynthetic program NEWSEIS available and Peter deMenocal and JimBristow for their help in reducing the physical properties data andhelping to match the synthetics to the seismic sections during the leg.Helpful and constructive reviews were provided by Terry Bruns,Robert Embley, and David Scholl. Ralph Currie helped reduce andplot the navigation for the location figures. Milly Giarratano suppliedthe bathymetry for the Detroit Seamount region. Richard Franklindrafted the figures. This work was wholly supported by the Geologi-cal Survey of Canada, contribution no. 10294.
REFERENCES*
Bloomer, S.F., Mayer, L.A., and Moore, T.C., Jr., 1995. Seismic stratigraphyof the eastern equatorial Pacific Ocean: paleoceanographic implications.In Pisias, N.G., Mayer, L.A., Janecek, T.R., Palmer-Julson, A., and vanAndel, T.H. (Eds.), Proc. ODP, Sci. Results, 138: College Station, TX(Ocean Drilling Program), 537-553.
* Abbreviations for names of organizations and publications in ODP reference lists fol-low the style given in Chemical Abstracts Service Source Index (published byAmerican Chemical Society).
452
SEISMIC STRATIGRAPHY OF CENOZOIC SEDIMENTS
Bornhold, B.D., Currie, R.G., and Sawyer, B., 1989. Patton-Murray Sea-mount Group: 3 maps: bathymetry, magnetic anomaly, sediment thick-ness, 1:250,000. Geol. Surv. Can. Open File, 2075.
Jacobi, R.D., and Hayes, D.E., 1989. Sedimentary effects of interplaybetween the Kuroshio extension and Pacific Plate motions. Geol. Soc.Am. Bull., 101:549-560.
Lonsdale, P., Dieu, J., and Natland, J., 1993. Posterosional volcanism in theCretaceous part of the Hawaiian hotspot trail. /. Geophys. Res., 98:4081-
Ludwig, W.J., and Houtz, R.E., 1979. Isopach map of sediments in thePacific Ocean Basin and marginal sea basins. AAPG Map Ser., 647.
Mayer, L.A., 1991. Extraction of high-resolution carbonate data for paleocli-mate reconstruction. Nature, 352:148-150.
Mayer, L.A., Shipley, T.H., Theyer, F., Wilkens, R.H., and Winterer, E.L.,1985. Seismic modeling and paleoceanography at Deep Sea DrillingProject Site 574. In Mayer, L.A., Theyer, F., Thomas, E., et al., Init.Repts. DSDP, 85: Washington (U.S. Govt. Printing Office), 947-970.
Mosher, D.C., Mayer, L.A., Shipley, T.H., Winterer, E.L., Hagen, R.A.,Marsters, J.C., Bassinot, F., Wilkens, R.H., and Lyle, M., 1993. Seismicstratigraphy of the Ontong Java Plateau. In Berger, W.H., Kroenke,L.W., Mayer, L.A., et al., Proc. ODP, Sci. Results, 130: College Station,TX (Ocean Drilling Program), 33-49.
Rea, D.K., Basov, LA., Janecek, T.R., Palmer-Julson, A., et al., 1993. Proc.ODP, Init. Repts., 145: College Station, TX (Ocean Drilling Program).
Rohr, K.M.M., and Schmidt, U., 1994. Seismic structure of Middle Valleynear Sites 855-858, Leg 139, Juan de Fuca Ridge. In Mottl, MJ., Davis,E.E., Fisher, A.T., and Slack, J.F. (Eds.), Proc. ODP, Sci. Results, 139:College Station, TX (Ocean Drilling Program), 3-17.
Scholl, D.V., Hein, J.R., Marlow, M., and Buffington, E.C., 1977. Meiji sed-iment tongue: North Pacific evidence for limited movement between thePacific and North American plates. Geol. Soc. Am. Bull., 88:1567-1576.
Udintsev, G. (Coord.), 1982. Pacific Ocean, 1:10,000,000 Mercator. GeneralBathymetric Chart of the Oceans (GEBCO) 5-07 (5th ed.): Ottawa (Can.Hydrogr. Surv.).
, 1984. Pacific Ocean, 1:10,000,000 Mercator. General Bathymet-ric Chart of the Oceans (GEBCO) 5-02 (5th ed.): Ottawa (Can. Hydrogr.Surv.).
Date of initial receipt: 4 April 1994Date of acceptance: 25 January 1995Ms 145SR-136
453