Embed Size (px)
Citation preview
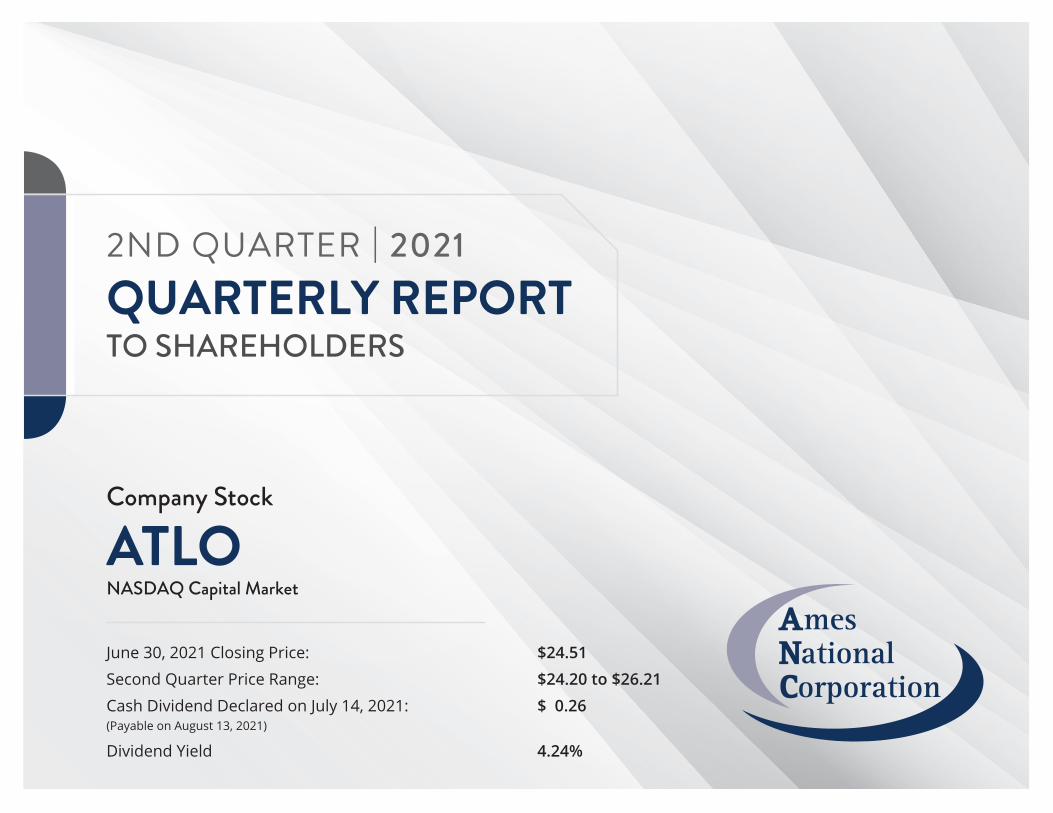
2ND QUARTER | 2021QUARTERLY REPORTTO SHAREHOLDERS
Company Stock
ATLONASDAQ Capital Market
June 30, 2021 Closing Price: $24.51
Second Quarter Price Range: $24.20 to $26.21
Cash Dividend Declared on July 14, 2021: $ 0.26(Payable on August 13, 2021)
Dividend Yield 4.24%
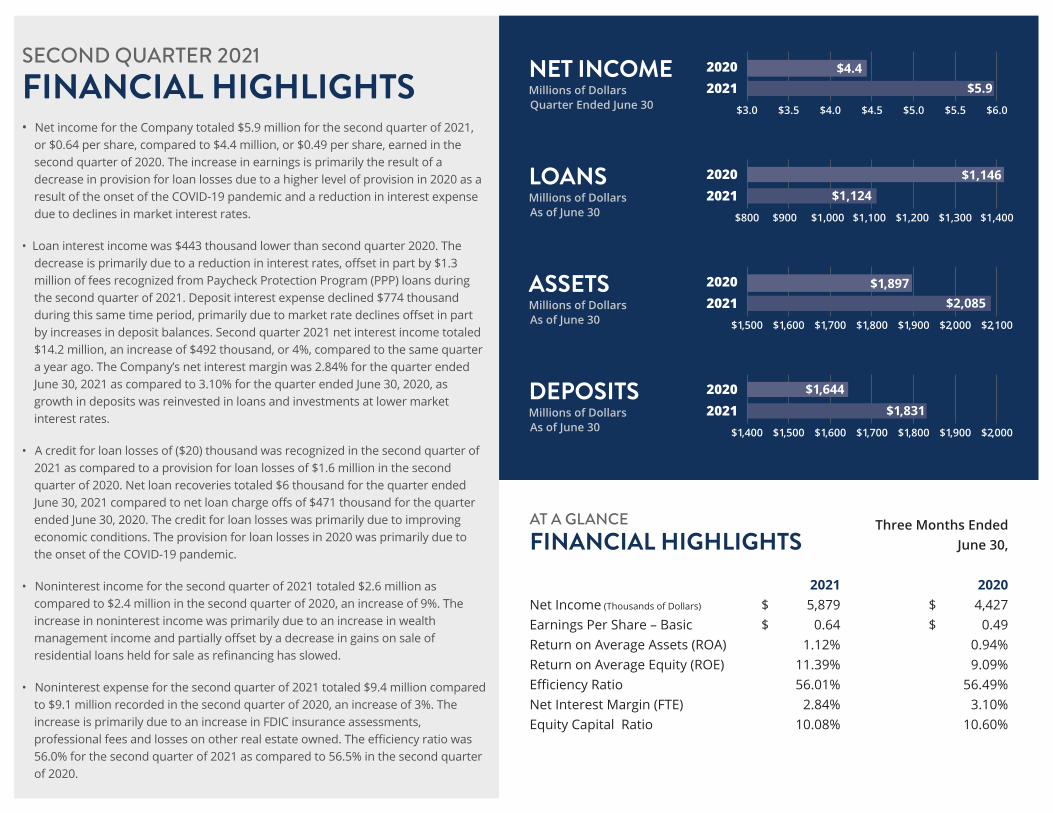
SECOND QUARTER 2021FINANCIAL HIGHLIGHTS• Net income for the Company totaled $5.9 million for the second quarter of 2021,
or $0.64 per share, compared to $4.4 million, or $0.49 per share, earned in the second quarter of 2020. The increase in earnings is primarily the result of a decrease in provision for loan losses due to a higher level of provision in 2020 as a result of the onset of the COVID-19 pandemic and a reduction in interest expense due to declines in market interest rates.
• Loan interest income was $443 thousand lower than second quarter 2020. The decrease is primarily due to a reduction in interest rates, offset in part by $1.3 million of fees recognized from Paycheck Protection Program (PPP) loans during the second quarter of 2021. Deposit interest expense declined $774 thousand during this same time period, primarily due to market rate declines offset in part by increases in deposit balances. Second quarter 2021 net interest income totaled $14.2 million, an increase of $492 thousand, or 4%, compared to the same quarter a year ago. The Company’s net interest margin was 2.84% for the quarter ended June 30, 2021 as compared to 3.10% for the quarter ended June 30, 2020, as growth in deposits was reinvested in loans and investments at lower market interest rates.
• A credit for loan losses of ($20) thousand was recognized in the second quarter of 2021 as compared to a provision for loan losses of $1.6 million in the second quarter of 2020. Net loan recoveries totaled $6 thousand for the quarter ended June 30, 2021 compared to net loan charge offs of $471 thousand for the quarter ended June 30, 2020. The credit for loan losses was primarily due to improving economic conditions. The provision for loan losses in 2020 was primarily due to the onset of the COVID-19 pandemic.
• Noninterest income for the second quarter of 2021 totaled $2.6 million as compared to $2.4 million in the second quarter of 2020, an increase of 9%. The increase in noninterest income was primarily due to an increase in wealth management income and partially offset by a decrease in gains on sale of residential loans held for sale as refinancing has slowed.
• Noninterest expense for the second quarter of 2021 totaled $9.4 million compared to $9.1 million recorded in the second quarter of 2020, an increase of 3%. The increase is primarily due to an increase in FDIC insurance assessments, professional fees and losses on other real estate owned. The efficiency ratio was 56.0% for the second quarter of 2021 as compared to 56.5% in the second quarter of 2020.
Three Months EndedJune 30,
2021 2020Net Income (Thousands of Dollars) $ 5,879 $ 4,427Earnings Per Share – Basic $ 0.64 $ 0.49Return on Average Assets (ROA) 1.12% 0.94%Return on Average Equity (ROE) 11.39% 9.09%Efficiency Ratio 56.01% 56.49%Net Interest Margin (FTE) 2.84% 3.10%Equity Capital Ratio 10.08% 10.60%
20202021
$4.4$5.9
$3.5$3.0 $4.0 $4.5 $5.0 $5.5 $6.0
NET INCOMEMillions of DollarsQuarter Ended June 30
20202021
$1,146$1,124
$900$800 $1,000 $1,100 $1,200 $1,300 $1,400
LOANSMillions of DollarsAs of June 30
20202021
$1,897$2,085
$1,600$1,500 $1,700 $1,800 $1,900 $2,000 $2,100
ASSETSMillions of DollarsAs of June 30
DEPOSITSMillions of DollarsAs of June 30
AT A GLANCEFINANCIAL HIGHLIGHTS
20202021
$1,644$1,831
$1,500$1,400 $1,600 $1,700 $1,800 $1,900 $2,000
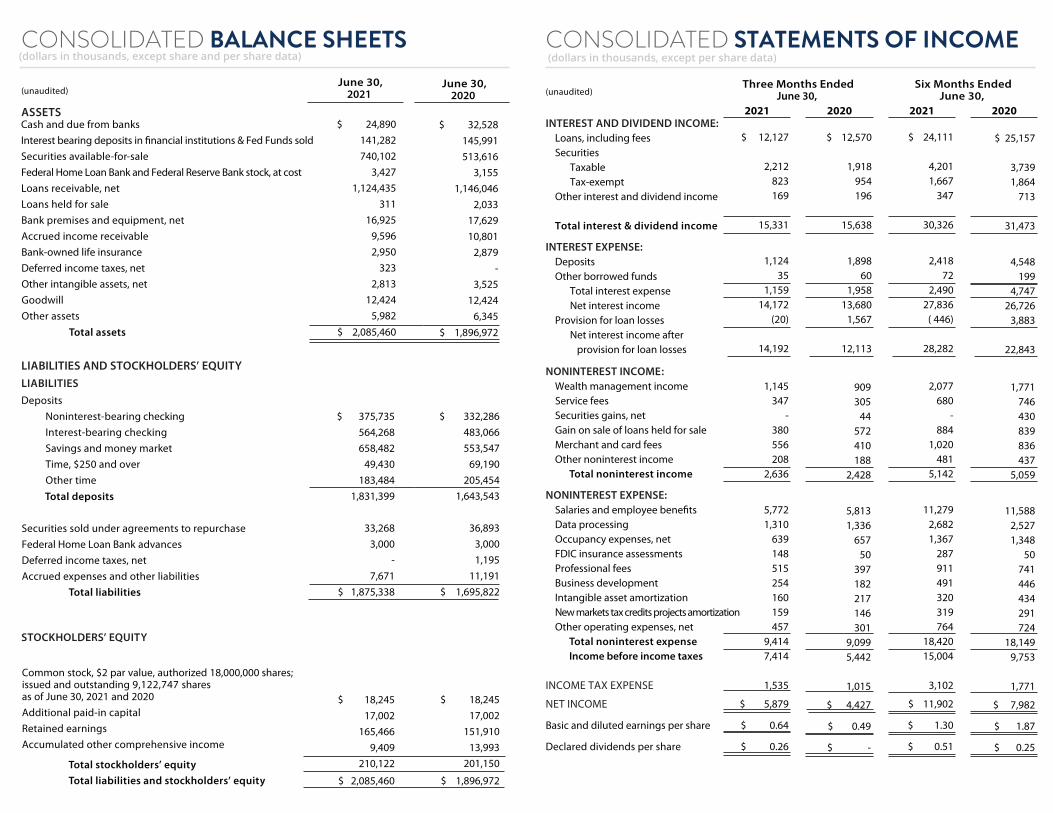
CONSOLIDATED STATEMENTS OF INCOME
(unaudited)
ASSETS
LIABILITIES AND STOCKHOLDERS’ EQUITY
LIABILITIES
Total stockholders’ equityTotal liabilities and stockholders’ equity
(unaudited)
CONSOLIDATED BALANCE SHEETS
$ 32,528 145,991 513,616
3,155 1,146,046
2,033 17,629 10,801
2,879 -
3,525 12,424
6,345 $ 1,896,972
Cash and due from banksInterest bearing deposits in financial institutions & Fed Funds soldSecurities available-for-saleFederal Home Loan Bank and Federal Reserve Bank stock, at costLoans receivable, netLoans held for saleBank premises and equipment, netAccrued income receivableBank-owned life insurance Deferred income taxes, netOther intangible assets, netGoodwillOther assets Total assets
$ 332,286 483,066 553,547
69,190 205,454
1,643,543
36,893 3,000 1,195
11,191 $ 1,695,822
$ 18,245 17,002
151,910 13,993
201,150
$ 1,896,972
Deposits Noninterest-bearing checking Interest-bearing checking Savings and money market Time, $250 and over Other time Total deposits
Securities sold under agreements to repurchaseFederal Home Loan Bank advancesDeferred income taxes, netAccrued expenses and other liabilities Total liabilities
2021
$ 12,127
2,212 823 169
15,331
1,124 35
1,159 14,172
(20)
14,192
1,145 347
- 380 556 208
2,636
5,772 1,310
639 148515 254 160159 457
9,414 7,414
1,535
$ 5,879
$ 0.64
$ 0.26
$ 24,111
4,201 1,667
347
30,326
2,418 72
2,490 27,836
( 446)
28,282
2,077 680
- 884
1,020 481
5,142
11,279 2,682 1,367
287 911 491
320 319 764
18,420 15,004
3,102
$ 11,902
$ 1.30
$ 0.51
NONINTEREST INCOME:Wealth management income Service feesSecurities gains, netGain on sale of loans held for saleMerchant and card feesOther noninterest income Total noninterest income
NONINTEREST EXPENSE:Salaries and employee bene�tsData processingOccupancy expenses, netFDIC insurance assessmentsProfessional feesBusiness developmentIntangible asset amortizationNew markets tax credits projects amortizationOther operating expenses, net Total noninterest expense Income before income taxes
INCOME TAX EXPENSE
NET INCOME
Basic and diluted earnings per share
Declared dividends per share
INTEREST AND DIVIDEND INCOME:Loans, including feesSecurities Taxable Tax-exemptOther interest and dividend income Total interest & dividend income
INTEREST EXPENSE:DepositsOther borrowed funds Total interest expense Net interest incomeProvision for loan losses Net interest income after provision for loan losses
Three Months EndedJune 30,
Six Months EndedJune 30,
2020 2021 2020
STOCKHOLDERS’ EQUITY
June 30,2021
June 30,2020
$ 24,890 141,282 740,102
3,427 1,124,435
311 16,925
9,596 2,950 323
2,813 12,424
5,982 $ 2,085,460
$ 375,735 564,268 658,482
49,430 183,484
1,831,399
33,268 3,000
- 7,671
$ 1,875,338
$ 18,245 17,002
165,466 9,409
210,122
$ 2,085,460
$ 12,570
1,918 954196
15,638
1,898 60
1,958 13,680 1,567
12,113
909 305
44 572 410 188
2,428
5,813 1,336
657 50
397 182 217 146
301 9,099 5,442
1,015
$ 4,427
$ 0.49
$ -
$ 25,157
3,739 1,864
713
31,473
4,548 199
4,74726,726
3,883
22,843
1,771 746 430
839 836 437
5,059
11,588 2,527 1,348
50 741
446 434 291 724
18,149 9,753
1,771
$ 7,982
$ 1.87
$ 0.25
Common stock, $2 par value, authorized 18,000,000 shares; issued and outstanding 9,122,747 shares as of June 30, 2021 and 2020Additional paid-in capitalRetained earningsAccumulated other comprehensive income
(dollars in thousands, except share and per share data) (dollars in thousands, except per share data)
MISSION STATEMENTAmes National Corporation is a result-oriented financial services holding company providing leadership, counsel and support to its commu-nity affiliate banks and superior performance for its shareholders.
CORE VALUESExcellenceStriving to exceed expectations
IntegrityDemonstrating high moral and ethical conduct
LeadershipCreating and developing opportunities that benefit our employees, customers, communities, and shareholders
StabilityMaintaining financial strength and a dedicated staff to successfully serve the current and future needs of our employees, customers, communities, and shareholders
TrustActing in the best interest of our employees, customers, and shareholders
CommunityDedicated to serving our communities through local decision making, community involvement and active boards of directors
AFFILIATE BANKS
Ames National Corporation405 5th Street • Ames, IA 50010PHONE 515-232-6251FAX 515-663-3033EMAIL [email protected] www.amesnational.com
THOMAS H. POHLMANChairman, Ames National Corporation
JOHN P. NELSONPresident & CEO, Ames National Corporation
DAVID W. BENSONAttorney, Nyemaster Goode, P.C.
MICHELLE R. CASSABAUMChief Operating and Financial Officer, 21st Century Rehab P.C.
LISA M. ESLINGERChief Financial and Administrative Officer,Iowa State University Foundation
STEVEN D. FORTHFarmer
PATRICK G. HAGANRetired Senior Vice President and Treasurer,Fareway Stores, Inc.
BETTY A. BAUDLER HORRASPresident, Baudler Enterprises, Inc.
JAMES R. LARSON, IIPresident, Larson Development Corporation
JOHN L. PIERSCHBACHERChief Financial Officer, Ames National Corporation
KEVIN L. SWARTZRetired Chief Executive Officer, Wolfe Clinic PC
COMPANY DIRECTORS