Embed Size (px)
Citation preview

Final Report …helping organizations make better decisions since 1982
Submitted to: Unified Government of Wyandotte County/ Kansas City, Kansas
Submitted by: ETC Institute 725 W. Frontier Lane, Olathe, Kansas 66061
May 2016
‘16 2016 Kansas City, KS/ Wyandotte County Community Survey

ETC Institute (2016) Page i
2016 Kansas City, KS/Wyandotte County Community Survey
Executive Summary Report
Overview and Methodology
During the spring of 2016, ETC Institute administered the third community survey for the Unified Government of Wyandotte County/Kansas City, Kansas. The purpose of the survey was to determine the quality of life in the area and overall perceptions of city and county government services. The results of the survey will help develop government funding priorities and assist in efforts to deliver government services in the most cost effective and efficient manner possible.
Methodology. A survey was mailed to a stratified random sample of households in Wyandotte County and Kansas City, KS. The sample was stratified to ensure the completion of at least 300 surveys in each of the eight Commission Districts. The mailed survey included a postage paid return envelope, cover letter explaining the purpose of the survey and where residents could complete the online version of the survey.
Approximately two weeks after the surveys were mailed; residents who received the survey were contacted by phone and/or e-mail. Those who indicated that they had not returned the survey or completed it online were given the option of completing it by phone. A total of 3,175 households completed a survey. The results for the random sample of 3,175 households have a 95% level of confidence with a precision of at least +/- 1.7%.
Don’t Knows. The percentage of “don’t know” responses has been excluded from many of the graphs in this report to assess satisfaction with residents who had used City or County services. Since the number of “don’t know” responses often reflects the utilization and awareness of city and county services, the percentage of “don’t know” responses has been included in the tabular data in Section 3 of this report. When the “don’t know” responses have been excluded, the text of this report will indicate that the responses have been excluded with the phrase “who had an opinion.”

ETC Institute (2016) Page ii
This report contains the following:
a summary of the methodology for administering the survey and major findings
charts showing the overall results for most questions on the survey (Section 1)
importance-satisfaction analysis that identifies priorities for investment (Section 2)
tabular data showing the overall results for all questions on the survey (Section 3)
a copy of the cover letter and survey instrument (Section 4)
Perceptions of the County
Perceptions of the County. Residents were asked to rate several items that mayinfluence their perceptions of the County. The items that had the highest levels ofsatisfaction, based upon the combined “very satisfied” and “satisfied” responses amongresidents who had an opinion, were: satisfaction with your monthly trash service fee(38%), overall quality of life in Wyandotte County (37%), and how well the County isplanning/managing growth/development (35%).
Overall Satisfaction with Unified Government Services
City Services. The major categories of City services that had the highest levels ofsatisfaction, based upon the combined percentage of “very satisfied” and “satisfied”responses among residents who had an opinion, were: fire services (83%), ambulanceservices (78%), trash collection system (70%), and police services (69%).
County Services. The major categories of County services that had the highest levels ofsatisfaction, based upon the combined percentage of “very satisfied” and “satisfied”responses among residents who had an opinion, were: the quality of parks (52%), thequality of the County Sheriff’s Office (51%), the quality of Election Office (44%), and thequality of the community elections (42%).
Satisfaction with Specific Services
Public Safety. The highest levels of satisfaction with public safety services, based uponthe combined percentage of “very satisfied” and “satisfied” responses among residentswho had an opinion, were: how quickly the Fire Department responds to medicalemergency calls (78%), how quickly the Fire Department responds to fires (77%), howquickly the Police Department responds to emergencies (56%), and the visibility ofpolice in neighborhoods (52%).
City Codes and Ordinances. The highest levels of satisfaction with the City codes andordinances, based upon the combined percentage of “very satisfied” and “satisfied”responses among residents who had an opinion, were: enforcing the removal ofinoperable or junk cars (35%), enforcing maintenance of business property (34%), andthe maintenance of residential property (34%).

ETC Institute (2016) Page iii
City Maintenance. The highest levels of satisfaction with City maintenance services, based upon the combined percentage of “very satisfied” and “satisfied” responses among residents who had an opinion, were: snow removal on major City streets (58%), the maintenance of streets signs/traffic signals (48%), and the maintenance of city buildings (41%).
Parks and Recreation. The highest levels of satisfaction with the City’s parks, recreation, based upon the combined percentage of “very satisfied” and “satisfied” responses among residents who had an opinion, were: the maintenance of parks and equipment (49%), Sunflower Hills Golf Course (42%), and the number of parks (38%).
Funding Priorities for Village West Tax Revenue. Based on the sum of respondents’ top three choices, respondents indicated the top three funding priorities should be (1) property tax relief (51%), (2) street resurfacing (38%), and (3) police services (33%).
Other Findings
Some of the other major findings from the survey are listed below.
Business Needs and Availability. Respondents were asked to indicate from a list of 15 potential businesses which their household has a need for. Respondents were then asked to indicate if they would like to see the availability of the business in their neighborhood increase, stay the same, or decrease.
o Business Needs. Sixty-seven percent (68%) of households indicated that they have a need for a grocery store. Other business needs include: hardware store (60%), casual dining restaurant (57%), clothing and home goods store (57%), urgent medical care facility (56%), convenience/gas station (56%), health and fitness center (55%), fast casual restaurant (55%), drug store/pharmacy (53%), and fine dining restaurant (51%).
o Business Availability. Four out of five households indicated they would like to see (1) senior day care (82%), (2) health and fitness center (79%), and children’s daycare (79%) increase in their neighborhood.
Current Quality of Life. Almost half of respondents (47%) indicated that they feel the current quality of life in their neighborhood is about the same as it has always been. Other feelings include: getting worse (24%), getting better (23%), never better (4%), and never worse (2%).
Trends Notable Increases

ETC Institute (2016) Page iv
Overall satisfaction with police services has increased since the 2014 survey efforts Satisfaction with the police department response time to emergencies Satisfaction with the enforcement of maintenance of business property Satisfaction with the number of walking and biking trails
Notable decreases
Satisfaction with quality of parks and recreation facilities Satisfaction with quality of storm water runoff/management system Satisfaction with quality of communication with the public Satisfaction with the overall image of Wyandotte County
Investment Priorities Recommended Priorities for the Next Two Years. In order to help the Unified Government identify investment priorities for the next two years, ETC Institute conducted an Importance-Satisfaction (I-S) analysis. This analysis examined the importance that residents placed on each service and the level of satisfaction with each service.
By identifying services of high importance and low satisfaction, the analysis identified which services will have the most impact on overall satisfaction with City and County services over the next two years. If the Unified Government wants to improve its overall satisfaction rating, they should prioritize investments in services with the highest Importance Satisfaction (I-S) ratings. Details regarding the methodology for the analysis are provided in the Section 3 of this report.
Based on the results of the Importance-Satisfaction (I-S) Analysis, ETC Institute recommends the following:
Overall Priorities for the City by Major Category. The first level of analysis reviewed the importance of and satisfaction with major categories of City services. This analysis was conducted to help set the overall priorities for the City. Based on the results of this analysis, the major services that are recommended as the top priorities for investment over the next two years in order to raise the City’s overall satisfaction rating are listed below in descending order of the Importance-Satisfaction rating:
o Quality of maintenance of City streets o Quality of communication with the public o Quality of City Code Enforcement o Quality of public transportation o Quality of City’s storm water runoff/management system
Overall Priorities for the County by Major Category. The second level of analysis reviewed the importance of and satisfaction with major categories of County services. This analysis was conducted to help set the overall priorities for the County. Based on the results of this analysis, the major services that are recommended as the top

ETC Institute (2016) Page v
priorities for investment over the next two years in order to raise the County’s overall satisfaction rating are listed below in descending order of the Importance-Satisfaction rating:
o Quality of motor vehicle registrationo Quality aging serviceso Quality services for development disabilitieso Customer service received from County employeeso Public health department serviceso Senior transportation
Priorities Within Departments/Specific Areas: The third level of analysis reviewed theimportance of and satisfaction of services within departments and specific service areas.This analysis was conducted to help departmental managers set priorities for theirdepartment. Based on the results of this analysis, the services that are recommendedas the top priorities within each department over the next two years are listed below:
o Public Safety: City’s overall efforts to prevent crime, quality of animal control inthe City, code enforcement, and the visibility of police in neighborhoods.
o City Codes and Ordinances: Enforcing the clean-up of litter & debris (blight),Mowing/trimming on private and/or vacant property city-wide, enforcing theclean-up of litter and debris in neighborhoods, mowing and trimming of privateand/or vacant property in neighborhoods, and maintenance of neighborhoodresidential property.
o City Maintenance Services: Maintenance of streets in your neighborhood,maintenance of sidewalks, snow removal on neighborhood streets, and overallcleanliness of streets and other public areas.
o Parks and Recreation: Number of walking & biking trails, youth recreationprograms, and swimming pool and spray parks.

Contents
Executive Summary ....................................................................................... Page i
Section 1: Charts and Graphs ....................................................................... Page 1
Section 2: Importance-Satisfaction Analysis .............................................. Page 20
Section 3: Tabular Analysis ......................................................................... Page 36
Section 4: Survey Instrument ..................................................................... Page 85
Appendix A: GIS Maps by District and Neighborhood
Appendix B: National Benchmark Comparisons
Commission District Level Reports

Section 1:
Charts and Graphs
2016 Kansas City, KS/Wyandotte County Community Survey Final Report
ETC Institute (2016) Page 1

38%37%
24%25%
14%13%
10%10%8%10%9%8%7%7%6%
45%41%
46%44%
38%37%
35%31%
30%26%
27%23%23%23%
22%
15%
18%
18%
21%
29%
29%
36%
36%
35%
40%
47%
38%
49%
39%
27%
2%
4%
12%
11%
19%
21%
20%
23%
27%
24%
18%
31%
21%
31%
45%
Fire services
Ambulance services
Trash collection system
Police services
Recycling
Parks and recreation facilities
Sewer utility system
Parks and recreation programs
Storm water runoff/management system
Public transportation
Municipal court
Code enforcement
Planning and zoning
Communication with the public
Maintenance of city streets
0% 20% 40% 60% 80% 100%
Very Satisfied (5) Satisfied (4) Neutral (3) Dissatisfied (1/2)
Q1. Overall Satisfaction with Servicesin Neighborhood and Community
by percentage of respondents who rated the item as a 1 to 5 on a 5-point scale (excluding “don't know”)
Source: ETC Institute DirectionFinder (2016 - Kansas City, KS/Wyandotte County)
Q1. Overall Satisfaction with Servicesin Neighborhood and Community
Trends: 2000, 2014, and 2016by percentage of respondents who rated the item as a 4 or 5 on a 5-point scale (excluding “don't know”)
Source: ETC Institute DirectionFinder (2016 - Kansas City, KS/Wyandotte County)
83%
69%
50%
41%
38%
31%
30%
28%
85%
66%
55%
44%
46%
33%
40%
36%
81%
63%
38%
38%
34%
30%
29%
19%
Quality of City fire services
Quality of City police services
Quality of City's parks & recreation facilities
Quality of City's parks & recreation programs
City's storm water runoff/management system
Quality of City Code Enforcement
Quality of communication with public
Quality of maintenance of City streets
0% 20% 40% 60% 80% 100%
2016 2014 2000
2016 Kansas City, KS/Wyandotte County Community Survey Final Report
ETC Institute (2016) Page 2

63%32%
30%26%
24%22%22%
18%16%15%15%14%
12%10%
8%
Maintenance of City streets
Communication with the public
Police services
Code enforcement
Parks & recreation facilities
Storm water runoff/management system
Public transportation
Parks & recreation programs
Sewer utility system
Recycling
Planning & zoning
Fire services
Trash collection system
Ambulance services
Municipal court
0% 20% 40% 60% 80% 100%
1st Choice 2nd Choice 3rd Choice 4th Choice
Q2. Neighborhood Priorities That Should Receive the Most Emphasis Over the Next 2 Yearsby percentage of respondents who selected the item as one of their top four choices
Source: ETC Institute DirectionFinder (2016 - Kansas City, KS/Wyandotte County)
12%
14%
11%
10%
9%
9%
9%
9%
10%
9%
8%
8%
8%
8%
7%
40%
37%
33%
32%
30%
29%
29%
29%
27%
26%
26%
25%
23%
21%
21%
32%
41%
46%
45%
42%
24%
48%
38%
51%
49%
52%
43%
47%
49%
48%
16%
8%
11%
13%
20%
38%
15%
25%
12%
16%
14%
25%
22%
22%
24%
County parks
County Sheriff's office
The Election Office
Community elections
Treasurer's Office
Motor Vehicle Registration
District Courts
Customer service
The District Attorneys' Office
Public Health Department services
Adult Jail/Juvenile Detention Center
County Appraiser's Office services
Area Agency on Aging Services
Senior transportation
Services for developmental disabilities
0% 20% 40% 60% 80% 100%
Very Satisfied (5) Satisfied (4) Neutral (3) Dissatisfied (1/2)
Q3. Satisfaction with County Servicesby percentage of respondents who rated the item as a 1 to 5 on a 5-point scale (excluding “don't know”)
Source: ETC Institute DirectionFinder (2016 - Kansas City, KS/Wyandotte County)
2016 Kansas City, KS/Wyandotte County Community Survey Final Report
ETC Institute (2016) Page 3

53%
51%
43%
42%
39%
38%
37%
37%
37%
33%
32%
28%
55%
50%
51%
50%
43%
45%
43%
47%
41%
36%
34%
33%
Quality of Parks
Quality of County Sheriff's Office
Quality of Election Office
Quality of Community Elections
Quality of Treasurers Office
Quality of Motor Vehicle Registration
Quality of District Courts
Customer serviced received from County employees
Quality of District Attorney's Office
Quality of County Appraiser's Office services
Quality of Aging Services
Quality of services for developmental disabilities
0% 20% 40% 60% 80% 100%
2016 2014
Q3. Satisfaction with County ServicesTrends: 2014 and 2016
by percentage of respondents who rated the item as a 1 to 5 on a 5-point scale (excluding “don't know”)
Source: ETC Institute DirectionFinder (2016 - Kansas City, KS/Wyandotte County)*Not asked in 2000
44%
28%
27%
27%
24%
24%
21%
17%
15%
13%
11%
10%
9%
7%
6%
Motor Vehicle Registration
County parks
Customer service provided by Unified Government em
Area Agency on Aging Services
Services for developmental disabilities
Public Health Department services
Senior transportation
County Appraiser's Office services
Adult Jail/Juvenile Detention Center
Treasurer's Office
County Sheriff's office
Community elections
District Courts
The Election Office
The District Attorneys' Office
0% 20% 40% 60%
1st Choice 2nd Choice 3rd Choice 4th Choice
Q4. County Services That Should Receive the Most Emphasis Over the Next 2 Years
by percentage of respondents who selected the item as one of their top three choices
Source: ETC Institute DirectionFinder (2016 - Kansas City, KS/Wyandotte County)
2016 Kansas City, KS/Wyandotte County Community Survey Final Report
ETC Institute (2016) Page 4

40%
25%
22%
14%
14%
13%
12%
12%
12%
12%
11%
11%
11%
10%
10%
Maintenance of City streets
Motor Vehicle Registration
Police services
Area Agency on Aging Services
Code enforcement
Services for developmental disabilities
Communication with the public
Customer service provided by Unified Government em
Parks & recreation facilities
County parks
Fire services
Storm water runoff/management system
Public Health Department services
Senior transportation
Public transportation
0% 20% 40% 60%
1st Choice 2nd Choice 3rd Choice 4th Choice
Q5. Overall Services That Should Receive the Most Emphasis Over the Next 2 Years
by percentage of respondents who selected the item as one of their top four choices
Source: ETC Institute DirectionFinder (2016 - Kansas City, KS/Wyandotte County)
8%
8%
8%
7%
7%
7%
6%
6%
5%
5%
4%
3%
3%
3%
2%
Adult Jail/Juvenile Detention Center
Parks & recreation programs
County Appraiser's Office services
Planning & zoning
Recycling
Sewer utility system
Ambulance services
Treasurer's Office
County Sheriff's office
Trash collection system
District Courts
Municipal court
Community elections
The District Attorneys' Office
The Election Office
0% 20% 40%
1st Choice 2nd Choice 3rd Choice 4th Choice
Q5. Overall Services That Should Receive the Most Emphasis Over the Next 2 Years (Continued)
by percentage of respondents who selected the item as one of their top four choices
Source: ETC Institute DirectionFinder (2016 - Kansas City, KS/Wyandotte County)
2016 Kansas City, KS/Wyandotte County Community Survey Final Report
ETC Institute (2016) Page 5

37%
34%
18%
14%
12%
10%
9%
10%
8%
7%
41%
43%
38%
38%
36%
35%
30%
23%
23%
19%
19%
21%
27%
25%
31%
34%
33%
30%
36%
46%
3%
3%
17%
23%
21%
20%
29%
37%
34%
29%
Fire department response time to fires
Police dept. response time to emergencies
Visibility of police in neighborhoods
Visibility of police in neighborhood retail areas
Enforcement of traffic laws
The city's overall efforts to prevent crime
Quality of animal control in your neighborhood
0% 20% 40% 60% 80% 100%
Very Satisfied (5) Satisfied (4) Neutral (3) Dissatisfied (1/2)
Q6. Satisfaction with Public Safety Servicesby percentage of respondents who rated the item as a 1 to 5 on a 5-point scale (excluding “don't know”)
Source: ETC Institute DirectionFinder (2016 - Kansas City, KS/Wyandotte County)
Visibility of Code Enforcement in your neighborhood
Visibility of Building Inspection in your neighborhood
Fire department response time to emergency calls
Satisfaction with Public Safety ServicesTrends: 2000,2014, and 2016
Source: ETC Institute DirectionFinder (2016 - Kansas City, KS/Wyandotte County)
55%
52%
48%
45%
39%
33%
54%
52%
49%
49%
44%
31%
64%
50%
41%
50%
50%
42%
Police department response time to emergencies
Visibility of police in neighborhoods
Visibility of police in retail areas
Enforcement of City traffic laws
City's overall efforts to prevent crime
Quality of animal control in City
0% 20% 40% 60% 80% 100%
2016 2014 2000
by percentage of respondents who rated the item as a 4 or 5 on a 5-point scale (excluding “don't know”)
2016 Kansas City, KS/Wyandotte County Community Survey Final Report
ETC Institute (2016) Page 6

Q7. Public Safety Services That Should Receive the Most Emphasis Over the Next 2 Years
Source: ETC Institute DirectionFinder (2016 - Kansas City, KS/Wyandotte County)
38%
37%
29%
26%
23%
18%
15%
14%
8%
7%
The City's overall efforts to prevent crime
The visibility of police in neighborhoods
Quality of animal control in your neighborhood
Visibility of police in neighborhood retail areas
Police dept response time to emergencies
Enforcement of traffic laws
Visibility of Bldg Inspection in your neighborhood
Fire dept response time to medical emergencies
How quickly fire department responded to fires
0% 20% 40% 60%
1st Choice 2nd Choice 3rd Choice
by percentage of respondents who selected the item as one of their top three choices
Visibility of Code Enforcement in your neighborhood
13%
9%
7%
7%
7%
9%
7%
5%
5%
6%
5%
4%
4%
45%
39%
34%
32%
31%
27%
28%
26%
25%
23%
19%
16%
12%
25%
36%
44%
26%
40%
23%
35%
33%
21%
44%
29%
27%
39%
17%
16%
16%
36%
22%
41%
31%
36%
50%
28%
47%
53%
46%
Snow removal on major City streets
Maintenance of street signs/traffic signals
Maintenance of City buildings
Maintenance of major City streets
Overall appearance of downtown
Snow removal on neighborhood streets
Overall cleanliness of streets/public areas
Maintenance of streets in your neighborhood
Maintenance of downtown parking lots
Maintenance of curbs in your neighborhood
Maintenance of sidewalks in your neighborhood
Maintenance of alleys in your neighborhood
0% 20% 40% 60% 80% 100%
Very Satisfied (5) Satisfied (4) Neutral (3) Dissatisfied (1/2)
Q8. Satisfaction With City Maintenanceby percentage of respondents who rated the item as a 1 to 5 on a 5-point scale (excluding “don't know”)
Source: ETC Institute DirectionFinder (2016 - Kansas City, KS/Wyandotte County)
Maintenance of stormwater drainage system in your neighborhood
2016 Kansas City, KS/Wyandotte County Community Survey Final Report
ETC Institute (2016) Page 7

Satisfaction With City MaintenanceTrends: 2000,2014, and 2016
Source: ETC Institute DirectionFinder (2016 - Kansas City, KS/Wyandotte County)
58%
48%
41%
39%
38%
31%
20%
60%
59%
49%
51%
41%
34%
25%
43%
65%
53%
22%
31%
32%
25%
Snow removal on major City streets
Maintenance of street signs/traffic signals
Maintenance of City buildings
Maintenance of major City streets
Appearance of Downtown
Overall cleanliness of streets & other public area
Maintenance of sidewalks
0% 20% 40% 60% 80% 100%
2016 2014 2000
by percentage of respondents who rated the item as a 4 or 5 on a 5-point scale (excluding “don't know”)
43%
30%
29%
28%
24%
18%
17%
14%
11%
10%
7%
7%
5%
Maintenance of streets in your neighborhood
Snow removal on neighborhood streets
Maintenance of major City streets
Maintenance of sidewalks in your neighborhood
Overall cleanliness of streets & other public area
Maintenance of curbs in your neighborhood
Maintenance of alleys in your neighborhood
Overall appearance of Downtown
Snow removal on major City streets
Maintenance of Downtown parking lots
Maintenance of street signs/traffic signals
Maintenance of City buildings
0% 20% 40% 60%
1st Choice 2nd Choice 3rd Choice
Q9. City Maintenance Services That Should Receive the Most Emphasis Over the Next 2 Years
Source: ETC Institute DirectionFinder (2016 - Kansas City, KS/Wyandotte County)
by percentage of respondents who selected the item as one of their top three choices
Maintenance of stormwater drainage system in your neighborhood
2016 Kansas City, KS/Wyandotte County Community Survey Final Report
ETC Institute (2016) Page 8

7%
6%
7%
6%
5%
5%
4%
28%
28%
27%
25%
23%
21%
20%
34%
44%
32%
28%
28%
29%
29%
32%
23%
35%
41%
44%
46%
47%
Enforcing removal of inoperable or junk cars
Enforcing maintenance of business property
Maintenance of neighborhood residential property
Enforcing clean-up of trash in your neighborhood
Mowing & trimming in your neighborhood
Enforcing clean-up of trash city-wide
Mowing & trimming city-wide
0% 20% 40% 60% 80% 100%
Very Satisfied (5) Satisfied (4) Neutral (3) Dissatisfied (1/2)
Q10. Satisfaction With the Enforcement of Kansas City Codes and Ordinances
by percentage of respondents who rated the item as a 1 to 5 on a 5-point scale (excluding “don't know”)
Source: ETC Institute DirectionFinder (2016 - Kansas City, KS/Wyandotte County)
Satisfaction With the Enforcement of Kansas City Codes and Ordinances
Trends: 2000,2014, and 2016
Source: ETC Institute DirectionFinder (2016 - Kansas City, KS/Wyandotte County)
33%
33%
26%
24%
31%
33%
27%
24%
39%
33%
29%
29%
Enforcing maintenance of business property
Maintenance of neighborhood residential property
Enforcing clean up of litter & debris
Mowing/trimming on private and/or vacant property
0% 20% 40% 60%
2016 2014 2000
by percentage of respondents who rated the item as a 4 or 5 on a 5-point scale (excluding “don't know”)
2016 Kansas City, KS/Wyandotte County Community Survey Final Report
ETC Institute (2016) Page 9

47%
40%
37%
28%
24%
21%
17%
Enforcing clean-up of trash city-wide
Enforcing mowing and trimming city-wide
Enforcing clean-up of trash in your neighborhood
Mowing & trimming in your neighborhood
Maintenance of neighborhood residential property
Enforcing removal of inoperable or junk cars
Enforcing maintenance of business property
0% 20% 40% 60%
1st Choice 2nd Choice 3rd Choice
Q11. Codes and Ordinances That Should Receive the Most Emphasis Over the Next 2 Yearsby percentage of respondents who selected the item as one of their top three choices
Source: ETC Institute DirectionFinder (2016 - Kansas City, KS/Wyandotte County)
10%
12%
8%
7%
7%
6%
6%
7%
7%
6%
6%
6%
39%
30%
31%
25%
23%
20%
19%
18%
16%
18%
17%
16%
33%
50%
34%
37%
27%
48%
36%
34%
53%
47%
39%
42%
18%
8%
27%
30%
43%
26%
38%
42%
24%
30%
38%
36%
Maintenance of parks & equipment
Sunflower Hills Golf Course
The number of parks
Number of outdoor athletic fields
Number of walking and biking trails
Ease of registering for programs
Youth recreation programs
Swimming pool & spray parks
Skate board parks
Fees charged for recreation programs
Adult recreation programs
Programs for seniors
0% 20% 40% 60% 80% 100%
Very Satisfied (5) Satisfied (4) Neutral (3) Dissatisfied (1/2)
Q12. Satisfaction With Parks and Recreation Facilities and Services
by percentage of respondents who rated the item as a 1 to 5 on a 5-point scale (excluding “don't know”)
Source: ETC Institute DirectionFinder (2016 - Kansas City, KS/Wyandotte County)
2016 Kansas City, KS/Wyandotte County Community Survey Final Report
ETC Institute (2016) Page 10

Satisfaction With Parks and Recreation Facilities and Services
Trends: 2000,2014, and 2016
Source: ETC Institute DirectionFinder (2016 - Kansas City, KS/Wyandotte County)
49%
39%
32%
30%
26%
25%
24%
50%
42%
32%
26%
29%
22%
26%
57%
34%
42%
17%
38%
20%
40%
Maintenance of parks & equipment
Number of parks
Number of outdoor athletic fields
Number of walking & biking trails
Ease of registering for programs
Swimming pool & spray parks
Fees that are charged for recreation programs
0% 20% 40% 60% 80%
2016 2014 2000
by percentage of respondents who rated the item as a 4 or 5 on a 5-point scale (excluding “don't know”)
36%
28%
27%
25%
20%
19%
18%
14%
13%
7%
4%
2%
Number of walking & biking trails
Maintenance of parks & equipment
Youth recreation programs
Swimming pool & spray parks
The number of parks
Programs for seniors
Adult recreation programs
Fees charged for recreation programs
Number of outdoor athletic fields
Ease of registering for programs
Skate board parks
Sunflower Hills Golf Course
0% 10% 20% 30% 40%
1st Choice 2nd Choice 3rd Choice
Q13. Parks and Recreation Issues that Should Receive the Most Emphasis Over the Next 2 Years
by percentage of respondents who selected the item as one of their top three choices
Source: ETC Institute DirectionFinder (2016 - Kansas City, KS/Wyandotte County)
2016 Kansas City, KS/Wyandotte County Community Survey Final Report
ETC Institute (2016) Page 11

51%
38%
33%
23%
23%
23%
19%
16%
14%
13%
13%
10%
Property Tax Relief
Street Resurfacing
Police Services
Aging Services
Park Improvements
Demolitions of Residential/Commercial Properties
Snow Removal Plowing & Treatment
Fire Services
Mowing Vacant Lots
Code Enforcement
Other
0% 10% 20% 30% 40% 50% 60%
1st Choice 2nd Choice 3rd Choice
Q14. Top Three Funding Priorites to Fund with the Village West Sales Tax Revenues
by percentage of respondents who selected the item as one of their top three choices
Source: ETC Institute DirectionFinder (2016 - Kansas City, KS/Wyandotte County)
Personal Property (Auto) Registration at Courthouse or Annex
68%
60%
57%
57%
56%
56%
55%
55%
53%
51%
43%
32%
27%
25%
24%
Grocery Store
Hardware Store
Casual Dining Restaurant
Clothing and Home Goods
Urgent Medical Care Facility
Convenience/Gas Station
Health and Fitness Center
Fast Casual Restaurant
Drug Store/Pharmacy (e.g. CVS)
Fine Dining Restaurant
Fast Food Restaurant
Dry Cleaners
Children's Day Care
Senior Day Care
Laundromat
0% 10% 20% 30% 40% 50% 60% 70% 80%
Q15. Business Needsby percentage of respondents
Source: ETC Institute DirectionFinder (2016 - Kansas City, KS/Wyandotte County)
2016 Kansas City, KS/Wyandotte County Community Survey Final Report
ETC Institute (2016) Page 12

82%
79%
79%
73%
70%
69%
68%
66%
63%
57%
56%
56%
46%
37%
36%
17%
20%
21%
27%
30%
31%
32%
33%
37%
43%
43%
44%
52%
59%
63%
1%
1%
0%
1%
1%
1%
1%
1%
0%
0%
1%
0%
2%
4%
1%
Senior Day Care
Health and Fitness Center
Children's Day Care
Fine Dining Restaurant
Fast Casual Restaurant
Casual Dining Restaurant
Urgent Medical Care Facility
Clothing and Home Goods
Grocery Store
Laundromat
Dry Cleaners
Hardware Store
Convenience/Gas Station
Fast Food Restaurant
Drug Store/Pharmacy (e.g. CVS)
0% 20% 40% 60% 80% 100%
Increase (3) Stay About the Same (2) Decrease (1)
Q15a. Household Wants for Business Availability in Neighborhood
by percentage of respondents
Source: ETC Institute DirectionFinder (2016 - Kansas City, KS/Wyandotte County)
Q16. How Respondents Feels About the Current Quality of Life in their Neighborhood
Never been better4%
Getting better23%
About the same 47%
Getting worse24%
Never been worse2%
Source: ETC Institute DirectionFinder (2016 - Kansas City, KS/Wyandotte County)
by percentage of respondents
2016 Kansas City, KS/Wyandotte County Community Survey Final Report
ETC Institute (2016) Page 13

7%
5%
6%
5%
4%
5%
5%
4%
3%
31%
32%
29%
27%
27%
24%
24%
23%
13%
33%
33%
35%
41%
29%
32%
31%
31%
27%
29%
31%
30%
28%
40%
39%
41%
43%
57%
Your monthly trash service fee
Overall quality of life in Wyandotte County
Overall quality of City and County services
Overall image of Wyandotte County
Your monthly sewer fee
Overall feeling of safety in Wyandotte County
Overall appearance of Wyandotte County
The overall value you receive taxes/fees
0% 20% 40% 60% 80% 100%
Very Satisfied (5) Satisfied (4) Neutral (3) Dissatisfied (1/2)
Q17. Satisfaction with Items that Influence Perceptions of Wyandotte County
by percentage of respondents who rated the item as a 1 to 5 on a 5-point scale (excluding “don't know”)
Source: ETC Institute DirectionFinder (2016 - Kansas City, KS/Wyandotte County)
County is planning/managinggrowth/development well
Satisfaction with Items that Influence Perceptions of Kansas City, KS
Trends: 2000, 2014, and 2016
Source: ETC Institute DirectionFinder (2016 - Kansas City, KS/Wyandotte County)
37%
31%
47%
44%
30%
19%
Overall quality of life in Wyandotte County
Overall image of Wyandotte County
0% 20% 40% 60%
2016 2014 2000
by percentage of respondents who rated the item as a 4 or 5 on a 5-point scale (excluding “don't know”)
2016 Kansas City, KS/Wyandotte County Community Survey Final Report
ETC Institute (2016) Page 14

DEMOGRAPHICS
QD-1. Approximately how many years have you lived in Kansas City, KS or Wyandotte County?
5 or less9%
6 to 108%
11 to 156%
16 to 207%
21 to 3017%
31+51%
Not provided2%
Source: ETC Institute DirectionFinder (2016 - Kansas City, KS/Wyandotte County)
by percentage of respondents
2016 Kansas City, KS/Wyandotte County Community Survey Final Report
ETC Institute (2016) Page 15

QD-2. What is your age?by percentage of respondents
18-3419%
35-4420%
45-5420%
55-6421%
65+18%
Not provided2%
Source: ETC Institute DirectionFinder (2016 - Kansas City, KS/Wyandotte County)
Under age 57%
Ages 5-94%
Ages 10-147%
Ages 15-197%Ages 20-24
4%
Ages 25-3415%
Ages 35-4415%
Ages 45-5415%
Ages 55-6415%
Ages 65-747%
Ages 75+4%
QD-3. Counting yourself, how many people in your household are:
by percentage of persons in households
Source: ETC Institute DirectionFinder (2016 - Kansas City, KS/Wyandotte County)
2016 Kansas City, KS/Wyandotte County Community Survey Final Report
ETC Institute (2016) Page 16

QD-4. Do you own or rent your current residence?by percentage of respondents
Own68%
Rent32%
Source: ETC Institute DirectionFinder (2016 - Kansas City, KS/Wyandotte County)
QD-5. Are you or other members of your household of Hispanic or Latino ancestry?
by percentage of respondents
Yes23%
No77%
Source: ETC Institute DirectionFinder (2016 - Kansas City, KS/Wyandotte County)
2016 Kansas City, KS/Wyandotte County Community Survey Final Report
ETC Institute (2016) Page 17

66%
23%
3%
2%
6%
White
African American/Black
American Indian/Alaska Native
Asian, Hawaiian/Other Pacific Islander
Other
0% 20% 40% 60% 80%
QD-6. Which of the following best describes your race?by percentage of respondents (multiple selections could be made)
Source: ETC Institute DirectionFinder (2016 - Kansas City, KS/Wyandotte County)
Under $30K27%
$30K to $59,99931%
$60K to $99,99922%
$100K+13%
Not provided8%
QD7. Total Annual Household Incomeby percentage of respondents
Source: ETC Institute DirectionFinder (2016 - Kansas City, KS/Wyandotte County)
2016 Kansas City, KS/Wyandotte County Community Survey Final Report
ETC Institute (2016) Page 18

Male48%
Female51%
Not provided1%
QD-8. Demographics: Gender by percentage of respondents
Source: ETC Institute DirectionFinder (2016 - Kansas City, KS/Wyandotte County)
Council District of Respondentsby percentage of respondents
District 112.6%
District 212.5%
District 312.5%
District 412.5%
District 512.5%
District 612.4%
District 712.6%
District 812.5%
Source: ETC Institute DirectionFinder (2016 - Kansas City, KS/Wyandotte County)
2016 Kansas City, KS/Wyandotte County Community Survey Final Report
ETC Institute (2016) Page 19

Section 2:
Importance-Satisfaction
Analysis
2016 Kansas City, KS/Wyandotte County Community Survey Final Report
ETC Institute (2016) Page 20
Importance-Satisfaction Analysis Kansas City, KS/Wyandotte County
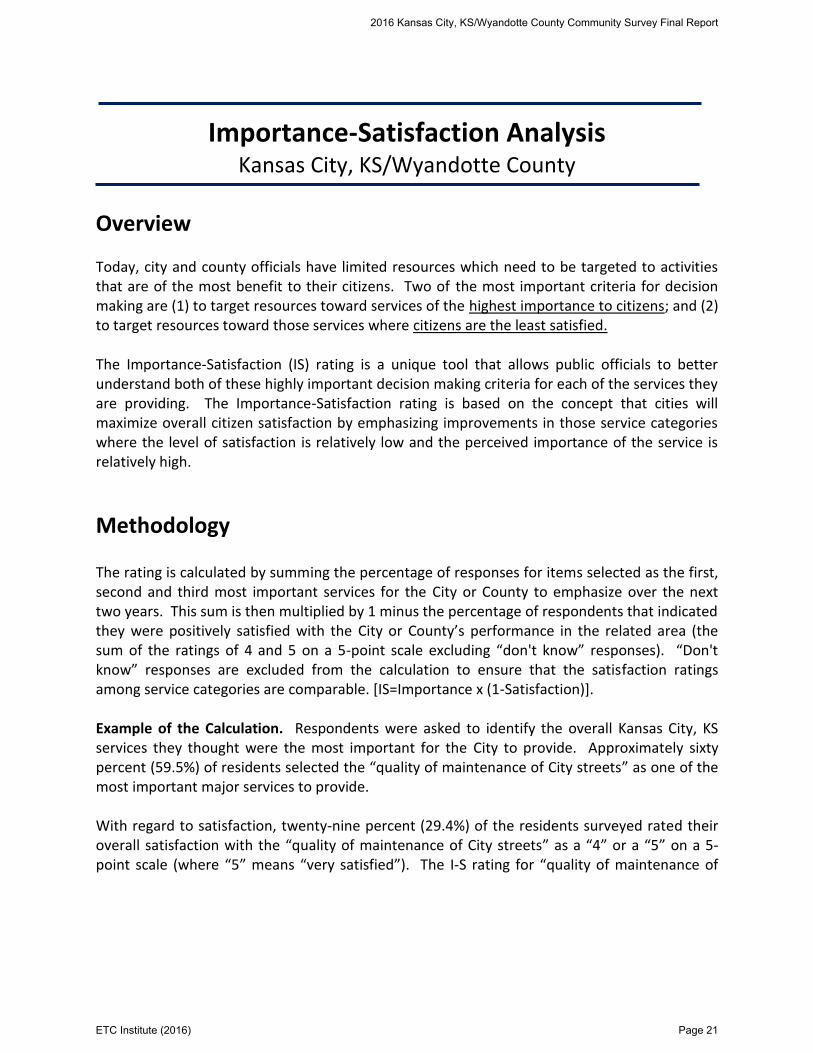
Overview Today, city and county officials have limited resources which need to be targeted to activities that are of the most benefit to their citizens. Two of the most important criteria for decision making are (1) to target resources toward services of the highest importance to citizens; and (2) to target resources toward those services where citizens are the least satisfied. The Importance-Satisfaction (IS) rating is a unique tool that allows public officials to better understand both of these highly important decision making criteria for each of the services they are providing. The Importance-Satisfaction rating is based on the concept that cities will maximize overall citizen satisfaction by emphasizing improvements in those service categories where the level of satisfaction is relatively low and the perceived importance of the service is relatively high.
Methodology
The rating is calculated by summing the percentage of responses for items selected as the first, second and third most important services for the City or County to emphasize over the next two years. This sum is then multiplied by 1 minus the percentage of respondents that indicated they were positively satisfied with the City or County’s performance in the related area (the sum of the ratings of 4 and 5 on a 5-point scale excluding “don't know” responses). “Don't know” responses are excluded from the calculation to ensure that the satisfaction ratings among service categories are comparable. [IS=Importance x (1-Satisfaction)]. Example of the Calculation. Respondents were asked to identify the overall Kansas City, KS services they thought were the most important for the City to provide. Approximately sixty percent (59.5%) of residents selected the “quality of maintenance of City streets” as one of the most important major services to provide. With regard to satisfaction, twenty-nine percent (29.4%) of the residents surveyed rated their overall satisfaction with the “quality of maintenance of City streets” as a “4” or a “5” on a 5-point scale (where “5” means “very satisfied”). The I-S rating for “quality of maintenance of
2016 Kansas City, KS/Wyandotte County Community Survey Final Report
ETC Institute (2016) Page 21

City streets” was calculated by multiplying the sum of the most important percentages by 1 minus the sum of the satisfaction percentages. In this example, 59.5% was multiplied by 29.4% (1-0.706). This calculation yielded an I-S rating of 0.4201, which ranked first out of fifteen major City services. The maximum rating is 1.00 and would be achieved when 100% of the respondents select an item as one of their top three choices to emphasize over the next two years and 0% indicates that they are positively satisfied with the delivery of the service. The lowest rating is 0.00 and could be achieved under either one of the following two situations:
if 100% of the respondents were positively satisfied with the delivery of the service
if none (0%) of the respondents selected the service as one of the three most important areas for the City to emphasize over the next two years.
Interpreting the Ratings Ratings that are greater than or equal to 0.20 identify areas that should receive significantly more emphasis over the next two years. Ratings from .10 to .20 identify service areas that should receive increased emphasis. Ratings less than .10 should continue to receive the current level of emphasis.
Definitely Increase Emphasis (IS>=0.20)
Increase Current Emphasis (0.10<=IS<0.20)
Maintain Current Emphasis (IS<0.10) The results for Kansas City, KS/Wyandotte County are provided on the following page.
2016 Kansas City, KS/Wyandotte County Community Survey Final Report
ETC Institute (2016) Page 22

Importance-Satisfaction Matrix Analysis
The Importance-Satisfaction rating is based on the concept that public agencies will maximize overall customer satisfaction by emphasizing improvements in those areas where the level of satisfaction is relatively low and the perceived importance of the service is relatively high. ETC Institute developed an Importance-Satisfaction Matrix to display the perceived importance of major services that were assessed on the survey against the perceived quality of service delivery. The two axes on the matrix represent Satisfaction (vertical) and relative Importance (horizontal).
The I-S (Importance-Satisfaction) matrix should be interpreted as follows.
Continued Emphasis (above average importance and above average satisfaction). This area shows where the City/County is meeting customer expectations. Items in this area have a significant impact on the customer’s overall level of satisfaction. The City/County should maintain (or slightly increase) emphasis on items in this area.
Exceeding Expectations (below average importance and above average satisfaction). This area shows where the City/County is performing significantly better than customers expect the City/County to perform. Items in this area do not significantly affect the overall level of satisfaction that residents have with City/County services. The City/County should maintain (or slightly decrease) emphasis on items in this area.
Opportunities for Improvement (above average importance and below average satisfaction). This area shows where the City/County is not performing as well as residents expect the City/County to perform. This area has a significant impact on customer satisfaction, and the City/County should DEFINITELY increase emphasis on items in this area.
Less Important (below average importance and below average satisfaction). This area shows where the City/County is not performing well relative to the City/County’s performance in other areas; however, this area is generally considered to be less important to residents. This area does not significantly affect overall satisfaction with City/County services because the items are less important to residents. The agency should maintain current levels of emphasis on items in this area.
Matrices showing the results for Kansas City, KS/Wyandotte County are provided on the following pages.
2016 Kansas City, KS/Wyandotte County Community Survey Final Report
ETC Institute (2016) Page 23

Satis
f act
ion
Rat
ing
!
!
!
!
!
!
!!!
!
!
!
!
!
!
me a
n sa
tisfa
c tio
n
Opportunities for Improvement
2016 Kansas City, KS/Wyandotte County Community SurveyImportance-Satisfaction Assessment Matrix
-City Services-(points on the graph show deviations from the mean importance and satisfaction ratings given by respondents to the survey)
mean importance
Importance RatingLower Importance Higher Importance
lower importance/higher satisfaction higher importance/higher satisfaction
lower importance/lower satisfaction higher importance/lower satisfaction
Exceeded Expectations
Less Important
Continued Emphasis
Source: ETC Institute (2016)
Municipal court
Maintenance of City streets
Communication with the public
Police services
Code enforcement
Parks & recreation facilities
Storm water runoff/management systemPublic transportation
Parks & recreation programsSewer utility system
Recycling
Planning & zoning
Fire services
Trash collection system
Ambulance services
2016 Kansas City, KS/Wyandotte County Community Survey Final Report
ETC Institute (2016) Page 24

Satis
f act
ion
Rat
ing
!!
!
!
!
!
!!
!!
!
!
!
!
!
me a
n sa
tisfa
c tio
n
Opportunities for Improvement
2016 Kansas City, KS/Wyandotte County Community SurveyImportance-Satisfaction Assessment Matrix
-Wyandotte County Services-(points on the graph show deviations from the mean importance and satisfaction ratings given by respondents to the survey)
mean importance
Importance RatingLower Importance Higher Importance
lower importance/higher satisfaction higher importance/higher satisfaction
lower importance/lower satisfaction higher importance/lower satisfaction
Exceeded Expectations
Less Important
Continued Emphasis
Source: ETC Institute (2016)
The District Attorneys' Office
Motor Vehicle Registration
County parks
Customer service
Area Agency on Aging Services
Public Health Department services
Services for developmental disabilitiesSenior transportation
County Appraiser's Office servicesAdult Jail/Juvenile Detention Center
Treasurer's Office
County Sheriff's office
Community elections
District Courts
The Election Office
2016 Kansas City, KS/Wyandotte County Community Survey Final Report
ETC Institute (2016) Page 25

!
!
!
!!
!
!
!
!
!
Satis
f act
ion
Rat
ing
me a
n sa
tisfa
c tio
n
Opportunities for Improvement
mean importance
Importance RatingLower Importance Higher Importance
lower importance/higher satisfaction higher importance/higher satisfaction
lower importance/lower satisfaction higher importance/lower satisfaction
Exceeded Expectations
Less Important
Continued Emphasis
2016 Kansas City, KS/Wyandotte County Community SurveyImportance-Satisfaction Assessment Matrix
-Public Safety-(points on the graph show deviations from the mean importance and satisfaction ratings given by respondents to the survey)
Source: ETC Institute (2016)
Fire department response time to fires
The city's overall efforts to prevent crime
Visibility of Building Inspection in your neighborhood
Quality of animal control in your neighborhood
Visibility of police in neighborhood retail areas
Visibility of police in neighborhoods
Police dept. response time to emergencies
Enforcement of traffic laws
Visibility of Code Enforcement in your neighborhood
Fire department response time to emergency calls
2016 Kansas City, KS/Wyandotte County Community Survey Final Report
ETC Institute (2016) Page 26

!
!
!
!
!
!!
Satis
f act
ion
Rat
ing
me a
n sa
tisfa
c tio
n
Opportunities for Improvement
mean importance
Importance RatingLower Importance Higher Importance
lower importance/higher satisfaction higher importance/higher satisfaction
lower importance/lower satisfaction higher importance/lower satisfaction
Exceeded Expectations
Less Important
Continued Emphasis
2016 Kansas City, KS/Wyandotte County Community SurveyImportance-Satisfaction Assessment Matrix
-City Codes and Ordinances-(points on the graph show deviations from the mean importance and satisfaction ratings given by respondents to the survey)
Source: ETC Institute (2064)
Enforcing clean-up of trash city-wide
Enforcing mowing and trimming city-wide
Enforcing clean-up of trash in your neighborhood
Mowing & trimming in your neighborhoodMaintenance of neighborhood residential property
Enforcing removal of inoperable or junk cars
Enforcing maintenance of business property
2016 Kansas City, KS/Wyandotte County Community Survey Final Report
ETC Institute (2016) Page 27

!
!
!!
!
!
!
!
!
!
!
!
!
Satis
f act
ion
Rat
ing
me a
n sa
tisfa
c tio
n
Opportunities for Improvement
mean importance
Importance RatingLower Importance Higher Importance
lower importance/higher satisfaction higher importance/higher satisfaction
lower importance/lower satisfaction higher importance/lower satisfaction
Exceeded Expectations
Less Important
Continued Emphasis
2016 Kansas City, KS/Wyandotte County Community SurveyImportance-Satisfaction Assessment Matrix
-City Maintenance-(points on the graph show deviations from the mean importance and satisfaction ratings given by respondents to the survey)
Source: ETC Institute (2016)
Maintenance of City buildings
Maintenance of streets in your neighborhood
Snow removal on neighborhood streets
Maintenance of major City streets
Maintenance of sidewalks in your neighborhood
Overall cleanliness of streets & other public areas
Maintenance of curbs in your neighborhood
Maintenance of stormwater system in your neighborhood
Maintenance of alleys in your neighborhood
Overall appearance of Downtown
Snow removal on major City streets
Maintenance of Downtown parking lots
Maintenance of street signs/traffic signals
2016 Kansas City, KS/Wyandotte County Community Survey Final Report
ETC Institute (2016) Page 28

Satis
f act
ion
Rat
ing
!
!
!
!!
!
!!!
!
!
!
me a
n sa
tisfa
c tio
n
Opportunities for Improvement
mean importance
Importance RatingLower Importance Higher Importance
lower importance/higher satisfaction higher importance/higher satisfaction
lower importance/lower satisfaction higher importance/lower satisfaction
Exceeded Expectations
Less Important
Continued Emphasis
2016 Kansas City, KS/Wyandotte County Community Survey Importance-Satisfaction Assessment Matrix
-Parks and Recreation-(points on the graph show deviations from the mean importance and satisfaction ratings given by respondents to the survey)
Source: ETC Institute (2016)
Sunflower Hills Golf Course
Number of walking & biking trails
Maintenance of parks & equipment
Youth recreation programs
Swimming pool & spray parks
The number of parks
Programs for seniors
Adult recreation programs
Fees charged for recreation programs
Number of outdoor athletic fields
Ease of registering for programs
Skate board parks
2016 Kansas City, KS/Wyandotte County Community Survey Final Report
ETC Institute (2016) Page 29

Importance-Satisfaction RatingKansas City, KS/Wyandotte County
City Services
Category of Service
Most
Important
%
Most
Important
Rank
Satisfaction
%
Satisfaction
Rank
Importance-
Satisfaction
Rating
I-S Rating
Rank
Very High Priority (IS > .20)
Quality of maintenance of City streets 63% 1 28% 16 0.4549 1
Quality of communication with public 32% 2 30% 15 0.2218 2
High Priority (IS .10-.20)
Quality of City Code Enforcement 26% 5 31% 13 0.1818 3
Quality of public transportation 22% 7 37% 12 0.1382 4
City's storm water runoff/management system 22% 6 38% 11 0.1374 5
Quality of City's parks & recreation facilities 24% 4 50% 6 0.1178 6
Quality of City's parks & recreation programs 18% 8 41% 10 0.1087 7
Quality of City Planning & Zoning 15% 9 30% 14 0.1050 8
Medium Priority (IS < .10)
Quality of City police services 30% 3 69% 4 0.0942 9
Quality of City's sewer utility 16% 11 45% 7 0.0857 10
Quality of recycling 15% 10 52% 5 0.0723 11
Quality of trash collection system 12% 13 70% 3 0.0366 12
Quality of Municipal Court 8% 16 35% 9 0.0518 13
Quality of ambulance services 10% 15 78% 2 0.0227 14
Quality of City fire services 14% 12 83% 1 0.0235 15
Note: The I-S Rating is calculated by multiplying the "Most Important" % by (1-'Satisfaction' %)
Most Important %: The "Most Important" percentage represents the sum of the first, second and third
most important responses for each item. Respondents were asked to identify
the items they thought should receive the most emphasis over the next two years.
Satisfaction %: The "Satisfaction" percentage represents the sum of the ratings "4" and "5" excluding 'don't knows.'
Respondents ranked their level of satisfaction with the each of the items on a scale
of 1 to 5 with "5" being very satisfied and "1" being very dissatisfied.
© 2016 DirectionFinder by ETC Institute
2016 Kansas City, KS/Wyandotte County Community Survey Final Report
ETC Institute (2016) Page 30

Importance-Satisfaction RatingKansas City, KS/Wyandotte County
Wyandotte County Services
Category of Service
Most
Important
%
Most
Important
Rank
Satisfaction
%
Satisfaction
Rank
Importance-
Satisfaction
Rating
I-S Rating
Rank
Very High Priority (IS > .20)
Quality of Motor Vehicle Registration 44% 1 38% 8 0.2706 1
High Priority (IS .10-.20)
Quality Aging Services 27% 5 32% 13 0.1815 2
Quality services for developmental disabilities 24% 6 28% 15 0.1742 3
Customer service received from County employees 27% 3 37% 9 0.1690 4
Public Health Department Services 24% 4 36% 10 0.1554 5
Senior Transportation 21% 7 29% 14 0.1502 6
Quality of Parks 28% 2 53% 2 0.1340 7
Quality of County Appraiser's Office services 17% 8 33% 12 0.1154 8
Medium Priority (IS < .10)
Adult Jail/Juevenile Detention Center 15% 9 35% 11 0.0948 9
Quality of Treasurers Office 13% 10 39% 6 0.0824 10
Quality of County Sheriff's Office 11% 11 51% 2 0.0535 11
Quality of Community Elections 10% 12 42% 3 0.0595 12
Quality of District Courts 9% 13 37% 7 0.0576 13
Quality of Election Office 7% 14 43% 4 0.0403 14
Quality of District Attorneys' Office 6% 15 37% 5 0.0379 15
Note: The I-S Rating is calculated by multiplying the "Most Important" % by (1-'Satisfaction' %)
Most Important %: The "Most Important" percentage represents the sum of the first, second and third
most important responses for each item. Respondents were asked to identify
the items they thought should receive the most emphasis over the next two years.
Satisfaction %: The "Satisfaction" percentage represents the sum of the ratings "4" and "5" excluding 'don't knows.'
Respondents ranked their level of satisfaction with the each of the items on a scale
of 1 to 5 with "5" being very satisfied and "1" being very dissatisfied.
© 2016 DirectionFinder by ETC Institute
2016 Kansas City, KS/Wyandotte County Community Survey Final Report
ETC Institute (2016) Page 31
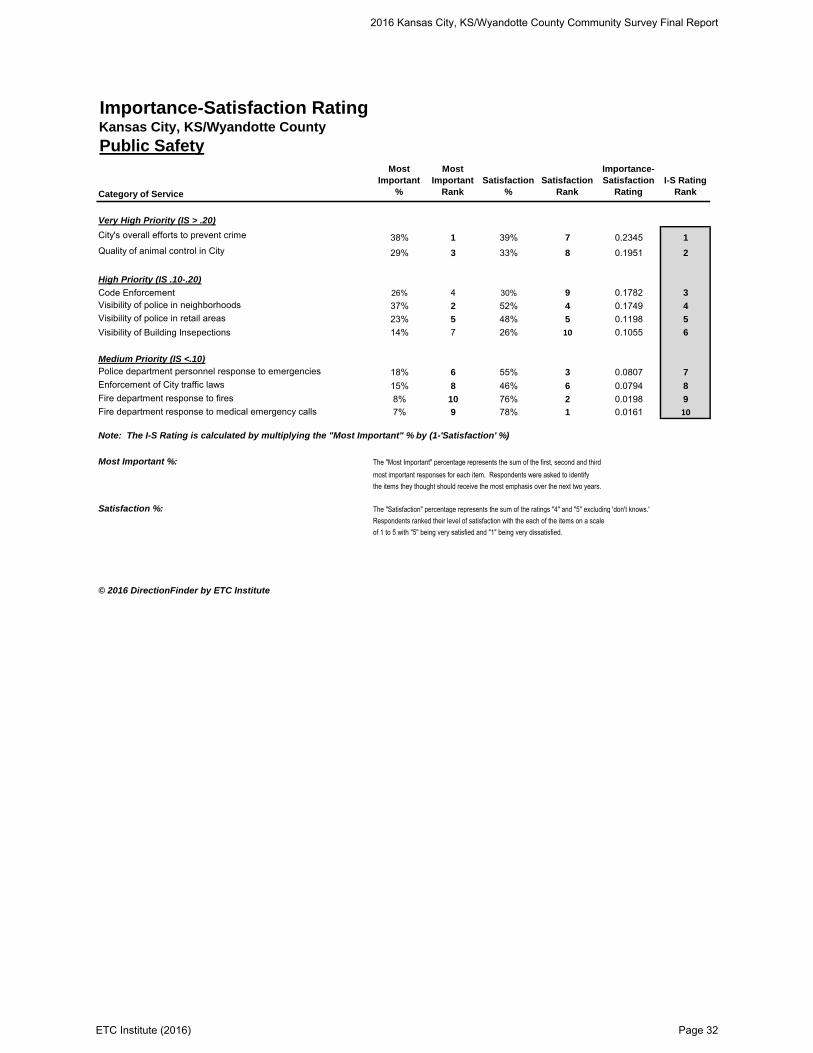
Importance-Satisfaction RatingKansas City, KS/Wyandotte County
Public Safety
Category of Service
Most
Important
%
Most
Important
Rank
Satisfaction
%
Satisfaction
Rank
Importance-
Satisfaction
Rating
I-S Rating
Rank
Very High Priority (IS > .20)
City's overall efforts to prevent crime 38% 1 39% 7 0.2345 1
Quality of animal control in City 29% 3 33% 8 0.1951 2
High Priority (IS .10-.20)
Code Enforcement 26% 4 30% 9 0.1782 3
Visibility of police in neighborhoods 37% 2 52% 4 0.1749 4
Visibility of police in retail areas 23% 5 48% 5 0.1198 5
Visibility of Building Insepections 14% 7 26% 10 0.1055 6
Medium Priority (IS <.10)
Police department personnel response to emergencies 18% 6 55% 3 0.0807 7
Enforcement of City traffic laws 15% 8 46% 6 0.0794 8
Fire department response to fires 8% 10 76% 2 0.0198 9
Fire department response to medical emergency calls 7% 9 78% 1 0.0161 10
Note: The I-S Rating is calculated by multiplying the "Most Important" % by (1-'Satisfaction' %)
Most Important %: The "Most Important" percentage represents the sum of the first, second and third
most important responses for each item. Respondents were asked to identify
the items they thought should receive the most emphasis over the next two years.
Satisfaction %: The "Satisfaction" percentage represents the sum of the ratings "4" and "5" excluding 'don't knows.'
Respondents ranked their level of satisfaction with the each of the items on a scale
of 1 to 5 with "5" being very satisfied and "1" being very dissatisfied.
© 2016 DirectionFinder by ETC Institute
2016 Kansas City, KS/Wyandotte County Community Survey Final Report
ETC Institute (2016) Page 32

Importance-Satisfaction RatingKansas City, KS/Wyandotte County
City Codes and Ordinances
Category of Service
Most
Important
%
Most
Important
Rank Satisfaction %
Satisfaction
Rank
Importance-
Satisfaction
Rating
I-S Rating
Rank
Very High Priority (IS > .20)
Enforcing the clean up of litter and desbris city-wide 47% 2 26% 7 0.3494 1
Mowing/Trimming on private and/or vacant property city-wide 40% 3 24% 8 0.3055 2
Enforcing the clean up of litter and desbris in neighborhood 37% 4 31% 4 0.2564 3
Mowing/trimming on private and/or vacant property in neighborhood 28% 5 28% 5 0.2016 4
5
High Priority (IS .10-.20)
Maintenance of neighborhood residential property 24% 6 33% 3 0.1632 5
Enforcing removal of inoperable or junk cars 21% 7 35% 1 0.1363 6
Enforcing maintenance of business property 17% 8 33% 2 0.1116 7
Medium Priority (IS <.10)
None
Note: The I-S Rating is calculated by multiplying the "Most Important" % by (1-'Satisfaction' %)
Most Important %: The "Most Important" percentage represents the sum of the first, second and third
most important responses for each item. Respondents were asked to identify
the items they thought should receive the most emphasis over the next two years.
Satisfaction %: The "Satisfaction" percentage represents the sum of the ratings "4" and "5" excluding 'don't knows.'
Respondents ranked their level of satisfaction with the each of the items on a scale
of 1 to 5 with "5" being very satisfied and "1" being very dissatisfied.
© 2016 DirectionFinder by ETC Institute
2016 Kansas City, KS/Wyandotte County Community Survey Final Report
ETC Institute (2016) Page 33

Importance-Satisfaction RatingKansas City, KS/Wyandotte County
City Maintenance
Category of Service
Most
Important
%
Most
Important
Rank
Satisfaction
%
Satisfaction
Rank
Importance-
Satisfaction
Rating
I-S Rating
Rank
Very High Priority (IS > .20)
Maintenance of streets in your neighborhood 43% 1 30% 7 0.2975 1
Maintenance of sidewalks 28% 3 20% 12 0.2235 2
High Priority (IS .10-.20)
Snow removal on neighborhood streets 30% 2 36% 6 0.1879 3
Maintenance of major City streets 29% 4 39% 3 0.1781 4
Overall cleanliness of streets & other public areas 24% 5 31% 9 0.1619 5
Maintenance of curbs in your neighborhood 18% 7 24% 11 0.1385 6
Maintenance of alleys 14% 8 16% 13 0.1154 7
Maintenance of stormwater drainage system 17% 6 34% 8 0.1110 8
Medium Priority (IS <.10)
Appearance of Downtown 11% 10 38% 5 0.0675 9
Maintenance of Downtown parking lots 7% 11 29% 10 0.0478 10
Snow removal on major City streets 10% 9 58% 1 0.0438 11
Maintenance of street signs/traffic signals 7% 12 49% 2 0.0334 12
Maintenance of City buildings 5% 13 41% 4 0.0302 13
Note: The I-S Rating is calculated by multiplying the "Most Important" % by (1-'Satisfaction' %)
Most Important %: The "Most Important" percentage represents the sum of the first, second and third
most important responses for each item. Respondents were asked to identify
the items they thought should receive the most emphasis over the next two years.
Satisfaction %: The "Satisfaction" percentage represents the sum of the ratings "4" and "5" excluding 'don't knows.'
Respondents ranked their level of satisfaction with the each of the items on a scale
of 1 to 5 with "5" being very satisfied and "1" being very dissatisfied.
© 2016 DirectionFinder by ETC Institute
2016 Kansas City, KS/Wyandotte County Community Survey Final Report
ETC Institute (2016) Page 34
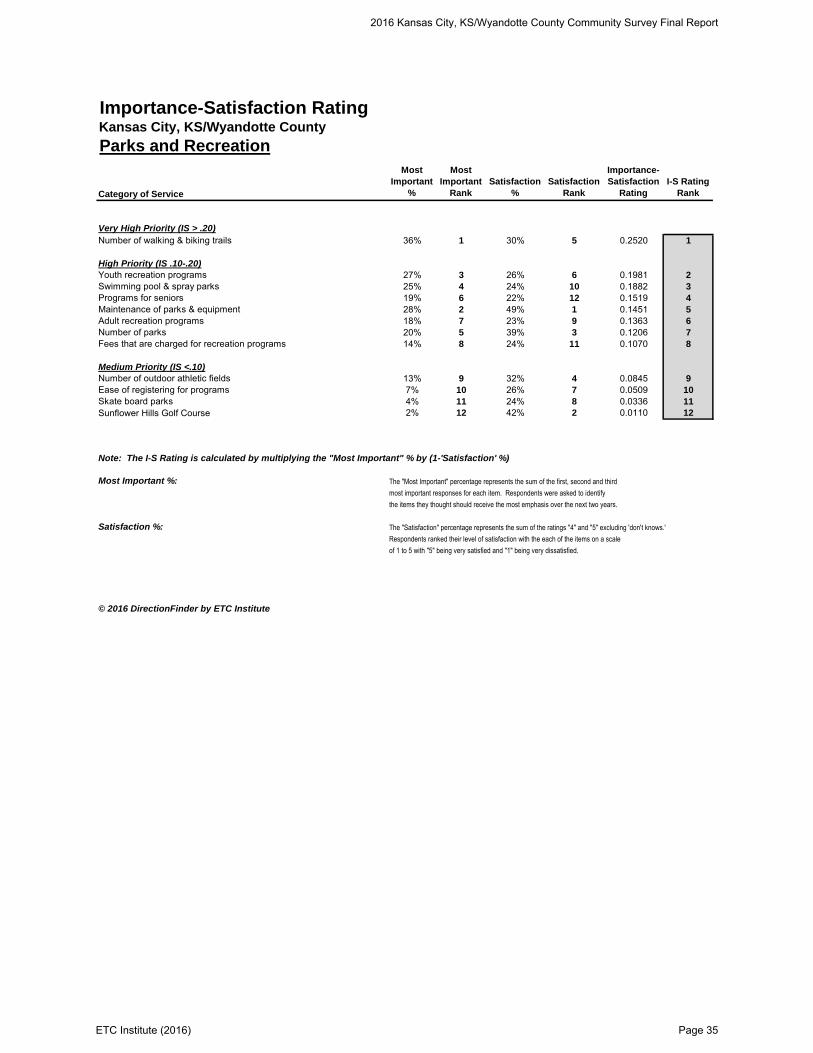
Importance-Satisfaction RatingKansas City, KS/Wyandotte County
Parks and Recreation
Category of Service
Most
Important
%
Most
Important
Rank
Satisfaction
%
Satisfaction
Rank
Importance-
Satisfaction
Rating
I-S Rating
Rank
Very High Priority (IS > .20)
Number of walking & biking trails 36% 1 30% 5 0.2520 1
High Priority (IS .10-.20)
Youth recreation programs 27% 3 26% 6 0.1981 2
Swimming pool & spray parks 25% 4 24% 10 0.1882 3
Programs for seniors 19% 6 22% 12 0.1519 4
Maintenance of parks & equipment 28% 2 49% 1 0.1451 5
Adult recreation programs 18% 7 23% 9 0.1363 6
Number of parks 20% 5 39% 3 0.1206 7
Fees that are charged for recreation programs 14% 8 24% 11 0.1070 8
Medium Priority (IS <.10)
Number of outdoor athletic fields 13% 9 32% 4 0.0845 9
Ease of registering for programs 7% 10 26% 7 0.0509 10
Skate board parks 4% 11 24% 8 0.0336 11
Sunflower Hills Golf Course 2% 12 42% 2 0.0110 12
Note: The I-S Rating is calculated by multiplying the "Most Important" % by (1-'Satisfaction' %)
Most Important %: The "Most Important" percentage represents the sum of the first, second and third
most important responses for each item. Respondents were asked to identify
the items they thought should receive the most emphasis over the next two years.
Satisfaction %: The "Satisfaction" percentage represents the sum of the ratings "4" and "5" excluding 'don't knows.'
Respondents ranked their level of satisfaction with the each of the items on a scale
of 1 to 5 with "5" being very satisfied and "1" being very dissatisfied.
© 2016 DirectionFinder by ETC Institute
2016 Kansas City, KS/Wyandotte County Community Survey Final Report
ETC Institute (2016) Page 35

Section 3:
Tabular Data
2016 Kansas City, KS/Wyandotte County Community Survey Final Report
ETC Institute (2016) Page 36

Tabular Data
Your District
DISTRICT Number Percent
District 1 399 12.6 %
District 2 396 12.5 %
District 3 397 12.5 %
District 4 398 12.5 %
District 5 398 12.5 %
District 6 395 12.4 %
District 7 399 12.6 %
District 8 393 12.4 %
Total 3175 100.0 %
2016 Kansas City, KS/Wyandotte County Community Survey Final Report
ETC Institute (2016) Page 37
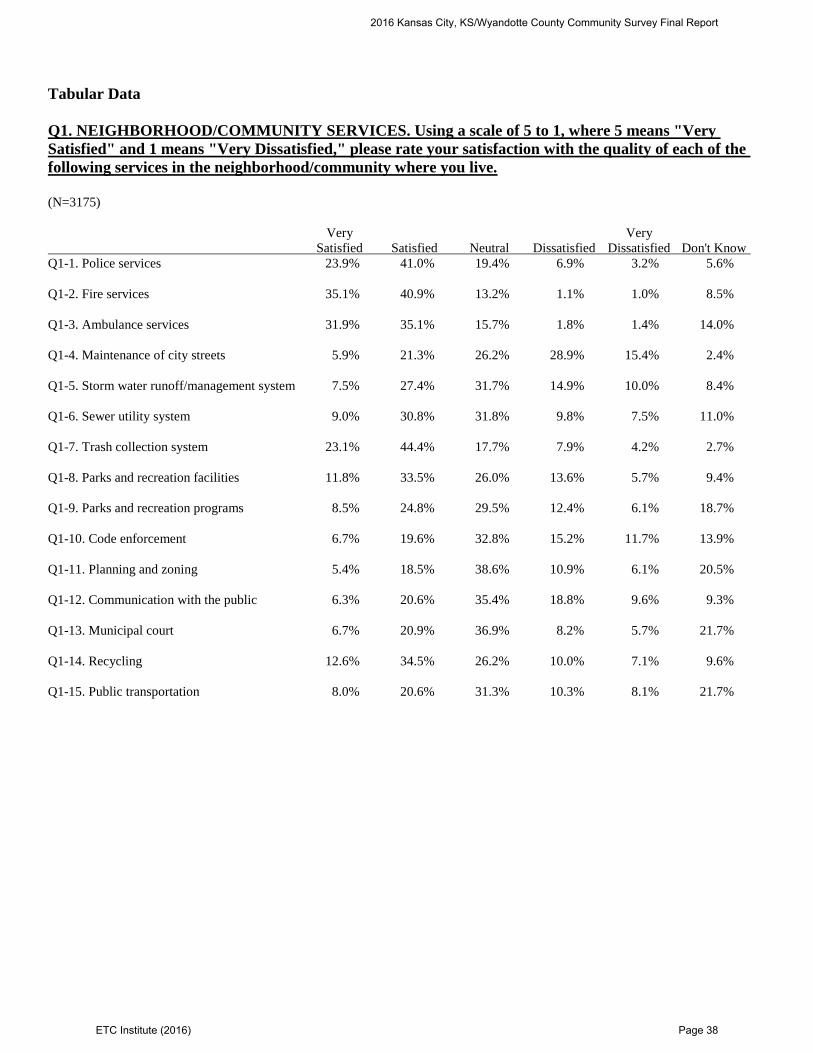
Tabular Data
Q1. NEIGHBORHOOD/COMMUNITY SERVICES. Using a scale of 5 to 1, where 5 means "Very
Satisfied" and 1 means "Very Dissatisfied," please rate your satisfaction with the quality of each of the
following services in the neighborhood/community where you live.
(N=3175)
Very Very
Satisfied Satisfied Neutral Dissatisfied Dissatisfied Don't Know
Q1-1. Police services 23.9% 41.0% 19.4% 6.9% 3.2% 5.6%
Q1-2. Fire services 35.1% 40.9% 13.2% 1.1% 1.0% 8.5%
Q1-3. Ambulance services 31.9% 35.1% 15.7% 1.8% 1.4% 14.0%
Q1-4. Maintenance of city streets 5.9% 21.3% 26.2% 28.9% 15.4% 2.4%
Q1-5. Storm water runoff/management system 7.5% 27.4% 31.7% 14.9% 10.0% 8.4%
Q1-6. Sewer utility system 9.0% 30.8% 31.8% 9.8% 7.5% 11.0%
Q1-7. Trash collection system 23.1% 44.4% 17.7% 7.9% 4.2% 2.7%
Q1-8. Parks and recreation facilities 11.8% 33.5% 26.0% 13.6% 5.7% 9.4%
Q1-9. Parks and recreation programs 8.5% 24.8% 29.5% 12.4% 6.1% 18.7%
Q1-10. Code enforcement 6.7% 19.6% 32.8% 15.2% 11.7% 13.9%
Q1-11. Planning and zoning 5.4% 18.5% 38.6% 10.9% 6.1% 20.5%
Q1-12. Communication with the public 6.3% 20.6% 35.4% 18.8% 9.6% 9.3%
Q1-13. Municipal court 6.7% 20.9% 36.9% 8.2% 5.7% 21.7%
Q1-14. Recycling 12.6% 34.5% 26.2% 10.0% 7.1% 9.6%
Q1-15. Public transportation 8.0% 20.6% 31.3% 10.3% 8.1% 21.7%
2016 Kansas City, KS/Wyandotte County Community Survey Final Report
ETC Institute (2016) Page 38
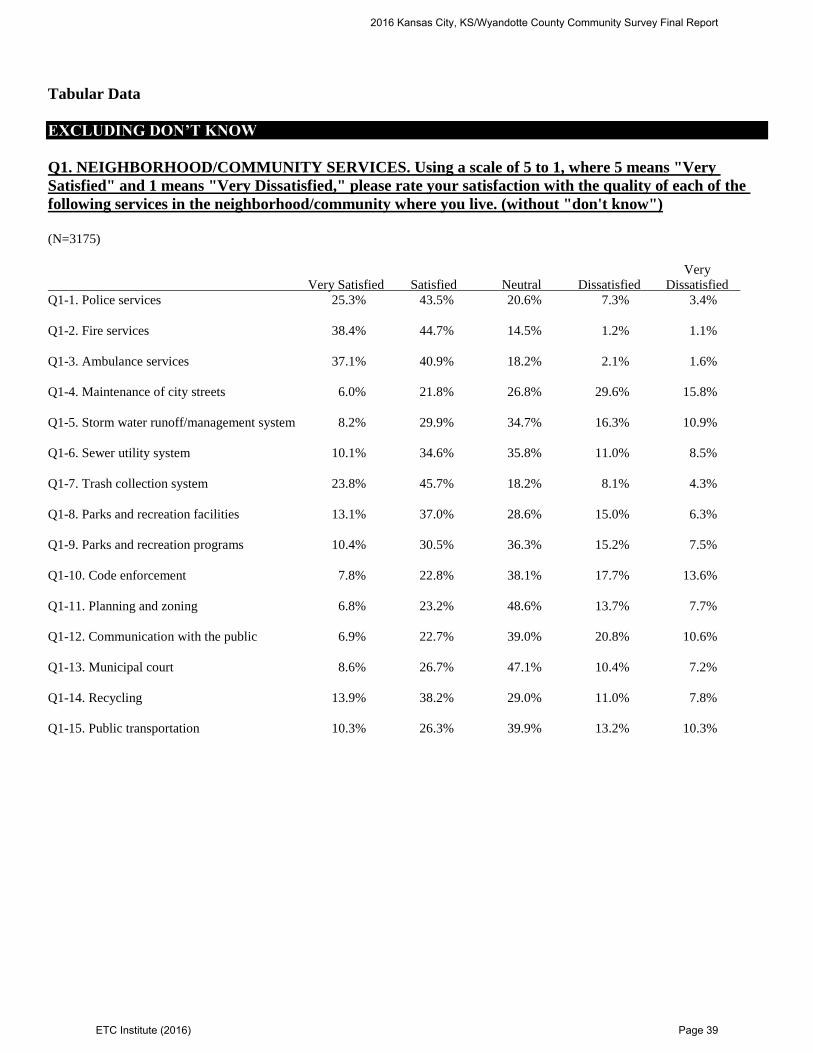
Tabular Data
EXCLUDING DON’T KNOW
Q1. NEIGHBORHOOD/COMMUNITY SERVICES. Using a scale of 5 to 1, where 5 means "Very
Satisfied" and 1 means "Very Dissatisfied," please rate your satisfaction with the quality of each of the
following services in the neighborhood/community where you live. (without "don't know")
(N=3175)
Very
Very Satisfied Satisfied Neutral Dissatisfied Dissatisfied
Q1-1. Police services 25.3% 43.5% 20.6% 7.3% 3.4%
Q1-2. Fire services 38.4% 44.7% 14.5% 1.2% 1.1%
Q1-3. Ambulance services 37.1% 40.9% 18.2% 2.1% 1.6%
Q1-4. Maintenance of city streets 6.0% 21.8% 26.8% 29.6% 15.8%
Q1-5. Storm water runoff/management system 8.2% 29.9% 34.7% 16.3% 10.9%
Q1-6. Sewer utility system 10.1% 34.6% 35.8% 11.0% 8.5%
Q1-7. Trash collection system 23.8% 45.7% 18.2% 8.1% 4.3%
Q1-8. Parks and recreation facilities 13.1% 37.0% 28.6% 15.0% 6.3%
Q1-9. Parks and recreation programs 10.4% 30.5% 36.3% 15.2% 7.5%
Q1-10. Code enforcement 7.8% 22.8% 38.1% 17.7% 13.6%
Q1-11. Planning and zoning 6.8% 23.2% 48.6% 13.7% 7.7%
Q1-12. Communication with the public 6.9% 22.7% 39.0% 20.8% 10.6%
Q1-13. Municipal court 8.6% 26.7% 47.1% 10.4% 7.2%
Q1-14. Recycling 13.9% 38.2% 29.0% 11.0% 7.8%
Q1-15. Public transportation 10.3% 26.3% 39.9% 13.2% 10.3%
2016 Kansas City, KS/Wyandotte County Community Survey Final Report
ETC Institute (2016) Page 39

Tabular Data
Q2. NEIGHBORHOOD/COMMUNITY PRIORITIES. Which FOUR of the services listed in Question 1
should receive the most emphasis for improvement in the neighborhood/community where you live over
the next TWO years?
Q2. Top choice Number Percent
Police services 504 15.9 %
Fire services 77 2.4 %
Ambulance services 29 0.9 %
Maintenance of City streets 935 29.4 %
Storm water runoff/management system 157 4.9 %
Sewer utility system 83 2.6 %
Trash collection system 57 1.8 %
Parks & recreation facilities 184 5.8 %
Parks & recreation programs 61 1.9 %
Code enforcement 236 7.4 %
Planning & zoning 54 1.7 %
Communication with the public 135 4.3 %
Municipal court 42 1.3 %
Recycling 75 2.4 %
Public transportation 165 5.2 %
None chosen 381 12.0 %
Total 3175 100.0 %
Q2. NEIGHBORHOOD/COMMUNITY PRIORITIES. Which FOUR of the services listed in Question 1
should receive the most emphasis for improvement in the neighborhood/community where you live over
the next TWO years?
Q2. 2nd choice Number Percent
Police services 195 6.1 %
Fire services 207 6.5 %
Ambulance services 77 2.4 %
Maintenance of City streets 471 14.8 %
Storm water runoff/management system 278 8.8 %
Sewer utility system 137 4.3 %
Trash collection system 116 3.7 %
Parks & recreation facilities 199 6.3 %
Parks & recreation programs 171 5.4 %
Code enforcement 190 6.0 %
Planning & zoning 121 3.8 %
Communication with the public 229 7.2 %
Municipal court 65 2.0 %
Recycling 104 3.3 %
Public transportation 129 4.1 %
None chosen 486 15.3 %
Total 3175 100.0 %
2016 Kansas City, KS/Wyandotte County Community Survey Final Report
ETC Institute (2016) Page 40

Tabular Data
Q2. NEIGHBORHOOD/COMMUNITY PRIORITIES. Which FOUR of the services listed in Question 1
should receive the most emphasis for improvement in the neighborhood/community where you live over
the next TWO years?
Q2. 3rd choice Number Percent
Police services 143 4.5 %
Fire services 88 2.8 %
Ambulance services 157 4.9 %
Maintenance of City streets 330 10.4 %
Storm water runoff/management system 152 4.8 %
Sewer utility system 146 4.6 %
Trash collection system 109 3.4 %
Parks & recreation facilities 190 6.0 %
Parks & recreation programs 171 5.4 %
Code enforcement 222 7.0 %
Planning & zoning 152 4.8 %
Communication with the public 300 9.4 %
Municipal court 68 2.1 %
Recycling 150 4.7 %
Public transportation 163 5.1 %
None chosen 634 20.0 %
Total 3175 100.0 %
Q2. NEIGHBORHOOD/COMMUNITY PRIORITIES. Which FOUR of the services listed in Question 1
should receive the most emphasis for improvement in the neighborhood/community where you live over
the next TWO years?
Q2. 4th choice Number Percent
Police services 117 3.7 %
Fire services 69 2.2 %
Ambulance services 68 2.1 %
Maintenance of City streets 268 8.4 %
Storm water runoff/management system 116 3.7 %
Sewer utility system 127 4.0 %
Trash collection system 99 3.1 %
Parks & recreation facilities 175 5.5 %
Parks & recreation programs 182 5.7 %
Code enforcement 184 5.8 %
Planning & zoning 150 4.7 %
Communication with the public 335 10.6 %
Municipal court 81 2.6 %
Recycling 149 4.7 %
Public transportation 235 7.4 %
None chosen 820 25.8 %
Total 3175 100.0 %
2016 Kansas City, KS/Wyandotte County Community Survey Final Report
ETC Institute (2016) Page 41

Tabular Data
SUM OF THE TOP CHOICES
Q2. NEIGHBORHOOD/COMMUNITY PRIORITIES. Which FOUR of the services listed in Question 1
should receive the most emphasis for improvement in the neighborhood/community where you live over
the next TWO years? (top 4)
Q2. Top choice Number Percent
Police services 959 30.2 %
Fire services 441 13.9 %
Ambulance services 331 10.4 %
Maintenance of City streets 2004 63.1 %
Storm water runoff/management system 703 22.1 %
Sewer utility system 493 15.5 %
Trash collection system 381 12.0 %
Parks & recreation facilities 748 23.6 %
Parks & recreation programs 585 18.4 %
Code enforcement 832 26.2 %
Planning & zoning 477 15.0 %
Communication with the public 999 31.5 %
Municipal court 256 8.1 %
Recycling 478 15.1 %
Public transportation 692 21.8 %
None chosen 381 12.0 %
Total 10760
2016 Kansas City, KS/Wyandotte County Community Survey Final Report
ETC Institute (2016) Page 42

Tabular Data
Q3. COUNTY LEVEL SERVICES. Using a scale of 5 to 1 where 5 means "Very Satisfied" and 1 means
"Very Dissatisfied," please rate your satisfaction with the quality of each of the following county level
services.
(N=3175)
Very Very
Satisfied Satisfied Neutral Dissatisfied Dissatisfied Don't Know
Q3-16. County Sheriff's office 10.1% 26.9% 29.8% 3.4% 2.6% 27.1%
Q3-17. Adult Jail/Juvenile Detention Center 5.2% 16.1% 31.7% 5.3% 3.2% 38.5%
Q3-18. Services for developmental disabilities 4.7% 13.4% 31.4% 10.3% 5.4% 34.8%
Q3-19. Area Agency on Aging Services 5.5% 15.6% 31.3% 10.0% 4.6% 33.0%
Q3-20. Senior transportation 5.2% 13.4% 31.6% 9.9% 4.3% 35.7%
Q3-21. District Courts 6.2% 20.4% 33.8% 6.6% 4.1% 29.0%
Q3-22. Treasurer's Office 6.8% 24.0% 33.3% 11.0% 5.0% 19.9%
Q3-23. Motor Vehicle Registration 8.3% 27.0% 22.3% 22.2% 13.7% 6.5%
Q3-24. County Appraiser's Office services 6.0% 19.9% 34.3% 12.6% 6.9% 20.4%
Q3-25. County parks (Wyandotte County
Park, Wyandotte County Lake, Pierson Park) 10.8% 34.9% 27.7% 9.7% 4.0% 12.9%
Q3-26. The District Attorneys' Office 6.9% 18.0% 34.4% 4.8% 3.6% 32.4%
Q3-27. The Election Office 8.3% 24.8% 35.3% 5.5% 2.5% 23.6%
Q3-28. Community elections 7.5% 25.5% 35.8% 6.7% 3.6% 21.0%
Q3-29. Customer service provided by Unified
Government employees 7.3% 23.8% 31.5% 12.2% 8.3% 17.0%
Q3-30. Public Health Department services 6.5% 18.1% 33.6% 7.2% 3.7% 30.9%
2016 Kansas City, KS/Wyandotte County Community Survey Final Report
ETC Institute (2016) Page 43

Tabular Data
EXCLUDING DON’T KNOW
Q3. COUNTY LEVEL SERVICES. Using a scale of 5 to 1 where 5 means "Very Satisfied" and 1 means
"Very Dissatisfied," please rate your satisfaction with the quality of each of the following county level
services. (without "don't know")
(N=3175)
Very
Very Satisfied Satisfied Neutral Dissatisfied Dissatisfied
Q3-16. County Sheriff's office 13.9% 37.0% 40.8% 4.7% 3.6%
Q3-17. Adult Jail/Juvenile Detention Center 8.4% 26.2% 51.6% 8.7% 5.2%
Q3-18. Services for developmental disabilities 7.1% 20.6% 48.2% 15.7% 8.3%
Q3-19. Area Agency on Aging Services 8.3% 23.2% 46.8% 14.9% 6.9%
Q3-20. Senior transportation 8.0% 20.8% 49.1% 15.3% 6.7%
Q3-21. District Courts 8.7% 28.7% 47.6% 9.2% 5.7%
Q3-22. Treasurer's Office 8.5% 30.0% 41.6% 13.7% 6.3%
Q3-23. Motor Vehicle Registration 8.9% 28.9% 23.9% 23.7% 14.6%
Q3-24. County Appraiser's Office services 7.5% 25.0% 43.1% 15.9% 8.6%
Q3-25. County parks (Wyandotte County
Park, Wyandotte County Lake, Pierson Park) 12.4% 40.1% 31.8% 11.1% 4.6%
Q3-26. The District Attorneys' Office 10.2% 26.6% 50.9% 7.1% 5.3%
Q3-27. The Election Office 10.8% 32.5% 46.2% 7.3% 3.3%
Q3-28. Community elections 9.5% 32.2% 45.3% 8.4% 4.5%
Q3-29. Customer service provided by Unified
Government employees 8.8% 28.6% 37.9% 14.7% 10.0%
Q3-30. Public Health Department services 9.3% 26.2% 48.7% 10.4% 5.3%
2016 Kansas City, KS/Wyandotte County Community Survey Final Report
ETC Institute (2016) Page 44

Tabular Data
Q4. COUNTY LEVEL PRIORITIES. Which FOUR of the county-level services listed in Question 3
should receive the most emphasis for improvement over the next TWO years?
Q4. Top choice Number Percent
County Sheriff's office 136 4.3 %
Adult Jail/Juvenile Detention Center 135 4.3 %
Services for developmental disabilities 281 8.9 %
Area Agency on Aging Services 236 7.4 %
Senior transportation 115 3.6 %
District Courts 63 2.0 %
Treasurer's Office 86 2.7 %
Motor Vehicle Registration 687 21.6 %
County Appraiser's Office services 111 3.5 %
County parks (Wyandotte County Park, Wyandotte County
Lake, Pierson Park) 247 7.8 %
The District Attorneys' Office 28 0.9 %
The Election Office 26 0.8 %
Community elections 44 1.4 %
Customer service provided by Unified Government employees 207 6.5 %
Public Health Department services 172 5.4 %
None chosen 601 18.9 %
Total 3175 100.0 %
Q4. COUNTY LEVEL PRIORITIES. Which FOUR of the county-level services listed in Question 3
should receive the most emphasis for improvement over the next TWO years?
Q4. 2nd choice Number Percent
County Sheriff's office 60 1.9 %
Adult Jail/Juvenile Detention Center 120 3.8 %
Services for developmental disabilities 181 5.7 %
Area Agency on Aging Services 250 7.9 %
Senior transportation 224 7.1 %
District Courts 84 2.6 %
Treasurer's Office 153 4.8 %
Motor Vehicle Registration 340 10.7 %
County Appraiser's Office services 173 5.4 %
County parks (Wyandotte County Park, Wyandotte County
Lake, Pierson Park) 243 7.7 %
The District Attorneys' Office 44 1.4 %
The Election Office 52 1.6 %
Community elections 75 2.4 %
Customer service provided by Unified Government employees 188 5.9 %
Public Health Department services 164 5.2 %
None chosen 824 26.0 %
Total 3175 100.0 %
2016 Kansas City, KS/Wyandotte County Community Survey Final Report
ETC Institute (2016) Page 45
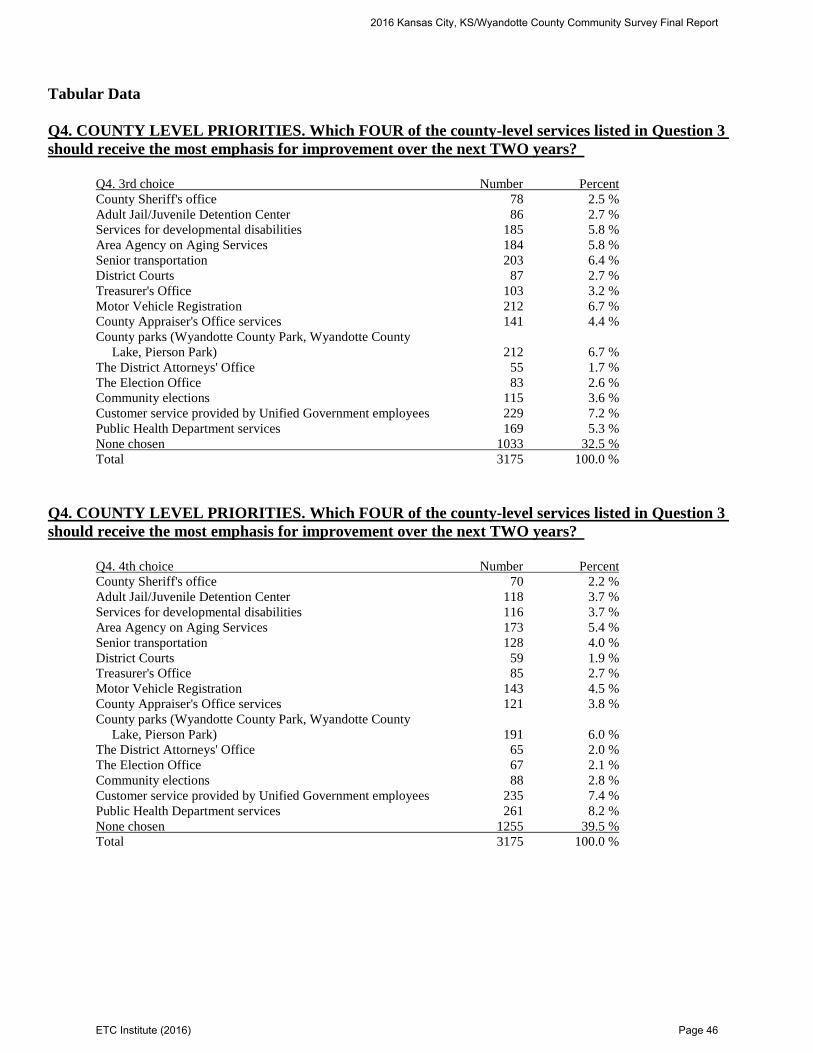
Tabular Data
Q4. COUNTY LEVEL PRIORITIES. Which FOUR of the county-level services listed in Question 3
should receive the most emphasis for improvement over the next TWO years?
Q4. 3rd choice Number Percent
County Sheriff's office 78 2.5 %
Adult Jail/Juvenile Detention Center 86 2.7 %
Services for developmental disabilities 185 5.8 %
Area Agency on Aging Services 184 5.8 %
Senior transportation 203 6.4 %
District Courts 87 2.7 %
Treasurer's Office 103 3.2 %
Motor Vehicle Registration 212 6.7 %
County Appraiser's Office services 141 4.4 %
County parks (Wyandotte County Park, Wyandotte County
Lake, Pierson Park) 212 6.7 %
The District Attorneys' Office 55 1.7 %
The Election Office 83 2.6 %
Community elections 115 3.6 %
Customer service provided by Unified Government employees 229 7.2 %
Public Health Department services 169 5.3 %
None chosen 1033 32.5 %
Total 3175 100.0 %
Q4. COUNTY LEVEL PRIORITIES. Which FOUR of the county-level services listed in Question 3
should receive the most emphasis for improvement over the next TWO years?
Q4. 4th choice Number Percent
County Sheriff's office 70 2.2 %
Adult Jail/Juvenile Detention Center 118 3.7 %
Services for developmental disabilities 116 3.7 %
Area Agency on Aging Services 173 5.4 %
Senior transportation 128 4.0 %
District Courts 59 1.9 %
Treasurer's Office 85 2.7 %
Motor Vehicle Registration 143 4.5 %
County Appraiser's Office services 121 3.8 %
County parks (Wyandotte County Park, Wyandotte County
Lake, Pierson Park) 191 6.0 %
The District Attorneys' Office 65 2.0 %
The Election Office 67 2.1 %
Community elections 88 2.8 %
Customer service provided by Unified Government employees 235 7.4 %
Public Health Department services 261 8.2 %
None chosen 1255 39.5 %
Total 3175 100.0 %
2016 Kansas City, KS/Wyandotte County Community Survey Final Report
ETC Institute (2016) Page 46

Tabular Data
SUM OF THE TOP CHOICES
Q4. COUNTY LEVEL PRIORITIES. Which FOUR of the county-level services listed in Question 3
should receive the most emphasis for improvement over the next TWO years? (top 4)
Q4. Top choice Number Percent
County Sheriff's office 344 10.8 %
Adult Jail/Juvenile Detention Center 459 14.5 %
Services for developmental disabilities 763 24.0 %
Area Agency on Aging Services 843 26.6 %
Senior transportation 670 21.1 %
District Courts 293 9.2 %
Treasurer's Office 427 13.4 %
Motor Vehicle Registration 1382 43.5 %
County Appraiser's Office services 546 17.2 %
County parks (Wyandotte County Park, Wyandotte County
Lake, Pierson Park) 893 28.1 %
The District Attorneys' Office 192 6.0 %
The Election Office 228 7.2 %
Community elections 322 10.1 %
Customer service provided by Unified Government employees 859 27.1 %
Public Health Department services 766 24.1 %
None chosen 601 18.9 %
Total 9588
2016 Kansas City, KS/Wyandotte County Community Survey Final Report
ETC Institute (2016) Page 47

Tabular Data
Q5. OVERALL PRIORITIES. Using the lists in Questions 1 and 3, which FOUR items do you think
should be the top overall priorities for the Unified Government over the next TWO years?
Q5. Top choice Number Percent
Police services 409 12.9 %
Fire services 83 2.6 %
Ambulance services 24 0.8 %
Maintenance of City streets 558 17.6 %
Storm water runoff/management system 92 2.9 %
Sewer utility system 56 1.8 %
Trash collection system 25 0.8 %
Parks & recreation facilities 86 2.7 %
Parks & recreation programs 36 1.1 %
Code enforcement 151 4.8 %
Planning & zoning 37 1.2 %
Communication with the public 76 2.4 %
Municipal court 15 0.5 %
Recycling 32 1.0 %
Public transportation 91 2.9 %
County Sheriff's office 40 1.3 %
Adult Jail/Juvenile Detention Center 46 1.4 %
Services for developmental disabilities 97 3.1 %
Area Agency on Aging Services 78 2.5 %
Senior transportation 35 1.1 %
District Courts 20 0.6 %
Treasurer's Office 31 1.0 %
Motor Vehicle Registration 197 6.2 %
County Appraiser's Office services 51 1.6 %
County parks (Wyandotte County Park, Wyandotte County
Lake, Pierson Park) 55 1.7 %
The District Attorneys' Office 20 0.6 %
The Election Office 10 0.3 %
Community elections 14 0.4 %
Customer service provided by Unified Government employees 71 2.2 %
Public Health Department services 67 2.1 %
None chosen 572 18.0 %
Total 3175 100.0 %
2016 Kansas City, KS/Wyandotte County Community Survey Final Report
ETC Institute (2016) Page 48

Tabular Data
Q5. OVERALL PRIORITIES. Using the lists in Questions 1 and 3, which FOUR items do you think
should be the top overall priorities for the Unified Government over the next TWO years?
Q5. 2nd choice Number Percent
Police services 118 3.7 %
Fire services 160 5.0 %
Ambulance services 54 1.7 %
Maintenance of City streets 314 9.9 %
Storm water runoff/management system 127 4.0 %
Sewer utility system 57 1.8 %
Trash collection system 45 1.4 %
Parks & recreation facilities 122 3.8 %
Parks & recreation programs 69 2.2 %
Code enforcement 126 4.0 %
Planning & zoning 62 2.0 %
Communication with the public 89 2.8 %
Municipal court 28 0.9 %
Recycling 57 1.8 %
Public transportation 64 2.0 %
County Sheriff's office 42 1.3 %
Adult Jail/Juvenile Detention Center 53 1.7 %
Services for developmental disabilities 86 2.7 %
Area Agency on Aging Services 101 3.2 %
Senior transportation 92 2.9 %
District Courts 33 1.0 %
Treasurer's Office 50 1.6 %
Motor Vehicle Registration 226 7.1 %
County Appraiser's Office services 56 1.8 %
County parks (Wyandotte County Park, Wyandotte County
Lake, Pierson Park) 80 2.5 %
The District Attorneys' Office 14 0.4 %
The Election Office 17 0.5 %
Community elections 18 0.6 %
Customer service provided by Unified Government employees 77 2.4 %
Public Health Department services 59 1.9 %
None chosen 679 21.4 %
Total 3175 100.0 %
2016 Kansas City, KS/Wyandotte County Community Survey Final Report
ETC Institute (2016) Page 49

Tabular Data
Q5. OVERALL PRIORITIES. Using the lists in Questions 1 and 3, which FOUR items do you think
should be the top overall priorities for the Unified Government over the next TWO years?
Q5. 3rd choice Number Percent
Police services 100 3.1 %
Fire services 53 1.7 %
Ambulance services 87 2.7 %
Maintenance of City streets 227 7.1 %
Storm water runoff/management system 67 2.1 %
Sewer utility system 55 1.7 %
Trash collection system 43 1.4 %
Parks & recreation facilities 100 3.1 %
Parks & recreation programs 70 2.2 %
Code enforcement 104 3.3 %
Planning & zoning 62 2.0 %
Communication with the public 112 3.5 %
Municipal court 24 0.8 %
Recycling 63 2.0 %
Public transportation 73 2.3 %
County Sheriff's office 43 1.4 %
Adult Jail/Juvenile Detention Center 78 2.5 %
Services for developmental disabilities 119 3.7 %
Area Agency on Aging Services 136 4.3 %
Senior transportation 78 2.5 %
District Courts 44 1.4 %
Treasurer's Office 44 1.4 %
Motor Vehicle Registration 208 6.6 %
County Appraiser's Office services 70 2.2 %
County parks (Wyandotte County Park, Wyandotte County
Lake, Pierson Park) 97 3.1 %
The District Attorneys' Office 21 0.7 %
The Election Office 19 0.6 %
Community elections 22 0.7 %
Customer service provided by Unified Government employees 88 2.8 %
Public Health Department services 86 2.7 %
None chosen 782 24.6 %
Total 3175 100.0 %
2016 Kansas City, KS/Wyandotte County Community Survey Final Report
ETC Institute (2016) Page 50

Tabular Data
Q5. OVERALL PRIORITIES. Using the lists in Questions 1 and 3, which FOUR items do you think
should be the top overall priorities for the Unified Government over the next TWO years?
Q5. 4th choice Number Percent
Police services 79 2.5 %
Fire services 41 1.3 %
Ambulance services 21 0.7 %
Maintenance of City streets 160 5.0 %
Storm water runoff/management system 49 1.5 %
Sewer utility system 37 1.2 %
Trash collection system 43 1.4 %
Parks & recreation facilities 70 2.2 %
Parks & recreation programs 67 2.1 %
Code enforcement 62 2.0 %
Planning & zoning 60 1.9 %
Communication with the public 105 3.3 %
Municipal court 31 1.0 %
Recycling 71 2.2 %
Public transportation 74 2.3 %
County Sheriff's office 36 1.1 %
Adult Jail/Juvenile Detention Center 71 2.2 %
Services for developmental disabilities 105 3.3 %
Area Agency on Aging Services 133 4.2 %
Senior transportation 102 3.2 %
District Courts 35 1.1 %
Treasurer's Office 48 1.5 %
Motor Vehicle Registration 167 5.3 %
County Appraiser's Office services 63 2.0 %
County parks (Wyandotte County Park, Wyandotte County
Lake, Pierson Park) 136 4.3 %
The District Attorneys' Office 33 1.0 %
The Election Office 29 0.9 %
Community elections 48 1.5 %
Customer service provided by Unified Government employees 144 4.5 %
Public Health Department services 120 3.8 %
None chosen 935 29.4 %
Total 3175 100.0 %
2016 Kansas City, KS/Wyandotte County Community Survey Final Report
ETC Institute (2016) Page 51

Tabular Data
SUM OF THE TOP CHOICES
Q5. OVERALL PRIORITIES. Using the lists in Questions 1 and 3, which FOUR items do you think
should be the top overall priorities for the Unified Government over the next TWO years? (top 4)
Q5. Top choice Number Percent
Police services 706 22.2 %
Fire services 337 10.6 %
Ambulance services 186 5.9 %
Maintenance of City streets 1259 39.7 %
Storm water runoff/management system 335 10.6 %
Sewer utility system 205 6.5 %
Trash collection system 156 4.9 %
Parks & recreation facilities 378 11.9 %
Parks & recreation programs 242 7.6 %
Code enforcement 443 14.0 %
Planning & zoning 221 7.0 %
Communication with the public 382 12.0 %
Municipal court 98 3.1 %
Recycling 223 7.0 %
Public transportation 302 9.5 %
County Sheriff's office 161 5.1 %
Adult Jail/Juvenile Detention Center 248 7.8 %
Services for developmental disabilities 407 12.8 %
Area Agency on Aging Services 448 14.1 %
Senior transportation 307 9.7 %
District Courts 132 4.2 %
Treasurer's Office 173 5.4 %
Motor Vehicle Registration 798 25.1 %
County Appraiser's Office services 240 7.6 %
County parks (Wyandotte County Park, Wyandotte County
Lake, Pierson Park) 368 11.6 %
The District Attorneys' Office 88 2.8 %
The Election Office 75 2.4 %
Community elections 102 3.2 %
Customer service provided by Unified Government employees 380 12.0 %
Public Health Department services 332 10.5 %
None chosen 572 18.0 %
Total 10304
2016 Kansas City, KS/Wyandotte County Community Survey Final Report
ETC Institute (2016) Page 52

Tabular Data
Q6. PUBLIC SAFETY. Please rate your satisfaction on a scale of 5 to 1, where 5 means "Very Satisfied"
and 1 means "Very Dissatisfied," with the following PUBLIC SAFETY services provided by your
government.
(N=3175)
Very Very
Satisfied Satisfied Neutral Dissatisfied Dissatisfied Don't Know
Q6-1. The visibility of police in
neighborhoods 13.8% 36.9% 23.9% 16.5% 6.0% 2.9%
Q6-2. The visibility of police in neighborhood
retail areas 11.4% 33.4% 29.0% 14.8% 5.0% 6.3%
Q6-3. The visibility of Code Enforcement in
your neighborhood 6.6% 19.9% 31.5% 18.5% 11.7% 11.7%
Q6-4. The visibility of Building Inspection in
your neighborhood 5.4% 14.8% 35.8% 13.8% 8.6% 21.7%
Q6-5. The city's overall efforts to prevent
crime 8.0% 28.0% 30.3% 17.9% 9.0% 6.7%
Q6-6. Enforcement of traffic laws 9.7% 33.2% 31.9% 12.3% 6.8% 6.0%
Q6-7. How quickly police department
personnel respond to emergencies 15.1% 32.8% 23.7% 8.9% 5.9% 13.6%
Q6-8. How quickly fire department responded
to fires 28.2% 35.5% 17.4% 1.4% 1.2% 16.5%
Q6-9. How quickly fire department responds
to medical emergency calls 31.0% 35.0% 15.9% 1.5% 1.1% 15.5%
Q6-10. Quality of animal control in your
neighborhood 8.9% 21.0% 27.8% 17.9% 16.3% 8.0%
2016 Kansas City, KS/Wyandotte County Community Survey Final Report
ETC Institute (2016) Page 53

Tabular Data
EXCLUDING DON’T KNOW
Q6. PUBLIC SAFETY. Please rate your satisfaction on a scale of 5 to 1, where 5 means "Very Satisfied"
and 1 means "Very Dissatisfied," with the following PUBLIC SAFETY services provided by your
government. (without "don't know")
(N=3175)
Very
Very Satisfied Satisfied Neutral Dissatisfied Dissatisfied
Q6-1. The visibility of police in
neighborhoods 14.2% 38.0% 24.6% 17.0% 6.2%
Q6-2. The visibility of police in neighborhood
retail areas 12.2% 35.7% 31.0% 15.8% 5.3%
Q6-3. The visibility of Code Enforcement in
your neighborhood 7.5% 22.6% 35.6% 20.9% 13.3%
Q6-4. The visibility of Building Inspection in
your neighborhood 6.8% 18.9% 45.7% 17.6% 10.9%
Q6-5. The city's overall efforts to prevent
crime 8.6% 30.0% 32.5% 19.2% 9.6%
Q6-6. Enforcement of traffic laws 10.3% 35.3% 34.0% 13.1% 7.2%
Q6-7. How quickly police department
personnel respond to emergencies 17.5% 37.9% 27.4% 10.3% 6.9%
Q6-8. How quickly fire department responded
to fires 33.7% 42.5% 20.8% 1.6% 1.4%
Q6-9. How quickly fire department responds
to medical emergency calls 36.6% 41.4% 18.8% 1.8% 1.3%
Q6-10. Quality of animal control in your
neighborhood 9.7% 22.8% 30.2% 19.5% 17.7%
2016 Kansas City, KS/Wyandotte County Community Survey Final Report
ETC Institute (2016) Page 54

Tabular Data
Q7. Which THREE of the public safety services from the list in Question 6 do you think should receive
the most emphasis from government leaders over the next TWO years?
Q7. Top choice Number Percent
The visibility of police in neighborhoods 694 21.9 %
The visibility of police in neighborhood retail areas 165 5.2 %
The visibility of Code Enforcement in your neighborhood 309 9.7 %
The visibility of Building Inspection in your neighborhood 104 3.3 %
The City's overall efforts to prevent crime 501 15.8 %
Enforcement of traffic laws 107 3.4 %
How quickly police department personnel respond to
emergencies 142 4.5 %
How quickly fire department responded to fires 53 1.7 %
How quickly fire department responds to medical emergency
calls 42 1.3 %
Quality of animal control in your neighborhood 331 10.4 %
None chosen 727 22.9 %
Total 3175 100.0 %
Q7. Which THREE of the public safety services from the list in Question 6 do you think should receive
the most emphasis from government leaders over the next TWO years?
Q7. 2nd choice Number Percent
The visibility of police in neighborhoods 268 8.4 %
The visibility of police in neighborhood retail areas 351 11.1 %
The visibility of Code Enforcement in your neighborhood 276 8.7 %
The visibility of Building Inspection in your neighborhood 197 6.2 %
The City's overall efforts to prevent crime 391 12.3 %
Enforcement of traffic laws 191 6.0 %
How quickly police department personnel respond to
emergencies 192 6.0 %
How quickly fire department responded to fires 96 3.0 %
How quickly fire department responds to medical emergency
calls 97 3.1 %
Quality of animal control in your neighborhood 232 7.3 %
None chosen 884 27.8 %
Total 3175 100.0 %
2016 Kansas City, KS/Wyandotte County Community Survey Final Report
ETC Institute (2016) Page 55

Tabular Data
Q7. Which THREE of the public safety services from the list in Question 6 do you think should receive
the most emphasis from government leaders over the next TWO years?
Q7. 3rd choice Number Percent
The visibility of police in neighborhoods 200 6.3 %
The visibility of police in neighborhood retail areas 212 6.7 %
The visibility of Code Enforcement in your neighborhood 227 7.1 %
The visibility of Building Inspection in your neighborhood 149 4.7 %
The City's overall efforts to prevent crime 321 10.1 %
Enforcement of traffic laws 166 5.2 %
How quickly police department personnel respond to
emergencies 242 7.6 %
How quickly fire department responded to fires 81 2.6 %
How quickly fire department responds to medical emergency
calls 125 3.9 %
Quality of animal control in your neighborhood 357 11.2 %
None chosen 1095 34.5 %
Total 3175 100.0 %
SUM OF THE TOP CHOICES
Q7. Which THREE of the public safety services from the list in Question 6 do you think should receive
the most emphasis from government leaders over the next TWO years? (top 3)
Q7. Top choice Number Percent
The visibility of police in neighborhoods 1162 36.6 %
The visibility of police in neighborhood retail areas 728 22.9 %
The visibility of Code Enforcement in your neighborhood 812 25.6 %
The visibility of Building Inspection in your neighborhood 450 14.2 %
The City's overall efforts to prevent crime 1213 38.2 %
Enforcement of traffic laws 464 14.6 %
How quickly police department personnel respond to
emergencies 576 18.1 %
How quickly fire department responded to fires 230 7.2 %
How quickly fire department responds to medical emergency
calls 264 8.3 %
Quality of animal control in your neighborhood 920 29.0 %
None chosen 727 22.9 %
Total 7546
2016 Kansas City, KS/Wyandotte County Community Survey Final Report
ETC Institute (2016) Page 56
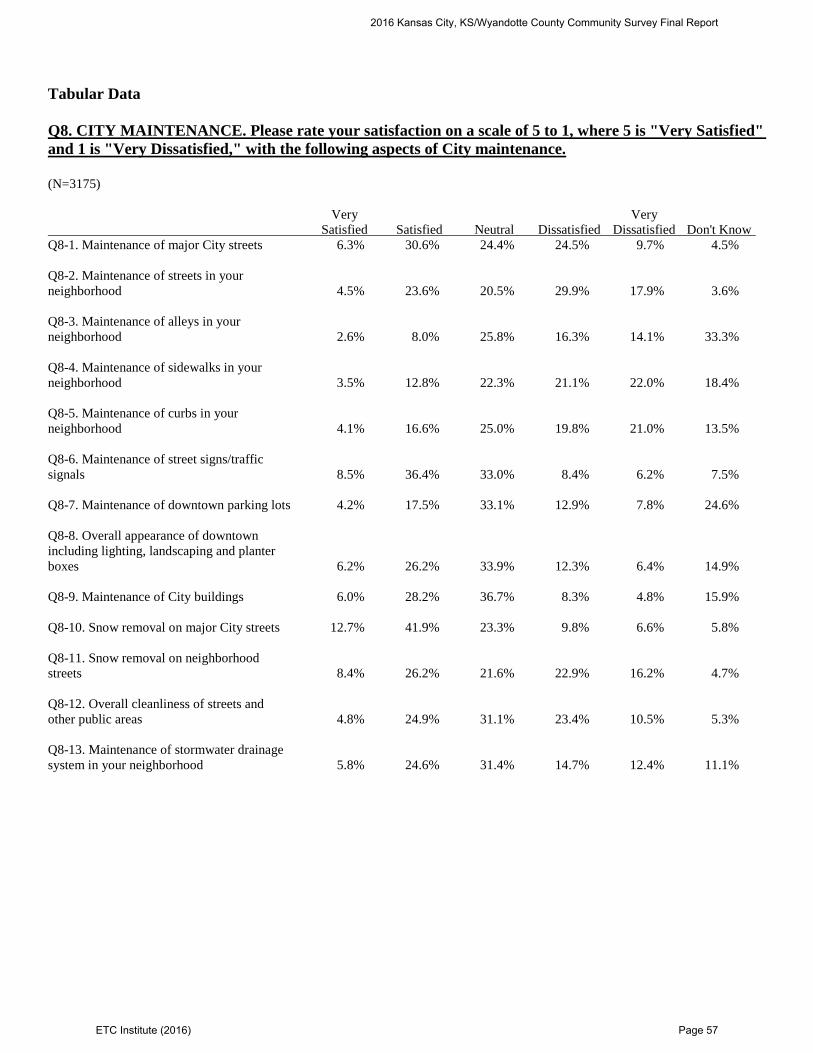
Tabular Data
Q8. CITY MAINTENANCE. Please rate your satisfaction on a scale of 5 to 1, where 5 is "Very Satisfied"
and 1 is "Very Dissatisfied," with the following aspects of City maintenance.
(N=3175)
Very Very
Satisfied Satisfied Neutral Dissatisfied Dissatisfied Don't Know
Q8-1. Maintenance of major City streets 6.3% 30.6% 24.4% 24.5% 9.7% 4.5%
Q8-2. Maintenance of streets in your
neighborhood 4.5% 23.6% 20.5% 29.9% 17.9% 3.6%
Q8-3. Maintenance of alleys in your
neighborhood 2.6% 8.0% 25.8% 16.3% 14.1% 33.3%
Q8-4. Maintenance of sidewalks in your
neighborhood 3.5% 12.8% 22.3% 21.1% 22.0% 18.4%
Q8-5. Maintenance of curbs in your
neighborhood 4.1% 16.6% 25.0% 19.8% 21.0% 13.5%
Q8-6. Maintenance of street signs/traffic
signals 8.5% 36.4% 33.0% 8.4% 6.2% 7.5%
Q8-7. Maintenance of downtown parking lots 4.2% 17.5% 33.1% 12.9% 7.8% 24.6%
Q8-8. Overall appearance of downtown
including lighting, landscaping and planter
boxes 6.2% 26.2% 33.9% 12.3% 6.4% 14.9%
Q8-9. Maintenance of City buildings 6.0% 28.2% 36.7% 8.3% 4.8% 15.9%
Q8-10. Snow removal on major City streets 12.7% 41.9% 23.3% 9.8% 6.6% 5.8%
Q8-11. Snow removal on neighborhood
streets 8.4% 26.2% 21.6% 22.9% 16.2% 4.7%
Q8-12. Overall cleanliness of streets and
other public areas 4.8% 24.9% 31.1% 23.4% 10.5% 5.3%
Q8-13. Maintenance of stormwater drainage
system in your neighborhood 5.8% 24.6% 31.4% 14.7% 12.4% 11.1%
2016 Kansas City, KS/Wyandotte County Community Survey Final Report
ETC Institute (2016) Page 57

Tabular Data
EXCLUDING DON’T KNOW
Q8. CITY MAINTENANCE. Please rate your satisfaction on a scale of 5 to 1, where 5 is "Very Satisfied"
and 1 is "Very Dissatisfied," with the following aspects of City maintenance. (without "don't know")
(N=3175)
Very
Very Satisfied Satisfied Neutral Dissatisfied Dissatisfied
Q8-1. Maintenance of major City streets 6.6% 32.0% 25.6% 25.6% 10.2%
Q8-2. Maintenance of streets in your
neighborhood 4.7% 24.5% 21.2% 31.0% 18.6%
Q8-3. Maintenance of alleys in your
neighborhood 3.8% 12.0% 38.6% 24.4% 21.1%
Q8-4. Maintenance of sidewalks in your
neighborhood 4.2% 15.7% 27.3% 25.8% 27.0%
Q8-5. Maintenance of curbs in your
neighborhood 4.7% 19.2% 28.9% 22.9% 24.3%
Q8-6. Maintenance of street signs/traffic
signals 9.2% 39.4% 35.6% 9.1% 6.7%
Q8-7. Maintenance of downtown parking lots 5.5% 23.1% 43.9% 17.2% 10.3%
Q8-8. Overall appearance of downtown
including lighting, landscaping and planter
boxes 7.3% 30.8% 39.8% 14.5% 7.5%
Q8-9. Maintenance of City buildings 7.2% 33.5% 43.7% 9.9% 5.7%
Q8-10. Snow removal on major City streets 13.4% 44.5% 24.7% 10.4% 7.0%
Q8-11. Snow removal on neighborhood
streets 8.9% 27.4% 22.7% 24.0% 17.0%
Q8-12. Overall cleanliness of streets and
other public areas 5.1% 26.3% 32.8% 24.7% 11.1%
Q8-13. Maintenance of stormwater drainage
system in your neighborhood 6.6% 27.7% 35.3% 16.6% 13.9%
2016 Kansas City, KS/Wyandotte County Community Survey Final Report
ETC Institute (2016) Page 58
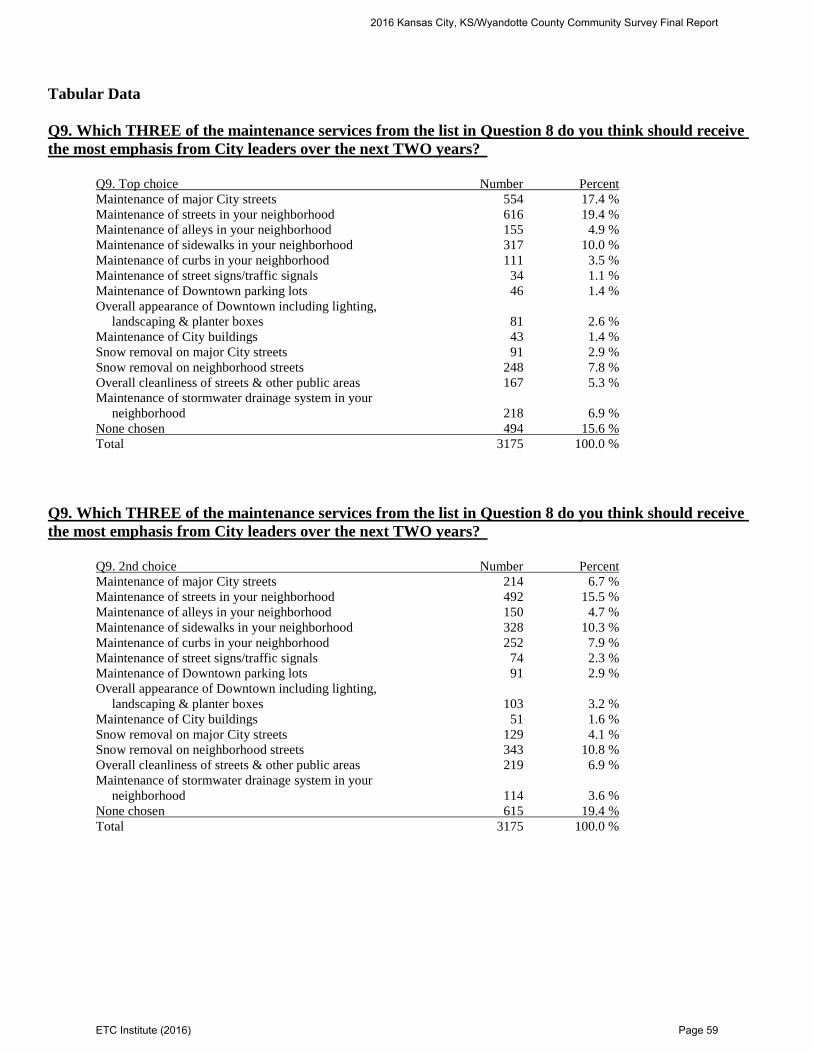
Tabular Data
Q9. Which THREE of the maintenance services from the list in Question 8 do you think should receive
the most emphasis from City leaders over the next TWO years?
Q9. Top choice Number Percent
Maintenance of major City streets 554 17.4 %
Maintenance of streets in your neighborhood 616 19.4 %
Maintenance of alleys in your neighborhood 155 4.9 %
Maintenance of sidewalks in your neighborhood 317 10.0 %
Maintenance of curbs in your neighborhood 111 3.5 %
Maintenance of street signs/traffic signals 34 1.1 %
Maintenance of Downtown parking lots 46 1.4 %
Overall appearance of Downtown including lighting,
landscaping & planter boxes 81 2.6 %
Maintenance of City buildings 43 1.4 %
Snow removal on major City streets 91 2.9 %
Snow removal on neighborhood streets 248 7.8 %
Overall cleanliness of streets & other public areas 167 5.3 %
Maintenance of stormwater drainage system in your
neighborhood 218 6.9 %
None chosen 494 15.6 %
Total 3175 100.0 %
Q9. Which THREE of the maintenance services from the list in Question 8 do you think should receive
the most emphasis from City leaders over the next TWO years?
Q9. 2nd choice Number Percent
Maintenance of major City streets 214 6.7 %
Maintenance of streets in your neighborhood 492 15.5 %
Maintenance of alleys in your neighborhood 150 4.7 %
Maintenance of sidewalks in your neighborhood 328 10.3 %
Maintenance of curbs in your neighborhood 252 7.9 %
Maintenance of street signs/traffic signals 74 2.3 %
Maintenance of Downtown parking lots 91 2.9 %
Overall appearance of Downtown including lighting,
landscaping & planter boxes 103 3.2 %
Maintenance of City buildings 51 1.6 %
Snow removal on major City streets 129 4.1 %
Snow removal on neighborhood streets 343 10.8 %
Overall cleanliness of streets & other public areas 219 6.9 %
Maintenance of stormwater drainage system in your
neighborhood 114 3.6 %
None chosen 615 19.4 %
Total 3175 100.0 %
2016 Kansas City, KS/Wyandotte County Community Survey Final Report
ETC Institute (2016) Page 59

Tabular Data
Q9. Which THREE of the maintenance services from the list in Question 8 do you think should receive
the most emphasis from City leaders over the next TWO years?
Q9. 3rd choice Number Percent
Maintenance of major City streets 157 4.9 %
Maintenance of streets in your neighborhood 240 7.6 %
Maintenance of alleys in your neighborhood 129 4.1 %
Maintenance of sidewalks in your neighborhood 240 7.6 %
Maintenance of curbs in your neighborhood 216 6.8 %
Maintenance of street signs/traffic signals 98 3.1 %
Maintenance of Downtown parking lots 75 2.4 %
Overall appearance of Downtown including lighting,
landscaping & planter boxes 162 5.1 %
Maintenance of City buildings 66 2.1 %
Snow removal on major City streets 107 3.4 %
Snow removal on neighborhood streets 346 10.9 %
Overall cleanliness of streets & other public areas 362 11.4 %
Maintenance of stormwater drainage system in your
neighborhood 202 6.4 %
None chosen 775 24.4 %
Total 3175 100.0 %
SUM OF THE TOP CHOICES
Q9. Which THREE of the maintenance services from the list in Question 8 do you think should receive
the most emphasis from City leaders over the next TWO years? (top 3)
Q9. Top choice Number Percent
Maintenance of major City streets 925 29.1 %
Maintenance of streets in your neighborhood 1348 42.5 %
Maintenance of alleys in your neighborhood 434 13.7 %
Maintenance of sidewalks in your neighborhood 885 27.9 %
Maintenance of curbs in your neighborhood 579 18.2 %
Maintenance of street signs/traffic signals 206 6.5 %
Maintenance of Downtown parking lots 212 6.7 %
Overall appearance of Downtown including lighting,
landscaping & planter boxes 346 10.9 %
Maintenance of City buildings 160 5.0 %
Snow removal on major City streets 327 10.3 %
Snow removal on neighborhood streets 937 29.5 %
Overall cleanliness of streets & other public areas 748 23.6 %
Maintenance of stormwater drainage system in your
neighborhood 534 16.8 %
None chosen 494 15.6 %
Total 8135
2016 Kansas City, KS/Wyandotte County Community Survey Final Report
ETC Institute (2016) Page 60

Tabular Data
Q10. ENFORCEMENT OF CODES AND ORDINANCES IN YOUR CITY. Please rate your satisfaction
on a scale of 5 to 1, where 5 means "Very Satisfied" and 1 means "Very Dissatisfied," with the following
aspects of codes and ordinances.
(N=3175)
Very Very
Satisfied Satisfied Neutral Dissatisfied Dissatisfied Don't Know
Q10-1. Enforcing the clean-up of junk, trash &
debris (blight), city-wide 4.5% 19.0% 26.5% 27.7% 14.7% 7.6%
Q10-2. Enforcing the clean-up of junk, trash &
debris (blight), in your neighborhood 5.6% 23.5% 25.9% 23.8% 15.1% 6.1%
Q10-3. Enforcing the mowing and trimming of
weeds on private and/or vacant property,
city-wide 3.8% 18.3% 27.0% 26.9% 15.9% 8.1%
Q10-4. Enforcing the mowing and trimming of
weeds on private and/or vacant property, in
your neighborhood 4.9% 21.1% 26.0% 24.7% 16.1% 7.1%
Q10-5. Enforcing the maintenance of
residential property (houses) in your
neighborhood 6.0% 24.7% 29.7% 19.6% 12.7% 7.2%
Q10-6. Enforcing the maintenance of
business property 4.7% 23.8% 37.7% 12.6% 7.2% 14.1%
Q10-7. Enforcing the removal of inoperable or
junk cars in your neighborhood 6.2% 24.6% 29.7% 15.8% 12.3% 11.4%
2016 Kansas City, KS/Wyandotte County Community Survey Final Report
ETC Institute (2016) Page 61

Tabular Data
EXCLUDING DON’T KNOW
Q10. ENFORCEMENT OF CODES AND ORDINANCES IN YOUR CITY. Please rate your satisfaction
on a scale of 5 to 1, where 5 means "Very Satisfied" and 1 means "Very Dissatisfied," with the following
aspects of codes and ordinances. (without "don't know")
(N=3175)
Very
Very Satisfied Satisfied Neutral Dissatisfied Dissatisfied
Q10-1. Enforcing the clean-up of junk, trash &
debris (blight), city-wide 4.9% 20.6% 28.7% 29.9% 15.9%
Q10-2. Enforcing the clean-up of junk, trash &
debris (blight), in your neighborhood 5.9% 25.0% 27.6% 25.3% 16.1%
Q10-3. Enforcing the mowing and trimming of
weeds on private and/or vacant property,
city-wide 4.1% 19.9% 29.4% 29.2% 17.3%
Q10-4. Enforcing the mowing and trimming of
weeds on private and/or vacant property, in
your neighborhood 5.3% 22.7% 28.0% 26.6% 17.4%
Q10-5. Enforcing the maintenance of
residential property (houses) in your
neighborhood 6.5% 26.6% 32.1% 21.1% 13.7%
Q10-6. Enforcing the maintenance of
business property 5.5% 27.7% 43.8% 14.7% 8.3%
Q10-7. Enforcing the removal of inoperable or
junk cars in your neighborhood 7.0% 27.8% 33.6% 17.8% 13.9%
2016 Kansas City, KS/Wyandotte County Community Survey Final Report
ETC Institute (2016) Page 62
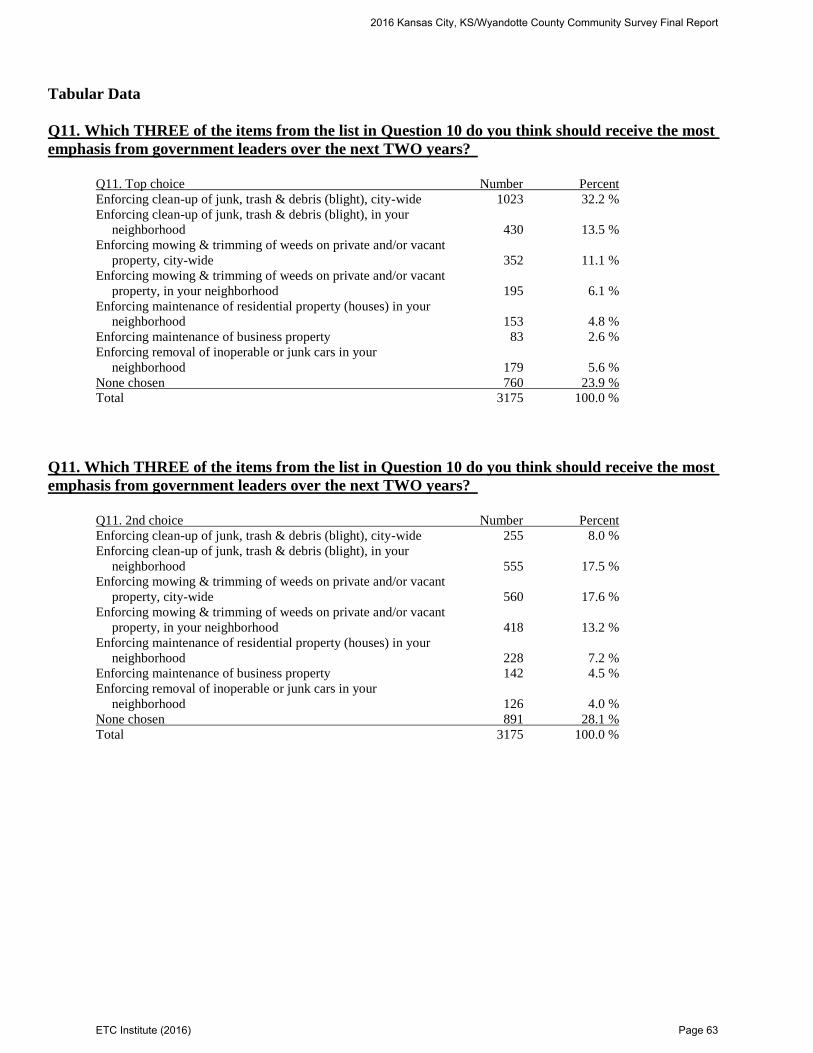
Tabular Data
Q11. Which THREE of the items from the list in Question 10 do you think should receive the most
emphasis from government leaders over the next TWO years?
Q11. Top choice Number Percent
Enforcing clean-up of junk, trash & debris (blight), city-wide 1023 32.2 %
Enforcing clean-up of junk, trash & debris (blight), in your
neighborhood 430 13.5 %
Enforcing mowing & trimming of weeds on private and/or vacant
property, city-wide 352 11.1 %
Enforcing mowing & trimming of weeds on private and/or vacant
property, in your neighborhood 195 6.1 %
Enforcing maintenance of residential property (houses) in your
neighborhood 153 4.8 %
Enforcing maintenance of business property 83 2.6 %
Enforcing removal of inoperable or junk cars in your
neighborhood 179 5.6 %
None chosen 760 23.9 %
Total 3175 100.0 %
Q11. Which THREE of the items from the list in Question 10 do you think should receive the most
emphasis from government leaders over the next TWO years?
Q11. 2nd choice Number Percent
Enforcing clean-up of junk, trash & debris (blight), city-wide 255 8.0 %
Enforcing clean-up of junk, trash & debris (blight), in your
neighborhood 555 17.5 %
Enforcing mowing & trimming of weeds on private and/or vacant
property, city-wide 560 17.6 %
Enforcing mowing & trimming of weeds on private and/or vacant
property, in your neighborhood 418 13.2 %
Enforcing maintenance of residential property (houses) in your
neighborhood 228 7.2 %
Enforcing maintenance of business property 142 4.5 %
Enforcing removal of inoperable or junk cars in your
neighborhood 126 4.0 %
None chosen 891 28.1 %
Total 3175 100.0 %
2016 Kansas City, KS/Wyandotte County Community Survey Final Report
ETC Institute (2016) Page 63

Tabular Data
Q11. Which THREE of the items from the list in Question 10 do you think should receive the most
emphasis from government leaders over the next TWO years?
Q11. 3rd choice Number Percent
Enforcing clean-up of junk, trash & debris (blight), city-wide 212 6.7 %
Enforcing clean-up of junk, trash & debris (blight), in your
neighborhood 195 6.1 %
Enforcing mowing & trimming of weeds on private and/or vacant
property, city-wide 365 11.5 %
Enforcing mowing & trimming of weeds on private and/or vacant
property, in your neighborhood 275 8.7 %
Enforcing maintenance of residential property (houses) in your
neighborhood 393 12.4 %
Enforcing maintenance of business property 304 9.6 %
Enforcing removal of inoperable or junk cars in your
neighborhood 359 11.3 %
None chosen 1072 33.8 %
Total 3175 100.0 %
SUM OF THE TOP CHOICES
Q11. Which THREE of the items from the list in Question 10 do you think should receive the most
emphasis from government leaders over the next TWO years? (top 3)
Q11. Top choice Number Percent
Enforcing clean-up of junk, trash & debris (blight), city-wide 1490 46.9 %
Enforcing clean-up of junk, trash & debris (blight), in your
neighborhood 1180 37.2 %
Enforcing mowing & trimming of weeds on private and/or vacant
property, city-wide 1277 40.2 %
Enforcing mowing & trimming of weeds on private and/or vacant
property, in your neighborhood 888 28.0 %
Enforcing maintenance of residential property (houses) in your
neighborhood 774 24.4 %
Enforcing maintenance of business property 529 16.7 %
Enforcing removal of inoperable or junk cars in your
neighborhood 664 20.9 %
None chosen 760 23.9 %
Total 7562
2016 Kansas City, KS/Wyandotte County Community Survey Final Report
ETC Institute (2016) Page 64

Tabular Data
Q12. PARKS AND RECREATION. Please rate your satisfaction on a scale of 5 to 1, where 5 means
"Very Satisfied" and 1 means "Very Dissatisfied," with the following parks and recreation facilities and
services.
(N=3175)
Very Very
Satisfied Satisfied Neutral Dissatisfied Dissatisfied Don't Know
Q12-1. Maintenance of parks & equipment 8.7% 32.2% 27.6% 11.2% 3.9% 16.2%
Q12-2. Number of walking and biking trails 6.1% 19.2% 23.1% 23.1% 13.2% 15.3%
Q12-3. The number of parks 7.4% 26.8% 29.5% 16.3% 7.4% 12.6%
Q12-4. Number of outdoor athletic fields 5.8% 20.6% 30.2% 17.1% 7.5% 18.8%
Q12-5. Sunflower Hills Golf Course 7.0% 17.7% 29.5% 2.4% 2.0% 41.5%
Q12-6. Swimming pool & spray parks 4.9% 13.5% 25.2% 18.2% 13.3% 24.9%
Q12-7. Youth recreation programs 4.6% 13.7% 25.5% 17.5% 9.6% 29.0%
Q12-8. Adult recreation programs 4.0% 12.3% 27.7% 17.2% 9.3% 29.6%
Q12-9. Programs for seniors 3.7% 10.2% 27.3% 14.7% 8.6% 35.4%
Q12-10. Ease of registering for programs 4.1% 12.7% 30.5% 10.1% 6.6% 36.0%
Q12-11. Skate board parks 4.3% 9.6% 31.1% 8.1% 5.9% 41.0%
Q12-12. Fees charged for recreation programs 3.8% 11.5% 30.1% 10.7% 8.7% 35.2%
2016 Kansas City, KS/Wyandotte County Community Survey Final Report
ETC Institute (2016) Page 65

Tabular Data
EXCLUDING DON’T KNOW
Q12. PARKS AND RECREATION. Please rate your satisfaction on a scale of 5 to 1, where 5 means
"Very Satisfied" and 1 means "Very Dissatisfied," with the following parks and recreation facilities and
services. (without "don't know")
(N=3175)
Very
Very Satisfied Satisfied Neutral Dissatisfied Dissatisfied
Q12-1. Maintenance of parks & equipment 10.4% 38.5% 33.0% 13.4% 4.7%
Q12-2. Number of walking and biking trails 7.2% 22.6% 27.3% 27.3% 15.6%
Q12-3. The number of parks 8.4% 30.7% 33.7% 18.6% 8.5%
Q12-4. Number of outdoor athletic fields 7.1% 25.3% 37.3% 21.1% 9.2%
Q12-5. Sunflower Hills Golf Course 11.9% 30.2% 50.3% 4.1% 3.4%
Q12-6. Swimming pool & spray parks 6.5% 17.9% 33.5% 24.3% 17.7%
Q12-7. Youth recreation programs 6.4% 19.4% 36.0% 24.7% 13.6%
Q12-8. Adult recreation programs 5.6% 17.4% 39.3% 24.4% 13.2%
Q12-9. Programs for seniors 5.8% 15.9% 42.3% 22.7% 13.4%
Q12-10. Ease of registering for programs 6.4% 19.9% 47.7% 15.7% 10.2%
Q12-11. Skate board parks 7.4% 16.2% 52.6% 13.7% 10.0%
Q12-12. Fees charged for recreation programs 5.8% 17.8% 46.5% 16.6% 13.4%
2016 Kansas City, KS/Wyandotte County Community Survey Final Report
ETC Institute (2016) Page 66
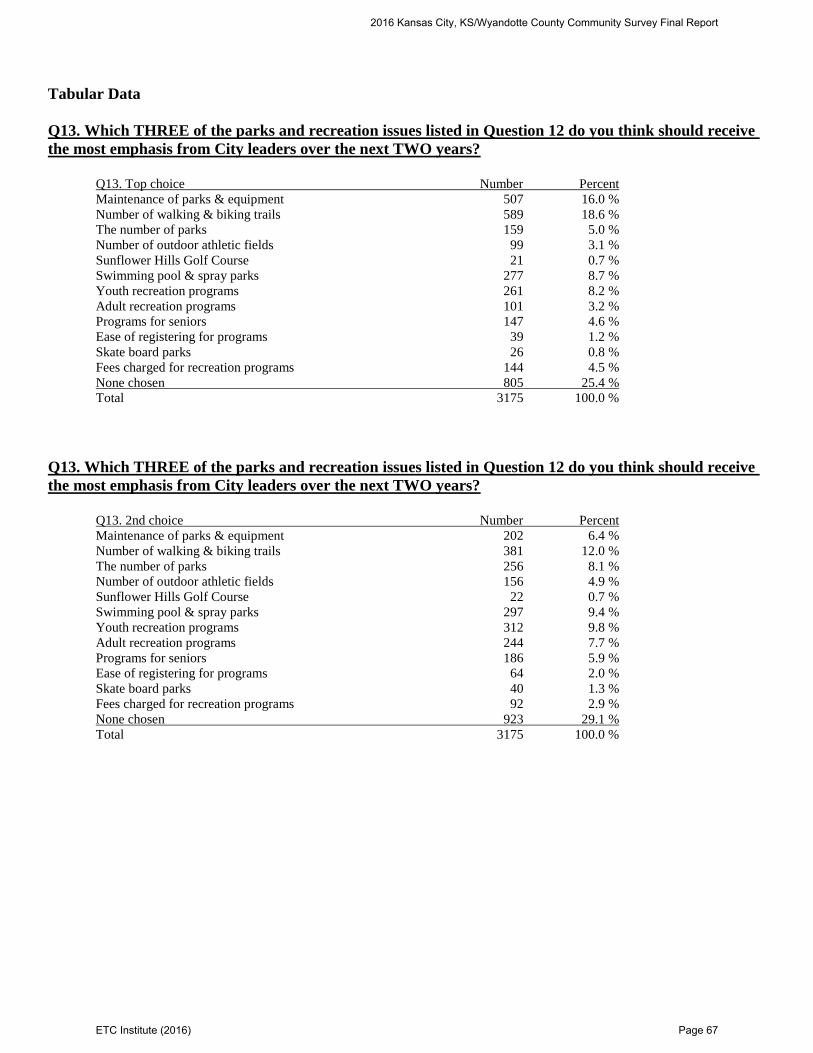
Tabular Data
Q13. Which THREE of the parks and recreation issues listed in Question 12 do you think should receive
the most emphasis from City leaders over the next TWO years?
Q13. Top choice Number Percent
Maintenance of parks & equipment 507 16.0 %
Number of walking & biking trails 589 18.6 %
The number of parks 159 5.0 %
Number of outdoor athletic fields 99 3.1 %
Sunflower Hills Golf Course 21 0.7 %
Swimming pool & spray parks 277 8.7 %
Youth recreation programs 261 8.2 %
Adult recreation programs 101 3.2 %
Programs for seniors 147 4.6 %
Ease of registering for programs 39 1.2 %
Skate board parks 26 0.8 %
Fees charged for recreation programs 144 4.5 %
None chosen 805 25.4 %
Total 3175 100.0 %
Q13. Which THREE of the parks and recreation issues listed in Question 12 do you think should receive
the most emphasis from City leaders over the next TWO years?
Q13. 2nd choice Number Percent
Maintenance of parks & equipment 202 6.4 %
Number of walking & biking trails 381 12.0 %
The number of parks 256 8.1 %
Number of outdoor athletic fields 156 4.9 %
Sunflower Hills Golf Course 22 0.7 %
Swimming pool & spray parks 297 9.4 %
Youth recreation programs 312 9.8 %
Adult recreation programs 244 7.7 %
Programs for seniors 186 5.9 %
Ease of registering for programs 64 2.0 %
Skate board parks 40 1.3 %
Fees charged for recreation programs 92 2.9 %
None chosen 923 29.1 %
Total 3175 100.0 %
2016 Kansas City, KS/Wyandotte County Community Survey Final Report
ETC Institute (2016) Page 67

Tabular Data
Q13. Which THREE of the parks and recreation issues listed in Question 12 do you think should receive
the most emphasis from City leaders over the next TWO years?
Q13. 3rd choice Number Percent
Maintenance of parks & equipment 190 6.0 %
Number of walking & biking trails 167 5.3 %
The number of parks 213 6.7 %
Number of outdoor athletic fields 142 4.5 %
Sunflower Hills Golf Course 16 0.5 %
Swimming pool & spray parks 217 6.8 %
Youth recreation programs 275 8.7 %
Adult recreation programs 215 6.8 %
Programs for seniors 281 8.9 %
Ease of registering for programs 116 3.7 %
Skate board parks 73 2.3 %
Fees charged for recreation programs 209 6.6 %
None chosen 1061 33.4 %
Total 3175 100.0 %
SUM OF THE TOP CHOICES
Q13. Which THREE of the parks and recreation issues listed in Question 12 do you think should receive
the most emphasis from City leaders over the next TWO years? (top 3)
Q13. Top choice Number Percent
Maintenance of parks & equipment 899 28.3 %
Number of walking & biking trails 1137 35.8 %
The number of parks 628 19.8 %
Number of outdoor athletic fields 397 12.5 %
Sunflower Hills Golf Course 59 1.9 %
Swimming pool & spray parks 791 24.9 %
Youth recreation programs 848 26.7 %
Adult recreation programs 560 17.6 %
Programs for seniors 614 19.3 %
Ease of registering for programs 219 6.9 %
Skate board parks 139 4.4 %
Fees charged for recreation programs 445 14.0 %
None chosen 805 25.4 %
Total 7541
2016 Kansas City, KS/Wyandotte County Community Survey Final Report
ETC Institute (2016) Page 68

Tabular Data
Q14. Beginning in 2017, the Unified Government will begin receiving approximately $12 million annually
from Village West sales tax revenues. Please indicate which THREE of the items listed below should be
the top priorities to fund with the sales tax revenue.
Q14. Top choice Number Percent
Aging Services 358 11.3 %
Code Enforcement 153 4.8 %
Demolitions of Residential/Commercial Properties 213 6.7 %
Fire Services 144 4.5 %
Mowing Vacant Lots 88 2.8 %
Park Improvements 202 6.4 %
Police Services 375 11.8 %
Personal Property (Auto) Registration at Courthouse or Annex 153 4.8 %
Property Tax Relief 865 27.2 %
Snow Removal Plowing & Treatment 77 2.4 %
Street Resurfacing 261 8.2 %
Other 134 4.2 %
None chosen 152 4.8 %
Total 3175 100.0 %
Q14. Beginning in 2017, the Unified Government will begin receiving approximately $12 million annually
from Village West sales tax revenues. Please indicate which THREE of the items listed below should be
the top priorities to fund with the sales tax revenue.
Q14. 2nd choice Number Percent
Aging Services 154 4.9 %
Code Enforcement 128 4.0 %
Demolitions of Residential/Commercial Properties 246 7.7 %
Fire Services 194 6.1 %
Mowing Vacant Lots 172 5.4 %
Park Improvements 278 8.8 %
Police Services 372 11.7 %
Personal Property (Auto) Registration at Courthouse or Annex 264 8.3 %
Property Tax Relief 388 12.2 %
Snow Removal Plowing & Treatment 206 6.5 %
Street Resurfacing 460 14.5 %
Other 69 2.2 %
None chosen 244 7.7 %
Total 3175 100.0 %
2016 Kansas City, KS/Wyandotte County Community Survey Final Report
ETC Institute (2016) Page 69

Tabular Data
Q14. Beginning in 2017, the Unified Government will begin receiving approximately $12 million annually
from Village West sales tax revenues. Please indicate which THREE of the items listed below should be
the top priorities to fund with the sales tax revenue.
Q14. 3rd choice Number Percent
Aging Services 215 6.8 %
Code Enforcement 138 4.3 %
Demolitions of Residential/Commercial Properties 258 8.1 %
Fire Services 105 3.3 %
Mowing Vacant Lots 164 5.2 %
Park Improvements 238 7.5 %
Police Services 293 9.2 %
Personal Property (Auto) Registration at Courthouse or Annex 200 6.3 %
Property Tax Relief 358 11.3 %
Snow Removal Plowing & Treatment 237 7.5 %
Street Resurfacing 500 15.7 %
Other 123 3.9 %
None chosen 346 10.9 %
Total 3175 100.0 %
SUM OF THE TOP CHOICES
Q14. Beginning in 2017, the Unified Government will begin receiving approximately $12 million annually
from Village West sales tax revenues. Please indicate which THREE of the items listed below should be
the top priorities to fund with the sales tax revenue. (top 3)
Q14. Top choice Number Percent
Aging Services 727 22.9 %
Code Enforcement 419 13.2 %
Demolitions of Residential/Commercial Properties 717 22.6 %
Fire Services 443 14.0 %
Mowing Vacant Lots 424 13.4 %
Park Improvements 718 22.6 %
Police Services 1040 32.8 %
Personal Property (Auto) Registration at Courthouse or Annex 617 19.4 %
Property Tax Relief 1611 50.7 %
Snow Removal Plowing & Treatment 520 16.4 %
Street Resurfacing 1221 38.5 %
Other 326 10.3 %
None chosen 152 4.8 %
Total 8935
2016 Kansas City, KS/Wyandotte County Community Survey Final Report
ETC Institute (2016) Page 70

Tabular Data
Q14. Other
Q14. Other Number Percent
sidewalks 21 6.7 %
sidewalks & curbs 18 5.7 %
schools 12 3.8 %
curbs 7 2.2 %
swimming pools 6 1.9 %
education 5 1.6 %
neighborhood sidewalks 5 1.6 %
lower sales tax 4 1.3 %
lower property taxes 4 1.3 %
lower taxes 3 1.0 %
alleys 3 1.0 %
public transportation 3 1.0 %
youth recreation programs 3 1.0 %
recycling program 2 0.6 %
bike trails 2 0.6 %
This is a survey about what the city wants, not what we want. 2 0.6 %
stormwater runoff 2 0.6 %
youth services 2 0.6 %
mental health services 2 0.6 %
Neighborhood sidewalks and curbs 2 0.6 %
animal control 2 0.6 %
add curbs on neighborhood streets 2 0.6 %
sidewalks & stormwater 2 0.6 %
bike paths 2 0.6 %
programs for seniors 2 0.6 %
New Fire Station 2 0.6 %
gun range 2 0.6 %
Spring pick up 2 0.6 %
neighborhood streets, sidewalks & curbs 2 0.6 %
Waste water runoff improvements 1 0.3 %
youth/adult programs 1 0.3 %
public education 1 0.3 %
more paved walk/bike trails 1 0.3 %
grocery stores 1 0.3 %
neglected properties (Quivera Hills Estates) 1 0.3 %
Planning of more upscale residential neighborhoods 1 0.3 %
personal raise 1 0.3 %
roadside/streetside garbage cleanup 1 0.3 %
Leavenworth Road 1 0.3 %
bring back operation brightside 1 0.3 %
Tax relief for senior citizens 1 0.3 %
utilities, water service 1 0.3 %
put the money in the bank 1 0.3 %
raises for non union employees 1 0.3 %
youth programs/swimming pool 1 0.3 %
creeks with erosion 1 0.3 %
BPU is exempt from fed & state income taxes as well as local
property taxes 1 0.3 %
Inner city curbs & sidewalks 1 0.3 %
clean up junk/trash in neighborhoods 1 0.3 %
sidewalk replacement 1 0.3 %
food for elderly 1 0.3 %
2016 Kansas City, KS/Wyandotte County Community Survey Final Report
ETC Institute (2016) Page 71

Tabular Data
Q14. Other
Q14. Other Number Percent
keep businesses going, build job opportunities 1 0.3 %
Animal HUMANE Society and Trap, Neuter, and Release
program 1 0.3 %
We need more youth recreation programs 1 0.3 %
remarking streets in Wyandotte County (yellow & white lines) 1 0.3 %
redo Leavenworth Road west of 435 1 0.3 %
sewers in areas that don't have them 1 0.3 %
activity for youths 1 0.3 %
curbs & Sidewalks on residential streets 1 0.3 %
New Turner High School Stadium 1 0.3 %
another NO-kill animal shelter further south & east 1 0.3 %
more Sheriff officers 1 0.3 %
evaluating BPU 1 0.3 %
election office parking lot 1 0.3 %
Maintenance of neighborhood alleys & clean up wooded areas 1 0.3 %
property 1 0.3 %
property tax relief 1 0.3 %
new sidewalks for old neighborhoods 1 0.3 %
Youth related programs 1 0.3 %
grocery store in NE area 1 0.3 %
funding for schools 1 0.3 %
police acting on Protection from Abuse orders 1 0.3 %
too many old buildings with poor maintenance 1 0.3 %
sewer for north Edwardsville 1 0.3 %
street lights on 42nd St 1 0.3 %
more boat slips at Wyandotte County Lake 1 0.3 %
fixing neighborhood sidewalks 1 0.3 %
reserve funds 1 0.3 %
Sheriff's office 1 0.3 %
help homeless 1 0.3 %
improve schools so housing values will grow 1 0.3 %
homeless resources 1 0.3 %
cleaning alleys & fixing potholes 1 0.3 %
sidewalks, street lights, curbs 1 0.3 %
no sales tax on food purchased 1 0.3 %
Wyandotte County Lake Park 1 0.3 %
tax relief 1 0.3 %
more grants for resident student education 1 0.3 %
Help low income individuals with house repairs 1 0.3 %
fund balance 1 0.3 %
sidewalks & street lights in Armourdale 1 0.3 %
recreation programs 1 0.3 %
animal safety 1 0.3 %
sewer on 51st St north of Leau Rd 1 0.3 %
streets 1 0.3 %
pay as you go equipment/projects 1 0.3 %
water treatment 1 0.3 %
flooding yards and basements 1 0.3 %
sidewalks & residential streets 1 0.3 %
cleaning our city streets from garbage 1 0.3 %
find occupants for the EPA building 1 0.3 %
creating a viable and usable downtown 1 0.3 %
2016 Kansas City, KS/Wyandotte County Community Survey Final Report
ETC Institute (2016) Page 72
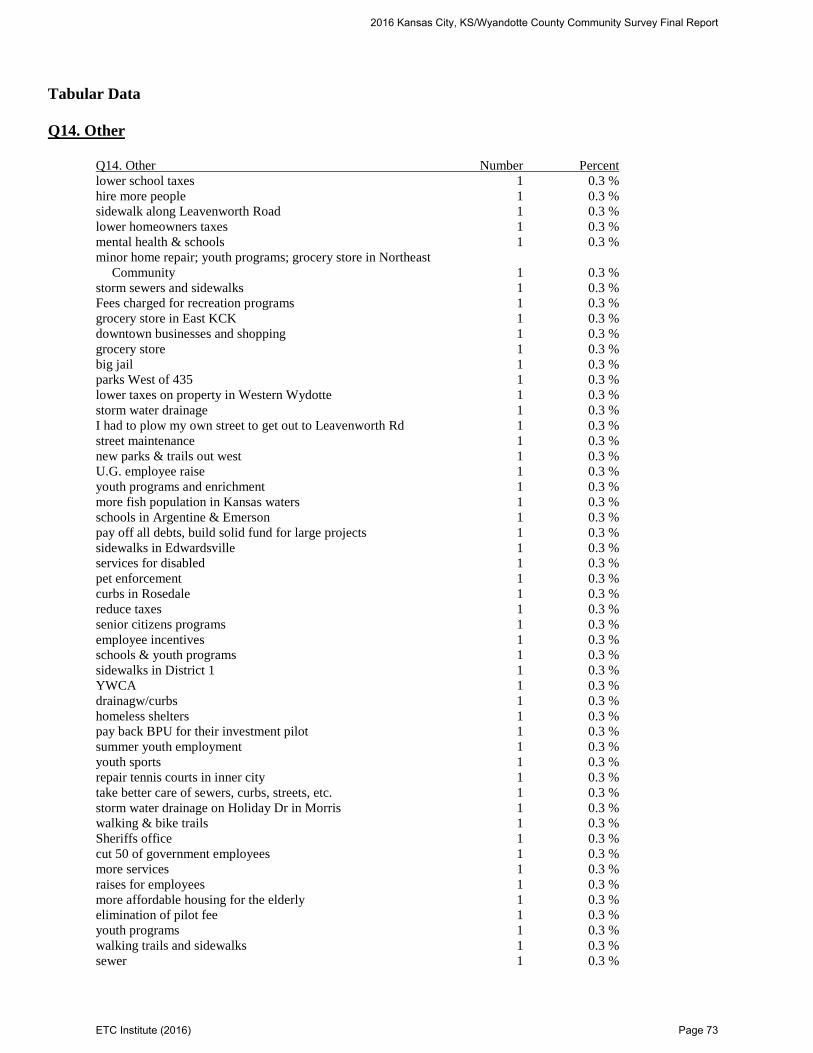
Tabular Data
Q14. Other
Q14. Other Number Percent
lower school taxes 1 0.3 %
hire more people 1 0.3 %
sidewalk along Leavenworth Road 1 0.3 %
lower homeowners taxes 1 0.3 %
mental health & schools 1 0.3 %
minor home repair; youth programs; grocery store in Northeast
Community 1 0.3 %
storm sewers and sidewalks 1 0.3 %
Fees charged for recreation programs 1 0.3 %
grocery store in East KCK 1 0.3 %
downtown businesses and shopping 1 0.3 %
grocery store 1 0.3 %
big jail 1 0.3 %
parks West of 435 1 0.3 %
lower taxes on property in Western Wydotte 1 0.3 %
storm water drainage 1 0.3 %
I had to plow my own street to get out to Leavenworth Rd 1 0.3 %
street maintenance 1 0.3 %
new parks & trails out west 1 0.3 %
U.G. employee raise 1 0.3 %
youth programs and enrichment 1 0.3 %
more fish population in Kansas waters 1 0.3 %
schools in Argentine & Emerson 1 0.3 %
pay off all debts, build solid fund for large projects 1 0.3 %
sidewalks in Edwardsville 1 0.3 %
services for disabled 1 0.3 %
pet enforcement 1 0.3 %
curbs in Rosedale 1 0.3 %
reduce taxes 1 0.3 %
senior citizens programs 1 0.3 %
employee incentives 1 0.3 %
schools & youth programs 1 0.3 %
sidewalks in District 1 1 0.3 %
YWCA 1 0.3 %
drainagw/curbs 1 0.3 %
homeless shelters 1 0.3 %
pay back BPU for their investment pilot 1 0.3 %
summer youth employment 1 0.3 %
youth sports 1 0.3 %
repair tennis courts in inner city 1 0.3 %
take better care of sewers, curbs, streets, etc. 1 0.3 %
storm water drainage on Holiday Dr in Morris 1 0.3 %
walking & bike trails 1 0.3 %
Sheriffs office 1 0.3 %
cut 50 of government employees 1 0.3 %
more services 1 0.3 %
raises for employees 1 0.3 %
more affordable housing for the elderly 1 0.3 %
elimination of pilot fee 1 0.3 %
youth programs 1 0.3 %
walking trails and sidewalks 1 0.3 %
sewer 1 0.3 %
2016 Kansas City, KS/Wyandotte County Community Survey Final Report
ETC Institute (2016) Page 73

Tabular Data
Q14. Other
Q14. Other Number Percent
demo or rehab of properties 1 0.3 %
cleaning up trash 1 0.3 %
pick up trash on street 1 0.3 %
fix curbs for wheelchair bound people 1 0.3 %
opportunities, parks, businesses in urban core 1 0.3 %
save downtown 1 0.3 %
new grocery stores in downtown 1 0.3 %
mowing city/public areas (side of roads) 1 0.3 %
more parks 1 0.3 %
sidewalks for major streets in Leavenworth 1 0.3 %
homeowners hazardous material 1 0.3 %
sidewalks and curbs in residential areas 1 0.3 %
need more street lights in neighborhood 1 0.3 %
sidewalks on 136th St 1 0.3 %
downtown/Minnesota Ave redevelopment 1 0.3 %
drainage system 1 0.3 %
sewers for all residents 1 0.3 %
type of transportation in the Turner Area 1 0.3 %
attract social businesses to east end 1 0.3 %
youth and elderly disability services 1 0.3 %
state taxes 1 0.3 %
help seniors restore their property 1 0.3 %
summer programs for low income families 1 0.3 %
transportation 1 0.3 %
handicap access 1 0.3 %
crime prevention 1 0.3 %
streets/sidewalks on N 67th St between Leavenworth & Parallel 1 0.3 %
need speed bumps 1 0.3 %
stormwater maintenance 1 0.3 %
city maintenance 1 0.3 %
cleaning creeks 1 0.3 %
health program for public 1 0.3 %
bury electrical lines 1 0.3 %
mental health service 1 0.3 %
sidewalks for school childrens 1 0.3 %
pools, trails, gyms 1 0.3 %
programs for youth 1 0.3 %
pay raises for employees 1 0.3 %
grocery/shopping in NE area 1 0.3 %
walkways 1 0.3 %
youth and adult programs 1 0.3 %
blight 1 0.3 %
build up/clean up 600 block of Central 1 0.3 %
10th st south parking west side 1 0.3 %
sewers no more septic systems 1 0.3 %
walking & biking trails 1 0.3 %
inner city development 1 0.3 %
clean up vacant lots 1 0.3 %
urban youth 1 0.3 %
craft store 1 0.3 %
school supplies 1 0.3 %
pool and spray park 1 0.3 %
2016 Kansas City, KS/Wyandotte County Community Survey Final Report
ETC Institute (2016) Page 74

Tabular Data
Q14. Other
Q14. Other Number Percent
taxes on BPU bill relief 1 0.3 %
grocery store in NE Wyandotte County 1 0.3 %
youth rec & after school programs 1 0.3 %
safety when kids walking to school 1 0.3 %
build a park on the vacant lot back of Quik Trip 1 0.3 %
sidewalks & trails 1 0.3 %
mental health center 1 0.3 %
cleaning the streets in the neighborhood 1 0.3 %
economic development 1 0.3 %
Access to Recreational Faciliates for everyone 1 0.3 %
sewers 1 0.3 %
redevelop Rainbow & SW Blvd 1 0.3 %
release from land bank 1 0.3 %
Total 315 100.0 %
2016 Kansas City, KS/Wyandotte County Community Survey Final Report
ETC Institute (2016) Page 75

Tabular Data
Q15. BUSINESS NEEDS. Several types of businesses are listed below. For each one, please indicate if you
or others in your household have a need for the business.
(N=3175)
Yes No
Q15-1. Grocery Store 68.3% 31.7%
Q15-2. Hardware Store 60.0% 40.0%
Q15-3. Dry Cleaners 31.5% 68.5%
Q15-4. Laundromat 24.3% 75.7%
Q15-5. Fast Food Restaurant (order at
counter; carry own food; dispose of own
trash) 42.9% 57.1%
Q15-6. Fast Casual Restaurant (order at
counter but higher quality; e.g. Panera Bread) 54.5% 45.5%
Q15-7. Casual Dining Restaurant (e.g.
Applebee's) 57.4% 42.6%
Q15-8. Fine Dining Restaurant (full-service;
order and food brought to table) 51.4% 48.6%
Q15-9. Convenience/Gas Station (e.g.
QuikTrip) 55.7% 44.3%
Q15-10. Senior Day Care 25.2% 74.8%
Q15-11. Children's Day Care 26.8% 73.2%
Q15-12. Health and Fitness Center 54.7% 45.3%
Q15-13. Urgent Medical Care Facility 55.8% 44.2%
Q15-14. Drug Store/Pharmacy (e.g. CVS) 52.6% 47.4%
Q15-15. Clothing and Home Goods (e.g.
Kohl's) 56.9% 43.1%
2016 Kansas City, KS/Wyandotte County Community Survey Final Report
ETC Institute (2016) Page 76

Tabular Data
Q15. THEN, please indicate how you would like to see the availability of each type of business in your
neighborhood change.
(N=2739)
Stay about the
Increase same Decrease Don't know
Q15-1. Grocery Store 58.3% 33.8% 0.2% 7.8%
Q15-2. Hardware Store 51.7% 40.5% 0.4% 7.4%
Q15-3. Dry Cleaners 49.9% 38.4% 0.7% 11.1%
Q15-4. Laundromat 50.1% 37.2% 0.3% 12.4%
Q15-5. Fast Food Restaurant (order at
counter; carry own food; dispose of own
trash) 34.8% 54.6% 3.9% 6.7%
Q15-6. Fast Casual Restaurant (order at
counter but higher quality; e.g. Panera
Bread) 64.4% 27.6% 0.6% 7.3%
Q15-7. Casual Dining Restaurant (e.g.
Applebee's) 63.7% 28.2% 0.4% 7.7%
Q15-8. Fine Dining Restaurant (full-service;
order and food brought to table) 66.4% 24.1% 0.5% 9.1%
Q15-9. Convenience/Gas Station (e.g.
QuikTrip) 42.1% 47.7% 1.6% 8.6%
Q15-10. Senior Day Care 67.6% 14.2% 0.5% 17.8%
Q15-11. Children's Day Care 65.4% 17.6% 0.3% 16.7%
Q15-12. Health and Fitness Center 69.8% 17.6% 0.7% 11.9%
Q15-13. Urgent Medical Care Facility 60.5% 28.3% 0.5% 10.7%
Q15-14. Drug Store/Pharmacy (e.g. CVS) 33.0% 57.9% 1.0% 8.2%
Q15-15. Clothing and Home Goods (e.g.
Kohl's) 59.7% 30.2% 0.9% 9.3%
2016 Kansas City, KS/Wyandotte County Community Survey Final Report
ETC Institute (2016) Page 77
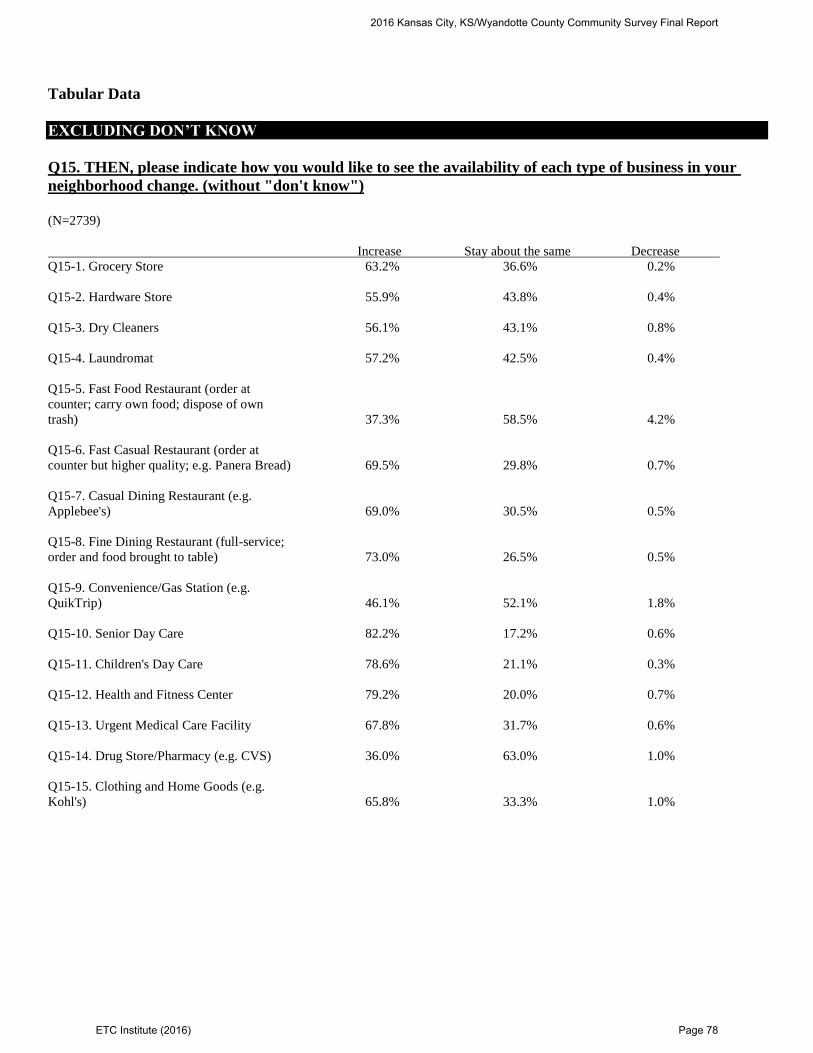
Tabular Data
EXCLUDING DON’T KNOW
Q15. THEN, please indicate how you would like to see the availability of each type of business in your
neighborhood change. (without "don't know")
(N=2739)
Increase Stay about the same Decrease
Q15-1. Grocery Store 63.2% 36.6% 0.2%
Q15-2. Hardware Store 55.9% 43.8% 0.4%
Q15-3. Dry Cleaners 56.1% 43.1% 0.8%
Q15-4. Laundromat 57.2% 42.5% 0.4%
Q15-5. Fast Food Restaurant (order at
counter; carry own food; dispose of own
trash) 37.3% 58.5% 4.2%
Q15-6. Fast Casual Restaurant (order at
counter but higher quality; e.g. Panera Bread) 69.5% 29.8% 0.7%
Q15-7. Casual Dining Restaurant (e.g.
Applebee's) 69.0% 30.5% 0.5%
Q15-8. Fine Dining Restaurant (full-service;
order and food brought to table) 73.0% 26.5% 0.5%
Q15-9. Convenience/Gas Station (e.g.
QuikTrip) 46.1% 52.1% 1.8%
Q15-10. Senior Day Care 82.2% 17.2% 0.6%
Q15-11. Children's Day Care 78.6% 21.1% 0.3%
Q15-12. Health and Fitness Center 79.2% 20.0% 0.7%
Q15-13. Urgent Medical Care Facility 67.8% 31.7% 0.6%
Q15-14. Drug Store/Pharmacy (e.g. CVS) 36.0% 63.0% 1.0%
Q15-15. Clothing and Home Goods (e.g.
Kohl's) 65.8% 33.3% 1.0%
2016 Kansas City, KS/Wyandotte County Community Survey Final Report
ETC Institute (2016) Page 78

Tabular Data
Q16. Please indicate how you feel about the current quality of life in your neighborhood.
Q16. How do you feel about the current quality of life in
your neighborhood Number Percent
Never been better 116 3.7 %
Getting better 686 21.6 %
About the same as it has always been 1388 43.7 %
Getting worse 697 22.0 %
Never been worse 60 1.9 %
Don't know 228 7.2 %
Total 3175 100.0 %
EXCLUDING DON’T KNOW
Q16. Please indicate how you feel about the current quality of life in your neighborhood. (without "don't
know")
Q16. How do you feel about the current quality of life in
your neighborhood Number Percent
Never been better 116 3.9 %
Getting better 686 23.3 %
About the same as it has always been 1388 47.1 %
Getting worse 697 23.7 %
Never been worse 60 2.0 %
Total 2947 100.0 %
2016 Kansas City, KS/Wyandotte County Community Survey Final Report
ETC Institute (2016) Page 79

Tabular Data
Q17. Some items that may influence your perception of Wyandotte County are listed below. Please rate
each item on a scale of 5 to 1, where 5 means "Very Satisfied" and 1 means "Very Dissatisfied."
(N=3175)
Very Very
Satisfied Satisfied Neutral Dissatisfied Dissatisfied Don't Know
Q17-1. Overall image of Wyandotte County 3.7% 25.7% 27.6% 29.4% 9.2% 4.4%
Q17-2. How well Wyandotte County is
planning for and managing growth and
development 5.2% 26.0% 31.8% 20.7% 6.5% 9.9%
Q17-3. Overall quality of life in Wyandotte
County 4.5% 30.2% 31.8% 22.8% 6.7% 4.0%
Q17-4. Overall appearance of Wyandotte
County 3.5% 21.7% 29.4% 32.2% 9.4% 3.9%
Q17-5. Overall feeling of safety in Wyandotte
County 4.3% 23.1% 29.6% 27.0% 11.8% 4.2%
Q17-6. Overall quality of City and County
services 4.3% 24.8% 38.2% 18.8% 7.6% 6.3%
Q17-7. Your monthly trash service fee 6.5% 28.8% 30.7% 17.5% 9.1% 7.3%
Q17-8. Your monthly sewer fee 4.5% 21.0% 28.4% 21.6% 12.8% 11.7%
Q17-9. The overall value you receive for the
city/county taxes and fees that you pay 2.6% 12.5% 24.9% 29.9% 23.9% 6.1%
2016 Kansas City, KS/Wyandotte County Community Survey Final Report
ETC Institute (2016) Page 80

Tabular Data
EXCLUDING DON’T KNOW
Q17. Some items that may influence your perception of Wyandotte County are listed below. Please rate
each item on a scale of 5 to 1, where 5 means "Very Satisfied" and 1 means "Very Dissatisfied." (without
"don't know")
(N=3175)
Very
Very Satisfied Satisfied Neutral Dissatisfied Dissatisfied
Q17-1. Overall image of Wyandotte County 3.9% 26.9% 28.8% 30.8% 9.6%
Q17-2. How well Wyandotte County is
planning for and managing growth and
development 5.7% 28.8% 35.3% 23.0% 7.2%
Q17-3. Overall quality of life in Wyandotte
County 4.7% 31.5% 33.1% 23.8% 7.0%
Q17-4. Overall appearance of Wyandotte
County 3.6% 22.6% 30.5% 33.5% 9.7%
Q17-5. Overall feeling of safety in Wyandotte
County 4.5% 24.1% 30.9% 28.2% 12.3%
Q17-6. Overall quality of City and County
services 4.6% 26.5% 40.8% 20.1% 8.1%
Q17-7. Your monthly trash service fee 7.0% 31.1% 33.1% 18.9% 9.8%
Q17-8. Your monthly sewer fee 5.1% 23.8% 32.2% 24.5% 14.4%
Q17-9. The overall value you receive for the
city/county taxes and fees that you pay 2.8% 13.3% 26.6% 31.9% 25.5%
2016 Kansas City, KS/Wyandotte County Community Survey Final Report
ETC Institute (2016) Page 81

Tabular Data
D1. Approximately how many years have you lived in Kansas City, KS or Wyandotte County?
D1. How many years have you lived in Kansas City, KS
or Wyandotte County Number Percent
5 or less 298 9.4 %
6-10 243 7.7 %
11-15 201 6.3 %
16-20 217 6.8 %
21-30 545 17.2 %
31+ 1613 50.8 %
Not provided 58 1.8 %
Total 3175 100.0 %
D2. What is your age?
D2. Your age Number Percent
18-34 611 19.2 %
35-44 637 20.1 %
45-54 627 19.7 %
55-64 663 20.9 %
65+ 576 18.1 %
Not provided 61 1.9 %
Total 3175 100.0 %
D3. How many persons in your household (counting yourself) are:
Mean Sum
number 2.6 8138
Under age 5 0.2 485
Ages 5-9 0.1 456
Ages 10-14 0.2 504
Ages 15-19 0.2 517
Ages 20-24 0.1 443
Ages 25-34 0.4 1184
Ages 35-44 0.4 1185
Ages 45-54 0.4 1128
Ages 55-64 0.4 1188
Ages 65-74 0.2 604
Ages 75+ 0.1 444
2016 Kansas City, KS/Wyandotte County Community Survey Final Report
ETC Institute (2016) Page 82

Tabular Data
D4. Do you own or rent your current residence?
D4. Do you own or rent your current residence Number Percent
Own 2173 68.4 %
Rent 1002 31.6 %
Total 3175 100.0 %
D5. Are you or other members of your household of Hispanic or Latino ancestry?
D5. Hispanic or Latino ancestry Number Percent
Yes 736 23.2 %
No 2439 76.8 %
Total 3175 100.0 %
D6. Which of the following best describes your race?
D6. Your race Number Percent
African American/Black 740 23.3 %
American Indian/Alaska Native 94 3.0 %
Asian, Hawaiian/Other Pacific Islander 63 2.0 %
White 2087 65.7 %
Other 194 6.1 %
Total 3178
D7. Would you say your total household income is:
D7. Your total household income Number Percent
Under $30K 846 26.6 %
$30K to $59,999 974 30.7 %
$60K to $99,999 699 22.0 %
$100K+ 406 12.8 %
Not provided 250 7.9 %
Total 3175 100.0 %
2016 Kansas City, KS/Wyandotte County Community Survey Final Report
ETC Institute (2016) Page 83

Tabular Data
D8. Your gender:
D8. Your gender Number Percent
Male 1530 48.2 %
Female 1615 50.9 %
Not provided 30 0.9 %
Total 3175 100.0 %
2016 Kansas City, KS/Wyandotte County Community Survey Final Report
ETC Institute (2016) Page 84

Section 4:
Survey Instrument
2016 Kansas City, KS/Wyandotte County Community Survey Final Report
ETC Institute (2016) Page 85

©2016 ETC Institute Page 1
2016 Unified Government Community Survey
Thank you for taking the time to complete this important survey. City and County leaders will use your input to help set community priorities so that the tax dollars are spent wisely. When you are finished, please return your completed survey in the postage-paid envelope provided. You may also complete the survey on-line by going to www.UGSSurvey.org. If you have questions, please call (913) 573-5157 and ask for Mike Grimm.
1. NEIGHBORHOOD/COMMUNITY SERVICES. Using a scale of 5 to 1, where 5 means "Very Satisfied" and 1 means "Very Dissatisfied," please rate your satisfaction with the quality of each of the following services in the neighborhood/community where you live.
Neighborhood/Community Services Very
Satisfied Satisfied Neutral Dissatisfied
Very Dissatisfied
Don't Know
01. Police services 5 4 3 2 1 9
02. Fire services 5 4 3 2 1 9
03. Ambulance services 5 4 3 2 1 9
04. Maintenance of city streets 5 4 3 2 1 9
05. Storm water runoff/management system 5 4 3 2 1 9
06. Sewer utility system 5 4 3 2 1 9
07. Trash collection system 5 4 3 2 1 9
08. Parks and recreation facilities 5 4 3 2 1 9
09. Parks and recreation programs 5 4 3 2 1 9
10. Code enforcement 5 4 3 2 1 9
11. Planning and zoning 5 4 3 2 1 9
12. Communication with the public 5 4 3 2 1 9
13. Municipal court 5 4 3 2 1 9
14. Recycling 5 4 3 2 1 9
15. Public transportation 5 4 3 2 1 9
2. NEIGHBORHOOD/COMMUNITY PRIORITIES. Which FOUR of the services listed in Question 1 should receive the most emphasis for improvement in the neighborhood/community where you live over the next TWO years? [Use the numbers from the list in Question 1.]
1st: ____ 2nd: ____ 3rd: ____ 4th: ____

©2016 ETC Institute Page 2
3. COUNTY LEVEL SERVICES. Using a scale of 5 to 1 where 5 means "Very Satisfied" and 1 means "Very Dissatisfied," please rate your satisfaction with the quality of each of the following county level services.
County Level Services Very
Satisfied Satisfied Neutral Dissatisfied
Very Dissatisfied
Don't Know
16. County Sheriff's office 5 4 3 2 1 9
17. Adult Jail/Juvenile Detention Center 5 4 3 2 1 9
18. Services for developmental disabilities 5 4 3 2 1 9
19. Area Agency on Aging Services 5 4 3 2 1 9
20. Senior transportation 5 4 3 2 1 9
21. District Courts 5 4 3 2 1 9
22. Treasurer's Office 5 4 3 2 1 9
23. Motor Vehicle Registration 5 4 3 2 1 9
24. County Appraiser's Office services 5 4 3 2 1 9
25. County parks (Wyandotte County Park, Wyandotte County Lake, Pierson Park)
5 4 3 2 1 9
26. The District Attorneys' Office 5 4 3 2 1 9
27. The Election Office 5 4 3 2 1 9
28. Community elections 5 4 3 2 1 9
29. Customer service provided by Unified Government employees
5 4 3 2 1 9
30. Public Health Department services 5 4 3 2 1 9
4. COUNTY LEVEL PRIORITIES. Which FOUR of the county-level services listed in Question 3 should receive the most emphasis for improvement over the next TWO years? [Use the numbers from the list in Question 3.]
1st: ____ 2nd: ____ 3rd: ____ 4th: ____
5. OVERALL PRIORITIES. Using the lists in Questions 1 and 3, which FOUR items do you think should be the top overall priorities for the Unified Government over the next TWO years? [Use the numbers (01-30) from the lists in Questions 1 and 3.]
1st: ____ 2nd: ____ 3rd: ____ 4th: ____
6. PUBLIC SAFETY. Please rate your satisfaction on a scale of 5 to 1, where 5 means "Very Satisfied" and 1 means "Very Dissatisfied," with the following PUBLIC SAFETY services provided by your government.
Public Safety Very
Satisfied Satisfied Neutral Dissatisfied
Very Dissatisfied
Don't Know
01. The visibility of police in neighborhoods 5 4 3 2 1 9
02. The visibility of police in neighborhood retail areas 5 4 3 2 1 9
03. The visibility of Code Enforcement in your neighborhood
5 4 3 2 1 9
04. The visibility of Building Inspection in your neighborhood
5 4 3 2 1 9
05. The city's overall efforts to prevent crime 5 4 3 2 1 9
06. Enforcement of traffic laws 5 4 3 2 1 9
07. How quickly police department personnel respond to emergencies
5 4 3 2 1 9
08. How quickly fire department responded to fires 5 4 3 2 1 9
09. How quickly fire department responds to medical emergency calls
5 4 3 2 1 9
10. Quality of animal control in your neighborhood 5 4 3 2 1 9

©2016 ETC Institute Page 3
7. Which THREE of the public safety services from the list in Question 6 do you think should receive the most emphasis from government leaders over the next TWO years? [Use the numbers from the list in Question 6.]
1st: ____ 2nd: ____ 3rd: ____
8. CITY MAINTENANCE. Please rate your satisfaction on a scale of 5 to 1, where 5 is "Very Satisfied" and 1 is "Very Dissatisfied," with the following aspects of City maintenance.
City Maintenance Very
Satisfied Satisfied Neutral Dissatisfied
Very Dissatisfied
Don't Know
01. Maintenance of major City streets 5 4 3 2 1 9
02. Maintenance of streets in your neighborhood 5 4 3 2 1 9
03. Maintenance of alleys in your neighborhood 5 4 3 2 1 9
04. Maintenance of sidewalks in your neighborhood 5 4 3 2 1 9
05. Maintenance of curbs in your neighborhood 5 4 3 2 1 9
06. Maintenance of street signs/traffic signals 5 4 3 2 1 9
07. Maintenance of downtown parking lots 5 4 3 2 1 9
08. Overall appearance of downtown including lighting, landscaping and planter boxes
5 4 3 2 1 9
09. Maintenance of City buildings 5 4 3 2 1 9
10. Snow removal on major City streets 5 4 3 2 1 9
11. Snow removal on neighborhood streets 5 4 3 2 1 9
12. Overall cleanliness of streets and other public areas 5 4 3 2 1 9
13. Maintenance of stormwater drainage system in your neighborhood
5 4 3 2 1 9
9. Which THREE of the maintenance services from the list in Question 8 do you think should receive the most emphasis from City leaders over the next TWO years? [Use the numbers from the list in Question 8.]
1st: ____ 2nd: ____ 3rd: ____
10. ENFORCEMENT OF CODES AND ORDINANCES IN YOUR CITY. Please rate your satisfaction on a scale of 5 to 1, where 5 means "Very Satisfied" and 1 means "Very Dissatisfied," with the following aspects of codes and ordinances.
Codes and Ordinances Very
Satisfied Satisfied Neutral Dissatisfied
Very Dissatisfied
Don't Know
01. Enforcing the clean-up of junk, trash & debris (blight), city-wide
5 4 3 2 1 9
02. Enforcing the clean-up of junk, trash & debris (blight), in your neighborhood
5 4 3 2 1 9
03. Enforcing the mowing and trimming of weeds on private and/or vacant property, city-wide
5 4 3 2 1 9
04. Enforcing the mowing and trimming of weeds on private and/or vacant property, in your neighborhood
5 4 3 2 1 9
05. Enforcing the maintenance of residential property (houses) in your neighborhood
5 4 3 2 1 9
06. Enforcing the maintenance of business property 5 4 3 2 1 9
07. Enforcing the removal of inoperable or junk cars in your neighborhood
5 4 3 2 1 9

©2016 ETC Institute Page 4
11. Which THREE of the items from the list in Question 10 do you think should receive the most emphasis from government leaders over the next TWO years? [Write-in your answers below using the numbers from the list in Question 10.]
1st: ____ 2nd: ____ 3rd: ____
12. PARKS AND RECREATION. Please rate your satisfaction on a scale of 5 to 1, where 5 means "Very Satisfied" and 1 means "Very Dissatisfied," with the following parks and recreation facilities and services.
Parks and Recreation Very
Satisfied Satisfied Neutral Dissatisfied
Very Dissatisfied
Don't Know
01. Maintenance of parks & equipment 5 4 3 2 1 9
02. Number of walking and biking trails 5 4 3 2 1 9
03. The number of parks 5 4 3 2 1 9
04. Number of outdoor athletic fields 5 4 3 2 1 9
05. Sunflower Hills Golf Course 5 4 3 2 1 9
06. Swimming Pool & spray parks 5 4 3 2 1 9
07. Youth recreation programs 5 4 3 2 1 9
08. Adult recreation programs 5 4 3 2 1 9
09. Programs for seniors 5 4 3 2 1 9
10. Ease of registering for programs 5 4 3 2 1 9
11. Skate board parks 5 4 3 2 1 9
12. Fees charged for recreation programs 5 4 3 2 1 9
13. Which THREE of the parks and recreation issues listed in Question 12 do you think should receive the most emphasis from City leaders over the next TWO years? [Write-in your answers below using the numbers from the list in Question 12.]
1st: ____ 2nd: ____ 3rd: ____
14. Beginning in 2017, the Unified Government will begin receiving approximately $12 million annually from Village West sales tax revenues.
Please indicate which THREE of the items listed below should be the top priorities to fund with the sales tax revenue by writing the corresponding numbers as your 1st, 2nd, and 3rd choices below.
(01) Aging Services (07) Police Services (02) Code Enforcement (08) Personal Property (Auto) Registration at Courthouse or Annex (03) Demolitions of Residential/Commercial Properties (09) Property Tax Relief (04) Fire Services (10) Snow Removal Plowing & Treatment (05) Mowing Vacant Lots (11) Street Resurfacing (06) Park Improvements (99) Other: ____________________________
TOP PRIORITIES: 1st: ____ 2nd: ____ 3rd: ____

©2016 ETC Institute Page 5
15. BUSINESS NEEDS. Several types of businesses are listed below. For each one, please indicate if you or others in your household have a need for the business by circling either "YES" or "NO."
THEN, please indicate how you would like to see the availability of each type of business in your neighborhood change. If you would like to see more of that type of business, circle 3 for "Increase," or if you wish that there were fewer businesses of that type, circle 1 for "Decrease."
Type of Business
Do You Have a Need for this type
of business?
How would you like to see the availability of each type of business change in the
neighborhood where you live?
Yes No Increase Stay About the Same
Decrease Don't Know
01. Grocery Store 1 2 3 2 1 9
02. Hardware Store 1 2 3 2 1 9
03. Dry Cleaners 1 2 3 2 1 9
04. Laundromat 1 2 3 2 1 9
05. Fast Food Restaurant (order at counter; carry own food; dispose of own trash)
1 2 3 2 1 9
06. Fast Casual Restaurant (order at counter but higher quality; e.g. Panera Bread)
1 2 3 2 1 9
07. Casual Dining Restaurant (e.g. Applebee's) 1 2 3 2 1 9
08. Fine Dining Restaurant (full-service; order and food brought to table)
1 2 3 2 1 9
09. Convenience/Gas Station (e.g. QuikTrip) 1 2 3 2 1 9
10. Senior Day Care 1 2 3 2 1 9
11. Children's Day Care 1 2 3 2 1 9
12. Health and Fitness Center 1 2 3 2 1 9
13. Urgent Medical Care Facility 1 2 3 2 1 9
14. Drug Store/Pharmacy (e.g. CVS) 1 2 3 2 1 9
15. Clothing and Home Goods (e.g. Kohl's) 1 2 3 2 1 9
16. Please indicate how you feel about the current quality of life in your neighborhood.
____(1) Never Been Better ____(4) Getting Worse ____(2) Getting Better ____(5) Never Been Worse ____(3) About the same as it has always been ____(9) Don't Know
17. Some items that may influence your perception of Wyandotte County are listed below. Please rate each item on a scale of 5 to 1, where 5 means "Very Satisfied" and 1 means "Very Dissatisfied."
How satisfied are you with: Very
Satisfied Satisfied Neutral Dissatisfied
Very Dissatisfied
Don't Know
1. Overall image of Wyandotte County 5 4 3 2 1 9
2. How well Wyandotte County is planning for and managing growth and development
5 4 3 2 1 9
3. Overall quality of life in Wyandotte County 5 4 3 2 1 9
4. Overall appearance of Wyandotte County 5 4 3 2 1 9
5. Overall feeling of safety in Wyandotte County 5 4 3 2 1 9
6. Overall quality of City and County services 5 4 3 2 1 9
7. Your monthly trash service fee 5 4 3 2 1 9
8. Your monthly sewer fee 5 4 3 2 1 9
9. The overall value you receive for the city/county taxes and fees that you pay
5 4 3 2 1 9

©2016 ETC Institute Page 6

©2016 ETC Institute Page 7
DEMOGRAPHICS
D1. Approximately how many years have you lived in Kansas City, KS or Wyandotte County?
__________ years
D2. What is your age? __________ years old
D3. How many persons in your household (counting yourself) are:
Under age 5: _____ Ages 15-19: _____ Ages 35-44: _____ Ages 65-74: _____ Ages 5-9: _____ Ages 20-24: _____ Ages 45-54: _____ Ages 75+: _____ Ages 10-14: _____ Ages 25-34: _____ Ages 55-64: _____
D4. Do you own or rent your current residence? ____(1) Own ____(2) Rent
D5. Are you or other members of your household of Hispanic or Latino ancestry?
____(1) Yes ____(2) No
D6. Which of the following best describes your race?
____(1) African American/Black ____(3) Asian, Hawaiian/Other Pacific Islander ____(5) Other: ______________ ____(2) American Indian/Alaska Native ____(4) White
D7. Would you say your total household income is:
____(1) Under $30,000 ____(2) $30,000 to $59,999 ____(3) $60,000 to $99,999 ____(4) $100,000 or more
D8. Your gender: ____(1) Male ____(2) Female
This concludes the survey – Thank you for your time!
Please return your completed survey in the enclosed postage-paid envelope addressed to: ETC Institute, 725 W. Frontier Circle, Olathe, KS 66061
Your responses will remain completely confidential. The Information printed to the right will ONLY be used to help identify which areas of the City are having problems with city services. If your address is not correct, please provide the correct information. Thank you!

District Specific Questions

©2016 ETC Institute Page 6
COMMISSION DISTRICT 1 QUESTIONS
18. The Unified Government has a dangerous dog ordinance to make the community safe for people and pets in the most comprehensive way possible. The Unified Government’s current dangerous dog ordinance currently bans “pit bulls”. The Unified Government could amend the current dangerous dog ordinance to hold owners accountable for the behavior of their dogs regardless of the dog’s breed. Would you support this change?
____(1) Yes (The law should be expanded to hold owners responsible for the behavior of all dog breeds.) ____(2) No (The law should continue to apply to pit bulls only.)
19. Should female/hen chickens (no males/roosters) be allowed in backyards not zoned for agricultural purposes?
____(1) Yes ____(2) No
19-2. [IF YES to #19] How many female chickens should be allowed in backyards?
____(1) 1 to 6 ____(3) 13 to 20 ____(9) Don’t know ____(2) 7 to 12 ____(4) 21 or more chickens
20. Do you have any suggestions to improve the quality of services in your neighborhood? [If yes, please write your suggestions in the space provided below.]
PLEASE ANSWER THE DEMOGRAPHIC QUESTIONS ON THE NEXT PAGE

©2016 ETC Institute Page 6
COMMISSION DISTRICT 2 QUESTIONS
18. The Unified Government has a dangerous dog ordinance to make the community safe for people and pets in the most comprehensive way possible. The Unified Government’s current dangerous dog ordinance currently bans “pit bulls”. The Unified Government could amend the current dangerous dog ordinance to hold owners accountable for the behavior of their dogs regardless of the dog’s breed. Would you support this change?
____(1) Yes (The law should be expanded to hold owners responsible for the behavior of all dog breeds.) ____(2) No (The law should continue to apply to pit bulls only.)
19. Should female/hen chickens (no males/roosters) be allowed in backyards not zoned for agricultural purposes?
____(1) Yes ____(2) No
19-2. [IF YES to #19] How many female chickens should be allowed in backyards?
____(1) 1 to 6 ____(3) 13 to 20 ____(9) Don’t know ____(2) 7 to 12 ____(4) 21 or more chickens
20. Do you have any suggestions to improve the quality of services in your neighborhood? [If yes, please write your suggestions in the space provided below.]
PLEASE ANSWER THE DEMOGRAPHIC QUESTIONS ON THE NEXT PAGE

©2016 ETC Institute Page 6
COMMISSION DISTRICT 3 QUESTIONS
18. The Unified Government has a dangerous dog ordinance to make the community safe for people and pets in the most comprehensive way possible. The Unified Government’s current dangerous dog ordinance currently bans “pit bulls”. The Unified Government could amend the current dangerous dog ordinance to hold owners accountable for the behavior of their dogs regardless of the dog’s breed. Would you support this change?
____(1) Yes (The law should be expanded to hold owners responsible for the behavior of all dog breeds.) ____(2) No (The law should continue to apply to pit bulls only.)
19. Should female/hen chickens (no males/roosters) be allowed in backyards not zoned for agricultural purposes?
____(1) Yes ____(2) No
19-2. [IF YES to #19] How many female chickens should be allowed in backyards?
____(1) 1 to 6 ____(3) 13 to 20 ____(9) Don’t know ____(2) 7 to 12 ____(4) 21 or more chickens
20. Do you routinely shop at the Wal-Mart in Argentine? ____(1) Yes ____(2) No
20-2. [IF YES to #20] How many times per month? ____________
21. Do you routinely shop at the Save-A-Lot in Argentine? ____(1) Yes ____(2) No
21-2. [IF YES to #21] How many times per month? ____________
22. Do you currently live in Belrose Manor? ____(1) Yes ____(2) No
22-2. [IF YES to #22] Would you like to live somewhere else? ____(1) Yes ____(2) No
23. Do you currently live in Rosedale Towers? ____(1) Yes ____(2) No
23-2. [IF YES to #23] Would you like to live somewhere else? ____(1) Yes ____(2) No
24. The Housing Authority has responsibility over low income housing like Belrose Manor and Rosedale Towers. As the Housing Authorities properties continue to age, increasing maintenance costs are becoming a significant issue. How would you like to see the Housing Authority address the issues stated above? (Choose one.)
____(1) Continue to invest in these properties regardless of the cost ____(2) Sell one or both of these properties and relocate residents to other low income housing options
If you answered “SELL” the properties, how would you like to see these properties redeveloped?
25-1. How would you like to see Belrose Manor Redeveloped?
____(1) New Housing (fair market prices) ____(3) Other: ________________ ____(2) New Retail ____(9) Don’t know
25-2. How would you like to see Rosedale Towers Redeveloped?
____(1) New Housing (fair market prices) ____(3) Other: ________________ ____(2) New Retail ____(9) Don’t know

©2016 ETC Institute Page 6
COMMISSION DISTRICT 4 QUESTIONS
18. The Unified Government has a dangerous dog ordinance to make the community safe for people and pets in the most comprehensive way possible. The Unified Government’s current dangerous dog ordinance currently bans “pit bulls”. The Unified Government could amend the current dangerous dog ordinance to hold owners accountable for the behavior of their dogs regardless of the dog’s breed. Would you support this change?
____(1) Yes (The law should be expanded to hold owners responsible for the behavior of all dog breeds.) ____(2) No (The law should continue to apply to pit bulls only.)
19. Should female/hen chickens (no males/roosters) be allowed in backyards not zoned for agricultural purposes?
____(1) Yes ____(2) No
19-2. [IF YES to #19] How many female chickens should be allowed in backyards?
____(1) 1 to 6 ____(3) 13 to 20 ____(9) Don’t know ____(2) 7 to 12 ____(4) 21 or more chickens
20. Do you have any suggestions to improve the quality of services in your neighborhood? [If yes, please write your suggestions in the space provided below.]
PLEASE ANSWER THE DEMOGRAPHIC QUESTIONS ON THE NEXT PAGE

©2016 ETC Institute Page 6
COMMISSION DISTRICT 5 QUESTIONS
18. The Unified Government has a dangerous dog ordinance to make the community safe for people and pets in the most comprehensive way possible. The Unified Government’s current dangerous dog ordinance currently bans “pit bulls”. The Unified Government could amend the current dangerous dog ordinance to hold owners accountable for the behavior of their dogs regardless of the dog’s breed. Would you support this change?
____(1) Yes (The law should be expanded to hold owners responsible for the behavior of all dog breeds.) ____(2) No (The law should continue to apply to pit bulls only.)
19. Should female/hen chickens (no males/roosters) be allowed in backyards not zoned for agricultural purposes?
____(1) Yes ____(2) No
19-2. [IF YES to #19] How many female chickens should be allowed in backyards?
____(1) 1 to 6 ____(3) 13 to 20 ____(9) Don’t know ____(2) 7 to 12 ____(4) 21 or more chickens
20. Do you have any suggestions to improve the quality of services in your neighborhood? [If yes, please write your suggestions in the space provided below.]
PLEASE ANSWER THE DEMOGRAPHIC QUESTIONS ON THE NEXT PAGE

©2016 ETC Institute Page 6
COMMISSION DISTRICT 6 QUESTIONS
18. The Unified Government has a dangerous dog ordinance to make the community safe for people and pets in the most comprehensive way possible. The Unified Government’s current dangerous dog ordinance currently bans “pit bulls”. The Unified Government could amend the current dangerous dog ordinance to hold owners accountable for the behavior of their dogs regardless of the dog’s breed. Would you support this change?
____(1) Yes (The law should be expanded to hold owners responsible for the behavior of all dog breeds.) ____(2) No (The law should continue to apply to pit bulls only.)
19. Should female/hen chickens (no males/roosters) be allowed in backyards not zoned for agricultural purposes? ____(1) Yes ____(2) No
19-2. [IF YES to #19] How many female chickens should be allowed in backyards?
____(1) 1 to 6 ____(3) 13 to 20 ____(9) Don’t know ____(2) 7 to 12 ____(4) 21 or more chickens
20. Is your home located in an area where storm water floods your yard or home? ___(1) Yes ___(2) No
20-2. [IF YES to #20] How many times has your property flooded in the past year? ________ times
TURNER RECREATION COMMISSION. The Turner Recreation Commission is a full service recreation organization with services available to residents who live within the Turner School District. Programs offered include a wide variety of youth and adult activities. Persons living in the Turner School District help support the Turner Recreation Commission which is funded through a school district wide mill levy, user fees, rentals, and gifts and grants. As an example, in 2015 persons living in a $100,000 house paid $81 to the Turner Recreation Commission as part of their real property tax bill. Knowing this, please answer the following questions:
21. In the past year, have you or a member of your family used a Turner Recreation Commission (TRC) facility or participated in a TRC activity?
___(1) Yes ___(2) No
22. Using a scale of 5 to 1 where 5 means "Very Satisfied" and 1 means "Very Dissatisfied”, please rate your satisfaction with the following facilities and services provided by the Turner Recreation Commission.
Turner Recreation Commission Facilities and Services
Very Satisfied
Satisfied Neutral Dissatisfied Very
Dissatisfied Don't Know
1. Maintenance of Turner Recreation Commission parks & equipment
5 4 3 2 1 9
2. Turner Walking Park 5 4 3 2 1 9
3. Highland Park 5 4 3 2 1 9
4. Turner Community Garden 5 4 3 2 1 9
5. Turner Aquatic Center 5 4 3 2 1 9
6. Youth recreation programs 5 4 3 2 1 9
7. Adult recreation programs 5 4 3 2 1 9
8. Parks and recreation facilities 5 4 3 2 1 9
23. Which THREE items listed in Question 22 do you think should receive the most emphasis from the Turner Recreation Commission over the next TWO years? [Write-in your answers below using the numbers from the list in Question 22.]
1st: ____ 2nd: ____ 3rd: ____
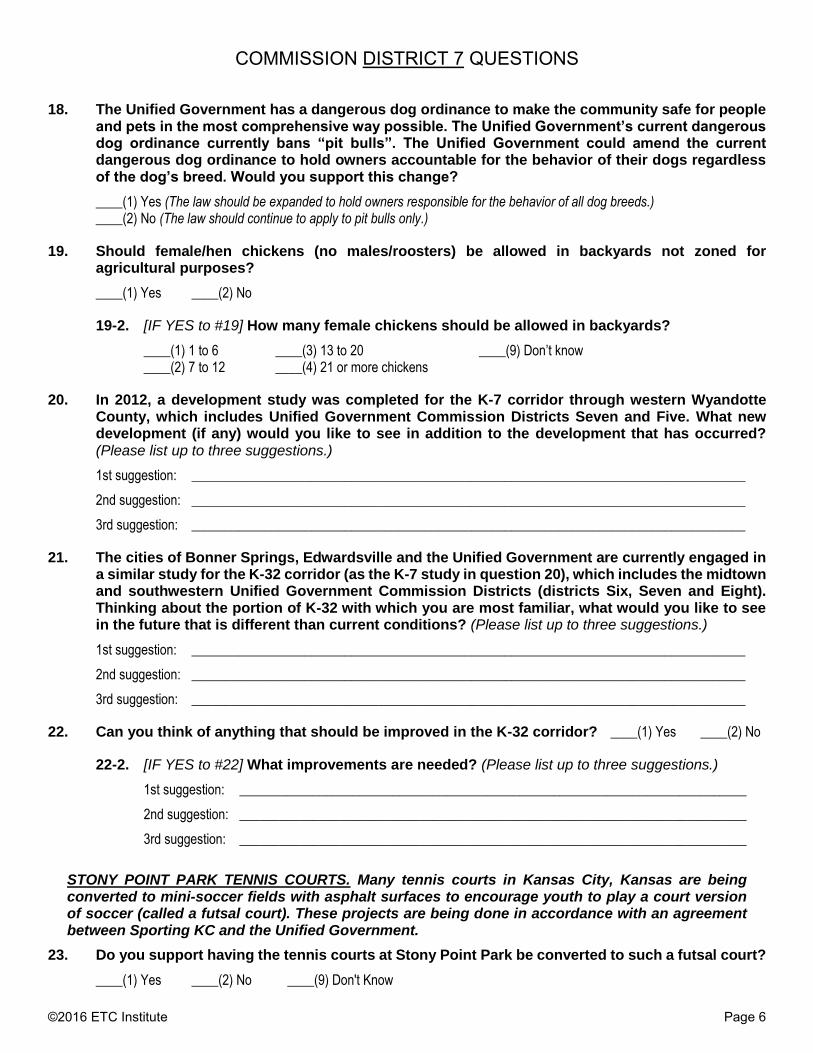
©2016 ETC Institute Page 6
COMMISSION DISTRICT 7 QUESTIONS
18. The Unified Government has a dangerous dog ordinance to make the community safe for people and pets in the most comprehensive way possible. The Unified Government’s current dangerous dog ordinance currently bans “pit bulls”. The Unified Government could amend the current dangerous dog ordinance to hold owners accountable for the behavior of their dogs regardless of the dog’s breed. Would you support this change?
____(1) Yes (The law should be expanded to hold owners responsible for the behavior of all dog breeds.) ____(2) No (The law should continue to apply to pit bulls only.)
19. Should female/hen chickens (no males/roosters) be allowed in backyards not zoned for agricultural purposes?
____(1) Yes ____(2) No
19-2. [IF YES to #19] How many female chickens should be allowed in backyards?
____(1) 1 to 6 ____(3) 13 to 20 ____(9) Don’t know ____(2) 7 to 12 ____(4) 21 or more chickens
20. In 2012, a development study was completed for the K-7 corridor through western Wyandotte County, which includes Unified Government Commission Districts Seven and Five. What new development (if any) would you like to see in addition to the development that has occurred? (Please list up to three suggestions.)
1st suggestion: ___________________________________________________________________________________
2nd suggestion: ___________________________________________________________________________________
3rd suggestion: ___________________________________________________________________________________
21. The cities of Bonner Springs, Edwardsville and the Unified Government are currently engaged in a similar study for the K-32 corridor (as the K-7 study in question 20), which includes the midtown and southwestern Unified Government Commission Districts (districts Six, Seven and Eight). Thinking about the portion of K-32 with which you are most familiar, what would you like to see in the future that is different than current conditions? (Please list up to three suggestions.)
1st suggestion: ___________________________________________________________________________________
2nd suggestion: ___________________________________________________________________________________
3rd suggestion: ___________________________________________________________________________________
22. Can you think of anything that should be improved in the K-32 corridor? ____(1) Yes ____(2) No
22-2. [IF YES to #22] What improvements are needed? (Please list up to three suggestions.)
1st suggestion: ____________________________________________________________________________
2nd suggestion: ____________________________________________________________________________
3rd suggestion: ____________________________________________________________________________
STONY POINT PARK TENNIS COURTS. Many tennis courts in Kansas City, Kansas are being converted to mini-soccer fields with asphalt surfaces to encourage youth to play a court version of soccer (called a futsal court). These projects are being done in accordance with an agreement between Sporting KC and the Unified Government.
23. Do you support having the tennis courts at Stony Point Park be converted to such a futsal court?
____(1) Yes ____(2) No ____(9) Don't Know

©2016 ETC Institute Page 6
COMMISSION DISTRICT 8 QUESTIONS
18. The Unified Government has a dangerous dog ordinance to make the community safe for people and pets in the most comprehensive way possible. The Unified Government’s current dangerous dog ordinance currently bans “pit bulls”. The Unified Government could amend the current dangerous dog ordinance to hold owners accountable for the behavior of their dogs regardless of the dog’s breed. Would you support this change?
____(1) Yes (The law should be expanded to hold owners responsible for the behavior of all dog breeds.) ____(2) No (The law should continue to apply to pit bulls only.)
19. Should female/hen chickens (no males/roosters) be allowed in backyards not zoned for agricultural purposes?
____(1) Yes ____(2) No
19-2. [IF YES to #19] How many female chickens should be allowed in backyards?
____(1) 1 to 6 ____(3) 13 to 20 ____(9) Don’t know ____(2) 7 to 12 ____(4) 21 or more chickens
20. Do you have any suggestions to improve the quality of services in your neighborhood? [If yes, please write your suggestions in the space provided below.]
PLEASE ANSWER THE DEMOGRAPHIC QUESTIONS ON THE NEXT PAGE