Embed Size (px)
Citation preview
3- 1Outline 3: Risk, Return, and Cost of Capital
3.1 Rates of Return 3.2 Measuring Risk3.3 Risk & Diversification3.4 Measuring Market Risk3.5 Portfolio Betas3.6 Risk and Return3.7 CAPM and Expected Return3.8 Security Market Line3.9 Capital Budgeting and Project Risk3.10 Cost of Capital3.11 Weighted Average Cost of Capital (WACC)3.12 Capital Structure3.13 Required Rates of Return
3- 2
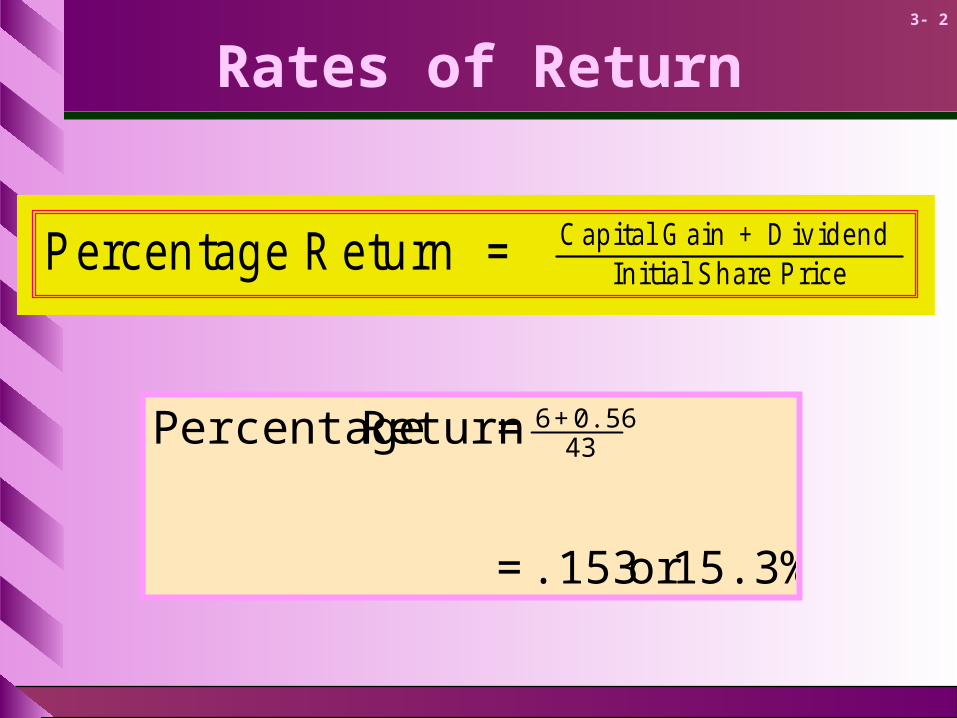
Rates of Return
15.3%or .153=
=Return Percentage 430.56 + 6
P e rc e n ta g e R e tu rn = C a p i ta l G a in + D iv id e n d In i t ia l S h a re P r ic e
3- 3
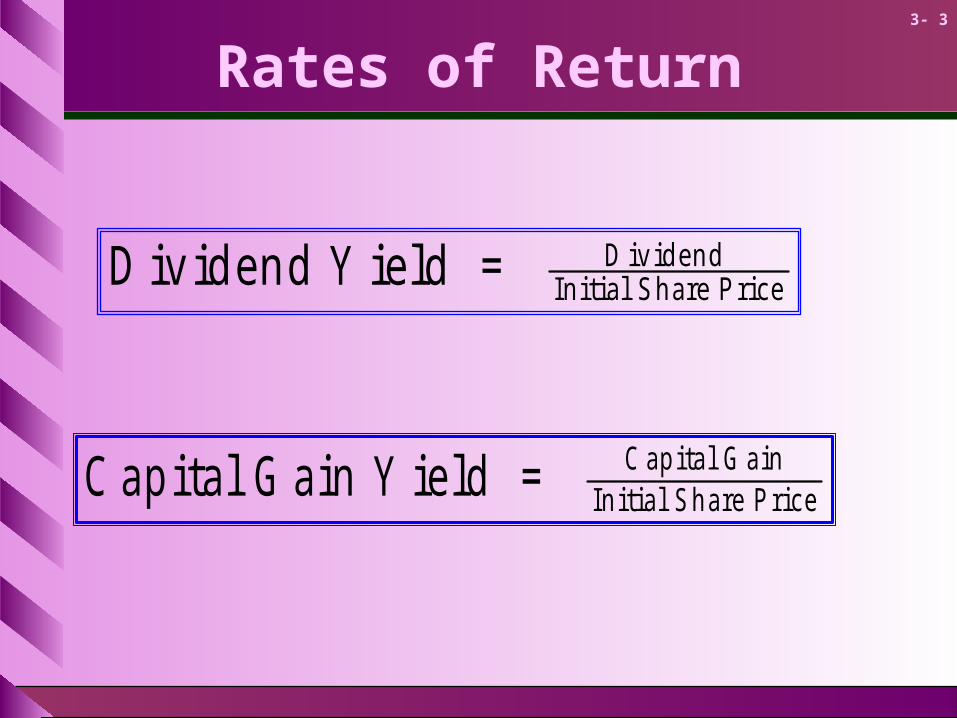
Rates of Return
D iv id e n d Y ie ld = D iv id e n d In i t ia l S h a re P r ic e
C a p i t a l G a in Y ie ld = C a p i t a l G a inIn i t i a l S h a r e P r i c e
3- 4
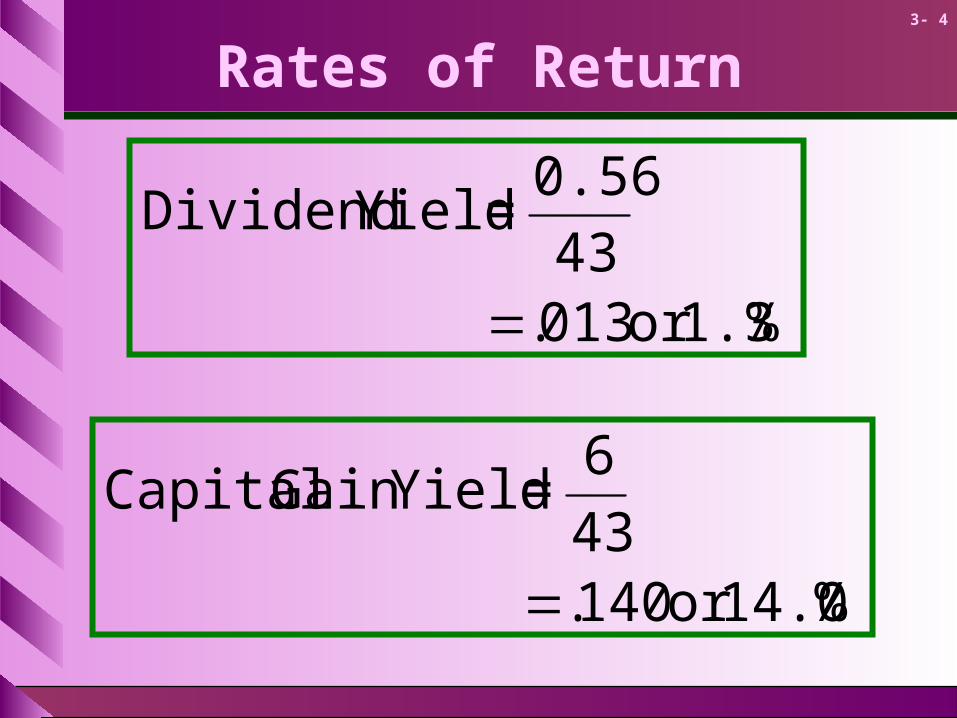
Rates of Return
%1.3or 013.43
0.56= Yield Dividend
%14.0or 140.43
6= YieldGain Capital
3- 5
Market Indexes
Dow Jones Industrial Average (The Dow)
Value of a portfolio holding one share in each of 30 large industrial firms.
Standard & Poor’s Composite Index (The S&P 500)
Value of a portfolio holding shares in 500 firms. Holdings are proportional to the number of shares in the issues.
3- 6
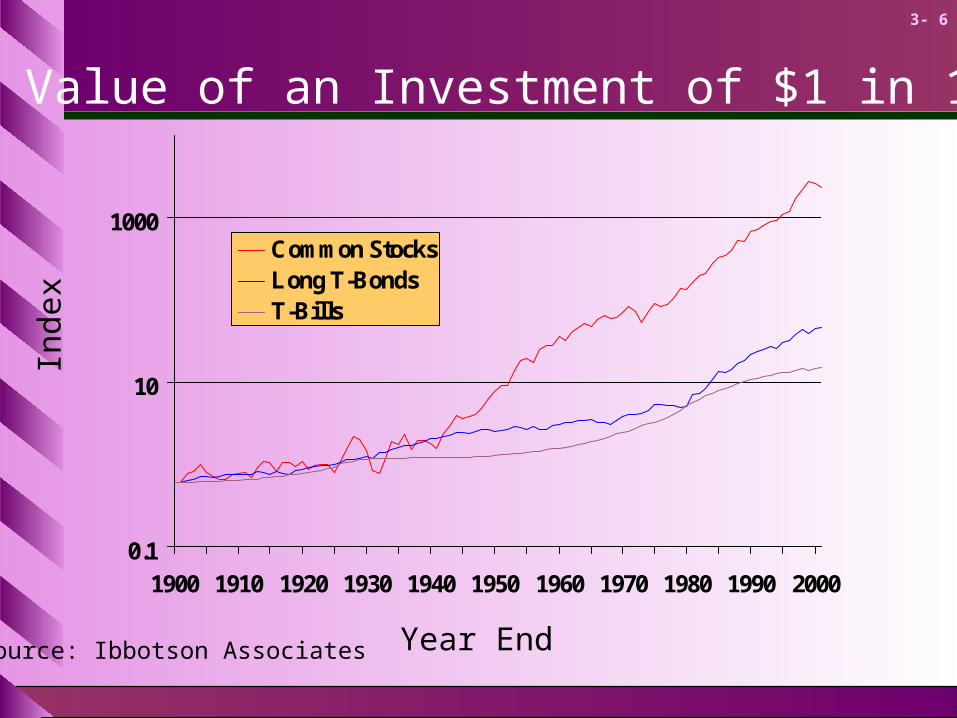
The Value of an Investment of $1 in 1900
Source: Ibbotson Associates
0.1
10
1000
1900 1910 1920 1930 1940 1950 1960 1970 1980 1990 2000
Common StocksLong T-BondsT-Bills
Inde
x
Year End
3- 7
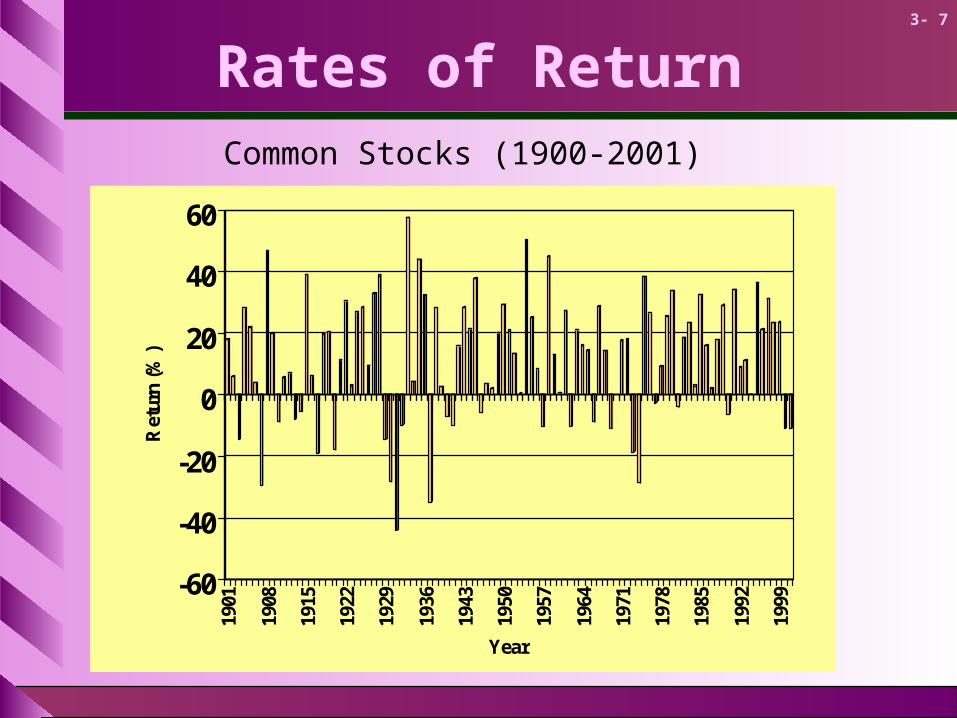
Rates of Return
-60
-40
-20
0
20
40
60
Ret
urn
(%)
1901
1908
1915
1922
1929
1936
1943
1950
1957
1964
1971
1978
1985
1992
1999
Year
Common Stocks (1900-2001)
3- 8
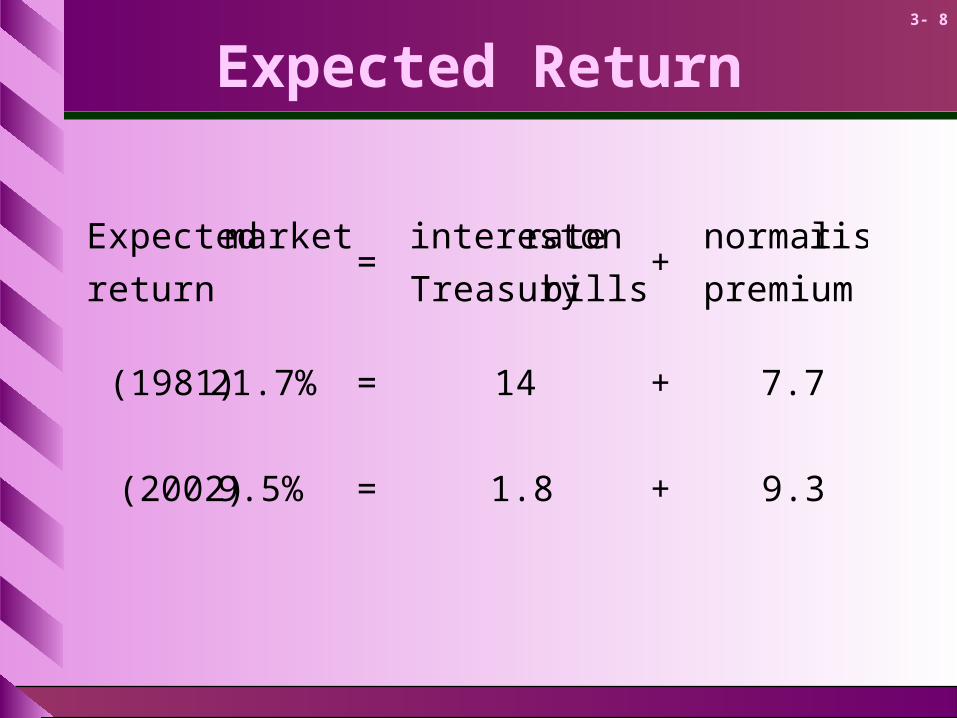
Expected Return
9.3+1.8=9.5% (2002)
7.7+14=21.7% (1981)
premium
risk normal+
billsTreasury
on rateinterest =
return
market Expected

3- 9
Measuring Risk
Variance - Average value of squared deviations from mean. A measure of volatility.
Standard Deviation - Average value of squared deviations from mean. A measure of volatility.
3- 10
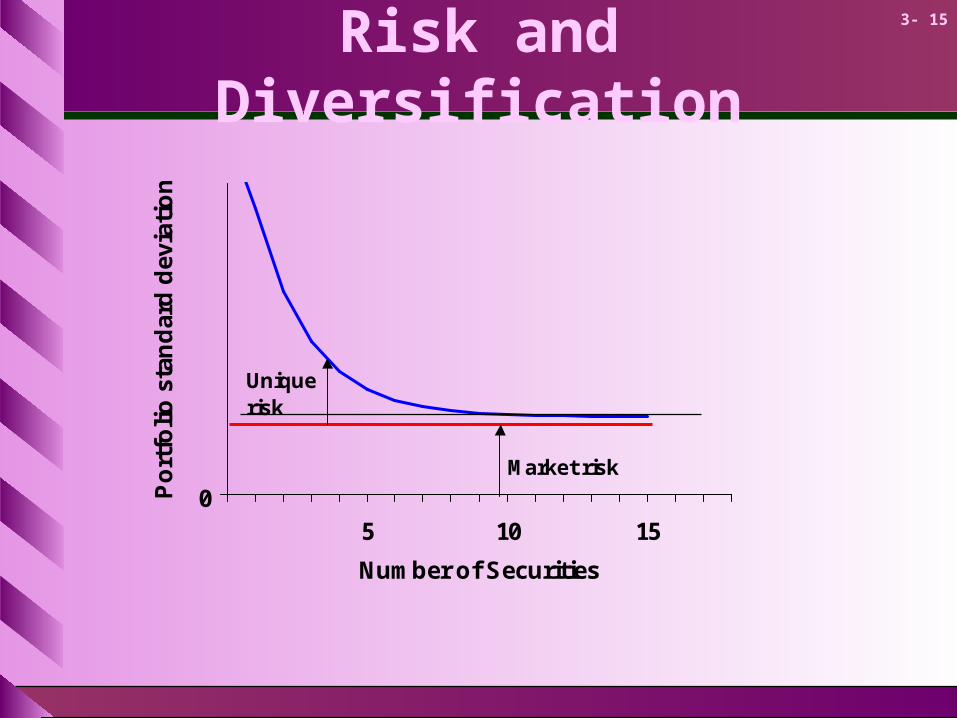
Risk and Diversification
Diversification - Strategy designed to reduce risk by spreading the portfolio across many investments.
Unique Risk - Risk factors affecting only that firm. Also called “diversifiable risk.”
Market Risk - Economy-wide sources of risk that affect the overall stock market. Also called “systematic risk.”
3- 11
Risk and Diversification
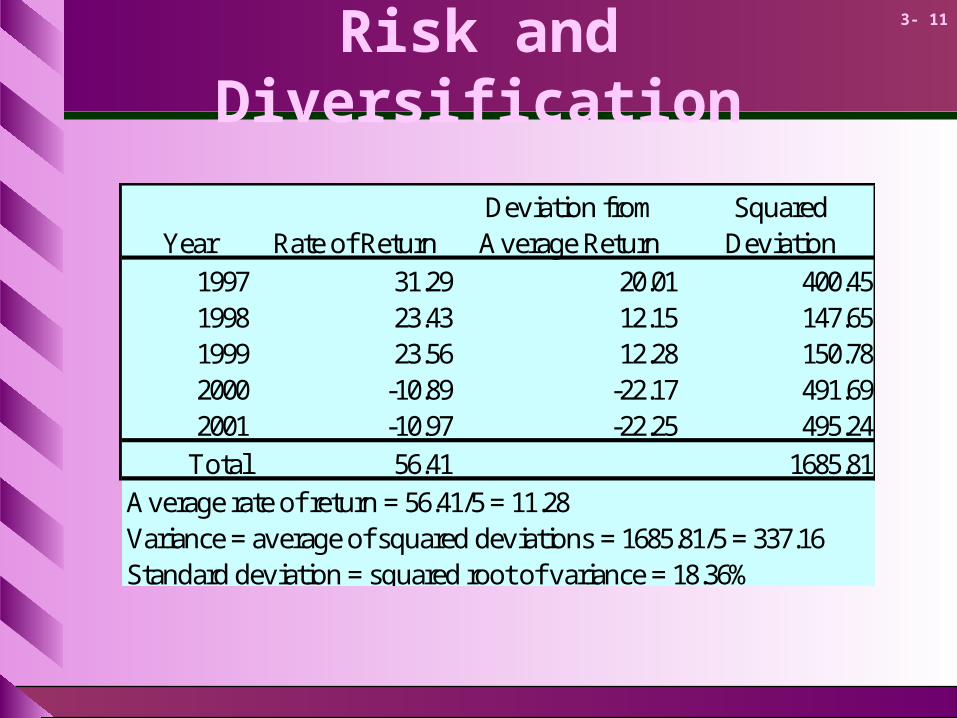
Deviation from SquaredYear Rate of Return Average Return Deviation
1997 31.29 20.01 400.451998 23.43 12.15 147.651999 23.56 12.28 150.782000 -10.89 -22.17 491.692001 -10.97 -22.25 495.24
Total 56.41 1685.81
Average rate of return = 56.41/5 = 11.28Variance = average of squared deviations = 1685.81/5 = 337.16Standard deviation = squared root of variance = 18.36%

3- 12
Risk and Diversification
Portfolio rate
of return=
fraction of portfolio
in first assetx
rate of return
on first asset
+fraction of portfolio
in second assetx
rate of return
on second asset
((
(())
))
3- 13
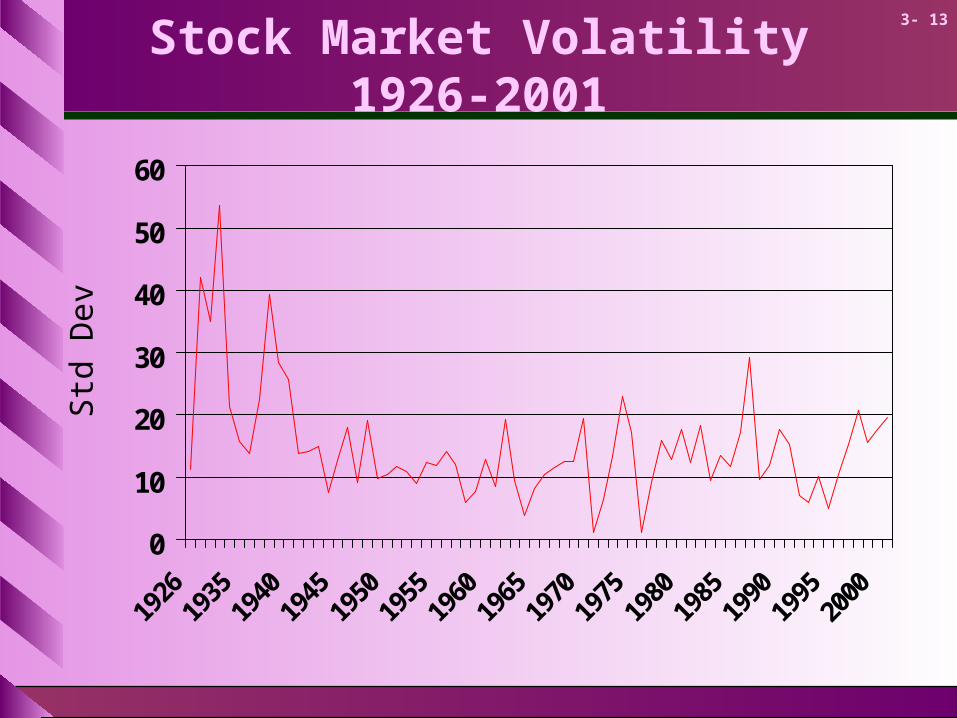
Stock Market Volatility 1926-2001
0
10
20
30
40
50
60
1926
1935
1940
1945
1950
1955
1960
1965
1970
1975
1980
1985
1990
1995
2000
Std
Dev
3- 14
Risk and Diversification
0
5 10 15
Number of Securities
Po
rtfo
lio s
tan
da
rd d
ev
iati
on
3- 15
05 10 15
Number of Securities
Po
rtfo
lio
sta
nd
ard
dev
iati
on
Market risk
Uniquerisk
Risk and Diversification
3- 16
Measuring Market Risk
Market Portfolio - Portfolio of all assets in the economy. In practice a broad stock market index, such as the S&P Composite, is used to represent the market.
Beta - Sensitivity of a stock’s return to the return on the market portfolio.

3- 17
Measuring Market Risk
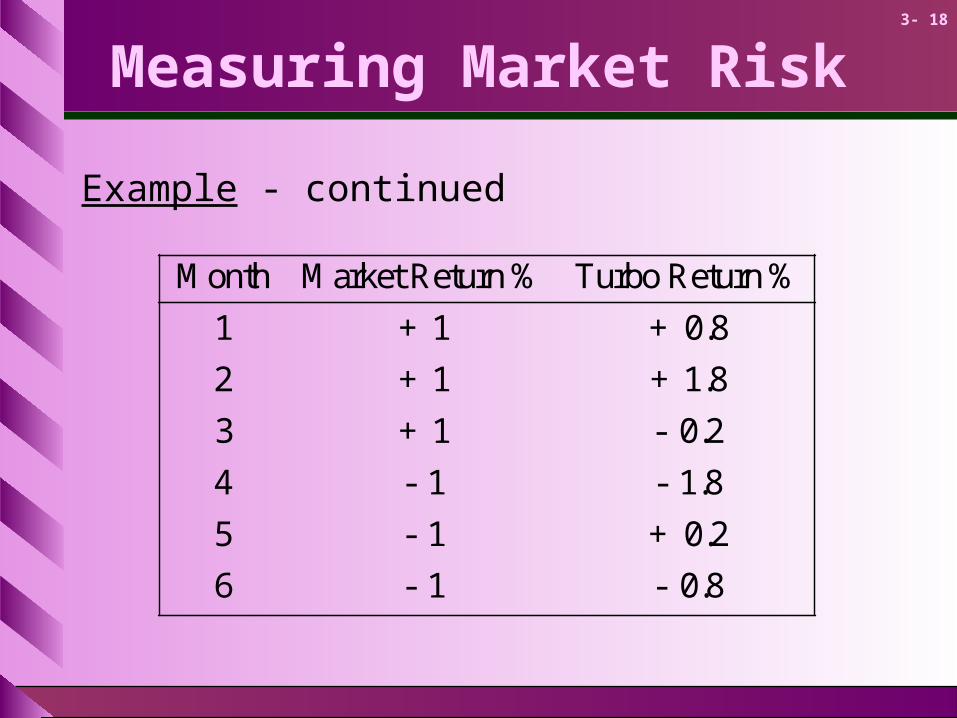
Example - Turbo Charged Seafood has the following % returns on its stock, relative to the listed changes in the % return on the market portfolio. The beta of Turbo Charged Seafood can be derived from this information.
3- 18
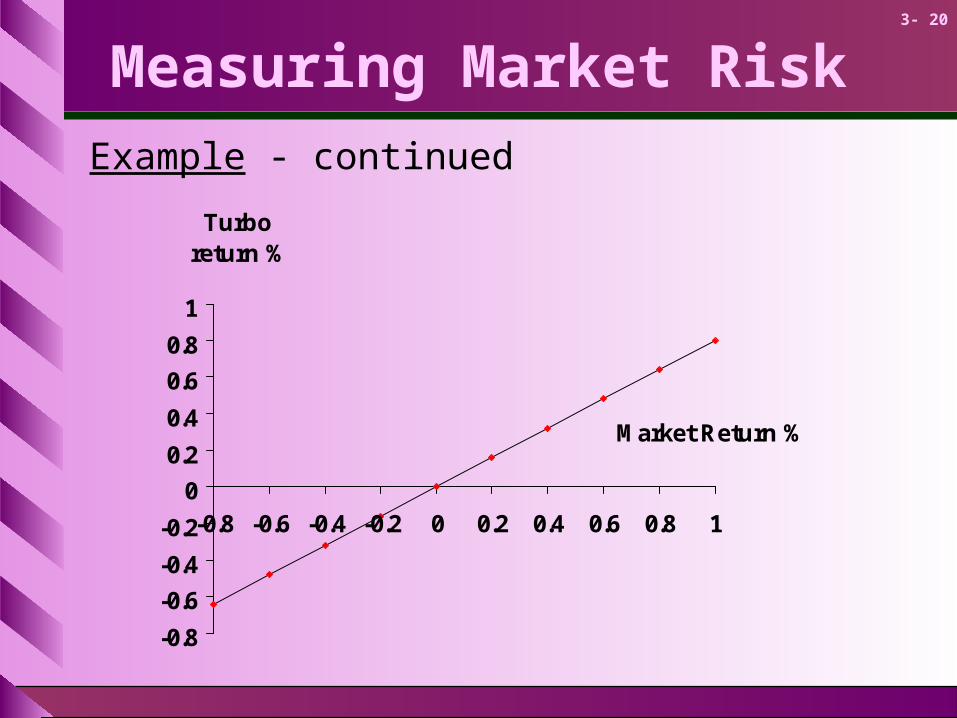
Measuring Market Risk
Month Market Return % Turbo Return %
1 + 1 + 0.8
2 + 1 + 1.8
3 + 1 - 0.2
4 - 1 - 1.8
5 - 1 + 0.2
6 - 1 - 0.8
Example - continued
3- 19
Measuring Market Risk
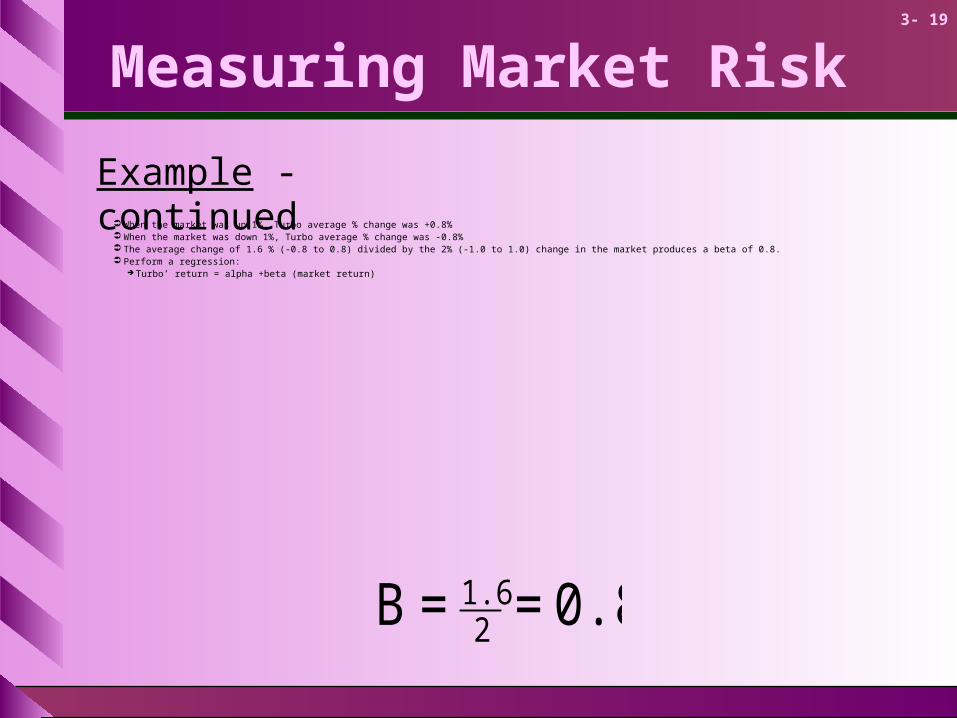
0.8==B 21.6
When the market was up 1%, Turbo average % change was +0.8% When the market was down 1%, Turbo average % change was -0.8% The average change of 1.6 % (-0.8 to 0.8) divided by the 2% (-1.0 to 1.0) change in the market produces a beta of 0.8. Perform a regression:
Turbo’ return = alpha +beta (market return)
Example - continued
3- 20
Measuring Market Risk
Example - continued
-0.8
-0.6
-0.4
-0.2
0
0.2
0.4
0.6
0.8
1
-0.8 -0.6 -0.4 -0.2 0 0.2 0.4 0.6 0.8 1
Market Return %
Turbo return %
3- 21
Portfolio Betas
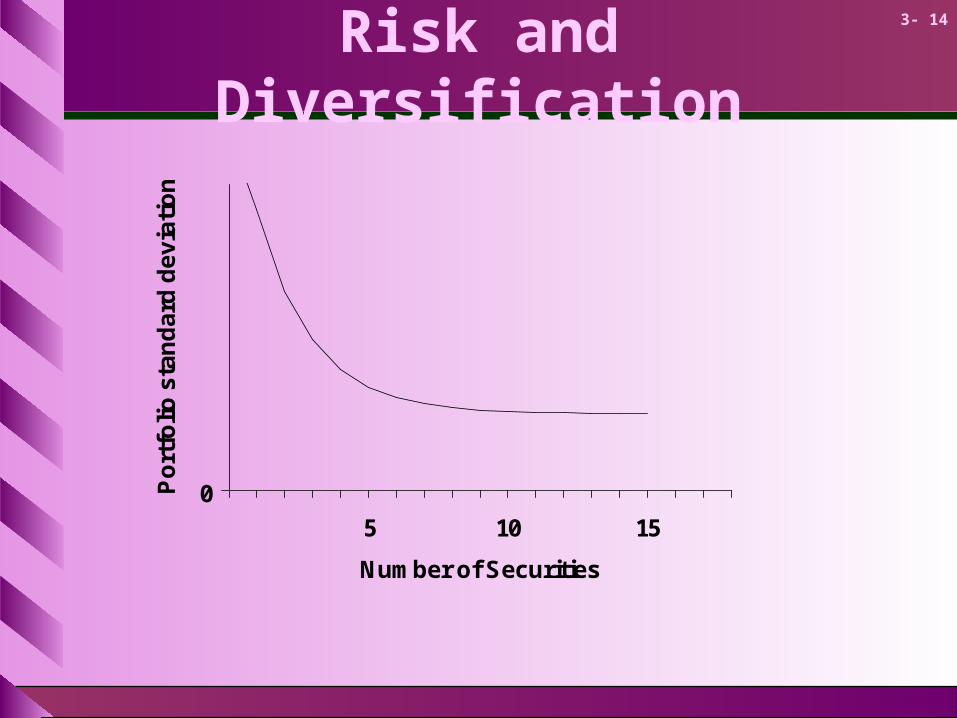
Diversification decreases variability from unique risk, but not from market risk.
The beta of your portfolio will be an average of the betas of the securities in the portfolio.
If you owned all of the S&P Composite Index stocks, you would have an average beta of 1.0

3- 22
Stock Betas
.31Heinz.H.J
.41ExxonMobil
.57Pfizer
.66sMcDonald'
.67PepsiCo
1.00Airlines Delta
1.05Ford
1.18GE
2.14erDellComput
3.30Amazon
BetaStock
B
3- 23
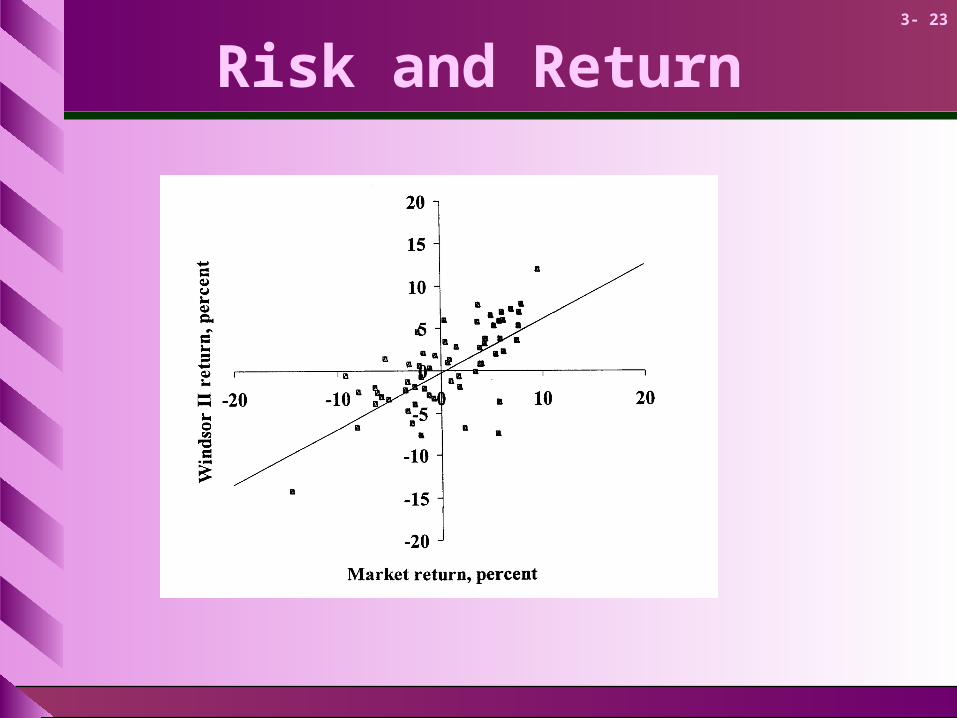
Risk and Return
3- 24
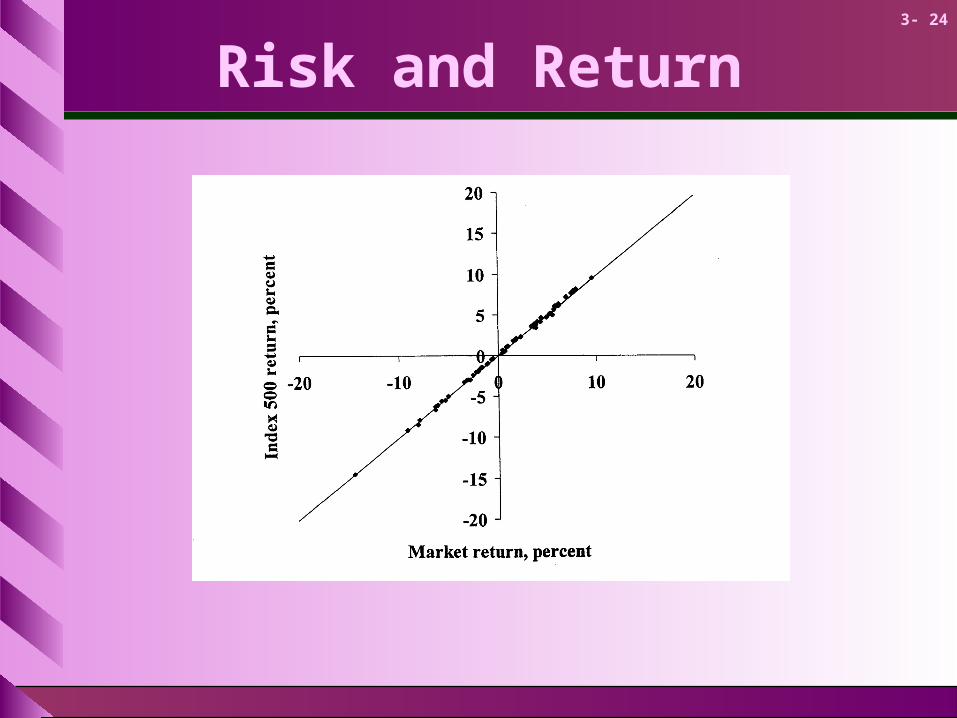
Risk and Return
3- 25
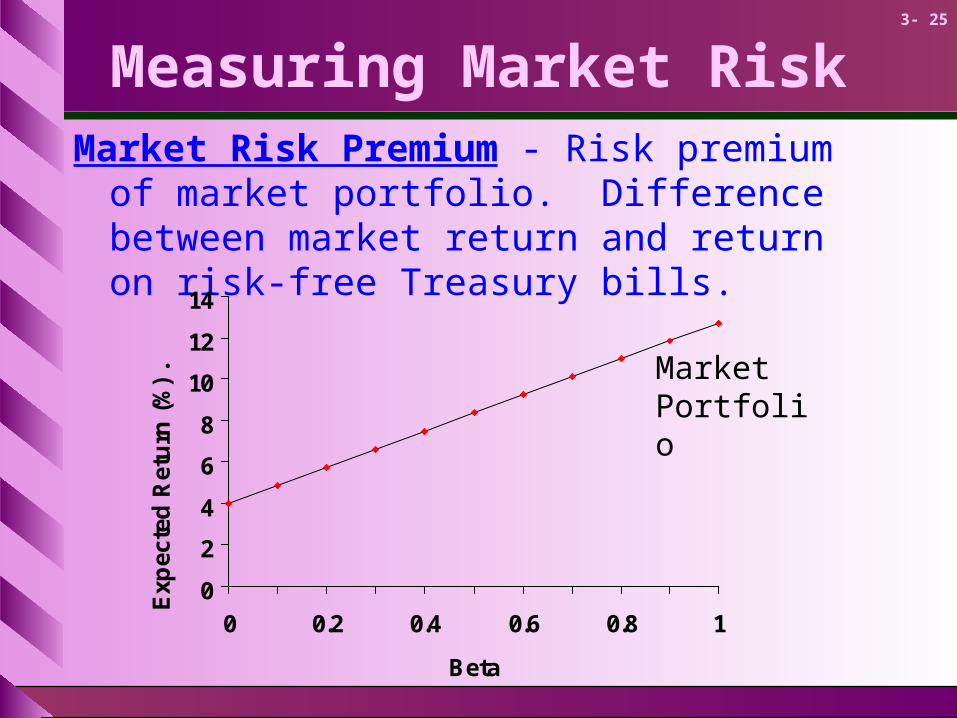
Measuring Market RiskMarket Risk Premium - Risk premium of market
portfolio. Difference between market return and return on risk-free Treasury bills.
0
2
4
6
8
10
12
14
0 0.2 0.4 0.6 0.8 1
Beta
Exp
ecte
d R
etu
rn (
%)
. Market Portfolio
3- 26
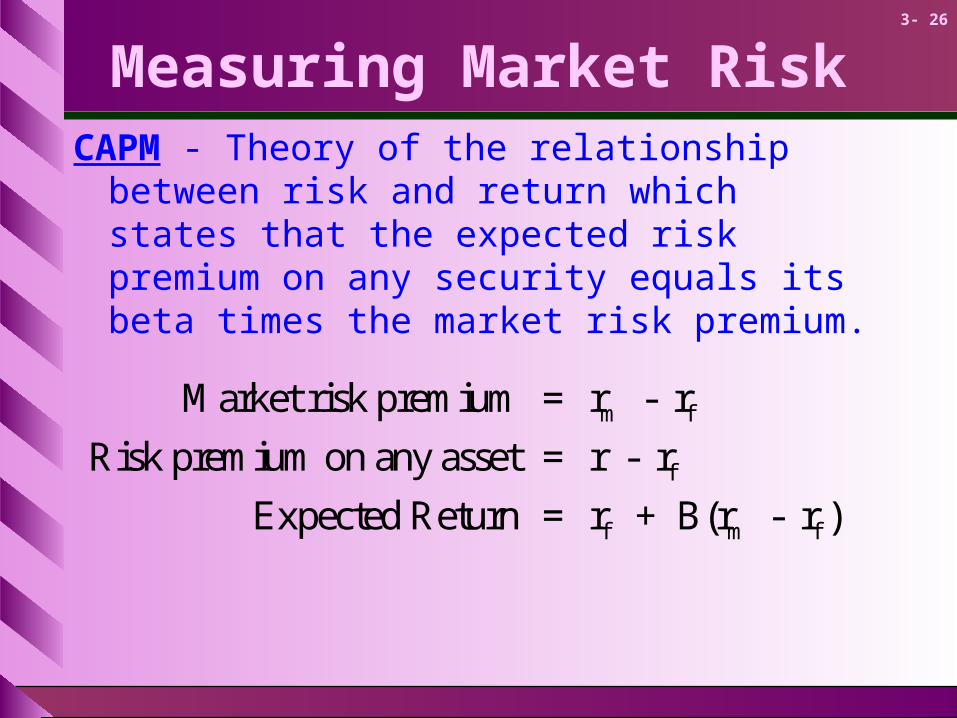
Measuring Market RiskCAPM - Theory of the relationship between risk and
return which states that the expected risk premium on any security equals its beta times the market risk premium.
Market risk premium = r - r
Risk premium on any asset = r - r
Expected Return = r + B(r - r )
m f
f
f m f
3- 27
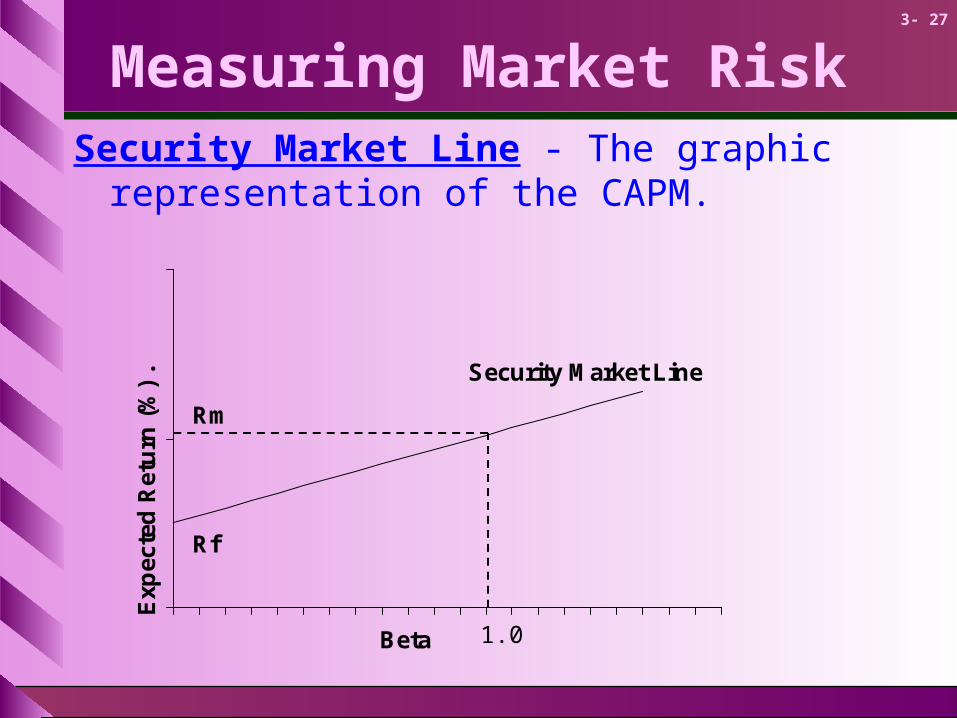
Measuring Market RiskSecurity Market Line - The graphic representation
of the CAPM.
Beta
Exp
ecte
d R
etu
rn (
%)
.
Rf
Rm
Security Market Line
1.0
3- 28
Capital Budgeting & Project Risk
The project cost of capital depends on the use to which the capital is being put. Therefore, it depends on the risk of the project and not the risk of the company.
3- 29
Capital Budgeting & Project Risk
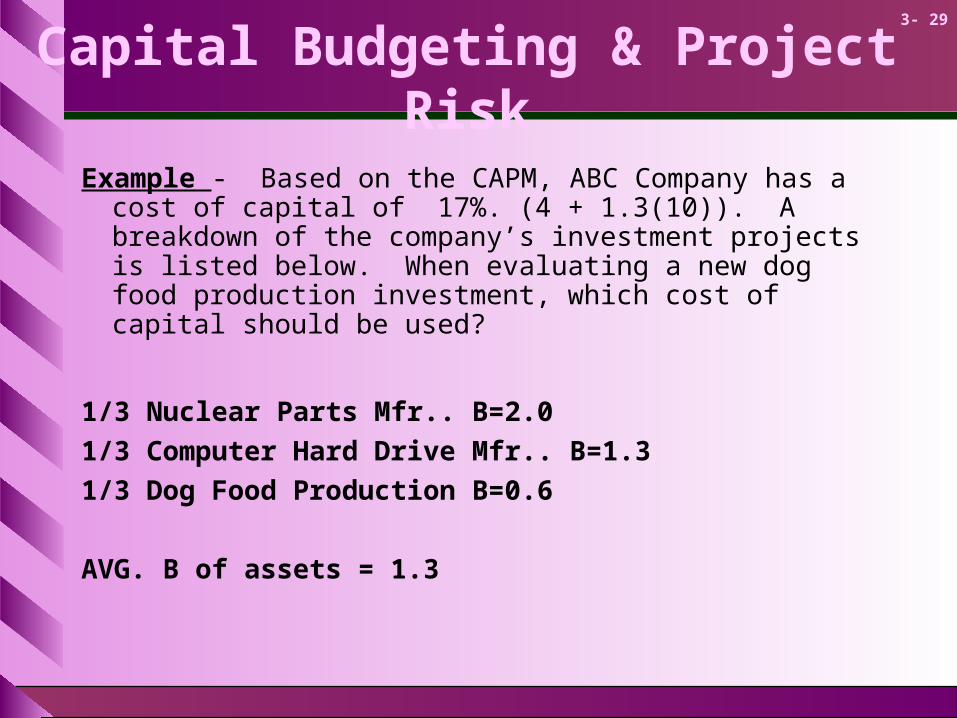
Example - Based on the CAPM, ABC Company has a cost of capital of 17%. (4 + 1.3(10)). A breakdown of the company’s investment projects is listed below. When evaluating a new dog food production investment, which cost of capital should be used?
1/3 Nuclear Parts Mfr.. B=2.0
1/3 Computer Hard Drive Mfr.. B=1.3
1/3 Dog Food Production B=0.6
AVG. B of assets = 1.3
3- 30
Capital Budgeting & Project Risk
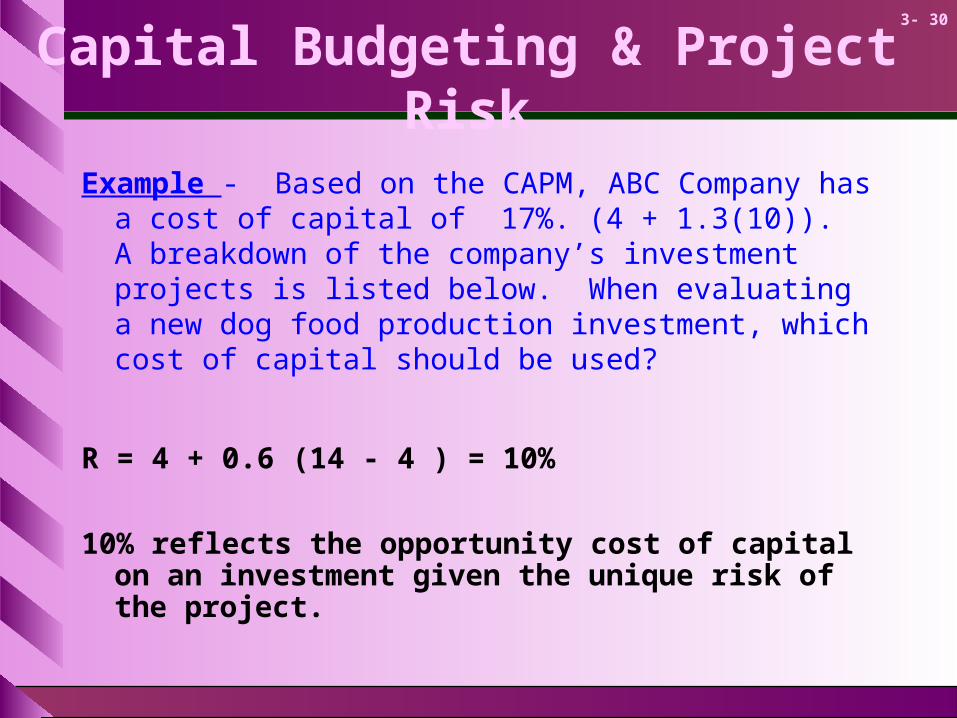
Example - Based on the CAPM, ABC Company has a cost of capital of 17%. (4 + 1.3(10)). A breakdown of the company’s investment projects is listed below. When evaluating a new dog food production investment, which cost of capital should be used?
R = 4 + 0.6 (14 - 4 ) = 10%
10% reflects the opportunity cost of capital on an investment given the unique risk of the project.
3- 31
Cost of Capital
Cost of Capital - The return the firm’s investors expect to earn if they invested in securities with comparable degrees of risk.
Capital Structure - The firm’s mix of long term financing and equity financing.
3- 32
Cost of Capital
Example
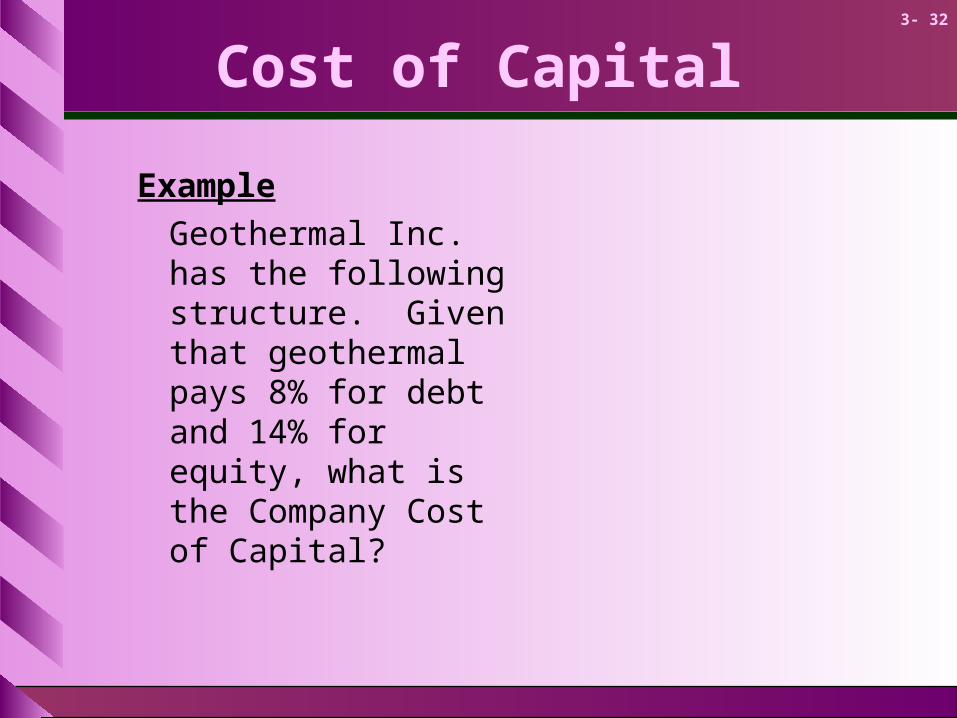
Geothermal Inc. has the following structure. Given that geothermal pays 8% for debt and 14% for equity, what is the Company Cost of Capital?
3- 33
Cost of Capital
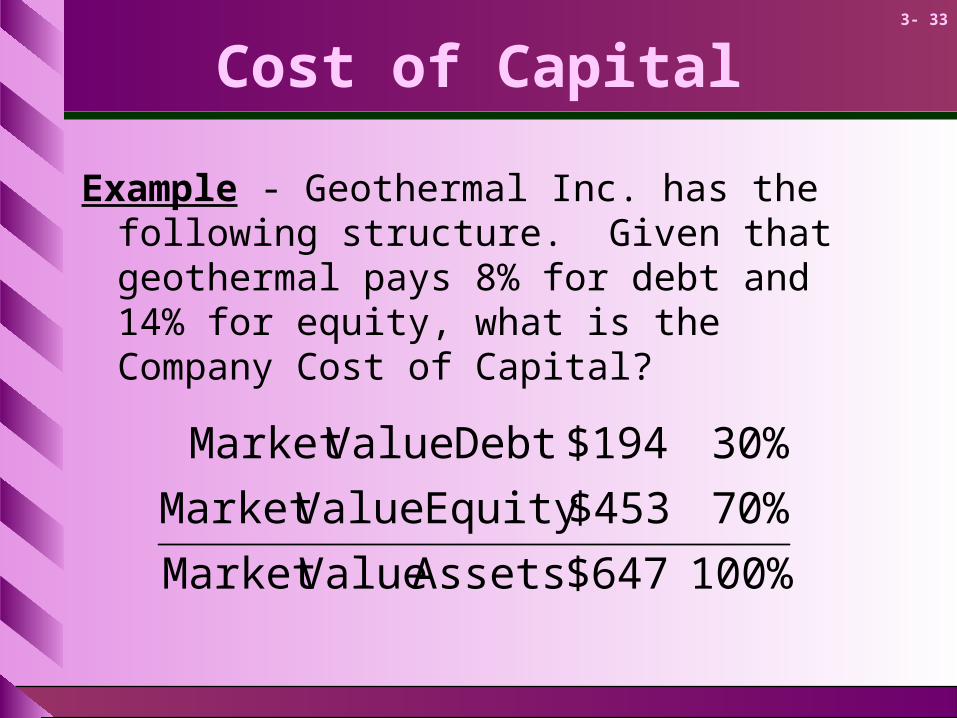
Example - Geothermal Inc. has the following structure. Given that geothermal pays 8% for debt and 14% for equity, what is the Company Cost of Capital?
100%$647Assets ValueMarket
70%$453 EquityValueMarket
30%$194 DebtValueMarket
3- 34
Cost of Capital
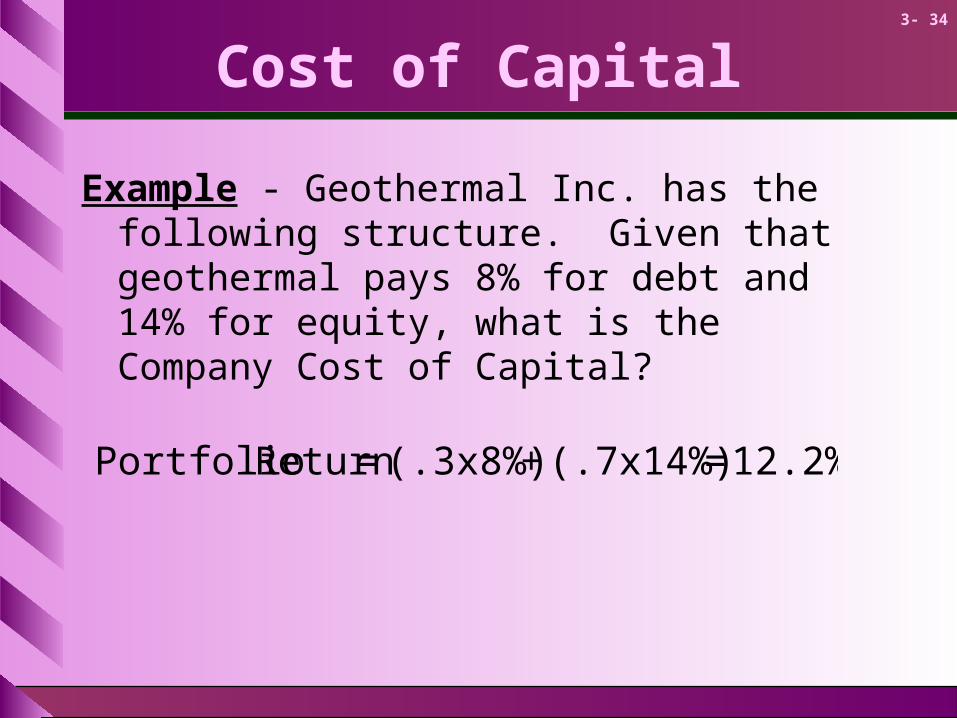
Example - Geothermal Inc. has the following structure. Given that geothermal pays 8% for debt and 14% for equity, what is the Company Cost of Capital?
12.2%=(.7x14%)+(.3x8%)= ReturnPortfolio
3- 35
Cost of Capital
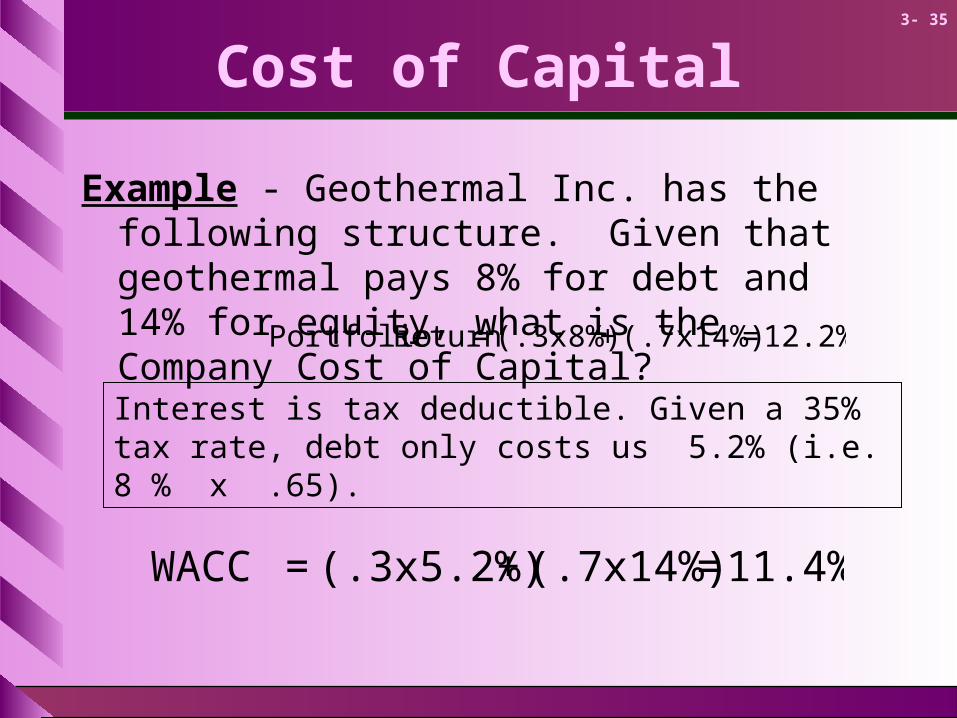
Example - Geothermal Inc. has the following structure. Given that geothermal pays 8% for debt and 14% for equity, what is the Company Cost of Capital? 12.2%=(.7x14%)+(.3x8%)= ReturnPortfolio
Interest is tax deductible. Given a 35% tax rate, debt only costs us 5.2% (i.e. 8 % x .65).
11.4%=(.7x14%)+(.3x5.2%)= WACC

3- 36
WACC
Weighted Average Cost of Capital (WACC) - The expected rate of return on a portfolio of all the firm’s securities.
Company cost of capital = Weighted average of debt and equity returns.
3- 37
WACC
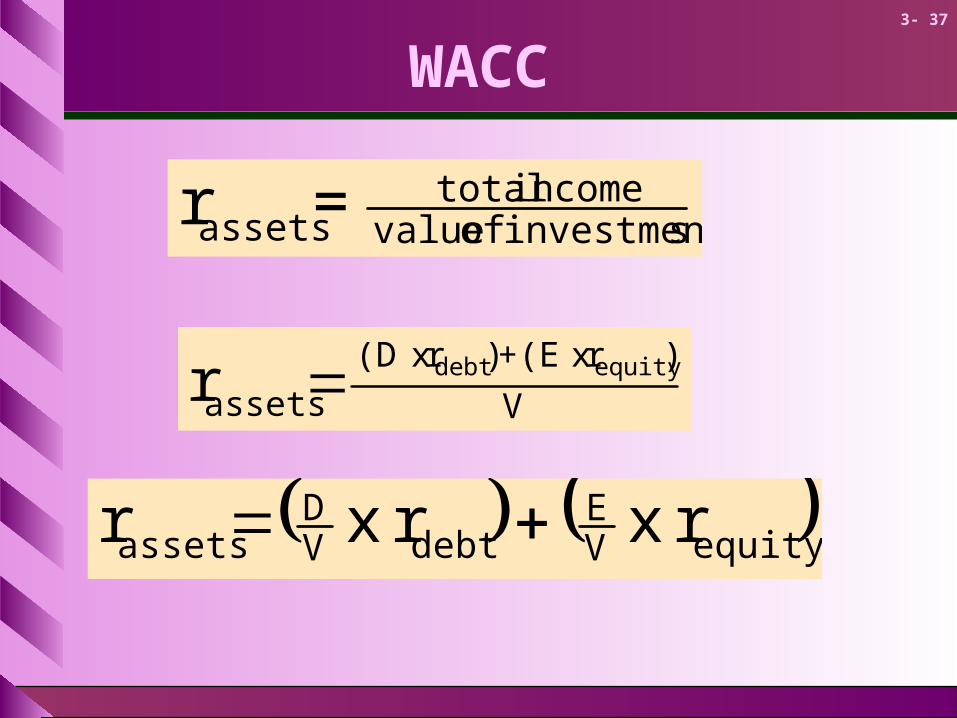
V
)r x (E+)r x (D
assetsequitydebtr
equityVE
debtVD
assets rx rx r
sinvestment of valueincome total
assets =r

3- 38
WACC
Three Steps to Calculating Cost of Capital
1. Calculate the value of each security as a proportion of the firm’s market value.
2. Determine the required rate of return on each security.
3. Calculate a weighted average of these required returns.
3- 39
WACC
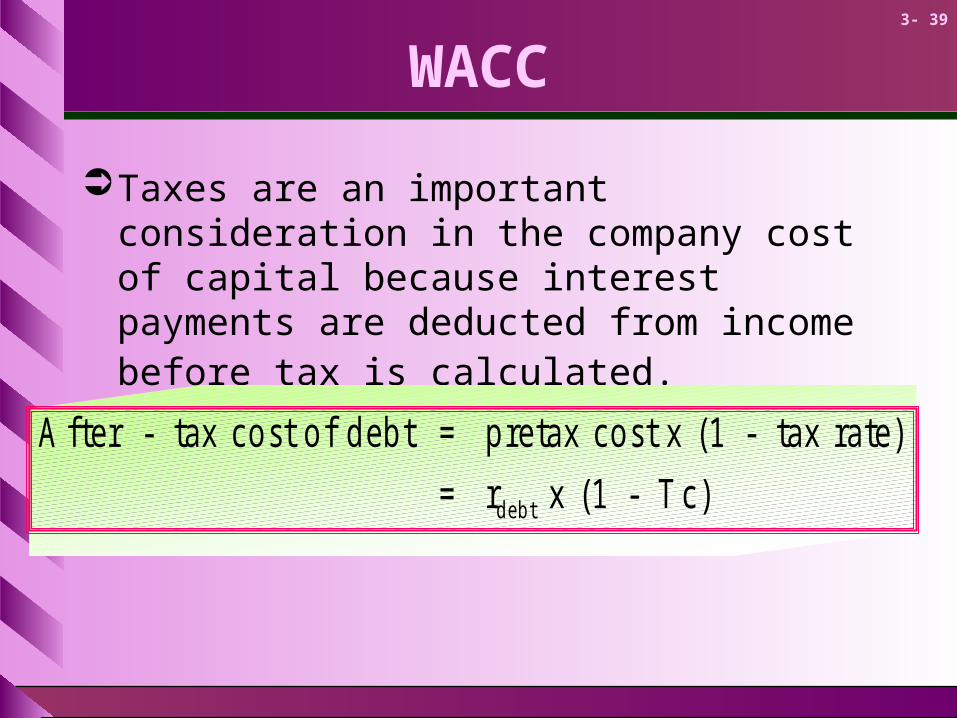
Taxes are an important consideration in the company cost of capital because interest payments are deducted from income before tax is calculated.
A f te r - ta x c o s t o f d e b t = p re ta x c o s t x (1 - ta x r a te )
= r x (1 - T c )d e b t
3- 40
WACC
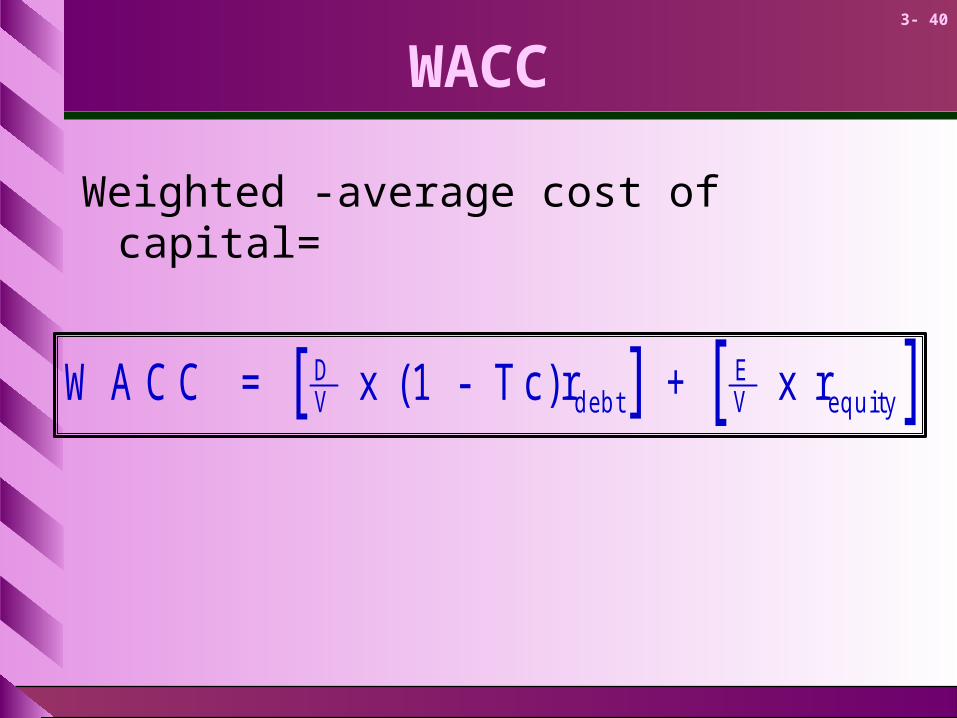
Weighted -average cost of capital=
[ ] [ ]W A C C = x ( 1 - T c ) r + x rDV d e b t
EV e q u i ty
3- 41
WACC
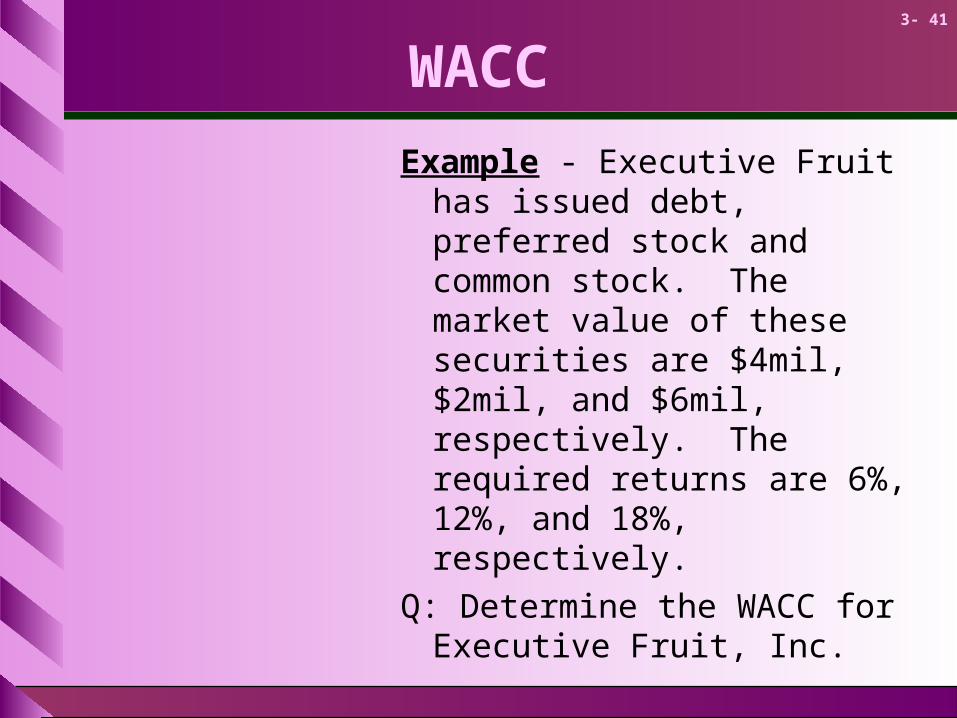
Example - Executive Fruit has issued debt, preferred stock and common stock. The market value of these securities are $4mil, $2mil, and $6mil, respectively. The required returns are 6%, 12%, and 18%, respectively.
Q: Determine the WACC for Executive Fruit, Inc.
3- 42
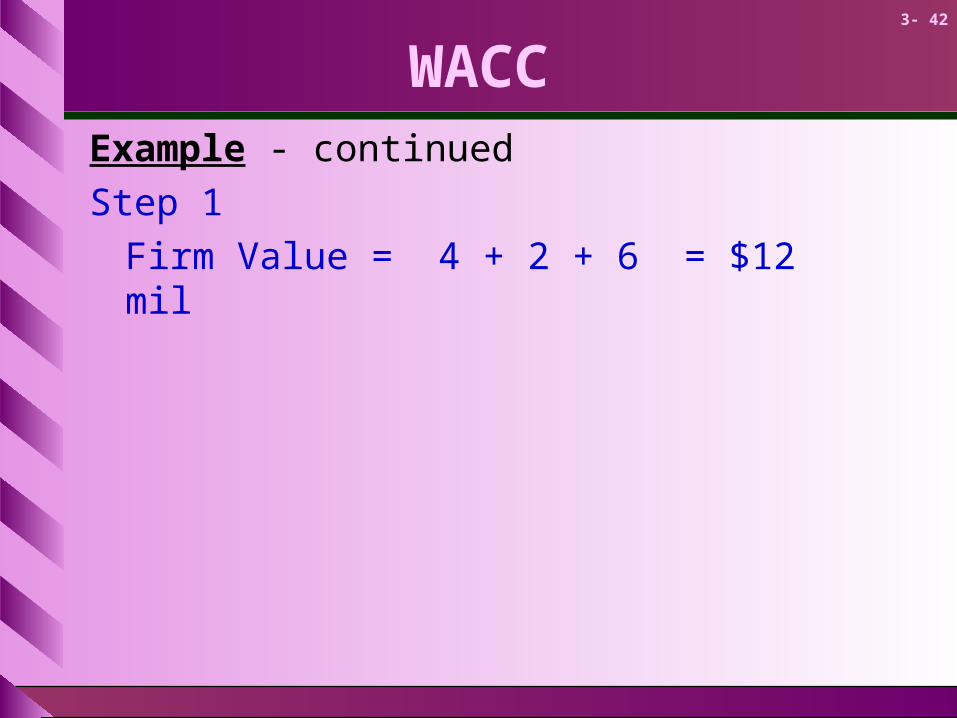
WACCExample - continued
Step 1
Firm Value = 4 + 2 + 6 = $12 mil

3- 43
WACCExample - continued
Step 1
Firm Value = 4 + 2 + 6 = $12 mil
Step 2
Required returns are given

3- 44
WACCExample - continued
Step 1
Firm Value = 4 + 2 + 6 = $12 mil
Step 2
Required returns are given
Step 3
[ ] ( ) ( )WACC = x(1-.35).06 + x.12 + x.18
=.123 or 12.3%
412
212
612
3- 45
WACC
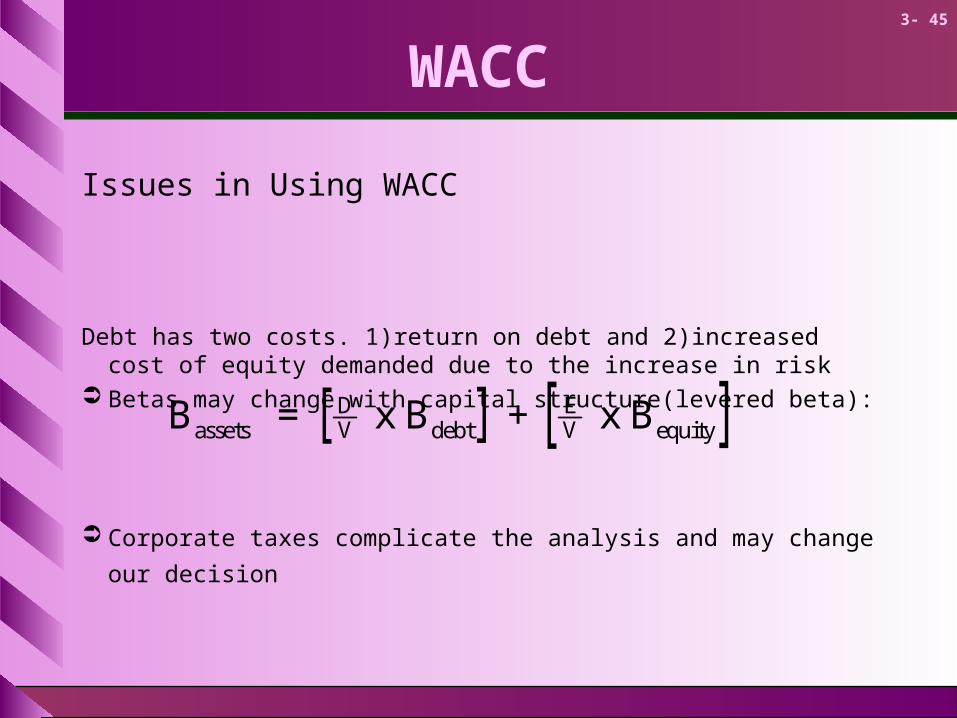
Issues in Using WACC
Debt has two costs. 1)return on debt and 2)increased cost of equity demanded due to the increase in risk
Betas may change with capital structure(levered beta):
Corporate taxes complicate the analysis and may change our
decision
[ ] [ ]B = x B + x BassetsDV debt
EV equity
3- 46
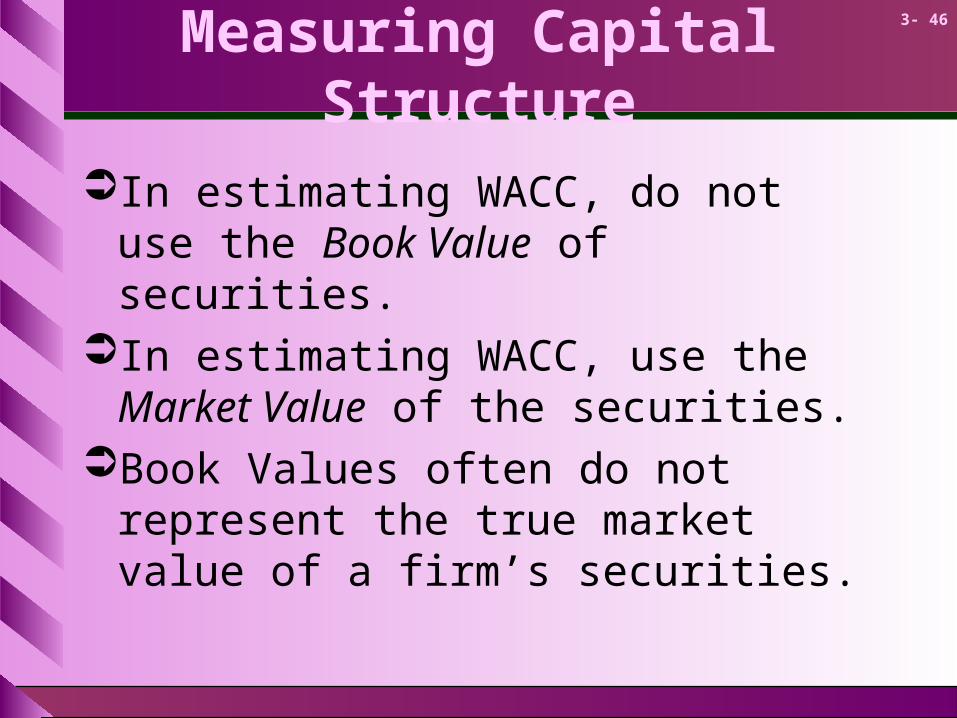
Measuring Capital Structure
In estimating WACC, do not use the Book Value of securities.
In estimating WACC, use the Market Value of the securities.
Book Values often do not represent the true market value of a firm’s securities.
3- 47
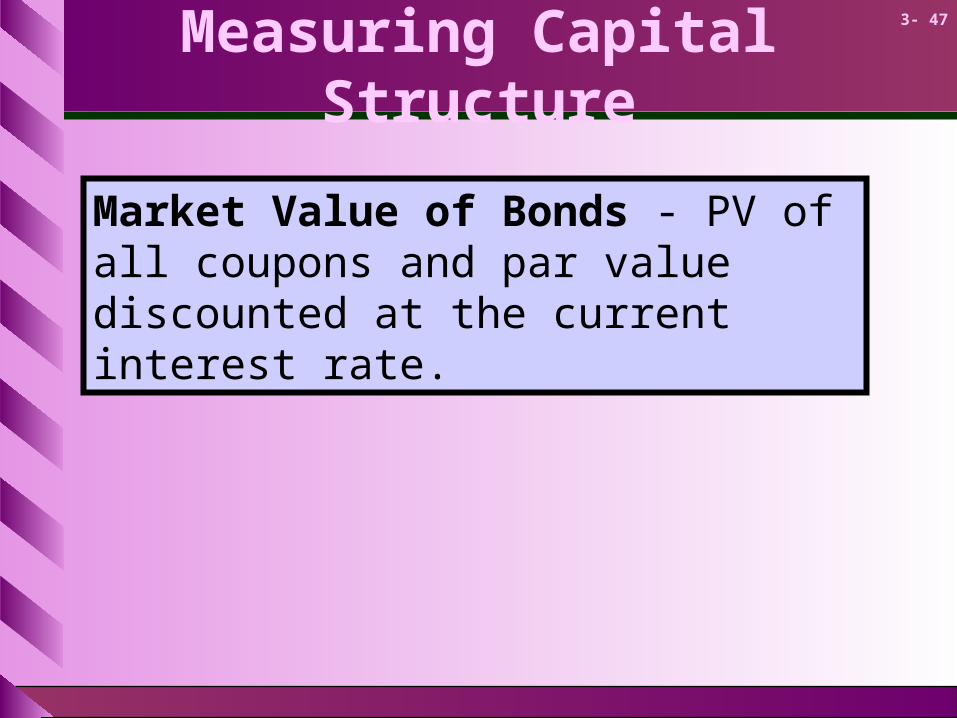
Measuring Capital Structure
Market Value of Bonds - PV of all coupons and par value discounted at the current interest rate.
3- 48
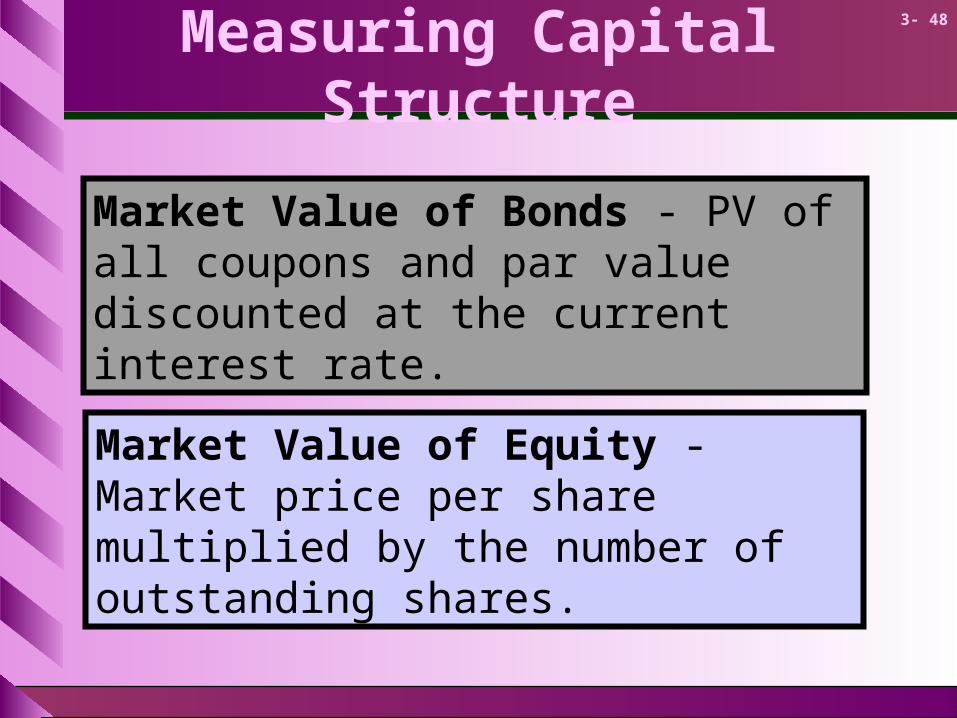
Measuring Capital Structure
Market Value of Bonds - PV of all coupons and par value discounted at the current interest rate.
Market Value of Equity - Market price per share multiplied by the number of outstanding shares.
3- 49
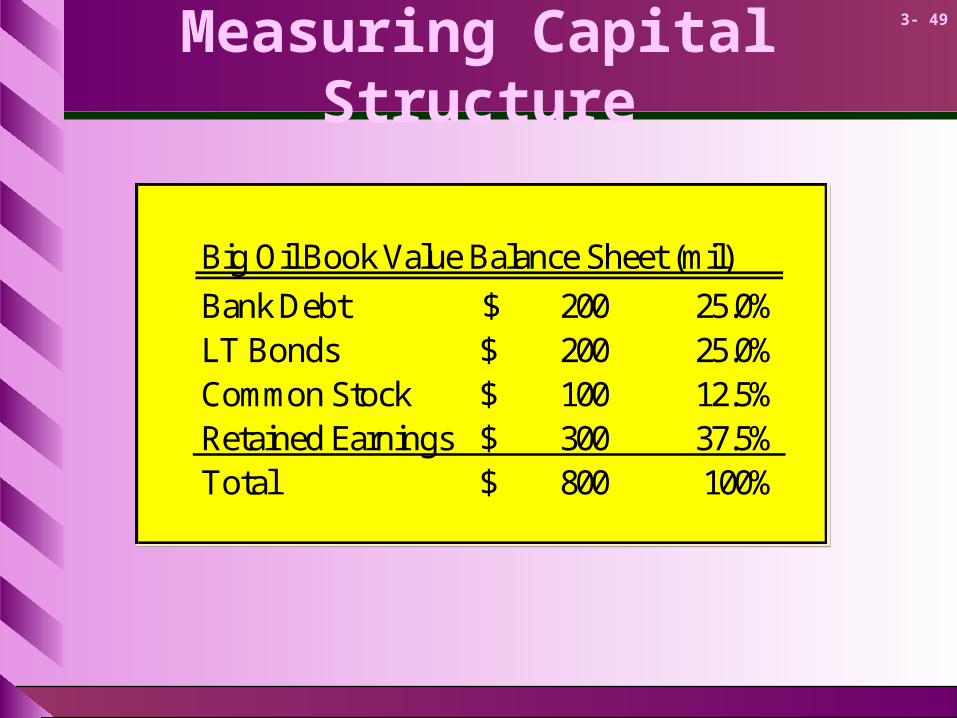
Measuring Capital Structure
Big Oil Book Value Balance Sheet (mil)
Bank Debt 200$ 25.0%LT Bonds 200$ 25.0%Common Stock 100$ 12.5%Retained Earnings 300$ 37.5%Total 800$ 100%
Big Oil Book Value Balance Sheet (mil)
Bank Debt 200$ 25.0%LT Bonds 200$ 25.0%Common Stock 100$ 12.5%Retained Earnings 300$ 37.5%Total 800$ 100%

3- 50
Measuring Capital Structure
Big Oil Book Value Balance Sheet (mil)
Bank Debt 200$ 25.0%LT Bonds 200$ 25.0%Common Stock 100$ 12.5%Retained Earnings 300$ 37.5%Total 800$ 100%
Big Oil Book Value Balance Sheet (mil)
Bank Debt 200$ 25.0%LT Bonds 200$ 25.0%Common Stock 100$ 12.5%Retained Earnings 300$ 37.5%Total 800$ 100%
If the long term bonds pay an 8% coupon and mature in 12 years, what is their market value assuming a 9% YTM?
70.185$09.1
216....
09.1
16
09.1
16
09.1
161232
PV
3- 51
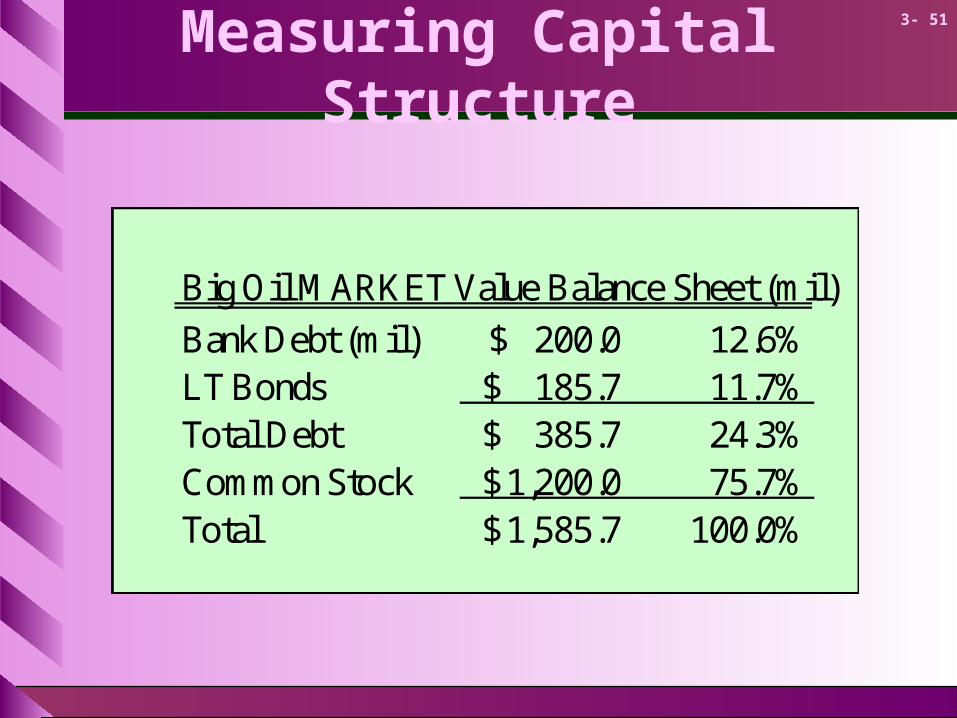
Measuring Capital Structure
Big Oil MARKET Value Balance Sheet (mil)
Bank Debt (mil) 200.0$ 12.6%LT Bonds 185.7$ 11.7%Total Debt 385.7$ 24.3%Common Stock 1,200.0$ 75.7%Total 1,585.7$ 100.0%
3- 52
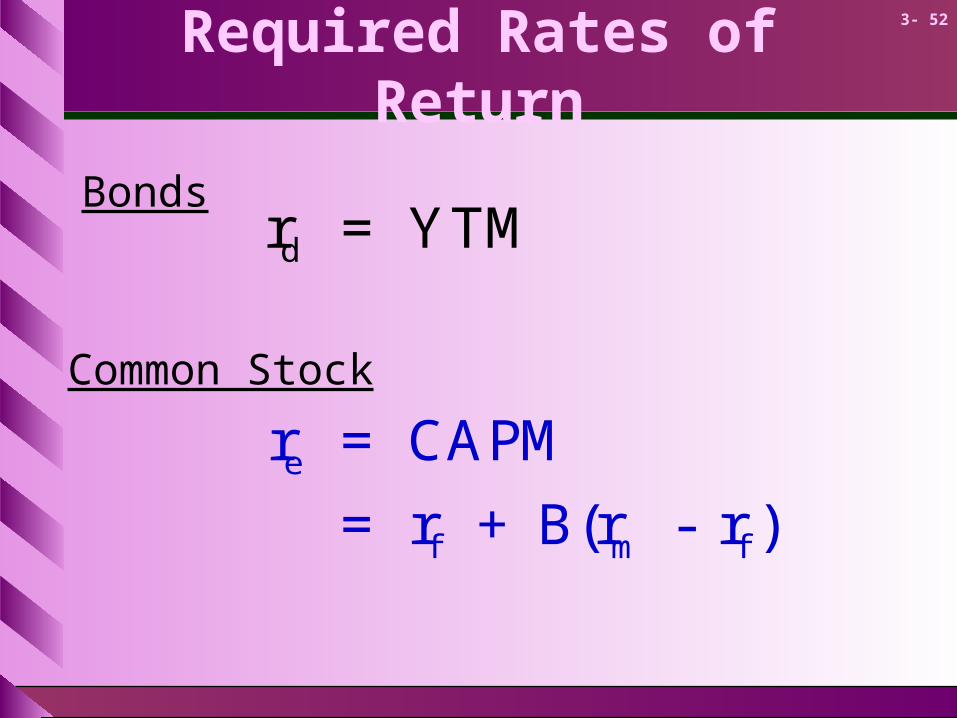
Required Rates of Return
Bondsr = YTMd
r = CAPM
= r + B(r - r )e
f m f
Common Stock
3- 53
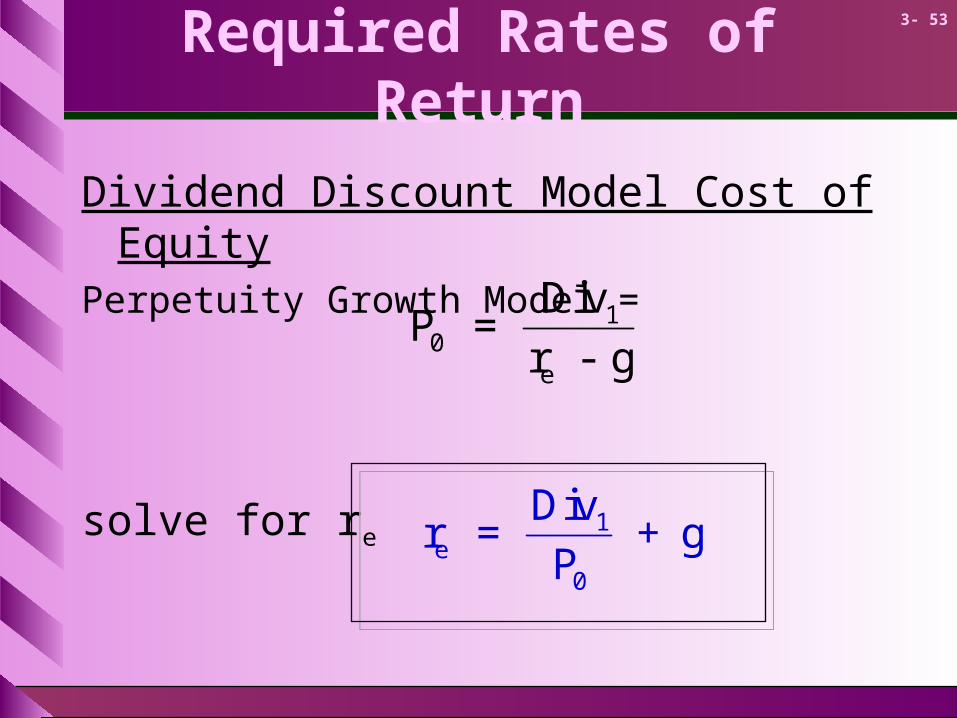
Required Rates of Return
Dividend Discount Model Cost of EquityPerpetuity Growth Model =
solve for re
P =Div
r - g01
e
r =Div
P+ ge
1
0

3- 54
Required Rates of Return
Expected Return on Preferred StockPrice of Preferred Stock =
solve for rpreferred
P =Div
r01
preferred
r =Div
Ppreferred1
0

3- 55
Flotation Costs
The cost of implementing any financing decision must be incorporated into the cash flows of the project being evaluated.
Only the incremental costs of financing should be included.