Embed Size (px)
Citation preview
3-19-2004 1
Harnessing IT to Green Buildings -UCB as a Living Laboratory
David E. Culler
UCB/IBM Meeting
March 19. 2009
MModelMMitigate
MMonitor

3-19-2004 2
What they say about buldings
Source: U.S. Department of Energy 2007 Building Energy Data Book. Sept 2007
The Numbers Tell the Story
$370 BillionTotal U.S. Annual Energy Costs
200%Increase in U.S. Electricity Consumption Since 1990
40%Total U.S. Energy Consumption for Buildings
72%Total U.S. Electricity Consumption for Buildings
55%Total U.S. Natural Gas Consumption for Buildings
The Numbers Tell the Story
$370 BillionTotal U.S. Annual Energy Costs
200%Increase in U.S. Electricity Consumption Since 1990
40%Total U.S. Energy Consumption for Buildings
72%Total U.S. Electricity Consumption for Buildings
55%Total U.S. Natural Gas Consumption for Buildings
3-19-2004 3
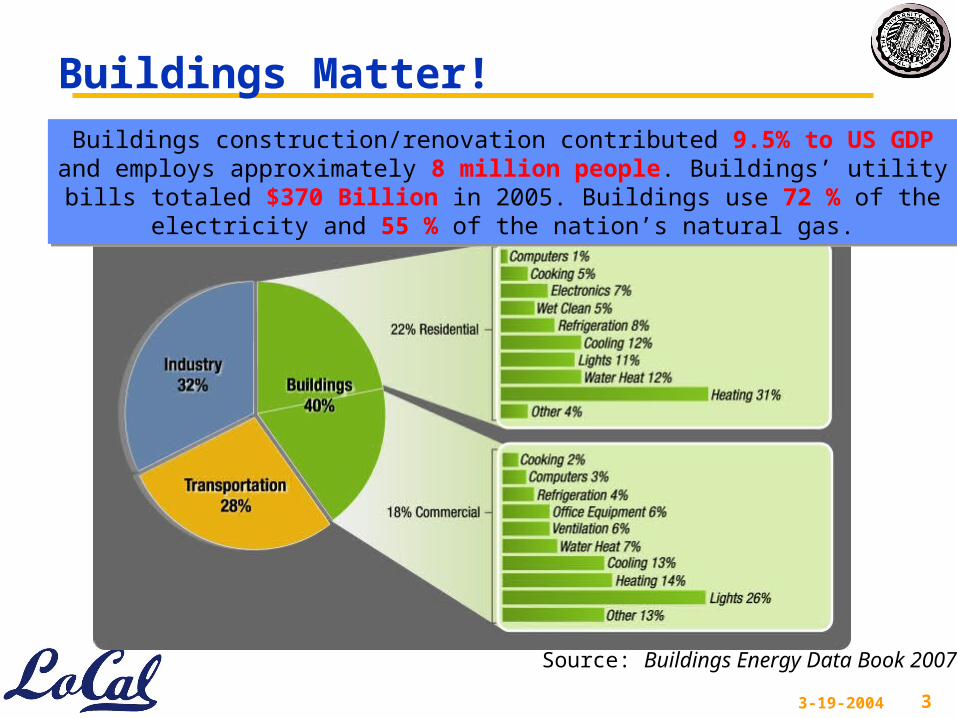
Buildings Matter! Buildings construction/renovation contributed 9.5% to US GDP and employs
approximately 8 million people. Buildings’ utility bills totaled $370 Billion in 2005. Buildings use 72 % of the electricity and 55 % of the nation’s natural gas.
Buildings construction/renovation contributed 9.5% to US GDP and employs approximately 8 million people. Buildings’ utility bills totaled $370 Billion in 2005.
Buildings use 72 % of the electricity and 55 % of the nation’s natural gas.
Source: Buildings Energy Data Book 2007
3-19-2004 4
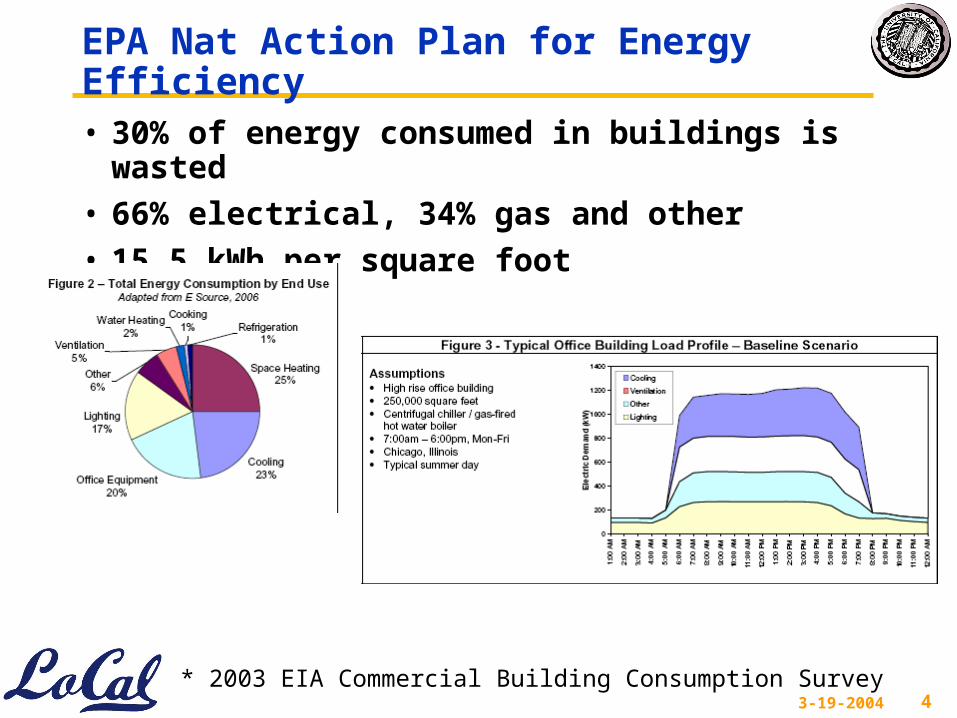
EPA Nat Action Plan for Energy Efficiency
• 30% of energy consumed in buildings is wasted
• 66% electrical, 34% gas and other
• 15.5 kWh per square foot
* 2003 EIA Commercial Building Consumption Survey

3-19-2004 5
UCB today
• Consumes 210 M kwh annually [campus sustainability assessment]
• Buildings measured @ 130 M kwh annually [demandless]
– approx $13 M
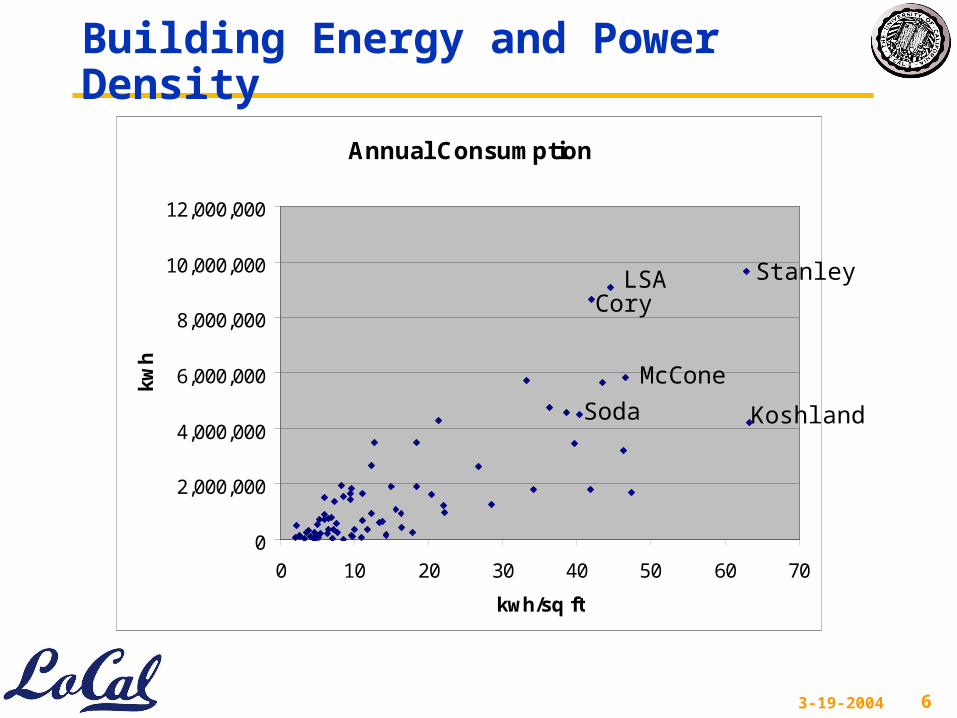
• Top 15 buildings are 2-4 time national average khw/sq ft and constitute 58% of the 130 M
• IT is a big part of the problem
• IT can potentially be a big part of the solution– We need to gain most of the reduction by utilizing existing
facilities better
– “Physical” Information processing to identify where the energy goes, what to change and how.
– Big gains come from changing Operation Processes
– IT is key to providing the energy awareness to guide action
3-19-2004 6
Building Energy and Power Density
Annual Consumption
0
2,000,000
4,000,000
6,000,000
8,000,000
10,000,000
12,000,000
0 10 20 30 40 50 60 70
kwh/sq ft
kwh
Stanley
KoshlandSoda
CoryLSA
McCone

3-19-2004 7
One example: Soda Hall
• Huge baseline load!
• 1300 SCADA sense/control points inaccessible for analysis– No clear understanding of what knobs to turn or when
Servers / Clusters
HVAC / CRU / PDU support
Lighting
HVAC & Plug Loads
443
~1200
3-19-2004 8
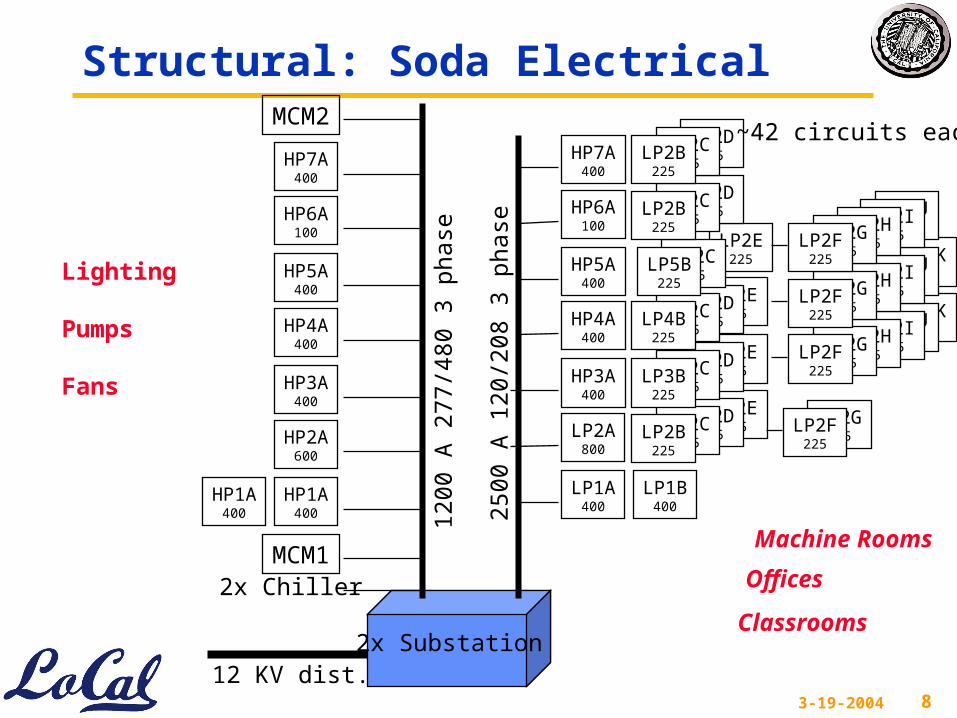
Structural: Soda Electrical
12 KV dist.2x Substation
1200
A 2
77/4
80 3
pha
se
2500
A 1
20/2
08 3
pha
se
2x ChillerMCM1
HP1A400
HP1A400
HP2A600
HP3A400
HP4A400
HP5A400
HP6A100
HP7A400
MCM2
Lighting
Pumps
Fans
Machine Rooms
Offices
Classrooms
LP2E225
LP2D225
LP2C225
LP1A400
LP2A800
HP3A400
HP4A400
HP5A400
HP6A100
HP7A400
LP1B400
LP2B225
LP2G225
LP2F225
LP2E225
LP2D225
LP2C225
LP3B225
LP2E225
LP2D225
LP2C225
LP4B225
LP2E225LP2C
225LP5B
225
LP2D225
LP2C225
LP2B225
LP2D225
LP2C225
LP2B225
LP2K225
LP2J225
LP2I225
LP2H225
LP2G225
LP2F225
LP2K225
LP2J225
LP2I225
LP2H225
LP2G225
LP2F225
LP2J225
LP2I225
LP2H225
LP2G225
LP2F225
~42 circuits each

3-19-2004 9
Structural: Soda HVAC
• Blow cold air throughout building
• Maintain circulation• Adjust cooling with
vents and VFDs• Heat it where
needed• AC determined by
needs of the worst heat load
– Comm closet
2x chillers
Cooling Towers
287 288 290
340
420
530
Pumps
Fans
Machine Room ACCs

3-19-2004 10
Legacy MonitoringL SCADA
• 1300 sense / ctrl points in Soda Hall• Vast database of action / effect• Marooned !!!• No science to turning all the knobs
3-19-2004 11
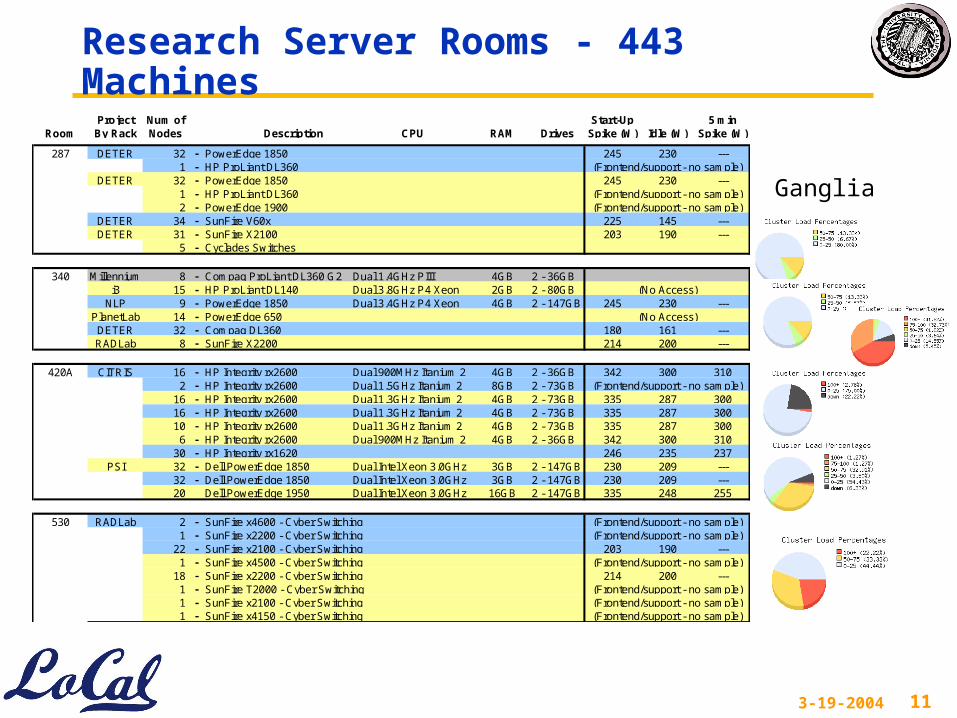
Research Server Rooms - 443 Machines Project Num of Start-Up 5 min
Room By Rack Nodes Description CPU RAM Drives Spike (W) Idle (W) Spike (W)
287 DETER 32 - PowerEdge 1850 245 230 ---1 - HP ProLiant DL360 (Frontend/support - no sample)
DETER 32 - PowerEdge 1850 245 230 ---1 - HP ProLiant DL360 (Frontend/support - no sample)2 - PowerEdge 1900 (Frontend/support - no sample)
DETER 34 - SunFire V60x 225 145 ---DETER 31 - SunFire X2100 203 190 ---
5 - Cyclades Switches
340 Millennium 8 - Compaq ProLiant DL360 G2 Dual 1.4GHz PIII 4GB 2 - 36GBi3 15 - HP ProLiant DL140 Dual 3.8GHz P4 Xeon 2GB 2 - 80GB (No Access)
NLP 9 - PowerEdge 1850 Dual 3.4GHz P4 Xeon 4GB 2 - 147GB 245 230 ---PlanetLab 14 - PowerEdge 650 (No Access)DETER 32 - Compaq DL360 180 161 ---RADLab 8 - SunFire X2200 214 200 ---
420A CITRIS 16 - HP Integrity rx2600 Dual 900MHz Itanium 2 4GB 2 - 36GB 342 300 3102 - HP Integrity rx2600 Dual 1.5GHz Itanium 2 8GB 2 - 73GB (Frontend/support - no sample)
16 - HP Integrity rx2600 Dual 1.3GHz Itanium 2 4GB 2 - 73GB 335 287 30016 - HP Integrity rx2600 Dual 1.3GHz Itanium 2 4GB 2 - 73GB 335 287 30010 - HP Integrity rx2600 Dual 1.3GHz Itanium 2 4GB 2 - 73GB 335 287 3006 - HP Integrity rx2600 Dual 900MHz Itanium 2 4GB 2 - 36GB 342 300 310
30 - HP Integrity rx1620 246 235 237PSI 32 - Dell PowerEdge 1850 Dual Intel Xeon 3.0GHz 3GB 2 - 147GB 230 209 ---
32 - Dell PowerEdge 1850 Dual Intel Xeon 3.0GHz 3GB 2 - 147GB 230 209 ---20 Dell PowerEdge 1950 Dual Intel Xeon 3.0GHz 16GB 2 - 147GB 335 248 255
530 RADLab 2 - SunFire x4600 - Cyber Switching (Frontend/support - no sample)1 - SunFire x2200 - Cyber Switching (Frontend/support - no sample)
22 - SunFire x2100 - Cyber Switching 203 190 ---1 - SunFire x4500 - Cyber Switching (Frontend/support - no sample)
18 - SunFire x2200 - Cyber Switching 214 200 ---1 - SunFire T2000 - Cyber Switching (Frontend/support - no sample)1 - SunFire x2100 - Cyber Switching (Frontend/support - no sample)1 - SunFire x4150 - Cyber Switching (Frontend/support - no sample)
Ganglia

3-19-2004 12
Server Power Consumption
230
15
248
87
190
13
190
13
200
14
161
19
287
48
0
50
100
150
200
250
300
350
Wat
ts
Pow
erE
dge
1850
Del
l Pow
erE
dge
1950
Sun
Fire
V60
x
Sun
Fire
x21
00 -
Cyb
er S
witc
hing
Sun
Fire
X22
00
Com
paq
DL3
60
HP
Int
egrit
y rx
2600
Server Power Consumption
Active
Idle Soda Machine Room Power Consumption
26.5 30.6 31
18.118.9 19
44.5
50.9 50
9.5
10.117
10
31
0
20
40
60
80
100
120
140
160
180
est kW min est kW max kW meas
KW
290 Soda
288 Soda
530 Soda
420A Soda
340 Soda
287 Soda
• x 1/PDU efficiency + ACC
• If Pidle = 0 we’d save ~125 kw x 24 hours x 365 …
• … Do Nothing Well
3-19-2004 13
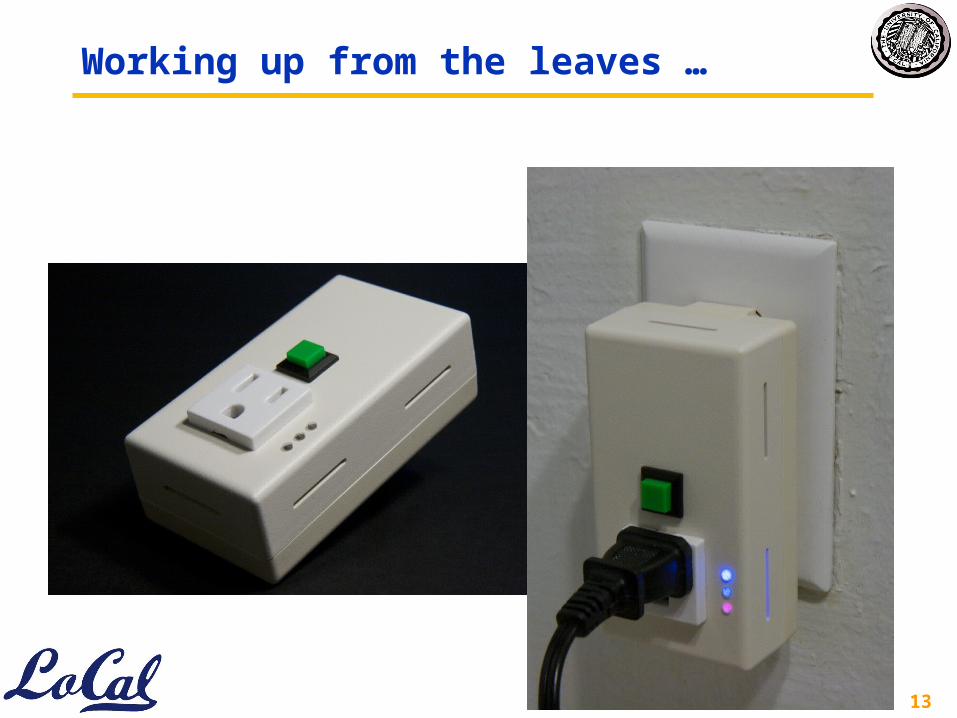
Working up from the leaves …
3-19-2004 14
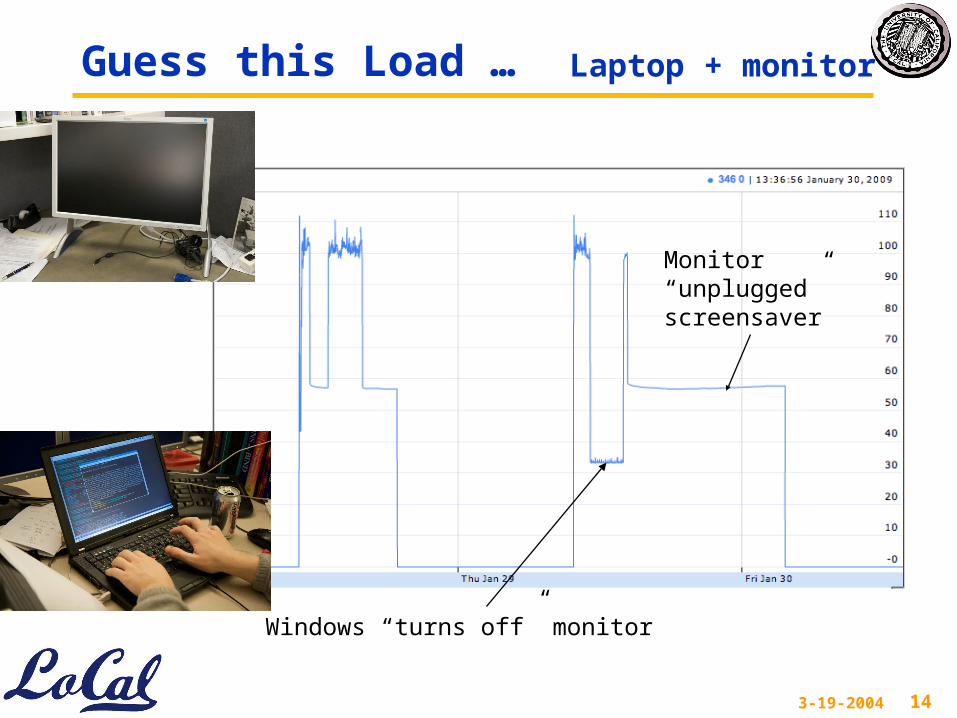
Guess this Load … Laptop + monitor
Windows “turns off” monitor
Monitor “unplugged” screensaver

3-19-2004 15
Composite Power Picture
Monitor On, Unplugged
Desktop Idle
inauguration
Projector left OnClean Shutdown
3-19-2004 16
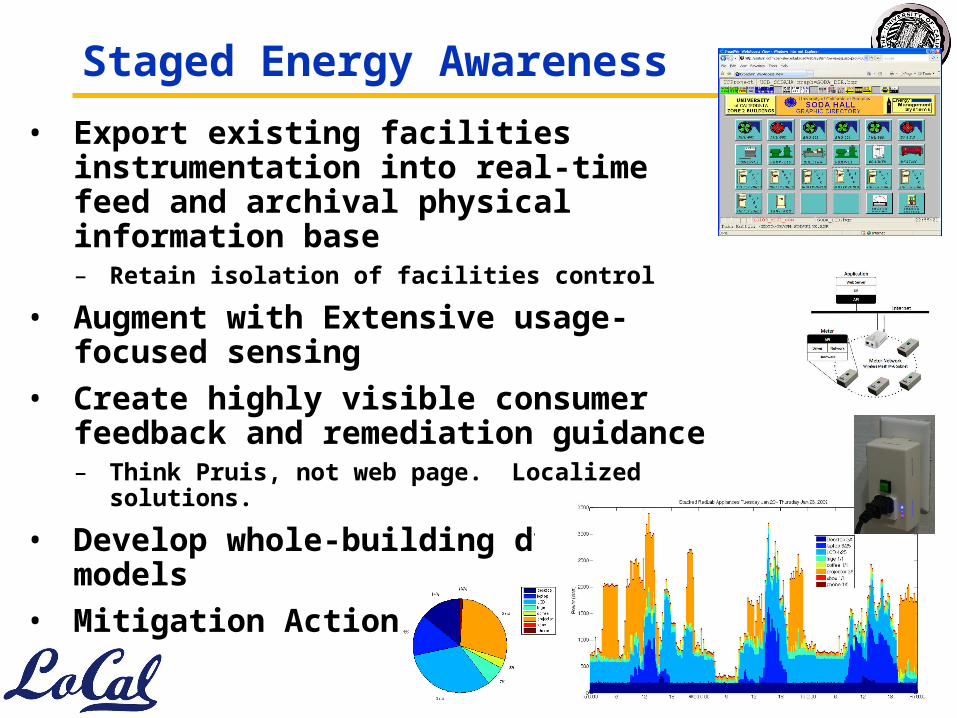
Staged Energy Awareness
• Export existing facilities instrumentation into real-time feed and archival physical information base– Retain isolation of facilities control
• Augment with Extensive usage-focused sensing
• Create highly visible consumer feedback and remediation guidance– Think Pruis, not web page. Localized solutions.
• Develop whole-building dynamic models
• Mitigation Actions with PFS
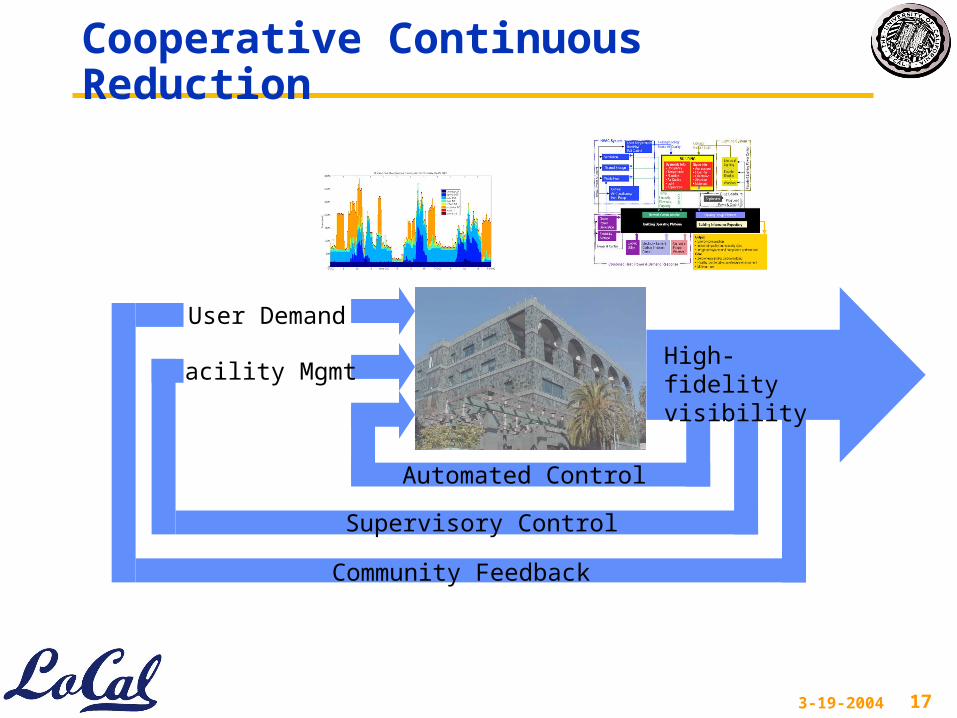
3-19-2004 17
Cooperative Continuous Reduction
Automated Control
Facility Mgmt
User Demand
Supervisory Control
Community Feedback
High-fidelity visibility