Embed Size (px)
Citation preview

Contents lists available at ScienceDirect
Measurement
journal homepage: www.elsevier.com/locate/measurement
3-D monitoring of rubble mound breakwater damages
Rosaria E. Musumecia,⁎, Davide Moltisantib, Enrico Fotia, Sebastiano Battiatob,Giovanni M. Farinellab
a Department of Civil Engineering and Architecture, University of Catania, Viale Andrea Doria 6, Catania, Italyb Image Processing Laboratory, University of Catania, Viale Andrea Doria 6, Catania, Italy
A R T I C L E I N F O
Keywords:RGB-D camerasOptical measurementsAccropodesUnderwater measurements
A B S T R A C T
Breakwaters play a crucial role in the protection of coastal zones. Their maintenance is critical to safeguard thedaily activities of harbours and marine areas. The evaluation of damage is a necessity for timely preservationworks. Traditional monitoring methods span various techniques, ranging from mechanical profilers to opticalsystems. Current methods though are expensive, requiring remarkably sophisticated technologies which demanda high degree of expertise to be operated.
In this paper, we propose an affordable yet accurate fully automated method based on 3D cameras. Ourtechnique is non invasive, allowing hence non intrusive as well as fast measure of damage over time, simulta-neously above and below sea water level. Experimental results obtained on laboratory breakwater models de-monstrated that the proposed point cloud method, which does not depend on the imaging sensor and can beapplied to any 3D dataset of rubble mound breakwater, can achieve accurate damage estimation, even whenusing a budget RGB-D camera. One of the additional advantages of using RGB-D cameras is the possibility toobtain measurements also in the presence of water.
1. Introduction and motivation
Breakwater structures are used worldwide to protect harbours andcoastal zones from wave attack. Depending on the local availability ofmaterials, on the bathymetric conditions, on the wave climate and onspecific design requirements, breakwaters can be built by using rocks orconcrete units, located as a double or single layer, considering a tra-ditional trapezoidal shape or a berm breakwater, with different types oftoe structures.
Due to the large site-dependent construction variability, the damageestimation of rubble mound breakwaters is a delicate and a crucial task.Notwithstanding the advances of numerical CFD models able to simu-late the flow between individual blocks of the armour layer [1], la-boratory experiments remain the most reliable methodology of in-vestigation due to the complexity of the interactions between the flowand the armour layer units, the filter layer, the toe and the core of theactual structure. Indeed, several empirical approaches have been pro-posed based on laboratory experiments - [2–9] just to list a few - andare currently used as a basis for the design of rubble mound break-waters.
Stability formulae are usually expressed in terms of the stabilityparameter H D/Δs n50, where Hs is the significant wave height,
= −ρ ρΔ / 1r w is the relative density with ρr and ρw being respectively therock and water density, and Dn50 is the median diameter of rock armourunits or some characteristic dimension of concrete elements.Traditionally, the damage to the armour layer of the breakwater isexpressed as the damage percentage Nd of displaced stones related to acertain area, which could be a part of the armour layer or the entirelayer itself. Another approach considers the damage level S, i.e. theratio between the erosion area around the still-water level Ae, and Dn50
2 .The above parameters can be considered as complementary. The firstparameter is focused on the armour layer exposed surface, while thesecond parameter accounts for deformation of the overall breakwatercross-section.
Concerning the measurement of the damage to the structure, a longtime has passed since the pioneering work of Hudson [2], who mea-sured the cross-sections by using a sounding rod equipped with a cir-cular spirit level, a graduated scale and a ball-and-socket foot. Nowa-days, in hydraulic laboratories the measurement of armour layerdamage is generally performed through mechanical or laser profiling[9–13] or visually by means of video cameras [6,8,9,14–16].
Mechanical profilers are usually preferred when large models withsignificant damages are considered. The use of profilers, though veryaccurate, requires that the experiment is stopped, therefore dynamic
https://doi.org/10.1016/j.measurement.2017.12.020Received 31 July 2017; Received in revised form 12 December 2017; Accepted 13 December 2017
⁎ Corresponding author.E-mail addresses: [email protected] (R.E. Musumeci), [email protected] (D. Moltisanti), [email protected] (E. Foti), [email protected] (S. Battiato),
[email protected] (G.M. Farinella).
Measurement 117 (2018) 347–364
Available online 19 December 20170263-2241/ © 2017 Published by Elsevier Ltd.
T
observations cannot be obtained. Moreover, often several profiles needto be measured in the spanwise direction, in order to obtain average ormaximum estimates of the damage along the breakwater length[12,13]. This is to avoid under- or over-estimates of the damage levels,depending on the position of the control section in the flume.
Photographic techniques are quite popular because outcomes ofexperimental studies are provided in a form which is closer to the op-erator’s perception, allowing thus an easier interpretation of the dataunder analysis. Several applications of optical methodologies are pos-sible, the most common being the overlap of photos to determine rockand concrete unit movements, while videos can help to identify in-stability mechanisms. However, image techniques usually require areliable calibration. Moreover, they are generally limited to the two-dimensional observation of the armour layer, either from the top orfrom the side. Furthermore, measurements below the water surface maybe difficult. For example, Vidal et al. [10] compared three differentmethodologies to assess damages to rubble mound breakwaters, interms of the damage level S, namely (i) laser profiling, (ii) to countsettled stones in more than two layers and (iii) digital image processingcounting pixels of layer below the outer armour layer. Such authorsdemonstrated that profiling techniques are more accurate for largerdamages and that calibrated image analysis techniques can under-estimate damage levels, particularly if the second layer is affected. It isworth noting that in order to understand the failure mechanism of thestructure, it is important to consider not only damage levels but alsodamage progression [16,17]. Therefore dynamic measurements overlarge portions of the breakwater are necessary.
The importance of gathering objective measurements of the armourlayer damage was underlined by Chilo and Guiducci [18], who pro-posed a manual image processing to recover small armour unit move-ments. More recently, van Gent and van der Werf [19] used stereophotography when investigating the stability of rock toes. However,such authors state that they used the 3D map of the structure just for aquick verification of the damage values obtained through profiling.
In general, traditional photographic techniques, such as laserscanner or stereo-photogrammetry methods, are able to provide a three-dimensional damage assessment without interacting with the structure.However, in order to obtain measurements below water level, thestructure has to be drained by emptying the wave flume. Such a pro-cedure causes longer experimental time and it may even affect thestability of the structure, particularly in the presence of sandy beds.Moreover, calibration of stereo-systems and automation of photo-grammetric techniques are not trivial tasks, needing a lot of time to befinalised. Furthermore, costs of stereo-system or of laser scanner sys-tems may be relatively high.
A different class of three-dimensional optical systems is representedby Red-Green-Blue and Depth (RGB-D) cameras. RGB-D cameras arelow cost technologies which can see both under and above the water,combining in only one device the capability to observe the wholestructure. The high-fidelity dense topographic/bathymetric point cloudallows a whole new group of analyses and data to be employed. Thislevel of detail and the magnitude of data imply a challenging new ap-proach to the way data are stored, processed and presented. Whilesensor systems with these capabilities have been custom-built for longtime, it has been only recently that they are being available in afford-able and consumer forms, which make them attractive for researchoutside specialised computer vision groups [20–22].
In this work a novel three-dimensional laboratory technique basedon RGB-D cameras is proposed to measure rubble-mound breakwaterdamage simultaneously above and below sea water level. In particular,here the proposed monitoring method is applied to the investigation ofthe stability of an Accropode breakwater under wave attack. The po-tentialities of the proposed technique are pointed out by using tradi-tional and new methodologies to describe the structure damages.
In particular, Accropodes belong to the category of single-layerconcrete armour blocks. They are quasi-randomly placed, according to
a well-defined positioning of their centre of mass and to some con-struction rules-of-thumb aimed at ensuring the maximum level of in-terlocking [23]. Their behaviour is quite different from that of double-layer elements. Indeed, the packing of the elements is completed underthe wave attack and the system acts as an integral layer [5]. The workin Kobayashi and Kaihatsu [24] investigated experimentally the per-formance of Accropodes, reporting good stability characteristics for thistype of blocks based also on field experience. However the authorsunderline the fact that although the stability at no damage conditionwas very high, the criteria of no damage and failure were very close.This was also confirmed by van der Meer [4], who suggests the fol-lowing criteria for initiation of damage and failure respectively:
=HDΔ
3.7s
n (1)
=HDΔ
4.1s
n (2)
where Hs is the significant wave height, Δ is the relative submergedspecific gravity of the blocks and Dn is the nominal diameter of theblocks. Both coefficients have a standard deviation of =σ 0.2. van derMeer [4] suggests that the criterion for the starting of damage must notbe considered for design, and a different formula for design is proposedby van der Meer [25]:
=HDΔ
2.5s
n (3)
This will include a safety coefficient which reduces the risk offailure induced by underprediction of the expected design wave height[5].
From the above considerations, it follows that it is extremely im-portant to accurately monitor even the smallest movements of eachsingle Accropode element, as the overall stability of the armour layercould be compromised. Therefore, the investigation of such kind ofstructures represents an ideal case to test the capabilities of the pro-posed fully automatic damage assessment methodology. Indeed, on onehand Accropode elements have a regular geometry, on the other sidetheir stability curve is very steep [4,25], hence a measurement tech-nique must be able to accurately detect any tiny deformation or rockingof the armour units. In particular, the roto-translation movements of thearmour layer are estimated by means of the proposed RGB-D technique.Such results allow to diagnose the mechanism of failure, by identifyingthe weakest part of the armour layer, from which a structure collapsecould suddenly develop.
The work is organised as follows. In Section 2 we introduce theproposed measuring system. Section 3 provides an overview of theadopted RGB-D technology and a quantitative assessment of the mea-suring errors of the depth cameras in the application context is carriedout. In Section 4 details regarding the experimental campaign setup areprovided. In Section 5 we discuss the results of the proposed metho-dology, whereas in Section 6 we compare such results with traditionalmethods. Finally, Section 7 provides conclusions and hints for futureworks.
2. Proposed measuring system
RGB-D technology refers to three-dimensional reconstruction of theobserved scene, that is the acquisition of traditional RGB data alongwith per-pixel depth information (i.e. the distance of the points in thescene from the camera). There are several techniques tackling thischallenging task. Stereo-based methods try to match correspondingpoints in a image pair coming from a stereo camera, basing the calcu-lation of the depth on the relative distance of the matching points in thetwo images [26]. Structured light approaches project an “invisible”light pattern onto the scene and infer the depth map by measuring thedeformation of the reflected pattern [27–30]. The depth of the scene
R.E. Musumeci et al. Measurement 117 (2018) 347–364
348

can also be measured using time-of-flight techniques, where the dis-tance of the points is obtained by measuring the time of flight of a lightsignal reflected by the surface [31,32].
The pipeline of the proposed measuring system is illustrated inFig. 1. During the experiments a physical model of a rubble-moundbreakwater is hit by waves to test the stability of the structure. Several3D point cloud models of such structure are acquired with a RGB-Dcamera, in order to monitor the conditions of the breakwater and es-timate the evolution of damage during wave storm attack. The camerawas mounted perpendicularly to the analysed surface. The 3D modelsare hence processed to estimate the movements of the armour layerblocks. Experimental setup and the data acquisition procedure detailsare provided in Section 4, whereas in the following the proposedmeasuring method is presented.
2.1. Automatic 3D data processing and measurements
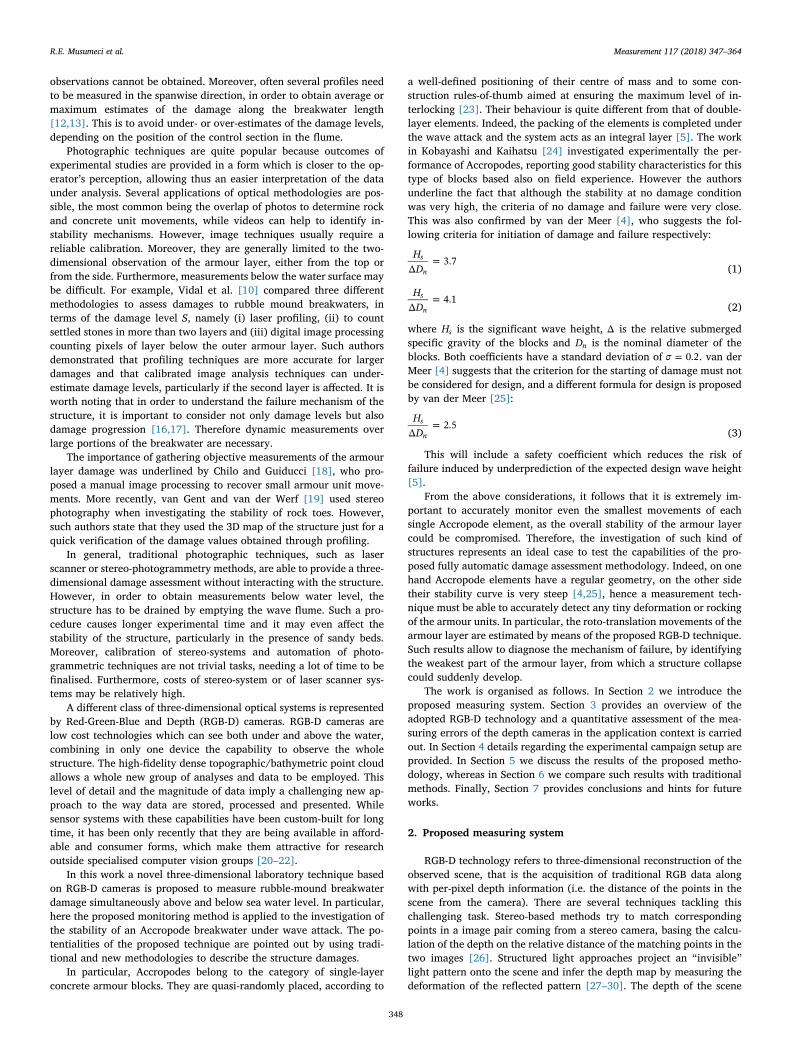
The workflow of the data processing is illustrated in Fig. 2. Top rowpictures show the breakwater being hit by a sequence of waves during atest. The corresponding 3D reconstructions are illustrated below. Wecall “clouds” the ordered list of meshes that have been reconstructedduring an experiment: the i-th 3D model captured at time i is stored atposition i of the clouds list. A “special” cloud is that stored at position 0:this is the mesh of the initial condition of the barrier, that is before theexperiment started. The cloud at time 0 is used as reference mesh toevaluate movements in every subsequent cloud at time i-th. The firststep in the processing pipeline is related to the alignment of the cloud i-th with respect to the reference cloud, as discussed below. Thereafter,we evaluate blocks movements by calculating local differences betweenthe point clouds, as explained in Section 2.3.
2.2. Point clouds alignment
3D models belonging to the same testing sequence may be notaligned, that is the models may not overlap exactly one with the other.This can occur due to slight vibrations transmitted to the RGB-D cameraby the waves during the experiment, causing thus minor shifts of thecamera.
Every clouds(i) of the test sequence is aligned with respect to thereference clouds(0), using the Iterative Closest Point algorithm [33],considering specific sub-clouds parts selected by the user on the re-ference mesh. A sub-cloud is a mesh composed of subsets of points ofthe source cloud. We call this sub-cloud “ICP-cloud”: ICP-cloud(0) re-fers then to the sub-cloud of the reference clouds(0), while ICP-cloud(i)refers to the i-th cloud of the sequence. In particular, for the alignmentalgorithm we pick those parts of the clouds where no movements canoccur (e.g. fixed frame bars or lateral flume walls). Given that ICPoperates by finding matches between points and minimising their dis-tance in the Euclidean space, a region where some movements takeplace would lead to a failure of the alignment algorithm. Fig. 3 illus-trates an example of such region, marked in red. In this part of the cloudthe elements of the armour layer, which move both slightly and con-siderably, are located according to the intensity of the flooding waves.In Fig. 3, the steel rod at the bottom of the barrier is marked too; this isbecause some blocks may fall down and get to the bottom due to abarrier break. In these cases, by considering those part for the align-ment, the ICP procedure would fail as the matching between the re-ference mesh and the cloud to be aligned would fail.
Fig. 4 depicts the building phase of an ICP-cloud. The software asksthe user to pick some spheres located in the correspondence of staticstructures from the reference clouds(0): the points lying inside the red
A physical model of the rubble-mound breakwaters is placed in a wave tank equipped with an electronically controlled
wavemaker
A RGB-D camera reconstructs the scene producing several 3D point clouds, representing the breakwaters, during a test
The 3D point clouds are aligned and then processed to estimate the accropodes shifts
occurred during the test
The stability of the structure is tested by considering different
wave attacks
The camera is positioned in order to be able to recover the
entire structure, both above and below water level.
From each 3D model a set of control points is extracted to compute local shifts in the
barrier
Exp
erim
enta
l se
tup
Dat
a ac
quis
ition
Dat
a pr
oces
sing
wavemaker
kinect
probe
breakwaters
Fig. 1. Generic pipeline of the proposed approach. The pipeline is divided in three main modules: experimental setup, data acquisition and data processing.
R.E. Musumeci et al. Measurement 117 (2018) 347–364
349
spheres are extracted from the source cloud and put in the ICP-cloud.The sub-cloud is built asking the user only once per test sequence.Specifically, the ICP-cloud is built on the reference clouds(0): then, forevery clouds(i) to be aligned, the corresponding ICP-clouds are createdby taking those points in clouds(i) which lie in the spheres defined bythe user. This means that the x y z( , , ) coordinates of each sphere centreare referred to clouds(0) space and are the same every time an ICP-cloud is created; given that the meshes may be slightly shifted eachother, though, the points lying inside the spheres might change a littlein every clouds(i). We find these shifts with the ICP algorithm and wethen apply the resulting transformation matrix to the clouds(i). For eachcouple [clouds(0), clouds(i)], after the creation of the correspondingICP-clouds, the system runs the ICP algorithm, which can be resumed asfollows:
1. For each Pik point in ICP-cloud(i), find the nearest point Pk
0 in ICP-cloud(0).
2. Estimate the roto-translation matrixM which best aligns Pik points to
the corresponding Pk0 . The matrix is evaluated by calculating the
Mean Square Error (MSE) over each point.3. Apply the transformation matrix M to clouds(i).4. Repeat from point (1) until a stop criterion is satisfied.
ICP has three stop criteria:
1. A certain number of iteration is reached.2. The difference between the previous transformation and the current
estimated transformation is smaller than a certain value.3. The sum of Euclidean squared errors is smaller than a defined
threshold.
In all our experiments both criteria 1 and 3 have been used jointly,setting 100 as maximum number of iterations and −10 8 as threshold forthe Euclidean squared errors sum. In Fig. 5 we can observe the result ofthe alignment process between two clouds.
2.3. Calculating movements of the armour layer elements
After the alignment phase, the next step in the workflow is theevaluation of the roto-translation movements of the elements of thearmour layer. First, the reference clouds(0) is subsampled dividing itsspace in cubes of side n (which is set by default equal to 2 cm). For eachcube j the points contained in it are substituted and represented by theirmass centre Pj. These Pj points are used as control points to calculateboth rotational and translational shifts between the reference cloud anda mesh clouds(i) from the sequence. Fig. 6 illustrates a result of suchsubsampling process. Every point showed in this mesh represents acontrol point Pj, that is the mass centre of the points contained in thecorresponding j-th cube of the cloud.
2.3.1. Translation estimationTo estimate translation shifts for a clouds(i), we run a radius search
around each mass centre Pj:
• For each =P x y z( , , )j j j j , find in clouds(i) the points lying in theneighbourhood given by the sphere of radius n
2and centre Pj. Let
neighbours P( )j be the set of these points.
• Calculate the mass centre ′Pj for the points in neighbours P( )j .• The movements occurred in the space portion of clouds(i) located bythe sphere centred in Pj is given by the Euclidean distance betweenPj and ′Pj .
We use K-d tree [34] implementation of the Point Cloud Library torun radius search over the clouds. Fig. 7 provides a graphical exampleof application of the radius search based algorithm.
clouds(0)
align clouds(i) with respect to clouds(0)
calculate movements in clouds(i) with respect to
clouds(0)
clouds(i) clouds(i+1) ... clouds(n)
images
3D reconstructions
Fig. 2. Workflow of the proposed approach. The pic-tures at the top row show the breakwater model underwave attack during a test, in relationship with thecorresponding 3D reconstructions, which are located atthe bottom row. A damage on the top left part of thebarrier is visible in the last 3D reconstruction/pictureof the sequence.
Fig. 3. Region of a cloud where movements can take place (marked in red). (For inter-pretation of the references to colour in this figure legend, the reader is referred to the webversion of this article.)
R.E. Musumeci et al. Measurement 117 (2018) 347–364
350

2.3.2. Rotation estimationMesh surface normals are computed in order to estimate the rota-
tion of the armour blocks for a clouds(i). More precisely, to calculatethe rotation in a portion of a clouds(i) located by a control point Pj, weproceed as follows:
• Given the point =P x y z( , , )j j j j , estimate in clouds(0) the normal
vector⎯→⎯N j( )0 of the surface given by the points lying on the spherical
neighbourhood of radius n2and centre Pj.
• Estimate in clouds(i) the normal vector⎯→⎯N j( )i of the surface given by
the points lying on the spherical neighbourhood of radius n2and
centre Pj.
• The angle θ between⎯→⎯N j( )0 and
⎯→⎯N j( )i vectors gives an estimate of the
rotation occurred in the portion of clouds(i) located by Pj.
Fig. 4. ICP-cloud for the reference mesh. (a) The userselects some spheres in static regions where nomovements can occur, such as the bar upon the bar-rier, the walls and the rod beyond the breakwater. Thepoints included in these spheres will populate the ICP-cloud. In (b) the reference clouds(0) is superimposedover the points included by the spheres, so that we canobserve the points that are extracted to create the ICP-cloud, which is shown in (c). The diameter of thespheres can be adjusted and is set by default to 7 cm.
(a) Overlapped 3D models before alignment (b) Overlapped 3D models after alignment
Fig. 5. Clouds alignment. (a) Before the alignmentprocess, a noticeable shift between the overlapped 3Dmodels is clearly visible. (b) After the alignment, theclouds are perfectly overlapping and the two meshes arenot distinguishable.
Fig. 6. Point Cloud subsampling result.
R.E. Musumeci et al. Measurement 117 (2018) 347–364
351

To calculate the angle between⎯→⎯
=N j A B C( ) ( , , )0 1 1 1 and⎯→⎯
=N j A B C( ) ( , , )i 2 2 2 , the angle between their perpendicular planes isconsidered:
⎯→⎯ ⎯→⎯= + +
+ + + +θ N j N j A A B B C C
A B C A B C( ( ), ( )) arccos | · · · |
·i0
1 2 1 2 1 2
12
12
12
22
22
22 (4)
We estimate normal vectors using the method proposed inBerkmann and Caelli [35], which is based on Principal ComponentAnalysis. Fig. 8 illustrates an example of estimate of the normals andcomparison of a couple [clouds(0), clouds(i)], considering only a smallregion of the mesh. Red lines are
⎯→⎯N j( )i vectors, while green lines are
⎯→⎯N j( )0 vectors; the mesh depicted in the picture is the reference cloud. Inthis example almost every
⎯→⎯N j( )i vector is parallel to the correspondent
reference vector⎯→⎯N j( )0 , since no noticeable movements have occurred in
this part of clouds(i). In contrast, when the vectors are not parallel asignificant rotation has occurred.
3. Adopted RGB-D technology
The widely known low-cost Microsoft Kinect camera was used asRGB-D camera in our experiments.1 Microsoft Kinect sensor belongs tothe family of RGB-D devices which reconstruct the depth of a scene byusing an infrared (IR) light pattern [36]. In order to create the depthmap, the Kinect’s IR projector throws a bundle of pseudo-random in-frared beams. The reflected rays are captured by the infrared camera,and a 3D reconstruction algorithm determines how the points are closeto the device. The depth map of the scene is provided as an image M of
×m n size, where each pixel p x y( , ) encodes the distance in the scene ofthe 3D point from the sensor. Fig. 9 illustrates the Kinect scene re-construction procedure.
The structured light technique used by the Kinect exploits a stereovision system built by coupling the projector and the camera. A knowninfrared pattern is projected into the scene and the depth of the objectsis computed by measuring its distortion on the objects. It is possible toimplement this technique with various methods. A first approach is theprojection of lines and the measuring of their curvature on objects. Sucha technique is not very fast and it is also subject to interference whenobjects are in motion. A second possibility is the projection of 2D per-iodic patterns and the evaluation of their deviation on hit objects. Inthis way the 3D information is obtained in real-time but the sensorcannot work over long distances because of the pattern distortion. Athird method, which is the one used by Kinect, is the projection of 2Dpseudo-random patterns. The advantage of this method is the possibi-lity to obtain accurate real-time 3D maps thanks to the pattern ran-domness, despite their two-dimensionality.
Fig. 7. Radius search. The red dots represent all the control points Pj, whereas the yellow
dots represent the points lying in neighbourhood P( )j . In the right part a single control point
and its respective neighbourhood is isolated: here it’s quite visible that the mass centre ofthe yellow points doesn’t coincide with the control point Pj. This means that a shift has
taken place in that portion of the cloud, which will be estimated as the Euclidean distancebetween Pj and the mass centre of neighbourhood P( )j . The radius of the sphere containing
the yellow points, i. e. the radius of the neighbourhood search, is an adjustable parameterof the algorithm which is set by default to 2 cm. (For interpretation of the references tocolour in this figure legend, the reader is referred to the web version of this article.)
Fig. 8. Estimation of the normals and comparison on a portion of mesh. Green lines arenormal vectors computed for the reference cloud, while red lines are normals vectorscomputed for a cloud in the sequence. For clarity sake only a subset of vectors is illu-strated. (For interpretation of the references to colour in this figure legend, the reader isreferred to the web version of this article.)
4 42 4 4
1 1 2 3 4 41 1 2 3 3 41 1 2 3 31 1 3 3
4 42 4 4
1 1 2 3 4 41 1 2 3 3 41 1 2 3 31 1 3 3
IR PROJECTOR
IR LIGHT VISIBLE LIGHT
IR SENSOR COLOUR SENSOR
IR LIGHT
DEPTHPROCESSOR
IMAGECAPTURE
3D IMAGEPROCESSOR
Fig. 9. Kinect scheme. The red dots scattered over the stick men represent the infraredpattern projected by the Kinect. Depth map and image capture are matched together tocreate a unique 3D image of the scene. (For interpretation of the references to colour inthis figure legend, the reader is referred to the web version of this article.)
1 We used the first edition of Kinect for Windows.
R.E. Musumeci et al. Measurement 117 (2018) 347–364
352

3.1. RGB-D system settings and measuring capabilities
In order to use the Kinect sensor to monitor the damage of rubblemound structures in hydraulic laboratories, a preliminary assessment ofthe reconstruction accuracy was carried out. Such preliminary testshave proved useful to determine the optimal range of setting para-meters of the Kinect sensor as well.
Every depth map was acquired with the Kinect Fusion Explorersoftware, which is part of the Microsoft Kinect SDK [37]. The volume ofa 3D reconstruction is composed of small cubes which are referred to as“voxels”. The most important parameters of a reconstruction, with re-spect to its accuracy, are the Volume Voxels Resolution (VVR), that isthe total amount of voxels in the final 3D model and the Volume Voxelsper Meter (VVPM), that is the spatial density of the reconstruction.Besides, another crucial parameter is the Volume Max IntegrationWeight (VMIW). This parameter controls the time averaging of datainto the reconstruction volume: by increasing it, the system is able toreconstruct the scene with a higher detail but, at the same time, takeslonger time to reconstruct the scene, and therefore does not adapt toquickly changing scenarios. Low values of the VMIW parameter makethe system respond faster to changes in the scene (e.g. moving objects),but produces noisier results. Finally, the distance between the Kinectand the target object is a discriminative factor regarding the resulting
3D reconstruction. Depending on the size of the object, the range ofdistances which work best for the reconstruction can vary remarkably.
3.1.1. Accuracy evaluation on single Accropode reconstructionIn order to evaluate the accuracy of the Kinect reconstruction, we
undertook an initial series of tests on a single physical Accropode modelof dimensions O(5 cm). The purpose of these experiments was to findthe Kinect configuration minimising the measurement error. The testsconsisted in the 3D reconstruction of the analysed object and in thecomparison of its real size with the acquired 3D model, both in staticand dynamic conditions. In the former case the Kinect cameras wasplaced at a fixed location with respect to the Accropode, while in thelatter case the Kinect was moved around the object.
The static tests on the single Accropode were initially performedconsidering the maximum allowed values of the parameters VMIW,VVPM and VVR, setting a constant distance between object and Kinect.The experimental configuration in static conditions is illustrated inFig. 10, where L is the distance between the Kinect and the Accropode,H is the vertical distance of the Kinect from the floor, h is the distance ofthe Accropode and s is its lateral shift with respect to the lens axis. TheAccropode is frontal with respect to the lens of the camera, as illu-strated in Fig. 10(c) (the Accropode anvil is 0.0464m high). This po-sition was also maintained in the dynamic tests, which were performedwith the use of a trolley, moving the Kinect along a rail.
The experimental configuration in dynamic conditions is illustratedin Fig. 11, where L, fixed to 1m, is the distance between the Kinect andthe Accropode, h is the height of the Accropode, and x, equal to 0.92m,is the amplitude of the movement of the camera along the rail lineduring the 3D reconstruction. As for the static test case, both softwareand geometrical parameters of the experimental setting have been ex-plored under dynamic conditions. More specifically, 120 tests werecarried out in static conditions, while 60 were performed in dynamicconditions. In order to evaluate the measuring error, the anvil side wasmeasured for each test in which the Accropode was identified. Giventhat the Accropode anvil is not univocally defined in the RGB-D meshes,
Fig. 10. Kinect-Accropode configuration for the accu-racy evaluation experiments in static conditions. Sideview and top view of the experimental setting are de-picted respectively in (a) and (b). (c) The Accropodeposition assumed during the performed tests.
Fig. 11. Kinect-Accropode configuration for the accuracy evaluation experiments in dy-namic conditions. Side view and top view of the experimental setting are depicted re-spectively in (a) and (b).
Fig. 12. Static tests: average absolute measuring error as a function of the distance of the Kinect camera from the Accropode model.
R.E. Musumeci et al. Measurement 117 (2018) 347–364
353

Fig. 13. Dynamic tests: average absolute error as a function of the VVPM parameter (distance between the camera and the object is equal to 1m).
Fig. 14. Three-dimensional model of the experimentalwave tank.
Fig. 15. Sections of the two investigated configurations of the breakwater: (a) configuration A, with Accropodes located both on the armour layer and at the toe of the structure; (b)configuration B, with Accropodes on the armour layer and a quarry stone berm.
R.E. Musumeci et al. Measurement 117 (2018) 347–364
354

in order to check the influence of the operator we obtained multiplemeasurements by independent operators. Once the anvil measures wereobtained, the absolute and the relative errors were calculated by all theoperators. Subsequently, we calculated the average of these values,obtaining the mean absolute error and the mean relative error. All thedata collected from every single test were used to analyse the dis-tribution of the error as a function of the distance and of the VVPMvalues, in static conditions, and of the VIMW parameter in dynamic
conditions.By keeping the Kinect sensor fixed with respect to the observed
object, we reconstructed a single Accropode model from 6 differentdistances of the camera, by setting for each of them only 5 possiblevalues of the parameter VVPM. A total of 30 reconstructions were ob-tained. Specifically the nominal station positions of the Kinect camerawere 400, 300, 200, 150, 100, and 50 cm. We did not collect mea-surements for distances greater than 400 cm, as this is the nominalcapturing range of the Kinect (edition 1). In order to verify the cameraperformances in usual working conditions of hydraulic laboratories, thetests were repeated by slightly displacing the camera around thenominal station position. For example, at the nominal 1.00m station,which is the most relevant in the present experimental conditions, fourdifferent actual distances have been used, namely 1.00m, 1.01m,1.04m, 1.09m. On the other hand the VVPM values were set equal to64, 128, 256, 384, 512, 640. Such preliminary tests showed that fordistances greater than 300 cm, it was not possible to recognise theAccropode model in the reconstructed scene with any VVPM value.Considering distances equal to 150 and 200 cm, and values of VVPMslarger than 512 and 384 respectively, the Accropode element was notrecognised either. For this reason, we focused on working distancessmaller or equal to about 200 cm. Fig. 12 illustrates the outcomes of thetests carried out in static conditions, while Fig. 13 reports the results ofthe dynamic conditions tests. In particular, in static conditions the bestreconstruction, with errors smaller than 0.003m, is obtained at a dis-tance equal to 1m. As for the software parameters, the value whichminimises the relative error is 640 for both the VVPM and the VVR (inall the three spatial directions). In dynamic conditions, where the dis-tance was also set to 1m, in many cases it was not possible to recognisethe physical model of the Accropode in the scene and therefore it was
Table 1Experimental wave parameters. Hsi and Hsr indicate respectively incident and reflectedsignificant wave heights, mean wave period is indicated by Tm, whereas reflection coef-ficient is referred with Kr .
Test Hsi [cm] Hsr [cm] Tm [s] Kr [–] Ns [–]
Configuration A A01 2.81 1.06 0.50 0.38 1.53A02 6.87 1.92 0.70 0.28 3.74A03 6.61 1.89 0.80 0.29 3.60A04 7.02 2.43 0.81 0.35 3.82A05 7.20 2.91 0.84 0.45 3.92A06 7.28 3.07 0.85 0.42 3.96A07 7.01 3.00 0.88 0.43 3.81
Configuration B B01 2.99 1.15 0.51 0.38 1.63B02 6.98 2.60 0.72 0.37 3.80B03 8.36 2.95 0.81 0.35 4.55B04 9.44 3.09 0.87 0.33 5.14B05 9.46 3.38 0.93 0.36 5.15B06 10.64 3.71 0.94 0.35 5.79B07 10.53 3.56 1.00 0.34 5.73B08 10.78 3.89 1.02 0.36 5.87B09 10.83 4.00 1.04 0.37 5.89B10 11.21 4.21 1.17 0.38 6.10
Fig. 16. 3D point clouds of Configuration A during thetests.
R.E. Musumeci et al. Measurement 117 (2018) 347–364
355
not possible to measure its dimensions. The relative error reaches itsminimum (2%) with VVPM and VMIW set to 512 and 1000 respec-tively.
4. Experimental breakwater damage assessment
The aim of the experimental campaign was to demonstrate the ad-vantages and the limits of the proposed methodology when applied tomeasure the damage of the armour layer of a breakwater at lab scale. Tothis aim, the stability of a traditional breakwater protected by anAccropode armour layer was investigated. The experiments were car-ried out at the Hydraulic Laboratory of the University of Catania. Thewave tank is 18m long, 3.60m wide and 1.20m deep. The flap-typewavemaker, located at one end of the flume, is electronically controlledand it is able to generate random waves with a given Jonswap spec-trum. Fig. 14 shows a three-dimensional model of the wave tank. In thepresent experiments, in order to obtain a 2D behaviour of the structure,the full width of the tank was partitioned to obtain a wave flume 1mwide where the physical model of the structure was located.
The Accropode elements are 4.64 cm high. They are made up of amixture of synthetic resin, basaltic dust and iron sawdust. This mixturehas both good moulding and drying characteristics, which facilitatesthe production of the elements. The density of the mixture is
=ρ 2303 kg/mr3. In order to reduce scale effects induced by the
roughness of the elements themselves, the Accropodes have beenpainted in different colours. The above technique is also traditionallyused in laboratories to visually estimate the damage percentage Nd bycounting the number of displaced elements. Fig. 15 shows the twoconfigurations of the cross-section of the investigated breakwater. Inboth sections, the slope of the armour layer is 4:3, the core is made upof granulated marble stones, whose size is in the range
=D 9.0–20.0 mm, and the filter layer is made up of basaltic quarrystone, with diameters in the range =D 12.7–15.0 mm. The toe of thetwo structures is different. Indeed, Configuration A has both the armourlayer and the toe of the structure made up of Accropode elements, whilethe armour layer of Configuration B is protected by a berm made up ofbasaltic quarry stones, whose dimensions are in the range
=D 15.0–20.0 mm. In this case, the offshore slope of toe berm is 3:2.Finally, in both cases, between the concrete seawall and the Accropodearmour layer, an armouring of marble stones ( =D 30 mm) is used. Thebreakwater was constructed by carefully following the building in-structions for Accropode structures, in order to guarantee the maximuminterlocking level [23]. This is essential in order to avoid any openingwhich could significantly influence the subsequent answer of thestructure to the wave attack.
The characteristics of the incident and reflected wave motion weremeasured by means of a couple of resistive wave gauges, located 1.5moff-shore of the toe of the structure. The well known two-gauge methodwas used to this aim [38]. The distance between the two wave gauges isabout 0.17m. The damage to the structure was monitored by means ofboth the RGB-D Kinect sensor and traditional optical systems. The latterwas composed by a stabilised HDR-PJ10E Sony video camera (full HDrecording mode), along with a Canon EOS 1000-D reflex camera. Bothcameras were located on a steel frame perpendicularly to the break-water model at a distance of about 1.2m far from the toe of thestructure, which is sufficient to obtain a good resolution and scan range[20].
Table 1 reports the tested wave conditions, in terms of the incidentand reflected significant wave heights, Hsi and Hsr , of the mean waveperiod, Tm, and of the reflection coefficient, Kr . The water depth at thewavemaker was equal to 0.30m, while the water depth at the toe of thestructure was equal to 0.17m. Each test lasted about 1500 waves. For
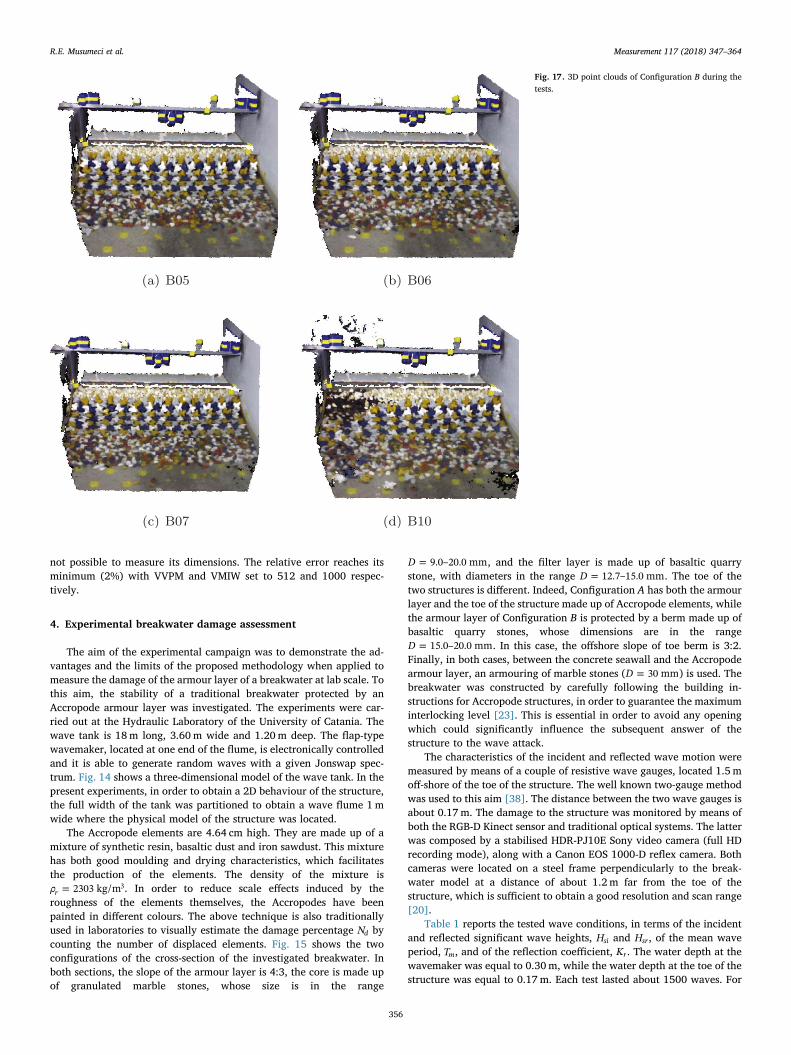
Fig. 17. 3D point clouds of Configuration B during thetests.
R.E. Musumeci et al. Measurement 117 (2018) 347–364
356

both configurations A and B, shown in Fig. 15, a shake-down test wascarried out in order to allow an adjustment of the structure similar tothe one which occurs in the field due to small storms during con-struction [39]. The hydrodynamic conditions reported in Table 1 in-dicate that in both cases, the reflection coefficients are about 0.4, asexpected for this type of structures [24]. It should be noted that thesequence of the waves of Configuration B was longer, since the struc-ture resisted to more energetic waves.
5. Results of the 3D monitoring technique
A set of 3D point clouds of the breakwater gathered during theexperiments are reported in Figs. 16 and 17, for Configurations A and B,respectively. Figs. 18 and 20 show the damage endured by the struc-ture, visualised in terms of the Euclidean distance between the sampledcontrol centroids (i. e. the control points obtained before the experi-ment started) and the centroids sampled at different instants during the
20 40 60 80
X (cm)
5
10
15
20
Y (
cm)
- cl
oud
3
0.1
0.2
0.3
0.4
0.5
0.6
0.7
0.8
Dis
tanc
e in
cen
timet
res
classes10 0
10 1
10 2
10 3
10 4
Num
ber
of c
entr
oids
(lo
g sc
ale) class 1 : N
dc = 99.37
class 2 : Ndc
= 0.19
class 3 : Ndc
= 0.05
class 4 : Ndc
= 0.39
20 40 60 80
X (cm)
5
10
15
20
Y (
cm)
- cl
oud
4
0.1
0.2
0.3
0.4
0.5
0.6
0.7
0.8D
ista
nce
in c
entim
etre
s
classes10 0
10 1
10 2
10 3
10 4
Num
ber
of c
entr
oids
(lo
g sc
ale) class 1 : N
dc = 99.18
class 2 : Ndc
= 0.19
class 3 : Ndc
= 0.14
class 4 : Ndc
= 0.48
20 40 60 80
X (cm)
5
10
15
20
Y (
cm)
- cl
oud
5
0.1
0.2
0.3
0.4
0.5
0.6
0.7
0.8
Dis
tanc
e in
cen
timet
res
classes10 0
10 1
10 2
10 3
10 4
Num
ber
of c
entr
oids
(lo
g sc
ale) class 1 : N
dc = 98.84
class 2 : Ndc
= 0.29
class 3 : Ndc
= 0.29
class 4 : Ndc
= 0.58
20 40 60 80
X (cm)
5
10
15
20
Y (
cm)
- cl
oud
7
0.1
0.2
0.3
0.4
0.5
0.6
0.7
0.8
Dis
tanc
e in
cen
timet
res
classes10 1
10 2
10 3
10 4
Num
ber
of c
entr
oids
(lo
g sc
ale) class 1 : N
dc = 98.12
class 2 : Ndc
= 0.92
class 3 : Ndc
= 0.48
class 4 : Ndc
= 0.48
Fig. 18. Distance contour plots on X-Y planefrom test sequence A (first column) along withNdc bar plots (second column). Each row re-presents the following test clouds, in orderfrom top to bottom: A03, A04, A05, A07.
R.E. Musumeci et al. Measurement 117 (2018) 347–364
357

test. The first column of the Figures contains contour plots for thedistances, projected on the X-Y plane, parallel to the plane of the ar-mour layer. The second column reports bar plots for the damageparameter Ndc. Each row represents a cloud, that is a 3D model of thebreakwater at different instants during the experiment.
The Ndc value is a measure of the overall damage of the breakwaterbased on the centroids distance. More precisely, it indicates the per-centage of centroids, for a given cloud, whose shift lies in one of theselected distance classes. Every class represents a distance interval. The
intervals are obtained by equally dividing the maximum registereddistance by the number n of classes. Specifically:
= ∈ ⎡⎣
× − × ⎞⎠
class i d d maxDistancen
i maxDistancen
i( ) : ( 1),d (5)
with ∈ …i n{1,2, , }. When =i n, the classd set is fully closed, includingtherefore also the maximum distance. Finally, given a class i, we expressNdc with the following equation
20 40 60 80
X (cm)
5
10
15
20
Y (
cm)
- cl
oud
3
0.5
1
1.5
2
2.5
3
Rot
atio
n in
deg
rees
classes10 2
10 3
10 4
Num
bers
of c
entr
oids
(lo
g sc
ale) class 1 : N
rc = 70.72
class 2 : Nrc
= 5.46
class 3 : Nrc
= 7.68
class 4 : Nrc
= 16.14
20 40 60 80X (cm)
5
10
15
20
Y (
cm)
- cl
oud
4
0.5
1
1.5
2
2.5
3
Rot
atio
n in
deg
rees
classes10 2
10 3
10 4
Num
bers
of c
entr
oids
(lo
g sc
ale) class 1 : N
rc = 72.85
class 2 : Nrc
= 6.76
class 3 : Nrc
= 8.70
class 4 : Nrc
= 11.69
20 40 60 80X (cm)
5
10
15
20
Y (
cm)
- cl
oud
5
0.5
1
1.5
2
2.5
3
classes10 2
10 3
10 4
Num
bers
of c
entr
oids
(lo
g sc
ale) class 1 : N
rc = 73.53
class 2 : Nrc
= 5.46
class 3 : Nrc
= 6.81
class 4 : Nrc
= 14.20
20 40 60 80X (cm)
5
10
15
20
Y (
cm)
- cl
oud
7
0.5
1
1.5
2
2.5
3
Rot
atio
n in
deg
rees
Rot
atio
n in
deg
rees
classes10 2
10 3
10 4
Num
bers
of c
entr
oids
(lo
g sc
ale) class 1 : N
rc = 71.59
class 2 : Nrc
= 7.68
class 3 : Nrc
= 9.13
class 4 : Nrc
= 11.59
Fig. 19. Rotation contour plots on X-Y plane fromtest sequence A (first column) along with Nrc barplots (second column). Each row represents thefollowing test clouds, in order from top to bottom:A03, A04, A05, A07.
R.E. Musumeci et al. Measurement 117 (2018) 347–364
358

= ∈ ∈N c d c c class i c CC
|{ : ( , ) ( ), }|| |dc
i t t c d t T
T (6)
where d c c( , )t c is the distance between a test centroid ct and its corre-spondent control centroid cc, and CT is the set containing all the testcentroids. The control centroids do not belong to this set, as they arerelative to the cloud acquired before the beginning of test. In the pre-sent analysis, the number of classes is =n 4. The definition of Ndc isvery close to that of the damage percentage Nd. The main differencehere is that while Nd refers to the individual block positions, which is
somehow ambiguous to be determined, the parameter Ndc considers thepositions of the centroids of the armour layer, which are automaticallyand unequivocally detected. Fig. 20 is a clear example of how theproposed methodology allows to easily track the status of the break-water at a glance. As long as waves hit the barrier, Accropodes movedincreasingly: at the beginning of the test (first three plots of the firstrow) only few Accropodes moved, while at the central and ending phaseof the experiment many Accropodes were displaced (last row plots). Wecan observe that the upper region of the breakwater is the most
20 40 60 80
X (cm)
5
10
15
20
25
30
35
Y (
cm)
- cl
oud
5
0.1
0.2
0.3
0.4
0.5
0.6
0.7
Dis
tanc
e in
cen
timet
res
classes10 0
10 1
10 2
10 3
10 4
Num
ber
of c
entr
oids
(lo
g sc
ale) class 1 : N
dc = 99.50
class 2 : Ndc
= 0.27
class 3 : Ndc
= 0.12
class 4 : Ndc
= 0.12
20 40 60 80
X (cm)
5
10
15
20
25
30
35
Y (
cm)
- cl
oud
6
0.1
0.2
0.3
0.4
0.5
0.6
0.7
0.8
Dis
tanc
e in
cen
timet
res
classes10 0
10 1
10 2
10 3
10 4
Num
ber
of c
entr
oids
(lo
g sc
ale) class 1 : N
dc = 98.91
class 2 : Ndc
= 0.62
class 3 : Ndc
= 0.27
class 4 : Ndc
= 0.21
20 40 60 80
X (cm)
5
10
15
20
25
30
35
Y (
cm)
- cl
oud
7
0.1
0.2
0.3
0.4
0.5
0.6
0.7
0.8
Dis
tanc
e in
cen
timet
res
classes10 0
10 1
10 2
10 3
10 4
Num
ber
of c
entr
oids
(lo
g sc
ale) class 1 : N
dc = 98.50
class 2 : Ndc
= 0.91
class 3 : Ndc
= 0.35
class 4 : Ndc
= 0.24
20 40 60 80
X (cm)
5
10
15
20
25
30
35
Y (
cm)
- cl
oud
10
0.1
0.2
0.3
0.4
0.5
0.6
0.7
0.8
Dis
tanc
e in
cen
timet
res
classes10 1
10 2
10 3
10 4
Num
ber
of c
entr
oids
(lo
g sc
ale) class 1 : N
dc = 95.88
class 2 : Ndc
= 2.65
class 3 : Ndc
= 0.94
class 4 : Ndc
= 0.53
Fig. 20. Distance contour plots on X-Y plane fromtest sequence B (first column) along with Ndc barplots (second column). Each row represents thefollowing test clouds, in order from top to bottom:B05, B06, B07, B10.
R.E. Musumeci et al. Measurement 117 (2018) 347–364
359

damaged part.Figs. 19 and 21 show the damage of the same sequences expressed
in terms of the rotation between the normal vectors of the control andtest centroids. Both contour and bar plots are calculated as explainedabove. The only difference is that here the intervals between the dif-ferent classes refer to the rotation angle between the centroids normals:
= ∈ ⎡⎣
× − × ⎞⎠
class i r r maxRotationn
i maxRotationn
i( ) : ( 1),r (7)
= ∈ ∈N c r c c class i c CC
|{ : ( , ) ( ), }|| |rc
i t t c r t T(8)
where r c c( , )t c is the rotation angle between the normal vector of a testcentroid ct and the normal vector of its correspondent control centroidcc. In this case, =n 4 as well. The results on the rotational movementsof the armour layer elements, albeit more noisy than the translationshifts plots, contribute to prove an incremental damage of the break-water. The noise of rotational movements is mainly due to the fact weare estimating normals on very small region of the clouds (a sphere with
20 40 60 80
X (cm)
5
10
15
20
25
30
35
Y (
cm)
- cl
oud
5
0.5
1
1.5
2
2.5
3
Rot
atio
n in
deg
rees
classes10 1
10 2
10 3
10 4
Num
bers
of c
entr
oids
(lo
g sc
ale) class 1 : N
rc = 86.16
class 2 : Nrc
= 1.56
class 3 : Nrc
= 1.15
class 4 : Nrc
= 11.13
20 40 60 80
X (cm)
5
10
15
20
25
30
35
Y (
cm)
- cl
oud
6
0.5
1
1.5
2
2.5
3
Rot
atio
n in
deg
rees
classes10 1
10 2
10 3
10 4
Num
bers
of c
entr
oids
(lo
g sc
ale) class 1 : N
rc = 83.83
class 2 : Nrc
= 2.39
class 3 : Nrc
= 1.35
class 4 : Nrc
= 12.43
20 40 60 80
X (cm)
5
10
15
20
25
30
35
Y (
cm)
- cl
oud
7
0.5
1
1.5
2
2.5
3
Rot
atio
n in
deg
rees
classes10 1
10 2
10 3
10 4
Num
bers
of c
entr
oids
(lo
g sc
ale)
class 1 : Nrc
= 81.86
class 2 : Nrc
= 3.36
class 3 : Nrc
= 2.12
class 4 : Nrc
= 12.67
20 40 60 80
X (cm)
5
10
15
20
25
30
35
Y (
cm)
- cl
oud
10
0.5
1
1.5
2
2.5
3
Rot
atio
n in
deg
rees
classes10 1
10 2
10 3
10 4
Num
bers
of c
entr
oids
(lo
g sc
ale)
class 1 : Nrc
= 80.00
class 2 : Nrc
= 6.22
class 3 : Nrc
= 2.89
class 4 : Nrc
= 10.90
Fig. 21. Rotation contour plots on X-Y plane fromtest sequence B (first column) along with Nrc barplots (second column). Each row represents thefollowing test clouds, in order from top to bottom:B05, B06, B07, B10.
R.E. Musumeci et al. Measurement 117 (2018) 347–364
360
radius of 1 cm). Notice that the proposed monitoring technique allowsan immediate and eventually even continuous monitoring of the evo-lution of the breakwater conditions.
6. Results derived from the 3D technique using traditionalmethods
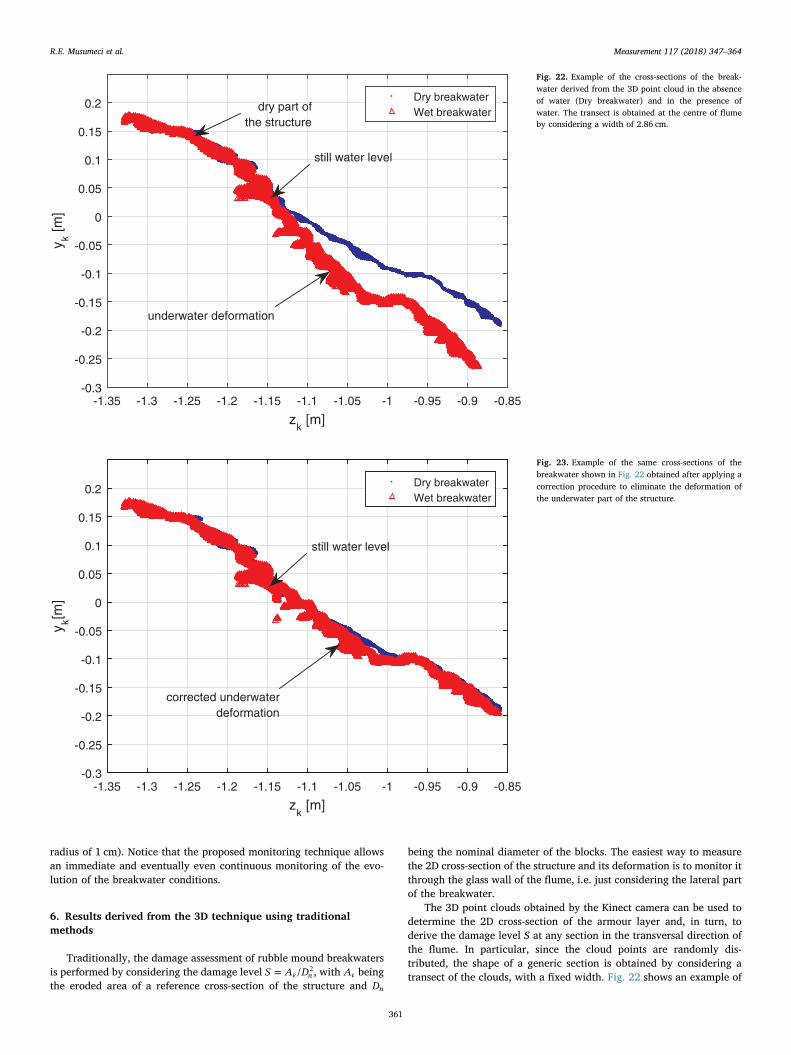
Traditionally, the damage assessment of rubble mound breakwatersis performed by considering the damage level =S A D/e n
2, with Ae beingthe eroded area of a reference cross-section of the structure and Dn
being the nominal diameter of the blocks. The easiest way to measurethe 2D cross-section of the structure and its deformation is to monitor itthrough the glass wall of the flume, i.e. just considering the lateral partof the breakwater.
The 3D point clouds obtained by the Kinect camera can be used todetermine the 2D cross-section of the armour layer and, in turn, toderive the damage level S at any section in the transversal direction ofthe flume. In particular, since the cloud points are randomly dis-tributed, the shape of a generic section is obtained by considering atransect of the clouds, with a fixed width. Fig. 22 shows an example of
zk [m]
-1.35 -1.3 -1.25 -1.2 -1.15 -1.1 -1.05 -1 -0.95 -0.9 -0.85
y k [m]
-0.3
-0.25
-0.2
-0.15
-0.1
-0.05
0
0.05
0.1
0.15
0.2Dry breakwaterWet breakwater
still water level
underwater deformation
dry part ofthe structure
Fig. 22. Example of the cross-sections of the break-water derived from the 3D point cloud in the absenceof water (Dry breakwater) and in the presence ofwater. The transect is obtained at the centre of flumeby considering a width of 2.86 cm.
zk [m]
-1.35 -1.3 -1.25 -1.2 -1.15 -1.1 -1.05 -1 -0.95 -0.9 -0.85
y k[m]
-0.3
-0.25
-0.2
-0.15
-0.1
-0.05
0
0.05
0.1
0.15
0.2Dry breakwaterWet breakwater
still water level
corrected underwaterdeformation
Fig. 23. Example of the same cross-sections of thebreakwater shown in Fig. 22 obtained after applying acorrection procedure to eliminate the deformation ofthe underwater part of the structure.
R.E. Musumeci et al. Measurement 117 (2018) 347–364
361

the cross section of the Configuration B of the breakwater derived fromthe Kinect measurements both in the absence and in the presence ofwater at the centre of the flume. Clearly, the emerged part of the twomeasured sections overlaps, whereas optical refraction causes a de-formation below water level. A correction of such a deformation iscarried out by considering a rotation angle α and a scaling factor f of thesubmerged part of the section. In order to minimise the errors, the
optimal values of such parameters turned out to be =α 0.16 rad and=f 0.93. An example of the result of the above transformation is re-
ported in Fig. 23. Figs. 24 and 25 show the damage levels calculatedconsidering 35 cross-sections, obtained along the entire width of Con-figuration A and Configuration B of the breakwater respectively. Inparticular, both the partial damage parameter calculated at the end ofeach tested sea-state and the cumulated damage levels are shown in the
0 0.1 0.2 0.3 0.4 0.5 0.6 0.7 0.8 0.90
1
2
3
4
5
6
7
x [m]
Dam
age
leve
l S
partial A01partial A02partial A03partial A04partial A05partial A06partial A07Cumulated
Fig. 24. Partial and cumulated damage level calcu-lated considering 35 cross-sections of theConfiguration A of the breakwater.
0 0.1 0.2 0.3 0.4 0.5 0.6 0.7 0.8 0.90
1
2
3
4
5
6
7
x [m]
Dam
age
leve
l S
partial B01partial B02partial B03partial B04partial B05partial B06partial B07partial B08partial B09partial B10Cumulated
Fig. 25. Partial and cumulated damage level calcu-lated considering 35 cross-sections of theConfiguration B of the breakwater.
R.E. Musumeci et al. Measurement 117 (2018) 347–364
362

Figures. Table 1 reports the values of the stability number Ns of theperformed experiments, calculated by assuming that the nominal dia-meter Dn is equal to 0.7 of the height of the Accropode blocks. It can beobserved that in both cases the structure shows a strong three-dimen-sional behaviour. For example, Configuration A appears to be stable upto wave condition A05 ( =N 3.92s ), while the damage starts in thecentral part of the structure for =N 3.96s (test A06), by attaining da-mage levels close to =S 2. Once started, the damage cannot be ar-rested, even though the waves are slightly less energetic ( =N 3.81s intest A07), and it extends to the other parts of the armour layer. Theabove results agree with the criteria suggested by van der Meer [4],who for Accropode structures predicted start of damage for
> ±N 3.7 0.2s and failure for > ±N 4.1 0.2s .The beneficial effects of the presence of the berm at the toe is
confirmed by the results shown in Fig. 25. In fact, compared to Con-figuration A, Configuration B seems to be much more resilient to waveattack, since the damage level remains quite small up to =N 6.10s (testB10). In particular, it may be noticed that small movements of theblocks are present over the entire length of the structure during testsB01-B04 (i.e. up to =N 5.14s ), with damage levels smaller than 1.Probably such movements allowed the Accropode armour layer, whichis supported by the irregular quarry-stone berm, to adjust itself and toreach a more stable configuration. Indeed, almost everywhere the da-mage levels drop to zero during tests B05-B09, proving the fact that nodeformations of the structure are observed. Finally, during test B10, thestructure fails at the lateral left side. Contrary to what happened for theConfiguration A, where the failure was progressive, in this case thefailure was much quicker, with exposure of the filter layer.
7. Conclusions
A novel approach to measure the damage to rubble mound break-waters simultaneously above and below the sea water level is proposed.The developed methodology is based on the fully automatic analysis of3D point clouds of the armour layers subject to sequences of wave at-tack.
Considering a sub-cloud sampling of the static part of the scene, theproposed algorithm automatically aligns all the point clouds by usingthe Iterative Closest Point algorithm. Then, the deformation of the ar-mour layer is evaluated in terms of translations and rotations of itssurface. The initial position of the structure is used as a reference, whilethe armour layer is subsampled considering the centroids of the cloudpoint contained in cubes of size 2 cm.
The above methodology is applied to 3D depth maps of two con-figurations of an Accropode breakwater recorded by a budget RGB-Dcamera which uses IR structured light, namely the well knownMicrosoft Kinect camera. The system does not need a preliminary ca-libration. Accropode structures represent an ideal case for testing thecapabilities of the system, since their stability can be compromised byvery small movements of the armour layer elements, which thus need tobe accurately measured. A preliminary analysis is performed in order tooptimise the setting parameters of the Kinect sensor (VVR, VVPM,VMIW, etc.), the positioning of the camera with respect to the structure,and the measurement errors of the system. The analysis reveals that at adistance from the breakwater of about 1m it is possible to reachmeasurement errors smaller than 0.003m.
In order to investigate the advantages and disadvantages of theproposed methodology, we carried out tests at a lab scale on two con-figurations of an Accropode breakwater, with different design of the toeof the structure, and in turn different stability properties of the armourlayer. Both structures are attacked by series of sea states, made up byabout 1500 irregular waves, having increasing and then decreasingwave energy. Such forcing mimics the conditions during typical storms.
Two parameters, Ndci and Nrc
i , are introduced and used to quantifyand cluster the damage of different parts of the structure. The first one,which measures the damage to the structure in terms of translational
displacements, is very similar to the classical damage percentage Nd.However, while the latter provides an integral measure of the damageand its calculation may be computationally expensive, Ndc
i is univocallydefined and automatically calculated. In the present application, a clearthree-dimensional behaviour of the structure is observed. The use of Ndc
i
provides a clear representation of the spatial and temporal evolution ofthe breakwater damage, by allowing one to point out the area wherethe structure damage is initiated and in turn to locate the weakest re-gion of the armour layer. The results obtained by using Ndc
i agree quitewell with the damage estimate of the widely-used damage parameter S,which can be determined using the same point cloud results. Theparameter Nrc
i , which provides a measure of the rotational movementsof the elements of the armour layer, has never been considered beforeand it is an useful parameter to assess not only structural damage butalso the degrees of freedom of the blocks and their attitude to becomeunstable, which could eventually leads to failure.
From the above results, it appears that the proposed methodologypermits an immediate and eventually even continuous detailed mon-itoring of the breakwater status, simultaneously above and below thesea water level, using low-cost RGB-D technologies. It follows that theadvantages for laboratory investigation of the stability of rubble moundbreakwaters are clearly significant, in terms of operational time, eco-nomical costs, and of possibilities of testing alternative configurations.
Future developments of the technique will include testing in dy-namic conditions, i.e. in the presence of the moving water surface alsoin order to relate camera parameters to the initiation of motion of theelements of the armour layer and to its local actuators. Additionally, itshould be mentioned that RGB-D technologies have potential to beapplied to field conditions. Indeed, the survey of the actual status of abreakwater is a complex task with an high safety risk associated to it atpresent, mainly because of the visual inspection of submerged part ofthe structure usually carried out by professional scuba divers. The useof remote local sensing techniques, such as RGB-D camera able to re-cover at the same time the sub-aerial and submerged parts of thestructure and which could be located on boats without worries aboutthe movement of the sensor, could be thus highly beneficial.
Acknowledgements
This work has been partly funded by the European Commission,project HYDRALAB PLUS (contract No. 654110).
References
[1] F. Dentale, G. Donnarumma, E. Pugliese Carratelli, Simulation of flow within ar-mour blocks in a breakwater, J. Coast. Res. 30 (3) (2014) 528–536.
[2] R. Hudson, Laboratory investigation of rubble mound breakwaters, J. WaterwaysHarbors Div. 85 (1959) 93–122.
[3] J. van der Meer, Stability of breakwater armour layers - Design formulae, Coast.Eng. 11 (1987) 219–239.
[4] J. van der Meer, Stability of cubes, tetrapods and accropode, in: Breakwater ’88,1988.
[5] J. van der Meer, Design of concrete armour layers, Proc. Coastal Structures ’99,Balkema Rotterdam, 1999, pp. 213–221.
[6] M. Kramer, B. Zanuttigh, J.V. der Meer, C. Vidal, F. Gironella, Laboratory experi-ments on low-crested breakwaters, Coast. Eng. 52 (2005) 867–885.
[7] H. Burcharth, M. Kramer, A. Lamberti, B. Zanuttigh, Structural stability of detachedlow crested breakwaters, Coast. Eng. 53 (2006) 381–394.
[8] C. Vidal, R. Medina, P. Lomonaco, Wave height parameter for damage descriptionof rubble-mound brekwaters, Coast. Eng. 53 (2006) 711–722.
[9] M. van Gent, Oblique wave attack on rubble mound breakwaters, Coast. Eng. 88(2014) 43–54.
[10] C. Vidal, F. Martin, V. Negro, X. Gironella, B. Madrigal, J. Garcia-Palacios,Measurement of armor damage on rubble mound structures: comparison betweendifferent methodologies, in: Coastal Structure, 2003.
[11] K. Cihan, Y. Yuksel, Deformation of breakwater armoured artificial units undercyclic loading, Appl. Ocean Res. 42 (2013) 79–86.
[12] M. van Gent, Rock stability of rubble mound breakwaters with a berm, Coast. Eng.78 (2013) 35–45.
[13] H. Guler, T. Arikawa, T. Oei, A. Yalciner, Performance of rubble mound break-waters under tsunami attack, a case study: Haydarpasa port, Istanbul, Turkey,Coast. Eng. 104 (2015) 43–53.
R.E. Musumeci et al. Measurement 117 (2018) 347–364
363

[14] S. Eslami, M. van Gent, Wave overtopping and rubble mound stability undercombined loading of waves and current, in: ICCE 2010, 2010.
[15] K. Cihan, Y. Yuksel, Deformation of rubble-mound breakwaters under cyclic loads,Coast. Eng. 58 (2011) 528–539.
[16] F. Comola, T.L. Andersen, L. Martinelli, H. Burcharth, P. Ruol, Damage pattern anddamage progression on breakwater roundheads under multdirectional waves,Coast. Eng. 83 (2014) 24–35.
[17] M. Martin-Hidalgo, M.J. Martin-Soldevilla, V. Negro, P. Aberturas, J. Lopez-Gutierrez, Storm evolution characterization for analysing stone armour damageprogression, Coast. Eng. 85 (2014) 1–11.
[18] B. Chilo, F. Guiducci, Computerised methodology to measure rubble mound brek-water damage, in: Proccedings of the 24th Conference on Coastal Engineering,Kobe, Japan, 1994.
[19] M. van Gent, I. van der Werf, Rock toe stability of rubble mound breakwaters,Coast. Eng. 83 (2014) 166–176.
[20] F. Marinello, A. Pezzuolo, F. Gasparini, J. Arvidsson, L. Sartori, Application of thekinect sensor for dynamic soil surface characterization, Precis. Agric. 16 (6) (2015)601–612.
[21] H. Shen, B. He, J. Zhang, S. Chen, Obtaining four-dimensional vibration informa-tion for vibrating surfaces with a kinect sensor, Measurement 65 (2015) 149–165.
[22] M. Bueno, L. Díaz-Vilariño, J. Martínez-Sánchez, H. González-Jorge, H. Lorenzo,P. Arias, Metrological evaluation of kinectfusion and its comparison with microsoftkinect sensor, Measurement 73 (2015) 137–145.
[23] V. Verma, K. Varghese, A. Sekar, Evaldamage of physical modeling and 3-d simu-lation of planning Accropode placements, in: ISARC 2004 21st InternationalSymposium on Automation and Robotics in Construction, 2004.
[24] M. Kobayashi, S. Kaihatsu, Hydraulic characteristics and field experience of newwave dissipating concrete blocks (ACCROPODE), in: Proceedings of 19thConference on Coastal Engineering, 1984.
[25] J. van der Meer, Conceptual design of rubble mound breakwaters, in: A.N. York (Ed.), Proceedings of a Short Course on the Design and Reliability of Coastal Structures,23rd Conf. Coastal Eng., Venice, 1992, pp. 447–510.
[26] B. Tippetts, D.J. Lee, K. Lillywhite, J. Archibald, Review of stereo vision algorithmsand their suitability for resource-limited systems, J. Real-Time Image Process.(2013) 1–21.
[27] D. Fofi, T. Sliwa, Y. Voisin, A comparative survey on invisible structured light, in:
Electronic Imaging 2004, International Society for Optics and Photonics, 2004, pp.90–98.
[28] S. Baglio, E. Foti, R. Musumeci, Measuring the effects of wave action around piers,IEEE Instrum. Meas. Mag. 8 (5) (2005) 28–33.
[29] E. Foti, I. Caceres-Rabionet, A. Marini, R. Musumeci, A. Sanchez-Arcilla,Experimental investigation of the bed evolution in wave flumes: performance of 2Dand 3D optical systems, Coast. Eng. 58 (7) (2011) 606–622.
[30] W. Jang, C. Je, Y. Seo, S.W. Lee, Structured-light stereo: comparative analysis andintegration of structured-light and active stereo for measuring dynamic shape, Opt.Lasers Eng. 51 (11) (2013) 1255–1264.
[31] S.B. Gokturk, H. Yalcin, C. Bamji, A time-of-flight depth sensor-system description,issues and solutions, Conference on Computer Vision and Pattern RecognitionWorkshop, 2004, CVPRW’04, IEEE, 2004, p. 35.
[32] J. Zhu, L. Wang, R. Yang, J. Davis, Fusion of time-of-flight depth and stereo for highaccuracy depth maps, IEEE Conference on Computer Vision and PatternRecognition, 2008, CVPR 2008, IEEE, 2008, pp. 1–8.
[33] Y. Chen, G. Medioni, Object modelling by registration of multiple range images,Image Vis. Comput. 10 (3) (1992) 145–155.
[34] J.L. Bentley, Multidimensional binary search trees used for associative searching,Commun. ACM 18 (9) (1975) 509–517.
[35] J. Berkmann, T. Caelli, Computation of surface geometry and segmentation usingcovariance techniques, IEEE Trans. Pattern Anal. Mach. Intell. 16 (11) (1994)1114–1116.
[36] Z. Zhang, Microsoft kinect sensor and its effect, IEEE MultiMedia 19 (2) (2012)4–10.
[37] S. Izadi, D. Kim, O. Hilliges, D. Molyneaux, R. Newcombe, P. Kohli, J. Shotton,S. Hodges, D. Freeman, A. Davison, et al., Kinectfusion: real-time 3d reconstructionand interaction using a moving depth camera, Proceedings of the 24th Annual ACMSymposium on User Interface Software and Technology, ACM, 2011, pp. 559–568.
[38] Y. Goda, Y. Suzuki, Estimation of incident and reflected waves in random waveexperiments, in: Proceedings of 15th International Conference on CoastalEngineering, 1976, pp. 828–845.
[39] G. Wolters, W. Allsop, L. Hamm, D. Mühlestein, M. van Gent, L. Bonthoux, J.Kirkegaard, R.C. Ao, J. Fortes, X. Gironella, L. Pinheiro, J. Ao Santos, I. Sousa, UsersGuide to Physical Modelling and Experimentation, Experience of the HYDRALABNetwork, CRC Press, Taylor and Francis Group, Ch. Breakwaters, 2011, pp. 39–66.
R.E. Musumeci et al. Measurement 117 (2018) 347–364
364