Embed Size (px)
DESCRIPTION
TJPRC JOURNALS
Citation preview
www.tjprc.org [email protected]
SIGNIFICANCE OF SURFACE AND SUBSURFACE LINEAMENTS F OR
GROUNDWATER EXPLORATION IN THE PART OF VINDHYAN FRI NGE BELT
OF MIRZAPUR DISTRICT, U. P., INDIA
R. KUMAR & G. S. YADAV
Department of Geophysics, Banaras Hindu University, Varanasi, Uttar Pradesh, India
ABSTRACT
This article is intended to describe the significance of lineaments (surface and subsurface lineament) for
groundwater exploration in part of Vindhyan fringe belt of Mirzapur district, Uttar Pradesh, India. Remote sensing is
vital visualization tool for identification of geological feature, such as lineaments, land use pattern, geomorphologic
features etc., and also applicable for groundwater investigation. The lineaments (surface and subsurface lineament) play
a crucial role in groundwater investigation in hard rock area. The surface and subsurface lineaments are extracted from
the LANDSAT-TM satellite imagery and grided free air anomaly (satellite gravity data), respectively. The correlation
between surface and subsurface lineaments are performed by using the rose diagram and understand the orientations of
traverse lines of geophysical survey. The integrated lineament and lineament density maps are depicted the appropriate
locations were selected for detailed geophysical survey and also further detailed study.
KEYWORDS: Lineament, Remote sensing, Hard rock, Vindhyan fringe, Free air Anomaly
Received: Sep 28, 2015; Accepted: Oct 06, 2015; Published: Nov 15, 2015; Paper Id.: IJEEGSDEC20153
INTRODUCTION
Lineaments are one of the essential topographic features used in exploring for various natural resources
such as groundwater, hydrocarbons, minerals, and geothermal energy, as well as in mapping hazard susceptibility
from earthquakes and landslides (Guild 1974; Dix and Jackson 1981; Sibson 1986a, b; Boucher 1995; Rowan and
Bowers 1995; Rowland and Sibson 2004; Masoud et al. 2007). In this regard, the characteristics of lineaments
such as spatial extent, density, intersection and orientation have proved significant because they indicate zones and
trends of high permeability and/ or low pressure that may serve as pathways for migration and thus targets for
increased reserve. The lineaments may represent faults that control the basin development and distribution of
reservoirs (Warner 1997).
Generally, lineaments are underlain by zones of localized weathering and increased permeability and
porosity. Meanwhile, some researchers studied relationships between groundwater productivity and the number of
lineament within specifically designated areas or lineament density rather than the lineament itself (Hardcastle
1995). Therefore, the mapping of the lineaments closely related to the groundwater occurrence and yield is
essential to groundwater surveys, development and managements. Many groundwater exploration projects had
higher success rates when sites for drilling or detailed geophysical survey were guided by lineament mapping
based on the satellite images (Teme and Oni 1991; Guftafsson 1993). On the basis of technology, the lineament
can be classified into two types: surface lineament and subsurface lineament. The surface lineament can be
Original A
rticle International Journal of Earthquake Engineering and Geological Science (IJEEGS) Vol. 5, Issue 4, Dec 2015, 13 -24 © TJPRC Pvt. Ltd.

14 R. Kumar & G. S. Yadav
www.tjprc.org [email protected]
extracted from satellite imagery and subsurface lineament can be mapped out from geophysical techniques.
The Bouguer anomaly is calculated to apply atmospheric correction, Bullard-B correction and complete detailed
terrain correction (distant, intermediate and inner zone correction) from global free air grided data (satellite gravity data)
using FA2BOUG (FORTRAN CODE) with the input parameters (Fullea et al. 2008). The extraction of subsurface
lineaments from Bouguer anomaly is carried out using filtering technique (gradient of gravity data in various directions)
with the help of 3 × 3 gradient operators. The integrated lineament and integrated lineament density maps are prepared by
overlaying the thematic maps of surface & subsurface lineament map. The integrated lineament and integrated lineament
density map of study area show the appropriate locations which are selected for geophysical survey and also for further
detailed study.
GEOGRAPHY AND GEOLOGY OF STUDY AREA
The area chosen for the study is the part of Vindhyan fringe belt which is located in Mirzapur district of Uttar
Pradesh (Figure 1). The study area partly falls in Survey of India toposheet (No. 63K/16, 63L/13, 63O/4, 63P/1) at
1:50,000 scales and lies between latitudes 24057’54’’ and 25006’50’’N and longitudes 82050’23’’ and 83004’22’’E. It is
situated in the extreme north-eastern part of the district of Mirzapur, Uttar Pradesh covering parts of three blocks of
Mirzapur district such as Narayanpur, Jamalpur and Rajgarh. The district Varanasi lies to its north, district Chandauli to its
south-east, and remaining part in the district Mirzapur.
The area chosen for the investigation is a part of northern portion of Vindhyan fringe belt which is situated in the
south-eastern direction of the river Ganges. Some part of the area falls on the northern slope of Vindhyan plateau which is
entirely covered with a varying thickness of Pleistocene and Recent alluvial deposits of the Gangetic river system
(Krishnan and Swaminathan 1959). The Vindhyan Supergroup is composed mostly of low dipping formations of
sandstone, shale and carbonate, with a few conglomerate and volcaniclastic beds separated by a major regional and several
local unconformities. The regional unconformity occurs at the base of the Kaimur Group and divides the sequence into two
units: the Lower Vindhyans (Semri Group) and the Upper Vindhyans (Kaimur, Rewa and Bhander Groups). The outcrop
pattern of the Supergroup resembles a simple saucer-shaped syncline. It is generally believed that the Vindhyan basin was
a vast intra-cratonic basin formed in response to intraplate stresses (Bhattacharyya 1996; Bose et al. 2001).
Groundwater in Kaimur Formation may occur in the weathered and fractured sandstone provided the zone is
connected with recharging sources. The Kaimur Group of the Vindhyan Supergroup is of special significance because it
consists dominantly of silica-clastic rocks lying unconformably over the carbonate-rich Semri Group-Lower Vindhyans.
Therefore, the rocks from the Kaimur Group hold strong evidence regarding changing environment of deposition, climatic
conditions & tectonics and weathering conditions, during Mesoproterozoic (Mishra and Sen 2010).
The southern portion of study area is covered by thin surface soil with varying thickness ranging from 1-4 m and
few exposure of Vindhyan sandstone whereas thickness of overburden increases while moving towards northern side. The
bedrock (Vindhyan Supergroup of rocks) is expected below the surface soil cover (Krishnan 1982).
MATERIALS AND METHODS
Data Collection
The LANDSAT-TM (Path-142/ Row-043) data is used in the present study. The multispectral satellite image from
the LANDSAT-TM sensor contains seven bands, i.e. Blue (0.45-0.515 µm), Green (0.525-0.605 µm), Red (0.63-0.69 µm),

Significance of Surface and Subsurface Lineaments for Groundwater Exploration 15 in the Part of Vindhyan Fringe Belt of Mirzapur District, U. P., India
www.tjprc.org [email protected]
Near Infrared (0.75-0.90 µm), Shortwave IR-1 (1.55-1.75 µm), Thermal IR (10.4-12.5 µm) and Shortwave IR-2 (2.09-2.35)
(Palamuleni 2009). The survey of India toposheets 63K/16, 63L/13, 63O/4 and 63P/1 with a scale of 1:50,000 are used as a
source of ancillary information.
The publicly available global grided free air gravity anomaly (satellite gravity data) and elevation data sets are
used in the present study. Elevation data (topography) is taken from the 1′ × 1′ new release of Etopo22 global data base
(V9.1) by Hastings and Dunbar (1998); Sandwell and Smith (1997) and Smith and Sandwell (1994). The grided free air
gravity anomaly data is taken from the 1′ × 1′ global satellite altimetry data compilation V16.12 model by Sandwell and
Smith (1997).
Surface Lineaments Extraction
Arkoprovo et al. (2012) discussed about the satellite data analysis, the main task in this stage is to carry out
analysis and interpretation of satellite data, in order to produce thematic maps, such as lithology, structural and land use
maps. Initially, all the images are rectified using the Survey of India (SOI) toposheet. This is followed by processing the
digital images using the various processing techniques, viz., enhancement, filtering, classification and other GIS processes
16. Subsequently, selective field checking is carried out.
Subsurface Lineaments Extraction
Fullea et al. (2008) explained to perform the terrain correction (Bullard C) in three steps: the distant zone
computation, intermediate zone computation and inner zone computation. In a distant zone computation, the harmonic
spherical expansion of the potential of each right rectangular prism representing an elevation grid point has been
considered by Fullea et al. (2008). In an intermediate zone computation, Fullea et al. (2008) computed the gravitational
attraction produced by each prism using the analytic formula. In case inner zone computation, Fullea et al. (2008) divided
the scheme of the computation of inner zone contribution into two parts: (i) a flat-topped prism with a height equal to the
elevation of the computation point; (ii) four quadrants of a conic prism sloping continuously from each square of the inner
zone to the calculation point. Fullea et al. (2008) developed a computer program written in FORTRAN 90 (FA2BOUG)
specifically designed to determine the Bouguer anomaly from publicly available global grided free air anomaly and
elevation database sets. FA2BOUG computes the complete Bouguer correction (i.e. Bullard A, B and C corrections) in
several spatial domains according to the distance between the topography and the calculation point. In the present study,
FA2BOUG computer program has been used with input parameters to obtain a complete Bouguer anomaly map of the
study area. Finally, mapping of subsurface lineaments are carried out using gradient of gravity data in north-south and east-
west direction.
RESULTS AND DISCUSSIONS
Surface Lineament and Surface Lineament Density Map
The satellite images due to its many capabilities such as the synoptic aerial coverage, multispectral captivity of
data, temporal resolution, etc., produce better information than conventional aerial photographs (Lillesand and Kiefer
1999), so the same has been selected for the task of extracting surface lineament. Radiometric correction is applied to
images to remove noise present in the image. A 3*3 median filter is applied to all bands of LANDSAT-TM (Path-142/
Row-043) satellite images and maintain the output values which are not affected by the actual values of outlier cells within
the filter window. The median filter is particularly good for removing isolated random noise. With the help of image

16 R. Kumar & G. S. Yadav
www.tjprc.org [email protected]
interpretation keys and elements, lineaments are interpreted for the entire study area using standard False Color Composite
(FCC). The digital image enhancement techniques can be contributed significantly in extracting surface lineament. Among
the variety of image enhancement techniques, the filtering operations (Suzan and Topark 1998; Chang et al. 1998; Mah et
al. 1995), Principal Component Analysis (PCA) (Qari 1991; Nama 2004) and spectral ratioing (Arlegui and Soriano 1998)
are the most commonly used ones (Mohammed et al. 2010). The surface lineament map (Figure 2) has been created by
using FCC and image enhancement techniques. Arkoprovo et al. 2012 described lineament density map. The lineament
density map was prepared by dividing the study area into 1 km/ 1 km grids. The total length of lineament in each grid was
measured and plotted in the respective grid centers. These values are joined by isolines to prepare a lineament density map
as shown in Figure 3.
Surface lineament density map was generated from the surface lineament map. The values of surface lineament
density have been assigned depending on the density of the surface lineament. The high surface lineament density areas
may have important of groundwater prospects, hence acts good groundwater prospect.
Subsurface Lineament and Subsurface Lineament Density Map
The extraction of subsurface lineaments from Bouguer gravity anomaly is carried out using gradient of gravity
data along north-south and east-west direction with the help of 3 × 3 gradient operator. It is grided and contoured to
produce gradient directional map of gravity data along north-south and east-west direction by Surfer Version 10 and
Matlab Version 8.3.
The gradients of gravity data along east-west direction are grided and contoured to produce a gradient directional
map of gravity data along east-west direction. The subsurface lineaments are primarily oriented in one major set of
direction i.e., approximately north-south direction. The maximum number of subsurface lineaments occurs in southern part
of study area as shown in Figure 4.
Further, the gradients of gravity data along north-south direction are grided and contoured to produce a gradient
directional map of gravity data along north-south direction. The map shows that the subsurface lineaments occurs in
southern part of the study area in more number as compared to those derived from gradient directional map of gravity data
along east-west direction. The subsurface lineaments are primarily oriented in one major set of direction i.e., approximately
east-west direction as shown in Figure 5.
The subsurface lineament map is prepared by overlaying subsurface lineaments (as shown in Figure 4 & 5) from
filtering technique (gradient directional filter of gravity data along north-south and east-west direction) as shown in Figure
6. The subsurface lineament density map has been generated from the subsurface lineament map. The values of subsurface
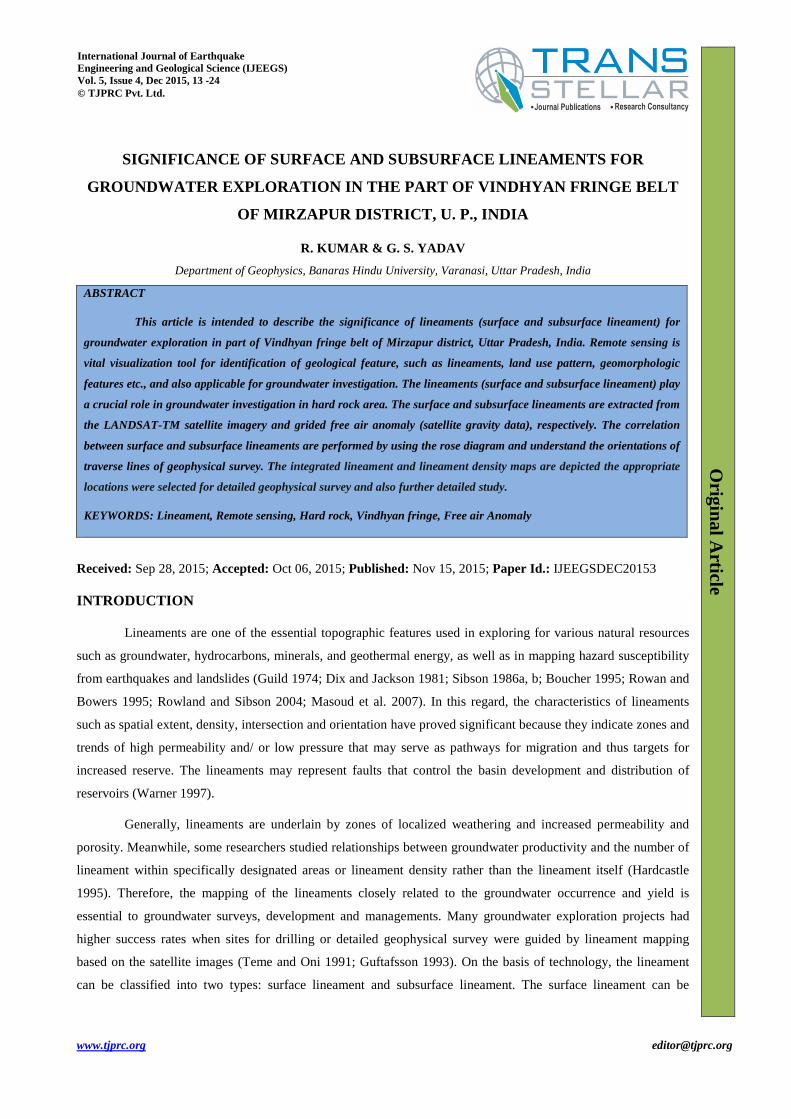
lineament density have been assigned depending on the density of the subsurface lineament which is shown in Figure 7.
The high subsurface lineament density region may be identified as good prospects for groundwater resources.
Integrated Lineament and Integrated Lineament Density Map
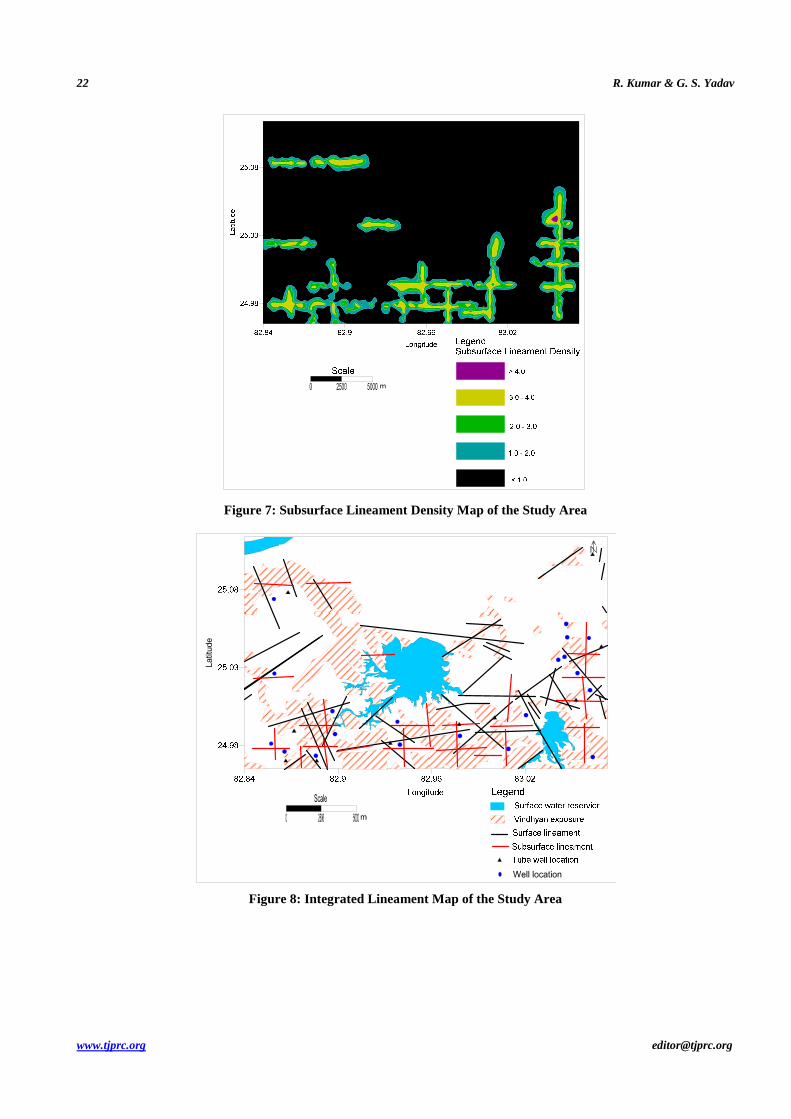
The integrated lineament map is prepared by overlaying the thematic maps of surface and subsurface lineament
map. The integrated map shows the appropriate locations which were selected for detailed geophysical survey and also
further detailed study. It may or may not delineate the fracture zone because maximum numbers of lineaments are existed
near the wells and tube wells as shown in Figure 8. Integrated lineament density map is generated from the integrated

Significance of Surface and Subsurface Lineaments for Groundwater Exploration 17 in the Part of Vindhyan Fringe Belt of Mirzapur District, U. P., India
www.tjprc.org [email protected]
lineament map. The values of integrated lineament density have been assigned depending on the density of the integrated
lineament as shown in Figure 9.
Orientation Analysis of Lineaments
Linear feature orientation is considered as one of the most important characteristics. Rose diagram is essentially
histogram for which the orientation axis is transformed into circle to give a true angular plot. The intervals of angle are
plotted as pie-shaped segments of a circle in their true orientation and the length of the radius is proportional to the
frequency of that orientation (Mohammed et al. 2010).
Rose diagram is one of the most useful for representing the appropriate orientation of traverse line of geophysical
survey and orientation of geological linear features. The surface lineament appears primarily in three sets of directions: two
major sets oriented in northeast-southwest and northwest-southeast and the other one minor set oriented along
approximately east-west direction as shown in Figure 10(A). The subsurface lineament appears primarily in two sets of
directions: one major set oriented in east-west and other one minor set oriented along north-south as shown in Figure
10(B). The integrated lineament appears primarily in four sets of directions: one major set oriented along east-west and
three minor sets oriented in north-south, northeast-southwest and northwest-southeast as shown in Figure 10(C). It can be
inferred from above study that traverse lines for geophysical survey have to be selected approximately in north-south
direction depending upon the feasibility and availability of space in area.
CONCLUSIONS
The integrated lineament of study area depicts the appropriate locations which were selected for geophysical
survey and also for further detailed study. It may or may not delineate the fracture zones because maximum numbers of
lineaments or more density of lineaments are existed near the wells and tube wells. In integrated density map, the high
density may have important groundwater prospects. The integrated lineament and integrated lineament density maps are
very helpful for conducting geophysical surveys. These maps are very helpful in distinguishing the prospective sites to
delineate hydrogeological features and the unfruitful attempts of conducting geophysical survey at several randomly
selected locations could be avoided which significantly minimize the cost and time of geoelectrical resistivity survey.
ACKNOWLEDGEMENTS
The authors wish to thank the Head of Department of Geophysics, B.H.U, Varanasi, India for providing the
Infrastrure to complete this work. We are thankful to the reviewers and editor of the journal who have given critical and
thoughtful suggestions, which improved present manuscript.
REFERENCES
1. Arlegui, L.E. and Soriano, M.A. 1998. “Characterizing Lineaments from Satellite Images and field Studies in the Central Ebro
Basin (NE Spain).” International Journal of Remote Sensing, 19(16), 3169-3185.
2. Arkoprovo, B., Adarsa, J. and Shashi, S.P. 2012. “Delineation of Groundwater Potential Zones using Satellite Remote Sensing
and Geographic Information System Techniques: A Case study from Ganjam district, Orissa, India.” 1(9), 59-66.
3. Bhattacharyya, A. 1996. Recent advances in Vindhyan geology. Geol Soc India Mem, 36, 331.
4. Bose, P.K., Sarkar, S., Chakrabarty, S. and Banerjee, S. 2001. “Overview of Mesoto Neoproterozoic evolution of the Vindhyan
basin, Central India.” J. Sediment Geol., 142, 395–419.

18 R. Kumar & G. S. Yadav
www.tjprc.org [email protected]
5. Boucher, R.K. 1995. “The relevance of lineament tectonics to hydrocarbon occurrences in the Cooper and Eromanga Basins,
South Australia.” Journal of Petroleum Exploration Society of Australia, 21, 69–75.
6. Chang, Y., Song, G. and Hsu, S. 1998. “Automatic Extraction of Ridge Valley Axes Using the profile Recognition and
Polygon-Breaking Algorithm.” Computers and geosciences, 24(1), 83-93.
7. Dix, O.R. and Jackson, M.P.A. 1981. “Statistical analysis of lineaments and their relation to fracturing, faulting, and
halokinesis in the East Texas Basin.” Bureau of Economic Geology, The University of Texas at Austin, Austin TX, Report 110,
30.
8. Fullea, J., Fernandez, M. and Zeyen, H. 2008. “FA2BOUG- A FORTRN 90 code to compute Bouguer gravity anomalies from
gridded free-air anomalies: Application the Atlantic-Mediterranean transition zone.” Computer & Geosciences, 34, 1665-
1681.
9. Guild, P.W. 1974. Distribution of metallogenic provinces in relation to major earth features: Schriftenreihe der
erdwissenschaftlichen Kommission der Österreichischen Akademie der Wissenschaften Band, 1, 10-24.
10. Guftafsson, P. 1993. “Satellite data and GIS as a tool in groundwater exploration in semi-arid area.” Publication A 74,
Chalmers University of Technology, Gothenburg, Sweden, 159p.
11. Hardcastle, K. 1995. “Photolineament factor: a new computer-aided method for remotely sensing the degree to which bedrock
is fractured.” Photogramm Eng. Remote Sensing, 61(6), 739-747.
12. Hastings, D.A. and Dunbar, P.K. 1998. “Development and assessment of the global land one-km base elevation digital
elevation model (GLOBE).” International Society of Photogrammetry and Remote Sensing, Archives 32(4), 218–221.
13. Krishnan, M.S. and Swaminathan, J. 1959. ‘The Great Vindhyan Basin of Northren India.” J. Geol. Soc. Ind., 14.
14. Krishnan, M.S. 1982. Geology of India and Burma. 6th Ed. CBS publishers and distributors, New Delhi, 536pp.
15. Lillesand, T.M. and Keifer, R.W. 1999. Remote Sensing and Image Interpretation. 4th Edition.
16. Masoud, A., Koike, K. and Teng, Y. 2007. “Geothermal Reservoir Characterization Integrating Spatial GIS Models of
Temperature, Geology, and Fractures.” Proc. 12th Conference of International Association for Mathematical Geology,
Beijing, China, August 26-31, (on CD-ROM).
17. Mah, A., Taylor, G.R., Lennox, P. and Balia, L. 1995. “Lineament Analysis of Landsat Thematic Mapper Images, Northern
Territory, Australia.” Photogrammetric Engineering and Remote Sensing, 61(6), 761-773.
18. Mishra, M. and Sen, M. 2010. “Geochemical signatures of Mesoproterozoic silicaclastic rocks of the Kaimur Group of the
Vindhyan Supergroup, Central India.” Chin. J. Geochem., 21, 021–032.
19. Mohammed, A., K.P. and Kumanan, C.J. 2010. “Significance of Surface Lineaments for Gas and Oil Exploration in Part of
Sabatayn Basin-Yemen.” Journal of Geography and Geology, 2(1), 119-128.
20. Nama, E.E. 2004. “Lineament Detection on Mount Cameroon During the 1999 Volcanic eruptions Using Landsat ETM.”
International Journal of Remote Sensing, 25(3), 501-510.
21. Palamuleni, L.G.C. 2009. “Land Cover Change and Hydrological Regimes in the Shire River Catchment Malawi.” Published
Ph. D thesis, University of Johannesburg.
22. Qari, M.Y.H.T. 1991. “Application of Landsat TM Data to Geological Studies, Al-Khabt Area, Southern Arabian.”
Photogrammetric Engineering and Remote Sensing, 57(4), 421-429.
23. Rowan, L.C. and Bowers, T.L. 1995. “Analysis of linear features mapped in Landsat thematic mapper and side-looking

Significance of Surface and Subsurface Lineaments for Groundwater Exploration 19 in the Part of Vindhyan Fringe Belt of Mirzapur District, U. P., India
www.tjprc.org [email protected]
airborne radar images of the Reno 1 degree by 2 degree Quadrangles, Nevada and California; implications for mineral
resource studies.” Photogrammetric Engineering & Remote Sensing, 61(6), 749–759.
24. Rowland, J.V. and Sibson, R.H. 2004. “Structural controls on hydrothermal flow in a segmented rift system.” Taupo Volcanic
Zone, New Zealand, Geofluids, 4(4):259–283.
25. Sandwell, D.T. and Smith, W.H. F. 1997. “Marine gravity anomalies from GEOSAT and ERS-1 satellite altimetry.” Journal of
Geophysical Research, 102, 10039–10054.
26. Sibson, R.H. 1986a. “Earthquakes and lineament infrastructure.” Philosophical Transactions of the Royal Society, London A,
317(1539), 63-79.
27. Sibson, R.H. 1986b. “Brecciation processes in fault zones, inferences from earthquake rupturing.” Pure Applied Geophysics,
124(1-2), 159-175.
28. Smith, W.H.F. and Sandwell, D.T. 1994. “Bathymetry prediction from dense satellite altimetry and sparse ship-borne
bathymetry.” Journal of Geophysical Research, 99, 21803–21824.
29. Suzan, M.L. and Topark, V. 1998. “Filtering of Satellite Images in Geological Lineament Analysis: An Application to a fault
Zone in Central Turkey.” International Journal of Remote Sensing, 19(6), 1101-1114.
30. Teme, S.C. and Oni, S.F. 1991. “Detection of groundwater flow in fracture media through remote sensing technique-Some
Nigerian cases.” Journal of African Earth Science, 12(3), 461-466.
31. Warner, T.A. 1997. “Integration of remotely sensed geobotanical and structural methods for hydrocarbon exploration in
West-central West Virginia.” Final report for DOE-sponsored Research Contract, DE-FG21-95MC32159, Morgantown, WV,
USA, 10.
APPENDICES
Figure 1: Location Map of the Study Area

20 R. Kumar & G. S. Yadav
www.tjprc.org [email protected]
Figure 2: Surface Lineament Map from Satellite Imagery of the Study Area
Figure 3: Surface Lineament Density Map of the Study Area
Latitu
de
2.0 - 3.0

Significance of Surface and Subsurface Lineaments for Groundwater Exploration 21 in the Part of Vindhyan Fringe Belt of Mirzapur District, U. P., India
www.tjprc.org [email protected]
Figure 4: Subsurface Lineaments from Gradient Directional Map of
Gravity Data along East-West Direction
Figure 5: Subsurface Lineaments from Gradient Directional Map of Gravity Data along North-South Direction
Figure 6: Subsurface Lineament Map of the Study Area
Latitu
de
22 R. Kumar & G. S. Yadav
www.tjprc.org [email protected]
Figure 7: Subsurface Lineament Density Map of the Study Area
Figure 8: Integrated Lineament Map of the Study Area
Latitu
de

Significance of Surface and Subsurface Lineaments for Groundwater Exploration 23 in the Part of Vindhyan Fringe Belt of Mirzapur District, U. P., India
www.tjprc.org [email protected]
Figure 9: Integrated Lineament Density Map of the Study Area
Figure 10: Rose Diagrams Show Orientation of Lineaments


![[XLS]dcpathanamthitta.files.wordpress.com · Web viewNEERAJA RAJAN RAJAN M.A 11/10/1997 MANNAKUNNIL HOUSE KAVIYOOR.P.O N.S.S.H.S.S. KAVIYOOR.P.O THIRUVALLA RAJALEKSHMI .K.R RAJAN](https://img.pdfslide.net/doc/110x75/5affd3a67f8b9a952f8bf10c/xls-viewneeraja-rajan-rajan-ma-11101997-mannakunnil-house-kaviyoorpo-nsshss.jpg)

![Pal_et_al[1] SAR FFT Lineament IJRS](https://img.pdfslide.net/doc/110x75/577d205d1a28ab4e1e92a9c1/paletal1-sar-fft-lineament-ijrs.jpg)