Embed Size (px)
Citation preview

3 Egypt Mahmoud Mohamed Abdellatif 3.1 Introduction
Egypt, commonly known as “The mother of the world’, “Land of civilization”, “Land of Quiver
(al-kanana)” and “The greatest power in the human history”, is reputed worldwide for its distinct 7000 years old record of civilization and immense wealth of knowledge. This has made Egypt a master and pioneer of science, arts and culture as well as all fields of human knowledge.
Egypt is one of a few countries all over world has kept its name unchanged over history, the Arabic equivalent name of Egypt is Misr, it was mentioned explicitly many times in the Holy Qura’n, the present official name of Egypt is Arab Republic of Egypt. 3.1.1 Land
Country location, Egypt located in the east north of African continent and west Asia continent, it lays between latitudes 22 and 32 norths of equator and between longitudes 24 ◦ and 37 ◦ east of Greenwich line
Geographical border, Egypt is bounded as follows, to the north by the Mediterranean Sea with a 955- km- long coast, to the east by the red sea with a 1941 –km-long coast, to the northeast by 265 km-long borders with Palestine, to the west, by 1115 km-long borders with Libya, and to the south, by 1280 km-long borders with Sudan. Area, Egypt has a total area of about 1,002,000 km2, 5.5% are populated.
The Capital of Egypt is Cairo, it is the largest city in the Arab world and Africa in order population, and on January 1, 1998 the population estimated at 7.162 million. Cairo is time-honored city, with an outstanding position among world capitals. Physical features, Egypt are divided into four major parts: 1) Nile valley and delta, it has an area of about 33000 km2 less than 4% of the total area of the
country, it extends in the south from Wadi Halfa up to Mediterranean coast in the north 2) Western desert, it occupies an area about 680,000km2, which equal to 68% of Egypt’s total
area extends from the Nile valley in the east to Libyan borders in the west, and from the Mediterranean Sea in the north to Egypt’s southern borders.
3) Eastern desert, its area is about 225,000km2, which represent 28% of Egypt’s total area; the eastern desert is marked with the eastern mountains range along the red sea with peaks that rise up about 3000 feet above sea level.
4) Sinai Peninsula, with an area of about 61000km2, which represents about 6.1% of Egypt’s total area, Sinai is bounded by the Mediterranean to the north, the Gulf of Aqaba to the east, and Gulf of Suez and Suez Canal to the west. Sinai is Asian part of Egypt.
3.1.2 Population
According to the 1996 census, the population residing within the country showed 59.3 million excluding Egyptian living abroad.
In 2000/2001, the population of Egypt estimated at 64.652 million, it is expected to reach 65.828 million in 2001/2002 excluding Egyptian living abroad, apart from Egyptians living abroad estimated at 1.9 million, total population at home and abroad is expected to be 67.728 million in 2001/2002.
71
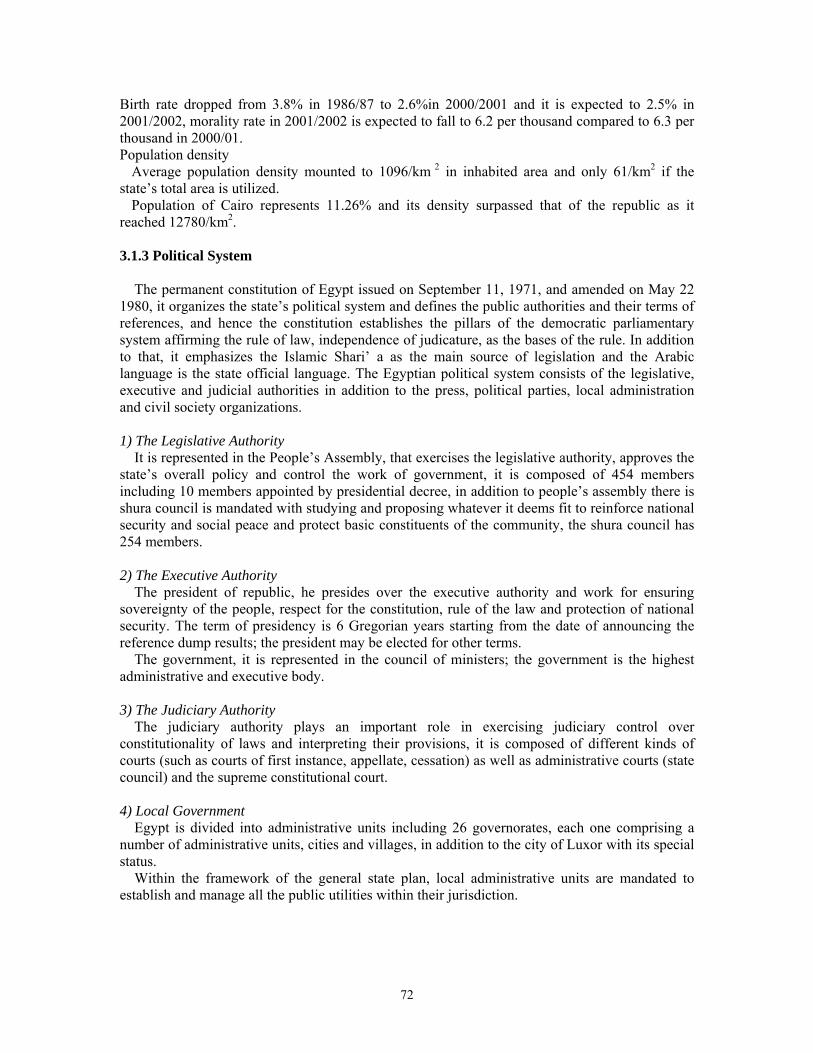
Birth rate dropped from 3.8% in 1986/87 to 2.6%in 2000/2001 and it is expected to 2.5% in 2001/2002, morality rate in 2001/2002 is expected to fall to 6.2 per thousand compared to 6.3 per thousand in 2000/01. Population density
Average population density mounted to 1096/km 2 in inhabited area and only 61/km2 if the state’s total area is utilized.
Population of Cairo represents 11.26% and its density surpassed that of the republic as it reached 12780/km2. 3.1.3 Political System
The permanent constitution of Egypt issued on September 11, 1971, and amended on May 22 1980, it organizes the state’s political system and defines the public authorities and their terms of references, and hence the constitution establishes the pillars of the democratic parliamentary system affirming the rule of law, independence of judicature, as the bases of the rule. In addition to that, it emphasizes the Islamic Shari’ a as the main source of legislation and the Arabic language is the state official language. The Egyptian political system consists of the legislative, executive and judicial authorities in addition to the press, political parties, local administration and civil society organizations. 1) The Legislative Authority
It is represented in the People’s Assembly, that exercises the legislative authority, approves the state’s overall policy and control the work of government, it is composed of 454 members including 10 members appointed by presidential decree, in addition to people’s assembly there is shura council is mandated with studying and proposing whatever it deems fit to reinforce national security and social peace and protect basic constituents of the community, the shura council has 254 members. 2) The Executive Authority
The president of republic, he presides over the executive authority and work for ensuring sovereignty of the people, respect for the constitution, rule of the law and protection of national security. The term of presidency is 6 Gregorian years starting from the date of announcing the reference dump results; the president may be elected for other terms.
The government, it is represented in the council of ministers; the government is the highest administrative and executive body. 3) The Judiciary Authority
The judiciary authority plays an important role in exercising judiciary control over constitutionality of laws and interpreting their provisions, it is composed of different kinds of courts (such as courts of first instance, appellate, cessation) as well as administrative courts (state council) and the supreme constitutional court. 4) Local Government
Egypt is divided into administrative units including 26 governorates, each one comprising a number of administrative units, cities and villages, in addition to the city of Luxor with its special status.
Within the framework of the general state plan, local administrative units are mandated to establish and manage all the public utilities within their jurisdiction.
72

5) Political Parties As nationalist and popular organizations, these parties are engaged in rallying and politically
representing citizens, thereby contributing to political, socioeconomic and democratic progress. There are 15 political parties and national Democratic Party is the ruling party as it has parliament majority.
3.2 Overview of Macroeconomic Activity and Fiscal Policy
After Egypt had attained its political independence from British colony in 1952, the political system changed from the monarchical system to the republican system, Egypt had started economic development through economic planning approach during that time in order to achieve soci-economic development and increase GDP per capita, in order to achieve these objective the Egyptian government had to nationalize Suez Canal in 1956, corporation and banks in 1961, implementation of agrarian reform in 1961 ,and pay more attention to industry to change Egypt from agricultural society depends mainly on exporting cotton, rice and other agricultural products and raw materials to industrial society, these changes had a great impacts on Egyptian economy, but unfortunately this economic progress couldn’t be continuous ,as in June 5,1967 Israel launched a treacherous assault against Egypt ,Syria and Jordan ,ending up with Israel occupation of Sinai ,the Golan Heights and the west bank of Jordan.
As result to this war the economic development process was suspended temporary as the economic resources almost were totally assigned to military purposes in order to liberate occupied land .On October 6, 1973, both Egyptian and Syrian armies simultaneously launched a battle to liberate Arabic lands from occupation, they achieved outstanding victory against Israel.
After that the Egyptian government paid more attention to economic development and peace, so in 1974 the Egyptian government launched economic openness policy and the first investment law was introduced (law No43 of 1974) which permitted to Arabic and foreign capital to invest directly in Egypt through establishing investment banks and corporations, under this law many companies, banks and offshore banks were established to enjoy by the investment incentives which given in accordance with that law, they include tax holidays and other incentives
As a result of economic openness policy and peace agreement which signed with Israel in 1979, the gross national product GDP increased substantially during the period from 1974 to 1984 about 8% annually.
In 1982 Egypt has started long term socioeconomic plan started from FY 1982/83 to FY 2017/2018, it is divided into interim plans (quinquennium) this economic plans aim to increase growth rate and developing Egyptian society in all aspects which well led at last to strengthen Egypt competitiveness.
In spite of these efforts to strengthen Egyptian economy, in the mid of 1980s and at the late of 1980s Egyptian economy had faced many difficulties which result from internal and external factors, these difficulties led to high level of inflation rate which estimated above 20%, annual rate of liquidity exceeding 18%, budget deficit was 15% in FY 1989/1990 .The economy was ebbing reflected in growing level of dollarization with high fraction (nearly 50%) of total liquidity accounted for by foreign currency deposits, internal imbalances were complemented by external balances ,the external debt burden was increased and other macroeconomic issues.
In the early of 1990s the Egyptian government has started macroeconomic stabilization program through collaboration with IMF and other international financial institutions, the results of this program are outstanding and led substantially economic stability and economic growth, which reflected in the figures of economic indicators of Egyptian economy during 1990s and in the beginning of the 21st. Century.
73

3.2.1 Macroeconomic Activity 1) International Environment
International environment includes number of elements, these elements are trade balance, current account, exchange rate and exchange system, foreign direct investment (FDI) and, borrowing from abroad and foreign aid. Trade Balance
As apart of macroeconomic stabilization program which has been started in 1991, reforming trade balance is one of most important measures applied by Egyptian government, in order to achieve this, Egypt carried out many regulations to liberate foreign trade with international society, applying unified exchange rate system (which consider the nominal anchor for stabilization program) which result in a significant effect on trade balance, in addition to rationalizing import prohibtation rules, lowering tariffs and narrowing the list of imports subject to compulsory quality control inspection.
At the same time Egypt joined world trade organization (WTO), as in June 1995 Egypt acceded to the WTO, in June 1998 Egypt joined the 21st member common market for eastern and southern Africa (COMESA), since October 31, 2000 tariffs with other (COMESA) Countries have been eliminated, with a view to establish a customs union by 2004 and monetary union by 2025, also Egypt joined the Greater Arab Free Trade Agreement (GAFTA) and it is scheduled to eliminate tariffs completely with other member states by 2007.In July 1999.
Egypt and the United States of America signed trade and investment free trade agreement (TIFA).
In 2000/2001 Egypt negotiated and signed partnership agreement with European union and anticipated formally into the agreement, shortly the agreement will permit Egypt to join the proposed European–Mediterranean–free trade zone which will establish in 2010.
Such trade agreements would posit Egypt as an attractive and strategic for FDI in exportable products to the European Union countries and COMESA markets.
The effects of stabilization program and free trade agreements affected in the figures of trade balance in the recent FY years, as the deficit of trade balance was dropped by 18.5% to US $ 9.4 billion in the FY 2000/20011, the fall in trade deficit partially explained by the fact that proceeds of commodity exports climbed significantly by 10.8% to US$7.1 billion against US$ 6.4 billion in 99/2000, on the other hand import payments retreated by US$ 1.4 billion or 8% to US$16.4 billion, this came as a reflection as of the all imports group with the exception of raw material imports, also the results of balance of payment of FY 2001/2002 witnessed improvement as the trade balance deficit was reduced from US$ 9353.6 million to US$ 8000.8 million.
Table 3.1 shows the balance of payments figures during the period from 1998/1999 to 2001/2002
1 Central Bank of Egypt(2002) “Annual Report 2000/2001
74

Table 3.1 Balance of Payments (million US$) Items 98/99 99/2000 2000/2001 2001/2002Current Account -1723.8 -1163.1 -33.0 -8.5 Current Account (excluding transfers) -6577.6 -5842.6 -3775.2 -4081.7 Trade Balance -12562.5 -11472.3 -9353.6 -8000.8 - Export 4445.1 6387.7 77078.2 6643.4 - Import -17007.6 17860.0 -16441.3 -14644.2 Service Balance 5696.6 5629.7 5587.5 3919.1 - Receipts 11025.5 11425.6 11696.4 9617.5 - Payments -5055.9 -5795.9 -6118.0 -5698.4 Transfers 4869.1 4679.5 3742.2 4073.2 - Officials 1096.7 932.5 769.3 1143.6 - Private 3772.4 3747.1 2972.9 2929.6 Capital and financial transactions 879.9 -1199.2 -541.6 -1037.7 -Direct Investment in Egypt (net) 710.6 1656.1 509.4 428.2 -Direct Investment abroad (net) -55.8 -42.5 -27.3 -15.2 -Portfolio Investment in Egypt (net) -173.6 472.6 260.5 45.3 -Portfolio Investment Abroad (net) -43.1 -12.2 -4.6 -3.2 -Other Investment (net) 480.5 -3273.2 -1279.6 1492.8 Net Error and Omissions -1311.5 -664.4 -278.2 599.1 Overall Balance -2116.7 -3026.7 -852.8 -447.1 Change in Reserve Asset Increase 2116.7 3,026,7 852.8 447.1
Source: Central Bank of Egypt Exports
Egyptian exports to the world consists of oil& gas products and non oil products, exports proceeds increased markedly by US$ 690.5 million during FY 2000/2001 this was due to the tangible rise in proceeds of crude oil and its products and non oil products.
Proceeds of oil exports stepped up by US$ 395.5 million to US$ 2.6 billion mainly because proceeds of crude oil exports increased by 29.2% to US$ 1.2 billion, while those of oil products dropped by 3.8 %to US$ 836.8 million
Regarding the proceeds of non oil exports, those of finished products edged up in 2000/2001 by US$ 184.7 million or 7.1% to US$ 2.8 billion, this was attributable to the expansion of exports proceeds of iron and steel products, sugar& products, rice and cotton textiles Table 3.2 shows exports according to their categories and relative importance for each category. Within FY 98/1999 to FY 2001/2002
Table 3.2 Exports By Degree of Manufacturing (million US$)
Items 1998/1999 1999/2000 2000/2001 2001/2002 Value % Value % Value % Value %
Total exports 4445.0 100.0 6387.7 100.0 7078.2 100.0 6643.0 100.0-Fuel Oil& Products 1017.5 22.9 2283.6 35.7 2649.6 37.4 1933.6 29.1-Raw Cotton 207.7 4.7 166.7 2.6 144.5 2.1 83.2 1.3-Raw Materials 254.6 5.7 153.7 2.4 162.6 2.3 184.8 2.8-Semi Finished Goods 418.6 9.4 282.8 4.4 398.5 5.6 440.5 6.6-Finished Goods 1675.9 37.7 2603.0 40.8 2788.4 39.4 2955.7 44.5-Miscellaneous Items 870.0 19.6 897.2 14.1 934.6 13.2 1045.6 15.7
Source: Central Bank of Egypt
75

This Table shows that finished commodities and fuel, mineral oils& products represent a significant item in Egyptian exports, but the importance of finished goods had increased substantially in recent years in comparison to fuel, oil& products. At the same time exports of raw cotton had decreased in year 2002, and it is obvious that it has declined considerably from year to year Imports
Imports of Egypt includes plant & equipments, intermediary goods, raw materials, consumer goods and etc, imports declined by US$ 1.4 billion or 8% to US$ 16.4 billion in FY 2000/2001 reflecting drop in all import groups, raw material group being an exception to the said trend, it increased by US$ 991.0 million to US$ 3.7 billion, Table 3.3 shows import figures according to their groups and their relative importance. Table 3.3Imports by Degree of Manufacturing (million US$)
1998/1999 1999/2000 2000/2001 2001/20002Items
Value % Value % Value % Value % Total Imports 16969.9 100.0 17860.0 100.0 16441.3 100.0 14644.2 100.0
Fuel, Oil& Products 458.8 2.9 1051.0 5.9 953.5 5.8 520.2 3.6Raw Materials 2346.4 13.8 2688.3 15.0 3679.3 22.4 3276.8 22.4Intermediary Goods 5341.2 31.5 4209.5 23.6 3972.4 24.2 3702.1 25.3Investment Goods 5574.5 32.8 5638.8 31.6 3696.1 22.5 3022.7 20.6Consumer Goods 2956.2 17.4 2995.9 16.8 2864.8 17.4 2779.4 18.8Unclassified Imports 264.9 1.6 1275.7 7.1 1275.2 7.7 1343.0 9.7Source: Central Bank of Egypt Figure 3.1 Developments of Imports and Exports
0
5000
10000
15000
20000
1998/1999 1999/2000 2000/2001 2001/2002
IMPORTS EXPORTS
Figure 3.1shows that exports increased in recent years at the same time imports decreased, so
that the gap between exports and imports was declined. Current Account
Current account is the net result of trade balance and service balance, the statistics of central bank of Egypt referred to an improvement in the current account, before the 1991 the current account had a deficit about 8% of Egyptian GDP in FY 88/89, as current account was changed to
76

surplus about 1.1% average after post stabilization era according to IMF STATISTICS from 19991/1996.
In the FY 2000/2001 the current deficit contracted to US$ 33milliom against US$ 1.2 billion in FY 99/2000, such improvement stemmed from the fact that trade deficit declined by US$ 2.1 billion to US$ 9.4 billion compared with US$ 11.5 billion during the FY 99/2000, this improvement in trade balance due to the fact that proceeds from commodity exports markedly increased to US$ 7.1 billion against US$ 6.4 billion in FY 99/2000, in the other hand the commodity imports payment dipped to US$16.4 billion against US$17.9 billion.
At the same time services balance surplus remained almost stable at previous year, as for the balance of transfers, its surplus retreated byUS$0.09 billion during FY 2000/2001. Table 3.1 illustrated the changes which occurred in current account balance Exchange Rate and Exchange System
Exchange rate had played a crucial role in Egyptian macroeconomic stabilization program, the Egyptian government used exchange rate as a nominal anchor for macroeconomic stabilization, before the implementation of that program the exchange market has many deficiencies, there were three markets for foreign exchange which organized in, the central bank pool handled exports of petroleum, cotton & rice, Suez canal dues and, imports of essential foodstuffs, the second pool was the commercial bank pool which received proceeds of workers remittances, tourism and exports not going through the central bank pool while providing foreign exchange for public sector payments not covered by central bank ,both rates were marked by heavy intervention and did not reflect market forces, the third pool was informal pool, it was illegal but it was known and the government couldn’t control it at that time as it satisfied the needs of private sectors and individuals at that time ,this an inefficient system was working until May 1987.
Since May 1987 the government has started foreign exchange reform, by introducing new exchange market, in which all authorized commercial banks and two travel agencies were allowed to operate. The initial rate was set at LE. 2.165 To US$, during that period, the central bank pool rate was devaluated a number of times on August 15, 1989 the rate was increased from LE. 0.7 To LE. 1.1 To the US$, on July 1, 1990 the central bank pool rate was changed again to LE.2.0 to the US$. In the meantime, the rate in the new bank foreign exchange market had steadily depreciated and at the end of 1990 it had reached LE.3.0 to US$.
After February 1991 the multiple exchange system mentioned above was abolished on February 27, 1991 and replaced by temporary dual exchange system consisting of a primary market and secondary market, those two markets were unified in a single market on October 8, 1991,and since then the Egyptian Pound has been totally freely traded in a single exchange market, this exchange system led to many positive results for stabilization program, such as reducing budget deficit, current balance deficit change to surplus, reverse effect against dollarization which called dedollarlization and other results
The exchange rate was still stable without significant problems until 2000 at the end of year 2000, exchange rate of Egyptian Pound was depreciated the rate was increase from LE.3.4 to US$ to 3.85, the Central Bank of Egypt has intervened many times to restore stability for exchange market, in year 2001 many regulation had been issued, in August 5,2001 it was to increase central rate to LE.4.15 to US$ as well as the dealing band to 3%, as from December 13,2001 the central rate was raised further to LE.4.5 to US$, then to LE 4.51 to US$ on January 13 ,2002with the dealing band being stable at +3%, It is be noted that in early January 20022 the euro currency was launched for circulation by the European central bank ,dealing in national currencies of member countries has stopped since March 8,2002,this has additional role in the stability of foreign exchange market in Egypt , Table 3.3 illustrates the exchange rate of Egyptian 2 Arab Republic of Egypt, Ministry of Foreign Trade (2002)” Egypt 2002 “
77

pound against dollar Figure 3.2 shows the direction of exchange rate against US$ ,and Table 3.4 shows the exchange rate of Egyptian pound against international currencies Table 3.4 Exchange Rate of US$ Against Egyptian Pound
Year 1994 1995 1996 1997 1998 1999 2000 2001 2002
1US$ 3.39 3.393 3.393 3.389 3.395 3.396 3.446 4.51 4.52
Source: Central Bank of Egypt Figure 3.2 Exchange Rate of US$ Against Egyptian Pound
0
1
2
3
4
5
1994 1995 1996 1997 1998 1999 2000 2001 2002
This Figure shows the exchange rate of Egyptian pound against US$ from 1991/2002, it is
obvious that foreign exchange market faced many difficulties in year 2001 and 2002. Table 3.5 Exchange Rate of Egyptian Pound against Major for Currencies
Currencies Dec,2001 Jan.2002 Feb.2002 Aug. 2002 US dollar Euro Pound sterling 100-Japanses Yen Saudi Riyal Kuwait Dinar U.A.E. Dirham
4.5100 3.9780 6.5282 3.4348 1.1973
14.1618 1.1852
4.5200 3.9088 6.4032 3.4025 1.2120
14.1699 1.1879
4.5200 3.9060 6.4025 3.3573 1.2120
14.0501 1.1879
4.5200 4.3767 6.8771 3.7814 1.2120
14.4610 1.1879
Special drawing rights (SDR) 5.6427 5.6016 5.58733 na
Source: Central Bank of Egypt and EL-ahram newspapers Foreign Direct Investment
Egypt has encourage foreign direct investment since 1974, as Egyptian government believes that domestic capital is not enough to achieve high level of economic growth and capital formation, in addition to insufficient technical experience which requires foreign partners from developed countries, so that in 1974 law No.43 of 1974 was introduced which permitted to Arab and foreign capitals to invest in Egypt, this law gave many incentives, including tax holidays, transferring profits to home countries ,and other incentives ,which are vital to encourage investments ,according to the provisions of this law investment in Egypt have two forms, the first form is inland investment which exercised in accordance with the local laws, and the second from is free zone which subject to specific rules .
In 1989 another investment law was introduced law No 230 of 1989which abolished the previous investment law, but unfortunately this law failed to achieve the expected results and to
78

meet the needs of new economic era which accompanied by economic reform program, so that in 1997 a new investment law was introduced law No 8 of 1997, this law determines the businesses types which can be established in accordance with it and then, these businesses activities have the right to enjoy by the guarantees and incentives which given by this law.
These investment laws played an important rule in capital inflow to Egypt, at the same time privatization law No 203 of 1991 has encourage foreign capital to follow to Egyptian economy in order to share in privatization of public enterprises. Many foreign companies have bought number of Egyptian public corporations. Table 3.6 shows the figures of FDI within 1997/1998-2001/2002. These figures include FDI to Egypt in accordance to investment law and privatization law.
Table 3.6 Foreign Direct Investments in Egypt (Million US $)
FY 1997/1998 1998/1999 1999/2000 2000/2001 2001/2002Net foreign direct Investment (FDI) 1103.9 710.6 656.1 509.4 428.2
Percentage of change (%) --- -35.6 133.056 -69.24 -14.94 Source: Central Bank of Egypt
It is obvious that the FDI in Egypt is so low if it is compared to other developing countries, the cause of increase FDI in 1997/1998 was result from launching 2 new mobile phone companies and for 1999/2000 was privatization of many large public corporation including cement companies, so in normal condition the FDI is too low, the government tries to streamline regulations and modernize government agencies which have direct influence to investment environment and this may be in the long run give positive results which increase FDI in Egypt . 2) Borrowing from Abroad and Foreign Aid
Egypt had suffered a lot from foreign debt, before macroeconomic stabilization program, the foreign debt represented a huge burden on Egyptian economy, which led to many consequences on balance of payment, which also, suffered from oil prices collapse in 1986. In May 1987 Egyptian government negotiated restructuring of US$ 12.0 billion of loans from official creditors, Egypt had signed an agreement with US in1990 to cut its external debt to only US$ 250.0 million, paying a portion by delivery of goods, debt services remained a burden, Arab countries cancelled US$ 7.0 billion in Egyptian debt at the time of Gulf war.
Major western countries followed this exemption in 1991, under the restructuring of Paris club total debt of US$ 21.2 billion was reduced approximately 50% in net present value, additional military debt owed to the US was also forgiven in 1991.In turn, this reduced the debt service ratio from 42% in 1990 to below 10% in 1996 and then it reached to 7.2% in June 1999 as a percentage of GDP, foreign debt declined to31.7% in 1999.
The total amount of foreign debt according to the central bank of Egypt was declined from US$ 27783.3 million in 2000 to US$ 26560.0 million, but external debit return to increase in the FY2001/2002 as the result of many economic difficulties which faced Egypt in2001/2002, which enforced the Egyptian government to issue treasury bonds in US$ currency to meet the shortage in foreign currency which required to finance some national projects, Table 3.7 shows the External debt figures and its categories 1997/ 2002.
79
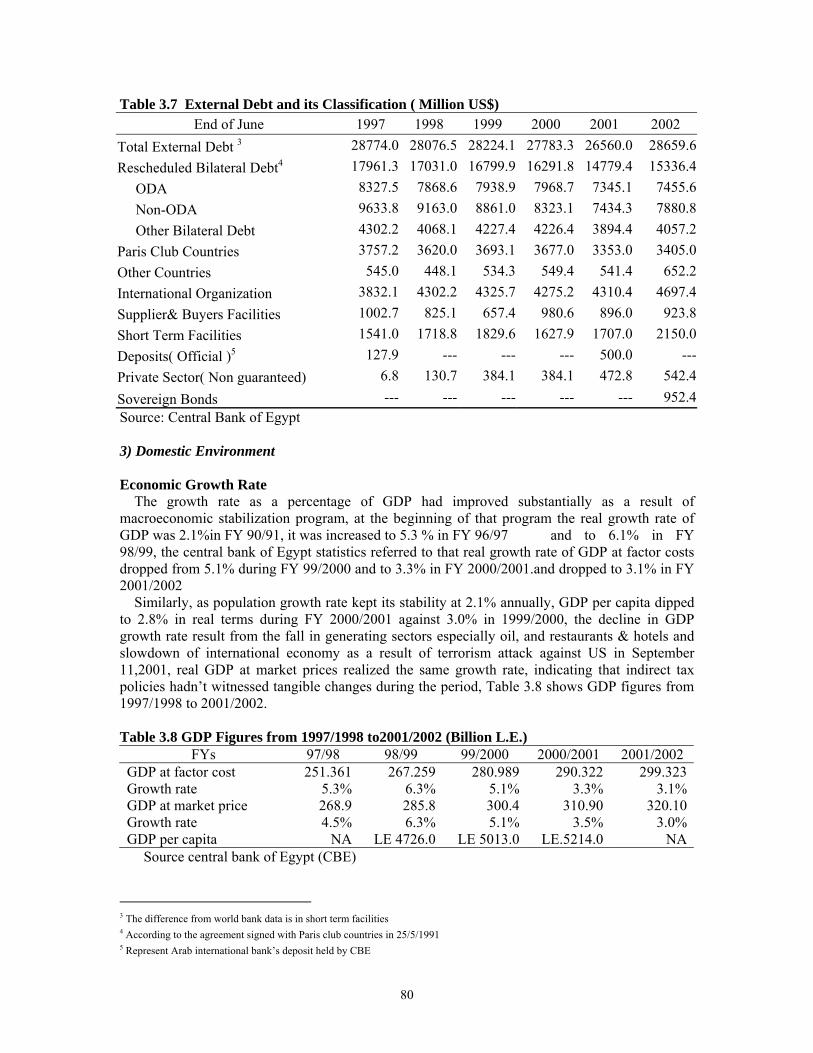
Table 3.7 External Debt and its Classification ( Million US$) End of June 1997 1998 1999 2000 2001 2002
Total External Debt 3 28774.0 28076.5 28224.1 27783.3 26560.0 28659.6Rescheduled Bilateral Debt4 17961.3 17031.0 16799.9 16291.8 14779.4 15336.4 ODA 8327.5 7868.6 7938.9 7968.7 7345.1 7455.6 Non-ODA 9633.8 9163.0 8861.0 8323.1 7434.3 7880.8 Other Bilateral Debt 4302.2 4068.1 4227.4 4226.4 3894.4 4057.2Paris Club Countries 3757.2 3620.0 3693.1 3677.0 3353.0 3405.0Other Countries 545.0 448.1 534.3 549.4 541.4 652.2International Organization 3832.1 4302.2 4325.7 4275.2 4310.4 4697.4Supplier& Buyers Facilities 1002.7 825.1 657.4 980.6 896.0 923.8Short Term Facilities 1541.0 1718.8 1829.6 1627.9 1707.0 2150.0Deposits( Official )5 127.9 --- --- --- 500.0 ---Private Sector( Non guaranteed) 6.8 130.7 384.1 384.1 472.8 542.4Sovereign Bonds --- --- --- --- --- 952.4Source: Central Bank of Egypt 3) Domestic Environment Economic Growth Rate
The growth rate as a percentage of GDP had improved substantially as a result of macroeconomic stabilization program, at the beginning of that program the real growth rate of GDP was 2.1%in FY 90/91, it was increased to 5.3 % in FY 96/97 and to 6.1% in FY 98/99, the central bank of Egypt statistics referred to that real growth rate of GDP at factor costs dropped from 5.1% during FY 99/2000 and to 3.3% in FY 2000/2001.and dropped to 3.1% in FY 2001/2002
Similarly, as population growth rate kept its stability at 2.1% annually, GDP per capita dipped to 2.8% in real terms during FY 2000/2001 against 3.0% in 1999/2000, the decline in GDP growth rate result from the fall in generating sectors especially oil, and restaurants & hotels and slowdown of international economy as a result of terrorism attack against US in September 11,2001, real GDP at market prices realized the same growth rate, indicating that indirect tax policies hadn’t witnessed tangible changes during the period, Table 3.8 shows GDP figures from 1997/1998 to 2001/2002.
Table 3.8 GDP Figures from 1997/1998 to2001/2002 (Billion L.E.)
FYs 97/98 98/99 99/2000 2000/2001 2001/2002GDP at factor cost Growth rate GDP at market price Growth rate GDP per capita
251.361 5.3% 268.9
4.5%NA
267.259 6.3% 285.8 6.3%
LE 4726.0
280.9895.1%300.45.1%
LE 5013.0
290.322 3.3%
310.90 3.5%
LE.5214.0
299.3233.1%
320.103.0%
NASource central bank of Egypt (CBE)
3 The difference from world bank data is in short term facilities 4 According to the agreement signed with Paris club countries in 25/5/1991 5 Represent Arab international bank’s deposit held by CBE
80
From this Table, the growth rate was declined significantly in recent years, as it was 5.1% in 1999/2000 then decline to 3.3 % in 2000/2001 and to 3.1% in 2001/2002, so that Egyptian government has to find suitable policies to increase growth rate to previous levels Inflation Rate
One of the most important results of macroeconomic stabilization program of Egypt was reducing the inflation rate from 19.5% in FY 90/91 to 2.8% in FY 2001/2002, The reduction of inflation rate result from a combination of fiscal, monetary, and credit policies which constitute stabilization program in addition to exchange rate which used as nominal anchor for this program.
The credibility of Egyptian government had an important role in declining inflation rate as the government applied successful policies with regard to prices, salaries & wages and liberating interest rates
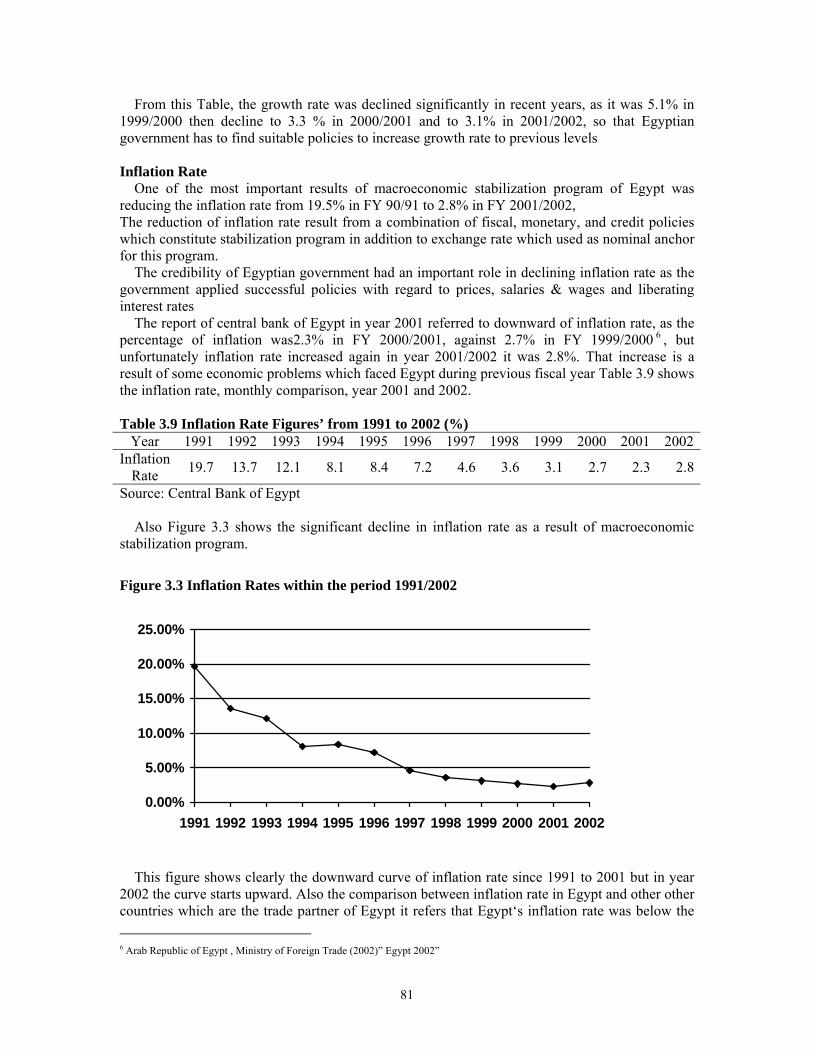
The report of central bank of Egypt in year 2001 referred to downward of inflation rate, as the percentage of inflation was2.3% in FY 2000/2001, against 2.7% in FY 1999/2000 6 , but unfortunately inflation rate increased again in year 2001/2002 it was 2.8%. That increase is a result of some economic problems which faced Egypt during previous fiscal year Table 3.9 shows the inflation rate, monthly comparison, year 2001 and 2002. Table 3.9 Inflation Rate Figures’ from 1991 to 2002 (%)
Year 1991 1992 1993 1994 1995 1996 1997 1998 1999 2000 2001 2002Inflation
Rate 19.7 13.7 12.1 8.1 8.4 7.2 4.6 3.6 3.1 2.7 2.3 2.8
Source: Central Bank of Egypt
Also Figure 3.3 shows the significant decline in inflation rate as a result of macroeconomic stabilization program.
Figure 3.3 Inflation Rates within the period 1991/2002
0.00%
5.00%
10.00%
15.00%
20.00%
25.00%
1991 1992 1993 1994 1995 1996 1997 1998 1999 2000 2001 2002
This figure shows clearly the downward curve of inflation rate since 1991 to 2001 but in year
2002 the curve starts upward. Also the comparison between inflation rate in Egypt and other other countries which are the trade partner of Egypt it refers that Egypt‘s inflation rate was below the 6 Arab Republic of Egypt , Ministry of Foreign Trade (2002)” Egypt 2002”
81

average of inflation rate of those trade partners, Table 3.10 shows the inflation rate in Egypt comparison to its trade partners countries in FY 2000/2001.
Table 3.10 Inflation Rates Of Egypt Trade Partners’
Source: Central Bank of Egypt
Trade partners Relative weight ofexternal trade based
on volume
Inflation Rate FY 99/2000
Inflation Rate FY
2000/2001 USA Germany UK France Switzerland Italy Japan Belgium The Netherlands Spain
0.429 0.115 0.091 0.081
0.070 0.063 0.051 0.035 0.032 0.032
3.7% 1.9% 3.3% 1.7% 1.8% 2.7%
-0.7% 2.8% 2.7% 3.4%
3.2% 3.1% 1.9% 2.1% 1.6% 3.0%
-0.5% 2.95 4.5% 4.2%
1.00 2.78% 2.73%
Consumption
Consumption includes the consumption of households and public consumption, in FY 2000/2001 Household consumption dropped to 71.3% of GDP against 71,5 % of GDP in FY 1999/2000, and public consumption dropped to 9.6% in FY 2000/2001 against 9.7% in FY 19999/2000, consequently gross domestic saving rose to 19.1% against 18.8%, the moderate decline in the growth rate in capital formation from 1.8% to 1.7% was associated with drop in its ratio in GDP from 24.6% to 23.9%. The domestic resources gap improved, as such from 5.8% of GDP in 1999/2000 to 4.8% of GDP in 2000/2001.
Final consumption private (household consumption) and public recorded growth rate of 4.6% against 4.25%, this was attributable to the success in cutting real growth rate in public expenditure to 3.5% against 4.3% making up for a large part of the impact of the rise in the private consumption from 4.2% to 4.75.
Table 3.11 illustrates the expenditure (consumption) on GDP and its evolution during the period from 98/99 to 2000/2001. Table 3.11 Expenditure on GDP from 1998/1999 to 2000/2001 (Billion LE.)
FY 1998/1999 Value %
1999/2000 Value %
20000/2001 Value %
1-Final consumption • Public consumption • Private consumption
2- Gross capital formation 3- Total domestic expenditures 1+4- Domestic resources gap 5- GDP at market price 3+4 6- Gross domestic savings 5-1
235.0 81.928.2 9.8206.8 72.173.0 25.5308.0 107.4(21.1) (7.4)286.9 100.051.9 18.8
244.9 81.229.4 9.7215.5 71.574.3 24.6319.2 105.8(17.6) (5.8)301.6 10056.7 18.8
256.1 80.930.4 9.6225.7 71.375.5 23.9331.6 104.8(15.3) (4.8)316.4 100.0
60.3 19.1Source central bank of Egypt (CBE)
82

Investment According to the macroeconomic stabilization program, government investment had been
declined substantially since 1991, as the Egyptian government has started privatization of public enterprises and this led to decreasing public investment, it is limited to infrastructures projects, such as water, electricity, communication, roads and others, so that private investment has upward direction from year to year. Central bank statistics referred to, the volume of investment implemented during the FY 2000/2001 amounted to LE.83 billion, with growth rate 1.7% against growth rate 6.0% in FY 1999/2000. The share of private sector in these investments rose to 66.9% of total against 54.0% in FY 1999/2000, Table 3.12 shows the actual investments of public and private sectors.
Table 3.12 Distribution of Investment Expenditure in Egyptian Economy FY 1998/1999 1999/2000 2000/2001 Value % Value % Value % Total 77.0 100.0% 81.6 100.0% 83.0 100.0% Private sector 43.5 56.5% 48.1 59.0% 55.6 66.9% Public sector 33.5 43.5% 33.5 41.0% 27.4 33.1% Source: Central Bank of Egypt Figure 3.4 Investment Expenditures
0
10
20
30
40
50
60
1998/1999 1999/2000 2000/2001
public sector private sector
Figure 3.4 shows that private investment expenditure gained more importance as a result of macroeconomic stabilization program. Capital Stock
Egyptian Stock Market witnessed a substantial growth since the beginning of 1990s, as a result of stabilization program, consequently Egyptian government would privatize public corporations, to achieve that and encourage private investment, in1991the government introduced privatization law 203 of 1991 and in 1992 capital market law was introduced law No 95 of 1992, both laws represent the keystone for an effective capital market. in addition to those laws many regulations had been issued later to cope with economic changes and challenges, for example in 1997 ministerial decree No 501 of 1997 was issued, which obliged all Egyptian and foreign corporation companies which exercise their business in Egypt and listed in Egyptian stock exchange have to follow Egyptian accounting standards in preparing their financial statements, these accounting standards consider the basis of financial disclosure which lead to transparency in the financial markets and encourage foreign investors to invest in Egyptian stock market, in addition to this financial auditing standards was issued in 2000, as ministerial decree No 625 of 2000, which
83

obliged financial auditors to follow these standards when carrying out any type of auditing for any corporations which support the credibility of financial auditing ,then the credibility of corporations’ financial statements.
In accordance with those laws and regulations the Egyptian stock market is being one of the emerging stock markets in the middle east region and among transition economies countries, many brokerage companies had been established for performing financial transaction in stock exchanges in Cairo and Alexandria, providing customers with relevant information about stock exchanges and stock prices, according to the statistics of Egyptian capital market authority in Egypt in year 2001 there were 10 new companies were given the license to commence activity in the stock market ,brining up the total number of the companies which conduct such activities to 273 by the end of June 2001 ,the break down of this number includes 155 are brokerage companies , 15 are companies for mutual funds management , 95 for subscription and underwriting ,corporate foundation &venture capital, 4 companies for record keeping & information dissemination, 8 companies for securities assessment and single company for clearing & settlement.
Regarding to corporations listed in stock exchange in year 2002, 64 new companies were listed on stock exchange increasing their total number to 1136 company, with the market and nominal value of their capital posting LE 118.6 billion and LE 89.12 billion respectively at the end of June 2002, Table 3.13 shows the data and classification of those listed companies.
Table 3.13 Number of Companies Listed in Egyptian Stock Exchanges
At the end of June 1998 1999 2000 2001 2002 No. of listed companies(units)
Official Unofficial
No. of listed shares (million) Official Unofficial
Nominal value of shares (Million LE.)(1) Market value of shares (Million LE.) (2) Ratio (2)/(1) LE shares price index
702 116 5862,5051,3111,194
23,172
70,783 3.1363.9
960 137 823
3,534 1,347 2,187
40,897
94,843 2.3
480.3
1,036 141 8954,4501,8842,566
69,535
119,734 1.7
615.2
1,072 144
928 5,146 1,525 3,621
76,737
110,317
1.4 602.6
1,136 147 9895,410
1,533 3,877
89,127
118,673 1.3
627.4Source: Central Bank of Egypt
This Table shows that the number of listed companies is increasing annually in both schedules official schedule and unofficial schedule, as result of increased listed companies the number of shares and their nominal value increase, but the market value of shares is reduced considerably, as it was 3.1 in 1998 and in 2002 it was 1.33. The general index of financial market was improved substantially as it increased from 393.9 in 1998 to 627.4. Figure 3.5 shows the changes in stock market index in Egypt
84
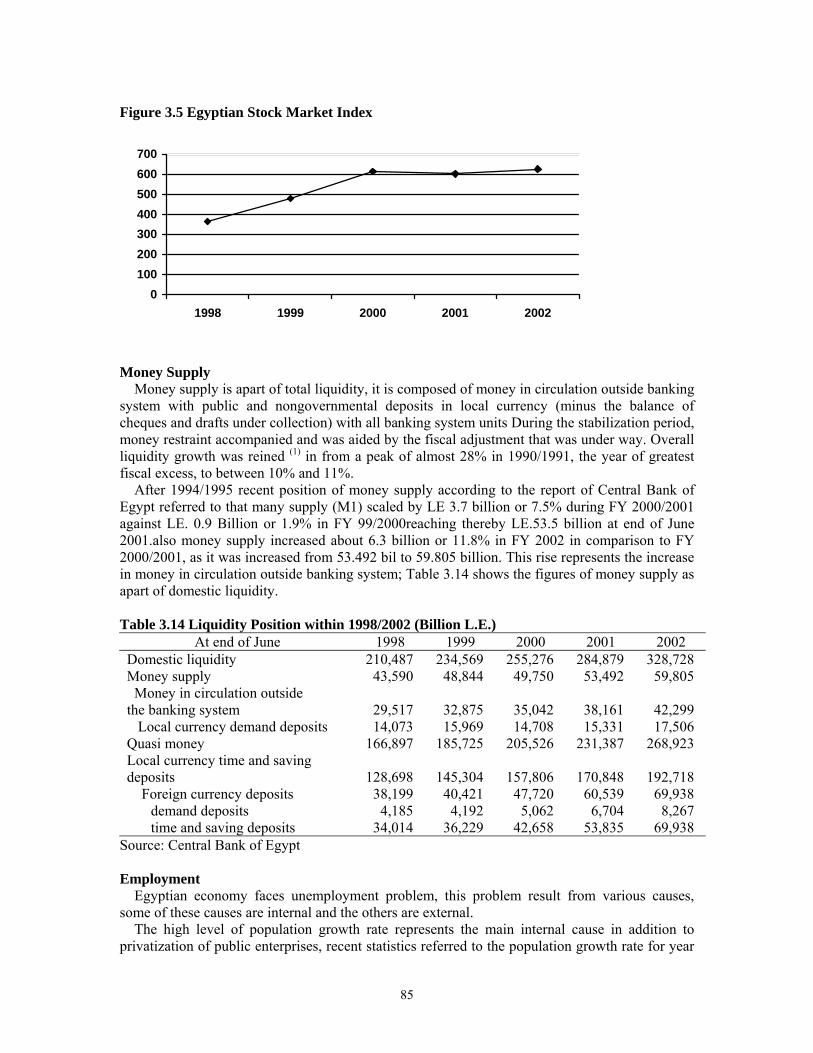
Figure 3.5 Egyptian Stock Market Index
0100200300400500600700
1998 1999 2000 2001 2002
Money Supply
Money supply is apart of total liquidity, it is composed of money in circulation outside banking system with public and nongovernmental deposits in local currency (minus the balance of cheques and drafts under collection) with all banking system units During the stabilization period, money restraint accompanied and was aided by the fiscal adjustment that was under way. Overall liquidity growth was reined (1) in from a peak of almost 28% in 1990/1991, the year of greatest fiscal excess, to between 10% and 11%.
After 1994/1995 recent position of money supply according to the report of Central Bank of Egypt referred to that many supply (M1) scaled by LE 3.7 billion or 7.5% during FY 2000/2001 against LE. 0.9 Billion or 1.9% in FY 99/2000reaching thereby LE.53.5 billion at end of June 2001.also money supply increased about 6.3 billion or 11.8% in FY 2002 in comparison to FY 2000/2001, as it was increased from 53.492 bil to 59.805 billion. This rise represents the increase in money in circulation outside banking system; Table 3.14 shows the figures of money supply as apart of domestic liquidity.
Table 3.14 Liquidity Position within 1998/2002 (Billion L.E.)
At end of June 1998 1999 2000 2001 2002 Domestic liquidity Money supply Money in circulation outside the banking system Local currency demand deposits Quasi money Local currency time and saving deposits Foreign currency deposits
demand deposits time and saving deposits
210,487 43,590
29,517 14,073166,897
128,698 38,199 4,185 34,014
234,569 48,844
32,875 15,969185,725
145,304 40,421 4,192 36,229
255,276 49,750
35,042 14,708205,526
157,806 47,720 5,062 42,658
284,879 53,492
38,161 15,331 231,387
170,848 60,539 6,704 53,835
328,728 59,805
42,299 17,506268,923
192,718 69,938 8,267 69,938
Source: Central Bank of Egypt Employment
Egyptian economy faces unemployment problem, this problem result from various causes, some of these causes are internal and the others are external.
The high level of population growth rate represents the main internal cause in addition to privatization of public enterprises, recent statistics referred to the population growth rate for year
85

2001 is 2.3%, at the same time labor force increase by 556000, this figure includes only university graduates, and high school graduates.
Privatization of public enterprises led to redeployment of workers which increases the level of unemployment, at the beginning of stabilization program unemployment level was about 10%.
In the other hand, external factors which affects in an unemployment is related to tourists’ business activities as tourists’ sector plays an important rule in Egyptian economy and it employs a considerable number of workers, unfortunately this sector is too sensitive to any political unrest or security measures, so that in 1997 after terrorism attack which took place in Loxor city in Egypt and after Sept. 11,2001 terrorism attack in US, tourists numbers were declined sharply which led to many tourists businesses had to fire workers, so these incidental accidents increase unemployment level
The government works to solve this problem through assisting private sectors enterprises in order to expand their businesses and then create new jobs, at the same time the government established with corporation of international financial institutions in 1991 the Social Fund for Development (SFD) to help small and medium size enterprise and to assist young people to establish their own business and then solving unemployment problem.
These government efforts has positive effect in reducing unemployment level, but the percentage of unemployment is still high, recent statistics referred to unemployment rate 8.5 % in FY 1997/1998 then it was slowdown to 8.2in 98/99, then to 7.9% in 99/2000 and at last FY 2000/2001 it was 7.6%. Table 3.15 illustrates population, labor force employment, and employment and unemployment levels.
Table 3.15 Labor Force and Unemployment Figures in Egypt (Million.person)
End of
June Population Labor
Force Employment Unemployment Labor Force/ Population %
UnemploymentRate
1989 1990 1991 1992 1993 1994 1995 1996 1997 1998 1999 2000 2001
50.5 51.5 52.6 53.7 54.8 55.9 57.1 58.2 59.4 60.7 62.0 63.3 64.6
13.8 14.3 14.7 15.1 15.6 16.0 16.5 16.9 17.4 17.9 18.4 18.9 19.5
12.7 13.0 13.4 13.7 14.0 14.4 14.9 15.3 15.8 16.3 16.9 17.4 18.0
1.1 1.2 1.4 1.4 1.6 1.6 1.6 1.6 1.5 1.5 1.5 1.5 1.5
27.3 27.7 28.1 28.2 28.4 28.6 28.8 29.0. 29.2 29.4 29.6 29.9 30.1
8.1 8.6 9.3 9.2
10.0 9.8 9.6 9.2 8.8 8.5 8.2 7.9 7.6
Source: Ministry of planning, excluding Egyptian working abroad 3.2.2 Fiscal Position
To curb the economic problems which faced Egypt during 1980s, Egyptian government with cooperation with International Monetary Fund (IMF) and other international financial institution has started macroeconomic stabilization program, this program encompasses four points7
1) Establishing the fundamentals for internal and external balance 2) Pursuing nominal anchors to achieve disinflation
7 Howard Handy (1997) “The Egyptian stabilization: An analytical retrospective” IMF, Middle Eastern department, September 1997
86

3) Undertaking structural reform to remove price distortions 4) Undertaking currency reforms to accelerate exchange stabilization
That stabilization program led to outstanding results. Regarding fiscal results, fiscal deficit declined from 15% of GDP before that program to 1.5 % of GDP over four years period. This decline was obtained through both revenue increases, which accounted for 42% of the turnaround in the overall deficit and expenditure reduction. Regarding revenue increase, it was result from applying new exchange rate which led to increase Suez Canal revenue, revenue from oil receipts and from taxes of international trade, in addition the introduction of sales tax in 1991 and its subsequent expansion contributed significantly in increasing revenue on the other side total expenditures reduction amounted to 7.5% of GDP, that cut was distributed between current and investment expenditures, within investment expenditures the share of spending accruing to social services unchanged, allaying concerns that the burden of fiscal adjustment would fall on poorer sections of society, the bulk of the investment cut was in economic sphere as the government cut back in the projects in electricity and tourism sectors
Within current expenditures, which were reduced by 1.2% subsidizes and transfers witnessed a decline of about 2.4% while wages &salaries (including pension payments) saw a modest reduction about0.6% of GDP.
As a result of the debt forgiveness and Paris Club rescheduling agreement of 1991, Egypt’s foreign interest bill was substantially reduced, estimated at 8.4% of GDP (cumulative for the post stabilization period) or 1.4% on average for six-year period. Budget deficit still remain at minimum level, as in FY 1999/2000 it was 1.8% of GDP, unfortunately it was increased in FY 2000/2001 to 4.0% of GDP. Egyptian budget starts from July 1 to June 30 of the coming year it is joined fiscal year.
Budget expenditures include these items, Salaries &wages, current expenditures, and investment expenditures in the other side, budget revenues include tax revenues and non tax revenues. Tax revenues compose of income tax revenue, sales tax, customs duties, stamp duties and other taxes revenues. Non-tax revenues compose of Suez Canal receipts, surplus of central bank of Egypt, surplus of public corporation & surplus of Egyptian petroleum authority and other revenues. Table 3.16 shows budget figures of fiscal years1998/1999- 2000/2001. Table 3.16 Egypt State Budget figures 1998/1999-2000/2001(Million L.E)
During 1998/1999 1999/2000 2000/2001 Total revenue and grants (A+B) A-total revenue Current revenue Tax revenue
Non tax revenue Capital revenue B- Grants Total expenditures and net ending (C+D) C-Total expenditure Current expenditure Capital expenditure D- lending minus repayments
99,718 98,069 95,853 46,543 49,310 2,216 1,649 99,938 92,812 75,271 17,541 7,126
106,623 104,850 103,728 49,621 54,107 1,122 1,773 99,938 92,812 75,271 17,541 7,126
110,189 107,883 106,788 51,456 55,332 1,095 2,306 117,539 113,580 98,600 14,980 3,959
Deficit/surplus (A+B)_ (C+D) -220 - 4,161 -7,350 Privatization proceeds Arrears
917 -1,342
1,980 -4,012
498 -4,173
Total required financing 645 6,193 11,025 Total financing Financing from abroad
-349 -2,001
6,406 -1,487
10,963 -2,961
87

Domestic financing Non-bank8
Bank9
Adjustment to cash/error and omission
1,652 -756 9,213 994
7,893 4,069 3,824 -213
13,924 -5,457 19,381 62
Deficit or surplus /GDP Total revenue and grants/GDP Total expenditure and net lending /GDP
-0.1% 32.9% 33.0%
-1.2% 31.7% 32.9%
-2.1% 30.7% 32.8%
Source: Central bank of Egypt (monthly bulletin news March 2002) 1) Public Borrowing
Before launching stabilization program in 1991, Egyptian government was used to financing budget deficit through monetary financing (which composed of seinorage and inflation tax) that approach led to high inflation rate, which estimated about 21% and to other bad consequences on Egyptian economy. Since 1991 Egyptian government has started to finance budget deficit through borrowing from financial institution, within issuing treasury bills and government bonds (national savings) and the government almost ceases borrowing from abroad, as a result to that fiscal policy for financing budget deficit, the burden of domestic debt is increased annually Table 3.17 shows the figures of public debt during the period. Domestic debt of government and economic authority’s debt
Table 3.17 Domestic Debt of Government and Economic Authority’s Debt
End of June 1996 1997 1998 1999 2000 2001 2002 Government domestic debts 114,098 125,493 136,745 147,155 164,392 194,810 221,165Bonds & bills 83,296 90,065 84,654 77,684 77,689 133,545 165,912Net government balance
with the banking system -13,840 -20,031 -16,793 -9,528 - 2,244 -39,861 -58,533Government borrowing from
NIB 44,642 55,459 68,884 78,999 88,974 101,126 113,786The economic authorities
debt 18159 22,977 23,174 34,916 37,535 41,654 41,141Net balances of economic
authorities with banking system
-8,352 -7,869 -4,471 - 4,471 -3,940 3,313 5,983
Borrowing of economic authorities from NIB10 26,511 30,846 34,567 39,387 41,475 44,967 47,124
Source: Central Bank of Egypt
It is obvious that domestic public debt is growing from year to year, this public debt compose of government debt plus the debt of economic authorities which owned by government such as Egyptian Railways Authority, Housing Authorities and other economic authorities, also interest paid for domestic debt represent a significant figures of budget expenditures in FY 1998/1999 it was LE. (mn) 12199, It increased to LE (mn) 14505in FY 1999/2000 and to LE. (mn) 16763 in FY 2000/2001.
2) Tax Revenue
Tax revenue is the major part of total revenue, it is composed of indirect tax revenue and direct tax revenue, income tax represents the greatest part of direct tax revenue, sales tax, customs 8 Non bank financing is composed of debt, NIB financing from national investment bank, capital transfer and suppliers credit 9 Bank financing deposit money banks and it is always negative, investment in US$ bonds, monetary authority within treasury bills, social insurance funds 10 National investment bank (NIB), it is a governmental authority responsible for enforcement of government investment plan which embodied in the state budget, through financing and controlling this plan, before October 2001 this bank was belong to ministry of planning, but since October 2001, it has belonged to ministry of finance. The sources of fund for NIB come from social insurance funds, post office savings, and others, these funds are used mainly by government to finance investment plan in infrastructure.
88
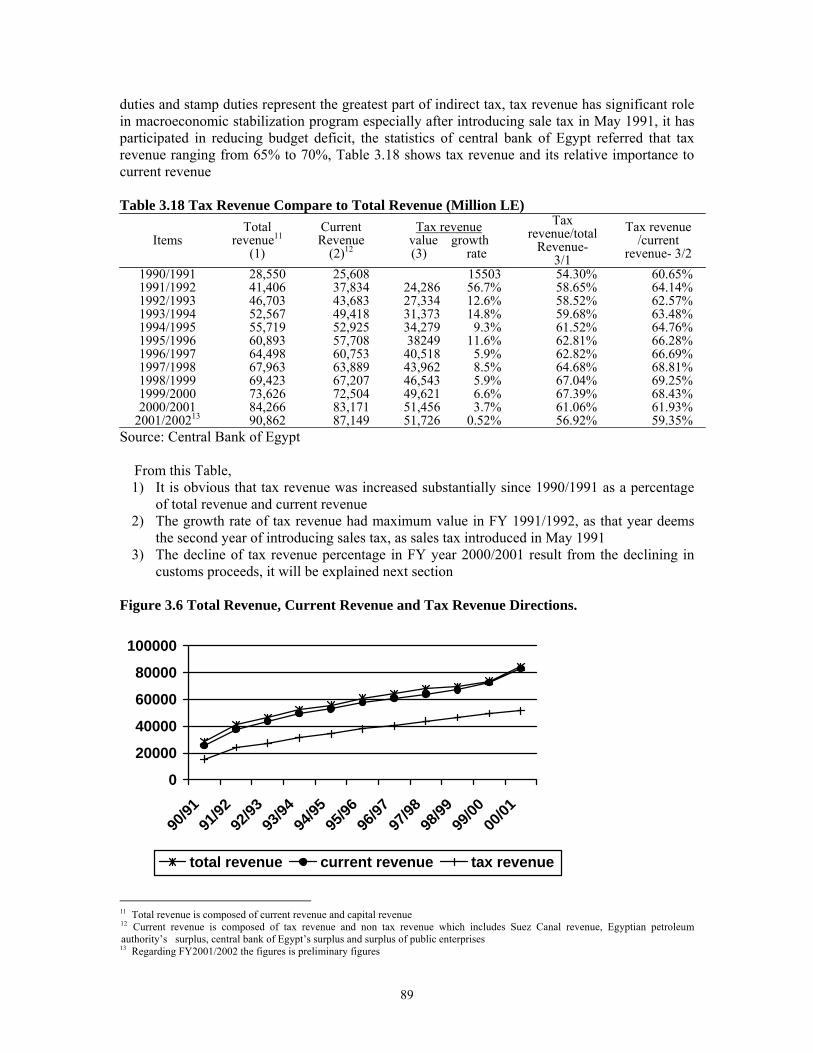
duties and stamp duties represent the greatest part of indirect tax, tax revenue has significant role in macroeconomic stabilization program especially after introducing sale tax in May 1991, it has participated in reducing budget deficit, the statistics of central bank of Egypt referred that tax revenue ranging from 65% to 70%, Table 3.18 shows tax revenue and its relative importance to current revenue Table 3.18 Tax Revenue Compare to Total Revenue (Million LE)
Items Total
revenue11
(1)
Current Revenue
(2)12
Tax revenue value growth (3) rate
Tax revenue/total
Revenue- 3/1
Tax revenue /current
revenue- 3/2 1990/1991 1991/1992 1992/1993 1993/1994 1994/1995 1995/1996 1996/1997 1997/1998 1998/1999 1999/2000 2000/2001
2001/200213
28,550 41,406 46,703 52,567 55,719 60,893 64,498 67,963 69,423 73,626 84,266 90,862
25,608 37,834 43,683 49,418 52,925 57,708 60,753 63,889 67,207 72,504 83,171 87,149
15503 24,286 56.7% 27,334 12.6% 31,373 14.8% 34,279 9.3% 38249 11.6%
40,518 5.9% 43,962 8.5% 46,543 5.9% 49,621 6.6% 51,456 3.7% 51,726 0.52%
54.30% 58.65% 58.52% 59.68% 61.52% 62.81% 62.82% 64.68% 67.04% 67.39% 61.06% 56.92%
60.65% 64.14% 62.57% 63.48% 64.76% 66.28% 66.69% 68.81% 69.25% 68.43% 61.93% 59.35%
Source: Central Bank of Egypt
From this Table, 1) It is obvious that tax revenue was increased substantially since 1990/1991 as a percentage
of total revenue and current revenue 2) The growth rate of tax revenue had maximum value in FY 1991/1992, as that year deems
the second year of introducing sales tax, as sales tax introduced in May 1991 3) The decline of tax revenue percentage in FY year 2000/2001 result from the declining in
customs proceeds, it will be explained next section Figure 3.6 Total Revenue, Current Revenue and Tax Revenue Directions.
0
20000
40000
60000
80000
100000
90/91
91/92
92/93
93/94
94/95
95/96
96/97
97/98
98/99
99/00
00/01
total revenue current revenue tax revenue
11 Total revenue is composed of current revenue and capital revenue 12 Current revenue is composed of tax revenue and non tax revenue which includes Suez Canal revenue, Egyptian petroleum authority’s surplus, central bank of Egypt’s surplus and surplus of public enterprises 13 Regarding FY2001/2002 the figures is preliminary figures
89
3.3 Tax Structure 3.3.1. An overview
Tax structure includes various types of taxes levied in a certain country during a specific period of time, that tax structure is not fixed for ever, but it is always changed to meet socioeconomic changes, there are many factors which affect in any tax structures of any country, these factors are14
1) Historical background which means that if people accustomed to certain type of taxes, so it may be difficult or it takes time to change present tax structure, or to replace tax that constitute tax structure by a new one, so that tax laws amended many times after ratification and after several amendments which took place in along periods governments may be think to introduce new tax regime.
2) Political system has a great effect in tax structure if the country is federalism or central government, different tax issues related to political system and the appropriate tax structure for specific political system
3) Economic system, it has a great effect on tax structure, as tax structure affected by the degree of economic development and the economic system if it is capitalism or socialism or transition economy
In Egypt the first tax law was introduced in 1939 after independence accord from Britain colony in 1936, that permitted Egyptian government to impose taxes, law No 14 of 1939 imposed taxes on business and labor gains, at the same year another tax law was introduced, that law No 113of 1939 of agriculture land tax, then law No 56 of 1954 of building tax.
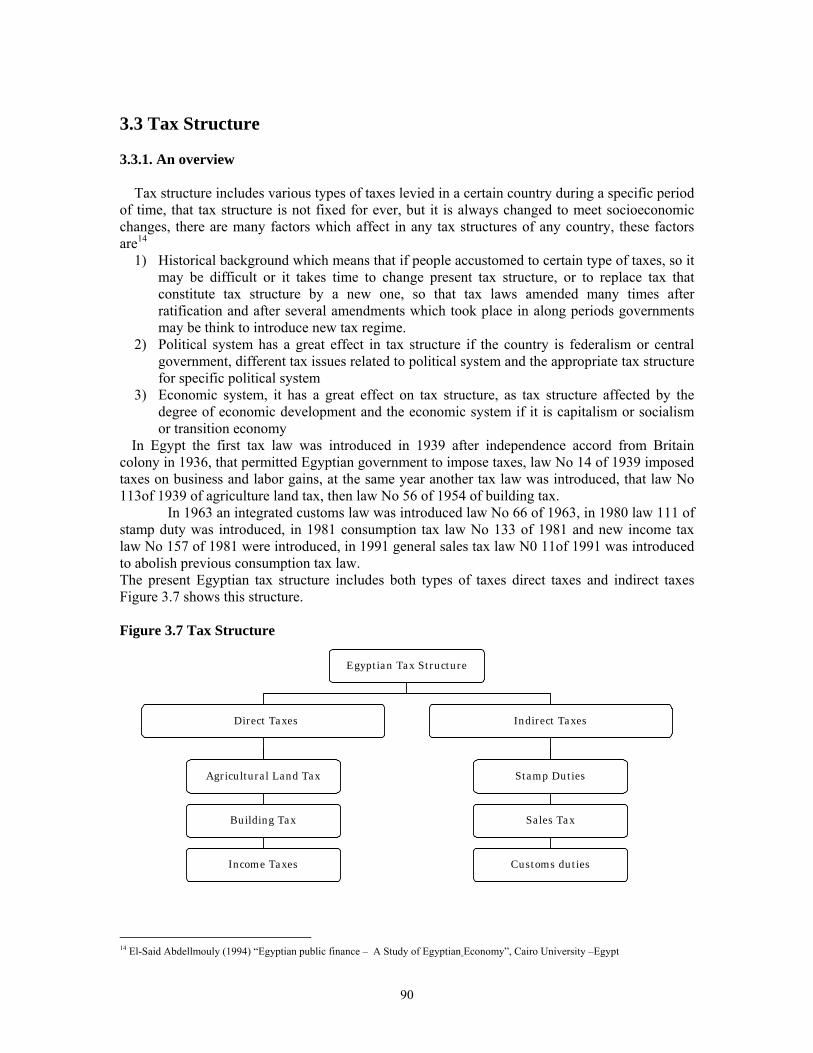
In 1963 an integrated customs law was introduced law No 66 of 1963, in 1980 law 111 of stamp duty was introduced, in 1981 consumption tax law No 133 of 1981 and new income tax law No 157 of 1981 were introduced, in 1991 general sales tax law N0 11of 1991 was introduced to abolish previous consumption tax law. The present Egyptian tax structure includes both types of taxes direct taxes and indirect taxes Figure 3.7 shows this structure. Figure 3.7 Tax Structure
Egyptian Tax Structure
Income Taxes
Agricultural Land Tax
Direct Taxes
Sales Tax Building Tax
Stamp Duties
Customs duties
Indirect Taxes
14 El-Said Abdellmouly (1994) “Egyptian public finance – A Study of Egyptian Economy”, Cairo University –Egypt
90

3.3.2 Enforcement of Tax Laws
Ministry of finance through its independent departments is in charge of enforcement of tax
laws or amendments or drafts of tax laws and submit to the Parliament for ratification, these responsibilities achieved through four independent departments, each department has its own organization structure, and by law These departments are 1) General tax department, this department is in charge of enforcement of income tax law, stamp
duties law and development fees law. 2) Customs department, this department is in charge of enforcement of customs duties law 3) Sales tax department, this department is in charge of enforcement of general sales tax law 4) Real state tax department, this department is in charge of enforcement of agricultural land tax
law and building tax law. Department from 1 to 3 are independent department subject to control of ministry of finance,
as the ministry in charge of formulating tax policy and this department execute this policy, there is no relation among these departments and local governments, but department No 4 (real estate tax department) subject to dual control one from ministry of finance and the other from local governments and almost all employees of this department come from local government 3.3.3 Direct Taxes 1) Income Tax
Income tax has an important role in Egyptian economy in general and in Egyptian fiscal policy especially, income tax proceeds represent a considerable amount to total tax revenue, Table 3.19 shows income tax proceeds (revenue) and its relative importance. Table 3.19 Income Tax Revenues in Proportion to Total Tax Revenue
FY* Total tax revenue Value Growth rate
Income tax revenue Value Growth rate
Income tax / total tax revenue
1990/1991 1991/1992 1992/1993 1993/1994 1994/1995 1995/1996 1996/1997 1997/1998 1998/1999 1999/2000
15,503 24,286 56.7% 27,334 12.6% 31,373 14.8% 34,279 9.3% 38,249 11.6% 40,518 5.9% 43,962 8.5% 46,543 5.9% 49,621 6.6%
6,406 9,996 56.04% 11,114 11.18% 12,003 7.99% 12,134 1.10% 13,707 12.96% 14,589 6.43% 15,306 4.91% 15,547 1.57% 17,982 15.66%
41.32% 41.15% 40.66% 38.25% 35.40% 35.84% 36.01% 34.81% 33.40% 36.23%
Source Central Bank of Egypt (CBE)
This figures includes income tax proceeds during that period after that, classification of tax revenue is changed
It is obvious from that Table that income tax represents a considerable percentage to tax revenue and its increased annually, this increase is not fixed, as it depends on economic changes. 2) Income Tax Law
Present income tax law is law No 157 of 1981 amended by law No 187 of 1993, this law is composed of three volumes, and these volumes are:
1st. Volume unified income tax (individuals’ income tax)
91

2nd Volume corporate income tax 3rd. Volume general rules This part will cover in general individual income tax and corporation income tax according to
law articles Individual Income Tax
Individual income tax is called unified tax; it encompasses 5 kinds of revenues, which they are listed below15
1) Mobile capital revenue 2) Business revenue (profits of commercial and industrial activities) 3) Salaries and wages (labor revenue) 4) Non commercial professional revenue 5) Real wealth revenue Although the individual income tax is called unified tax (which means that individual must
report their annual income from different sources in one tax return), but actually there is exception for this related to revenue from mobile capital revenue and salaries & wages, both revenue are excluded from annual tax return and has special law provisions. Figure 3.8 shows this situation
Figure 3.8 Unified Tax Structure
Unified tax
Revenues excluded from annual Tax return
Revenues included in the annual tax returnTax return
Business revenues Salaries and wages revenues
Non commercial revenues Mobile capital revenue
Real wealth revenues
Mobile Capital Revenue Tax
Scope of Revenue: Mobile capital revenue subject to unified tax under a specific law articles, this revenue result
from invested capital in, treasury bills, interest of debts, returns on loans of all kind which contracted by the government, individuals, and other legal form business, dividends, interest on bank deposits, attendance allowance paid to stock holders, salaries and wages paid in cash and fringe benefits, attendance allowance and other payments to the board of directors members in corporation companies which subject to corporation law or other laws
15 Article 5 of Income Tax Law No. 157 of 1981 amended by Law No 187of 1993
92

Exemption:
In general previous revenues subject to mobile capital revenue tax, but tax legislator to achieve tax equality and to encourage saving and investment exempted these revenue from this tax, various kinds of interests, such as interest of bonds, debts, bank deposits, and dividends of local corporations
Tax Rate
This revenue subject to flat tax rate, this rate is 32% from gross amount paid without any deduction
Tax Collection.
This tax withheld from source, which means that the payer of mobile capital revenues must withheld tax amount from the payee and remit tax to appropriate tax office within 15 days from payment date of that revenue
Salaries and Wages Tax Scope of Tax
Under article 49of law No 157 of 1981 amended by law No 187 of 1993, salaries tax is imposed on.
1) Salaries and other like payments, remunerations, wages, bonuses and annuities (except insurance payments) paid by the government agencies, public enterprises and funds subject to law 54 of 1975 (the law of private insurance funds).
2) Salaries and other like payments, remunerations, wages and bonuses, annuities (with the exception of pensions payments) paid by the companies, establishments, societies, private organizations, educational institutions and individuals to any person residing in Egypt or any person residing abroad for services rendered in Egypt
Taxable Income
Taxable income encompasses all revenues obtained by taxpayer (employee), including salaries, wages, various allowances and fringe benefits. In calculating taxable income, revenue of each part of the year is taken as proportion of annual revenue according to the ratio of period to the year (for example monthly salary is calculated as 1/12 of annual salary) since tax rate must be calculated using annual tax basis, monthly salary first multiplied by 12 to get annual taxable income and then determine annual tax rate, then compute annual tax due and divided this tax due by 12, to get monthly tax due Deduction from Taxable Revenue
There are specific deductions from taxable revenue of salaries tax, these deductions are. Bonuses are tax deductible up to LE.3000 Annually more than that amount subject to tax, Nature of work allowance is tax deductible up to LE. 480 annually more that amount subject to tax and, Representative allowance is tax-deductible upLE.2500 annually more that amount subject to tax. In general these deduction as all must not exceed LE. 4000:
- Social insurance and health insurance premiums - 10 % from net taxable income tax deductible against job expenses.
Other Exemptions
Wages of causal workers are exempted from salaries tax in general if that worker doesn’t work permanently and there is another source of income.
93

Exemption for Family Burden For employees only, tax law gives a special deduction equal LE. 2000 Annum in addition to
family burden deduction which is listed below. LE. 2000 Annum for singles. LE. 2500 Annum for married individuals without dependent. LE.3000 Annum for married individuals with dependents.
Tax rates
Exception from tax rates of unified tax (individual income tax) salaries & wages tax has different tax rates, these tax rates are listed below
20% up to LE. 50000.0 And 32% more than LE. 50000. Annually B-Revenue Included in Annual Tax Return Business revenues (commercial and industrial profits) Scope of Revenue
According to tax law articles, revenues result from activities, which are listed below must be included in annual tax return.
1) Professions: Persons running commercial and trading activities which are based on both labor and capital which are considered self employed
2) Mining & oil establishments, their net profit is subject to unified tax as business revenue 3) Crafts – related professions, all professions which rely upon personal skills and experience
to transform raw material into finished products for example tailors and carpenters. 4) Sole deal, the gains result from sole deal is fully taxable. 5) Brokerage, agency & intermediates 6) Commission and brokerage which is not related to professions 7) Leasing of trading & industrial stores and machines 8) Capital gains, all profits realized from the disposal of capital assets are subject to unified
tax as commercial and industrial revenues 9) Real estate transactions 10) Rental of furnished flats 11) Cultivation and land reclamation establishments. 12) Poultry, cattle breeding and fishing projects
Taxable Revenue
According to law articles, revenues which comprise the tax basis are to be determined with reference to the net profit realized in the preceding year 12 month period, the results of which are used to produce the last financial statements, which means annual basis for determining revenue Total Revenues
Law articles determine that taxable profit is to be calculated as the returns of business transactions or operations after having deducted all related costs. in determining the net profit the principle of accruals is applied ,according to which credit sales during the period are considered revenue , even if they not been collected ,similarly in order to apply the accounting principle of matching revenues with expenses ,expenses are included the accounting period whether or not they have been settled
Deductible Expenses
According to law articles these costs are tax deductible
94

Rent, depreciation of fixed assets, 25% of the cost of new machine (accelerated depreciation), taxes paid by the establishments except unified tax, donation for government without any limits and donation to registered charity association up 7% of net amended profit, allowances up to 5% of amended net profit, incentive & bonuses, social insurance contributions, salaries and wages, tips, commissions, bad debts interest expenses, compensations & fines insurance expense, advertising, miscellaneous and amounts withheld for special funds , These expenses mentioned for instance, if there are other expenses related to business must be tax deductible according to law articles Exemption from Tax
According to law article the following shall be exempted from tax 1) Profits of Bee breeding projects, exemption of profits realized from this activity has not
been restricted nor limited to any tax exemption period 2) Profits of establishments for the reclamation and cultivation of land, such establishments
shall be exempted from taxes for period of ten years, effective from the first fiscal year after the date on which the land is considered productive.
3) Profits of special insurance funds are set up according to the law 54 of 1975 (law of special insurance funds)
4) Profits of poultry breeding projects, and of fishing boats & trawlers shall be exempted from tax for a period of 10 years beginning on the date such activities are initiated
5) Profits of new projects which financed by social fund for development shall be exempted from tax for a period 5 consecutive years after the project is initiated, if these are financed wholly or partially from that fund
Non-Commercial Business Revenues (Free Professions Revenues)
Second type of revenue which must be included in annual unified tax return is non-commercial business revenue
Scope of Revenue
According to tax law articles, tax shall be applied to net income realized from the free professions and other non-commercial professions practiced by taxpayers independently and in which basic component of the net income is realized from exercising the profession or activity in Egypt.
The tax shall be applied also to the net income realized from practicing the profession abroad, if the business headquarter of the taxpayer is located in Egypt Taxable Revenue
Taxable revenue is computed as the difference among total revenues and related expenses
Revenue Revenues must be entered in the annual tax basis for the preceding year using the cash basis
method to account for those revenues
Expenses Deductible costs according to the law, law articles stipulated that the net income is determined
after deducting all costs necessary for practicing the profession, such as registration fees, subscription in syndicates and professional societies, as well as direct taxes, and other costs related to profession, the same tax period, and supported by documents.
95

Other Deductions After getting net income there are additional deduction are determined by law, these deductions
are 1. 15% for professional use 2. Payments to associations or syndicates to finance pension related system, providing that
the deductions thus made up to 10% of the net income. 3. Life and health insurance premiums benefiting the taxpayer, spouse and independents up
to 15% of net income or LE 1000 whichever is less 4. Donation paid to the government and / or related agencies deductible in full, other
donations up to 7% of net income Exemption from Tax
According to law articles these establishments are exempted from tax 1) Agricultural establishments with specific exceptions, 2) Non-profit organizations, within the limits of their social, scientific or sporting activities. 3) Free professional who are registered members in professional syndicates in the field of
their specialization, for a period of 3 years after the date they begin to exercise their free profession, they must settle the tax on the first month following the end of this three year period.
4) Writers and translators of books and religious, scientific, cultural, literary articles, profits from these activities are exempt, but not profit realized from the sale of books or translations produced in audio or visual form.
5) Profits of teaching staff members in universities, institutes and other academic institutions, earned from their books and literary works according to the university rules
Real Wealth Revenues Scope of Revenue
Three types of revenues belong to real wealth must be included in annual unified tax return, these revenues are
1. Revenues of agricultural lands 2. Revenue of productive fruits gardens 3. Revenues of built realties
Taxable Revenue For computing taxable revenue, there are two methods, the first one is estimated method and
the second on is based on proper accounting books, Estimated methods based on rental value which its computation depends on property tax and it is used according to this formula
1. Revenue of agricultural land (rental value) = property tax x 100/ tax rate. 2. Revenue of productive fruits there are two separate cases
When the land is leased Taxable Revenue = Rental Value x 80%. Where the land is owned Taxable Revenue = Rental Value x 2 x 80%.
3. Revenue of built realties Rental Value = Property Tax x 100/Tax Rate Taxable Revenue = Rental Value x 80%
Tax exemption 1-Tax is applied on revenues from productive fruit gardens only if the cultivable area exceeds
three fatten. 2- For ornamental medicinal and aromatic plants, tax is applied if the cultivable area exceeds
one faddan.
96

3- For horticultural nurseries not established for the owners’ personal use, the tax is applied regardless of the cultivable area General Rules for Unified Tax (Individual Income Tax) Tax Exemption for family burden
Arise according to the social status of taxpayer, it is not applied where the law specifies a fixed tax rate and according to law articles the annual exemption are LE. 2000. O for single taxpayer LE. 2500.0 For married taxpayers without dependents And LE. 3000.0 For married taxpayers with one or more independents Tax rates
Unified tax rates are progressive, according to law articles these rates are applied on those revenues which embodied in annual tax return; Table 3. 20 shows tax rates Table 3.20 Unified Tax Rates
No Income brackets Tax rates 1- 2- 3- 4-
From 0 to LE. 2500.0 From LE. 2500 to LE. 7000.0 From LE. 7000 to LE. 16000.0
More than LE.16000.0
20% 27% 35% 40%
Annual Tax Return
1) Those obliged to file tax return, any taxpayer who obtains revenues from commercial activities, the pursuit of a non-commercial profession, or from real estate wealth as one of the following 1-owner of sole proprietorship or 2-partner or silent partner
2) Date of filing tax return, the taxpayer must file their annual tax return of the previous year within the period starts from January 1, to March 31, Non filer taxpayers and filers after the due date pay penalty equal to 20% of his final tax due, this penalty reduced to half if the taxpayer agrees with tax office on tax due (internal settlement)
3) Tax assessment, it is obvious that Egyptian tax system based on self assessment which means that each taxpayer computes taxable income and pay tax due according to that computation and tax authority has the right to correct or amend or estimate tax due if it has additional information (which means the burden of prove is rely on tax authority)
Corporate Income Tax Scope of Tax
1) According to law articles this tax levied on these enterprises Joint stock companies, limited liabilities companies and partnership with limited shares companies which subject to corporation tax law No 159 of 1981
2) Public banks and public corporations 3) Foreign banks, offshore banks, foreign corporations and subsidiaries 4) Public economic authorities and other juridical persons which involved in profitable
activities, except national services agency which belong to ministry of defense Taxable Income
It is computed to accrual accounting principle, and it is based on annual basis. 1) Revenue, It includes all revenue accrued during accounting period, and that revenue
includes business revenue, capital gains and sundry revenue.
97

2) Expenses, Tax deductible costs includes all expenses incurred during the accounting period according to accrual basis, and law provision determines for instances theses expenses, rent, Depreciation of fixed assets, 25% new equipments as additional depreciation, social insurance premium, salaries and wages and other expenses
These expenses to be tax deductible it must be related to taxable period, it is foreseeable it is necessary to realize profits, and it is not overstated. Corporation Tax Rates.
The general tax rate is 40%, however exception to rate as 32% rate is imposed on profits of industrial companies and on profits derived from exports operations,
Oil prospecting and production companies subject to tax rate 40.55%. Development duty rate 2% is imposed on annual taxable profits exceeds of LE.18000.0 Mobile capital tax is imposed on the revenue of corporation derived from mobile capital in tax
rate equal 32% Filing Return
Companies must file their annual tax return together with all supporting schedules and original financial statements within 30 days of the approval of their financial statements by the general assembly of stockholders, the general assembly must be held within 3 months of the end of financial period.
Offshore banks and foreign subsidiaries must file annual tax return after 3 months of the end of financial period
Non filer companies and filers after due date will paid additional tax (penalty) equal to20% of final tax assessment, this penalty will be reduced to the half if that company reached to an agreement with tax office about tax amount Tax Exemption and Tax Relief 1) Tax exemption, tax law provisions gives tax holiday for 5 years for new established industrial
corporation which employed at least 50 workers and has proper and accurate accounting books, on the other side corporations which established according to investment law be given tax holiday period, this period ranging from 5 to 20 depending on the location of corporation’s headquarter
2) Tax relief for corporation is subject to certain circumstances, such as corporations which registered in Egyptian stock market will get tax relief equal to interest rate which can get from bank deposit of its capital if it is deposited in bank account, for example if one company has capital equal to LE.1000000, and it is registered in stock market and its taxable income for certain year LE.200000.0 and interest rate for bank deposit is 10% for that taxable year, then that company will get Tax Relief = 1000000.0x10%= LE.100000.0 Tax amount will be= (200000-100000) x tax rate, this tax relief virtually reduced the nominal tax rate and some computation indicate that effective tax rate for corporation in Egypt is 25%, also there other tax relief which alleviate corporation tax burden.
3) Property Taxes
There are two kinds of property taxes the first one is agricultural land tax and buildings tax, those taxes are enforced by department of real state tax, and the tax proceeds of that tax is too small in comparison to income tax or sales tax proceeds, so that there is no separate statistics of the proceeds of that tax, and its proceeds is added to other tax revenue, the discussion below will give a brief idea about that tax
98
Agricultural Land Tax Scope of Tax
This tax levied on all agricultural land virtually or other land which can be planted irrespective of method of irrigation or watering of that land.
Tax Basis
Tax basis is determined according to the rental value of that land; this rental value is estimated by tax authority every 10 years
Landlords bear the tax due and they must pay estimated tax amount annually to tax authority.
Tax Rate Tax rate of that tax is 14% of land rental value
Building Tax Scope of Tax
This tax levied on the income derived from immovable properties (buildings) established on the ground or underground, irrespective that buildings are inhabited or not and if there is a compensation for inhabiting or not. This tax levied on a certain town according to attached tables, which means that tax not encompass all cities and villages, also government buildings and public enterprises buildings are exempted from this tax Tax Basis
Tax basis is determined according to the rental value of that land; this rental value is estimated by tax authority every 10 years Landlords bear the tax due and they must pay estimated tax amount annually to tax authority. Tax Rate
This tax has progressive tax rate it is started from 10% to 40% 3.3.4 Indirect Taxes
There are three indirect taxes applied in Egypt, these taxes are sales tax, stamp duties and customs duties, they will be discussed below. 1) Sales Tax
Sales tax was introduced in 1991 by law No 11 of 1991, it was introduced as apart of macroeconomic stabilization program which it has been started in that year, and this tax was substituted for consumption tax, previously imposed by law No133 of 1981
Since it introduced in 1991, it has played outstanding role in increasing tax revenue and as a result reducing budget revenue, that outstanding role appears in Table 3.21 which shows sales tax revenue, sales tax revenue, its growth rate and the percentage of tax revenue from total tax revenue
99
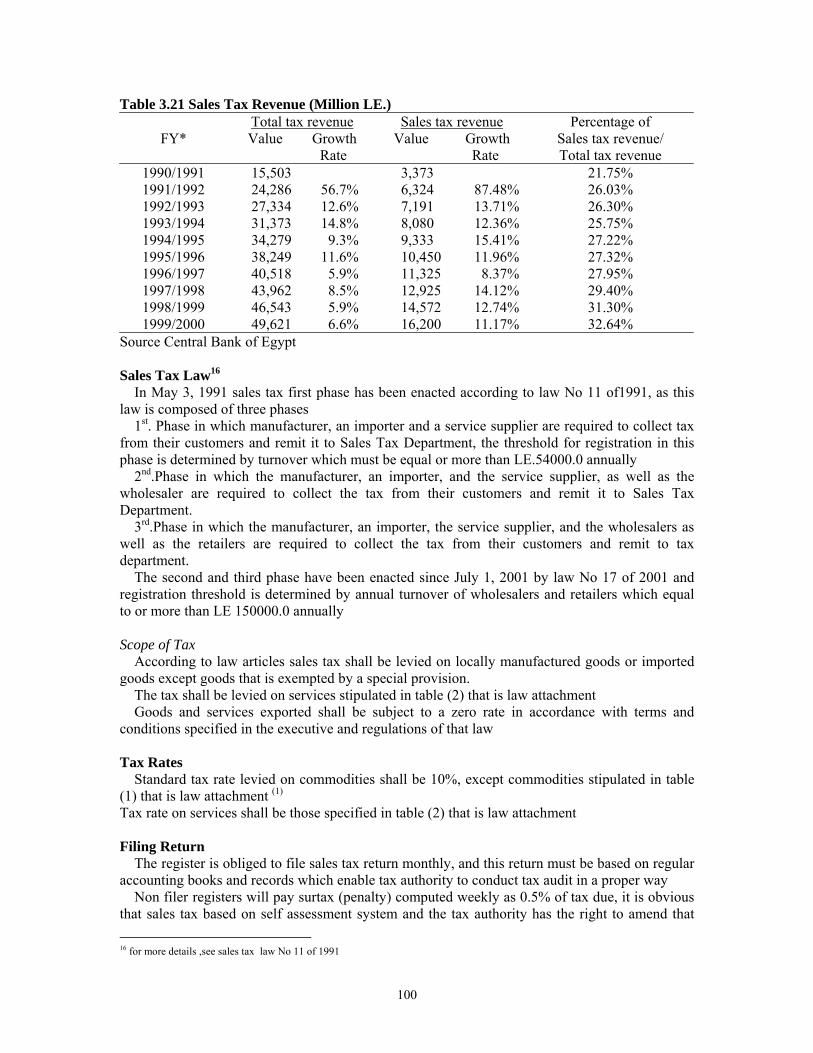
Table 3.21 Sales Tax Revenue (Million LE.)
FY* Total tax revenue Value Growth
Rate
Sales tax revenue Value Growth
Rate
Percentage of Sales tax revenue/ Total tax revenue
1990/1991 1991/1992 1992/1993 1993/1994 1994/1995 1995/1996 1996/1997 1997/1998 1998/1999 1999/2000
15,503 24,286 56.7% 27,334 12.6% 31,373 14.8% 34,279 9.3% 38,249 11.6% 40,518 5.9% 43,962 8.5% 46,543 5.9% 49,621 6.6%
3,373 6,324 87.48%7,191 13.71%8,080 12.36%9,333 15.41%10,450 11.96%11,325 8.37%12,925 14.12%14,572 12.74%16,200 11.17%
21.75% 26.03% 26.30% 25.75% 27.22% 27.32% 27.95% 29.40% 31.30% 32.64%
Source Central Bank of Egypt Sales Tax Law16
In May 3, 1991 sales tax first phase has been enacted according to law No 11 of1991, as this law is composed of three phases
1st. Phase in which manufacturer, an importer and a service supplier are required to collect tax from their customers and remit it to Sales Tax Department, the threshold for registration in this phase is determined by turnover which must be equal or more than LE.54000.0 annually
2nd.Phase in which the manufacturer, an importer, and the service supplier, as well as the wholesaler are required to collect the tax from their customers and remit it to Sales Tax Department.
3rd.Phase in which the manufacturer, an importer, the service supplier, and the wholesalers as well as the retailers are required to collect the tax from their customers and remit to tax department.
The second and third phase have been enacted since July 1, 2001 by law No 17 of 2001 and registration threshold is determined by annual turnover of wholesalers and retailers which equal to or more than LE 150000.0 annually Scope of Tax
According to law articles sales tax shall be levied on locally manufactured goods or imported goods except goods that is exempted by a special provision.
The tax shall be levied on services stipulated in table (2) that is law attachment Goods and services exported shall be subject to a zero rate in accordance with terms and
conditions specified in the executive and regulations of that law Tax Rates
Standard tax rate levied on commodities shall be 10%, except commodities stipulated in table (1) that is law attachment (1)
Tax rate on services shall be those specified in table (2) that is law attachment
Filing Return
The register is obliged to file sales tax return monthly, and this return must be based on regular accounting books and records which enable tax authority to conduct tax audit in a proper way
Non filer registers will pay surtax (penalty) computed weekly as 0.5% of tax due, it is obvious that sales tax based on self assessment system and the tax authority has the right to amend that 16 for more details ,see sales tax law No 11 of 1991
100

return or correct or ignore at all and estimated tax liability of any register if it has more information than provided in register’s return which it means that burden of proof is relied on tax authority Tax Exemptions
According to law articles there are many exemption forms to serve many purposes. 1) Social purposes (foods and medicine are tax exempt) the details of goods which
exempted for social purposes are mentioned in table (1) of law’s attachments 2) National security purposes, that all taxable commodities, equipments and services
necessary for armament purposes for defense and national security, as well as raw materials, production prerequisites and components thereof shall be exempted
3) Political purposes, such as the purchase and imports of foreign embassies in Egypt. 4) In addition to that, the ministry of finance has the right to exempt some goods, as
stipulated in the law articles, it is said that “the minister may, by a decree, and in agreement with the competent minister, exempt certain goods in each of the following. -Gifts, donations and presents to the state administration or municipalities -Imports of scientific, educational and cultural purposes by scientific research institutes
2) Customs Duties This tax has an important role in international trade and government fiscal policy, in the recent
year’s customs proceeds has declined to some extent as a result of trade liberation policy and joining many mutual trade agreements with other foreign countries
Table 3.22 shows customs proceeds in comparison to total tax revenue and its growth rate. Table 3.22 Customs Revenue (Million L.E.)
FY Total tax revenue Value Growth
Rate
Customs revenue Value Growth
Rate
Customs revenue/ Total tax revenue
1990/1991 1991/1992 1992/1993 1993/1994 1994/1995 1995/1996 1996/1997 1997/1998 1998/1999 1999/2000 2000/2001 2001/2002
15,503 24,286 56.70% 27,334 12.60% 31,373 14.80% 34,279 9.30% 38,249 11.60% 40,518 5.90% 43,962 8.50% 46,543 5.90% 49,621 6.60% 51,459 3.70% 51,726 0.52%
3,267 4,588 40.43% 5,009 9.17% 6,120 22,18% 7,017 14.65% 7,911 12.74% 8,125 2.95% 8,886 9.36% 11,048 24.33% 9,691 _12.28% 9,281 _ 4.23% 9,323 0.45%
21.07% 18.89% 18.32% 19.50% 20.47% 20.86% 20.05% 20.21% 23.74% 19.53% 18.03% 18.02%
Source central bank of Egypt
Customs Law The present custom law is law No 66 of 1963; many amendments had been done on the
original law to cope with economic changes and free trade agreements between Egypt and other foreign countries Scope of Customs Duties
In general exported goods don’t liable to customs duty, but there are many exceptions to certain goods, which subject to export tax, such as raw peltry, iron, copper, nickel, aluminum and zinc.
101

In the other hand imports subject to customs duty according to customs tariff, this customs tariff was issued in 1986, and later many amendments had been done in that tariff to cope with economic changes and bilateral trade agreements, now the maximum customs tariff rate is 40%, there are exception to a few commodities which is more than 40%, such as automobiles, wines, and etc Customs Exemption
There are many exemption which 17 mentioned in customs law No 66 of 1963 to achieve socioeconomic objectives, in addition to that exemption there are other exemption mentioned in law No 8 of 1997 (law of investment grantees and incentives)(1)
This exemption in investment law is aimed to attract foreign direct investment and domestic investment to accelerate economic development
3) Stamp Duties
Stamp duties is levied by law No 11 of 1980, it plays a substantial role in tax revenue and its proceeds grows annually, Table 3.23 shows stamp duty revenue, its percentage from total tax revenue, and its growth rate Table 3.23 Stamp duty revenues from 1990/1991 to 1999/2000(Million LE)
FY Total tax revenue Value Growth Rate
Stamp duty revenue Value Growth Rate
Stamp duty Revenue/total Tax revenue
1990/1991 1991/1992 1992/1993 1993/1994 1994/1995 1995/1996 1996/1997 1997/1998 1998/1999 1999/2000
15,503 24,286 56.7% 27,334 12.6% 31,373 14.8% 34,279 9.3% 38,249 11.6% 40,518 5.9% 43,962 8.5% 46,543 5.9% 49,621 6.6%
1,315 1,839 39.84% 2,067 12.39% 2,657 28.54% 2,874 8.16% 3,074 6.95% 3,168 3.05% 3,215 1.48% 3,342 3.95% 3,445 3.08%
8.48% 7.57% 7.56% 8.46% 8.38% 8.03% 7.81% 7.31% 7.18% 6.94%
Source: Central Bank of Egypt Law No 11 of 1980
This law consists of two chapters, the first one is specified for stamp duties general rules, such as imposing stamp duties, types of duties and due date of that duties, duty assessment and tax protest, tax payments and tax collection, tax audit, tax exemption, and penalties Second chapter is specified for different types of tax basis that subject to stamp duties, this section will cover a brief idea about stamp duty
Scope of Stamp Duties
Stamp duties are levied on many documents, contracts and transactions. 1) Documents, many documents subject to stamp duties such as certificates & reporting,
judicial documents, commercial AD., licenses, electricity, telephone and water bills, commercial invoices, and etc.
2) Contracts, all kinds of contracts subject to stamp duties
1 For more details about customs exemption, see law No 66of 1963 and law No 8 of 1997 law of investment guarantees and incentives chi. 1, section 2 and ch.2
102

3) Transactions, many transactions subject to stamp duties such as banking transaction (banking loans, deposits, accounts, and documents), insurances premium, transportation services, lottery, company registrations and etc.
Stamp Duties Rates 18
There are two types of stamp duties rate, the first one is fixed amount imposed on documents and this case includes all documents and contracts according to specified tables which attached with the law.
Second types is proportion rate and almost all transactions subject to this rate which imply that stamp duty is computed as a percentage of transaction amount, such as banking loans, insurance premium, commercial Ad which published in newspaper or broadcast in TV, Government payments and so on 3.4 Country Specific Fiscal Issue
Egypt had achieved outstanding economic gains as result of macroeconomic stabilization
program which has been started in 1991, in spite of substantial success of that program, Egypt in the late of 1990s and till now faces many fiscal issues which may influence negatively at the stability of Egyptian economy, and these issues will be summarized in these points
3.4.1 Growth of Government Expenditure
Growth rate of government expenditure is greater than growth rate of government revenue, this
case led to increase of budget deficit in recent year’s comparison with previous years, as the percentage of budget deficit in FY 98/99 was 0.1% of GDP, and it was increased to 1.2% in FY 99/2000 and to 2.1% of FY 2000/2001.it is necessary to increase government expenditures especially for social purposes such as educations and health care, in addition to finance infrastructure projects which will encourage private investment and then accelerate economic developments, but at the same time this increase must be financed within real revenues ,but in reality the government had to issue treasury bills and bonds , and as a result to this policy ,public debt is increased ,it is amounted to 64% of GDP end of 2000/2001 ,within total foreign debt amounted to about 26% of GDP and domestic public debt amounted to 38%of GDP.
3.4.2 Domestic Debt
Government relies mainly in domestic public debt to finance budget deficit (borrow from banking) and this led to the amount of domestic public debt increased considerably from LE. 194810 (million) in FY 2000/2001to LE.221165 (million) in FY 2001/2002 which means that its growth rate is 13.5% annually, this led to that debt interest payments represent a big portion of government expenditures for instance it is estimated for current FY 2002/2003 LE 38.2 (billion) from total government expenditure LE 141.6 (billion) which means it is about 26.9% of government expenditure
3.4.3 Tax Revenue and Tax Policy
Tax revenue was declined as apart from total revenue as it was 69.25 % in FY 98/99 decline to 68.43% in FY 99/2000 then to 61.93 % in FY 2000/2001, and this result of inefficient tax administration which must be modernized and restructured to cope with economic changes. At the same time tax policy has to be changed to set up proper tax structure, as present tax policy is 18 for more details see law 111 of 1980
103

based mainly on tax incentives to encourage investment, these tax incentives rely on tax holidays as a unique incentive, these tax holidays give businesses tax exemption from income tax for certain period of time (from 5 years to 20 years according to the location of businesses), so many rent seekers establish their businesses for certain period (depend on the tax holiday) and later they liquidate this businesses ,and other harmful tax practices related to tax holidays , so that it is necessary to rationalize tax holidays as a tax incentives technique ,since it result in distortion of tax
Revenue and inefficient tax system, government must find a suitable environment to encourage investment instead of relying only on tax incentives 3.4.4 Restructuring of State Budget
State budget must be restructured in order to get clear vision of real budget deficit and, to make government expenditure more efficient. At the same time restructuring of budget must encounter economic authorities, so that government must separate this economic authorities from state budget and these authorities must be restructured in order to be managed according to market economy, as subsidizing these economic authority represent a considerable amount of current expenditures, in addition to that, the relation between these authorities and national investment bank and between national investment bank and budget sector must be clear and determined as there are interrelated relation between these sectors which led to efficiency of government expenditure 3.5 Conclusion: Where We Stand, and Where We Go?
It is obvious that economic reform program which has been adopted since 1991, it has been given an outstanding results to Egyptian economy which summarized in these points
1) Budget deficit was declined sharply as from 15 % of GDP before 1991 to 2.2 in FY 2000/2001.
2) Inflation rate was declined from about 20% in FY 89/90 to be 2.7% in FY 2001/2002. 3) Balance of payments deficit was declined sharply; foreign debt was decline to
US$ 28659.6 million in FY 2001/2002. 4) Other economic indicators were improved substantially including growth rate,
unemployment ratio, financial system has been strengthened, external viability was improved, stock markets have been emerged.
But in the late of 1990s until now Egyptian economy suffers from many issues these issues result from internal and external, factors and they affected negatively in the performance of Egyptian economy as all, so that economic growth was slow down in recent years and economic developments, so following points describe the difficulties which face Egyptian economy:
1) Real GDP growth Rate, it was declined from 6.1% in FY 1998/1999 to be 4.9% in FY 2000/2001 and it is expected to decline more in FY 2001/2002, then the key challenge in the period a head is to restore strong economic growth and robust job creation while maintain macroeconomic stability.
2) Exchange rate system was stable for along period of time from 1991 until 1999, and it is considered nominal anchor for macroeconomic stabilization program and this led to many significant results, but since year 2000 exchange rate system witnessed many fluctuations and central bank of Egypt has interfered many times to maintain stability for exchange system and, this intervention led to erosion of official reserve of foreign currencies, it is declined from US$ 20118 million in June 1998 to US$ 14083 million in Dec.2001 , on the other hand Egyptian currency has witnessed many depreciations
104
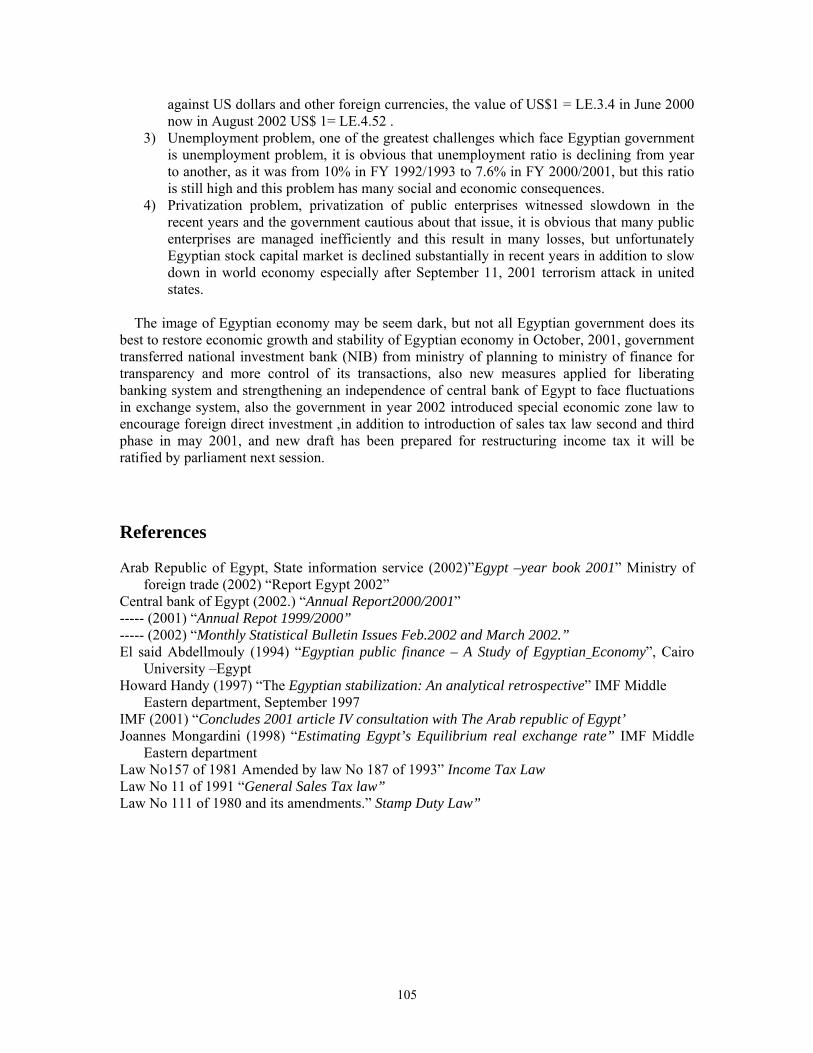
against US dollars and other foreign currencies, the value of US$1 = LE.3.4 in June 2000 now in August 2002 US$ 1= LE.4.52 .
3) Unemployment problem, one of the greatest challenges which face Egyptian government is unemployment problem, it is obvious that unemployment ratio is declining from year to another, as it was from 10% in FY 1992/1993 to 7.6% in FY 2000/2001, but this ratio is still high and this problem has many social and economic consequences.
4) Privatization problem, privatization of public enterprises witnessed slowdown in the recent years and the government cautious about that issue, it is obvious that many public enterprises are managed inefficiently and this result in many losses, but unfortunately Egyptian stock capital market is declined substantially in recent years in addition to slow down in world economy especially after September 11, 2001 terrorism attack in united states.
The image of Egyptian economy may be seem dark, but not all Egyptian government does its
best to restore economic growth and stability of Egyptian economy in October, 2001, government transferred national investment bank (NIB) from ministry of planning to ministry of finance for transparency and more control of its transactions, also new measures applied for liberating banking system and strengthening an independence of central bank of Egypt to face fluctuations in exchange system, also the government in year 2002 introduced special economic zone law to encourage foreign direct investment ,in addition to introduction of sales tax law second and third phase in may 2001, and new draft has been prepared for restructuring income tax it will be ratified by parliament next session. References Arab Republic of Egypt, State information service (2002)”Egypt –year book 2001” Ministry of
foreign trade (2002) “Report Egypt 2002” Central bank of Egypt (2002.) “Annual Report2000/2001” ----- (2001) “Annual Repot 1999/2000” ----- (2002) “Monthly Statistical Bulletin Issues Feb.2002 and March 2002.” El said Abdellmouly (1994) “Egyptian public finance – A Study of Egyptian Economy”, Cairo
University –Egypt Howard Handy (1997) “The Egyptian stabilization: An analytical retrospective” IMF Middle
Eastern department, September 1997 IMF (2001) “Concludes 2001 article IV consultation with The Arab republic of Egypt’ Joannes Mongardini (1998) “Estimating Egypt’s Equilibrium real exchange rate” IMF Middle
Eastern department Law No157 of 1981 Amended by law No 187 of 1993” Income Tax Law Law No 11 of 1991 “General Sales Tax law” Law No 111 of 1980 and its amendments.” Stamp Duty Law”
105