Embed Size (px)
Citation preview
Session 3: The World of Big Data from the Evolving Digital WorldLaura Jenkins Jirele, Jeff Kirsch, Tom Jirele
PMSA Virtual University
• PMSA Virtual University is conducting this four‐part webinar series focused on the introduction and understanding of the current and evolving data resources available in the Life Sciences industry.
• Each session in this webinar series is designed to build on the prior session to both expand and explore the evolving data available to the Pharmaceutical industry:
– Session 1: Learn about core pharmaceutical datasets ‐ retail and non‐retail.– Session 2: Dig deeper into analytics with APLD, EMR, and Specialty data. – Session 3: The world of big data coming from the evolving digital world.– Session 4: Understanding data behind the complex new world of healthcare involving IDNs and
ACOs.
• With a solid foundation of data resources, PVU’s goal is to establish a venue for discussion and collaboration on best practices in analytics, marketing, and sales operations.
3
Agen
da• Big Data• Pharma’s View – The Media Data Landscape• The Online Data World• Data Linkage and Analytics• Q&A
Goal: Right Data + Right Analytics + Right Answer
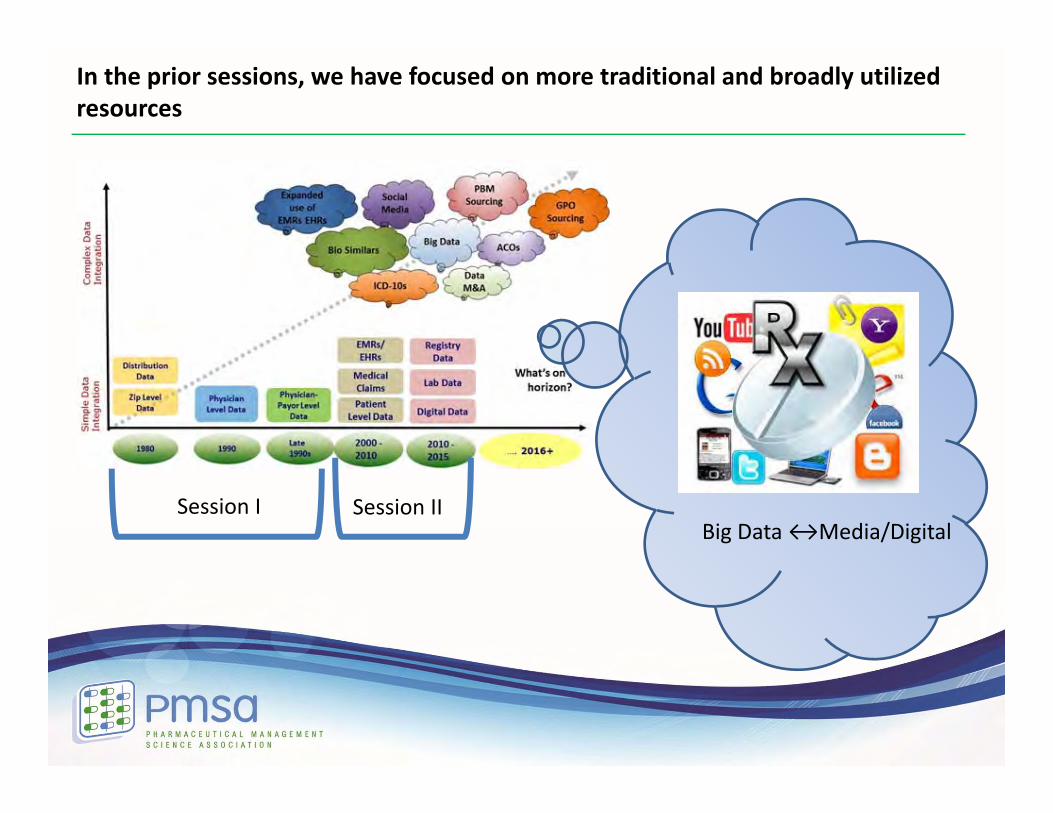
In the prior sessions, we have focused on more traditional and broadly utilized resources
Session I Session IIBig Data ↔Media/Digital
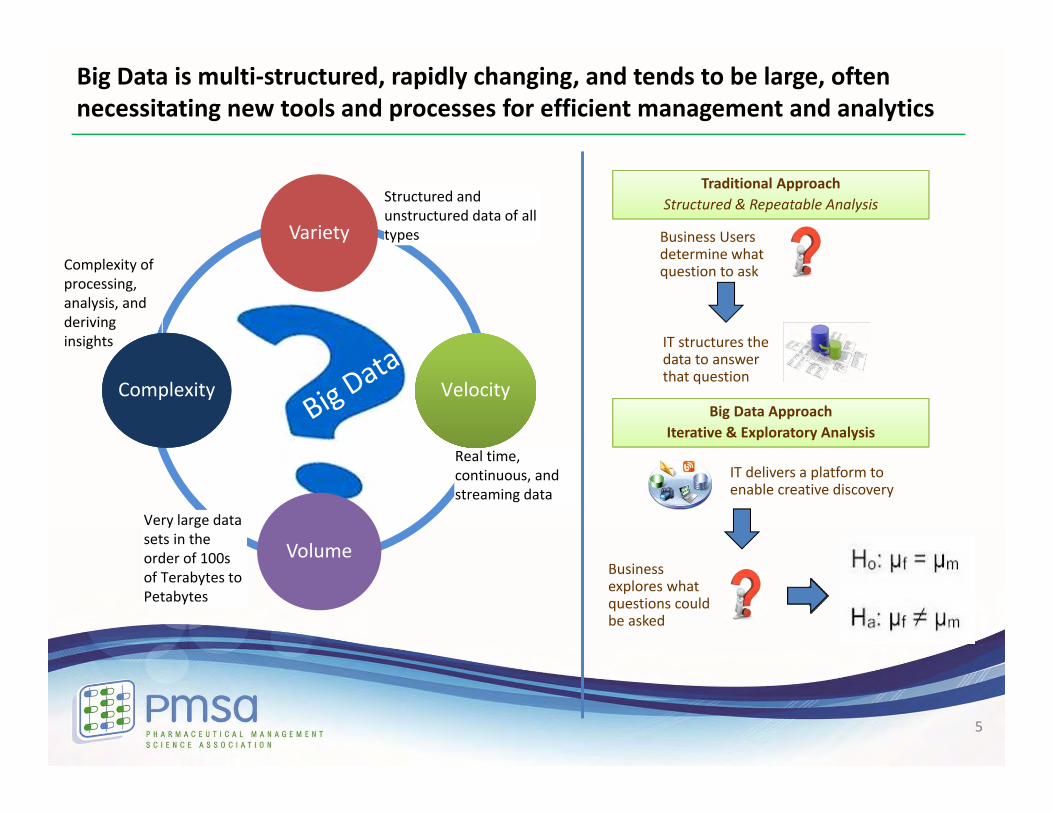
Big Data is multi‐structured, rapidly changing, and tends to be large, often necessitating new tools and processes for efficient management and analytics
5
Complexity of processing, analysis, and deriving insights
Structured and unstructured data of all types
Very large data sets in the order of 100s of Terabytes to Petabytes
Real time, continuous, and streaming data
Variety
VelocityVelocity
Volume
ComplexityComplexity
Business Usersdetermine what question to ask
Traditional ApproachStructured & Repeatable Analysis
IT structures the data to answer that question
Big Data ApproachIterative & Exploratory Analysis
IT delivers a platform to enable creative discovery
Business explores what questions could be asked
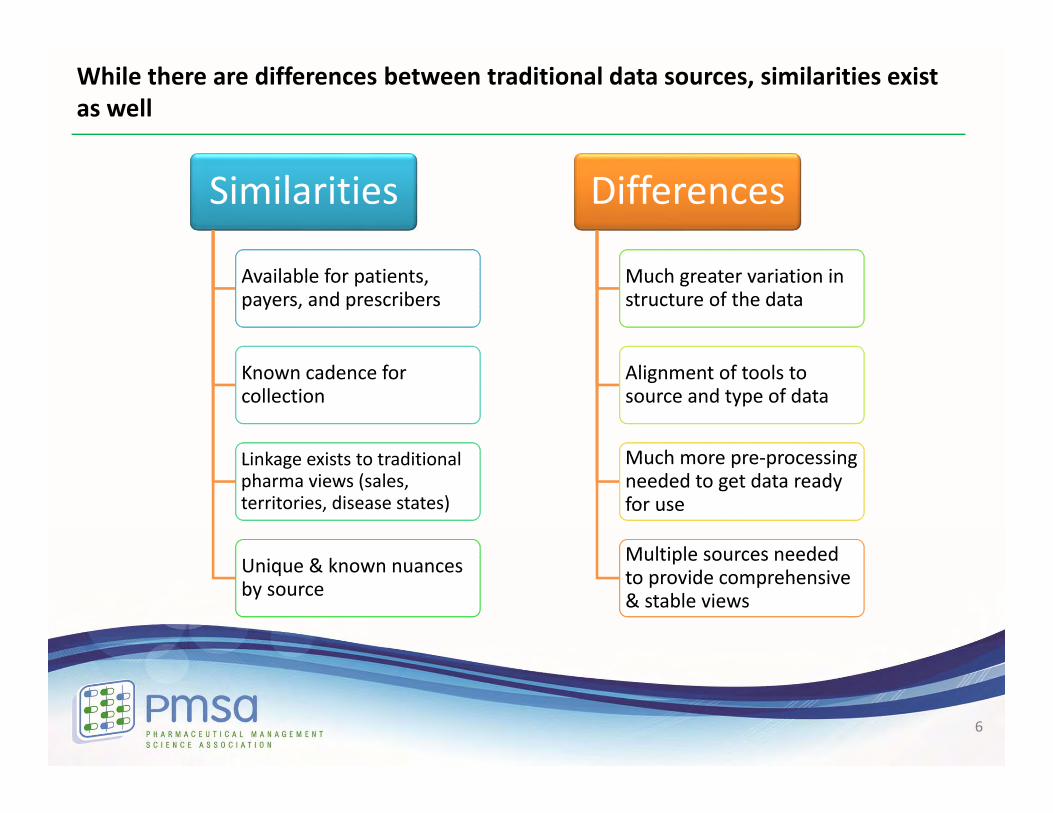
While there are differences between traditional data sources, similarities exist as well
6
Similarities
Available for patients, payers, and prescribersAvailable for patients, payers, and prescribers
Known cadence for collectionKnown cadence for collection
Linkage exists to traditional pharma views (sales, territories, disease states)
Linkage exists to traditional pharma views (sales, territories, disease states)
Unique & known nuances by sourceUnique & known nuances by source
Differences
Much greater variation in structure of the dataMuch greater variation in structure of the data
Alignment of tools to source and type of dataAlignment of tools to source and type of data
Much more pre‐processing needed to get data ready for use
Much more pre‐processing needed to get data ready for use
Multiple sources needed to provide comprehensive & stable views
Multiple sources needed to provide comprehensive & stable views
Pharma’s ViewThe Media Landscape
Brave New Worlds
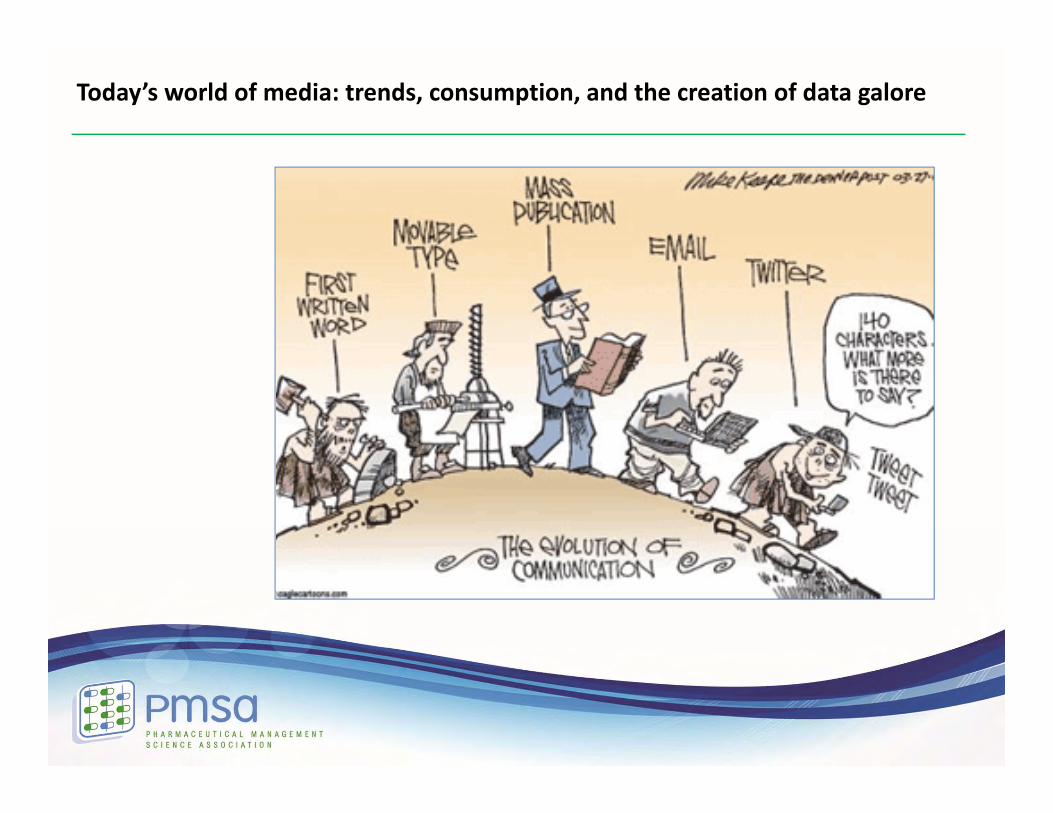
Today’s world of media: trends, consumption, and the creation of data galore
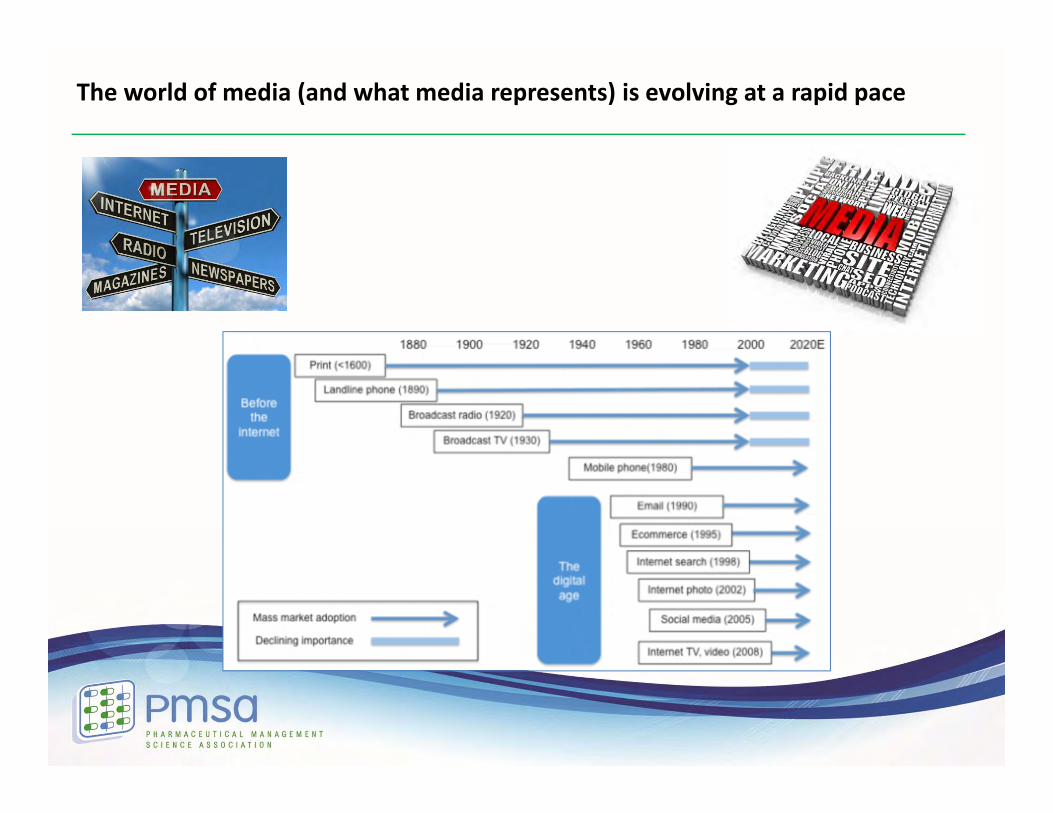
The world of media (and what media represents) is evolving at a rapid pace
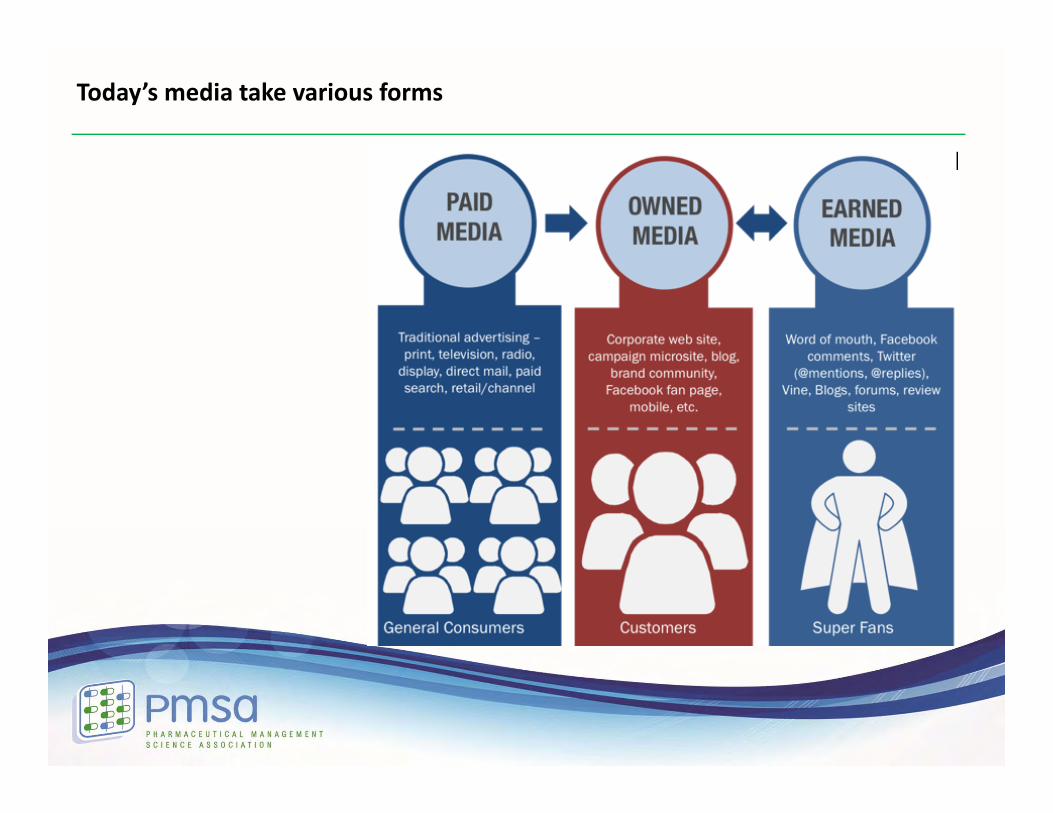
Today’s media take various forms
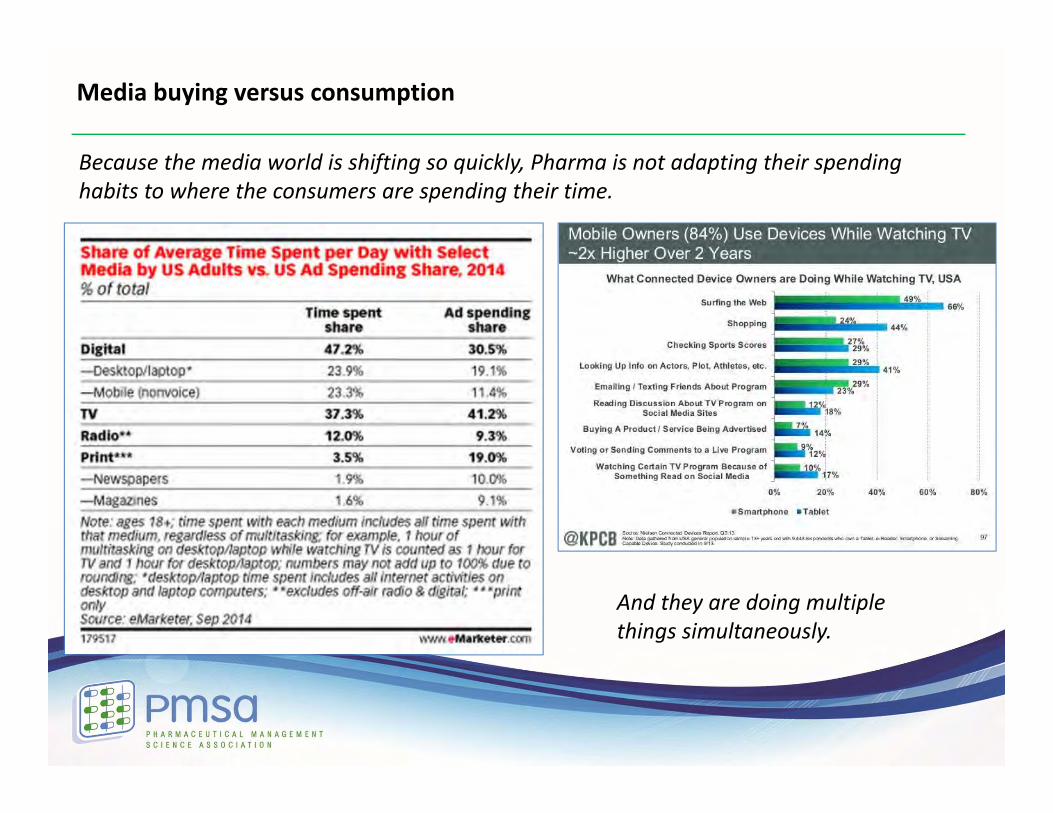
Media buying versus consumption
Because the media world is shifting so quickly, Pharma is not adapting their spending habits to where the consumers are spending their time.
And they are doing multiple things simultaneously.
The Online Data World
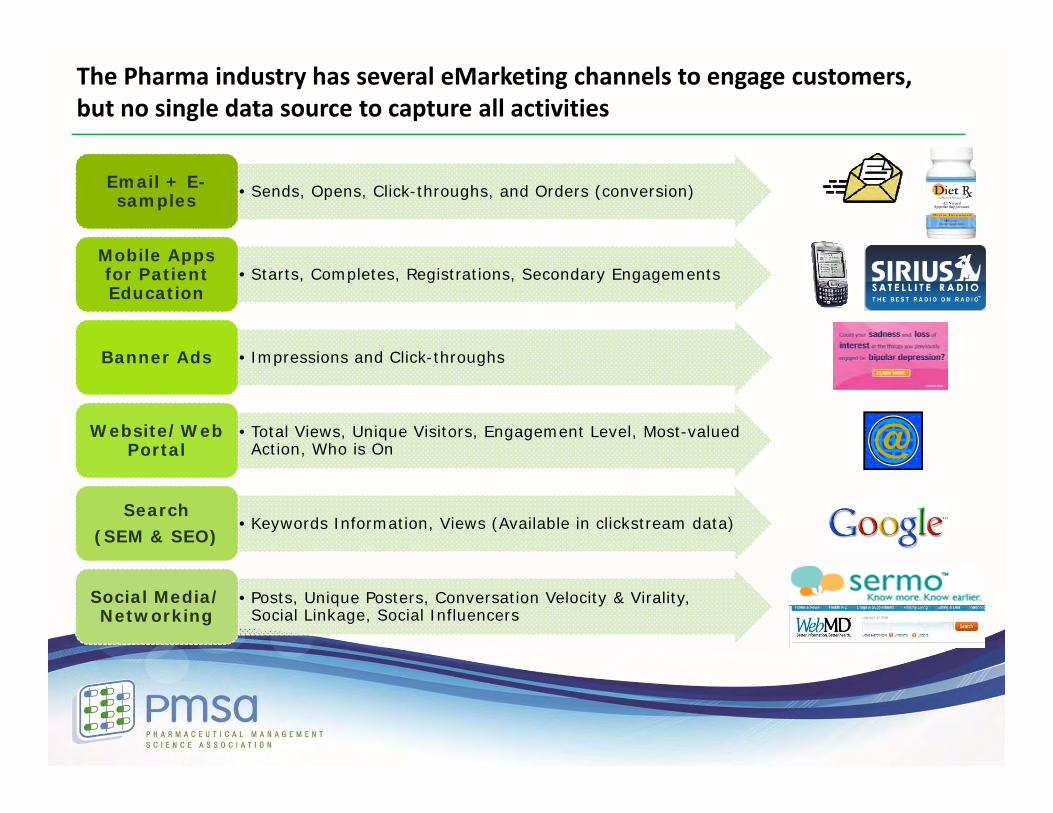
The Pharma industry has several eMarketing channels to engage customers, but no single data source to capture all activities
• Sends, Opens, Click-throughs, and Orders (conversion)Email + E-samples
• Starts, Completes, Registrations, Secondary Engagements Mobile Apps for Patient Education
• Impressions and Click-throughsBanner Ads
• Total Views, Unique Visitors, Engagement Level, Most-valued Action, Who is On
Website/Web Portal
• Keywords Information, Views (Available in clickstream data)Search
(SEM & SEO)
• Posts, Unique Posters, Conversation Velocity & Virality, Social Linkage, Social Influencers
Social Media/ Networking
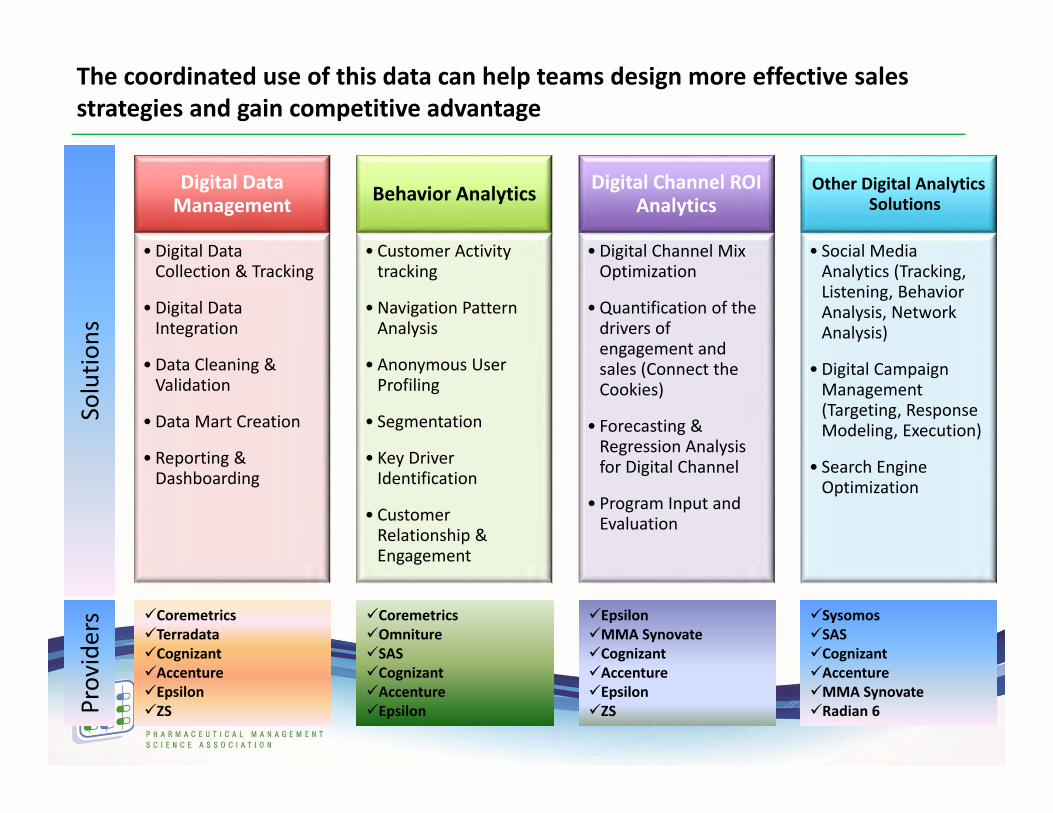
The coordinated use of this data can help teams design more effective sales strategies and gain competitive advantage
Digital Data Management
• Digital Data Collection & Tracking
• Digital Data Integration
• Data Cleaning & Validation
• Data Mart Creation
• Reporting & Dashboarding
Behavior Analytics
• Customer Activity tracking
• Navigation Pattern Analysis
• Anonymous User Profiling
• Segmentation
• Key Driver Identification
• Customer Relationship & Engagement
Digital Channel ROI Analytics
• Digital Channel Mix Optimization
• Quantification of the drivers of engagement and sales (Connect the Cookies)
• Forecasting & Regression Analysis for Digital Channel
• Program Input and Evaluation
Other Digital Analytics Solutions
• Social Media Analytics (Tracking, Listening, Behavior Analysis, Network Analysis)
• Digital Campaign Management (Targeting, Response Modeling, Execution)
• Search Engine Optimization
CoremetricsTerradataCognizantAccenture EpsilonZS
CoremetricsOmniture SASCognizantAccentureEpsilon
EpsilonMMA SynovateCognizantAccentureEpsilonZS
SysomosSASCognizantAccentureMMA SynovateRadian 6
Solutio
nsProviders
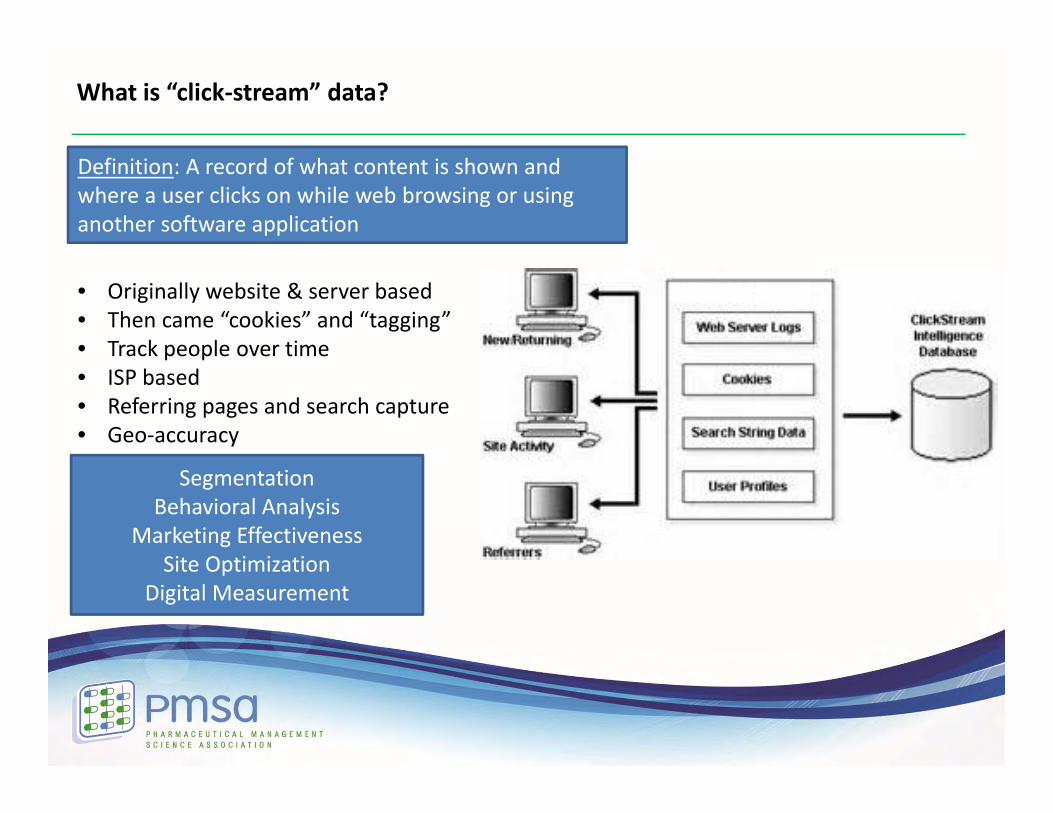
What is “click‐stream” data?
Definition: A record of what content is shown and where a user clicks on while web browsing or using another software application
• Originally website & server based• Then came “cookies” and “tagging”• Track people over time• ISP based• Referring pages and search capture• Geo‐accuracy
SegmentationBehavioral Analysis
Marketing EffectivenessSite Optimization
Digital Measurement
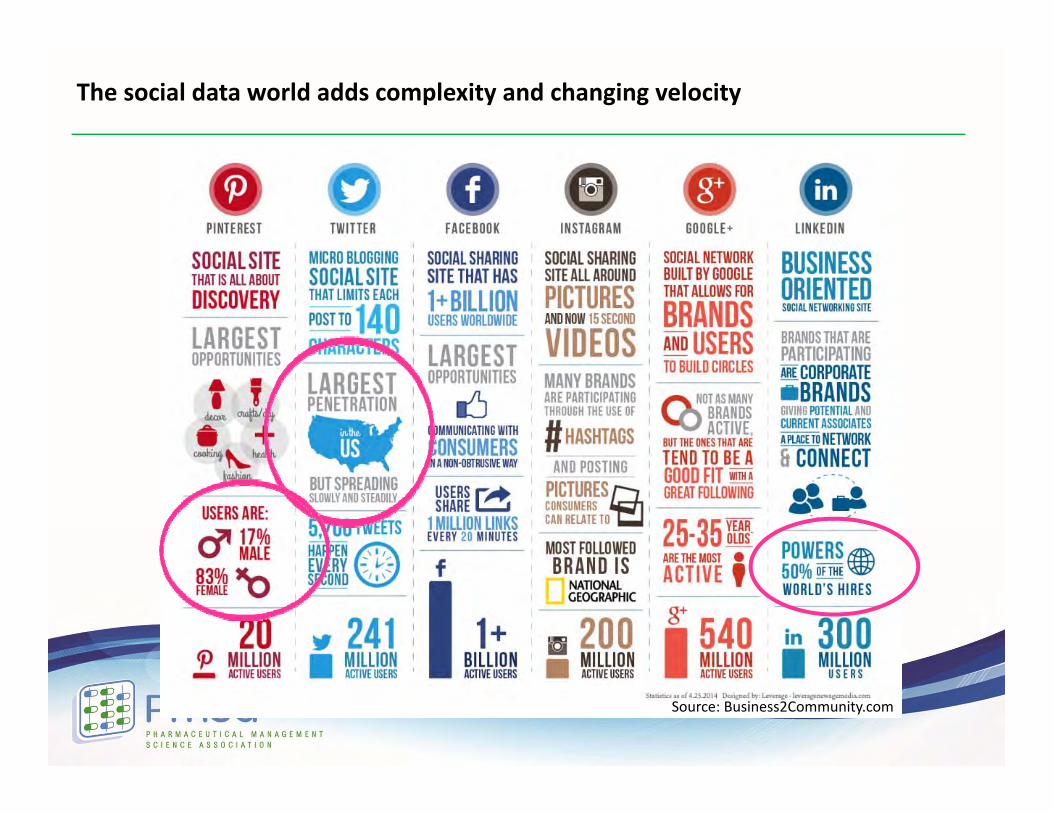
Source: Business2Community.com
The social data world adds complexity and changing velocity
You must be aware of social data restrictions
• All social media data is subject to Data Protection laws, meaning that it should only be obtained for a specific purpose and should not be kept for longer than is necessary
• Organizations must find out whether there is any intellectual property contained within the data, and if so, whether it is subject to copyright or confidentiality regulations
• Respect social networkers' privacy, even if their profiles are publicly visible
• HIPAA restrictions
• Examples of regulations and policies:– The Russian parliament has passed a law mandating that social networks and
other similar services be required to warehouse data on citizens within Russia– New Twitter policy around the deletion of tweets
17
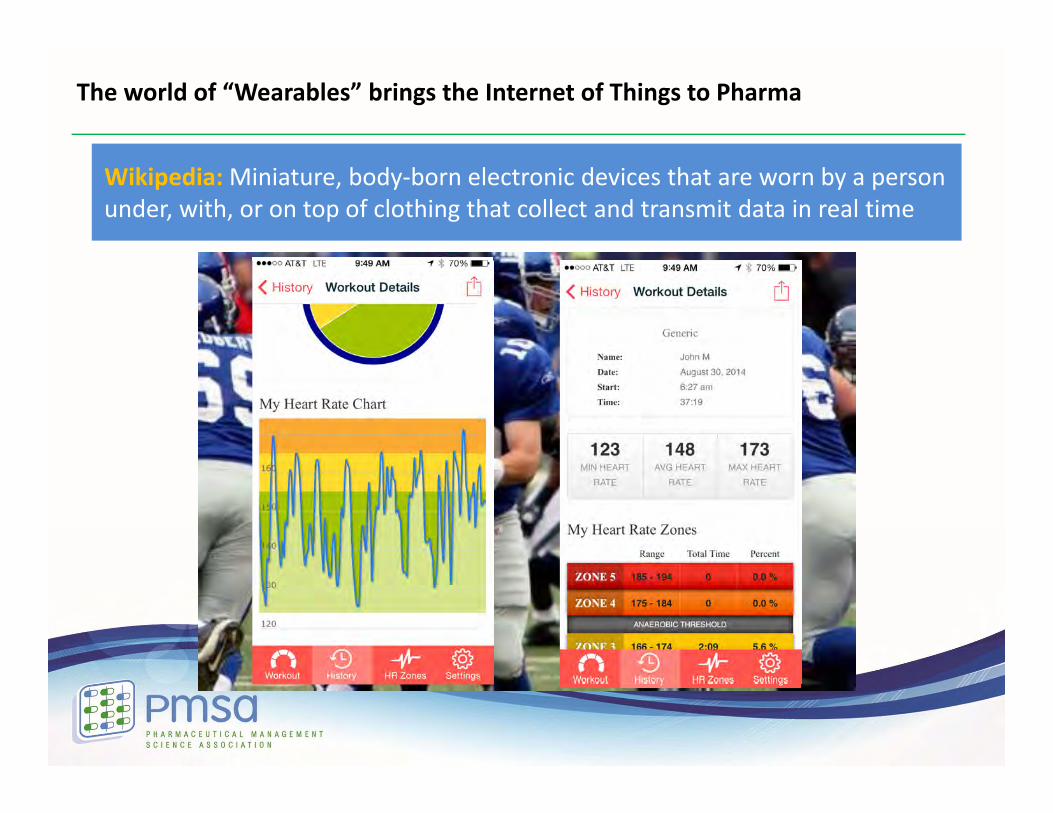
The world of “Wearables” brings the Internet of Things to Pharma
Wikipedia: Miniature, body‐born electronic devices that are worn by a person under, with, or on top of clothing that collect and transmit data in real time
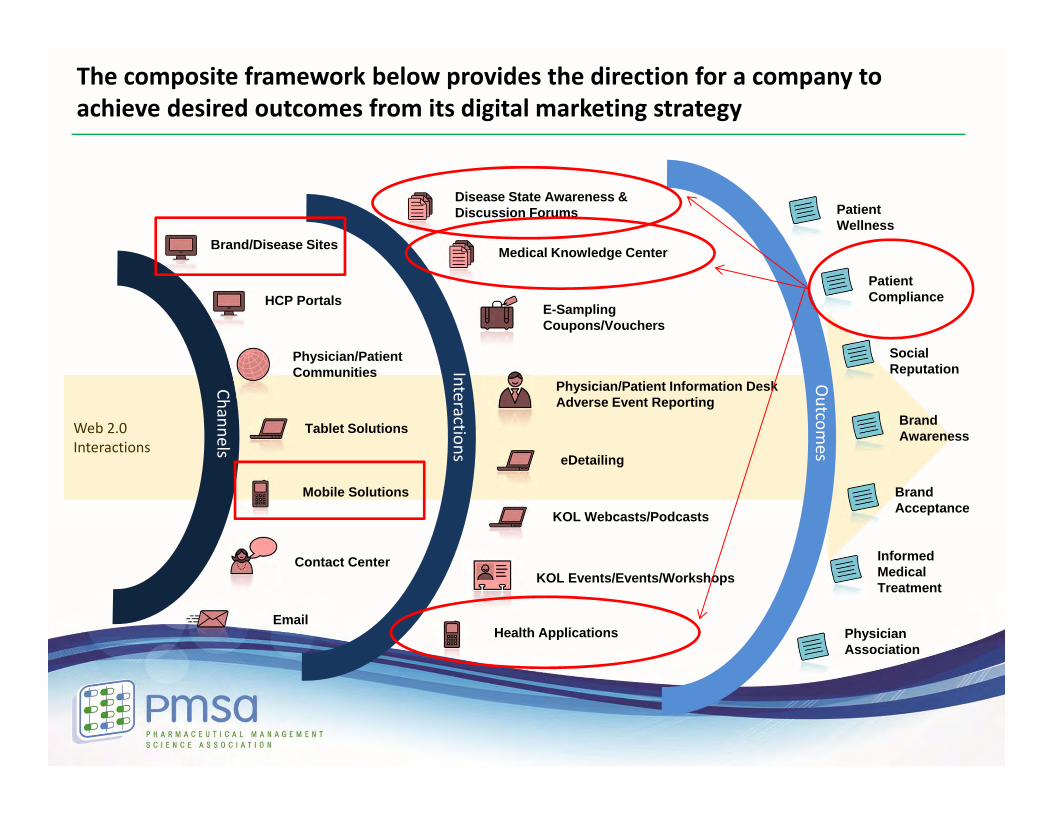
The composite framework below provides the direction for a company to achieve desired outcomes from its digital marketing strategy
Web 2.0Interactions
Brand/Disease Sites
HCP Portals
Physician/Patient Communities
Tablet Solutions
Mobile Solutions
Contact Center
E-Sampling Coupons/Vouchers
Medical Knowledge Center
Physician/Patient Information Desk Adverse Event Reporting
eDetailing
KOL Webcasts/Podcasts
KOL Events/Events/Workshops
Health Applications
Channels
Interactions
Disease State Awareness & Discussion Forums
Outcom
esPatient Wellness
Patient Compliance
Social Reputation
Brand Awareness
Brand Acceptance
Informed Medical Treatment
Physician Association
Linkage and Analytics
The Future is Here: Case Studies
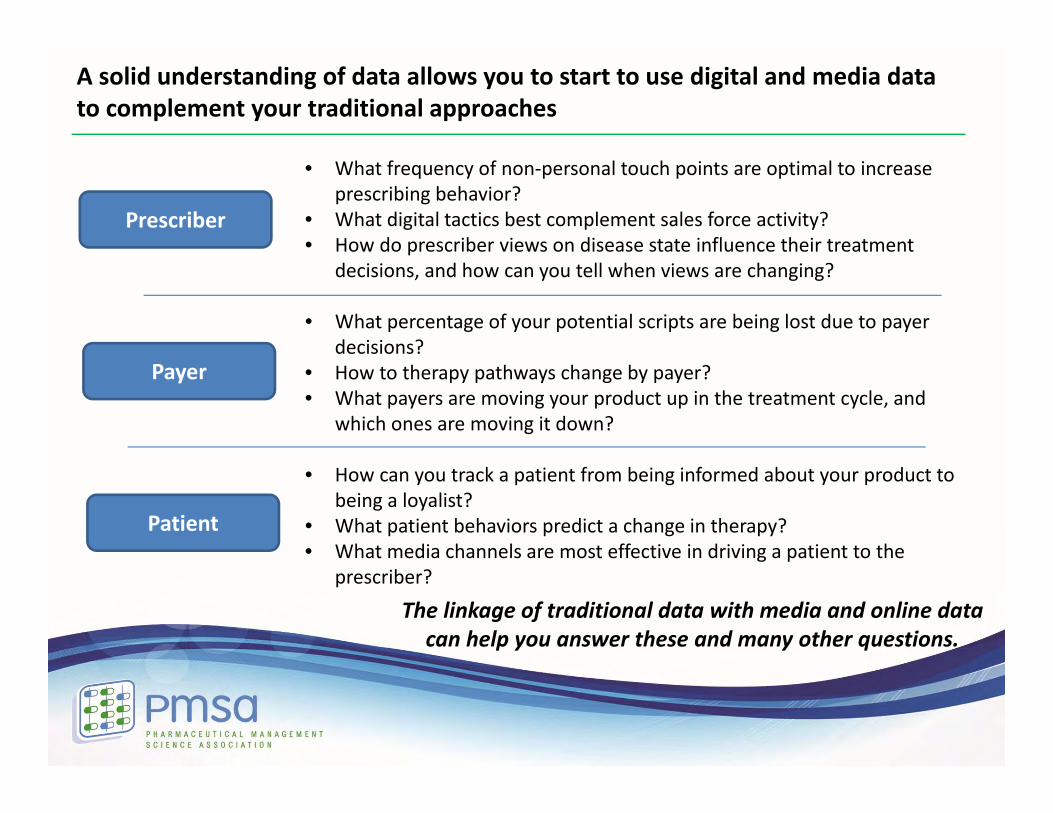
A solid understanding of data allows you to start to use digital and media data to complement your traditional approaches
Prescriber
Payer
Patient
• What frequency of non‐personal touch points are optimal to increase prescribing behavior?
• What digital tactics best complement sales force activity?• How do prescriber views on disease state influence their treatment
decisions, and how can you tell when views are changing?
• What percentage of your potential scripts are being lost due to payer decisions?
• How to therapy pathways change by payer?• What payers are moving your product up in the treatment cycle, and
which ones are moving it down?
• How can you track a patient from being informed about your product to being a loyalist?
• What patient behaviors predict a change in therapy?• What media channels are most effective in driving a patient to the
prescriber?
The linkage of traditional data with media and online data can help you answer these and many other questions.
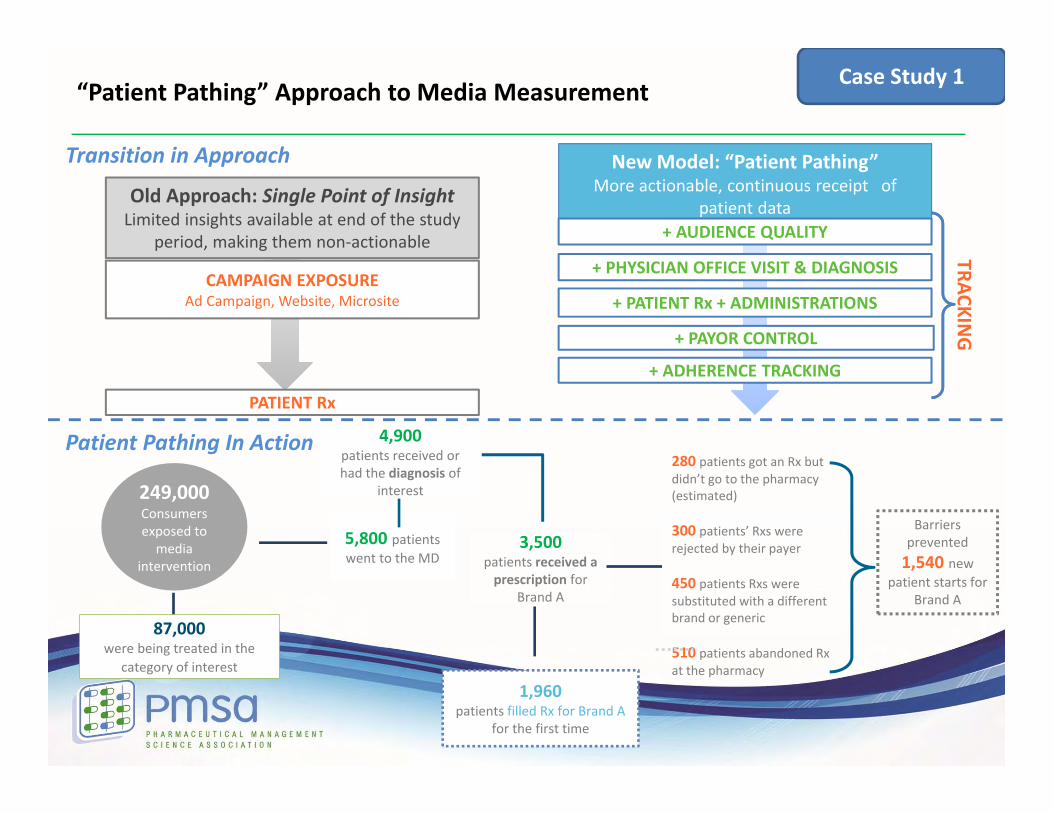
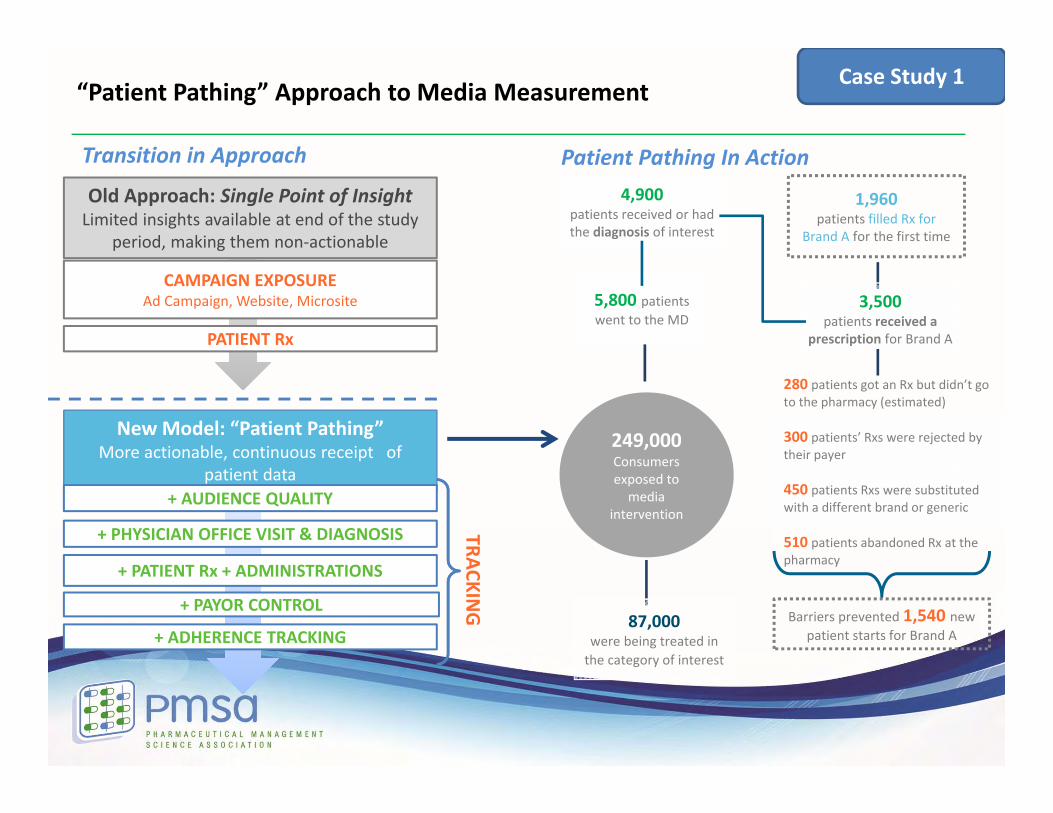
“Patient Pathing” Approach to Media Measurement Case Study 1
Transition in Approach
Old Approach: Single Point of InsightLimited insights available at end of the study
period, making them non‐actionable
PATIENT Rx
CAMPAIGN EXPOSUREAd Campaign, Website, Microsite
New Model: “Patient Pathing”More actionable, continuous receipt of
patient data
+ PHYSICIAN OFFICE VISIT & DIAGNOSIS
+ PATIENT Rx + ADMINISTRATIONS
TRACKING+ PAYOR CONTROL
+ ADHERENCE TRACKING
+ AUDIENCE QUALITY
3,500patients received a prescription for
Brand A
280 patients got an Rx but didn’t go to the pharmacy (estimated)
300 patients’ Rxs were rejected by their payer
450 patients Rxs were substituted with a different brand or generic
510 patients abandoned Rx at the pharmacy
5,800 patients went to the MD
4,900patients received or had the diagnosis of
interest
1,960patients filled Rx for Brand A
for the first time
Barriers prevented 1,540 new
patient starts for Brand A
87,000were being treated in the
category of interest
249,000Consumers exposed to media
intervention
Patient Pathing In Action
“Patient Pathing” Approach to Media Measurement Case Study 1
Patient Pathing In ActionTransition in Approach
3,500patients received a
prescription for Brand A
280 patients got an Rx but didn’t go to the pharmacy (estimated)
300 patients’ Rxs were rejected by their payer
450 patients Rxs were substituted with a different brand or generic
510 patients abandoned Rx at the pharmacy
5,800 patients went to the MD
4,900patients received or had the diagnosis of interest
Barriers prevented 1,540 new patient starts for Brand A
87,000were being treated in the category of interest
249,000Consumers exposed to media
intervention
1,960patients filled Rx for
Brand A for the first time
Old Approach: Single Point of InsightLimited insights available at end of the study
period, making them non‐actionable
PATIENT Rx
CAMPAIGN EXPOSUREAd Campaign, Website, Microsite
New Model: “Patient Pathing”More actionable, continuous receipt of
patient data
+ PHYSICIAN OFFICE VISIT & DIAGNOSIS
+ PATIENT Rx + ADMINISTRATIONSTRACKIN
G+ PAYOR CONTROL
+ ADHERENCE TRACKING
+ AUDIENCE QUALITY
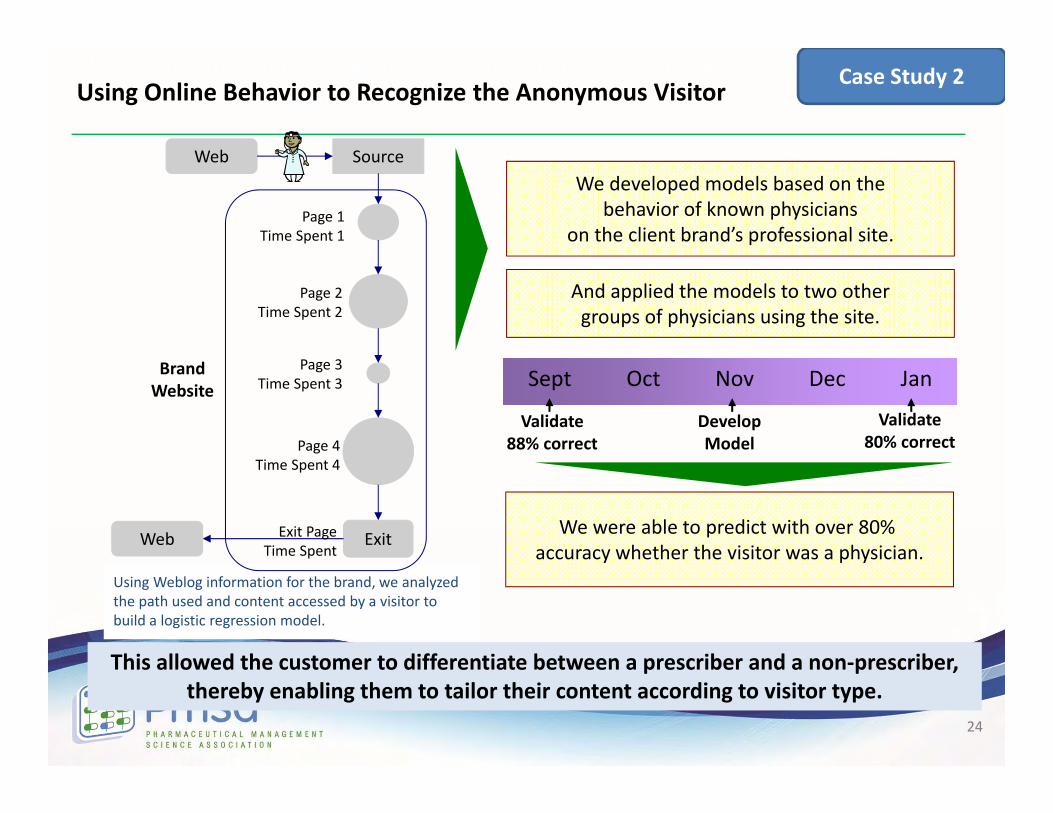
We built a model to recognize if the visitor on the brand website is a prescriber or a consumer
Using Weblog information for the brand, we analyzed the path used and content accessed by a visitor to build a logistic regression model.
Web
Exit
Source
Web
Page 1Time Spent 1
Page 3Time Spent 3
Page 2Time Spent 2
Page 4Time Spent 4
Brand Website
Exit PageTime Spent
We developed models based on thebehavior of known physicians
on the client brand’s professional site.
And applied the models to two othergroups of physicians using the site.
We were able to predict with over 80% accuracy whether the visitor was a physician.
Sept Oct Nov Dec Jan
DevelopModel
Validate88% correct
Validate80% correct
This allowed the customer to differentiate between a prescriber and a non‐prescriber, thereby enabling them to tailor their content according to visitor type.
Using Online Behavior to Recognize the Anonymous Visitor
24
Case Study 2
Questions?
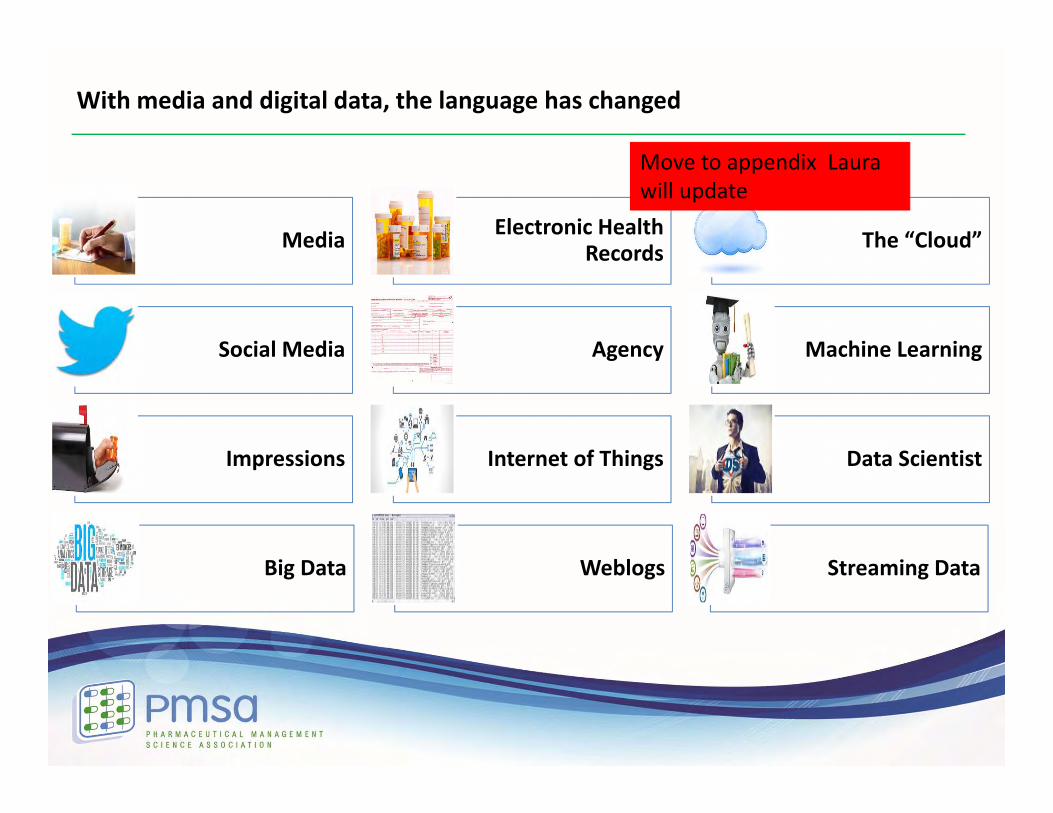
With media and digital data, the language has changed
Media Electronic Health Records The “Cloud”
Social Media Agency Machine Learning
Impressions Internet of Things Data Scientist
Big Data Weblogs Streaming Data
Move to appendix Laura will update