Embed Size (px)
Citation preview
30OCT200721261833
DP World Limited(a company limited by shares incorporated in the Dubai International Financial Centre)
Global Offering of 3,245,300,000 Shares(subject to an over-allotment option in respect of up to 572,700,000 additional Shares)
3,245,300,000 ordinary shares with a nominal value of $0.10 each (the ‘‘Shares’’) of DP World Limited (the ‘‘Company’’), acompany limited by shares incorporated in the Dubai International Financial Centre (the ‘‘DIFC’’), are being offered in thisglobal offering (the ‘‘Global Offering’’) by our sole shareholder, Port & Free Zone World FZE (the ‘‘Selling Shareholder’’).The Global Offering comprises an offering of (i) 2,129,527,994 Shares in the United States to qualified institutional buyers(each a ‘‘QIB’’) as defined in, and in reliance on, Rule 144A (‘‘Rule 144A’’) promulgated under the US Securities Act of1933, as amended (the ‘‘Securities Act’’), and outside the United States in reliance on Regulation S (‘‘Regulation S’’)promulgated under the Securities Act, including Shares being offered in the DIFC (the ‘‘Exempt Offer’’) pursuant to anexemption from registration under the Offered Securities Rules of the Dubai Financial Services Authority (the ‘‘DFSA’’)(collectively, the ‘‘International Offering’’), (ii) 307,692,306 Shares in the United Arab Emirates (the ‘‘UAE’’) to(A) nationals of the UAE or other Gulf Cooperation Council (‘‘GCC’’) countries who are resident in the UAE or anotherGCC country, (B) other UAE residents with a valid residency visa and (C) corporate entities organised under the laws ofthe UAE or another GCC country, who, in each case, hold a securities account with one of the participating brokers, applyfor Shares in the UAE and meet certain other requirements (the ‘‘UAE Retail Offer’’) and (iii) 808,079,700 Shares that willbe allocated to, or on behalf of, holders (the ‘‘Sukukholders’’) of the $3.5 billion Trust Certificates (Sukuk al Musharaka) due2008 (collectively, the ‘‘PCFC Development Sukuk’’) issued by the Company’s affiliate PCFC Development FZCO inconnection with the repayment in part of the PCFC Development Sukuk (the ‘‘Sukuk Allocation’’).Prior to the Global Offering, there has been no public market for the Shares. We have applied for the Shares to be admittedto the Official List of Securities of the Dubai International Financial Exchange (the ‘‘DIFX’’) and to list the Shares on theDIFX under the symbol ‘‘DPW’’ (the ‘‘DIFX Admission’’). There will be no conditional dealings in the Shares prior to theDIFX Admission. It is expected that the DIFX Admission will become effective and that dealings in the Shares will commenceon the DIFX on or about November 26, 2007 (the ‘‘Closing Date’’).
Investing in the Shares involves significant risks.
See ‘‘Risk Factors’’, including ‘‘Risks Relating to the DIFC and the DIFX’’, beginning on page 16.
Offer Price: $1.30 per Share
The Shares have not been and will not be registered under the Securities Act and, subject to certain limited exceptions, maynot be offered or sold within the United States. The Shares are being offered and sold outside the United States in reliance onRegulation S and within the United States only to QIBs in reliance on Rule 144A. For a description of these and certain furtherrestrictions on offers, sales and transfers of the Shares and the distribution of this Prospectus, see ‘‘Subscription and Sale’’and ‘‘Transfer Restrictions’’.
The Selling Shareholder has granted Deutsche Bank AG, London Branch (the ‘‘Stabilisation Manager’’), on behalf of theseveral Underwriters (as defined below), an over-allotment option (the ‘‘Over-allotment Option’’) to purchase up to anadditional 462,147,489 Shares at the initial offering price (the ‘‘Offer Price’’) within 30 days from the Closing Date to coverover-allotments, if any, made in connection with the Global Offering and to cover any short positions resulting fromstabilisation transactions. In addition, to the extent that the Over-allotment Option is exercised, up to an additional110,552,511 Shares will be allocated to, or on behalf of, Sukukholders.The Shares are offered by the Underwriters when, as and if delivered to, and accepted by, the Underwriters and subject totheir right to reject orders in whole or in part. Payment for, and delivery of, the Shares is expected to be made on thesettlement date, which is expected to be on or about the Closing Date, through the book-entry facilities of the CentralSecurities Depositary operated by the DIFX.The DIFX takes no responsibility for the contents of this Prospectus, makes no representations as to its accuracy orcompleteness and expressly disclaims any liability whatsoever for any loss howsoever arising from or in reliance upon any partof the contents of this Prospectus.
DIFC Exempt Offer Statement: This Prospectus relates to an Exempt Offer in accordance with the Offered Securities Rules ofthe DFSA. It is intended for distribution only to persons of a type specified in those rules. It must not be delivered to, or reliedon by, any other person. The DFSA has no responsibility for reviewing or verifying any documents in connection with ExemptOffers. The DFSA has not approved this Prospectus nor taken steps to verify the information set out in it and has noresponsibility for it. The securities to which this Prospectus relates may be illiquid and/or subject to restrictions on theirresale. Prospective purchasers of the securities offered should conduct their own due diligence on the securities. If you do notunderstand the contents of this Prospectus you should consult an authorised financial adviser.
Joint Global Coordinators, Joint Bookrunners and Joint Lead Managers
Deutsche Bank Merrill Lynch Millennium Finance SHUAA CapitalInternational Corporation Ltd. PSC
This Prospectus is dated November 21, 2007
16OCT200720143290
www.global-reports.com
TABLE OF CONTENTS
Page
Notice to Investors . . . . . . . . . . . . . . . . . . . . . . . . . . . . . . . . . . . . . . . . . . . . . . . . . . . . . . . . iiStabilisation . . . . . . . . . . . . . . . . . . . . . . . . . . . . . . . . . . . . . . . . . . . . . . . . . . . . . . . . . . . . . . iiiNotice to UK Investors . . . . . . . . . . . . . . . . . . . . . . . . . . . . . . . . . . . . . . . . . . . . . . . . . . . . . iiiNotice to European Economic Area Investors . . . . . . . . . . . . . . . . . . . . . . . . . . . . . . . . . . . . . iiiNotice to Australian Investors . . . . . . . . . . . . . . . . . . . . . . . . . . . . . . . . . . . . . . . . . . . . . . . . ivNotice to New Hampshire Residents . . . . . . . . . . . . . . . . . . . . . . . . . . . . . . . . . . . . . . . . . . . . ivEnforcement of Foreign Judgments . . . . . . . . . . . . . . . . . . . . . . . . . . . . . . . . . . . . . . . . . . . . . ivCautionary Statement Regarding Forward-Looking Statements . . . . . . . . . . . . . . . . . . . . . . . . . ivPresentation of Certain Financial and Other Information . . . . . . . . . . . . . . . . . . . . . . . . . . . . . vNon-IFRS Measures . . . . . . . . . . . . . . . . . . . . . . . . . . . . . . . . . . . . . . . . . . . . . . . . . . . . . . . xPresentation of Market, Market Share and Industry Data . . . . . . . . . . . . . . . . . . . . . . . . . . . . . xiAvailable Information . . . . . . . . . . . . . . . . . . . . . . . . . . . . . . . . . . . . . . . . . . . . . . . . . . . . . . xiSummary . . . . . . . . . . . . . . . . . . . . . . . . . . . . . . . . . . . . . . . . . . . . . . . . . . . . . . . . . . . . . . . . 1The Global Offering . . . . . . . . . . . . . . . . . . . . . . . . . . . . . . . . . . . . . . . . . . . . . . . . . . . . . . . 6Summary of Historical and Pro Forma Consolidated Financial and Operating Data . . . . . . . . . . 9Risk Factors . . . . . . . . . . . . . . . . . . . . . . . . . . . . . . . . . . . . . . . . . . . . . . . . . . . . . . . . . . . . . 16Use of Proceeds . . . . . . . . . . . . . . . . . . . . . . . . . . . . . . . . . . . . . . . . . . . . . . . . . . . . . . . . . . 35Dividend Policy . . . . . . . . . . . . . . . . . . . . . . . . . . . . . . . . . . . . . . . . . . . . . . . . . . . . . . . . . . . 36Exchange Rate Information . . . . . . . . . . . . . . . . . . . . . . . . . . . . . . . . . . . . . . . . . . . . . . . . . . 37Unaudited Pro Forma Consolidated Financial Information . . . . . . . . . . . . . . . . . . . . . . . . . . . . 38Selected Historical Consolidated Financial Data . . . . . . . . . . . . . . . . . . . . . . . . . . . . . . . . . . . 46Selected Historical Consolidated Financial Data of P&O . . . . . . . . . . . . . . . . . . . . . . . . . . . . . 50Management’s Discussion and Analysis of Financial Condition and Results of Operations . . . . . 53Industry Overview . . . . . . . . . . . . . . . . . . . . . . . . . . . . . . . . . . . . . . . . . . . . . . . . . . . . . . . . . 100Business . . . . . . . . . . . . . . . . . . . . . . . . . . . . . . . . . . . . . . . . . . . . . . . . . . . . . . . . . . . . . . . . 110Management . . . . . . . . . . . . . . . . . . . . . . . . . . . . . . . . . . . . . . . . . . . . . . . . . . . . . . . . . . . . . 141Related Party Transactions . . . . . . . . . . . . . . . . . . . . . . . . . . . . . . . . . . . . . . . . . . . . . . . . . . . 146Principal and Selling Shareholder . . . . . . . . . . . . . . . . . . . . . . . . . . . . . . . . . . . . . . . . . . . . . . 149Description of Share Capital . . . . . . . . . . . . . . . . . . . . . . . . . . . . . . . . . . . . . . . . . . . . . . . . . 150Clearance and Settlement . . . . . . . . . . . . . . . . . . . . . . . . . . . . . . . . . . . . . . . . . . . . . . . . . . . . 158Description of the PCFC Development FZCO Sukuk . . . . . . . . . . . . . . . . . . . . . . . . . . . . . . . 159Overview of the UAE . . . . . . . . . . . . . . . . . . . . . . . . . . . . . . . . . . . . . . . . . . . . . . . . . . . . . . 161Taxation . . . . . . . . . . . . . . . . . . . . . . . . . . . . . . . . . . . . . . . . . . . . . . . . . . . . . . . . . . . . . . . . 164Subscription and Sale . . . . . . . . . . . . . . . . . . . . . . . . . . . . . . . . . . . . . . . . . . . . . . . . . . . . . . . 167Transfer Restrictions . . . . . . . . . . . . . . . . . . . . . . . . . . . . . . . . . . . . . . . . . . . . . . . . . . . . . . . 174Legal Matters . . . . . . . . . . . . . . . . . . . . . . . . . . . . . . . . . . . . . . . . . . . . . . . . . . . . . . . . . . . . 176Independent Auditors . . . . . . . . . . . . . . . . . . . . . . . . . . . . . . . . . . . . . . . . . . . . . . . . . . . . . . 177Summary of Certain Differences Between IFRS and US GAAP . . . . . . . . . . . . . . . . . . . . . . . . 178Listing and General Information . . . . . . . . . . . . . . . . . . . . . . . . . . . . . . . . . . . . . . . . . . . . . . . 179Index to Financial Statements . . . . . . . . . . . . . . . . . . . . . . . . . . . . . . . . . . . . . . . . . . . . . . . . . F-1
i
NOTICE TO INVESTORS
In this Prospectus, unless the context otherwise requires, the ‘‘Company’’ or the ‘‘Issuer’’ refers toDP World Limited, a company limited by shares incorporated in the DIFC, with Registration Number 0226issued on August 9, 2006, and ‘‘we’’, ‘‘our’’, ‘‘us’’ and the ‘‘Group’’ refer to the Company together with itsconsolidated subsidiaries, joint ventures and associates, as well as their respective predecessor companiesor entities, as applicable.
This Prospectus constitutes an Exempt Offer statement for purposes of Rule 3.2 of the Offered SecuritiesRules of the DFSA. This Prospectus is not a prospectus for purposes of Section 12(a)(2) or any otherprovision of, or rule under, the Securities Act.
To the best of the knowledge and belief of our directors, this Prospectus complies with the Markets Law2004 of the DIFC and the Offered Securities Rules of the DFSA and our directors accept responsibility,jointly and severally, for the information contained in this Prospectus and believe that there are no otherfacts the omission of which would make this Prospectus or any statement herein misleading or deceptive.The DFSA has no responsibility for reviewing or verifying any documents in connection with ExemptOffers. The DFSA has not approved this Prospectus nor taken steps to verify the information set out in itand has no responsibility for it.
In making an investment decision, prospective investors must rely upon their own examination of us andthe terms of the Global Offering set out in this Prospectus, including the merits and risks involved.Prospective investors should exclusively rely on the information contained in this Prospectus. Neither wenor Deutsche Bank AG, London Branch, Merrill Lynch International, Millennium FinanceCorporation Ltd. or SHUAA Capital psc (collectively, the ‘‘Joint Global Coordinators’’) nor DeutscheBank AG, London Branch, Dubai Islamic Bank PJSC, Merrill Lynch International or SHUAA Capital psc(collectively, the ‘‘Underwriters’’) has authorised anyone, including any brokers participating in the UAERetail Offer, to provide prospective investors with information different from that contained in thisProspectus. The Joint Global Coordinators and the Underwriters make no representation or warranty,express or implied, as to the accuracy or completeness of the information contained in this Prospectus, andnothing contained in this Prospectus is, or shall be relied upon as, a promise or representation by the JointGlobal Coordinators, the Underwriters or their respective affiliates or advisors. The Joint GlobalCoordinators and the Underwriters are acting for the Company in relation to the Global Offering and forno one else and will not be responsible to anyone other than the Company for providing the protectionsafforded to their respective clients nor for providing advice in relation to the Global Offering or thecontents of this document or any transaction, arrangement or matter referred to herein. You agree to theforegoing by accepting delivery of this Prospectus. The information contained in this Prospectus is accurateonly as of the date of this Prospectus, regardless of the time of delivery of this Prospectus or of any sale ofour Shares.
The distribution of this Prospectus and the offering and sale of the Shares is restricted by law in certainjurisdictions, and this Prospectus does not constitute, and may not be used in connection with, any offer orsolicitation in any such jurisdiction or to any person to whom it is unlawful to make such offer orsolicitation. Other than in respect of the United Arab Emirates (the ‘‘UAE’’), no action has been or will betaken in any jurisdiction by us or the Joint Global Coordinators or the Underwriters that would permit apublic offering of the Shares or possession or distribution of a prospectus in any jurisdiction where actionfor that purpose would be required. The Shares have not been and will not be registered under theSecurities Act or with any securities regulatory authority of any state or other jurisdiction of the UnitedStates. The Shares may not be offered or sold within the United States, except in certain transactionsexempt from the registration requirements of the Securities Act.
The Shares are being offered and sold outside the United States in reliance on Regulation S and within theUnited States only to QIBs in reliance on Rule 144A. Prospective purchasers are hereby notified thatsellers of the Shares may be relying on the exemption from the provisions of Section 5 of the Securities Actprovided by Rule 144A. For a description of these and certain further restrictions on offers, sales andtransfers of Shares and distribution of this Prospectus, see ‘‘Subscription and Sale’’ and ‘‘TransferRestrictions’’.
Persons into whose possession this Prospectus may come are required by us, the Joint Global Coordinatorsand the Underwriters to inform themselves about and to observe the restrictions contained in thisProspectus. Neither we nor any of the Joint Global Coordinators or the Underwriters accepts any
ii
www.global-reports.com
responsibility for any violation by any person, whether or not it is a prospective subscriber or purchaser ofthe Shares, of any of these restrictions.
Neither we nor any of the Joint Global Coordinators or the Underwriters, nor any of our or theirrespective representatives, make any representation to any purchaser of the Shares offered herebyregarding the legality of an investment by such purchaser under appropriate legal investment or similarlaws. Each purchaser should consult with its own advisors as to the legal, tax, business, financial and otherrelevant implications of the purchase of the Shares.
This Prospectus has been prepared by us in connection with the Global Offering solely for the purpose ofenabling a prospective investor to consider the purchase of the Shares. Reproduction and distribution ofthis Prospectus or disclosure or use of the information contained herein for any purpose other thanconsidering an investment in the Shares is prohibited.
NEITHER THE US SECURITIES AND EXCHANGE COMMISSION NOR ANY STATE SECURITIESCOMMISSION IN THE UNITED STATES NOR ANY OTHER US REGULATORY AUTHORITY HASAPPROVED OR DISAPPROVED OF THE SHARES OR PASSED UPON OR ENDORSED THE MERITSOF THE OFFERING OF THE SHARES OR THE ACCURACY OR ADEQUACY OF THIS PROSPECTUS.ANY REPRESENTATION TO THE CONTRARY IS A CRIMINAL OFFENCE IN THE UNITED STATES.
STABILISATION
In connection with the Global Offering, the Stabilisation Manager, on behalf of the several Underwriters,or persons acting on its behalf, may over-allot the Shares or effect transactions that may support themarket price of the Shares at a level higher than that which might otherwise prevail. There is no assurance,however that the Stabilisation Manager, or any of its agents, will undertake stabilisation action. Any suchstabilisation may be conducted on the DIFX, in the open market or in over-the-counter transactions, ineach case, in accordance with the Price Stabilisation Module of the DFSA Rulebook. Such stabilisationactivities may be undertaken at any time during the period commencing on the date of the announcementof the Offer Price and ending on the date 30 days after the date of the Closing Date. Such stabilisation, ifcommenced, may be discontinued at any time without prior notice. The Stabilisation Manager has advisedus that in no event will measures be taken to stabilise the market price of the Shares above the Offer Price.The Stabilisation Manager has advised us that, except as required by law or regulation, neither theStabilisation Manager nor any of its agents intends to disclose the extent of any over-allotments madeand/or stabilisation transactions conducted in relation to the Global Offering.
NOTICE TO UK INVESTORS
This Prospectus is being distributed only to and is directed only at (i) persons who are outside the UnitedKingdom; (ii) investment professionals falling within Article 19(5) of the Financial Services and MarketsAct 2000 (Financial Promotion) Order 2005, as amended (the ‘‘Order’’); or (iii) high net worth entitiesfalling within Article 49(2)(a)-(d) of the Order (all such persons in (ii) and (iii) being referred to as‘‘relevant persons’’). The Shares are available only to, and any invitation, offer or agreement to purchase orotherwise acquire the Shares will be engaged in only with, relevant persons. Any person who is within theUnited Kingdom and not a relevant person should not act or rely on this Prospectus or any of its contents.
NOTICE TO EUROPEAN ECONOMIC AREA INVESTORS
This Prospectus and the Global Offering are only addressed to and directed at persons in member states ofthe European Economic Area that are ‘‘qualified investors’’ within the meaning of Article 2(i)(e) of theProspectus Directive (2003/71/EC (the ‘‘Prospectus Directive’’)). Any person in any member state of theEuropean Economic Area (the ‘‘EEA’’) other than the United Kingdom who is not such a qualifiedinvestor should not act or rely on this Prospectus or any of its contents.
This Prospectus has been prepared on the basis that all offerings of the Shares will be made pursuant to anexemption under the Prospectus Directive, as implemented in member states of the EEA, from therequirement to produce a prospectus for offerings of Shares. Accordingly, any person making or intendingto make any offering within the EEA of the Shares which are the subject of the Global Offering shouldonly do so in circumstances in which no obligation arises for us or any of the Joint Global Coordinators orthe Underwriters to produce a prospectus for such offering. Neither we nor any of the Joint GlobalCoordinators or the Underwriters have authorised or do authorise the making of any offering of the Shares
iii
through any financial intermediary, other than offerings made by the Joint Global Coordinators and theUnderwriters which constitute the final placement of the Shares contemplated in this Prospectus.
NOTICE TO AUSTRALIAN INVESTORS
This Prospectus has not been lodged with the Australian Securities and Investments Commission as adisclosure document under Chapter 6D of the Corporations Act 2001 (Cwth) (the ‘‘AustralianCorporations Act’’) and is not an offer to sell, or an invitation to purchase any Shares to persons in theCommonwealth of Australia who are not:
� investors falling within section 708(11) of the Australian Corporations Act; or
� investors falling within section 708(8) of the Australian Corporations Act.
NOTICE TO NEW HAMPSHIRE RESIDENTS
NEITHER THE FACT THAT A REGISTRATION STATEMENT OR AN APPLICATION FOR ALICENSE HAS BEEN FILED UNDER CHAPTER 421-B OF THE NEW HAMPSHIRE REVISEDSTATUTES ANNOTATED, 1955 (‘‘RSA 421-B’’), WITH THE STATE OF NEW HAMPSHIRE NORTHE FACT THAT A SECURITY IS EFFECTIVELY REGISTERED OR A PERSON IS LICENSEDIN THE STATE OF NEW HAMPSHIRE CONSTITUTES A FINDING BY THE SECRETARY OFSTATE OF NEW HAMPSHIRE THAT ANY DOCUMENT FILED UNDER RSA 421-B IS TRUE,COMPLETE AND NOT MISLEADING. NEITHER ANY SUCH FACT NOR THE FACT THAT ANEXEMPTION OR EXCEPTION IS AVAILABLE FOR A SECURITY OR A TRANSACTION MEANSTHAT THE SECRETARY OF STATE OF NEW HAMPSHIRE HAS PASSED IN ANY WAY UPONTHE MERITS OR QUALIFICATIONS OF, OR RECOMMENDED OR GIVEN APPROVAL TO,ANY PERSON, SECURITY OR TRANSACTION. IT IS UNLAWFUL TO MAKE, OR CAUSE TO BEMADE, TO ANY PROSPECTIVE PURCHASER, CUSTOMER OR CLIENT ANYREPRESENTATION INCONSISTENT WITH THE PROVISIONS OF THIS PARAGRAPH.
ENFORCEMENT OF FOREIGN JUDGMENTS
We are a company incorporated in, and under the laws issued by, the DIFC, with our headquarters in theEmirate of Dubai in the UAE. A substantial portion of our assets are located in a number of jurisdictionsoutside the United Kingdom and the United States. In addition, certain members of our board of directors(the ‘‘Board of Directors’’ or the ‘‘Board’’) and senior management reside in Dubai and all or a portion oftheir personal assets may be located in the UAE and/or other jurisdictions outside the United Kingdomand the United States. As a result, prospective investors may have difficulties effecting service of process inthe United Kingdom or the United States upon us or members of our Board of Directors or seniormanagement in connection with any lawsuits related to the Shares, including actions arising under the lawsof the United Kingdom or the federal securities laws of the United States. In the absence of any bilateraltreaty for the reciprocal enforcement of foreign judgments, UAE law sets out a procedure whereby thejudiciary of the UAE is able to ratify judgments, orders or awards of other jurisdictions. Such judgments,orders or awards which are ratified by the UAE court may be enforced within the UAE in the mannerprescribed by the Civil Procedure Code of the UAE. Investors may have difficulties in enforcing judgmentsof English or US courts against us or members of our Board of Directors or senior management in thecourts of the DIFC because the mechanism for enforcement of foreign judgments by the DIFC courts is asyet untested. Investors may also have difficulties in enforcing judgments of the DIFC courts and arbitrationawards ratified by the DIFC courts against us or members of our Board of Directors or seniormanagement in jurisdictions outside the DIFC because the mechanism for enforcement of judgments andawards issued by the DIFC courts in jurisdictions outside the DIFC is as yet untested.
CAUTIONARY STATEMENT REGARDING FORWARD-LOOKING STATEMENTS
This Prospectus includes forward-looking statements. The words ‘‘anticipate’’, ‘‘believe’’, ‘‘expect’’, ‘‘plan’’,‘‘intend’’, ‘‘targets’’, ‘‘aims’’, ‘‘estimate’’, ‘‘project’’, ‘‘will’’, ‘‘would’’, ‘‘may’’, ‘‘could’’, ‘‘continue’’ andsimilar expressions are intended to identify forward-looking statements. All statements other thanstatements of historical fact included in this Prospectus, including, without limitation, those regarding ourfinancial position, business strategy, management plans and objectives for future operations, are forward-looking statements. These forward-looking statements involve known and unknown risks, uncertainties and
iv
www.global-reports.com
other factors, which may cause our actual results, performance or achievements, or industry results, to bematerially different from those expressed or implied by these forward-looking statements. These forward-looking statements are based on numerous assumptions regarding our present and future businessstrategies and the environment in which we expect to operate in the future. Important factors that couldcause our actual results, performance or achievements to differ materially from those in the forward-looking statements include, among other factors referenced in this Prospectus:
� our ability to integrate our newly-acquired operations and any future expansion of our business;
� our ability to realise the benefits we expect from existing and future investments in our existingoperations and pending expansion and development projects;
� our ability to obtain requisite governmental or regulatory approvals to undertake planned orproposed terminal development projects;
� our ability to obtain external financing or maintain sufficient capital to fund our existing andfuture operations;
� changes in political, social, legal or economic conditions in the markets in which we and ourcustomers operate;
� changes in the competitive environment in which we and our customers operate;
� our ability to secure or renew concessions at future or existing facilities;
� failure to comply with regulations applicable to our business;
� fluctuations in the currency exchange rates in the markets in which we operate;
� actions taken by our joint venture partners that may not be in accordance with our policies andobjectives; and
� actions taken by our controlling shareholder, Dubai World Corporation (‘‘Dubai World’’), thatare not in line with, or may conflict with, the best interests of the Company and/or our othershareholders.
Additional factors that could cause actual results, performance or achievements to differ materiallyinclude, but are not limited to, those discussed under ‘‘Risk Factors’’. Forward-looking statements speakonly as of the date of this Prospectus and we expressly disclaim any obligation or undertaking to publiclyupdate or revise any forward-looking statements in this Prospectus to reflect any change in ourexpectations or any change in events, conditions or circumstances on which these forward-lookingstatements are based. Given the uncertainties of forward-looking statements, we cannot assure you thatprojected results or events will be achieved and we caution you not to place undue reliance on thesestatements.
PRESENTATION OF CERTAIN FINANCIAL AND OTHER INFORMATION
Pursuant to a restructuring plan (the ‘‘Restructuring’’) designed to separate the ports-related commercialand regulatory activities of the Government of Dubai, the Company was incorporated in the DIFC onAugust 9, 2006 for the purpose of becoming the holding company for the ports-related commercialactivities of Dubai World. On January 1, 2007, DP World FZE and Thunder FZE, which is the holdingcompany for the Peninsular and Oriental Steam Navigation Company (‘‘P&O’’), were transferred from anaffiliate of the Company, Dubai Ports Authority (‘‘DPA’’), to the Company. Consideration for the transferof DP World FZE and Thunder FZE is reflected in the Company Consolidated Financial Statements (asdefined below) as a payable (the ‘‘Intercompany Payable’’) to our parent company, Port & Free ZoneWorld FZE, which equalled $8,132.7 million as of June 30, 2007. Prior to the consummation of the GlobalOffering, we expect that we will have satisfied the Intercompany Payable through (i) the payment of$2.0 billion of the Intercompany Payable in cash, (ii) the conversion of $2.0 billion of the IntercompanyPayable into Shareholder’s reserve, based on the waiver of this amount by Port & Free Zone World FZEand (iii) the conversion of the remaining $4.1 billion of the Intercompany Payable into Share capital, basedon Port & Free Zone World FZE agreeing to subscribe for shares in the Company in consideration for thecapitalisation of $4.1 billion of the Intercompany Payable.
On the date of the transfer of DP World FZE and Thunder FZE, property, plant and equipment wererevalued to fair market value and transferred at carrying value, which required that we incur an additional
v
depreciation charge of $13.0 million per annum. In addition, prior to the transfer, our wholly-ownedsubsidiary DP World UAE Region FZE (‘‘DP World UAE’’) entered into a concession agreement (the‘‘Concession Agreement’’) with DPA to operate DP World Jebel Ali, Port Rashid (Dubai) and Hamriya Portin Dubai on an arm’s-length basis. The ownership of these ports has been retained by DPA. While DPWorld UAE is not obligated to pay any concession fee to DPA under the Concession Agreement untilDecember 31, 2012, we have started to accrue such fees in an amount equal to $47.0 million per annum,which represents the average annual minimum fee payable over the term of the agreement. The totalimpact of these adjustments on our consolidated financial statements will be $60.0 million per annum andwill be reflected in cost of sales on our consolidated income statement.
As a result of the Restructuring, the Company, together with its operating subsidiaries, now conducts all ofthe ports-related commercial activities of Dubai World and DPA will continue to conduct all of the ports-related regulatory activities of the Government of Dubai. Such regulatory activities have not been and willnot be transferred to the Company. Prior to the transfer of DP World FZE and Thunder FZE, theCompany did not have any operations. As a result, a substantial portion of the historical financialinformation presented in this Prospectus is based on the DPA Consolidated Financial Statements and theP&O Consolidated Financial Statements (each as defined below).
In connection with the Restructuring, on December 29, 2006, the syndicated term loan and revolving creditfacility among DPA, Thunder FZE and Jebel Ali Free Zone Authority (‘‘JAFZA’’), as borrowers, Ports,Customs & Free Zone Corporation (‘‘PCFC’’) and the other guarantors party thereto, as guarantors, thelenders from time to time party thereto and Deutsche Bank Luxembourg S.A., as facility agent, wasamended and restated (the ‘‘Amended and Restated Credit Facility’’) to, among other things, (i) transfer aportion of borrowings thereunder from Thunder FZE to JAFZA, (ii) remove the requirement that theproceeds from the sale of P&O Ports North America, Inc. (‘‘POPNA’’) be used to prepay borrowingsthereunder, (iii) upon the satisfaction of certain conditions, remove JAFZA as a borrower and guarantorthereunder and (iv) upon the satisfaction of certain conditions, remove PCFC as a guarantor thereunder.In addition, immediately prior to the transfer of Thunder FZE to the Company, the Company became aborrower and guarantor under the Amended and Restated Credit Facility. On March 29, 2007, theoutstanding borrowings of DPA were transferred to DP World UAE Region FZE and DP World UAEassumed all the obligations of DPA as a borrower under the Amended and Restated Credit Facility.
On October 29, 2007, we repaid in full the amounts outstanding under the Amended and Restated CreditFacility with $1.3 billion in borrowings under a new unsecured syndicated loan facility, dated October 22,2007 (the ‘‘Syndicated Loan Facility’’), among the Company, DP World Holdings (Australia) Limited andP&O, as borrowers, the Company, as the sole guarantor, the lenders from time to time party thereto,Barclays Capital, Citibank N.A., Deutsche Bank AG, London Branch, and The Royal Bank of ScotlandPlc, as mandated lead arrangers, The Royal Bank of Scotland Plc, as issuing bank, and Deutsche BankLuxembourg S.A., as Facility Agent.
For a description of the Syndicated Loan Facility, including the undertakings and covenants includedtherein, see ‘‘Management’s Discussion and Analysis of Financial Condition and Results of Operations—Liquidity and Capital Resources—Working Capital and Indebtedness—Revolving Credit SyndicatedFacility’’.
vi
www.global-reports.com
26SEP200717171345
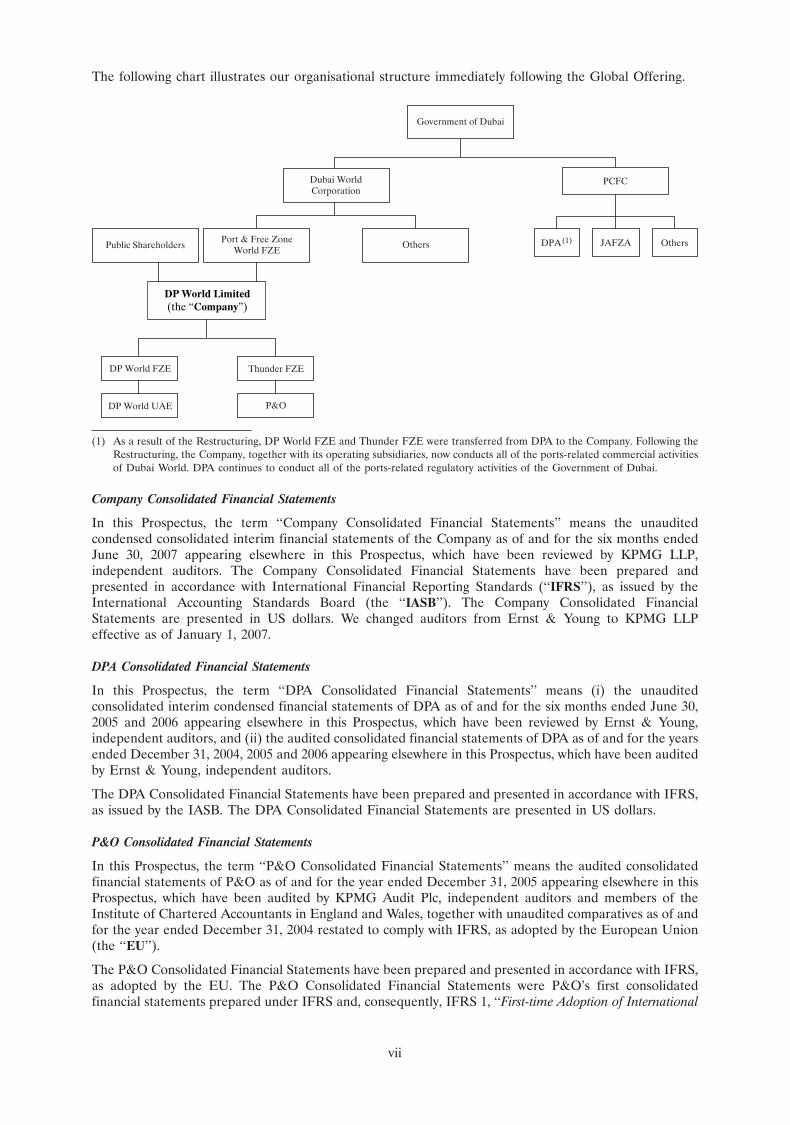
The following chart illustrates our organisational structure immediately following the Global Offering.
DP World Limited(the “Company”)
Port & Free ZoneWorld FZEPublic Shareholders Others
Dubai WorldCorporation
DPA(1) Others
PCFC
JAFZA
Government of Dubai
Thunder FZE
P&O
DP World FZE
DP World UAE
(1) As a result of the Restructuring, DP World FZE and Thunder FZE were transferred from DPA to the Company. Following theRestructuring, the Company, together with its operating subsidiaries, now conducts all of the ports-related commercial activitiesof Dubai World. DPA continues to conduct all of the ports-related regulatory activities of the Government of Dubai.
Company Consolidated Financial Statements
In this Prospectus, the term ‘‘Company Consolidated Financial Statements’’ means the unauditedcondensed consolidated interim financial statements of the Company as of and for the six months endedJune 30, 2007 appearing elsewhere in this Prospectus, which have been reviewed by KPMG LLP,independent auditors. The Company Consolidated Financial Statements have been prepared andpresented in accordance with International Financial Reporting Standards (‘‘IFRS’’), as issued by theInternational Accounting Standards Board (the ‘‘IASB’’). The Company Consolidated FinancialStatements are presented in US dollars. We changed auditors from Ernst & Young to KPMG LLPeffective as of January 1, 2007.
DPA Consolidated Financial Statements
In this Prospectus, the term ‘‘DPA Consolidated Financial Statements’’ means (i) the unauditedconsolidated interim condensed financial statements of DPA as of and for the six months ended June 30,2005 and 2006 appearing elsewhere in this Prospectus, which have been reviewed by Ernst & Young,independent auditors, and (ii) the audited consolidated financial statements of DPA as of and for the yearsended December 31, 2004, 2005 and 2006 appearing elsewhere in this Prospectus, which have been auditedby Ernst & Young, independent auditors.
The DPA Consolidated Financial Statements have been prepared and presented in accordance with IFRS,as issued by the IASB. The DPA Consolidated Financial Statements are presented in US dollars.
P&O Consolidated Financial Statements
In this Prospectus, the term ‘‘P&O Consolidated Financial Statements’’ means the audited consolidatedfinancial statements of P&O as of and for the year ended December 31, 2005 appearing elsewhere in thisProspectus, which have been audited by KPMG Audit Plc, independent auditors and members of theInstitute of Chartered Accountants in England and Wales, together with unaudited comparatives as of andfor the year ended December 31, 2004 restated to comply with IFRS, as adopted by the European Union(the ‘‘EU’’).
The P&O Consolidated Financial Statements have been prepared and presented in accordance with IFRS,as adopted by the EU. The P&O Consolidated Financial Statements were P&O’s first consolidatedfinancial statements prepared under IFRS and, consequently, IFRS 1, ‘‘First-time Adoption of International
vii
Financial Reporting Standards’’, was applied. For additional information on the transition to IFRS, seeNote 1, ‘‘Significant accounting policies—Transitional arrangements’’, of the Notes to the P&OConsolidated Financial Statements.
The P&O Consolidated Financial Statements are presented in Pounds Sterling. This Prospectus containshistorical data with respect to the high, low, average and period end noon buying rates for certain periodsin New York for cable transfers payable in Pounds Sterling as certified by the Federal Reserve Bank ofNew York for customs purposes. See ‘‘Exchange Rate Information’’. On November 20, 2007, the noonbuying rate in New York for cable transfers payable in Pounds Sterling as certified by the Federal ReserveBank of New York for customs purposes was $2.07 per £1.00. The inclusion of these exchange rates in thisProspectus is for illustrative purposes only, and does not mean that any amounts reported herein actuallyrepresent a specific amount in another currency or that any such amounts could have been converted atany particular rate, if at all.
Comparability of Historical Financial Information
The comparability of the historical financial information of DPA has been significantly affected by ouracquisitions of CSX World Terminals (‘‘CSX WT’’) in February 2005 and P&O in March 2006. Similarly,our historical and future results of operations are not and will not be directly comparable to the historicalfinancial information of DPA principally because the DPA Consolidated Financial Statements include thefinancial results of P&O for the period from March 9, 2006, the first day following our acquisition of P&O,through December 31, 2006 only, but also because the DPA Consolidated Financial Statements include thefinancial results of the regulatory activities of DPA. In addition, the DPA Consolidated FinancialStatements as of and for the six months ended June 30, 2006 and the year ended December 31, 2006 andthe Company Consolidated Financial Statements as of and for the six months ended June 30, 2007 includethe financial results of (i) P&O’s UK ferry operating business (‘‘P&O Ferries’’) and its European roadhaulage and freight management business (‘‘P&O Ferrymasters’’ and, together with P&O Ferries, the‘‘P&O Ferries Business’’) and (ii) POPNA and P&O’s property development businesses (‘‘P&O Estates’’).
The DPA Consolidated Financial Statements as of and for the six months ended June 30, 2006 reflect(i) the P&O Ferries Business and P&O Estates as continuing operations and not assets held for salebecause the decision to transfer these businesses was not taken until after June 30, 2006 and (ii) POPNA asassets held for sale and discontinued operations. The DPA Consolidated Financial Statements as of and forthe year ended December 31, 2006 reflect (i) the P&O Ferries Business as continuing operations and notassets held for sale because the decision to transfer this business was not taken until after December 31,2006 and (ii) POPNA and P&O Estates as assets held for sale and discontinued operations. The CompanyConsolidated Financial Statements reflect (i) P&O Estates as assets held for sale and discontinuedoperations and (ii) the P&O Ferries Business and POPNA as discontinued operations.
Unaudited Pro Forma Consolidated Financial Information
In this Prospectus, the term ‘‘Unaudited Pro Forma Consolidated Financial Information’’ means theunaudited pro forma consolidated statements of income of the Company for the year ended December 31,2006 and the six months ended June 30, 2007 and the unaudited pro forma consolidated balance sheet ofthe Company as of June 30, 2007. The unaudited pro forma consolidated statement of income of theCompany for the year ended December 31, 2006 is based on the audited consolidated statement of incomeof DPA for the year ended December 31, 2006 included in the DPA Consolidated Financial Statementsappearing elsewhere in this Prospectus. The unaudited pro forma consolidated statement of income of theCompany for the six months ended June 30, 2007 is based on the unaudited condensed consolidatedinterim income statement of the Company for the six months ended June 30, 2007 included in theCompany Consolidated Financial Statements appearing elsewhere in this Prospectus. The unaudited proforma consolidated balance sheet of the Company as of June 30, 2007 is based on the unaudited condensedconsolidated interim balance sheet of the Company as of June 30, 2007 included in the CompanyConsolidated Financial Statements appearing elsewhere in this Prospectus. The Unaudited Pro FormaConsolidated Financial Information is presented in US dollars.
The unaudited pro forma consolidated statement of income of the Company for the year endedDecember 31, 2006 has been prepared for illustrative purposes only to show the effect of (i) the acquisitionof P&O; (ii) the disposal of POPNA, two container terminals in Shekou, China (the ‘‘Shekou Terminals’’)and one container terminal in Colombo, Sri Lanka (the ‘‘Colombo Terminal’’) and the transfer to affiliatesof the Company of the P&O Ferries Business and of P&O Estates; (iii) the effective commencement of the
viii
www.global-reports.com
Concession Agreement and (iv) the sale of 50% of the group of companies known as P&O Trans Australia(‘‘POTA’’), which operates a landside logistics business in Australia, and 75% of the business known asP&O Automotive and General Stevedoring (‘‘P&O AGS’’), which was previously part of DP WorldAustralia Limited and operates automotive and general stevedoring businesses in Australia, as if suchevents had occurred on January 1, 2006.
The unaudited pro forma consolidated statement of income of the Company for the six months endedJune 30, 2007 has been prepared for illustrative purposes only to show the effect of (i) the disposal ofPOPNA, the Shekou Terminals and the Colombo Terminal and the transfer to affiliates of the Company ofthe P&O Ferries Business and of P&O Estates and (ii) the sale of portions of POTA and P&O AGS as ifsuch events had occurred on January 1, 2007.
The unaudited pro forma consolidated balance sheet of the Company as of June 30, 2007 has beenprepared for illustrative purposes only to show the effect of (i) the transfer to affiliates of the Company ofthe P&O Ferries Business and of P&O Estates; (ii) the issuance of $1,750,000,000 aggregate principalamount of 6.85 per cent. Notes due 2037 (the ‘‘Senior Notes’’) and $1,500,000,000 face amount of TrustCertificates due 2017 (the ‘‘Certificates’’) and the repayment of $3.2 billion under the Amended &Restated Credit Facility with the net proceeds from such issuances and (iii) the payment of $2.0 billion ofthe Intercompany Payable in cash, the conversion of $2.0 billion of the Intercompany Payable intoShareholder’s reserve and the conversion of the remaining $4.1 billion of the Intercompany Payable intoShare capital.
The Unaudited Pro Forma Consolidated Financial Information, because of its nature, addresses ahypothetical situation and, therefore, does not represent our actual financial position or results had thetransactions described therein been completed at the dates assumed or any other date and should not beregarded as an indication of the operating results generated by us or of our future financial position.
The Unaudited Pro Forma Consolidated Financial Information for the year ended December 31, 2006 hasbeen prepared on a basis consistent with the accounting policies of DPA as of and for the year endedDecember 31, 2006 as set out in Note 2.3, ‘‘Summary of Significant Accounting Policies’’, of the Notes tothe DPA Consolidated Financial Statements as of and for the years ended December 31, 2005 and 2006.The Unaudited Pro Forma Consolidated Financial Information as of and for the six months endedJune 30, 2007 has been prepared on a basis consistent with the accounting policies of the Company as ofand for the six months ended June 30, 2007 as set out in Note 3, ‘‘Significant accounting policies’’, of theNotes to the Company Consolidated Financial Statements as of and for the six months ended June 30,2007.
Operational Data
Certain volume figures in this Prospectus are expressed in ‘‘TEUs’’. A TEU is a twenty-foot equivalent unitthat is based on the dimensions of a cargo container 20 feet long by 8 feet wide by 8 feet 6 inches high, witha maximum load of 24 tonnes.
‘‘Throughput’’ is a measure of container handling activity. The two main categories of containerthroughput are origin and destination (‘‘O&D’’), which is also often referred to as import and export, andtranshipment. Every container shipped by sea is by definition an export container at the originationterminal and an import container at the destination terminal. A container that is transferred from one shipto another at some point during the journey is said to be transhipped, which gives rise to transhipmentthroughput at an intermediate terminal somewhere between the load terminal and the discharge terminal.Throughput includes the handling of imports, exports, empty containers and transhipments.
‘‘Gross throughput’’ refers to the total amount of throughput that a container terminal in our portfoliohandled over a period of time, regardless of our economic interest in such terminal or whether we heldsuch terminal for the entirety of such period. ‘‘Equity-adjusted throughput’’ is determined by multiplyingthe gross throughput of a particular container terminal by our economic interest in such terminal as ofDecember 31, 2006.
‘‘Capacity’’ refers to the theoretical amount of throughput that a container terminal could handle in a yearand is generally based on the size of the terminal’s container stacking area and the capacity of its quay,which in turn is based on the length of the quay and the capacity of the ship-to-shore cranes that areavailable.
ix
‘‘Gross capacity’’ refers to the capacity of a container terminal in our portfolio, regardless of our economicinterest in such terminal.
‘‘Revenue generating volume’’ is a measure of all movements of containers at a container terminal thatgenerate revenue. Descriptions of changes in revenue generating volume at a particular terminal or groupof terminals are presented based on the actual levels of revenue generating volume at such terminal orgroup of terminals, irrespective of changes in our ownership interest (including the acquisition thereof)therein during the period under review.
Unless otherwise stated, descriptions of our terminal portfolio, including aggregate throughput andcapacity figures, are based on its composition as of the date hereof and exclude the impact of the disposalof certain terminal operations, comprising the six container terminals operated by POPNA, the twoShekou Terminals and the one Colombo Terminal.
Following the Global Offering, for commercial reasons, we do not intend to continue to provideoperational data regarding our terminal portfolio with the same level of specificity as that set forth in thisProspectus. In particular, we do not intend to update the operational data that we have provided in thisProspectus on a terminal-by-terminal basis in the future. See ‘‘Risk Factors—Risks Related to the Shares—The market price of the Shares may be volatile, which could cause the value of your investment to decline’’.
General
In this Prospectus, unless otherwise specified or the context otherwise requires, references to ‘‘$’’, ‘‘US$’’,‘‘USD’’ and ‘‘dollars’’ are to US dollars, references to ‘‘dirham’’ and ‘‘AED’’ are to UAE dirham andreferences to ‘‘£’’, ‘‘Pounds Sterling’’ and ‘‘Sterling’’ are to the currency of the United Kingdom.
Certain financial and operating information contained in this Prospectus has been derived from unauditedmanagement accounts prepared by us.
NON-IFRS MEASURES
Earnings before interest, taxes, depreciation and amortisation (‘‘EBITDA’’), a measure used bymanagement to measure operating performance, is defined as profit after tax from continuing operationsplus finance costs (net of finance income), income tax, depreciation and amortisation. ‘‘Adjusted EBITDA’’is defined as EBITDA further adjusted to remove the impact of separately disclosable items. See Note 7,‘‘Separately Disclosable Items’’, of the Notes to the DPA Consolidated Financial Statements as of and forthe years ended December 31, 2005 and 2006, Note 3, ‘‘Separately Disclosable Items’’, of the Notes to theDPA Consolidated Financial Statements as of and for the six months ended June 30, 2006, Note 4,‘‘Separately disclosable items’’, of the Notes to the Company Consolidated Financial Statements as of andfor the six months ended June 30, 2007 and Note 4, ‘‘Separately disclosable items’’, of the Notes to theP&O Consolidated Financial Statements for further information. EBITDA and Adjusted EBITDA are notrecognised terms under IFRS or US generally accepted accounting principles (‘‘US GAAP’’) and do notpurport to be alternatives to profit after tax from continuing operations as measures of operatingperformance or to cash flows from operating activities as measures of liquidity. Additionally, EBITDA andAdjusted EBITDA are not intended to be measures of free cash flow available for management’sdiscretionary use, as they do not consider certain cash requirements such as interest payments, taxpayments and debt service requirements. Management believes that EBITDA and Adjusted EBITDA arehelpful in highlighting trends because they exclude the results of decisions that are outside the control ofoperating management and can differ significantly from company to company depending on long-termstrategic decisions regarding capital structure, the tax jurisdictions in which companies operate and capitalinvestments. Management uses EBITDA and Adjusted EBITDA to supplement IFRS results to provide amore complete understanding of the factors and trends affecting the business than IFRS results alone.Because not all companies use identical calculations, these presentations of EBITDA and AdjustedEBITDA may not be comparable to other similarly titled measures used by other companies.
x
www.global-reports.com
PRESENTATION OF MARKET, MARKET SHARE AND INDUSTRY DATA
The market, market share and industry data contained in this Prospectus has been taken from industryreports. In particular, information and data relating to the international container shipping industry has beenderived from reports, databases and other sources made available in the public domain by, among others,Drewry Shipping Consultants Ltd (‘‘Drewry’’). We confirm that this information has been accuratelyreproduced and, so far as we are aware and have been able to ascertain from that published information,no facts have been omitted which would render the reproduced information inaccurate or misleading.However, the accuracy of such information is subject to the availability and reliability of the datasupporting such information and neither the published information nor the underlying data has beenindependently verified. In addition, the methodology of Drewry and of other industry sources for collectinginformation and data, and therefore the reported information, may differ from that used by us to compileour operational data and from the methodologies employed by other sources, and does not reflect all oreven necessarily a comprehensive set of the actual transactions occurring in the container shippingindustry. Drewry has made no representation, express or implied, and has not accepted any responsibility,with respect to the accuracy or completeness of any of the information in this Prospectus.
AVAILABLE INFORMATION
We have agreed that, for so long as any of the Shares are ‘‘restricted securities’’ as defined inRule 144(a)(3) under the Securities Act, we will during any period that we are neither subject to Section 13or 15(d) of the US Securities and Exchange Act of 1934, as amended (the ‘‘Exchange Act’’), nor exemptfrom reporting pursuant to Rule 12g3-2(b) thereunder furnish, upon request, to any holder or beneficialowner of the Shares or any prospective purchaser designated by any such holder or beneficial owner, theinformation required to be delivered pursuant to Rule 144A(d)(4) under the Securities Act.
xi

(This page has been left blank intentionally.)
www.global-reports.com
SUMMARY
This summary should be read as an introduction to, and is qualified in its entirety by reference to, the moreextensive information contained elsewhere in this Prospectus. This summary may not contain all of theinformation that prospective investors should consider before deciding to invest in the Shares and any suchdecision should be based on a consideration of this Prospectus as a whole. You should read this entireProspectus carefully, including the financial statements and related notes.
Overview
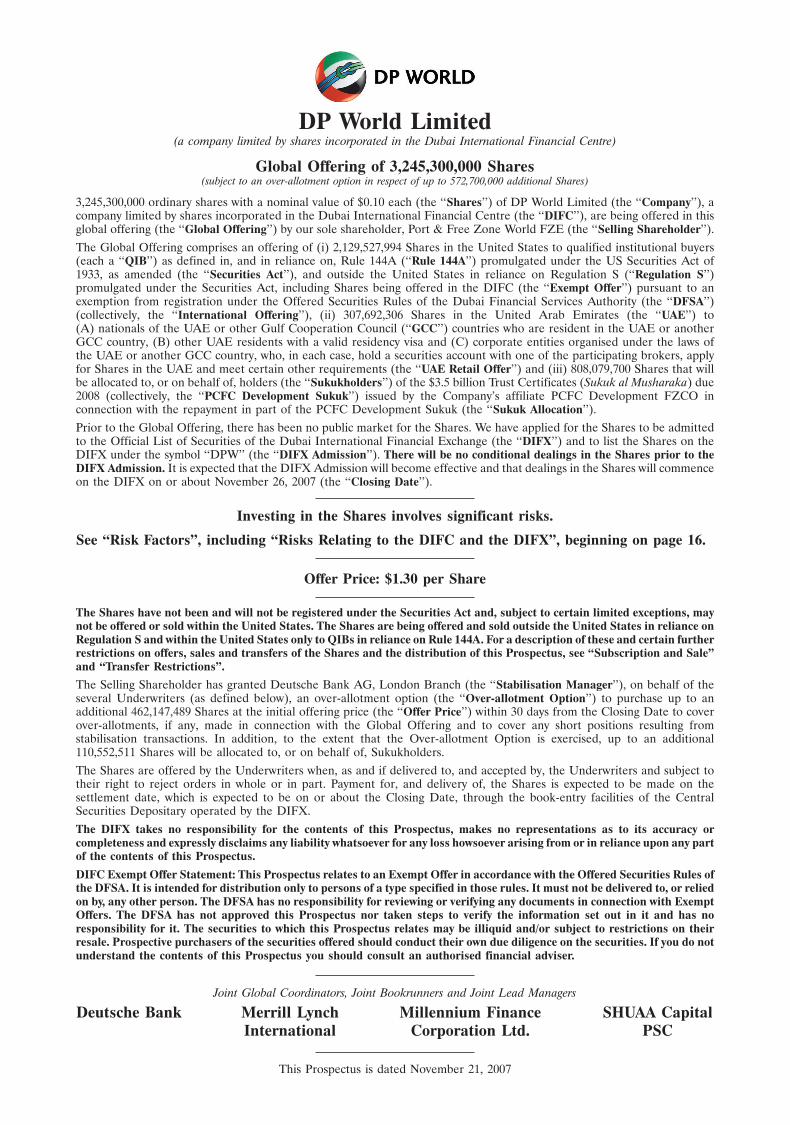
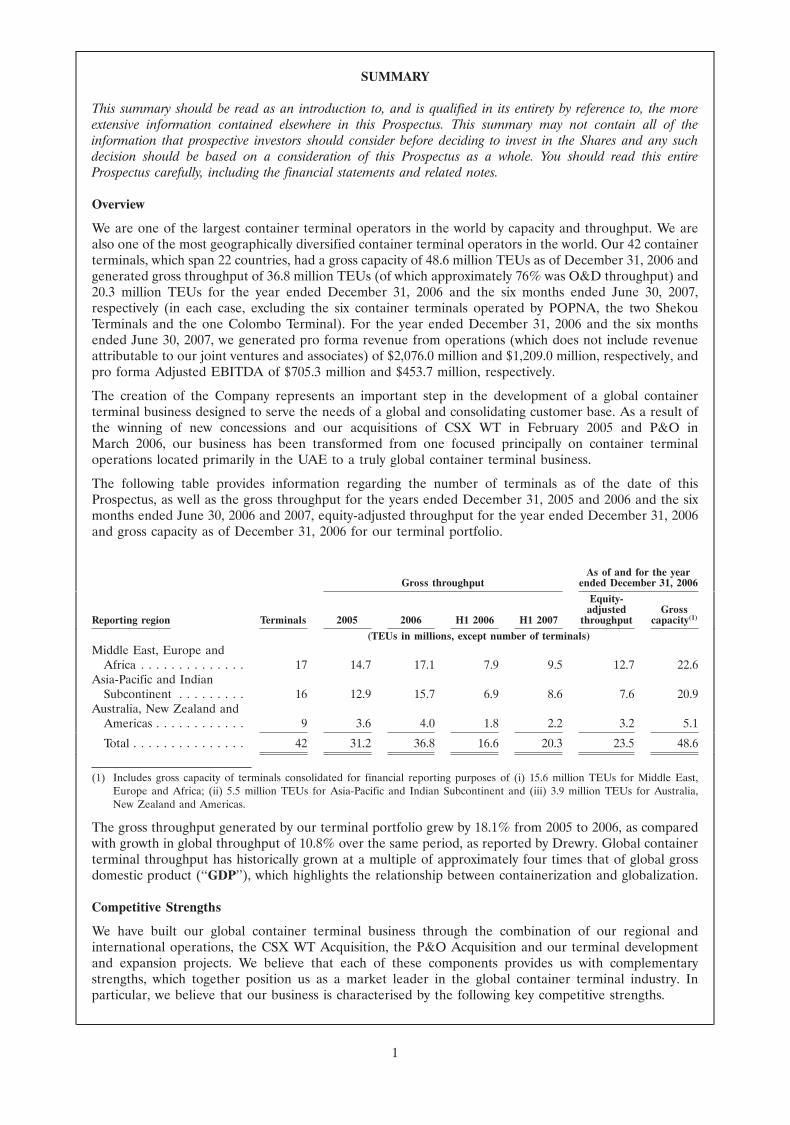
We are one of the largest container terminal operators in the world by capacity and throughput. We arealso one of the most geographically diversified container terminal operators in the world. Our 42 containerterminals, which span 22 countries, had a gross capacity of 48.6 million TEUs as of December 31, 2006 andgenerated gross throughput of 36.8 million TEUs (of which approximately 76% was O&D throughput) and20.3 million TEUs for the year ended December 31, 2006 and the six months ended June 30, 2007,respectively (in each case, excluding the six container terminals operated by POPNA, the two ShekouTerminals and the one Colombo Terminal). For the year ended December 31, 2006 and the six monthsended June 30, 2007, we generated pro forma revenue from operations (which does not include revenueattributable to our joint ventures and associates) of $2,076.0 million and $1,209.0 million, respectively, andpro forma Adjusted EBITDA of $705.3 million and $453.7 million, respectively.
The creation of the Company represents an important step in the development of a global containerterminal business designed to serve the needs of a global and consolidating customer base. As a result ofthe winning of new concessions and our acquisitions of CSX WT in February 2005 and P&O inMarch 2006, our business has been transformed from one focused principally on container terminaloperations located primarily in the UAE to a truly global container terminal business.
The following table provides information regarding the number of terminals as of the date of thisProspectus, as well as the gross throughput for the years ended December 31, 2005 and 2006 and the sixmonths ended June 30, 2006 and 2007, equity-adjusted throughput for the year ended December 31, 2006and gross capacity as of December 31, 2006 for our terminal portfolio.
As of and for the yearended December 31, 2006Gross throughput
Equity-adjusted Gross
Reporting region Terminals 2005 2006 H1 2006 H1 2007 throughput capacity(1)
(TEUs in millions, except number of terminals)Middle East, Europe and
Africa . . . . . . . . . . . . . . 17 14.7 17.1 7.9 9.5 12.7 22.6Asia-Pacific and Indian
Subcontinent . . . . . . . . . 16 12.9 15.7 6.9 8.6 7.6 20.9Australia, New Zealand and
Americas . . . . . . . . . . . . 9 3.6 4.0 1.8 2.2 3.2 5.1
Total . . . . . . . . . . . . . . . 42 31.2 36.8 16.6 20.3 23.5 48.6
(1) Includes gross capacity of terminals consolidated for financial reporting purposes of (i) 15.6 million TEUs for Middle East,Europe and Africa; (ii) 5.5 million TEUs for Asia-Pacific and Indian Subcontinent and (iii) 3.9 million TEUs for Australia,New Zealand and Americas.
The gross throughput generated by our terminal portfolio grew by 18.1% from 2005 to 2006, as comparedwith growth in global throughput of 10.8% over the same period, as reported by Drewry. Global containerterminal throughput has historically grown at a multiple of approximately four times that of global grossdomestic product (‘‘GDP’’), which highlights the relationship between containerization and globalization.
Competitive Strengths
We have built our global container terminal business through the combination of our regional andinternational operations, the CSX WT Acquisition, the P&O Acquisition and our terminal developmentand expansion projects. We believe that each of these components provides us with complementarystrengths, which together position us as a market leader in the global container terminal industry. Inparticular, we believe that our business is characterised by the following key competitive strengths.
1
A Globally Diversified, Market-Leading and Balanced Portfolio of Terminals
With 42 terminals in 22 countries, we believe that we have the most geographically diversified portfolio ofterminals in the industry and that the size and diversity of our portfolio gives us a competitive advantageover smaller and more concentrated operators because of the relatively high barriers to entry thatcharacterise the container terminal industry. Our asset base includes a diverse mixture of both establishedand newer terminals and a significant number of greenfield and brownfield projects that we are in theprocess of developing. We believe that this combination of development sites and fully operating facilitiesis key to facilitating our future growth strategies and that our portfolio allows us to take advantage of thetypically stable returns on equity in lower-risk established markets such as Europe and Australia and thepotential for greater returns on equity in higher-risk emerging markets such as Latin America and Africa,which have experienced high growth in recent years. In addition, we believe that our portfolio, which isdiversified within the regions in which we operate, should help to mitigate any region-specific downturns.
Strong Pipeline of New Projects and Additional Growth Potential
We have extensive experience in developing terminal operations around the globe, including byconstructing new terminals on both greenfield sites and brownfield sites as a result of concession wins. Wehave a strong track record of winning concessions globally based on our customer and business partnerrelationships, operating and technical credentials, willingness to invest in new capacity to meet demandand focus on key governmental issues, such as security and sustainability. Consequently, we believe that wewill win, on financial terms that we consider to be attractive, the majority of the concessions that weactively pursue and where we submit a bid.
Our new projects currently in development include a total of 13 terminal development projects and10 terminal expansion projects, which, subject to various final regulatory approvals in some cases, areexpected to become operational at various times over the next 10 years and to add 27.7 million TEUs and10.2 million TEUs, respectively, of gross capacity to our portfolio, based on anticipated capacity as ofcompletion, of which we expect 9.8 million TEUs and 9.2 million TEUs, respectively, will be operational bythe end of 2010. In addition, we commenced operations at the first phase of the expansion project at DPWorld Jebel Ali and the Phase III(b) expansion project at Qingdao Qianwan Container Terminal earlierthis year, which together added 4.0 million TEUs of gross capacity to our portfolio. We anticipate that14.5 million TEUs and 4.8 million TEUs of the expected additional gross capacity to be provided by ourterminal development projects and terminal expansion projects, respectively, will be provided by projectsthat we expect will be consolidated for financial reporting purposes, of which we expect 6.2 million TEUsand 4.0 million TEUs, respectively, will be operational by the end of 2010. We also have a pipeline ofpotential projects in various stages of review, and continue to look for innovative opportunities for theownership and management of terminal and terminal-related assets both inside and outside of ports.
Strong Relationships with Key Customers
We maintain a diverse customer base and enjoy close and long-standing relationships with our keycustomers, who are, for the most part, leaders in the global shipping industry. We believe that we havebeen successful in attracting and maintaining key customers as a result of our strong reputation in theindustry, continued achievement of operational excellence and the diversification of our global portfolio,each of which helps our customers succeed in their businesses. For example, seven of our current top tenglobal customers were also our customers ten years ago. We target key customers and seek to buildstrategic relationships based on an internal programme of customer segmentation, which we believe isunique to our industry. Through this programme, we seek to identify key commercial relationships byconsidering a number of different factors that we believe will assist us in evaluating our customers anddetermining how we can best serve them in the future.
Strategic Relationships with Dubai World and its Affiliates
As a majority-owned indirect subsidiary of Dubai World, a holding company owned by the Government ofDubai, following the Global Offering we expect to continue to benefit from the commitment of DubaiWorld to promote Dubai and its portfolio of businesses and projects both domestically and internationally.In addition, we have in the past benefited from and expect to continue to leverage relationships withaffiliates that engage in complementary businesses, which we believe allows us to offer a combination ofservices that is unique in the container terminal industry and provides us with an advantage over ourcompetitors.
2
www.global-reports.com
Operational Excellence and Innovation
We are one of the innovators in the container terminal industry and have been successful in developing andenhancing container terminal capacity and efficiency in the regions in which we operate based on the needsand attributes of particular terminals. In 2007, our international achievements were recognised by ourwinning Best Seaport in the Middle East for DP World Jebel Ali for the 13th year in a row and Best ContainerTerminal in Asia under 4 million TEUs per annum for CT3 (Hong Kong) at the Asian Freight & SupplyChain Awards. We also won various awards in 2006, including the Lloyd’s List’s Port Operator of the YearAward. Our commitment to operational excellence is reflected in the increase in our average global craneproductivity from approximately 25 gross moves per hour for the year ended December 31, 2005 toapproximately 27 gross moves per hour for the year ended December 31, 2006. This increase in ouraverage global crane productivity is made possible not only through the implementation of newtechnologies but also by significant improvements in operating efficiency that we have been able to makeat existing terminals, as well as at new terminals constructed on greenfield sites.
Experienced and International Management Team
Our global business is run out of our head office in Dubai by the 11 members of our executivemanagement team, who have significant industry experience, and some of whom also have experience inthe container shipping industry. In addition, our local operations are managed by eight regional managers,who also have significant experience in the container terminal industry and extensive local and regionalknowledge, and are supported by a highly experienced team of local container terminal managers.
Our Vision and Mission
Our vision is to be the ‘‘Port of Choice’’ for our customers in each of our locations, to excel in operations,sales and customer service to our clients and to enhance the position of the local communities andcountries in which we operate as gateways for global trade. Our mission is to provide world-class portservices and to be a global player in operating and managing ports. We aim to provide value-for-money,high quality services to our customers through motivated and innovative employees who are empowered tomake optimum use of modern facilities, technology and resources while ensuring a reasonable return oninvestment.
Corporate Strategy
We have historically grown our business through a combination of organic growth and corporateacquisitions, which have helped to establish our global footprint and fundamentally change thecomposition and dynamics of our industry. Going forward, we have a strong pipeline of new terminaldevelopment projects, which are expected to add 27.7 million TEUs of gross capacity to our portfolio overthe next 10 years, based on anticipated capacity as of completion. We will adopt a selective approachtowards future acquisition opportunities. The following strategic principles have therefore been developedto aid our objectives, with a focus on people, customers, quality and global reach.
Optimise Existing Asset Base and Current Capacity
We believe that operational excellence and innovation create opportunities to generate additional valueout of our existing facilities. We seek to improve our operational efficiency and increase the capacity of ourexisting facilities by investing in advanced handling equipment and streamlining our operational processes.We believe that this strategy is one of the most cost-effective methods for increasing capacity at ourexisting facilities. In addition, we continually communicate with our customers and essential stakeholdersin the port and shipping community to maximise the connectivity, responsiveness, accuracy and speed thatwe are able to offer.
Maximise Customer Satisfaction with Innovative and Tailored Solutions
Providing our global customers and their customers with value enhancing port and logistics solutions is acornerstone of our operating strategy. We seek to sustain our consultative approach to customerrelationship management to ensure we invest in facilities around the globe where our services are required.We employ a proactive management process that focuses on the key elements of connectivity, informationsharing and security, which can provide strategic solutions in inventory and cost control in the global supplychain. We believe that the reliability and efficiency of our operations and information flow will enhanceour customers’ competitive edge.
3
22SEP200718423235
Enhance Relationships with Sector Participants
We continually evaluate our relationships with both current and potential future partners and stakeholdersto ensure that we stay at the forefront of our industry, seizing the most attractive commercial opportunitiesby involving the relevant stakeholders from the outset. We believe that our credentials as one of theworld’s largest container terminal operators make us a natural partner of choice, and we seek to enhancethis perception across the globe. In addition, we believe that leveraging our relationships with our affiliateswithin Dubai World as we explore new opportunities will ultimately transform the local economies of thecountries in which we operate and consequently enhance the value proposition for our business.
Deploy Capital for Sustained Growth, Profitability and Market Leadership
We intend to pursue investment opportunities based on our assessment of their potential for valuecreation, growth and sustained profitability. We continue to ensure that our assessment of potentialinvestment opportunities is performed on a risk-adjusted basis, such that any capital deployed in morevolatile markets is accompanied by a commensurate increase in the expected return. Within thisframework, we emphasise operational control of new projects while ensuring that we have the mostappropriate partners on board where required. We seek to position ourselves to react to changes in bothour and our customers’ industries to ensure that we remain the port operator of choice.
Create a Place of Great Opportunity and Professional Enhancement for Employees
We believe that our achievement of operational excellence and innovation depends on the abilities,creativity and dedication of our employees. By implementing policies that allow us to be a good employerand good corporate citizen, we seek to create a culture of global excellence that will define ourorganisation and the container terminal industry. We plan to continue to invest in the personaldevelopment of our employees to ensure that we attract and retain the most experienced, motivated andknowledgeable workforce.
Organisational, Reporting and Operational Structure
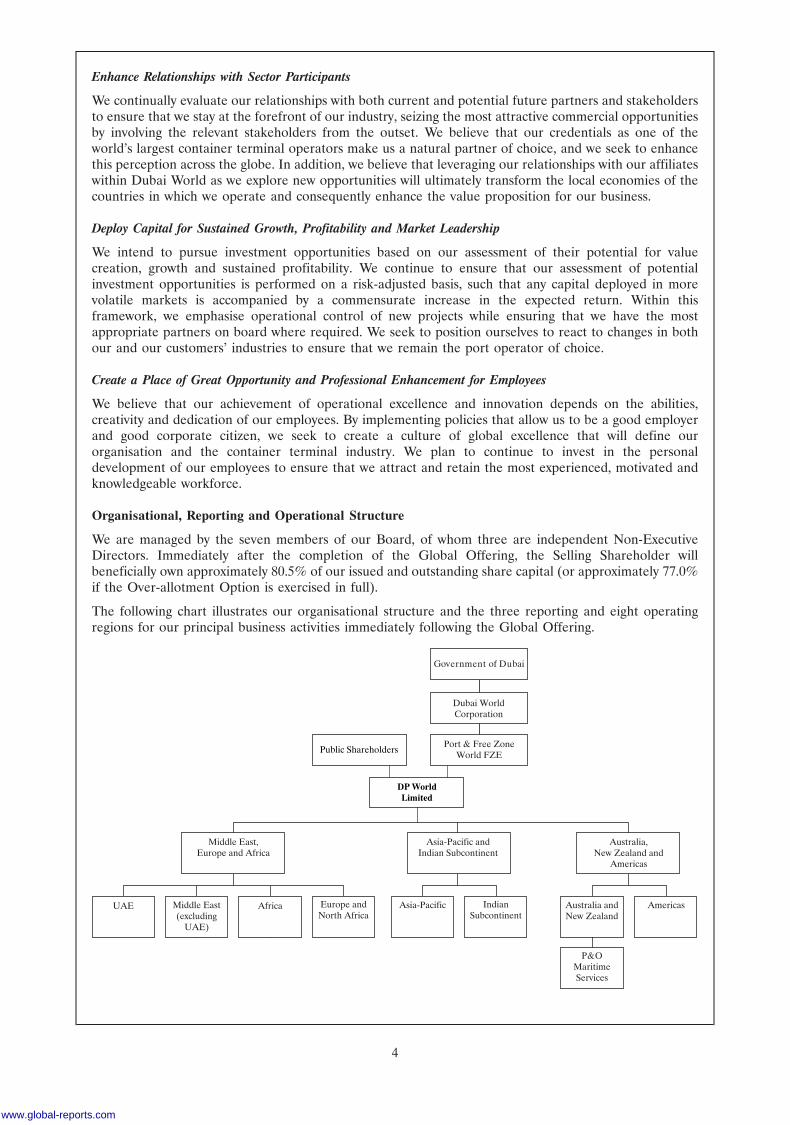
We are managed by the seven members of our Board, of whom three are independent Non-ExecutiveDirectors. Immediately after the completion of the Global Offering, the Selling Shareholder willbeneficially own approximately 80.5% of our issued and outstanding share capital (or approximately 77.0%if the Over-allotment Option is exercised in full).
The following chart illustrates our organisational structure and the three reporting and eight operatingregions for our principal business activities immediately following the Global Offering.
DP WorldLimited
Port & Free ZoneWorld FZE
Dubai WorldCorporation
Government of Dubai
Middle East,Europe and Africa
Asia-Pacific andIndian Subcontinent
Australia,New Zealand and
Americas
UAE Middle East(excluding
UAE)
Europe andNorth Africa
IndianSubcontinent
Asia-PacificAfrica Americas
P&OMaritimeServices
Australia andNew Zealand
Public Shareholders
4
www.global-reports.com
Risk Factors
An investment in the Shares involves significant risks, including: (i) risks relating to the newly-establishedand largely untested nature of the DIFC and the DIFX; (ii) risks relating to the Company, such as risksassociated with the transformative nature of our recent acquisitions, the capital and other requirements ofour development projects and our reliance on joint ventures; (iii) risks relating to our ports business, suchas risks associated with the high level of competition that we face in the container terminal industry forconcessions and an increasingly consolidated customer base, as well as risks relating to the political,regulatory, economic and social environments of the regions and countries in which we operate; and(iv) risks relating to the Shares, such as illiquidity, the control that Dubai World will retain over usfollowing the Global Offering and fluctuations in securities markets and the market price of the Shares.
Recent Developments
On October 30, 2007, we entered into an agreement to acquire a 90% stake in Egyptian ContainerHandling Co., which owns Sokhna Port Development Company (‘‘SPDC’’), for consideration ofapproximately $670 million. SPDC operates Sokhna Port in Egypt (‘‘Sokhna’’) under a concessionagreement that expires in 2027. Sokhna is located on the Red Sea coast within the North West SuezEconomic Zone and is the closest container port to Cairo, Egypt. Sokhna is currently expanding capacityand we expect that it will have capacity of approximately 1.2 million TEUs by the end of 2009. We believethat Sokhna will be an important addition to our existing Red Sea operations at Jeddah South ContainerTerminal and Port Autonome International de Djibouti. The transaction is subject to our receipt of certainregulatory approvals and is expected to be completed before the end of 2007.
Our principal executive offices are located at LOB 17, Jebel Ali Free Zone, Dubai, UAE. Our registeredoffice is PO Box 17000, Dubai, UAE. Our telephone number is +971 4 881 1110. Our website address iswww.dpworld.com. The information contained on our website is not incorporated by reference into, orotherwise included in, this Prospectus.
5
THE GLOBAL OFFERING
Company . . . . . . . . . . . . . . . . . DP World Limited.
The Selling Shareholder . . . . . . Port & Free Zone World FZE, a free zone establishment formed andregistered under the laws promulgated by JAFZA, currently holds100% of our issued and outstanding share capital. Immediatelyfollowing completion of the Global Offering, the Selling Shareholderwill own approximately 80.5% of our issued and outstanding sharecapital (or approximately 77.0% assuming the Over-allotment Optionis exercised in full). See ‘‘Principal and Selling Shareholder’’.
Global Offering . . . . . . . . . . . . 3,245,300,000 Shares are being offered in the Global Offering by theSelling Shareholder. The Global Offering comprises the InternationalOffering (which includes the Exempt Offer), the UAE Retail Offerand the Sukuk Allocation. The Shares are being offered outside theUnited States in reliance on Regulation S and within the UnitedStates only to QIBs in reliance on Rule 144A. The Exempt Offer isbeing made in the DIFC pursuant to an exemption from registrationunder the Offered Securities Rules of the DFSA.
International Offering . . . . . . 2,129,527,994 Shares are being offered in the International Offering(i) outside the United States in reliance on Regulation S, includingShares being offered in the Exempt Offer in the DIFC pursuant to anexemption from registration under the Offered Securities Rules of theDFSA, and (ii) within the United States only to QIBs in reliance onRule 144A.
UAE Retail Offer . . . . . . . . . . 307,692,306 Shares are being offered in the UAE to (i) nationals ofthe UAE or other Gulf Cooperation Council (‘‘GCC’’) countries whoare resident in the UAE or another GCC country, (ii) other UAEresidents with a valid residency visa and (iii) corporate entitiesorganised under the laws of the UAE or another GCC country, who,in each case, hold a securities account with one of the brokersparticipating in the UAE Retail Offer, apply for Shares pursuant tothe UAE Retail Offer in the UAE and meet certain otherrequirements (‘‘Eligible Applicants’’). Pursuant to the terms of theUAE Retail Offer, applications under the UAE Retail Offer must besubmitted (together with all supporting documents) by EligibleApplicants in accordance with the terms and conditions governing theUAE Retail Offer no later than 12:00 p.m. (Dubai time) onNovember 15, 2007 (or such later time as we and the lead receivingbank for the UAE Retail Offer may decide).
Sukuk Allocation . . . . . . . . . . 808,079,700 Shares will be allocated to, or on behalf of, theSukukholders in connection with the redemption of the PCFCDevelopment Sukuk in accordance with its terms. See ‘‘Description ofthe PCFC Development FZCO Sukuk’’ for more information.
Shares . . . . . . . . . . . . . . . . . . . Conditional on, and with effect from, DIFX Admission, our sharecapital will consist of 16,600,000,000 ordinary shares, each with anominal value of $0.10, which are fully paid, issued and outstanding.The Shares have the rights described under ‘‘Description of ShareCapital’’.
Offer Price . . . . . . . . . . . . . . . . The Offer Price is $1.30 per Share.
Over-allotment Option . . . . . . . The Selling Shareholder has granted the Stabilisation Manager, onbehalf of the several Underwriters, the Over-allotment Optionpursuant to which the Stabilisation Manager may purchase up to anadditional 462,147,489 Shares at the initial offering price (the ‘‘OfferPrice’’) within 30 days from the Closing Date to cover over-allotments, if any, made in connection with the Global Offering and to
6
www.global-reports.com
cover any short positions resulting from stabilisation transactions. Inaddition, to the extent that the Over-allotment Option is exercised, upto an additional 110,552,511 Shares will be allocated to, or on behalfof, Sukukholders.
Payment and settlement . . . . . . Purchasers will be required to make payment for the Shares on thesettlement date, which is expected to be on or about the Closing Date.If the DIFX Admission does not take place, the Selling Shareholderhas undertaken to the Joint Global Coordinators and theUnderwriters to return promptly the gross proceeds, if any, paid to iton the Closing Date.
Payment for, and delivery of, the Shares is expected to be made on thesettlement date to the accounts of purchasers through the book-entryfacilities of the Central Securities Depositary (the ‘‘CSD’’) operatedby the DIFX. Trading of the Shares will take place through the tradingsystem of the DIFX. Shares may be held either in accounts openedwith the CSD by the holders thereof or through custodian omnibusaccounts and the ownership of the Shares will be evidenced by theholdings in such accounts. Clearing and settlement of trades on theDIFX by brokers or custodians may be performed only throughmembers of the DIFX that are authorised clearing members (the‘‘Clearing Members’’). Each Clearing Member must hold a securitiesaccount with the CSD and a cash account with a designatedsettlement bank for settlement purposes. Similarly, a custodian needsto hold an omnibus account with the CSD and a cash account with asettlement bank for settlement of off-exchange trades. Settlement ofsecurities trading on the DIFX is governed by the DIFX BusinessRules. See ‘‘Clearance and Settlement’’.
Closing Date . . . . . . . . . . . . . . November 26, 2007.
Restrictions on purchases andtransfers of Shares . . . . . . . . . The Shares are subject to certain restrictions on their purchase, resale
and transfer. For more information, see ‘‘Subscription and Sale’’ and‘‘Transfer Restrictions’’.
Dividends . . . . . . . . . . . . . . . . . Subject to the considerations and limitations discussed in ‘‘DividendPolicy’’, it is our current dividend policy that not less than 20% of ourprofit for the year attributable to shareholders of the Company (afterseparately disclosable items) will be distributed as dividends. We donot intend to pay a dividend in respect of our pro forma results ofoperations for the year ended December 31, 2006 or the six monthsended June 30, 2007.
Although we can make no guarantee that we will, should we declareany dividends in the future, our Shares sold in the Global Offering,including any of our Shares sold pursuant to the exercise of theOver-allotment Option, if any, will be entitled to any such dividends ifthe relevant record date is on or after the Closing Date or the closingdate of the Over-allotment Option, as applicable.
Use of proceeds . . . . . . . . . . . . The net proceeds which will be received by the Selling Shareholderfrom the Global Offering will be approximately $3,109.3 million (orapproximately $3,699.7 million if the Over-allotment Option isexercised in full) (in each case, after deduction of commissions). All ofthe expenses of the Global Offering will be paid by the SellingShareholder.
We will not receive any of the proceeds from the sale of the Sharesoffered by the Selling Shareholder. The Global Offering is beingconducted, among other reasons, to allow the Selling Shareholder tosell part of its shareholding, while providing increased trading liquidity
7
in the Shares and raising our profile with the international investmentcommunity. In addition, the Global Offering will facilitate theredemption of the PCFC Development Sukuk in accordance with itsterms. For more information, see ‘‘Use of Proceeds’’ and ‘‘Descriptionof the PCFC Development FZCO Sukuk’’.
Listing and trading . . . . . . . . . . We have applied for the Shares to be admitted to the Official List ofSecurities of the DIFX and to list the Shares on the DIFX under thesymbol ‘‘DPW’’. Prior to the Global Offering, there has not been anypublic market for the Shares. There will be no conditional dealings inthe Shares prior to the DIFX Admission. It is expected that theDIFX Admission will become effective and that dealings in the Shareswill commence on the DIFX on or about the Closing Date.
Lock up . . . . . . . . . . . . . . . . . . We and the Selling Shareholder, which held 100% of the Sharesimmediately prior to the Global Offering, have agreed, for a period of180 days after the Closing Date, subject to certain exceptions,including the sale of the Shares by the Selling Shareholder pursuant tothe Over-allotment Option, the loan of Shares by the SellingShareholder to parties authorised to provide market-making facilitiesin respect of the Shares on the DIFX and to facilitate the redemptionof the PCFC Development Sukuk in accordance with its terms, andsubject as further provided below, not to (A) directly or indirectly,issue, offer, sell, contract to sell, sell or grant any option, right,warrant, or contract to purchase, exercise any option to sell, purchaseany option or contract to sell, or lend or otherwise transfer or disposeof any of our ordinary shares or other shares of ours, (B) enter intoany swap, or any other agreement or any transaction that transfers, inwhole or in part, directly or indirectly, the economic consequence ofownership of our ordinary shares, in each case, whether any suchtransaction is to be settled by delivery of ordinary shares or othersecurities, in cash or otherwise, or (C) publicly announce such anintention to effect any such transaction, in each case, without the priorwritten consent of the Joint Global Coordinators, such consent not tobe unreasonably withheld or delayed. The restrictions set out abovewill not prohibit us or the Selling Shareholder from, among otherthings, charging, pledging or otherwise providing any of our ordinaryshares as security for any indebtedness or financing. For moreinformation, see ‘‘Subscription and Sale.’’
Taxation . . . . . . . . . . . . . . . . . . For a discussion of certain tax considerations relevant to aninvestment in the Shares, see ‘‘Taxation.’’
General information . . . . . . . . . The security identification numbers of the Shares offered hereby areas follows:
Shares ISIN: AEDFXA0M6V00Shares Common Code: 033021160DIFX Share Trading Symbol: DPW
8
www.global-reports.com
SUMMARY OF HISTORICAL AND PRO FORMA CONSOLIDATED FINANCIALAND OPERATING DATA
The summary historical consolidated financial data of DPA for the years ended December 31, 2004, 2005 and2006 and the six months ended June 30, 2006 set forth below have been derived from the DPA ConsolidatedFinancial Statements appearing elsewhere in this Prospectus. The summary historical consolidated financialdata of the Company for the six months ended June 30, 2007 have been derived from the CompanyConsolidated Financial Statements appearing elsewhere in this Prospectus.
The summary unaudited pro forma consolidated financial data of the Company set forth below have beenderived from the Unaudited Pro Forma Consolidated Financial Information appearing elsewhere in thisProspectus.
The unaudited pro forma consolidated statement of income of the Company for the year ended December 31,2006 is based on the audited consolidated statement of income of DPA for the year ended December 31, 2006included in the DPA Consolidated Financial Statements appearing elsewhere in this Prospectus and has beenprepared for illustrative purposes only to show the effect of (i) the acquisition of P&O; (ii) the disposal ofPOPNA, the Shekou Terminals and the Colombo Terminal and the transfer to affiliates of the Company of theP&O Ferries Business and of P&O Estates; (iii) the effective commencement of the Concession Agreement and(iv) the sale of portions of POTA and P&O AGS as if such events had occurred on January 1, 2006.
The unaudited pro forma consolidated statement of income of the Company for the six months ended June 30,2007 is based on the unaudited condensed consolidated interim income statement of the Company for the sixmonths ended June 30, 2007 included in the Company Consolidated Financial Statements appearing elsewherein this Prospectus and has been prepared for illustrative purposes only to show the effect of (i) the disposal ofPOPNA, the Shekou Terminals and the Colombo Terminal and the transfer to affiliates of the Company of theP&O Ferries Business and of P&O Estates; and (ii) the sale of portions of POTA and P&O AGS as if suchevents had occurred on January 1, 2007.
The unaudited pro forma consolidated balance sheet of the Company as of June 30, 2007 is based on theunaudited condensed consolidated interim balance sheet of the Company as of June 30, 2007 included in theCompany Consolidated Financial Statements appearing elsewhere in this Prospectus and has been prepared forillustrative purposes only to show the effect of (i) the transfer to affiliates of the Company of the P&O FerriesBusiness and of P&O Estates; (ii) the issuance of the Senior Notes and the Certificates and the repayment of$3.2 billion under the Amended & Restated Credit Facility with the net proceeds from such issuances and(iii) the payment of $2.0 billion of the Intercompany Payable in cash, the conversion of $2.0 billion of theIntercompany Payable into Shareholder’s reserve and the conversion of the remaining $4.1 billion of theIntercompany Payable into Share capital.
The summary unaudited pro forma consolidated financial and operating data of the Company have beenprepared for illustrative purposes only and, because of their nature, address a hypothetical situation and,therefore, do not represent our actual financial position or results had the transactions described therein beencompleted at the dates assumed or any other date and should not be regarded as an indication of the operatingresults generated by us or of our future financial position.
The Unaudited Pro Forma Consolidated Financial Information for the year ended December 31, 2006 has beenprepared on a basis consistent with the accounting policies of DPA as of and for the year ended December 31,2006 as set out in Note 2.3, ‘‘Summary of Significant Accounting Policies’’, of the Notes to the DPAConsolidated Financial Statements as of and for the years ended December 31, 2005 and 2006. The UnauditedPro Forma Consolidated Financial Information as of and for the six months ended June 30, 2007 has beenprepared on a basis consistent with the accounting policies of the Company as of and for the six months endedJune 30, 2007 as set out in Note 3, ‘‘Significant accounting policies’’, of the Notes to the Company ConsolidatedFinancial Statements as of and for the six months ended June 30, 2007.
You should read the summary of historical and pro forma consolidated financial and operating data inconjunction with the information contained in ‘‘Use of Proceeds’’, ‘‘Unaudited Pro Forma ConsolidatedFinancial Information’’, ‘‘Selected Historical Consolidated Financial Data’’, ‘‘Selected Historical ConsolidatedFinancial Data of P&O’’, ‘‘Management’s Discussion and Analysis of Financial Condition and Results ofOperations’’, and the Company Consolidated Financial Statements, the DPA Consolidated FinancialStatements and the P&O Consolidated Financial Statements appearing in this Prospectus.
9
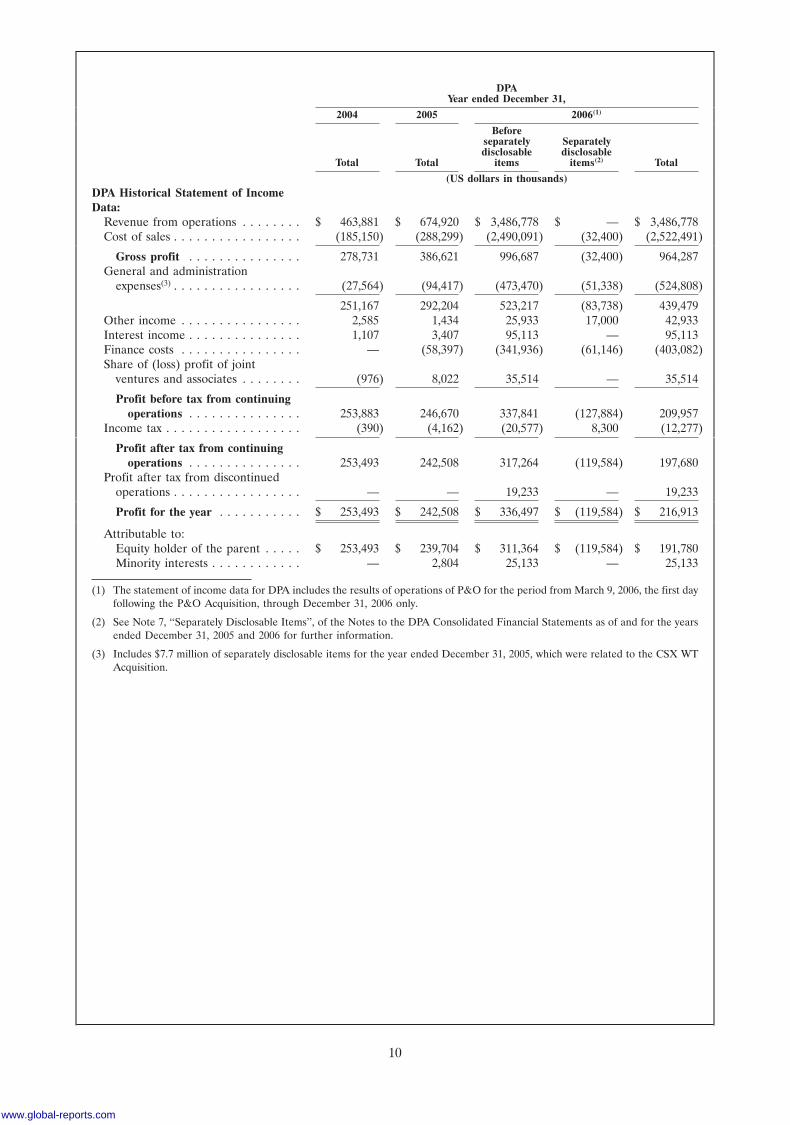
DPAYear ended December 31,
2004 2005 2006(1)
Beforeseparately Separatelydisclosable disclosable
Total Total items items(2) Total
(US dollars in thousands)DPA Historical Statement of IncomeData:
Revenue from operations . . . . . . . . $ 463,881 $ 674,920 $ 3,486,778 $ — $ 3,486,778Cost of sales . . . . . . . . . . . . . . . . . (185,150) (288,299) (2,490,091) (32,400) (2,522,491)
Gross profit . . . . . . . . . . . . . . . 278,731 386,621 996,687 (32,400) 964,287General and administration
expenses(3) . . . . . . . . . . . . . . . . . (27,564) (94,417) (473,470) (51,338) (524,808)
251,167 292,204 523,217 (83,738) 439,479Other income . . . . . . . . . . . . . . . . 2,585 1,434 25,933 17,000 42,933Interest income . . . . . . . . . . . . . . . 1,107 3,407 95,113 — 95,113Finance costs . . . . . . . . . . . . . . . . — (58,397) (341,936) (61,146) (403,082)Share of (loss) profit of joint
ventures and associates . . . . . . . . (976) 8,022 35,514 — 35,514
Profit before tax from continuingoperations . . . . . . . . . . . . . . . 253,883 246,670 337,841 (127,884) 209,957
Income tax . . . . . . . . . . . . . . . . . . (390) (4,162) (20,577) 8,300 (12,277)
Profit after tax from continuingoperations . . . . . . . . . . . . . . . 253,493 242,508 317,264 (119,584) 197,680
Profit after tax from discontinuedoperations . . . . . . . . . . . . . . . . . — — 19,233 — 19,233
Profit for the year . . . . . . . . . . . $ 253,493 $ 242,508 $ 336,497 $ (119,584) $ 216,913
Attributable to:Equity holder of the parent . . . . . $ 253,493 $ 239,704 $ 311,364 $ (119,584) $ 191,780Minority interests . . . . . . . . . . . . — 2,804 25,133 — 25,133
(1) The statement of income data for DPA includes the results of operations of P&O for the period from March 9, 2006, the first dayfollowing the P&O Acquisition, through December 31, 2006 only.
(2) See Note 7, ‘‘Separately Disclosable Items’’, of the Notes to the DPA Consolidated Financial Statements as of and for the yearsended December 31, 2005 and 2006 for further information.
(3) Includes $7.7 million of separately disclosable items for the year ended December 31, 2005, which were related to the CSX WTAcquisition.
10
www.global-reports.com
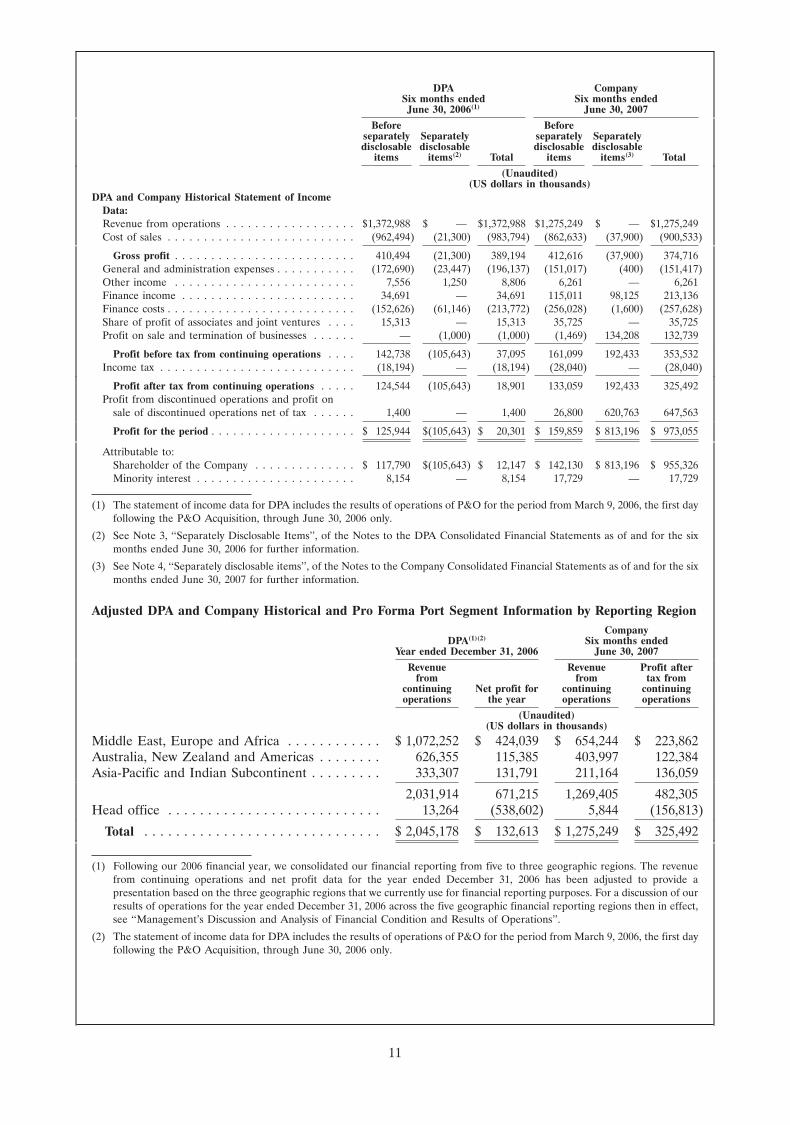
DPA CompanySix months ended Six months ended
June 30, 2006(1) June 30, 2007
Before Beforeseparately Separately separately Separatelydisclosable disclosable disclosable disclosable
items items(2) Total items items(3) Total
(Unaudited)(US dollars in thousands)
DPA and Company Historical Statement of IncomeData:Revenue from operations . . . . . . . . . . . . . . . . . . $1,372,988 $ — $1,372,988 $1,275,249 $ — $1,275,249Cost of sales . . . . . . . . . . . . . . . . . . . . . . . . . . (962,494) (21,300) (983,794) (862,633) (37,900) (900,533)
Gross profit . . . . . . . . . . . . . . . . . . . . . . . . . 410,494 (21,300) 389,194 412,616 (37,900) 374,716General and administration expenses . . . . . . . . . . . (172,690) (23,447) (196,137) (151,017) (400) (151,417)Other income . . . . . . . . . . . . . . . . . . . . . . . . . 7,556 1,250 8,806 6,261 — 6,261Finance income . . . . . . . . . . . . . . . . . . . . . . . . 34,691 — 34,691 115,011 98,125 213,136Finance costs . . . . . . . . . . . . . . . . . . . . . . . . . . (152,626) (61,146) (213,772) (256,028) (1,600) (257,628)Share of profit of associates and joint ventures . . . . 15,313 — 15,313 35,725 — 35,725Profit on sale and termination of businesses . . . . . . — (1,000) (1,000) (1,469) 134,208 132,739
Profit before tax from continuing operations . . . . 142,738 (105,643) 37,095 161,099 192,433 353,532Income tax . . . . . . . . . . . . . . . . . . . . . . . . . . . (18,194) — (18,194) (28,040) — (28,040)
Profit after tax from continuing operations . . . . . 124,544 (105,643) 18,901 133,059 192,433 325,492Profit from discontinued operations and profit on
sale of discontinued operations net of tax . . . . . . 1,400 — 1,400 26,800 620,763 647,563
Profit for the period . . . . . . . . . . . . . . . . . . . . $ 125,944 $(105,643) $ 20,301 $ 159,859 $ 813,196 $ 973,055
Attributable to:Shareholder of the Company . . . . . . . . . . . . . . $ 117,790 $(105,643) $ 12,147 $ 142,130 $ 813,196 $ 955,326Minority interest . . . . . . . . . . . . . . . . . . . . . . 8,154 — 8,154 17,729 — 17,729
(1) The statement of income data for DPA includes the results of operations of P&O for the period from March 9, 2006, the first dayfollowing the P&O Acquisition, through June 30, 2006 only.
(2) See Note 3, ‘‘Separately Disclosable Items’’, of the Notes to the DPA Consolidated Financial Statements as of and for the sixmonths ended June 30, 2006 for further information.
(3) See Note 4, ‘‘Separately disclosable items’’, of the Notes to the Company Consolidated Financial Statements as of and for the sixmonths ended June 30, 2007 for further information.
Adjusted DPA and Company Historical and Pro Forma Port Segment Information by Reporting RegionCompany
DPA(1)(2) Six months endedYear ended December 31, 2006 June 30, 2007
Revenue Revenue Profit afterfrom from tax from
continuing Net profit for continuing continuingoperations the year operations operations
(Unaudited)(US dollars in thousands)
Middle East, Europe and Africa . . . . . . . . . . . . $ 1,072,252 $ 424,039 $ 654,244 $ 223,862Australia, New Zealand and Americas . . . . . . . . 626,355 115,385 403,997 122,384Asia-Pacific and Indian Subcontinent . . . . . . . . . 333,307 131,791 211,164 136,059
2,031,914 671,215 1,269,405 482,305Head office . . . . . . . . . . . . . . . . . . . . . . . . . . . 13,264 (538,602) 5,844 (156,813)
Total . . . . . . . . . . . . . . . . . . . . . . . . . . . . . . $ 2,045,178 $ 132,613 $ 1,275,249 $ 325,492
(1) Following our 2006 financial year, we consolidated our financial reporting from five to three geographic regions. The revenuefrom continuing operations and net profit data for the year ended December 31, 2006 has been adjusted to provide apresentation based on the three geographic regions that we currently use for financial reporting purposes. For a discussion of ourresults of operations for the year ended December 31, 2006 across the five geographic financial reporting regions then in effect,see ‘‘Management’s Discussion and Analysis of Financial Condition and Results of Operations’’.
(2) The statement of income data for DPA includes the results of operations of P&O for the period from March 9, 2006, the first dayfollowing the P&O Acquisition, through June 30, 2006 only.
11
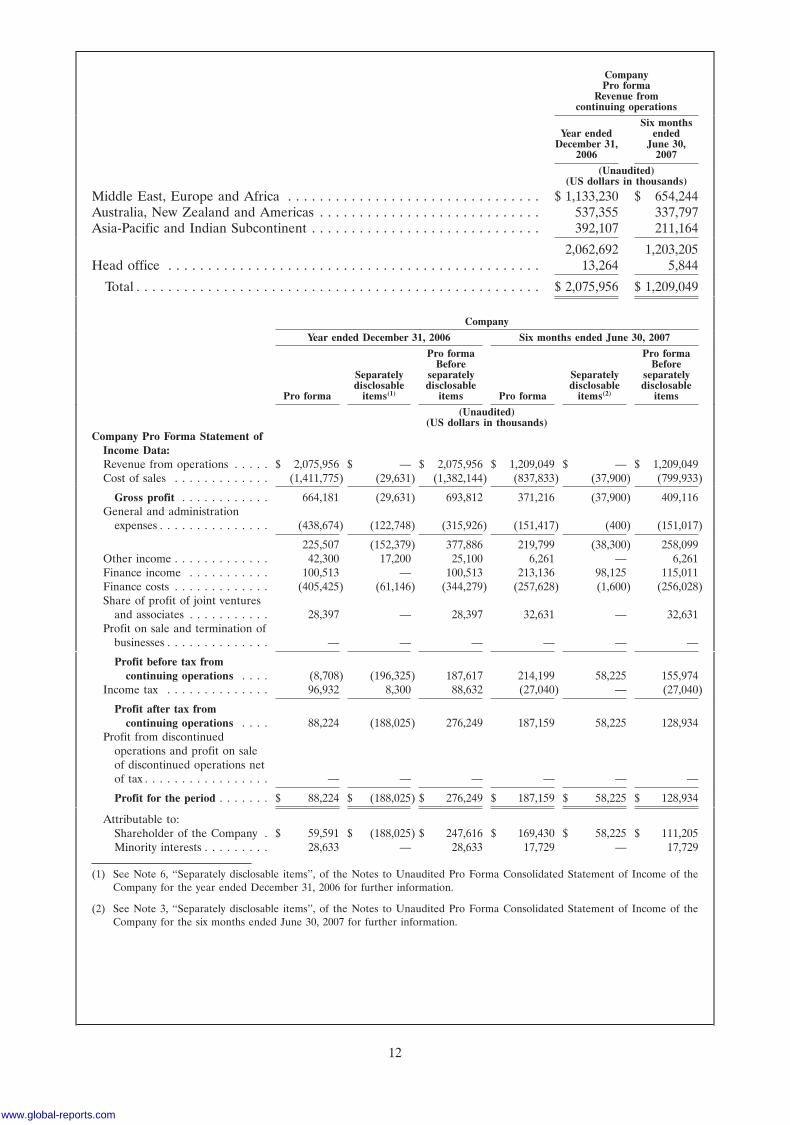
CompanyPro forma
Revenue fromcontinuing operations
Six monthsYear ended ended
December 31, June 30,2006 2007
(Unaudited)(US dollars in thousands)
Middle East, Europe and Africa . . . . . . . . . . . . . . . . . . . . . . . . . . . . . . . . $ 1,133,230 $ 654,244Australia, New Zealand and Americas . . . . . . . . . . . . . . . . . . . . . . . . . . . . 537,355 337,797Asia-Pacific and Indian Subcontinent . . . . . . . . . . . . . . . . . . . . . . . . . . . . . 392,107 211,164
2,062,692 1,203,205Head office . . . . . . . . . . . . . . . . . . . . . . . . . . . . . . . . . . . . . . . . . . . . . . . 13,264 5,844
Total . . . . . . . . . . . . . . . . . . . . . . . . . . . . . . . . . . . . . . . . . . . . . . . . . . . $ 2,075,956 $ 1,209,049
Company
Year ended December 31, 2006 Six months ended June 30, 2007
Pro forma Pro formaBefore Before
Separately separately Separately separatelydisclosable disclosable disclosable disclosable
Pro forma items(1) items Pro forma items(2) items
(Unaudited)(US dollars in thousands)
Company Pro Forma Statement ofIncome Data:Revenue from operations . . . . . $ 2,075,956 $ — $ 2,075,956 $ 1,209,049 $ — $ 1,209,049Cost of sales . . . . . . . . . . . . . (1,411,775) (29,631) (1,382,144) (837,833) (37,900) (799,933)
Gross profit . . . . . . . . . . . . 664,181 (29,631) 693,812 371,216 (37,900) 409,116General and administration
expenses . . . . . . . . . . . . . . . (438,674) (122,748) (315,926) (151,417) (400) (151,017)
225,507 (152,379) 377,886 219,799 (38,300) 258,099Other income . . . . . . . . . . . . . 42,300 17,200 25,100 6,261 — 6,261Finance income . . . . . . . . . . . 100,513 — 100,513 213,136 98,125 115,011Finance costs . . . . . . . . . . . . . (405,425) (61,146) (344,279) (257,628) (1,600) (256,028)Share of profit of joint ventures
and associates . . . . . . . . . . . 28,397 — 28,397 32,631 — 32,631Profit on sale and termination of
businesses . . . . . . . . . . . . . . — — — — — —
Profit before tax fromcontinuing operations . . . . (8,708) (196,325) 187,617 214,199 58,225 155,974
Income tax . . . . . . . . . . . . . . 96,932 8,300 88,632 (27,040) — (27,040)
Profit after tax fromcontinuing operations . . . . 88,224 (188,025) 276,249 187,159 58,225 128,934
Profit from discontinuedoperations and profit on saleof discontinued operations netof tax . . . . . . . . . . . . . . . . . — — — — — —
Profit for the period . . . . . . . $ 88,224 $ (188,025) $ 276,249 $ 187,159 $ 58,225 $ 128,934
Attributable to:Shareholder of the Company . $ 59,591 $ (188,025) $ 247,616 $ 169,430 $ 58,225 $ 111,205Minority interests . . . . . . . . . 28,633 — 28,633 17,729 — 17,729
(1) See Note 6, ‘‘Separately disclosable items’’, of the Notes to Unaudited Pro Forma Consolidated Statement of Income of theCompany for the year ended December 31, 2006 for further information.
(2) See Note 3, ‘‘Separately disclosable items’’, of the Notes to Unaudited Pro Forma Consolidated Statement of Income of theCompany for the six months ended June 30, 2007 for further information.
12
www.global-reports.com
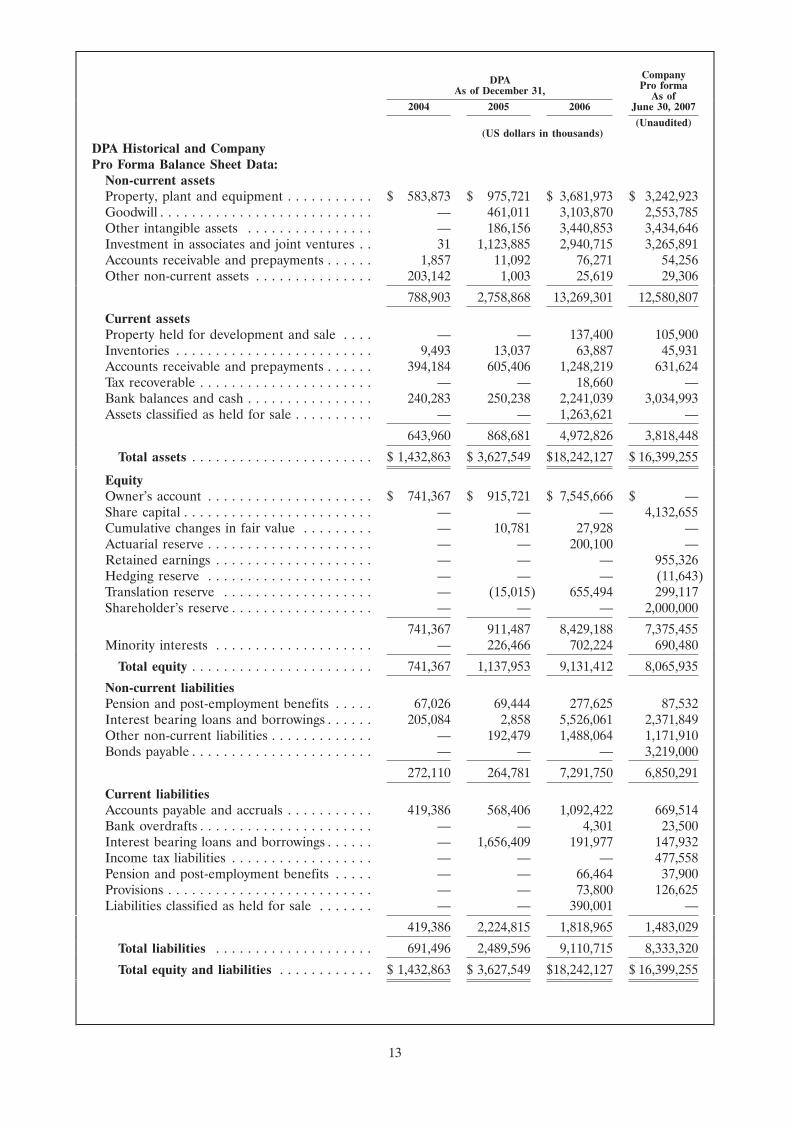
CompanyDPA Pro formaAs of December 31, As of2004 2005 2006 June 30, 2007
(Unaudited)(US dollars in thousands)
DPA Historical and CompanyPro Forma Balance Sheet Data:
Non-current assetsProperty, plant and equipment . . . . . . . . . . . $ 583,873 $ 975,721 $ 3,681,973 $ 3,242,923Goodwill . . . . . . . . . . . . . . . . . . . . . . . . . . . — 461,011 3,103,870 2,553,785Other intangible assets . . . . . . . . . . . . . . . . — 186,156 3,440,853 3,434,646Investment in associates and joint ventures . . 31 1,123,885 2,940,715 3,265,891Accounts receivable and prepayments . . . . . . 1,857 11,092 76,271 54,256Other non-current assets . . . . . . . . . . . . . . . 203,142 1,003 25,619 29,306
788,903 2,758,868 13,269,301 12,580,807
Current assetsProperty held for development and sale . . . . — — 137,400 105,900Inventories . . . . . . . . . . . . . . . . . . . . . . . . . 9,493 13,037 63,887 45,931Accounts receivable and prepayments . . . . . . 394,184 605,406 1,248,219 631,624Tax recoverable . . . . . . . . . . . . . . . . . . . . . . — — 18,660 —Bank balances and cash . . . . . . . . . . . . . . . . 240,283 250,238 2,241,039 3,034,993Assets classified as held for sale . . . . . . . . . . — — 1,263,621 —
643,960 868,681 4,972,826 3,818,448
Total assets . . . . . . . . . . . . . . . . . . . . . . . $ 1,432,863 $ 3,627,549 $18,242,127 $ 16,399,255
EquityOwner’s account . . . . . . . . . . . . . . . . . . . . . $ 741,367 $ 915,721 $ 7,545,666 $ —Share capital . . . . . . . . . . . . . . . . . . . . . . . . — — — 4,132,655Cumulative changes in fair value . . . . . . . . . — 10,781 27,928 —Actuarial reserve . . . . . . . . . . . . . . . . . . . . . — — 200,100 —Retained earnings . . . . . . . . . . . . . . . . . . . . — — — 955,326Hedging reserve . . . . . . . . . . . . . . . . . . . . . — — — (11,643)Translation reserve . . . . . . . . . . . . . . . . . . . — (15,015) 655,494 299,117Shareholder’s reserve . . . . . . . . . . . . . . . . . . — — — 2,000,000
741,367 911,487 8,429,188 7,375,455Minority interests . . . . . . . . . . . . . . . . . . . . — 226,466 702,224 690,480
Total equity . . . . . . . . . . . . . . . . . . . . . . . 741,367 1,137,953 9,131,412 8,065,935
Non-current liabilitiesPension and post-employment benefits . . . . . 67,026 69,444 277,625 87,532Interest bearing loans and borrowings . . . . . . 205,084 2,858 5,526,061 2,371,849Other non-current liabilities . . . . . . . . . . . . . — 192,479 1,488,064 1,171,910Bonds payable . . . . . . . . . . . . . . . . . . . . . . . — — — 3,219,000
272,110 264,781 7,291,750 6,850,291
Current liabilitiesAccounts payable and accruals . . . . . . . . . . . 419,386 568,406 1,092,422 669,514Bank overdrafts . . . . . . . . . . . . . . . . . . . . . . — — 4,301 23,500Interest bearing loans and borrowings . . . . . . — 1,656,409 191,977 147,932Income tax liabilities . . . . . . . . . . . . . . . . . . — — — 477,558Pension and post-employment benefits . . . . . — — 66,464 37,900Provisions . . . . . . . . . . . . . . . . . . . . . . . . . . — — 73,800 126,625Liabilities classified as held for sale . . . . . . . — — 390,001 —
419,386 2,224,815 1,818,965 1,483,029
Total liabilities . . . . . . . . . . . . . . . . . . . . 691,496 2,489,596 9,110,715 8,333,320
Total equity and liabilities . . . . . . . . . . . . $ 1,432,863 $ 3,627,549 $18,242,127 $ 16,399,255
13
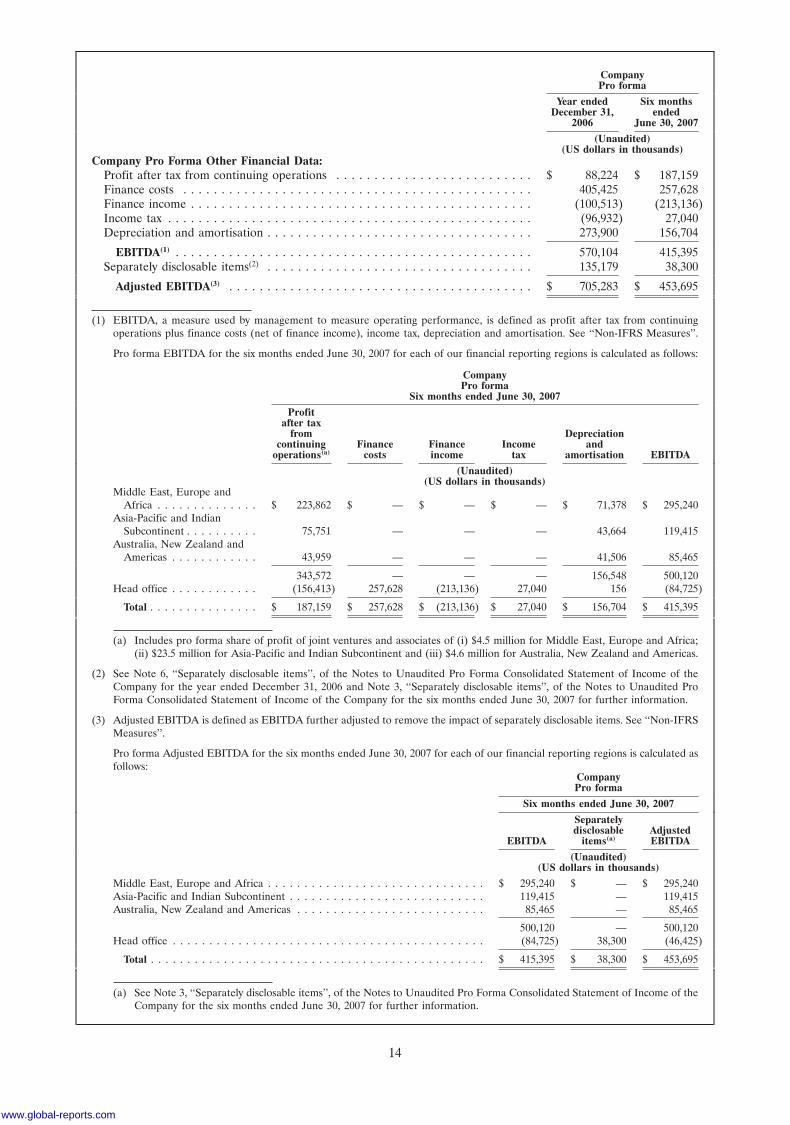
CompanyPro forma
Year ended Six monthsDecember 31, ended
2006 June 30, 2007
(Unaudited)(US dollars in thousands)
Company Pro Forma Other Financial Data:Profit after tax from continuing operations . . . . . . . . . . . . . . . . . . . . . . . . . . $ 88,224 $ 187,159Finance costs . . . . . . . . . . . . . . . . . . . . . . . . . . . . . . . . . . . . . . . . . . . . . . 405,425 257,628Finance income . . . . . . . . . . . . . . . . . . . . . . . . . . . . . . . . . . . . . . . . . . . . . (100,513) (213,136)Income tax . . . . . . . . . . . . . . . . . . . . . . . . . . . . . . . . . . . . . . . . . . . . . . . . (96,932) 27,040Depreciation and amortisation . . . . . . . . . . . . . . . . . . . . . . . . . . . . . . . . . . . 273,900 156,704
EBITDA(1) . . . . . . . . . . . . . . . . . . . . . . . . . . . . . . . . . . . . . . . . . . . . . . . 570,104 415,395Separately disclosable items(2) . . . . . . . . . . . . . . . . . . . . . . . . . . . . . . . . . . . 135,179 38,300
Adjusted EBITDA(3) . . . . . . . . . . . . . . . . . . . . . . . . . . . . . . . . . . . . . . . . $ 705,283 $ 453,695
(1) EBITDA, a measure used by management to measure operating performance, is defined as profit after tax from continuingoperations plus finance costs (net of finance income), income tax, depreciation and amortisation. See ‘‘Non-IFRS Measures’’.
Pro forma EBITDA for the six months ended June 30, 2007 for each of our financial reporting regions is calculated as follows:
CompanyPro forma
Six months ended June 30, 2007
Profitafter tax
from Depreciationcontinuing Finance Finance Income and
operations(a) costs income tax amortisation EBITDA
(Unaudited)(US dollars in thousands)
Middle East, Europe andAfrica . . . . . . . . . . . . . . $ 223,862 $ — $ — $ — $ 71,378 $ 295,240
Asia-Pacific and IndianSubcontinent . . . . . . . . . . 75,751 — — — 43,664 119,415
Australia, New Zealand andAmericas . . . . . . . . . . . . 43,959 — — — 41,506 85,465
343,572 — — — 156,548 500,120Head office . . . . . . . . . . . . (156,413) 257,628 (213,136) 27,040 156 (84,725)
Total . . . . . . . . . . . . . . . $ 187,159 $ 257,628 $ (213,136) $ 27,040 $ 156,704 $ 415,395
(a) Includes pro forma share of profit of joint ventures and associates of (i) $4.5 million for Middle East, Europe and Africa;(ii) $23.5 million for Asia-Pacific and Indian Subcontinent and (iii) $4.6 million for Australia, New Zealand and Americas.
(2) See Note 6, ‘‘Separately disclosable items’’, of the Notes to Unaudited Pro Forma Consolidated Statement of Income of theCompany for the year ended December 31, 2006 and Note 3, ‘‘Separately disclosable items’’, of the Notes to Unaudited ProForma Consolidated Statement of Income of the Company for the six months ended June 30, 2007 for further information.
(3) Adjusted EBITDA is defined as EBITDA further adjusted to remove the impact of separately disclosable items. See ‘‘Non-IFRSMeasures’’.
Pro forma Adjusted EBITDA for the six months ended June 30, 2007 for each of our financial reporting regions is calculated asfollows:
CompanyPro forma
Six months ended June 30, 2007
Separatelydisclosable Adjusted
EBITDA items(a) EBITDA
(Unaudited)(US dollars in thousands)
Middle East, Europe and Africa . . . . . . . . . . . . . . . . . . . . . . . . . . . . . . $ 295,240 $ — $ 295,240Asia-Pacific and Indian Subcontinent . . . . . . . . . . . . . . . . . . . . . . . . . . . 119,415 — 119,415Australia, New Zealand and Americas . . . . . . . . . . . . . . . . . . . . . . . . . . 85,465 — 85,465
500,120 — 500,120Head office . . . . . . . . . . . . . . . . . . . . . . . . . . . . . . . . . . . . . . . . . . . (84,725) 38,300 (46,425)
Total . . . . . . . . . . . . . . . . . . . . . . . . . . . . . . . . . . . . . . . . . . . . . . $ 415,395 $ 38,300 $ 453,695
(a) See Note 3, ‘‘Separately disclosable items’’, of the Notes to Unaudited Pro Forma Consolidated Statement of Income of theCompany for the six months ended June 30, 2007 for further information.
14
www.global-reports.com
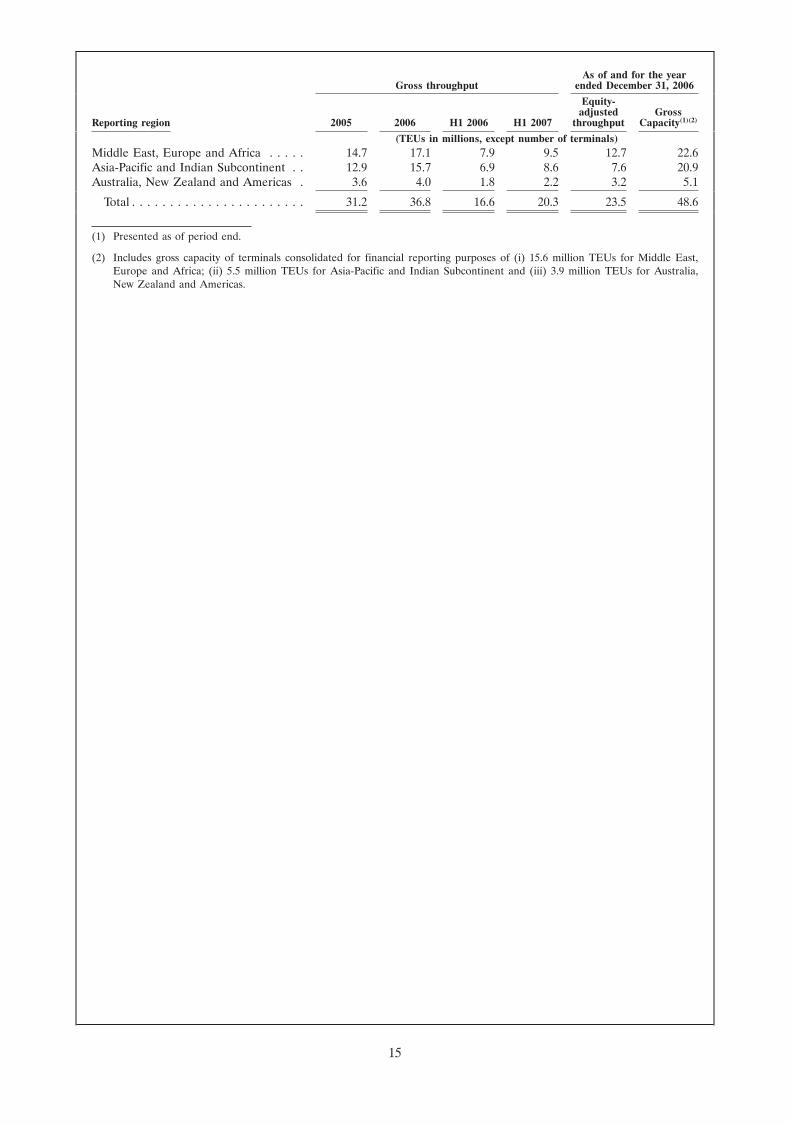
As of and for the yearended December 31, 2006Gross throughput
Equity-adjusted Gross
Reporting region 2005 2006 H1 2006 H1 2007 throughput Capacity(1)(2)
(TEUs in millions, except number of terminals)Middle East, Europe and Africa . . . . . 14.7 17.1 7.9 9.5 12.7 22.6Asia-Pacific and Indian Subcontinent . . 12.9 15.7 6.9 8.6 7.6 20.9Australia, New Zealand and Americas . 3.6 4.0 1.8 2.2 3.2 5.1
Total . . . . . . . . . . . . . . . . . . . . . . . 31.2 36.8 16.6 20.3 23.5 48.6
(1) Presented as of period end.
(2) Includes gross capacity of terminals consolidated for financial reporting purposes of (i) 15.6 million TEUs for Middle East,Europe and Africa; (ii) 5.5 million TEUs for Asia-Pacific and Indian Subcontinent and (iii) 3.9 million TEUs for Australia,New Zealand and Americas.
15
RISK FACTORS
An investment in the Shares involves a number of risks. You should carefully consider the following informationabout these risks, together with the other information contained in this Prospectus, before investing in theShares. Any of the risks described below, or additional risks not currently known to us or that we currently deemimmaterial, could have a significant or material adverse effect on our business, financial condition or results ofoperations and result in a corresponding decline in the market price of the Shares. You could lose all or asubstantial part of your investment.
This Prospectus also contains forward-looking statements that involve risks and uncertainties. Our actual resultscould differ materially from those anticipated in such forward-looking statements as a result of certain factors,including the risks described below and elsewhere in this Prospectus. See ‘‘Cautionary Statement RegardingForward-Looking Statements’’.
Risks Relating to the DIFC and the DIFX
We are incorporated in the DIFC, which is a newly established jurisdiction, and the legal framework applicable to usis untested.
Because the DIFC is a newly-established jurisdiction, the legal and regulatory regimes applicable to us andother companies domiciled in the DIFC, including the relevant companies laws, are still being developedand are largely untested. Similarly, the courts of the DIFC have yet to issue any substantive decisions,which may lead to ambiguities, inconsistencies and anomalies in the interpretation and enforcement of thelaws and regulations applicable to us, including with respect to rights of holders of the Shares. Theseuncertainties could affect your ability to enforce your rights or our ability to defend ourselves againstclaims by others, including regulators, judicial authorities and third parties who may challenge ourcompliance with applicable laws, decrees and regulations.
The DIFX has only recently commenced operations and we cannot assure you as to the level of liquidity that it willdevelop.
The DIFX has only recently commenced operations and is substantially smaller in terms of trade size andvolume than more established securities markets, such as those in the United States and the UnitedKingdom. Trading liquidity is limited, which may contribute to increased volatility for securities on theDIFX. Currently, twelve companies have their shares or other equity securities admitted to trading on theexchange and the total trading volume for 2006 and the six months ended June 30, 2007 was $26.3 millionand $15.7 million, respectively. As of October 26, 2007, the market capitalisation of all securities listed onthe DIFX was approximately $32.3 billion, of which equity securities accounted for approximately$4.2 billion. In addition, the DIFX competes with other Middle Eastern securities exchanges and, to theextent that it is unable to compete effectively, the level of liquidity may decrease. Brokerage commissionsand other transaction costs on the DIFX are also generally higher than those in Western Europeancountries. Such factors could generally decrease the liquidity and increase the volatility of our Share priceand impair the ability of a holder of the Shares to dispose of them in the amount and at the price and timesuch holder wishes to do so. See ‘‘Overview of the UAE—The Emirate of Dubai—DIFX’’ and DIFX’swebsite, www.difx.ae, for more information regarding the DIFX. Neither we, the Selling Shareholder, theJoint Global Coordinators nor the Underwriters have independently verified the information contained onDIFX’s website and we can provide no assurance as to the accuracy or completeness of such information.The information contained on DIFX’s website is not incorporated by reference into, or otherwise includedin, this Prospectus.
Disclosure obligations, financial controls and corporate governance requirements and protections for shareholdersor investors in publicly-traded companies incorporated in the DIFC may be less extensive that those of jurisdictionswith major securities markets.
Our corporate affairs are governed by the companies laws of the DIFC and the rights of holders of theShares and the responsibilities of members of our Board of Directors under such laws are different incertain respects from those applicable to corporations organised in the United States, the United Kingdomand other jurisdictions. In particular, because regulations concerning reporting requirements and auditingstandards for DIFC companies may be less extensive than those applicable to companies incorporated inthe United States or the United Kingdom, there is generally less information available about us and otherDIFC companies than is regularly published by or about listed companies in other jurisdictions. Similarly,legal protections against such practices as market manipulation and insider trading are less developed in
16
www.global-reports.com
the DIFC because the DIFC is a newly-established jurisdiction and, consequently, securities laws andregulations in the DIFC generally are not as comprehensive, and have not received as much judicial orregulatory interpretation or review, as those in the United States, the United Kingdom and other countrieswith established securities markets. As a result of these factors, you may have greater difficulties inprotecting your interests as a holder of the Shares than as a shareholder of a US or UK corporation. See‘‘—Risks Related to the Shares—We are a DIFC company, and it may be difficult for you to enforcejudgments against us or our directors and senior management’’ below.
Risks Relating to the Company
We have grown rapidly and are comprised in part of significant newly-acquired operations and expect to continue togrow as a result of future expansion and acquisitions. We may not be able to manage our growth, and do not have atrack record of operating the Group in its current form.
In February 2005, we acquired CSX WT, the international terminal business of CSX Corporation, and inMarch 2006, we acquired P&O, a leading container terminal operator. See ‘‘Business—History—GlobalExpansion—CSX WT’’ and ‘‘Business—History—Global Expansion—P&O’’. We also currently have13 terminal development projects and 10 terminal expansion projects in various stages of development, inaddition to our 42 existing terminal operations. As a result of the growth of our portfolio over the past twoyears, our pro forma Adjusted EBITDA for the year ended December 31, 2006 increased by 1.5 times, ascompared to DPA’s actual Adjusted EBITDA for the year ended December 31, 2004.
We do not have a history of operating at our current size, and our ability to manage our existing businessand its future growth is dependent upon a number of factors, including our ability to effectively increasethe scope of our operational and financial systems to handle the increased complexity and expandedgeographic area of our operations, recruit, train and retain qualified staff to manage and operate ourgrowing business, obtain necessary permits or approvals from governmental authorities and agencies,secure adequate financing on commercially reasonable terms and explore new markets and run newbusinesses. In addition, due to our lack of operating history in our current form, our historical consolidatedfinancial and operating data are not directly comparable.
Future expansion and acquisitions, if any, will entail risks, including:
� the failure to successfully integrate operations, technologies, existing contracts, accountingprocesses, personnel, services or products of companies that we acquire;
� the failure to successfully integrate financial and control systems and management of theacquired companies;
� the potential loss of customers or key employees of acquired companies;
� the diversion of management’s attention from other business concerns;
� the assumption of unknown material liabilities; and
� the failure to achieve financial or operating objectives.
Our inability to avoid these risks, or manage any future expansion, could have a material adverse effect onour business, results of operations, financial condition and prospects.
Our future success depends on our ability to achieve and manage growth, whether through internal growth orstrategic acquisitions.
A principal component of our strategy is to continue to grow by expanding our business both in thegeographic areas and markets where we are currently focused and into new geographic areas and markets.Our ability to achieve and manage future growth will depend upon a number of factors, including ourability to maintain, expand or develop relationships with our customers, suppliers, contractors, lenders andother third parties, reach agreements with potential joint venture partners on commercial and technicalterms satisfactory to us and expand our operating capacity on a timely and reasonable basis. It will alsodepend on our ability to adjust and optimise the organisation of our management and operating structure.In addition, as we continue to grow, we believe that we must maintain an appropriate mixture of greenfieldand brownfield development sites and established operating facilities to ensure that we achieve a balancebetween the capital expenditure and cash flow profiles associated with facilities in different stages ofdevelopment, and there can be no assurance that we will be able to achieve this goal.
17
Growth through strategic acquisitions also entails risks inherent in identifying suitable expansionopportunities and assessing the value, strengths and weaknesses of acquisition candidates. In addition,prior to our acquisition, target companies may have incurred contractual, financial, regulatory,environmental or other obligations and liabilities that may impact us in the future and that are notadequately reflected in the historical financial statements of such companies or otherwise known to us ordiscovered by us in our due diligence process. The success of our acquisitions will depend on, and may belimited by, the availability of suitable acquisition targets, our ability to finance large acquisitions andrestrictions contained in our debt instruments and our other existing and future financing arrangements.For a description of the Syndicated Loan Facility, including the undertakings and covenants includedtherein, see ‘‘Management’s Discussion and Analysis of Financial Condition and Results of Operations—Liquidity and Capital Resources—Working Capital and Indebtedness—Revolving Credit SyndicatedFacility’’.
Our acquisition strategy may also be limited by regulatory constraints within the countries in which weoperate due to antitrust laws or political conflicts. See ‘‘—Antitrust and competition laws in the countriesin which we operate may limit our growth and subject us to antitrust and other investigations’’ below.
We cannot give any assurance that our recent rate of growth will be maintained in the future or thatdemand for our services will continue to grow at rates sufficient to achieve a satisfactory return on anyexpenditure that we make. A failure on our part to manage our growth efficiently and effectively couldhave a material adverse effect on our business, financial condition, results of operations and prospects.
We are exposed to certain risks in respect of the expansion of our existing terminals and port facilities and thedevelopment and construction of new terminals and port facilities.
Our new projects currently in development include a total of 13 terminal development projects inthe UAE, Vietnam, Djibouti, Pakistan, India (Kulpi and Vallarpadam), Turkey, France, China, Peru,Senegal, the Netherlands and the United Kingdom, of which two remain subject to final governmentapprovals. In addition, we currently have a total of 10 terminal expansion projects in the UAE, France,the Dominican Republic, Germany, Canada, Romania, Argentina, Belgium, South Korea and Australia.Expansion and construction projects, including those in our development pipeline, typically requiresubstantial capital expenditures throughout the development, construction and upgrading phases and maytake months or years before they become operational, during which time we are subject to a number ofconstruction, financing, operating and other risks beyond our control, including, but not limited to:
� shortages of materials, equipment and labour;
� adverse weather conditions and natural disasters;
� an inability on our part to make any necessary financing arrangements on terms favourable to us,if at all;
� changes in demand for our services;
� labour disputes and disputes with sub-contractors;
� inadequate infrastructure, including as a result of failure by third parties to fulfil their obligationsrelating to the provision of utilities and transportation links that are necessary or desirable for thesuccessful operation of a project;
� failure to complete projects according to specification;
� accidents;
� changes in governmental priorities; and
� an inability to obtain and maintain project development permission or requisite governmentallicences, permits or approvals.
The occurrence of one or more of these events may negatively affect our ability to complete our current orfuture projects on schedule, if at all, or within the estimated budget and may prevent us from achieving theprojected revenues, internal rates of return or capacity associated with such projects. We cannot assure youthat the revenues that we are able to generate from our projects will be sufficient to cover the associatedconstruction and development costs. In addition, once complete, our ability to dispose of inadequate orpoorly performing businesses is sometimes subject to governmental approval, which may force us to bear
18
www.global-reports.com
the costs of any such business for a longer period of time, with an increasingly negative and prolongedimpact on our financial condition and results of operations, than would otherwise be the case.
Furthermore, because most of our development and construction projects are governed by contracts thatwe enter into with the owner of a particular port, failure on our part to fulfil our obligations relating tosuch projects, including meeting our deadlines in a timely manner, may constitute a breach under therelevant contract and subject us to penalties, including payment of liquidated damages, or, in the case of aserious breach, termination of a project. Although we attempt to allocate risk of failure to sub-contractorsand suppliers to the extent possible, if we are unable to seek full indemnification from third parties withrespect to any such breach, our financial condition and results of operations may be adversely affected.
A significant number of our operations are run through joint venture companies and, in some cases, we do not havea controlling equity stake or the right or power to direct the management and policies of such companies.
A significant number of our container terminal and other ports-related operations are conducted throughjointly controlled entities, associated companies and partnerships. For the year ended December 31, 2006and the six months ended June 30, 2007, our pro forma share of profits from our joint ventures andassociates was $28.4 million (or approximately 10.3%) and $32.6 million (or approximately 25.3%),respectively, of our pro forma total profit for the period before separately disclosable items. Joint venturetransactions present many of the same risks involved in acquisitions, but also involve additional risks,including the possibility that our joint venture partners may have economic, business or legal interests orgoals that are inconsistent with our own, may become bankrupt, may refuse to make additional investmentsthat we deem necessary or desirable or may prove otherwise unwilling or unable to fulfil their obligationsunder the relevant joint venture or associated agreements. In addition, there is a risk that our joint venturepartners may ultimately become competitors of ours. Joint ventures with government entities also exposeus to risks relating to differences in focus or priorities between successive regimes.
To the extent that we do not have a controlling equity stake in a joint venture or the right or power todirect the management and policies of such joint venture, our joint venture partners may take action that isnot in accordance with our policies and objectives. Should a joint venture partner act contrary to ourinterest, it could have a material adverse effect upon our business, results of operations, financial conditionand prospects.
Our ability to expand successfully through joint ventures will depend upon the availability of suitable andwilling joint venture partners, our ability to consummate such transactions and the availability of financingon commercially acceptable terms. We cannot give any assurance that we will be successful in completingjoint ventures or that, once completed, a joint venture will be profitable for us. If a joint venture isunsuccessful, we may be unable to recoup our initial investment and our financial condition and results ofoperations may be adversely affected.
Our businesses require substantial capital investment, and we may not have sufficient capital to make, or may berestricted by covenants in our financing agreements from making, future capital expenditures and other investmentsas we deem necessary or desirable.
We operate in capital intensive industries that require a substantial amount of capital and other long-termexpenditures, including those relating to the development and acquisition of new container terminalfacilities and the expansion of existing container terminal facilities. In the past we have financed theseexpenditures through a variety of means, including internally generated cash, external borrowings andcapital contributions from our controlling shareholder. In the future, we expect to utilise a combination ofthese sources, including banking and capital markets transactions, to manage our balance sheet and meetour financing requirements. However, we cannot assure you that our controlling shareholder will be willingto make further capital contributions or that any of the other sources of capital will be available to us onacceptable terms, if at all.
Our ability to arrange external financing and the cost of such financing are dependent on numerousfactors, including our future financial condition, general economic and capital market conditions, interestrates, credit availability from banks or other lenders, investor confidence in us, applicable provisions of taxand securities laws and political and economic conditions in any relevant jurisdiction. We cannot provideany assurance that we will be able to arrange any such external financing on commercially reasonableterms, if at all, and we may be required to secure any such financing with a lien over our assets and those ofour subsidiaries.
19
See ‘‘—Our future leverage could adversely affect our ability to raise additional capital to fund ouroperations, limit our ability to react to changes in the economy or the industries in which we operate andprevent us from meeting our debt obligations’’ below. In addition, covenants contained in our current orfuture financing agreements may restrict us from undertaking capital expenditure in amounts and at timesthat we deem necessary or desirable or when specified by construction timelines contained in concessionsfor new container terminal facilities. See ‘‘—Our debt agreements contain restrictions that limit ourflexibility in operating our business’’ below. If we are unable to generate or obtain funds sufficient to make,or are otherwise restricted from making, necessary or desirable capital expenditure and other investments,we may be unable to grow our business, which may have a material adverse effect on our financialcondition, results of operations and prospects.
Antitrust and competition laws in the countries in which we operate may limit our growth and subject us toantitrust and other investigations.
The antitrust and competition laws and related regulatory policies in many of the countries in which weoperate generally favour increased competition in the container terminal industry and may prohibit usfrom making further acquisitions or continuing to engage in particular practices to the extent that we holda leading market share in such countries. In addition, violations of such laws and policies could potentiallyexpose us to civil lawsuits or criminal prosecution, including fines and imprisonment, and to the paymentof punitive damages. On August 24, 2007, the Australian Competition and Consumer Commission (the‘‘ACCC’’) instituted proceedings against a number of former Patrick companies (now owned by eitherAsciano Group or Toll Group) and a number of former P&O companies in Australia, as well as certainformer senior executives of those companies, alleging that such companies engaged in anti-competitivepractices in connection with the formation and operation of a joint venture in Australia. The ACCC is alsoinvestigating allegations that P&O engaged in anti-competitive practices in connection with the provisionof truck access at its container terminals in Australia. Similarly, in the past year, DP World Antwerp NV(formerly P&O Ports Antwerp NV) has been involved in an investigation by the Belgian CompetitionService (Service de la Concurrence) into the legality of yearly cost increase announcements by the Antwerpcargo handling trade association to its members. In addition, while not antitrust claims, the GujaratMaritime Board served on us notices to show cause why our concession agreement in respect of MundraInternational Container Terminal should not be cancelled following the P&O Acquisition. We cannotpredict the effect that any of these investigations, or any future investigations, will have on our business. Ifas a result of any such investigation, the relevant antitrust or competition authority imposes fines or otherpenalties on us or prohibits us from engaging in certain types of business in one or more of the regions inwhich we operate, our financial performance and future growth could be adversely affected.
We are subject to political and economic conditions in Dubai, as well as the UAE as a whole.
For the year ended December 31, 2006 and the six months ended June 30, 2007, 52.4% and 51.3%,respectively, of our revenue from continuing operations for our ports segment related to operationslocated in our Middle East, Europe and Africa financial reporting region, significant portions of whichrelated to operations at DP World Jebel Ali in Dubai, UAE. Consequently, our results of operations areand will continue to be affected in general by economic and political developments in or affecting Dubaiand the UAE and, in particular, by the level of economic activity in Dubai and the UAE.
The economies of Dubai and the UAE, like those of many emerging markets, have been characterised bysignificant government involvement through direct ownership of enterprises and extensive regulation ofmarket conditions, including foreign investment, foreign trade and financial services. While the policies ofthe governments of Dubai and the UAE have generally resulted in improved economic performance inrecent years, there can be no assurance that these levels of performance can be sustained. Similarly, whileDubai and the UAE have enjoyed significant economic growth and relative political stability in recentyears, there can be no assurance that such growth or stability will continue. To the extent that economicgrowth or performance in Dubai or the UAE slows or begins to decline, our financial condition, results ofoperations and prospects may be adversely affected. In addition, the implementation by the governmentsof Dubai or the UAE of restrictive fiscal or monetary policies or regulations, or new legal interpretationsof existing regulations, introducing taxation, interest rates or exchange controls could have a materialadverse effect on our business, financial condition, results of operations and prospects.
20
www.global-reports.com
A deterioration of political relations in the Middle East may adversely affect our business.
The Middle East has experienced varying degrees of political instability over the past 50 years. Because ourbusiness relies heavily on our presence and sales in the UAE, future armed conflicts or political instabilityin the Middle East could impact our operations and have a material adverse effect on our financialcondition and results of operations. In particular, any blockage of, or other event affecting, the Strait ofHormuz or other political or military disruptions in the Arabian Gulf could prevent our shipping linecustomers from reaching the ports at which we operate in the UAE, including through prohibitiveincreases in their insurance premiums.
Instability in the Middle East may result from a number of factors, including government or militaryregime change, civil unrest or terrorism. Within the Middle East, extremists have engaged in a campaign,sometimes violent, against various governments in the region and terrorists have struck both military andcivilian targets. There can be no assurance that extremists or terrorist groups will not escalate violentactivities in the Middle East or that the governments of the Middle East will be successful in maintainingthe prevailing levels of domestic order and stability. Any of the foregoing circumstances could have amaterial adverse effect on the political and economic stability of the Middle East and, consequently, on ourbusiness, results of operations, financial condition and prospects. For a discussion of additional risks thatwe face in these and other countries, see ‘‘—Risks Relating to our Ports Business—We are subject to therisks of political, social and economic instability associated with countries and regions in which we operateor may seek to operate’’.
Our future leverage could adversely affect our ability to raise additional capital to fund our operations, limit ourability to react to changes in the economy or the industries in which we operate and prevent us from meeting our debtobligations.
We and our subsidiaries may incur substantial additional indebtedness in the future, subject to therestrictions contained in our debt agreements, which could, among other things:
� increase our vulnerability to general economic and industry conditions;
� require a substantial portion of cash flow from operations to be dedicated to the payment ofprincipal and interest on our indebtedness, thereby reducing our ability to use our cash flow tofund our operations, capital expenditures and future business opportunities and to pay dividends;
� expose us to the risk of increased interest rates with respect to our borrowings at variable rates ofinterest, unless we are able to fully hedge our interest rate exposure with respect to suchborrowings;
� restrict us from making strategic acquisitions or cause us to make non-strategic divestitures;
� limit our ability to obtain additional financing for working capital, capital expenditures, productdevelopment, debt service requirements, acquisitions and general corporate or other purposes;and
� limit our ability to adjust to changing market conditions and place us at a competitivedisadvantage compared to our competitors who are less highly leveraged.
Any of the foregoing consequences could have a material adverse effect on our business, results ofoperations, financial condition and prospects.
Our debt agreements contain restrictions that limit our flexibility in operating our business.
Our debt agreements contain various covenants that limit our ability to engage in specified types oftransactions. These covenants limit our and our restricted subsidiaries’ ability to, among other things:
� incur or guarantee additional financial indebtedness or issue certain redeemable shares;
� grant security or create any security interests; and
� consolidate, merge or sell or otherwise dispose of any of our assets.
In addition, certain of our debt agreements contain, and future agreements may contain, cross-defaultclauses whereby a default under one of our debt agreements may constitute an event of default underother of our debt agreements.
21
The agreement governing the Syndicated Loan Facility also requires us to satisfy and maintain a specifiedratio of total debt to total debt plus equity and other financial condition tests. Our ability to meet thisfinancial ratio and such tests can be affected by events beyond our control, and we cannot assure you thatwe will meet this ratio and such tests. A breach of any of these covenants would result in a default underthe Syndicated Loan Facility, which may allow the lenders to declare all amounts outstanding thereunderto be immediately due and payable and terminate all commitments to extend further credit.
For further information regarding the Syndicated Loan Facility, including the undertakings and covenantsincluded therein, see ‘‘Management’s Discussion and Analysis of Financial Condition and Results ofOperations—Liquidity and Capital Resources—Working Capital and Indebtedness—Revolving CreditSyndicated Facility’’.
Because we have operated as a private company, we have limited experience complying with public companyobligations and fulfilling these obligations will be expensive and time consuming and may divert our management’sattention from the day-to-day operation of our businesses.
While certain of our directors and senior management have experience running a public company, we havebeen operated historically as a privately-owned company and, accordingly, many of our seniormanagement have limited experience managing a publicly-traded company and limited experiencecomplying with the increasingly complex laws pertaining to public companies. In particular, the significantregulatory oversight and reporting obligations imposed on public companies will require substantialattention from our senior management and may divert its attention away from the day-to-day managementof our businesses, which could materially and adversely impact our business operations. Similarly,corporate governance obligations, including with respect to the development and implementation ofappropriate corporate governance policies, and concurrent service on our Board of Directors and possiblymultiple board committees will impose additional burdens on our non-executive directors.
In addition, as a public company, we will incur significant legal, accounting and other expenses that we didnot incur as a private company. We will also incur costs associated with our public company reportingrequirements and expect that being a public company will make it more expensive for us to hire directorsand to obtain director and officer liability insurance. We may be required to accept reduced policy limitsand coverage or incur substantially higher costs to obtain the same or similar coverage. Further, we mayneed to hire additional accounting, financial and compliance staff with appropriate public companyexperience and technical accounting knowledge. We cannot predict or estimate the amount of additionalcosts that we may incur or the timing of such costs. Any of these expenses could harm our business,operating results and financial condition.
If we fail to retain and attract qualified and experienced employees, our business may be harmed.
If we are unable to retain experienced, capable and reliable personnel, especially senior and middlemanagement with appropriate professional qualifications, or fail to recruit appropriate professional andtechnical staff in pace with our growth, our business and financial results may suffer. Experienced andcapable personnel in the container terminal industry remain in high demand, and there is continualcompetition for their talents. In particular, because of the significant growth in the container terminalindustry over the past 15 years, there is an industry-wide shortage of container terminal operatingmanagers. Consequently, when talented employees leave, we may have difficulty, and incur additionalcosts, replacing them. The loss of any member of our senior management team or any of our terminalmanagers may result in: (i) a loss of organisational focus; (ii) poor execution of operations; and (iii) aninability to identify and execute potential strategic initiatives such as expansion of capacity. These adverseresults could, among other things, reduce potential revenue, prevent us from diversifying our service linesand expose us to downturns in the markets in which we operate, all of which could adversely affect ourbusiness, results of operations, financial condition and prospects.
We may not maintain sufficient insurance coverage for the risks associated with the operation of our business.
Our operations may be affected by a number of risks, including terrorist acts and war-related events, forwhich full insurance cover is either not available or not available on commercially reasonable terms. Inaddition, the severity and frequency of various other events, such as accidents and other mishaps, businessinterruptions or potential damage to our facilities, property and equipment caused by inclement weather,human error, pollution and labour disputes, as well as risks relating to our provision of services tocustomers, including, with respect to our container terminal operations, damage to customers’ property,
22
www.global-reports.com
delays, misrouting of cargo and documentation errors, may result in losses or expose us to liabilities inexcess of our insurance coverage or significantly impair our reputation. We cannot assure you that ourinsurance coverage will be sufficient to cover the loss arising from any or all such events or that we will beable to renew existing insurance cover on commercially reasonable terms, if at all.
Should an incident occur in relation to which we have no insurance cover or inadequate insurance cover,we could lose the capital invested in, and anticipated future revenues relating to, any property that isdamaged or destroyed and, in certain cases, we may remain liable for financial obligations related to theimpacted property. Similarly, in the event that any assessments are made against us in excess of any relatedinsurance cover that we may maintain, our assets could be subject to attachment, confiscation or restraintunder various judicial procedures. Any of these occurrences could have a material adverse effect on ourbusiness, financial condition and results of operations.
We are exposed to credit risk with respect to our customers, and our business could be adversely affected if ourcustomers default on their obligations to us.
Because of the significant consolidation that has occurred in the container shipping line industry in recentyears, we rely on a small number of customers for a substantial portion of our business. For the year endedDecember 31, 2006, our five and ten largest customers accounted for approximately 42% and 59%,respectively, of the full-year gross throughput for all terminals held by us as of December 31, 2006(excluding the six container terminals operated by POPNA, the two Shekou Terminals and the oneColombo Terminal). While we seek to limit our credit risk by setting credit limits for individual customers,taking financial guarantees from customers and monitoring outstanding receivables, our customers may inthe future default on their obligations to us due to bankruptcy, lack of liquidity, operational failure orother reasons. Our credit risk is increased by the fact that our largest customers operate in the sameindustry and therefore may be similarly affected by changes in economic and other conditions. In addition,we are often unable to obtain reliable information regarding the financial condition of many of ourcustomers because they are privately-held companies and have no obligation to make such informationpublicly available. Delayed payment, non-payment or non-performance on the part of one or more of ourmajor customers, or a number of our smaller customers, could have a material adverse effect on ourfinancial condition, including cashflow, and results of operations.
Fluctuations in currency exchange rates could have an adverse effect on our results of operations.
Because we present our financial statements in US dollars, we are exposed to risks related to thetranslation of assets and liabilities denominated in foreign currencies. As of June 30, 2007, approximately71.7% of our assets were denominated in foreign currencies. As a result, currency fluctuations can have animpact on our balance sheet.
In addition to these translation risks, we are exposed to transaction risks as a result of differences in thecurrency mix of our operating revenue, on the one hand, and cost of sales, on the other hand. For example,the majority of the operating revenues for our container terminal operations in India is denominated inUS dollars, while the majority of the operating costs for such operations is denominated in Indian Rupees.These imbalances have negatively impacted the results of such operations in recent years as a result of theweakening US dollar. See ‘‘Management’s Discussion and Analysis of Financial Condition and Results ofOperations—Factors Affecting Financial Condition and Results of Operations—Foreign ExchangeMovements’’.
Although we currently hedge some of our exchange rate exposure by entering into swap and/or othercurrency exchange rate hedging transactions, there can be no assurance that such transactions will fullyprotect us from exchange rate risk or that we will continue to be able to enter into such arrangements oncommercially reasonable terms. Accordingly, we cannot assure you that future exchange rate fluctuationsbetween the US dollar and the currencies of countries in which we operate will not have a material adverseeffect on our business, financial condition, results of operations and prospects.
Increases in interest rates may adversely affect our financial condition.
The variable rate debt portion of our interest bearing loans and borrowings is subject to interest rate riskresulting from fluctuations in the relevant reference rates underlying such debt. Consequently, any increasein such reference rates will result in an increase in our interest rate expense and may have a materialadverse effect on our financial condition and results of operations. As of June 30, 2007, approximately$5.1 billion of our interest bearing loans and borrowings, comprising US dollar, Pound Sterling and
23
Australian and Canadian dollar borrowings, carried interest at floating rates. A hypothetical 1% change ininterest rates on this portion of our interest bearing loans and borrowings would result in a change in ourinterest expense of approximately $51 million per year. On July 6, 2007, we repaid $3.2 billion ofborrowings under the Amended & Restated Credit Facility, which carried interest at floating rates, withthe net proceeds from the issuances of the Senior Notes and the Certificates, which carry interest at fixedrates. In addition, there can be no assurance that, upon the expiration of our current hedgingarrangements, we will be able to enter into future interest rate hedging transactions on commerciallyreasonable terms, if at all, or that these agreements, if entered into, will protect us fully against our interestrate risk in the future. Any future unhedged interest rate risk may result in an increase in our interestexpense and may have a material adverse effect on our financial condition and results of operations.
The discontinuation of any of the preferential tax treatments currently available to us may increase our taxliabilities and decrease our profitability.
Certain of our container terminal operations located in India and China benefit from tax ‘‘holiday’’ orsimilar awards, which exempt us from paying tax on our profits or, in the case of India, allow us to pay areduced rate of tax on our profits, in each case, for a specified period of time but do not extend to thedividend distribution of such profits. In India, we also pay a significantly deducted rate of customs dutieson our imports of capital goods as a result of the Export Promotion Capital Goods Scheme (‘‘EPCGScheme’’), which reduces the customs duties on imports of capital goods on the basis that certainprescribed levels of exports are achieved. As a result of these tax awards, our overall tax charge is less thanit would otherwise be in the absence of such awards. These tax awards expire at various times between2010 and 2016 and, upon their expiration, we will be required to pay tax on our profits at the normal ratefor the relevant country. In addition, if we fail to meet the prescribed level of exports in India under theEPCG Scheme, we will be liable to pay the full rate of customs duties on our imports of capital goods.There can be no assurance that the tax awards that we currently enjoy will remain unchanged and anychange in respect of one or more such awards may materially adversely affect our tax liabilities andprofitability.
Risks Relating to our Ports Business
We face significant competition in the container terminal industry for concessions and throughput, which couldadversely affect our ability to maintain or increase our market share and profitability.
The global container terminal industry is highly competitive. We face significant competition from otherglobal container terminal operators, as well as smaller regional operators situated in the same locales as us,for both concessions, which allow us to operate in a particular port, and, once we have establishedoperations in a specific location, throughput. While we compete with other terminal operators for bothtranshipment and O&D throughput on the basis of location, productivity, accessibility, connectivity, priceand value added services, because transhipment throughput can be more easily routed through alternativeports and terminals, competition for transhipment throughput tends to be more price-sensitive and lesscaptive than O&D throughput. For the year ended December 31, 2006, approximately 24% of our grossthroughput was transhipment.
We compete with other terminal operators for concessions primarily on the basis of the concession ratesthat will be paid to the owner of the relevant port. When choosing a concessionaire, however, governmentsor other port owners may also consider other factors, including, among other things, the extent of theregional dominance exhibited by a proposed concessionaire. Consequently, we may face a competitivedisadvantage when competing for new concessions in regions or countries, such as India and Australia, inwhich we are the market-leading terminal operator.
The container terminal industry has in recent years experienced, and continues to experience, significantconsolidation, both internally and with the container shipping industry. According to Drewry, the fourlargest terminal operators by throughput and capacity, Hutchison Port Holdings (‘‘HPH’’), PSAInternational (‘‘PSA’’), APM Terminals (‘‘APMT’’) and us (after giving effect to the P&O Acquisition),collectively accounted for approximately 44.1% of global gross capacity as of December 31, 2006 and45.8% of global gross throughput for the year ended December 31, 2006. Consolidation within thecontainer terminal industry results in us having to compete with other terminal operators that may belarger than we are and have greater financial resources than we do and therefore may be able to bid athigher concession rates, invest more heavily or effectively in their facilities or withstand price competition
24
www.global-reports.com
and price volatility more successfully than we can. In addition, some of our competitors may have broaderoperational experience and longer standing relationships with international shipping companies.
Consolidation between the container terminal and container shipping industries has also had the effect ofboth reducing the number of shipping customers available to us and increasing the access that ourcompetitors have to the major shipping lines. Although we have entered into partnerships with shippinglines at certain of our terminals, we do not have an equity relationship with a major shipping company. Wecannot assure you that consolidation within the container terminal industry or between the containerterminal and container shipping industries will not become more prevalent or that our competitors will notundertake additional mergers and acquisitions to increase their capacity, economies of scale and financialand market strength.
If we are unable to compete effectively against our competitors, we may not be able to maintain or increaseour market share and may be forced to increase our concession rate bids or lower our fees, which couldhave a material adverse effect on our financial conditions, results of operations and prospects.
Our results of operations may fluctuate as a result of global trading volumes.
Our results of operations are affected by the volume of our business, which in turn depends on worldwidetrade volumes as well as the import and export volumes of the regions in which we operate. Global tradevolumes and the import and export volumes of the regions in which we operate are significantly affected bychanges in global and regional economic, financial and political conditions that are outside of our control,including as a result of the imposition of trade barriers, sanctions, boycotts and other measures, significantvariations in the exchange rates applicable to currencies in the regions in which we operate, trade disputesand work stoppages, particularly in the transportation services industry, and acts of war, hostilities, naturaldisasters, epidemics or terrorism. Any future deterioration in global and regional economic conditionscould have an adverse effect on our business, financial condition and results of operations, as well as ourfuture growth. See ‘‘—We are subject to the risks of political, social and economic instability associatedwith countries and regions in which we operate or may seek to operate’’ below.
Our inability to maintain and renew concession agreements at our existing facilities may adversely affect ourfinancial condition and results of operations.
Substantially all terminal operations in the container terminal industry are conducted pursuant tolong-term operating concessions or leases entered into by a terminal operator and the owner of a relevantport, typically a governmental entity. Concession agreements often contain clauses that allow the owner ofa port to cancel the agreement, impose penalties on us if we do not meet specified investment obligations,which, especially in the case of investments designed to reduce the environmental impact of a particularoperation, can be substantial, or require minimum payments based on previously estimated throughput,regardless of actual throughput handled. Similarly, because many of the counterparties to concessionagreements are governmental entities, terminal operators, including us, are subject to the risk thatconcession agreements may be cancelled because of political, social or economic instability. See ‘‘—We aresubject to the risks of political, social and economic instability associated with countries and regions inwhich we operate or may seek to operate’’ below. We cannot provide any assurance that one or more ofour existing concession agreements will not be prematurely cancelled or that we will not be penalised, withor without cause, by the applicable counterparty.
In advance of the expiration of a concession agreement, the owner of a port will typically agree to renewthe concession with the existing concessionaire, but often only after significant renegotiation that usuallyinvolves, among other things, a commitment on the part of the concessionaire to make capital expenditureswith respect to the relevant operation. We cannot assure you that we will be able to renew our concessionagreements upon their expiration on commercially reasonable terms, if at all, or that we would be thewinning bidder in any re-tender of one or more of our existing concessions should the relevant port ownerelect not to renew the relevant concession agreement with us. If we are unable to renew one or more of ourconcession agreements on commercially reasonable terms on or before their expiration dates, the capacityof our terminal portfolio will be reduced by the amount of capacity provided by the terminals associatedwith such concession agreements and our profitability, geographic reach and/or prospects may be adverselyaffected.
25
We are dependent on a small number of customers for a significant portion of our business.
For the year ended December 31, 2006, our five and ten largest customers accounted for approximately42% and 59%, respectively, of the full-year gross throughput for all terminals held by us as ofDecember 31, 2006 (excluding the six container terminals operated by POPNA, the two Shekou Terminalsand the one Colombo Terminal). Our major customers are global and regional shipping companies withwhom we enter into contracts of a duration typically ranging from two to five years, which usually containprovisions that allow our shipping line customers to terminate the contract early. The container shippingindustry has undergone significant consolidation over the past 15 years, both internally and with thecontainer terminal industry. See ‘‘—We face significant competition in the container terminal industry forconcessions and throughput, which could adversely affect our ability to maintain or increase our marketshare and profitability’’ above. According to Drewry, the share of container trade volume carried by thetop ten global container shipping lines was 46.8% in 2006. In addition, two of the top ten global containershipping lines currently have direct equity relationships with two of our three largest competitors. Becauseof this consolidation, we cannot assure you that, were we to lose all or a significant portion of the businessprovided by one or more of our major customers, we would be able to obtain business from othercustomers in amount sufficient to replace any such lost sales or, if we were able to obtain business fromother customers, that it would be on commercially reasonable terms.
Our operations could be adversely affected by terrorist attacks, natural disasters or other catastrophic events beyondour control.
Our business operations could be adversely affected or disrupted by terrorist attack, natural disasters (suchas earthquakes, floods, tsunamis, hurricanes, fires or typhoons) or other catastrophic or otherwisedisruptive events, including, but not limited to:
� changes to predominant natural weather, hydrologic and climatic patterns, including sea levels;
� the amount of silting that occurs in the areas around and leading to our facilities;
� invasion, piracy, sabotage, rebellion, revolution, insurrection, military or usurped power, war andradioactive or other material environmental contamination;
� riots or other forms of civil disturbance;
� any recurrence of SARS or outbreak of Avian Flu or other contagious disease, which mayadversely affect global or regional trade volumes or customer demand with respect to cargotransported to or from affected areas;
� denial of the use of any railway, port, airport, shipping service or other means of public transport;and
� strike or lock-out or other industrial action by workers or employers.
The occurrence of any of these events at one or more of our facilities or in the regions in which we operatemay cause delays in the arrival and departure of vessels or disruptions to our operations in part or inwhole, may increase the costs associated with dredging activities, may subject us to liability or impact ourbrand and reputation and may otherwise hinder the normal operation of our container terminals, whichcould materially affect our financial conditions, results of operations and prospects. The effect of any ofthese events on our financial condition and results of operations may be worsened to the extent that anysuch event involves risks for which we are uninsured or not fully insured. See ‘‘—Risks Relating to theCompany—We may not maintain sufficient insurance coverage for the risks associated with the operationof our business’’ above.
For risks relating to instability in the Middle East, see ‘‘—Risks Relating to the Company—A deteriorationof political relations in the Middle East may adversely affect our business’’ above.
Additional security requirements may increase our operating costs and restrict our ability to conduct ourports business.
In recent years, various international bodies and governmental agencies and authorities in the countries inwhich we operate have implemented numerous security measures that affect our container terminaloperations and the costs associated with such operations. The most recent examples of new securitymeasures that affect our ports business include the International Ship and Port Facility Security Code(‘‘ISPS Code’’), which was implemented in 2004, and, to the extent that our terminals handle cargo destined
26
www.global-reports.com
for the United States, the global security initiatives emanating from the US Safe Ports Act of 2006,specifically the Container Security Initiative (‘‘CSI’’) and the Secure Freight Initiative (‘‘SFI’’). The ISPSCode is a comprehensive set of measures designed to enhance the security of ships and port facilities andrequires us and our staff to, among other things, gather and assess information related to shippers andcargos, maintain communication protocols, restrict access to our facilities as appropriate, provide themeans to raise alarms, establish vessel and port security plans, and ensure training and drills areconducted. The SFI and CSI programmes are designed to improve US port security by requiring theadvance transmission of manifest documentation and technical images of pre-screened containers beforethey reach US ports. Failure on our part to comply with the security requirements applicable to us orobtain relevant security-related certifications may, among other things, prevent certain shipping linecustomers from using our facilities and result in higher insurance premiums, which could have a materialadverse effect on our financial condition, results of operations and prospects.
In addition, new security measures or updated regulatory compliance requirements, which may beinfluenced by political or other considerations not aligned with our interests, may be introduced at anytime, including in connection with the new EU ‘‘Approved Economic Operator’’ Customs SecurityProgram, the US Customs-Trade Partnership Against Terrorism and other government-to-industryinitiatives, and ensuring our compliance with such measures or requirements may involve considerabletime and resources on our part. The costs associated with existing and any additional or updated securitymeasures will negatively affect our operating income to the extent that we are unable to recover the fullamount of such costs from our customers, who generally also have faced increased security-related costs,or, in certain cases, the owners of the ports in which we operate. Similarly, additional security measuresthat require us to increase the scope of our screening procedures may effectively reduce the capacity of,and increase congestion at, our terminals, which may negatively affect our financial condition and resultsof operations.
We rely on security procedures carried out at other port facilities and by our shipping line customers, which areoutside of our control.
We inspect cargo that enters our terminals in accordance with the inspection procedures prescribed by, andunder the authority of, the governmental body charged with oversight of the relevant port. We also rely onthe security procedures carried out by our shipping line customers and the port facilities that such cargohas previously passed through to supplement our own inspection to varying degrees. We attempt tomitigate security-related risks as much as possible and believe that we maintain standards for security atour terminals, including with respect to compliance with the ISPS Code and internationally-recognisedefficient security management systems, that meet or exceed those generally adopted by the containerterminal industry. However, we cannot guarantee that none of the cargo that passes through our terminalswill be impacted by breaches in security or acts of terrorism either directly against us or indirectly in otherareas of the supply chain that will impact on us. A security breach or act of terrorism that occurs at one ormore of our facilities, or at a shipping line or other port facility that has handled cargo before us, couldsubject us to significant liability, including the risk of litigation and loss of goodwill. In addition, a majorsecurity breach or act of terrorism that occurs at one of our facilities or one of our competitors’ facilitiesmay result in a temporary shutdown of the container terminal industry and/or the introduction ofadditional or more stringent security measures and other regulations affecting the container terminalindustry, including us. See ‘‘—Additional security requirements may increase our operating costs andrestrict our ability to conduct our ports business’’ above. The costs associated with any such outcome couldhave a material adverse effect on our financial condition, results of operations and prospects.
We are subject to the risks of political, social and economic instability associated with countries and regions in whichwe operate or may seek to operate.
We conduct our business in a number of countries and regions with developing economies, many of whichdo not have firmly established legal and regulatory systems and some of which from time to time haveexperienced economic or political instability. Some of these countries are also in the process oftransitioning to a market economy and, as a result, are experiencing changes in their economies and theirgovernment policies that can affect our investments in these countries. Governments in these jurisdictionsand countries, as well as in more developed jurisdictions and countries, may be influenced by political orcommercial considerations outside of our control, and may act arbitrarily, selectively or unlawfully,including in a manner that benefits our competitors.
27
Specific country risks that may have a material adverse effect on our financial condition and results ofoperations include:
� political instability and violence;
� war and civil disturbance;
� government interventions, including expropriation or nationalisation of assets, increasedprotectionism and the introduction of tariffs or subsidies;
� changing fiscal, regulatory and tax regimes;
� arbitrary or inconsistent government action, including capricious application of tax laws andselective tax audits;
� cancellation, nullification or unenforceability of contractual rights; and
� underdeveloped industrial and economic infrastructure, including railway and road systems thatare unable to deal with the high volumes handled at a particular terminal.
In addition, to the extent that any of our operations is located in a country or region that is designated aHull, War, Strikes, Terrorism and Related Perils Listed Area by Lloyd’s Joint War Committee, shippinglines must pay war risk premiums in respect of insurance that they obtain for vessels travelling in suchareas. Three of our container terminals are located in countries that are currently designated Hull, War,Strikes, Terrorism and Related Perils Listed Areas, namely Djibouti, Saudi Arabia and Pakistan. Such adesignation could negatively affect the decisions of our shipping line customers to continue to call at theseterminals.
Changes in investment policies or shifts in the prevailing political climate in any of the countries in whichwe operate could result in the introduction of increased government regulations with respect to, amongother things:
� price controls;
� export, import and throughput controls;
� income and other taxes;
� environmental legislation;
� foreign ownership restrictions;
� foreign exchange and currency controls;
� labour and welfare benefit policies; and
� land and water use.
As the political, economic and social environments in certain countries in which we have made, or mayconsider making, investments remain subject to continuing development, investments in such countries arecharacterised by a significant degree of uncertainty. Any unexpected changes in the political, social,economic or other conditions in such countries, or in countries that neighbour such countries, could have amaterial adverse effect on the investments that we have made or may make in the future, which in turncould have a material adverse effect on our financial condition and results of operations. For risks relatingto political and economic conditions in Dubai, the UAE and the Middle East, see ‘‘—Risks Relating to theCompany—We are subject to political and economic conditions in Dubai, as well as the UAE as a whole’’and ‘‘—Risks Relating to the Company—A deterioration of political relations in the Middle East mayadversely affect our business’’ above.
We are subject to a wide variety of regulations and may face substantial liability if we fail to comply with existing orfuture regulations applicable to our businesses.
Our terminal operations are subject to extensive international, national and local laws and regulationsgoverning, among other things, the fees that we are permitted to charge at certain ports, the loading,unloading and storage of hazardous materials, environmental protection and health and safety. Our abilityto operate our ports business is contingent on our ability to comply with these laws and regulations and toobtain, maintain and renew as necessary related permits and licences from governmental agencies andauthorities in the countries in which we operate. As the laws and regulations governing our terminal
28
www.global-reports.com
operations are not uniform across the countries in which we operate, we are exposed to the costs andadministrative difficulties involved in keeping ourselves informed of new and evolving legislation andregulations that span many jurisdictions. Because of the complexities involved in ensuring compliance withdifferent and sometimes inconsistent national and international regulatory regimes, we cannot assure youthat we will remain in compliance with all of the regulatory and licensing requirements imposed on us byeach relevant jurisdiction. Our failure to comply with all applicable regulations and obtain and maintainrequisite certifications, permits and licences could lead to substantial penalties, including criminal oradministrative penalties, other punitive measures and/or increased regulatory scrutiny, trigger a defaultunder one or more of our financing agreements or invalidate or increase the cost of the insurance that wemaintain for our ports business. Additionally, our failure to comply with regulations that affect our staff,such as health and safety regulations, could affect our ability to attract and retain staff. See ‘‘—RisksRelating to the Company—If we fail to retain and attract qualified and experienced employees, ourbusiness may be harmed’’ above. We could also incur civil liabilities such as abatement and compensationfor loss in amounts in excess of, or that are not covered by, our insurance. See ‘‘—Risks Relating to theCompany—We may not maintain sufficient insurance coverage for the risks associated with the operationof our business’’ above. For the most serious violations we could also be forced to suspend operations untilwe obtain such certifications, permits or licences or otherwise bring our operations into compliance.
In addition, changes to existing regulations or tariffs or the introduction of new regulations or licensingrequirements are beyond our control and may be influenced by political or commercial considerations notaligned with our interests. Any such regulations, tariffs and licensing requirements could adversely affectour business by reducing our revenue, increasing our operating costs or both and we may be unable tomitigate the impact of such changes. For example, the Tariff Authority for Major Ports in India reduced thestevedoring tariff payable at DP World Nhava Sheva by 16% in July 2005 and an additional 12% inMay 2006, which, although significantly offset by the effects of cost reductions, higher volumes and revenueenhancement measures, adversely affected revenues and profits at the terminal. Further or future tariffreductions at one or more of our terminals could have a negative effect on our results of operations.
Finally, any expansion of the scope of the regulations governing our environmental obligations, inparticular, would likely involve substantial additional costs, including costs relating to maintenance andinspection, development and implementation of emergency procedures and insurance coverage or otherfinancial assurance of our ability to address environmental incidents or external threats. If we are unable tocontrol the costs involved in complying with these and other laws and regulations, or recover the fullamount of such costs from our customers, our business, financial condition and results of operations couldbe adversely affected.
Policies relating to the container terminal industry are currently being reviewed in the United Kingdom and the restof the EU, and any changes required by those reviews could have a material effect on the financial condition andresults of operations on operators in these markets.
In June 2006, following the rejection by the European Parliament in January 2006 of the second iterationof a proposed ports services directive, the European Commission launched a consultation to redefine thefoundations of the future EU ports policy. It is contemplated that this policy will address, among otherthings, necessary investments for meeting EU port capacity needs, competition, rules for publiccontribution to investments and environmental and social concerns. Similarly, in connection with its reviewof the policy framework for ports in the United Kingdom, the UK Government issued for public commentin May 2006 a discussion document that examines, among other things, the likely future demand for UKport capacity, the means of ensuring sustainable development, the relative importance of regionaldevelopment objectives in encouraging the future provision of UK ports capacity and the appropriate levelof government aid for smaller UK ports. In July 2007, the UK Government published an interim reportthat set out some of the findings from its ports policy review and will be followed by a more detailed reportupon completion of the review. A report on the European Commission’s consultation is expected to befinalised in the fourth quarter of 2007. Upon the completion by the European Commission and the UKGovernment of their respective reviews, we and the rest of the container terminal industry may be requiredto change aspects of the way that we conduct business in the United Kingdom and the rest of the EU,which could have a material effect on our financial condition, results of operations and prospects to theextent that current policies differ significantly from the policies ultimately promulgated by the UKGovernment and the European Commission.
29
Industrial action or adverse labour relations could disrupt our business operations and have an adverse effect onoperating results.
Our operations depend on employees who are parties to national or local collective bargainingarrangements or benefit from local applicable law, regulation or custom regarding employee rights andbenefits. If we are unable to negotiate acceptable labour agreements or maintain satisfactory employeerelations, the results could include work stoppages, strikes or other industrial action or labour difficulties(including higher labour costs) at one of our facilities or, in the case of our operations in India andAustralia, at all of our facilities in a particular country, any of which could have a material adverse effecton our operating results.
Failure in our information and technology systems could result in delays to our business operations.
Our information and technology systems are designed to enable us to use our infrastructure resources asefficiently as possible and monitor and control all aspects of our operations. Although each of ourterminals, based on the nature of its business, is configured to keep its systems operational under abnormalconditions, including with respect to business processes and procedures, any failure or breakdown in thesesystems could interrupt its normal business operations and result in a significant slowdown in operationaland management efficiency for the duration of such failure or breakdown. Any prolonged failure orbreakdown could dramatically impact our ability to offer services to our customers, which could have amaterial adverse effect on our business and results of operations. Similarly, any significant delays orinterruptions in our loading or unloading of a customer’s cargo could negatively impact our reputation asan efficient and reliable terminal operator.
In addition, we are reliant on third party vendors to supply and maintain much of our informationtechnology. In particular, as is the case for many of our competitors, a significant percentage of our coreoperations currently use information and technology systems provided by Navis, LLC (‘‘Navis’’), which werely on for related support and upgrades. In the event that Navis or one or more of the other third partyvendors that we engage to provide support and upgrades with respect to components of our informationtechnology ceased operations or became otherwise unable or unwilling to meet our needs, we cannotassure you that we would be able to replace any such vendor promptly or on commercially reasonableterms, if at all. Delay or failure in finding a suitable replacement could adversely affect our financialcondition, results of operations and prospects.
Risks Related to the Shares
There has been no prior market for the Shares and we cannot assure you that an active, stable or liquid market forthe Shares will develop.
Prior to the Global Offering, there has been no public market for the Shares and, as a result, we cannotpredict whether an active trading market will develop and continue after the Global Offering or whetherthe market price of the Shares will decline below the Offer Price. The Offer Price has been determined byagreement among the Joint Global Coordinators, the Selling Shareholder and us and may not be indicativeof the market price of the Shares after the Global Offering. Consequently, investors may not be able toresell their Shares at or above the Offer Price.
The market price of the Shares may be volatile, which could cause the value of your investment to decline.
Securities markets worldwide experience significant price and volume fluctuations. This market volatility,and corresponding fluctuations in the prices of the Shares, may not be correlated in a predictable way toour performance or operating results. Events and factors that may cause the prices of the Shares tofluctuate or decrease significantly from the Offer Price include:
� general, business, political, social and economic developments;
� variations in our actual or anticipated operating results;
� changes in the level of ongoing disclosure that we provide;
� changes in, or failure to meet, earnings estimates of securities analysts;
� failure to pay cash dividends at anticipated levels;
� regulatory actions;
30
www.global-reports.com
� changes in stock market analyst estimates or recommendations regarding us or any of our assets;
� changes in market valuations of companies in related industries;
� the determination by one or more Shari’a Supervision Boards that we are, or are not, incompliance with Shari’a principles;
� fluctuations in stock market prices and volumes, generally;
� additional issuances or future sales of the Shares or other securities exchangeable for orconvertible into the Shares;
� sales or acquisitions of a substantial number of the Shares by our directors and seniormanagement or significant shareholders, or the perception that such sales could occur;
� the addition or departure of key personnel; and
� announcements by us or our competitors of new concession agreements, acquisitions or jointventures.
Following the Global Offering, for commercial reasons, we do not intend to continue to provideoperational data regarding our terminal portfolio, including with respect to terminal development andterminal expansion projects, with the same level of specificity as that set forth in this Prospectus. Inparticular, we do not intend to update the operational data that we have provided in this Prospectus on aterminal-by-terminal basis in the future. Limitations on the scope of the operational data that we providein the future may negatively impact the market price of the Shares.
In addition, class action litigation has, in the past, been brought against companies following periods ofvolatility in the market price of those companies’ shares. Should the price of the Shares fluctuate ordecrease, we may become involved in this type of litigation, which could have a material adverse effect onour business, financial condition and results of operations. As a result of any of these factors, you may beunable to sell the Shares at or above the Offer Price.
After the Global Offering, our controlling shareholder, Dubai World, and the Government of Dubai will retain theability to exert control over us and its interests may conflict with yours and ours.
Dubai World, a holding company owned by the Government of Dubai, will retain a significant economicand voting interest in us and, therefore, will be able to exercise significant control over us. This is primarilya result of the following factors:
� immediately following the Global Offering, the Selling Shareholder will beneficially ownapproximately 80.5% of our issued and outstanding share capital (or approximately 77.0% if theOver-allotment Option is exercised in full);
� all of the members of our Board of Directors were nominated by the Selling Shareholder, whichis controlled by Dubai World; and
� Dubai World is under no obligation to support any nominees for director proposed by ourshareholders and consequently Dubai World will have the right to elect all of the members of ourBoard of Directors at any time standing for election.
Dubai World may therefore exert control over, among other things:
� election of our directors and, in turn, selection of our management;
� our business policies and strategies;
� budget approval;
� the timing and amount of dividend payments, if any, on the Shares;
� increases or decreases in share capital;
� the issuance of new debt or equity securities;
� mergers, acquisitions and disposals of our assets or businesses; and
� amendments to our constitutional documents.
31
Consequently, we cannot assure you that the resolution of any matter that may involve the interests ofDubai World will be resolved in what investors would consider to be in our or their best interests.
You will have limited control as a holder of the Shares regarding any changes we make to our policies andoperations.
Our Board of Directors determines our major policies, including those relating to our investmentobjectives, financing, growth and distributions, and our Board of Directors may amend or revise these andother policies at any time without a vote of holders of the Shares. In addition to the executive managementappointed to the Board, the day-to-day management of our business is conducted by our seniormanagement. Consequently, holders of the Shares will have limited control over changes in our policiesand our day-to-day operations. The broad discretion held by our Board and senior management withrespect to setting policies and managing our operations and the inability of holders of the Shares to exertcontrol over those policies and operations increases the uncertainty and risks that you face as a holder ofthe Shares. See ‘‘—After the Global Offering, our controlling shareholder, Dubai World, and theGovernment of Dubai will retain the ability to exert control over us and its interests may conflict with yoursand ours’’ above.
Future sales of the Shares, or the possibility or perception of such future sales, may affect the market price of theShares.
We and the Selling Shareholder have agreed, for a period of 180 days after the Closing Date, subject tocertain exceptions, not to, among other things, issue, offer, sell, contract to sell, grant options over orotherwise dispose of, directly or indirectly, any of our ordinary shares, without the prior written consent ofthe Joint Global Coordinators. Although there is no present intent or arrangement to do so, all or anyportion of such Shares may be released from such restrictions and those Shares would then be available forresale in the market. Any release would be considered on a case-by-case basis.
In the future, we may issue additional Shares in connection with acquisitions, investments or repayment ofour debt or for other purposes. The number of such Shares issued could constitute a material portion ofour then-outstanding share capital. We cannot predict what effect, if any, future sales of additional Shares,or the availability of additional Shares for future sale, will have on the market price of the Shares. Sales ofsubstantial amounts of additional Shares in the public market following the Global Offering, or theperception that sales of this type could occur, could depress the market price of the Shares and may makeit more difficult for you to sell the Shares at a time and price that you deem appropriate.
In addition, in accordance with the terms of the PCFC Development Sukuk, on the business day falling30 days after the Closing Date, each Sukukholder will receive 50% of its pro rata entitlement to the Sharesconstituting the Sukuk Allocation, with the remaining 50% to be delivered on the business day falling threemonths following the Closing Date. If a Sukukholder fails to comply with the procedures governing thedelivery of the Sukuk Allocation or is prohibited from receiving the Sukuk Allocation by virtue of theselling restrictions applicable to the Global Offering, the Principal Paying and Exchange Agent must usereasonable endeavours to dispose of the pro rata Sukuk Allocation of such Sukukholder. Consequently, tothe extent that Sukukholders do not intend to hold the Shares that they receive, or fail or are unable tocomply with the procedures governing the delivery of the Sukuk Allocation, a large number of Shares maybe sold in the secondary market shortly after the closing of the Global Offering, which may negativelyimpact the market price of the Shares. See ‘‘Description of the PCFC Development FZCO Sukuk—Redemption and Repayment’’ for more information.
We are a DIFC company that is controlled by the Government of Dubai, and it may be difficult for you to enforcejudgments against us or our directors and senior management.
We are a company limited by shares incorporated in, and under the laws issued by, the DIFC, with ourheadquarters in the Emirate of Dubai in the UAE. A substantial portion of our assets are located in anumber of jurisdictions outside the United Kingdom and the United States. In addition, certain of ourdirectors and senior management reside in Dubai and all or a portion of their personal assets may belocated in the UAE and/or other jurisdictions outside the United Kingdom and the United States. As such,it may be difficult or impossible to effect service of process within the United States or the UnitedKingdom upon us or those persons, or to recover on judgments of US or UK courts against us or them,including judgments predicated upon civil liability provisions of US federal securities laws or UK laws, asthe case may be.
32
www.global-reports.com
Further, no claim may be brought in the DIFC courts against us or our directors or senior management inthe first instance for violation of US federal securities laws because these laws have no extraterritorialapplication under DIFC law and do not have force of law in the DIFC. Similarly, you should not expect tohave recourse to the courts of the Emirate of Dubai (other than the courts of the DIFC) or to the federalcourts of the UAE.
We have been advised by our counsel that it is currently unclear as to whether the courts of the DIFCwould enforce judgments of US or UK courts obtained in actions against us or our directors or seniormanagement, predicated upon the civil liability provisions of the US federal securities laws, or originalactions brought in the DIFC against us or such persons predicated solely upon US federal securities lawsor UK laws, as the case may be. Further, we have been advised by our counsel that there is no treaty ineffect between either the United States or the United Kingdom and the UAE providing for theenforcement of judgments of US or UK courts in civil and commercial matters, and the grounds uponwhich DIFC courts may decline to enforce the judgments of US or UK courts, as the case may be, areunclear as they remain untested. Some remedies available under UK laws or the laws of US jurisdictions,including some remedies available under the US federal securities laws, may not be allowed in DIFCcourts as contrary to public policy in the DIFC. Because judgments of US and UK courts are notautomatically enforceable in the DIFC, it may be difficult for you to recover against us based upon suchjudgments. In addition, notwithstanding that the UAE acceded to the United Nations Convention on theRecognition and Enforcement of Arbitral Awards (New York 1958) in 2006, you may also have difficultiesin enforcing judgments of DIFC courts and arbitration awards ratified by DIFC courts against us or ourdirectors or senior management in jurisdictions outside the DIFC because the mechanism for enforcementof judgments and awards issued by the DIFC courts is as yet untested.
Dubai Law No. 10 of 2005 grants to the Government of Dubai and its affiliates immunity in respect of theirassets, providing that no debt or obligation owing from H.H. The Ruler of the Emirate of Dubai (the‘‘Ruler’’) or the Government of Dubai may be recovered by laying hold, attachment, sale in auction ortaking possession in any legal action of the Ruler’s or the Government of Dubai’s properties and assets,whether or not a final judgment is issued in respect of such debt or obligation. As the application of thislaw is untested, it is not clear whether it would actually apply to a company such as the Company.However, if it were to apply and be invoked, it may be difficult or impossible to enforce judgments againstthe properties or assets of the Company in the UAE.
Because we are a holding company and substantially all of our operations are conducted through our subsidiaries,unconsolidated joint ventures and associates, our ability to pay dividends on the Shares depends on our ability toobtain cash dividends or other cash payments or obtain loans from such entities.
We currently conduct substantially all of our operations through our subsidiaries, unconsolidated jointventures and associates, and such entities generate substantially all of our operating income and cash flow.Because we have no direct operations or significant assets other than the capital stock of these entities, werely on free cash flow of our subsidiaries, cash dividends from our joint ventures and associates, investmentincome, financing proceeds and other permitted payments from our subsidiaries, joint ventures andassociates to make principal and interest payments on our debt, pay operating expenses and dividends, ifany, on the Shares and pay other obligations of ours that may arise from time to time.
The ability of our subsidiaries, joint ventures and associates to make payments to us depends largely ontheir financial condition and ability to generate profits. In addition, because our subsidiaries, joint venturesand associates are separate and distinct legal entities, they will have no obligation to pay any dividends orto lend or advance us funds and may be restricted from doing so by contract, including other financingarrangements, charter provisions, other shareholders or partners or the applicable laws and regulations ofthe various countries in which they operate. Similarly, because of our holding company structure, claims ofthe creditors of our subsidiaries, joint ventures and associates, including trade creditors, banks and otherlenders, effectively have priority over any claims that we may have with respect to the assets of theseentities.
We cannot assure you that our subsidiaries, joint ventures or associates will generate sufficient profits andcash flows, or otherwise prove willing or able, to pay dividends or lend or advance us sufficient funds toenable us to meet our obligations and pay interest, expenses and dividends, if any, on the Shares. Theinability of one or more of these entities to pay dividends or lend or advance us funds could have a materialadverse effect on our business, financial condition and results of operations.
33
Payment of dividends on the Shares will be at the discretion of our Board of Directors and is subject to a number ofconsiderations and limitations. Consequently, you may not receive dividends on the Shares.
While our current dividend policy envisions the payment of dividends on the Shares, the amount andtiming of the declaration and payment of any such dividends will be at the discretion of our Board ofDirectors and will depend on, among other things, our operational performance, financial results, financialsituation and prospects, as well as cash and liquidity requirements (including capital expenditure andinvestment plans), market situation, legal restrictions, tax and such other factors as our Board of Directorsmay deem relevant at the time. Similarly, our ability to declare and pay cash dividends on the Shares maybe restricted by, among other things, restrictions contained in our debt agreements and by provisions ofDIFC law. In addition, our Board of Directors could, in its discretion, depart from or change our dividendpolicy at any time. As a result, capital appreciation, if any, realised through a resale of the Shares, if aliquid market develops, may be your sole source of gain.
Holders of the Shares in certain jurisdictions, including the United States, may not be able to exercise theirpre-emptive rights in the event that we increase our share capital.
Under our Articles of Association (the ‘‘Articles’’) to be adopted with effect from, and conditional upon,DIFX Admission, holders of the Shares generally have the right to subscribe and pay for a sufficientnumber of our ordinary shares to maintain their relative ownership percentages prior to the issuance ofany new ordinary shares in exchange for cash consideration. US holders of the Shares may not be able toexercise their pre-emptive rights unless a registration statement under the Securities Act is effective withrespect to such rights and the related ordinary shares or an exemption from the registration requirement isavailable. Similar restrictions exist in certain other jurisdictions. We currently do not intend to register theShares under the Securities Act or the laws of any other jurisdiction and no assurance can be given that anexemption from such registration requirements will be available to US or other holders of the Shares. Tothe extent that US or other holders of the Shares are not able to exercise their pre-emptive rights becauseno registration statement under the Securities Act or the laws of another jurisdiction is effective withrespect to such rights and no exemption from the registration requirement is available, pre-emptive rightswill lapse and the proportional interests of such US or other holders may be reduced.
34
www.global-reports.com

USE OF PROCEEDS
We will not receive any of the proceeds from the sale of the Shares offered by the Selling Shareholder. Allof the net proceeds from the sale of the Shares in the Global Offering, totalling approximately$3,109.3 million (or approximately $3,699.7 million if the Over-allotment Option is exercised in full) (ineach case, after deduction of commissions), will be for the account of the Selling Shareholder. All of theexpenses of the Global Offering will be paid by the Selling Shareholder. The Global Offering is beingconducted, among other reasons, to allow the Selling Shareholder to sell part of its shareholding, whileproviding increased trading liquidity in the Shares and raising our profile with the international investmentcommunity. In addition, the Global Offering will facilitate the redemption of the PCFC DevelopmentSukuk in accordance with its terms. Neither we, nor our subsidiaries, are or will be directly subject to thecovenants contained in the transaction documents governing the PCFC Development Sukuk. See‘‘Description of the PCFC Development FZCO Sukuk’’.
35
DIVIDEND POLICY
Under DIFC law and our constitutional documents, the payment of dividends is subject to therecommendation of our Board of Directors and approval by our shareholders. See ‘‘Description of ShareCapital—Our Articles of Association—Dividends’’.
Future dividend payments will depend upon a number of factors, including but not limited to, ouroperational performance, financial results, financial situation and prospects, as well as cash and liquidityrequirements (including capital expenditure and investment plans), market situation, legal, regulatory andcontractual restrictions, tax and such other factors as our Board of Directors may deem relevant at thetime. Subject to the foregoing, it is our current dividend policy that not less than 20% of our profit for theyear attributable to shareholders of the Company (after separately disclosable items) will be distributed asdividends. We do not intend to pay a dividend in respect of our pro forma results of operations for the yearended December 31, 2006 or the six months ended June 30, 2007.
Although we can make no guarantee that we will, should we declare any dividends in the future, our Sharessold in the Global Offering, including any of our Shares sold pursuant to the exercise of theOver-allotment Option, if any, will be entitled to any such dividends if the relevant record date is on orafter the Closing Date or the closing date of the Over-allotment Option, as applicable.
36
www.global-reports.com
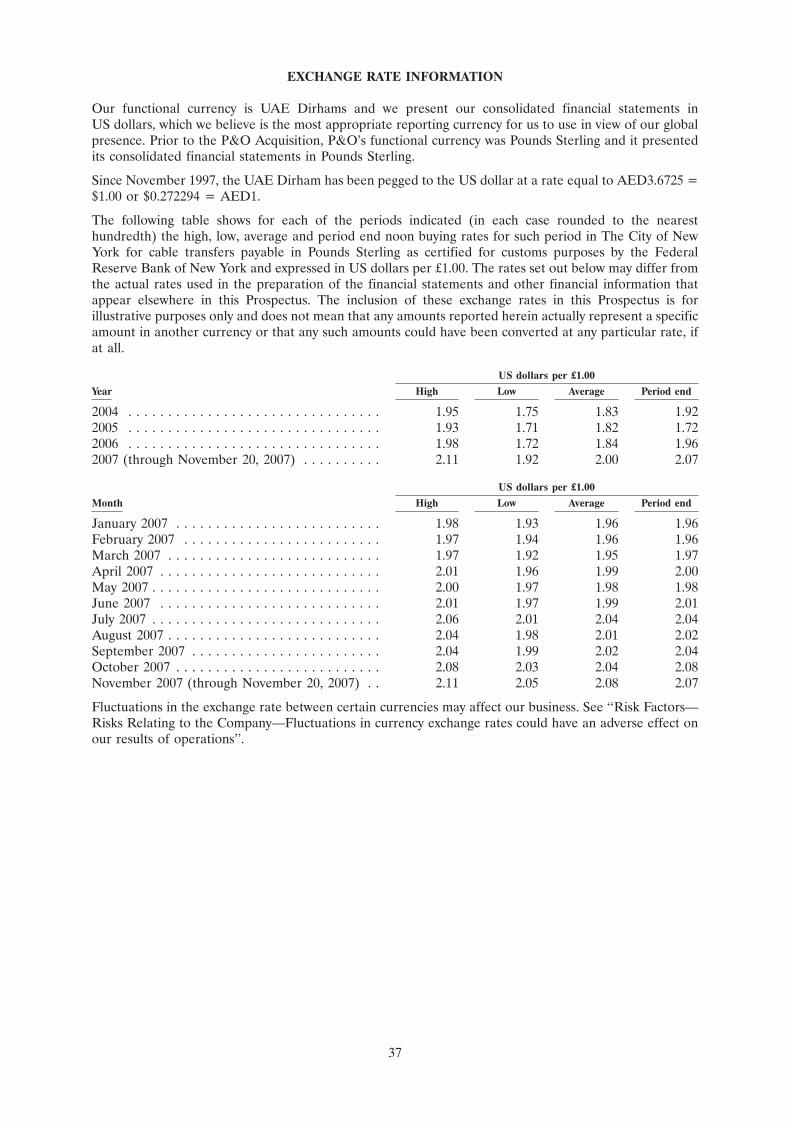
EXCHANGE RATE INFORMATION
Our functional currency is UAE Dirhams and we present our consolidated financial statements inUS dollars, which we believe is the most appropriate reporting currency for us to use in view of our globalpresence. Prior to the P&O Acquisition, P&O’s functional currency was Pounds Sterling and it presentedits consolidated financial statements in Pounds Sterling.
Since November 1997, the UAE Dirham has been pegged to the US dollar at a rate equal to AED3.6725 =$1.00 or $0.272294 = AED1.
The following table shows for each of the periods indicated (in each case rounded to the nearesthundredth) the high, low, average and period end noon buying rates for such period in The City of NewYork for cable transfers payable in Pounds Sterling as certified for customs purposes by the FederalReserve Bank of New York and expressed in US dollars per £1.00. The rates set out below may differ fromthe actual rates used in the preparation of the financial statements and other financial information thatappear elsewhere in this Prospectus. The inclusion of these exchange rates in this Prospectus is forillustrative purposes only and does not mean that any amounts reported herein actually represent a specificamount in another currency or that any such amounts could have been converted at any particular rate, ifat all.
US dollars per £1.00
Year High Low Average Period end
2004 . . . . . . . . . . . . . . . . . . . . . . . . . . . . . . . . 1.95 1.75 1.83 1.922005 . . . . . . . . . . . . . . . . . . . . . . . . . . . . . . . . 1.93 1.71 1.82 1.722006 . . . . . . . . . . . . . . . . . . . . . . . . . . . . . . . . 1.98 1.72 1.84 1.962007 (through November 20, 2007) . . . . . . . . . . 2.11 1.92 2.00 2.07
US dollars per £1.00
Month High Low Average Period end
January 2007 . . . . . . . . . . . . . . . . . . . . . . . . . . 1.98 1.93 1.96 1.96February 2007 . . . . . . . . . . . . . . . . . . . . . . . . . 1.97 1.94 1.96 1.96March 2007 . . . . . . . . . . . . . . . . . . . . . . . . . . . 1.97 1.92 1.95 1.97April 2007 . . . . . . . . . . . . . . . . . . . . . . . . . . . . 2.01 1.96 1.99 2.00May 2007 . . . . . . . . . . . . . . . . . . . . . . . . . . . . . 2.00 1.97 1.98 1.98June 2007 . . . . . . . . . . . . . . . . . . . . . . . . . . . . 2.01 1.97 1.99 2.01July 2007 . . . . . . . . . . . . . . . . . . . . . . . . . . . . . 2.06 2.01 2.04 2.04August 2007 . . . . . . . . . . . . . . . . . . . . . . . . . . . 2.04 1.98 2.01 2.02September 2007 . . . . . . . . . . . . . . . . . . . . . . . . 2.04 1.99 2.02 2.04October 2007 . . . . . . . . . . . . . . . . . . . . . . . . . . 2.08 2.03 2.04 2.08November 2007 (through November 20, 2007) . . 2.11 2.05 2.08 2.07
Fluctuations in the exchange rate between certain currencies may affect our business. See ‘‘Risk Factors—Risks Relating to the Company—Fluctuations in currency exchange rates could have an adverse effect onour results of operations’’.
37
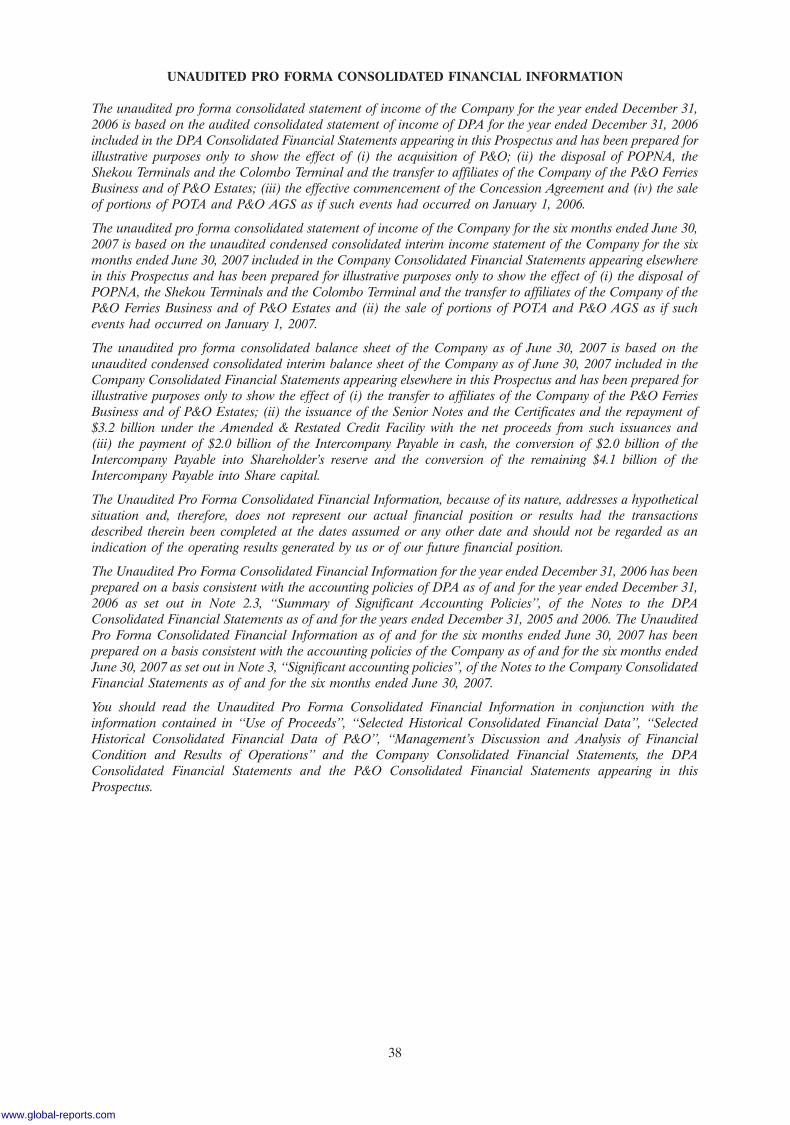
UNAUDITED PRO FORMA CONSOLIDATED FINANCIAL INFORMATION
The unaudited pro forma consolidated statement of income of the Company for the year ended December 31,2006 is based on the audited consolidated statement of income of DPA for the year ended December 31, 2006included in the DPA Consolidated Financial Statements appearing in this Prospectus and has been prepared forillustrative purposes only to show the effect of (i) the acquisition of P&O; (ii) the disposal of POPNA, theShekou Terminals and the Colombo Terminal and the transfer to affiliates of the Company of the P&O FerriesBusiness and of P&O Estates; (iii) the effective commencement of the Concession Agreement and (iv) the saleof portions of POTA and P&O AGS as if such events had occurred on January 1, 2006.
The unaudited pro forma consolidated statement of income of the Company for the six months ended June 30,2007 is based on the unaudited condensed consolidated interim income statement of the Company for the sixmonths ended June 30, 2007 included in the Company Consolidated Financial Statements appearing elsewherein this Prospectus and has been prepared for illustrative purposes only to show the effect of (i) the disposal ofPOPNA, the Shekou Terminals and the Colombo Terminal and the transfer to affiliates of the Company of theP&O Ferries Business and of P&O Estates and (ii) the sale of portions of POTA and P&O AGS as if suchevents had occurred on January 1, 2007.
The unaudited pro forma consolidated balance sheet of the Company as of June 30, 2007 is based on theunaudited condensed consolidated interim balance sheet of the Company as of June 30, 2007 included in theCompany Consolidated Financial Statements appearing elsewhere in this Prospectus and has been prepared forillustrative purposes only to show the effect of (i) the transfer to affiliates of the Company of the P&O FerriesBusiness and of P&O Estates; (ii) the issuance of the Senior Notes and the Certificates and the repayment of$3.2 billion under the Amended & Restated Credit Facility with the net proceeds from such issuances and(iii) the payment of $2.0 billion of the Intercompany Payable in cash, the conversion of $2.0 billion of theIntercompany Payable into Shareholder’s reserve and the conversion of the remaining $4.1 billion of theIntercompany Payable into Share capital.
The Unaudited Pro Forma Consolidated Financial Information, because of its nature, addresses a hypotheticalsituation and, therefore, does not represent our actual financial position or results had the transactionsdescribed therein been completed at the dates assumed or any other date and should not be regarded as anindication of the operating results generated by us or of our future financial position.
The Unaudited Pro Forma Consolidated Financial Information for the year ended December 31, 2006 has beenprepared on a basis consistent with the accounting policies of DPA as of and for the year ended December 31,2006 as set out in Note 2.3, ‘‘Summary of Significant Accounting Policies’’, of the Notes to the DPAConsolidated Financial Statements as of and for the years ended December 31, 2005 and 2006. The UnauditedPro Forma Consolidated Financial Information as of and for the six months ended June 30, 2007 has beenprepared on a basis consistent with the accounting policies of the Company as of and for the six months endedJune 30, 2007 as set out in Note 3, ‘‘Significant accounting policies’’, of the Notes to the Company ConsolidatedFinancial Statements as of and for the six months ended June 30, 2007.
You should read the Unaudited Pro Forma Consolidated Financial Information in conjunction with theinformation contained in ‘‘Use of Proceeds’’, ‘‘Selected Historical Consolidated Financial Data’’, ‘‘SelectedHistorical Consolidated Financial Data of P&O’’, ‘‘Management’s Discussion and Analysis of FinancialCondition and Results of Operations’’ and the Company Consolidated Financial Statements, the DPAConsolidated Financial Statements and the P&O Consolidated Financial Statements appearing in thisProspectus.
38
www.global-reports.com
DP WORLD LIMITED
Unaudited Pro Forma Consolidated Statement of Income
For the year ended December 31, 2006
Pro forma adjustments
Results of Disposal of POPNA,P&O from Shekou and Colombo Sale ofJanuary 1 and Transfer of P&O Impact of portions of
DPA to March 8, Estates and P&O Concession POTA and Companyhistorical 2006(1)(2) Ferries Business(3) Agreement(4) P&O AGS(5) pro forma
(US dollars in thousands)Revenue from operations . . . . . . . . . . . . $3,486,778 $ 485,448 $(1,680,670) $ — $ (215,600) $ 2,075,956Cost of sales . . . . . . . . . . . . . . . . . . . . (2,522,491) (423,178) 1,422,994 (60,000) 170,900 (1,411,775)
Gross profit . . . . . . . . . . . . . . . . . . . 964,287 62,270 (257,676) (60,000) (44,700) 664,181General and administration expenses . . . . . (524,808) (126,658) 180,792 — 32,000 (438,674)
439,479 (64,388) (76,884) (60,000) (12,700) 225,507Other income . . . . . . . . . . . . . . . . . . . . 42,933 2,800 (3,433) — — 42,300Interest income . . . . . . . . . . . . . . . . . . . 95,113 5,400 — — — 100,513Finance costs . . . . . . . . . . . . . . . . . . . . (403,082) (14,200) 11,857 — — (405,425)Share of profit (loss) of joint ventures and
associates . . . . . . . . . . . . . . . . . . . . . 35,514 9,477 (19,269) — 2,675 28,397
Profit before tax from continuingoperations . . . . . . . . . . . . . . . . . . . 209,957 (60,911) (87,729) (60,000) (10,025) (8,708)
Income tax . . . . . . . . . . . . . . . . . . . . . (12,277) 104,100 1,309 — 3,800 96,932
Profit after tax from continuingoperations . . . . . . . . . . . . . . . . . . . 197,680 43,189 (86,420) (60,000) (6,225) 88,224
Profit after tax from discontinued operations 19,233 27,137 (46,370) — — —
Profit for the year . . . . . . . . . . . . . . . $ 216,913 $ 70,326 $ (132,790) $ (60,000) $ (6,225) $ 88,224
Attributable to:Equity holder of the parent . . . . . . . . . . . $ 191,780 $ 66,826 $ (132,790) $ (60,000) $ (6,225) $ 59,591Minority interests . . . . . . . . . . . . . . . . . 25,133 3,500 — — — 28,633
Companypro forma
beforeSeparately separately
Company disclosable disclosablepro forma items(6) items
(US dollars in thousands)Revenue from operations . . . . . . . . . . . . . . . . . . . . . . . . . . . . . . . . . . . . . . . . . . $ 2,075,956 $ — $ 2,075,956Cost of sales . . . . . . . . . . . . . . . . . . . . . . . . . . . . . . . . . . . . . . . . . . . . . . . . . . (1,411,775) (29,631) (1,382,144)
Gross profit . . . . . . . . . . . . . . . . . . . . . . . . . . . . . . . . . . . . . . . . . . . . . . . . . 664,181 (29,631) 693,812General and administration expenses . . . . . . . . . . . . . . . . . . . . . . . . . . . . . . . . . . . (438,674) (122,748) (315,926)
225,507 (152,379) 377,886Other income . . . . . . . . . . . . . . . . . . . . . . . . . . . . . . . . . . . . . . . . . . . . . . . . . . 42,300 17,200 25,100Interest income . . . . . . . . . . . . . . . . . . . . . . . . . . . . . . . . . . . . . . . . . . . . . . . . 100,513 — 100,513Finance costs . . . . . . . . . . . . . . . . . . . . . . . . . . . . . . . . . . . . . . . . . . . . . . . . . . (405,425) (61,146) (344,279)Share of profit (loss) of joint ventures and associates . . . . . . . . . . . . . . . . . . . . . . . . . 28,397 — 28,397
Profit before tax from continuing operations . . . . . . . . . . . . . . . . . . . . . . . . . . . . . (8,708) (196,325) 187,617Income tax . . . . . . . . . . . . . . . . . . . . . . . . . . . . . . . . . . . . . . . . . . . . . . . . . . . 96,932 8,300 88,632
Profit after tax from continuing operations . . . . . . . . . . . . . . . . . . . . . . . . . . . . . . 88,224 (188,025) 276,249Profit after tax from discontinued operations . . . . . . . . . . . . . . . . . . . . . . . . . . . . . . — — —
Profit for the year . . . . . . . . . . . . . . . . . . . . . . . . . . . . . . . . . . . . . . . . . . . . . $ 88,224 $ (188,025) $ 276,249
Attributable to:Equity holder of the parent . . . . . . . . . . . . . . . . . . . . . . . . . . . . . . . . . . . . . . . . . $ 59,591 $ (188,025) $ 247,616Minority interests . . . . . . . . . . . . . . . . . . . . . . . . . . . . . . . . . . . . . . . . . . . . . . . 28,633 — 28,633
See the accompanyingNotes to Unaudited Pro Forma Consolidated Statement of Income
For the year ended December 31, 2006
39
DP WORLD LIMITED
Notes to Unaudited Pro Forma Consolidated Statement of Income
For the year ended December 31, 2006
(1) Results of P&O from January 1, 2006 to March 8, 2006: P&O was acquired by DP World effectiveMarch 9, 2006. Therefore, the audited financial statements of DPA as of and for the year endedDecember 31, 2006 include the results of P&O from March 9, 2006. This adjustment adds the resultsof P&O from January 1, 2006 to March 8, 2006.
(2) Tax Credits: Income tax includes tax credits of $118.3 million, which represent the release of deferredtax provisions made in prior years in Australia and India after favourable rulings by local taxauthorities, and of provisions for potential US tax liabilities related to periods that are beyond thestatute of limitations.
(3) Disposal of POPNA, Shekou and Colombo and the transfer of P&O Estates and P&O Ferries Business:This adjustment eliminates the results of operations of the businesses disposed of or transferred sinceDecember 31, 2006, which were reflected as discontinued operations in the audited financialstatements of DPA as of and for the year ended December 31, 2006 (i.e., POPNA, the ShekouTerminals, the Colombo Terminal and P&O Estates). In addition, this adjustment also eliminates theresults of the P&O Ferries Business, which was transferred post December 31, 2006 to an affiliate.Because no transfer had been agreed at December 31, 2006, the results of the P&O Ferries Businesswere reflected as continuing operations in the audited statement of income for DPA for the yearended December 31, 2006.
(4) Impact of Concession Agreement: With effect from July 1, 2006, DPA transferred all of its assets andliabilities relating to the Dubai Ports operations to DP World UAE, a subsidiary of DPA. On the dateof the transfer, property, plant and equipment were revalued and transferred at fair market value,which resulted in an additional depreciation charge of $13.0 million per annum. In addition, under theConcession Agreement, a concession fee is payable by DP World to DPA in the amount of$47.0 million per annum. The total impact of these adjustments is $60.0 million per annum.
(5) Sale of portions of POTA and P&O AGS: This adjustment gives effect to the sale of 50% of the group ofcompanies known as P&O Trans Australia (‘‘POTA’’), which operates a landside logistics business inAustralia, and 75% of the business known as P&O Automotive and General Stevedoring(‘‘P&O AGS’’), which was previously part of DP World Australia Limited and operates automotive andgeneral stevedoring businesses in Australia, and the corresponding reclassification of POTA and thenew company containing P&O AGS as associates rather than subsidiaries.
(6) Separately disclosable items: A reconciliation of historical separately disclosable items as per theaudited financial statements of DPA for the year ended December 31, 2006 and pro forma separatelydisclosable items is provided below. DPA presents, as separately disclosable items on the face of theincome statement, those material items of income and expense which, because of the nature andexpected infrequency of the events giving rise to them, merit separate presentation to allow users tobetter understand the elements of our financial performance in the period, so as to facilitate acomparison with prior periods and a better assessment of trends in our financial performance.
40
www.global-reports.com
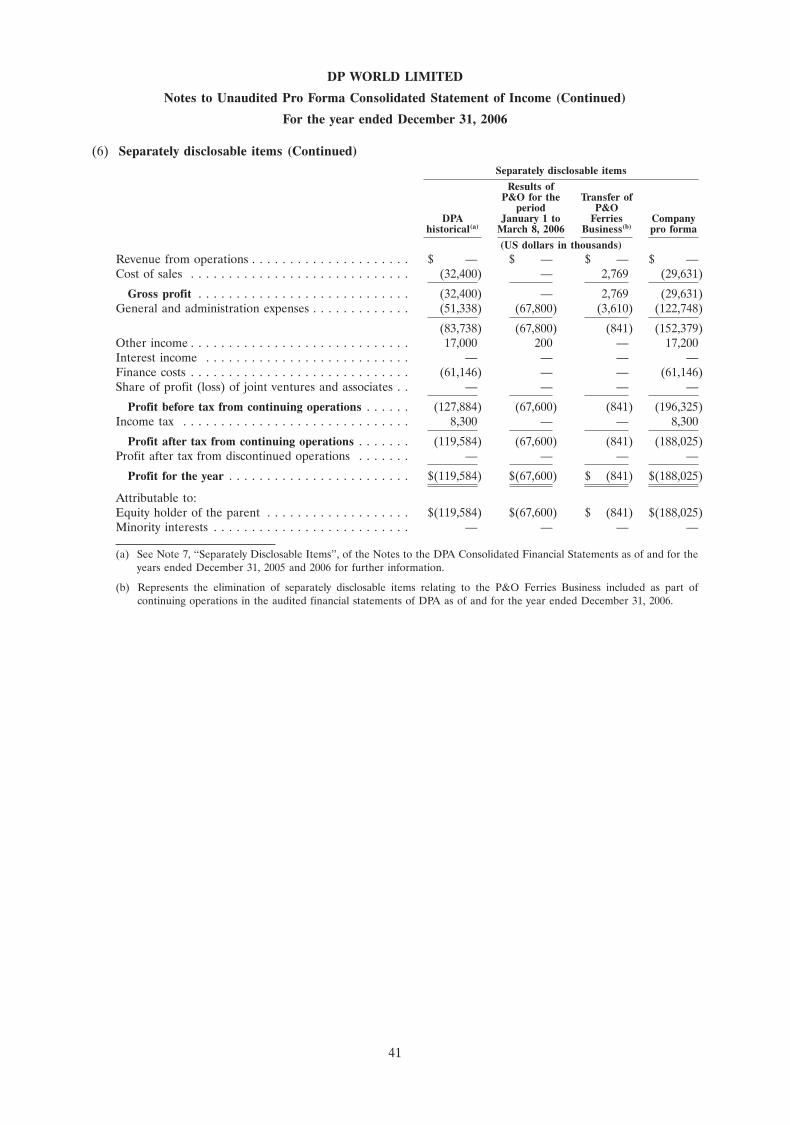
DP WORLD LIMITED
Notes to Unaudited Pro Forma Consolidated Statement of Income (Continued)
For the year ended December 31, 2006
(6) Separately disclosable items (Continued)Separately disclosable items
Results ofP&O for the Transfer of
period P&ODPA January 1 to Ferries Company
historical(a) March 8, 2006 Business(b) pro forma
(US dollars in thousands)Revenue from operations . . . . . . . . . . . . . . . . . . . . . $ — $ — $ — $ —Cost of sales . . . . . . . . . . . . . . . . . . . . . . . . . . . . . (32,400) — 2,769 (29,631)
Gross profit . . . . . . . . . . . . . . . . . . . . . . . . . . . . (32,400) — 2,769 (29,631)General and administration expenses . . . . . . . . . . . . . (51,338) (67,800) (3,610) (122,748)
(83,738) (67,800) (841) (152,379)Other income . . . . . . . . . . . . . . . . . . . . . . . . . . . . . 17,000 200 — 17,200Interest income . . . . . . . . . . . . . . . . . . . . . . . . . . . — — — —Finance costs . . . . . . . . . . . . . . . . . . . . . . . . . . . . . (61,146) — — (61,146)Share of profit (loss) of joint ventures and associates . . — — — —
Profit before tax from continuing operations . . . . . . (127,884) (67,600) (841) (196,325)Income tax . . . . . . . . . . . . . . . . . . . . . . . . . . . . . . 8,300 — — 8,300
Profit after tax from continuing operations . . . . . . . (119,584) (67,600) (841) (188,025)Profit after tax from discontinued operations . . . . . . . — — — —
Profit for the year . . . . . . . . . . . . . . . . . . . . . . . . $(119,584) $(67,600) $ (841) $(188,025)
Attributable to:Equity holder of the parent . . . . . . . . . . . . . . . . . . . $(119,584) $(67,600) $ (841) $(188,025)Minority interests . . . . . . . . . . . . . . . . . . . . . . . . . . — — — —
(a) See Note 7, ‘‘Separately Disclosable Items’’, of the Notes to the DPA Consolidated Financial Statements as of and for theyears ended December 31, 2005 and 2006 for further information.
(b) Represents the elimination of separately disclosable items relating to the P&O Ferries Business included as part ofcontinuing operations in the audited financial statements of DPA as of and for the year ended December 31, 2006.
41
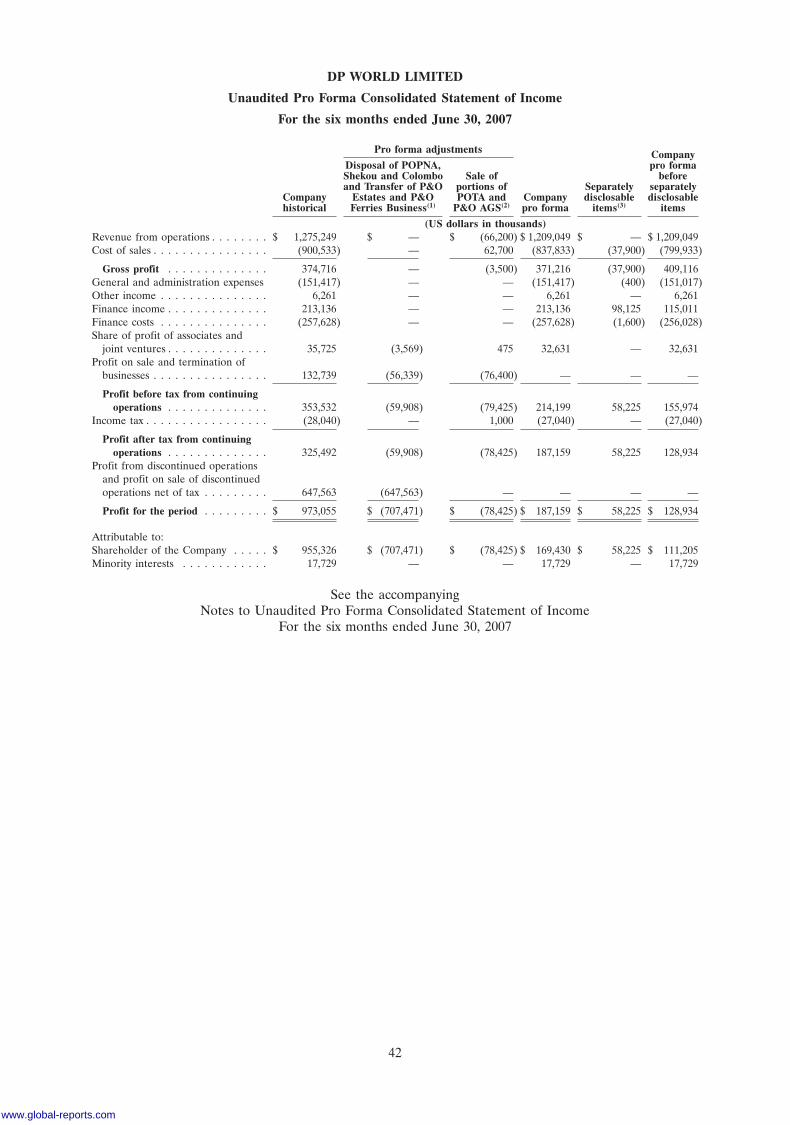
DP WORLD LIMITED
Unaudited Pro Forma Consolidated Statement of Income
For the six months ended June 30, 2007
Pro forma adjustments CompanyDisposal of POPNA, pro formaShekou and Colombo Sale of beforeand Transfer of P&O portions of Separately separately
Company Estates and P&O POTA and Company disclosable disclosablehistorical Ferries Business(1) P&O AGS(2) pro forma items(3) items
(US dollars in thousands)Revenue from operations . . . . . . . . $ 1,275,249 $ — $ (66,200) $ 1,209,049 $ — $ 1,209,049Cost of sales . . . . . . . . . . . . . . . . (900,533) — 62,700 (837,833) (37,900) (799,933)
Gross profit . . . . . . . . . . . . . . 374,716 — (3,500) 371,216 (37,900) 409,116General and administration expenses (151,417) — — (151,417) (400) (151,017)Other income . . . . . . . . . . . . . . . 6,261 — — 6,261 — 6,261Finance income . . . . . . . . . . . . . . 213,136 — — 213,136 98,125 115,011Finance costs . . . . . . . . . . . . . . . (257,628) — — (257,628) (1,600) (256,028)Share of profit of associates and
joint ventures . . . . . . . . . . . . . . 35,725 (3,569) 475 32,631 — 32,631Profit on sale and termination of
businesses . . . . . . . . . . . . . . . . 132,739 (56,339) (76,400) — — —
Profit before tax from continuingoperations . . . . . . . . . . . . . . 353,532 (59,908) (79,425) 214,199 58,225 155,974
Income tax . . . . . . . . . . . . . . . . . (28,040) — 1,000 (27,040) — (27,040)
Profit after tax from continuingoperations . . . . . . . . . . . . . . 325,492 (59,908) (78,425) 187,159 58,225 128,934
Profit from discontinued operationsand profit on sale of discontinuedoperations net of tax . . . . . . . . . 647,563 (647,563) — — — —
Profit for the period . . . . . . . . . $ 973,055 $ (707,471) $ (78,425) $ 187,159 $ 58,225 $ 128,934
Attributable to:Shareholder of the Company . . . . . $ 955,326 $ (707,471) $ (78,425) $ 169,430 $ 58,225 $ 111,205Minority interests . . . . . . . . . . . . 17,729 — — 17,729 — 17,729
See the accompanyingNotes to Unaudited Pro Forma Consolidated Statement of Income
For the six months ended June 30, 2007
42
www.global-reports.com
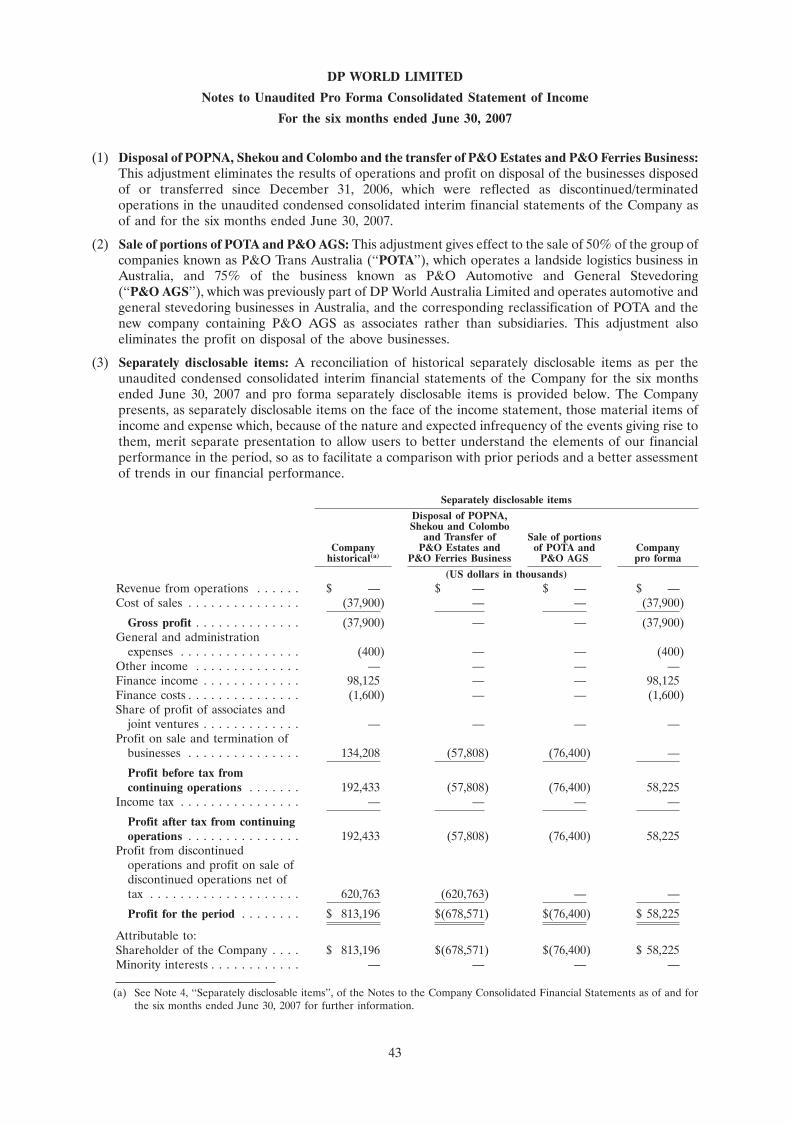
DP WORLD LIMITED
Notes to Unaudited Pro Forma Consolidated Statement of Income
For the six months ended June 30, 2007
(1) Disposal of POPNA, Shekou and Colombo and the transfer of P&O Estates and P&O Ferries Business:This adjustment eliminates the results of operations and profit on disposal of the businesses disposedof or transferred since December 31, 2006, which were reflected as discontinued/terminatedoperations in the unaudited condensed consolidated interim financial statements of the Company asof and for the six months ended June 30, 2007.
(2) Sale of portions of POTA and P&O AGS: This adjustment gives effect to the sale of 50% of the group ofcompanies known as P&O Trans Australia (‘‘POTA’’), which operates a landside logistics business inAustralia, and 75% of the business known as P&O Automotive and General Stevedoring(‘‘P&O AGS’’), which was previously part of DP World Australia Limited and operates automotive andgeneral stevedoring businesses in Australia, and the corresponding reclassification of POTA and thenew company containing P&O AGS as associates rather than subsidiaries. This adjustment alsoeliminates the profit on disposal of the above businesses.
(3) Separately disclosable items: A reconciliation of historical separately disclosable items as per theunaudited condensed consolidated interim financial statements of the Company for the six monthsended June 30, 2007 and pro forma separately disclosable items is provided below. The Companypresents, as separately disclosable items on the face of the income statement, those material items ofincome and expense which, because of the nature and expected infrequency of the events giving rise tothem, merit separate presentation to allow users to better understand the elements of our financialperformance in the period, so as to facilitate a comparison with prior periods and a better assessmentof trends in our financial performance.
Separately disclosable items
Disposal of POPNA,Shekou and Colombo
and Transfer of Sale of portionsCompany P&O Estates and of POTA and Company
historical(a) P&O Ferries Business P&O AGS pro forma
(US dollars in thousands)Revenue from operations . . . . . . $ — $ — $ — $ —Cost of sales . . . . . . . . . . . . . . . (37,900) — — (37,900)
Gross profit . . . . . . . . . . . . . . (37,900) — — (37,900)General and administration
expenses . . . . . . . . . . . . . . . . (400) — — (400)Other income . . . . . . . . . . . . . . — — — —Finance income . . . . . . . . . . . . . 98,125 — — 98,125Finance costs . . . . . . . . . . . . . . . (1,600) — — (1,600)Share of profit of associates and
joint ventures . . . . . . . . . . . . . — — — —Profit on sale and termination of
businesses . . . . . . . . . . . . . . . 134,208 (57,808) (76,400) —
Profit before tax fromcontinuing operations . . . . . . . 192,433 (57,808) (76,400) 58,225
Income tax . . . . . . . . . . . . . . . . — — — —
Profit after tax from continuingoperations . . . . . . . . . . . . . . . 192,433 (57,808) (76,400) 58,225
Profit from discontinuedoperations and profit on sale ofdiscontinued operations net oftax . . . . . . . . . . . . . . . . . . . . 620,763 (620,763) — —
Profit for the period . . . . . . . . $ 813,196 $(678,571) $(76,400) $ 58,225
Attributable to:Shareholder of the Company . . . . $ 813,196 $(678,571) $(76,400) $ 58,225Minority interests . . . . . . . . . . . . — — — —
(a) See Note 4, ‘‘Separately disclosable items’’, of the Notes to the Company Consolidated Financial Statements as of and forthe six months ended June 30, 2007 for further information.
43
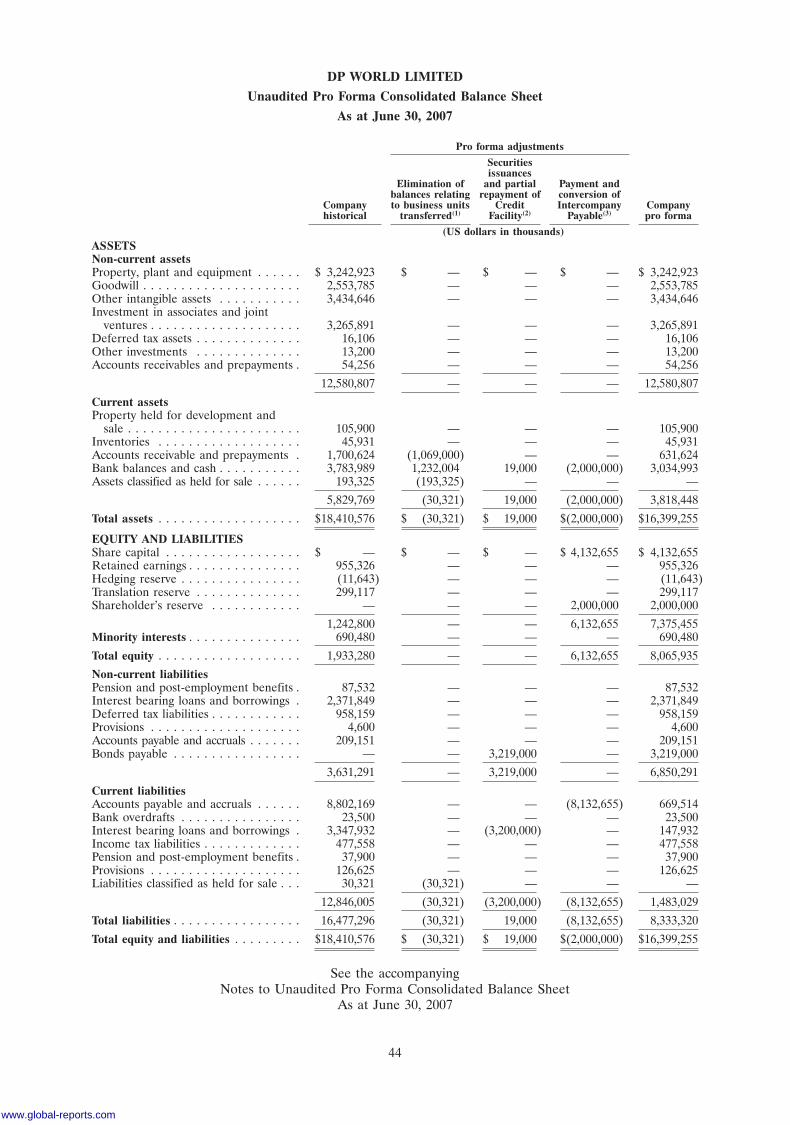
DP WORLD LIMITED
Unaudited Pro Forma Consolidated Balance Sheet
As at June 30, 2007
Pro forma adjustments
Securitiesissuances
Elimination of and partial Payment andbalances relating repayment of conversion of
Company to business units Credit Intercompany Companyhistorical transferred(1) Facility(2) Payable(3) pro forma
(US dollars in thousands)ASSETSNon-current assetsProperty, plant and equipment . . . . . . $ 3,242,923 $ — $ — $ — $ 3,242,923Goodwill . . . . . . . . . . . . . . . . . . . . . 2,553,785 — — — 2,553,785Other intangible assets . . . . . . . . . . . 3,434,646 — — — 3,434,646Investment in associates and joint
ventures . . . . . . . . . . . . . . . . . . . . 3,265,891 — — — 3,265,891Deferred tax assets . . . . . . . . . . . . . . 16,106 — — — 16,106Other investments . . . . . . . . . . . . . . 13,200 — — — 13,200Accounts receivables and prepayments . 54,256 — — — 54,256
12,580,807 — — — 12,580,807
Current assetsProperty held for development and
sale . . . . . . . . . . . . . . . . . . . . . . . 105,900 — — — 105,900Inventories . . . . . . . . . . . . . . . . . . . 45,931 — — — 45,931Accounts receivable and prepayments . 1,700,624 (1,069,000) — — 631,624Bank balances and cash . . . . . . . . . . . 3,783,989 1,232,004 19,000 (2,000,000) 3,034,993Assets classified as held for sale . . . . . . 193,325 (193,325) — — —
5,829,769 (30,321) 19,000 (2,000,000) 3,818,448
Total assets . . . . . . . . . . . . . . . . . . . $18,410,576 $ (30,321) $ 19,000 $(2,000,000) $16,399,255
EQUITY AND LIABILITIESShare capital . . . . . . . . . . . . . . . . . . $ — $ — $ — $ 4,132,655 $ 4,132,655Retained earnings . . . . . . . . . . . . . . . 955,326 — — — 955,326Hedging reserve . . . . . . . . . . . . . . . . (11,643) — — — (11,643)Translation reserve . . . . . . . . . . . . . . 299,117 — — — 299,117Shareholder’s reserve . . . . . . . . . . . . — — — 2,000,000 2,000,000
1,242,800 — — 6,132,655 7,375,455Minority interests . . . . . . . . . . . . . . . 690,480 — — — 690,480
Total equity . . . . . . . . . . . . . . . . . . . 1,933,280 — — 6,132,655 8,065,935
Non-current liabilitiesPension and post-employment benefits . 87,532 — — — 87,532Interest bearing loans and borrowings . 2,371,849 — — — 2,371,849Deferred tax liabilities . . . . . . . . . . . . 958,159 — — — 958,159Provisions . . . . . . . . . . . . . . . . . . . . 4,600 — — — 4,600Accounts payable and accruals . . . . . . . 209,151 — — — 209,151Bonds payable . . . . . . . . . . . . . . . . . — — 3,219,000 — 3,219,000
3,631,291 — 3,219,000 — 6,850,291
Current liabilitiesAccounts payable and accruals . . . . . . 8,802,169 — — (8,132,655) 669,514Bank overdrafts . . . . . . . . . . . . . . . . 23,500 — — — 23,500Interest bearing loans and borrowings . 3,347,932 — (3,200,000) — 147,932Income tax liabilities . . . . . . . . . . . . . 477,558 — — — 477,558Pension and post-employment benefits . 37,900 — — — 37,900Provisions . . . . . . . . . . . . . . . . . . . . 126,625 — — — 126,625Liabilities classified as held for sale . . . 30,321 (30,321) — — —
12,846,005 (30,321) (3,200,000) (8,132,655) 1,483,029
Total liabilities . . . . . . . . . . . . . . . . . 16,477,296 (30,321) 19,000 (8,132,655) 8,333,320
Total equity and liabilities . . . . . . . . . $18,410,576 $ (30,321) $ 19,000 $(2,000,000) $16,399,255
See the accompanyingNotes to Unaudited Pro Forma Consolidated Balance Sheet
As at June 30, 2007
44
www.global-reports.com
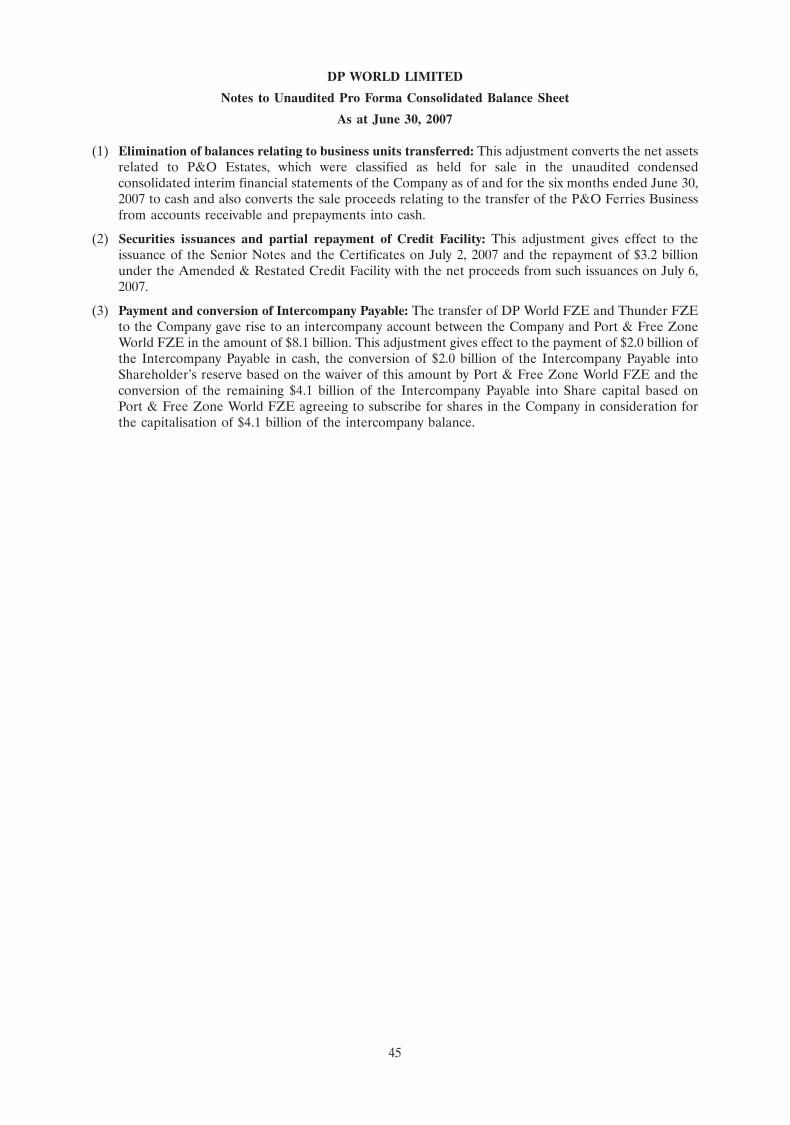
DP WORLD LIMITED
Notes to Unaudited Pro Forma Consolidated Balance Sheet
As at June 30, 2007
(1) Elimination of balances relating to business units transferred: This adjustment converts the net assetsrelated to P&O Estates, which were classified as held for sale in the unaudited condensedconsolidated interim financial statements of the Company as of and for the six months ended June 30,2007 to cash and also converts the sale proceeds relating to the transfer of the P&O Ferries Businessfrom accounts receivable and prepayments into cash.
(2) Securities issuances and partial repayment of Credit Facility: This adjustment gives effect to theissuance of the Senior Notes and the Certificates on July 2, 2007 and the repayment of $3.2 billionunder the Amended & Restated Credit Facility with the net proceeds from such issuances on July 6,2007.
(3) Payment and conversion of Intercompany Payable: The transfer of DP World FZE and Thunder FZEto the Company gave rise to an intercompany account between the Company and Port & Free ZoneWorld FZE in the amount of $8.1 billion. This adjustment gives effect to the payment of $2.0 billion ofthe Intercompany Payable in cash, the conversion of $2.0 billion of the Intercompany Payable intoShareholder’s reserve based on the waiver of this amount by Port & Free Zone World FZE and theconversion of the remaining $4.1 billion of the Intercompany Payable into Share capital based onPort & Free Zone World FZE agreeing to subscribe for shares in the Company in consideration forthe capitalisation of $4.1 billion of the intercompany balance.
45
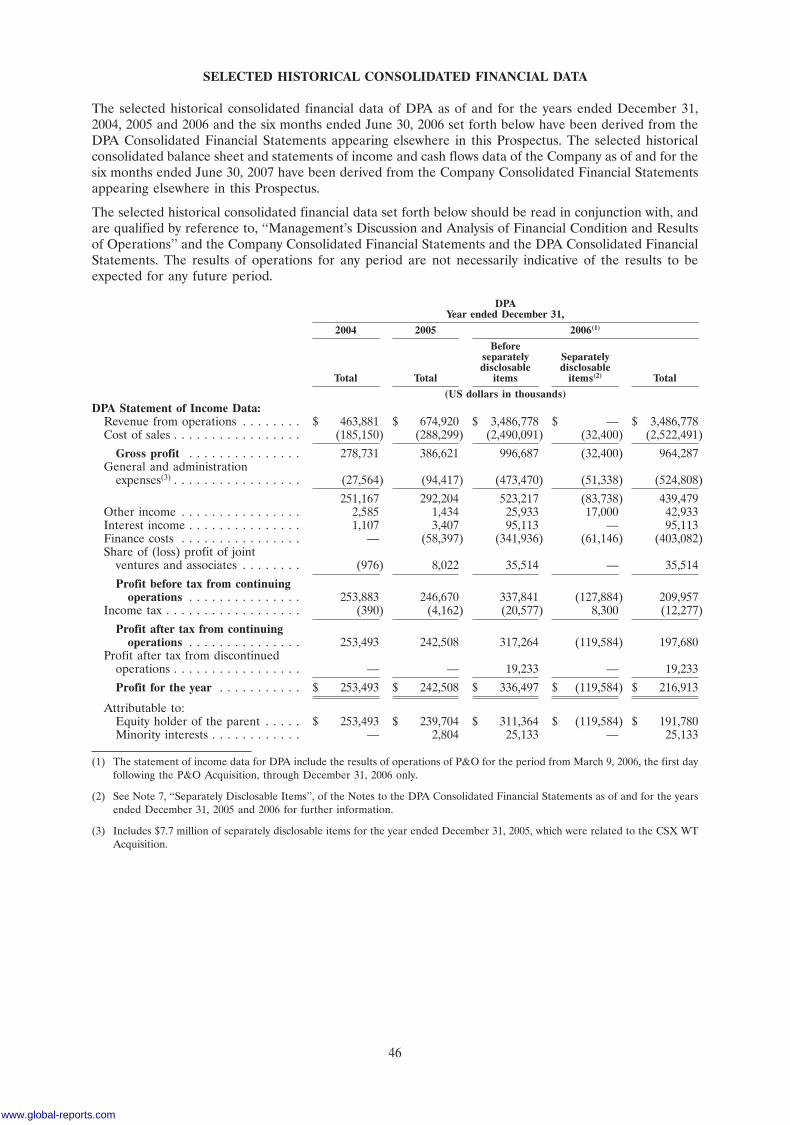
SELECTED HISTORICAL CONSOLIDATED FINANCIAL DATA
The selected historical consolidated financial data of DPA as of and for the years ended December 31,2004, 2005 and 2006 and the six months ended June 30, 2006 set forth below have been derived from theDPA Consolidated Financial Statements appearing elsewhere in this Prospectus. The selected historicalconsolidated balance sheet and statements of income and cash flows data of the Company as of and for thesix months ended June 30, 2007 have been derived from the Company Consolidated Financial Statementsappearing elsewhere in this Prospectus.
The selected historical consolidated financial data set forth below should be read in conjunction with, andare qualified by reference to, ‘‘Management’s Discussion and Analysis of Financial Condition and Resultsof Operations’’ and the Company Consolidated Financial Statements and the DPA Consolidated FinancialStatements. The results of operations for any period are not necessarily indicative of the results to beexpected for any future period.
DPAYear ended December 31,
2004 2005 2006(1)
Beforeseparately Separatelydisclosable disclosable
Total Total items items(2) Total
(US dollars in thousands)DPA Statement of Income Data:
Revenue from operations . . . . . . . . $ 463,881 $ 674,920 $ 3,486,778 $ — $ 3,486,778Cost of sales . . . . . . . . . . . . . . . . . (185,150) (288,299) (2,490,091) (32,400) (2,522,491)
Gross profit . . . . . . . . . . . . . . . 278,731 386,621 996,687 (32,400) 964,287General and administration
expenses(3) . . . . . . . . . . . . . . . . . (27,564) (94,417) (473,470) (51,338) (524,808)
251,167 292,204 523,217 (83,738) 439,479Other income . . . . . . . . . . . . . . . . 2,585 1,434 25,933 17,000 42,933Interest income . . . . . . . . . . . . . . . 1,107 3,407 95,113 — 95,113Finance costs . . . . . . . . . . . . . . . . — (58,397) (341,936) (61,146) (403,082)Share of (loss) profit of joint
ventures and associates . . . . . . . . (976) 8,022 35,514 — 35,514
Profit before tax from continuingoperations . . . . . . . . . . . . . . . 253,883 246,670 337,841 (127,884) 209,957
Income tax . . . . . . . . . . . . . . . . . . (390) (4,162) (20,577) 8,300 (12,277)
Profit after tax from continuingoperations . . . . . . . . . . . . . . . 253,493 242,508 317,264 (119,584) 197,680
Profit after tax from discontinuedoperations . . . . . . . . . . . . . . . . . — — 19,233 — 19,233
Profit for the year . . . . . . . . . . . $ 253,493 $ 242,508 $ 336,497 $ (119,584) $ 216,913
Attributable to:Equity holder of the parent . . . . . $ 253,493 $ 239,704 $ 311,364 $ (119,584) $ 191,780Minority interests . . . . . . . . . . . . — 2,804 25,133 — 25,133
(1) The statement of income data for DPA include the results of operations of P&O for the period from March 9, 2006, the first dayfollowing the P&O Acquisition, through December 31, 2006 only.
(2) See Note 7, ‘‘Separately Disclosable Items’’, of the Notes to the DPA Consolidated Financial Statements as of and for the yearsended December 31, 2005 and 2006 for further information.
(3) Includes $7.7 million of separately disclosable items for the year ended December 31, 2005, which were related to the CSX WTAcquisition.
46
www.global-reports.com
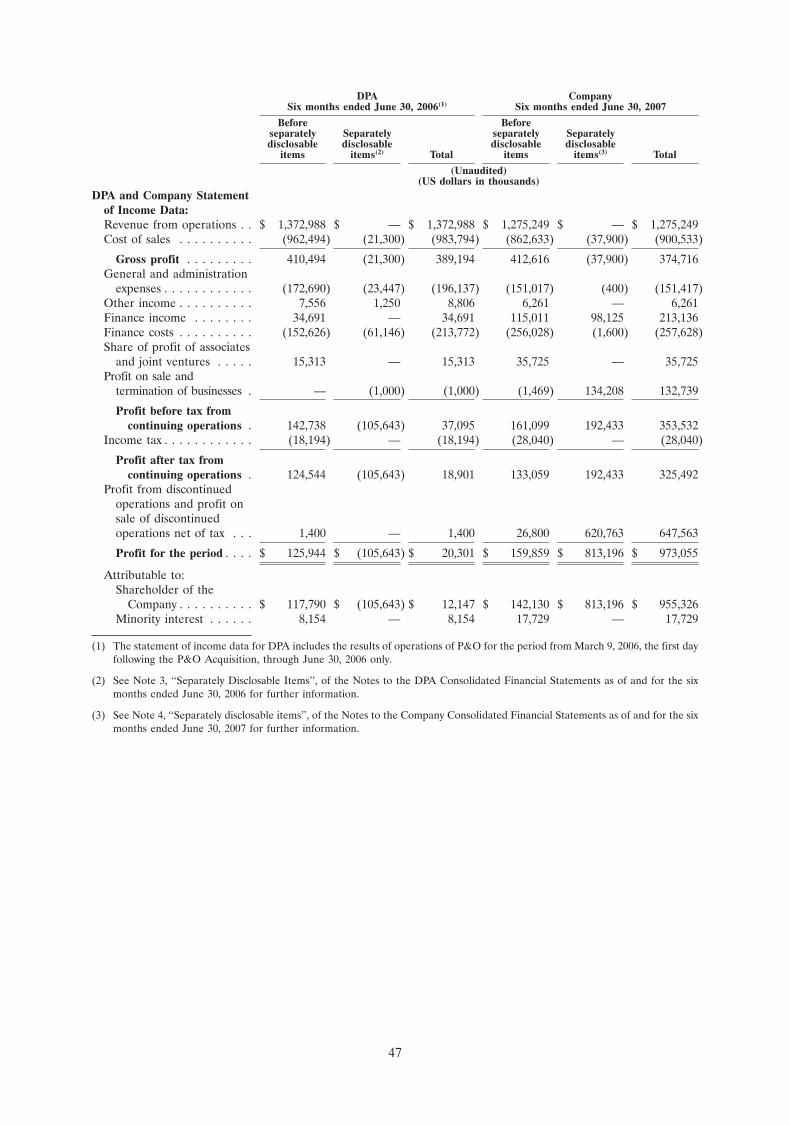
DPA CompanySix months ended June 30, 2006(1) Six months ended June 30, 2007
Before Beforeseparately Separately separately Separatelydisclosable disclosable disclosable disclosable
items items(2) Total items items(3) Total
(Unaudited)(US dollars in thousands)
DPA and Company Statementof Income Data:Revenue from operations . . $ 1,372,988 $ — $ 1,372,988 $ 1,275,249 $ — $ 1,275,249Cost of sales . . . . . . . . . . (962,494) (21,300) (983,794) (862,633) (37,900) (900,533)
Gross profit . . . . . . . . . 410,494 (21,300) 389,194 412,616 (37,900) 374,716General and administration
expenses . . . . . . . . . . . . (172,690) (23,447) (196,137) (151,017) (400) (151,417)Other income . . . . . . . . . . 7,556 1,250 8,806 6,261 — 6,261Finance income . . . . . . . . 34,691 — 34,691 115,011 98,125 213,136Finance costs . . . . . . . . . . (152,626) (61,146) (213,772) (256,028) (1,600) (257,628)Share of profit of associates
and joint ventures . . . . . 15,313 — 15,313 35,725 — 35,725Profit on sale and
termination of businesses . — (1,000) (1,000) (1,469) 134,208 132,739
Profit before tax fromcontinuing operations . 142,738 (105,643) 37,095 161,099 192,433 353,532
Income tax . . . . . . . . . . . . (18,194) — (18,194) (28,040) — (28,040)
Profit after tax fromcontinuing operations . 124,544 (105,643) 18,901 133,059 192,433 325,492
Profit from discontinuedoperations and profit onsale of discontinuedoperations net of tax . . . 1,400 — 1,400 26,800 620,763 647,563
Profit for the period . . . . $ 125,944 $ (105,643) $ 20,301 $ 159,859 $ 813,196 $ 973,055
Attributable to:Shareholder of the
Company . . . . . . . . . . $ 117,790 $ (105,643) $ 12,147 $ 142,130 $ 813,196 $ 955,326Minority interest . . . . . . 8,154 — 8,154 17,729 — 17,729
(1) The statement of income data for DPA includes the results of operations of P&O for the period from March 9, 2006, the first dayfollowing the P&O Acquisition, through June 30, 2006 only.
(2) See Note 3, ‘‘Separately Disclosable Items’’, of the Notes to the DPA Consolidated Financial Statements as of and for the sixmonths ended June 30, 2006 for further information.
(3) See Note 4, ‘‘Separately disclosable items’’, of the Notes to the Company Consolidated Financial Statements as of and for the sixmonths ended June 30, 2007 for further information.
47
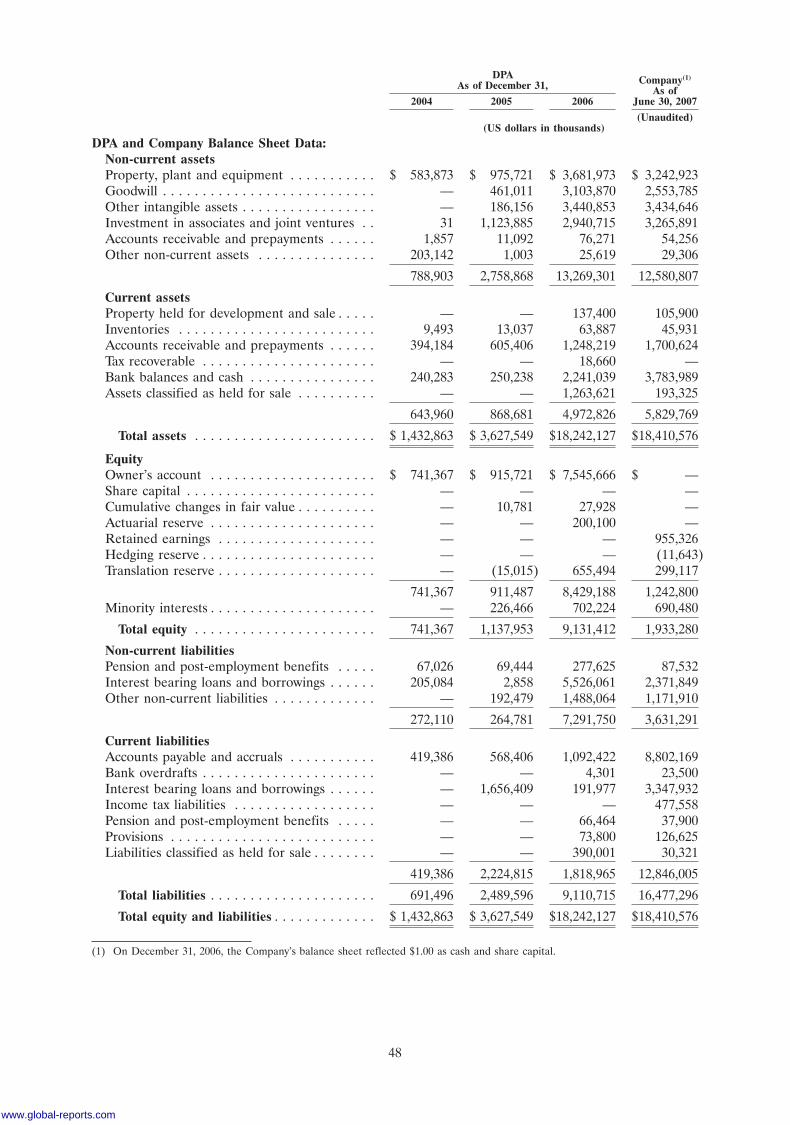
DPA Company(1)As of December 31, As of
2004 2005 2006 June 30, 2007
(Unaudited)(US dollars in thousands)
DPA and Company Balance Sheet Data:Non-current assetsProperty, plant and equipment . . . . . . . . . . . $ 583,873 $ 975,721 $ 3,681,973 $ 3,242,923Goodwill . . . . . . . . . . . . . . . . . . . . . . . . . . . — 461,011 3,103,870 2,553,785Other intangible assets . . . . . . . . . . . . . . . . . — 186,156 3,440,853 3,434,646Investment in associates and joint ventures . . 31 1,123,885 2,940,715 3,265,891Accounts receivable and prepayments . . . . . . 1,857 11,092 76,271 54,256Other non-current assets . . . . . . . . . . . . . . . 203,142 1,003 25,619 29,306
788,903 2,758,868 13,269,301 12,580,807
Current assetsProperty held for development and sale . . . . . — — 137,400 105,900Inventories . . . . . . . . . . . . . . . . . . . . . . . . . 9,493 13,037 63,887 45,931Accounts receivable and prepayments . . . . . . 394,184 605,406 1,248,219 1,700,624Tax recoverable . . . . . . . . . . . . . . . . . . . . . . — — 18,660 —Bank balances and cash . . . . . . . . . . . . . . . . 240,283 250,238 2,241,039 3,783,989Assets classified as held for sale . . . . . . . . . . — — 1,263,621 193,325
643,960 868,681 4,972,826 5,829,769
Total assets . . . . . . . . . . . . . . . . . . . . . . . $ 1,432,863 $ 3,627,549 $18,242,127 $18,410,576
EquityOwner’s account . . . . . . . . . . . . . . . . . . . . . $ 741,367 $ 915,721 $ 7,545,666 $ —Share capital . . . . . . . . . . . . . . . . . . . . . . . . — — — —Cumulative changes in fair value . . . . . . . . . . — 10,781 27,928 —Actuarial reserve . . . . . . . . . . . . . . . . . . . . . — — 200,100 —Retained earnings . . . . . . . . . . . . . . . . . . . . — — — 955,326Hedging reserve . . . . . . . . . . . . . . . . . . . . . . — — — (11,643)Translation reserve . . . . . . . . . . . . . . . . . . . . — (15,015) 655,494 299,117
741,367 911,487 8,429,188 1,242,800Minority interests . . . . . . . . . . . . . . . . . . . . . — 226,466 702,224 690,480
Total equity . . . . . . . . . . . . . . . . . . . . . . . 741,367 1,137,953 9,131,412 1,933,280
Non-current liabilitiesPension and post-employment benefits . . . . . 67,026 69,444 277,625 87,532Interest bearing loans and borrowings . . . . . . 205,084 2,858 5,526,061 2,371,849Other non-current liabilities . . . . . . . . . . . . . — 192,479 1,488,064 1,171,910
272,110 264,781 7,291,750 3,631,291
Current liabilitiesAccounts payable and accruals . . . . . . . . . . . 419,386 568,406 1,092,422 8,802,169Bank overdrafts . . . . . . . . . . . . . . . . . . . . . . — — 4,301 23,500Interest bearing loans and borrowings . . . . . . — 1,656,409 191,977 3,347,932Income tax liabilities . . . . . . . . . . . . . . . . . . — — — 477,558Pension and post-employment benefits . . . . . — — 66,464 37,900Provisions . . . . . . . . . . . . . . . . . . . . . . . . . . — — 73,800 126,625Liabilities classified as held for sale . . . . . . . . — — 390,001 30,321
419,386 2,224,815 1,818,965 12,846,005
Total liabilities . . . . . . . . . . . . . . . . . . . . . 691,496 2,489,596 9,110,715 16,477,296
Total equity and liabilities . . . . . . . . . . . . . $ 1,432,863 $ 3,627,549 $18,242,127 $18,410,576
(1) On December 31, 2006, the Company’s balance sheet reflected $1.00 as cash and share capital.
48
www.global-reports.com
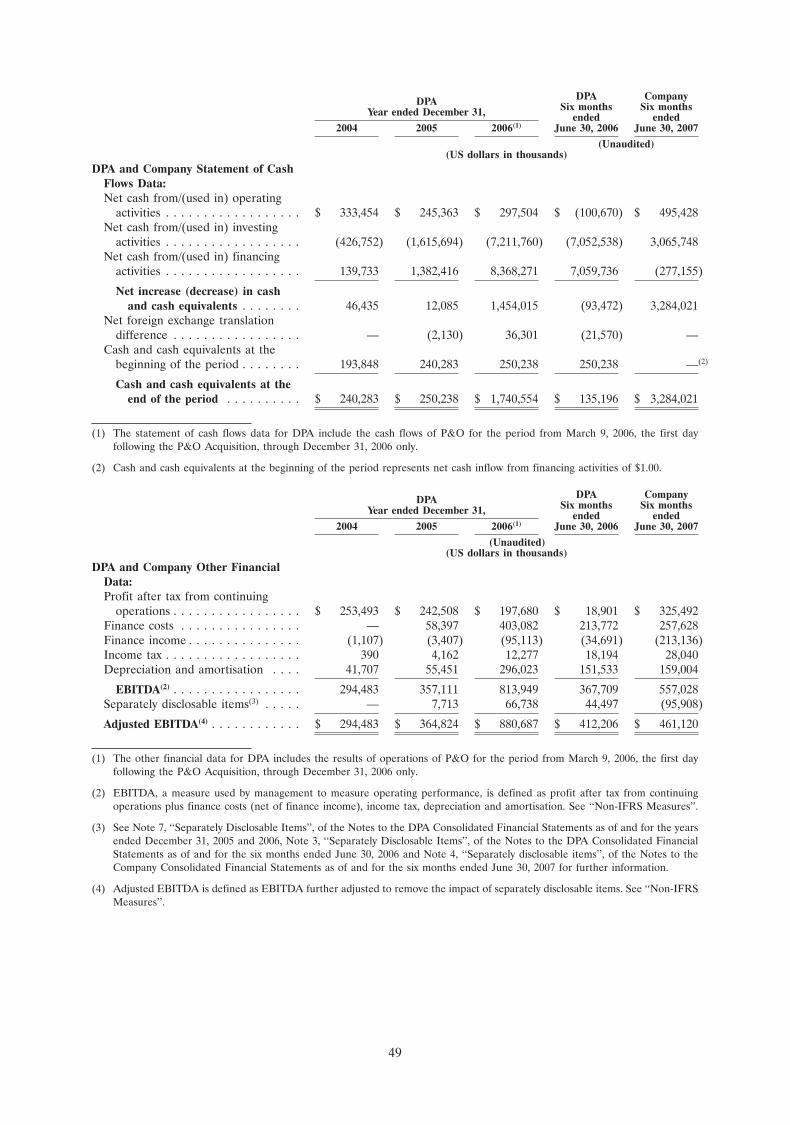
DPA CompanyDPA Six months Six monthsYear ended December 31, ended ended2004 2005 2006(1) June 30, 2006 June 30, 2007
(Unaudited)(US dollars in thousands)
DPA and Company Statement of CashFlows Data:Net cash from/(used in) operating
activities . . . . . . . . . . . . . . . . . . $ 333,454 $ 245,363 $ 297,504 $ (100,670) $ 495,428Net cash from/(used in) investing
activities . . . . . . . . . . . . . . . . . . (426,752) (1,615,694) (7,211,760) (7,052,538) 3,065,748Net cash from/(used in) financing
activities . . . . . . . . . . . . . . . . . . 139,733 1,382,416 8,368,271 7,059,736 (277,155)
Net increase (decrease) in cashand cash equivalents . . . . . . . . 46,435 12,085 1,454,015 (93,472) 3,284,021
Net foreign exchange translationdifference . . . . . . . . . . . . . . . . . — (2,130) 36,301 (21,570) —
Cash and cash equivalents at thebeginning of the period . . . . . . . . 193,848 240,283 250,238 250,238 —(2)
Cash and cash equivalents at theend of the period . . . . . . . . . . $ 240,283 $ 250,238 $ 1,740,554 $ 135,196 $ 3,284,021
(1) The statement of cash flows data for DPA include the cash flows of P&O for the period from March 9, 2006, the first dayfollowing the P&O Acquisition, through December 31, 2006 only.
(2) Cash and cash equivalents at the beginning of the period represents net cash inflow from financing activities of $1.00.
DPA CompanyDPA Six months Six monthsYear ended December 31, ended ended2004 2005 2006(1) June 30, 2006 June 30, 2007
(Unaudited)(US dollars in thousands)
DPA and Company Other FinancialData:Profit after tax from continuing
operations . . . . . . . . . . . . . . . . . $ 253,493 $ 242,508 $ 197,680 $ 18,901 $ 325,492Finance costs . . . . . . . . . . . . . . . . — 58,397 403,082 213,772 257,628Finance income . . . . . . . . . . . . . . . (1,107) (3,407) (95,113) (34,691) (213,136)Income tax . . . . . . . . . . . . . . . . . . 390 4,162 12,277 18,194 28,040Depreciation and amortisation . . . . 41,707 55,451 296,023 151,533 159,004
EBITDA(2) . . . . . . . . . . . . . . . . . 294,483 357,111 813,949 367,709 557,028Separately disclosable items(3) . . . . . — 7,713 66,738 44,497 (95,908)
Adjusted EBITDA(4) . . . . . . . . . . . . $ 294,483 $ 364,824 $ 880,687 $ 412,206 $ 461,120
(1) The other financial data for DPA includes the results of operations of P&O for the period from March 9, 2006, the first dayfollowing the P&O Acquisition, through December 31, 2006 only.
(2) EBITDA, a measure used by management to measure operating performance, is defined as profit after tax from continuingoperations plus finance costs (net of finance income), income tax, depreciation and amortisation. See ‘‘Non-IFRS Measures’’.
(3) See Note 7, ‘‘Separately Disclosable Items’’, of the Notes to the DPA Consolidated Financial Statements as of and for the yearsended December 31, 2005 and 2006, Note 3, ‘‘Separately Disclosable Items’’, of the Notes to the DPA Consolidated FinancialStatements as of and for the six months ended June 30, 2006 and Note 4, ‘‘Separately disclosable items’’, of the Notes to theCompany Consolidated Financial Statements as of and for the six months ended June 30, 2007 for further information.
(4) Adjusted EBITDA is defined as EBITDA further adjusted to remove the impact of separately disclosable items. See ‘‘Non-IFRSMeasures’’.
49
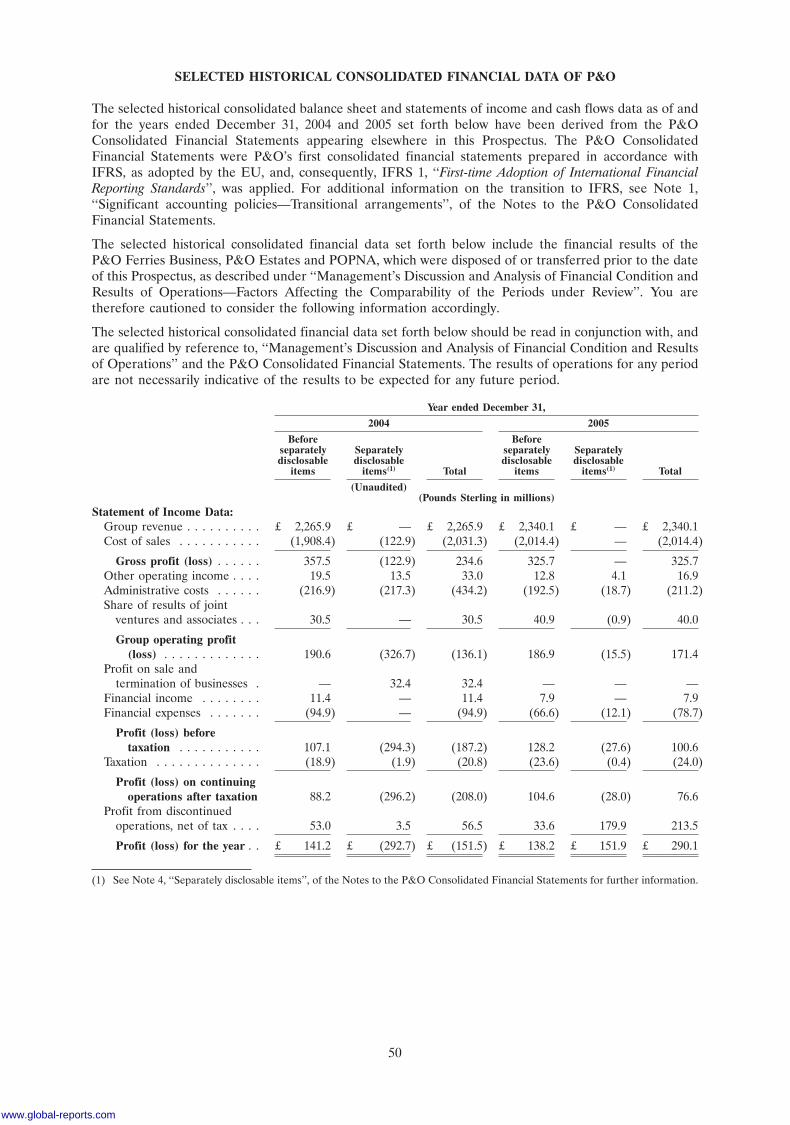
SELECTED HISTORICAL CONSOLIDATED FINANCIAL DATA OF P&O
The selected historical consolidated balance sheet and statements of income and cash flows data as of andfor the years ended December 31, 2004 and 2005 set forth below have been derived from the P&OConsolidated Financial Statements appearing elsewhere in this Prospectus. The P&O ConsolidatedFinancial Statements were P&O’s first consolidated financial statements prepared in accordance withIFRS, as adopted by the EU, and, consequently, IFRS 1, ‘‘First-time Adoption of International FinancialReporting Standards’’, was applied. For additional information on the transition to IFRS, see Note 1,‘‘Significant accounting policies—Transitional arrangements’’, of the Notes to the P&O ConsolidatedFinancial Statements.
The selected historical consolidated financial data set forth below include the financial results of theP&O Ferries Business, P&O Estates and POPNA, which were disposed of or transferred prior to the dateof this Prospectus, as described under ‘‘Management’s Discussion and Analysis of Financial Condition andResults of Operations—Factors Affecting the Comparability of the Periods under Review’’. You aretherefore cautioned to consider the following information accordingly.
The selected historical consolidated financial data set forth below should be read in conjunction with, andare qualified by reference to, ‘‘Management’s Discussion and Analysis of Financial Condition and Resultsof Operations’’ and the P&O Consolidated Financial Statements. The results of operations for any periodare not necessarily indicative of the results to be expected for any future period.
Year ended December 31,
2004 2005
Before Beforeseparately Separately separately Separatelydisclosable disclosable disclosable disclosable
items items(1) Total items items(1) Total
(Unaudited)(Pounds Sterling in millions)
Statement of Income Data:Group revenue . . . . . . . . . . £ 2,265.9 £ — £ 2,265.9 £ 2,340.1 £ — £ 2,340.1Cost of sales . . . . . . . . . . . (1,908.4) (122.9) (2,031.3) (2,014.4) — (2,014.4)
Gross profit (loss) . . . . . . 357.5 (122.9) 234.6 325.7 — 325.7Other operating income . . . . 19.5 13.5 33.0 12.8 4.1 16.9Administrative costs . . . . . . (216.9) (217.3) (434.2) (192.5) (18.7) (211.2)Share of results of joint
ventures and associates . . . 30.5 — 30.5 40.9 (0.9) 40.0
Group operating profit(loss) . . . . . . . . . . . . . 190.6 (326.7) (136.1) 186.9 (15.5) 171.4
Profit on sale andtermination of businesses . — 32.4 32.4 — — —
Financial income . . . . . . . . 11.4 — 11.4 7.9 — 7.9Financial expenses . . . . . . . (94.9) — (94.9) (66.6) (12.1) (78.7)
Profit (loss) beforetaxation . . . . . . . . . . . 107.1 (294.3) (187.2) 128.2 (27.6) 100.6
Taxation . . . . . . . . . . . . . . (18.9) (1.9) (20.8) (23.6) (0.4) (24.0)
Profit (loss) on continuingoperations after taxation 88.2 (296.2) (208.0) 104.6 (28.0) 76.6
Profit from discontinuedoperations, net of tax . . . . 53.0 3.5 56.5 33.6 179.9 213.5
Profit (loss) for the year . . £ 141.2 £ (292.7) £ (151.5) £ 138.2 £ 151.9 £ 290.1
(1) See Note 4, ‘‘Separately disclosable items’’, of the Notes to the P&O Consolidated Financial Statements for further information.
50
www.global-reports.com
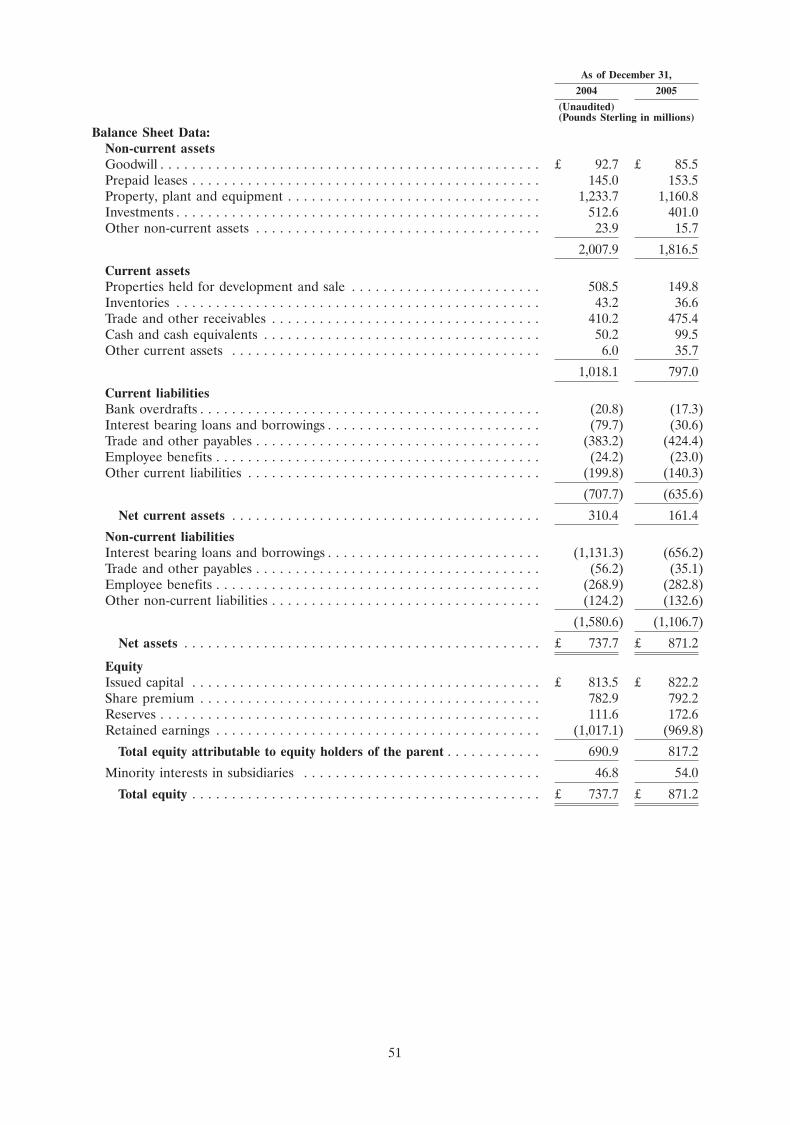
As of December 31,
2004 2005
(Unaudited)(Pounds Sterling in millions)
Balance Sheet Data:Non-current assetsGoodwill . . . . . . . . . . . . . . . . . . . . . . . . . . . . . . . . . . . . . . . . . . . . . . . . £ 92.7 £ 85.5Prepaid leases . . . . . . . . . . . . . . . . . . . . . . . . . . . . . . . . . . . . . . . . . . . . 145.0 153.5Property, plant and equipment . . . . . . . . . . . . . . . . . . . . . . . . . . . . . . . . 1,233.7 1,160.8Investments . . . . . . . . . . . . . . . . . . . . . . . . . . . . . . . . . . . . . . . . . . . . . . 512.6 401.0Other non-current assets . . . . . . . . . . . . . . . . . . . . . . . . . . . . . . . . . . . . 23.9 15.7
2,007.9 1,816.5
Current assetsProperties held for development and sale . . . . . . . . . . . . . . . . . . . . . . . . 508.5 149.8Inventories . . . . . . . . . . . . . . . . . . . . . . . . . . . . . . . . . . . . . . . . . . . . . . 43.2 36.6Trade and other receivables . . . . . . . . . . . . . . . . . . . . . . . . . . . . . . . . . . 410.2 475.4Cash and cash equivalents . . . . . . . . . . . . . . . . . . . . . . . . . . . . . . . . . . . 50.2 99.5Other current assets . . . . . . . . . . . . . . . . . . . . . . . . . . . . . . . . . . . . . . . 6.0 35.7
1,018.1 797.0
Current liabilitiesBank overdrafts . . . . . . . . . . . . . . . . . . . . . . . . . . . . . . . . . . . . . . . . . . . (20.8) (17.3)Interest bearing loans and borrowings . . . . . . . . . . . . . . . . . . . . . . . . . . . (79.7) (30.6)Trade and other payables . . . . . . . . . . . . . . . . . . . . . . . . . . . . . . . . . . . . (383.2) (424.4)Employee benefits . . . . . . . . . . . . . . . . . . . . . . . . . . . . . . . . . . . . . . . . . (24.2) (23.0)Other current liabilities . . . . . . . . . . . . . . . . . . . . . . . . . . . . . . . . . . . . . (199.8) (140.3)
(707.7) (635.6)
Net current assets . . . . . . . . . . . . . . . . . . . . . . . . . . . . . . . . . . . . . . . 310.4 161.4
Non-current liabilitiesInterest bearing loans and borrowings . . . . . . . . . . . . . . . . . . . . . . . . . . . (1,131.3) (656.2)Trade and other payables . . . . . . . . . . . . . . . . . . . . . . . . . . . . . . . . . . . . (56.2) (35.1)Employee benefits . . . . . . . . . . . . . . . . . . . . . . . . . . . . . . . . . . . . . . . . . (268.9) (282.8)Other non-current liabilities . . . . . . . . . . . . . . . . . . . . . . . . . . . . . . . . . . (124.2) (132.6)
(1,580.6) (1,106.7)
Net assets . . . . . . . . . . . . . . . . . . . . . . . . . . . . . . . . . . . . . . . . . . . . . £ 737.7 £ 871.2
EquityIssued capital . . . . . . . . . . . . . . . . . . . . . . . . . . . . . . . . . . . . . . . . . . . . £ 813.5 £ 822.2Share premium . . . . . . . . . . . . . . . . . . . . . . . . . . . . . . . . . . . . . . . . . . . 782.9 792.2Reserves . . . . . . . . . . . . . . . . . . . . . . . . . . . . . . . . . . . . . . . . . . . . . . . . 111.6 172.6Retained earnings . . . . . . . . . . . . . . . . . . . . . . . . . . . . . . . . . . . . . . . . . (1,017.1) (969.8)
Total equity attributable to equity holders of the parent . . . . . . . . . . . . 690.9 817.2
Minority interests in subsidiaries . . . . . . . . . . . . . . . . . . . . . . . . . . . . . . 46.8 54.0
Total equity . . . . . . . . . . . . . . . . . . . . . . . . . . . . . . . . . . . . . . . . . . . . £ 737.7 £ 871.2
51
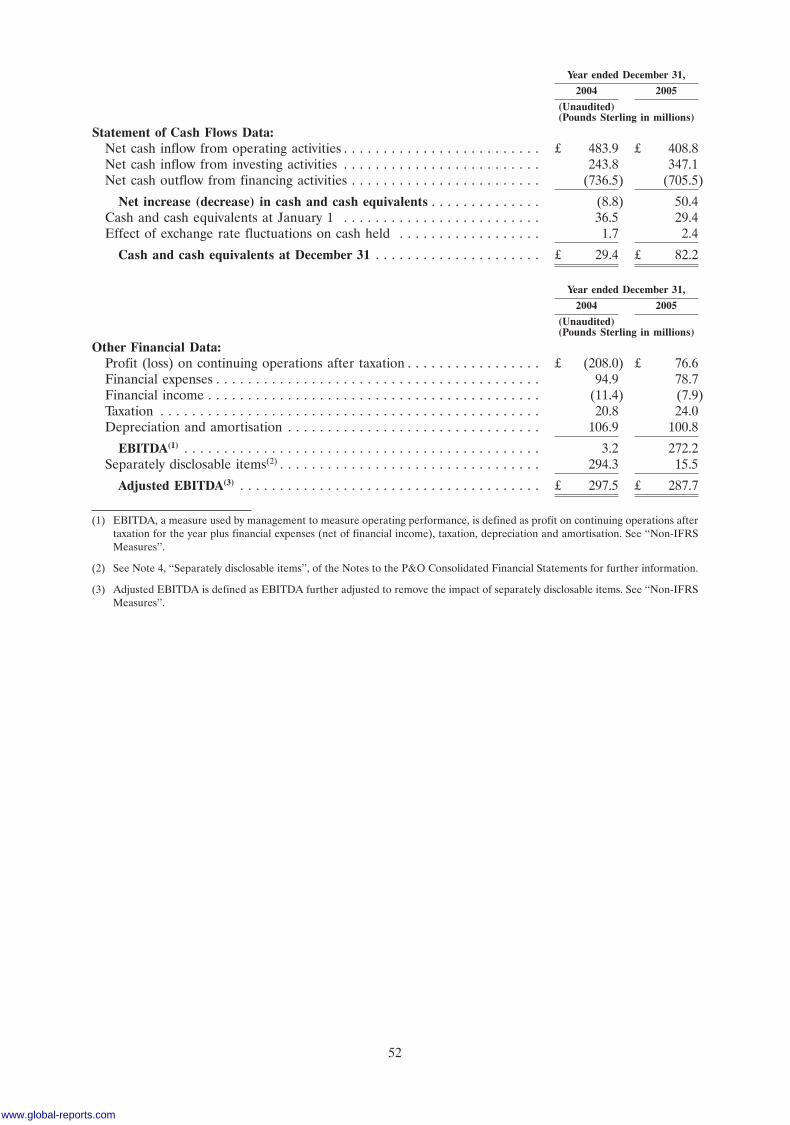
Year ended December 31,
2004 2005
(Unaudited)(Pounds Sterling in millions)
Statement of Cash Flows Data:Net cash inflow from operating activities . . . . . . . . . . . . . . . . . . . . . . . . . £ 483.9 £ 408.8Net cash inflow from investing activities . . . . . . . . . . . . . . . . . . . . . . . . . 243.8 347.1Net cash outflow from financing activities . . . . . . . . . . . . . . . . . . . . . . . . (736.5) (705.5)
Net increase (decrease) in cash and cash equivalents . . . . . . . . . . . . . . (8.8) 50.4Cash and cash equivalents at January 1 . . . . . . . . . . . . . . . . . . . . . . . . . 36.5 29.4Effect of exchange rate fluctuations on cash held . . . . . . . . . . . . . . . . . . 1.7 2.4
Cash and cash equivalents at December 31 . . . . . . . . . . . . . . . . . . . . . £ 29.4 £ 82.2
Year ended December 31,
2004 2005
(Unaudited)(Pounds Sterling in millions)
Other Financial Data:Profit (loss) on continuing operations after taxation . . . . . . . . . . . . . . . . . £ (208.0) £ 76.6Financial expenses . . . . . . . . . . . . . . . . . . . . . . . . . . . . . . . . . . . . . . . . . 94.9 78.7Financial income . . . . . . . . . . . . . . . . . . . . . . . . . . . . . . . . . . . . . . . . . . (11.4) (7.9)Taxation . . . . . . . . . . . . . . . . . . . . . . . . . . . . . . . . . . . . . . . . . . . . . . . . 20.8 24.0Depreciation and amortisation . . . . . . . . . . . . . . . . . . . . . . . . . . . . . . . . 106.9 100.8
EBITDA(1) . . . . . . . . . . . . . . . . . . . . . . . . . . . . . . . . . . . . . . . . . . . . . 3.2 272.2Separately disclosable items(2) . . . . . . . . . . . . . . . . . . . . . . . . . . . . . . . . . 294.3 15.5
Adjusted EBITDA(3) . . . . . . . . . . . . . . . . . . . . . . . . . . . . . . . . . . . . . . £ 297.5 £ 287.7
(1) EBITDA, a measure used by management to measure operating performance, is defined as profit on continuing operations aftertaxation for the year plus financial expenses (net of financial income), taxation, depreciation and amortisation. See ‘‘Non-IFRSMeasures’’.
(2) See Note 4, ‘‘Separately disclosable items’’, of the Notes to the P&O Consolidated Financial Statements for further information.
(3) Adjusted EBITDA is defined as EBITDA further adjusted to remove the impact of separately disclosable items. See ‘‘Non-IFRSMeasures’’.
52
www.global-reports.com
MANAGEMENT’S DISCUSSION AND ANALYSIS OF FINANCIAL CONDITION ANDRESULTS OF OPERATIONS
The following discussion of our financial condition and results of operations should be read in conjunction withthe information in ‘‘Selected Historical Consolidated Financial Data’’, ‘‘Selected Historical ConsolidatedFinancial Data of P&O’’, ‘‘Unaudited Pro Forma Consolidated Financial Information’’ and the CompanyConsolidated Financial Statements, the DPA Consolidated Financial Statements and the P&O ConsolidatedFinancial Statements appearing in this Prospectus.
This discussion and analysis contains forward-looking statements that involve risks and uncertainties. Ouractual results could differ materially from those anticipated in these forward-looking statements as a result ofvarious factors, including those discussed below and elsewhere in this Prospectus, particularly under theheadings ‘‘Risk Factors’’ and ‘‘Cautionary Statement Regarding Forward-Looking Statements’’.
Overview
We are one of the largest container terminal operators in the world by capacity and throughput, with aportfolio of 42 container terminals spanning 22 countries. For the year ended December 31, 2006 and thesix months ended June 30, 2007, we generated pro forma revenue from operations (which does not includerevenue attributable to our joint ventures and associates) of $2,076.0 million and $1,209.0 million,respectively, and pro forma Adjusted EBITDA of $705.3 million and $453.7 million, respectively.
For financial reporting purposes, prior to the transfers and disposals described under ‘‘—Factors Affectingthe Comparability of the Periods under Review’’ below, our businesses had been organised and managed inthree operating segments: (i) ports, which included our container terminal and other ports-relatedoperations, as well as our maritime services company (‘‘P&O Maritime Services’’), (ii) ferries, whichincluded the P&O Ferries Business, and (iii) properties, which included P&O Estates. As a result of suchtransfers and disposals, we now only have one operating segment, ports, as well as a head office reportingsegment, which includes unallocated financial results. For the DPA Consolidated Financial Statements asof and for the years ended December 31, 2005 and 2006, we divided our ports segment into five geographicfinancial reporting regions, which consolidated certain of the eight operating regions that we use tomanage our ports business and P&O Maritime Services. For the DPA Consolidated Financial Statementsas of and for the six months ended June 30, 2006 and the Company Consolidated Financial Statements asof and for the six months ended June 30, 2007, we consolidated these five geographic financial reportingregions into three geographic financial reporting regions as set forth below.
Financial Reporting Region
Years ended Six months endedOperating Region December 31, 2005 and 2006 June 30, 2006 and 2007
UAE
Africa UAE, Middle East and South andEast Africa Middle East, Europe and
Middle East (excluding UAE) Africa
Europe and North Africa Europe and North and West Africa
Asia-PacificAsia-Pacific and Indian Subcontinent Asia-Pacific and Indian Subcontinent
Indian Subcontinent
Australia and New ZealandAustralia and New Zealand Australia, New Zealand and
P&O Maritime Services Americas
Americas Americas
For future reporting periods, we intend to continue to present our financial results on the basis of thesethree reporting regions. For a presentation of how our revenue from operations and net profit for the yearwould have been presented if we reported this information on a consolidated basis by these three reportingregions for the year ended December 31, 2006, see ‘‘Summary of Historical and Pro Forma ConsolidatedFinancial and Operating Data’’.
53
Factors Affecting the Comparability of the Periods under Review
As a result of the evolution of our business during the periods under review as described below, ourfinancial condition and results of operations for such periods were affected by the following principalfactors.
The Company
Pursuant to the Restructuring, which was designed to separate the ports-related commercial and regulatoryactivities of the Government of Dubai, the Company was incorporated in the DIFC on August 9, 2006 forthe purpose of becoming the holding company for the ports-related commercial activities of Dubai World.On January 1, 2007, DP World FZE and Thunder FZE, which is the holding company for P&O, weretransferred from an affiliate of the Company, DPA, to the Company. Consideration for the transfer ofDP World FZE and Thunder FZE is reflected in the Company Consolidated Financial Statements as apayable to Port & Free Zone World FZE, which equalled $8,132.7 million as of June 30, 2007. Prior to theconsummation of the Global Offering, we expect that we will have satisfied the Intercompany Payablethrough (i) the payment of $2.0 billion of the Intercompany Payable in cash, (ii) the conversion of$2.0 billion of the Intercompany Payable into Shareholder’s reserve, based on the waiver of this amount byPort & Free Zone World FZE and (iii) the conversion of the remaining $4.1 billion of the IntercompanyPayable into Share capital, based on Port & Free Zone World FZE agreeing to subscribe for shares in theCompany in consideration for the capitalisation of $4.1 billion of the Intercompany Payable.
On the date of the transfer of DP World FZE and Thunder FZE, property, plant and equipment wererevalued to fair market value and transferred at carrying value, which required that we incur an additionaldepreciation charge of $13.0 million per annum. In addition, prior to the transfer, our wholly-ownedsubsidiary DP World UAE entered into the Concession Agreement with DPA to operate DP World JebelAli, Port Rashid (Dubai) and Hamriya Port in Dubai on an arm’s-length basis. The ownership of theseports has been retained by DPA. While DP World UAE is not obligated to pay any concession fee to DPAunder the Concession Agreement until December 31, 2012, we have started to accrue such fees in anamount equal to $47.0 million per annum, which represents the average annual minimum fee payable overthe term of the agreement. The total impact of these adjustments on our consolidated financial statementswill be $60.0 million per annum and will be reflected in cost of sales on our consolidated income statement.Prior to the transfer of DP World FZE and Thunder FZE, the Company did not have any operations. As aresult, a substantial portion of the historical financial information presented in this ‘‘Management’sDiscussion and Analysis of Financial Condition and Results of Operations’’ is based on the DPAConsolidated Financial Statements and the P&O Consolidated Financial Statements.
CSX WT Acquisition
In February 2005, we acquired CSX WT, the international terminal business of CSX Corporation, for$1.2 billion (the ‘‘CSX WT Acquisition’’). CSX WT was a leading global container terminal operator withkey strategic assets in some of the world’s fastest growing markets, including Asia and South America. TheCSX WT Acquisition represented an important step in our global expansion strategy by increasing ourinternational presence in the container terminal industry and enhancing our geographic diversification.
We conducted full purchase price adjustment accounting with respect to this transaction, which resulted ina step-up valuation of $405.6 million and $204.2 million for the tangible and intangible assets, respectively,as well as $434.5 million of additional goodwill. The tangible and intangible assets will be depreciated andamortised over their remaining useful lives. For a discussion of how we account for the impairment ofgoodwill and intangible assets, see ‘‘—Critical Accounting Policies and Estimates—Accounting forImpairment of Assets—Impairment of goodwill’’ and ‘‘—Critical Accounting Policies and Estimates—Accounting for Impairment of Assets—Impairment of other intangible assets’’, respectively, below. Wehave also recognised an additional deferred tax liability of $138.1 million relating to the CSX WTAcquisition.
The annual impact of additional depreciation and amortisation net of minority interest, deferred taxes, andcorresponding adjustments to investments in associates will be $14.1 million.
P&O Acquisition
In March 2006, we acquired P&O for $7.2 billion (the ‘‘P&O Acquisition’’). P&O was a leading globalcontainer terminal operator and also had significant operations in ferries, as well as maritime services and
54
www.global-reports.com
property development businesses. The P&O Acquisition represented a unique opportunity to significantlyincrease our global container terminal network and market position by incorporating P&O’s largelycomplementary portfolio of terminals in Asia, India, Australia, the Americas, Europe and Africa into ourterminal portfolio.
We conducted full purchase price adjustment accounting with respect to this transaction, which resulted ina step-up valuation of $2,095.2 million and $2,821.4 million for the tangible and intangible assets,respectively, as well as $2,499.1 million of additional goodwill. The tangible and intangible assets will bedepreciated and amortised over their remaining useful lives. We have also recognised an additionaldeferred tax liability of $1,020.0 million relating to the P&O Acquisition.
The annual impact of additional depreciation and amortisation net of minority interest, deferred taxes andcorresponding adjustments to investments in associates will be $82.6 million, or $72.7 million excludingdiscontinued operations.
POPNA Disposal
In connection with the P&O Acquisition, we acquired the assets of POPNA, which included concessions atsix container terminal operations and three non-container terminal operations in the United States, as wellas stevedoring operations at an additional 16 US ports. On March 16, 2007, P&O Holdings, Inc., a wholly-owned subsidiary of ours, completed the sale of 100% of POPNA to a wholly-owned subsidiary of AIGGlobal Investment Group. In accordance with IFRS, the operations of POPNA were reflected as assetsheld for sale and discontinued operations in the DPA Consolidated Financial Statements as of and for thesix months ended June 30, 2006 and the year ended December 31, 2006. The operations of POPNA werereflected as discontinued operations in the Company Consolidated Financial Statements.
P&O Ferries Business Transfer
On March 30, 2007, we entered into an agreement to transfer the P&O Ferries Business that we acquiredin the P&O Acquisition to P&O Ferries Division Holdings Limited (‘‘P&O Ferries Division Holdings’’),Ship Management Holdings (Gibraltar) Limited and P&O Ferries Holdings Limited, affiliates of ours thatare also indirect subsidiaries of Port & Free Zone World FZE, our direct parent company. See ‘‘RelatedParty Transactions—Relationship with Dubai World and the Government of Dubai—OngoingRelationship—Transfer of P&O Ferries’’. In accordance with IFRS the operations of the P&O FerriesBusiness were reflected as continuing operations and not assets held for sale in the DPA ConsolidatedFinancial Statements as of and for the six months ended June 30, 2006 and the year ended December 31,2006 because the decision to transfer this business was not taken until after December 31, 2006. Theoperations of the P&O Ferries Business were reflected as discontinued operations in the CompanyConsolidated Financial Statements. Consideration for the transfer of the P&O Ferries Business is reflectedin the Company Consolidated Financial Statements as a receivable from a related party, which as ofJune 30, 2007 equalled $1,069.0 million. Under the terms of the transfer of the P&O Ferries Business,which was completed on March 30, 2007, we have entered into an agreement in respect of pensionarrangements, pursuant to which we expect that our net liabilities in respect of pension andpost-retirement benefits will be reduced by approximately £66.7 million under existing fundingrequirements.
P&O Estates Transfer
On May 11, 2007, we entered into an agreement to transfer the P&O Estates business that we acquired inthe P&O Acquisition to an affiliate of ours in the Istithmar group, which is also a portfolio company ofDubai World, our indirect parent company, for a transfer price equal to the market value of the assetstransferred plus a premium, subject to specific adjustments. We expect that the completion of the transferof P&O Estates will occur in the second half of 2007. See ‘‘Related Party Transactions—Relationship withDubai World and the Government of Dubai—Ongoing Relationship—Transfer of P&O Estates’’. Inaccordance with IFRS, the operations of P&O Estates were reflected as continuing operations and notassets held for sale in the DPA Consolidated Financial Statements as of and for the six months endedJune 30, 2006 because the decision to transfer this business was not taken until after June 30, 2006. Theoperations of P&O Estates were reflected as assets held for sale and discontinued operations in the DPAConsolidated Financial Statements as of and for the year ended December 31, 2006, as well as theCompany Consolidated Financial Statements.
55
Shekou Disposal
On December 14, 2006, we entered into a share purchase agreement to sell the 22.5% and 22.05%interests in Shekou Container Terminal 1 and Shekou Container Terminal 2, respectively, which weacquired in the P&O Acquisition, to China Merchants Holdings (International) Company Limited for cashconsideration of HK$1,782 million (or approximately $228.4 million as of February 22, 2007). Our minorityinterests in the Shekou Terminals, which are located in Shenzhen, China, did not meet our objectives withrespect to maintaining day-to-day management control and influence over the terminals in our portfolio,and the sale is designed to rebalance our China portfolio in line with our strategic vision. The completionof the sale occurred in the first quarter of 2007. In accordance with IFRS, the Shekou Terminals werereflected as continuing operations and not assets held for sale in the DPA Consolidated FinancialStatements as of and for the six months ended June 30, 2006 because the decision to sell the ShekouTerminals was not taken until after June 30, 2006. The Shekou Terminals were reflected as continuingoperations and assets held for sale in the DPA Consolidated Financial Statements as of and for the yearended December 31, 2006.
Colombo Disposal
On December 1, 2006, we entered into a share sale and purchase agreement to sell our 16.25% interest inSouth Asia Gateway Terminals (Private) Ltd, which we acquired as part of the P&O Acquisition, toNedlloyd BV for cash consideration of $60 million. Our strategy is to have either management orownership control over our terminals, and our minority interest in the Colombo Terminal did not meetthese objectives. Completion of the sale under the share sale and purchase agreement occurred on May 21,2007. The Colombo Terminal was reflected as continuing operations and not assets held for sale in theDPA Consolidated Financial Statements as of and for the six months ended June 30, 2006 because thedecision to sell the Colombo Terminal was not taken until after June 30, 2006. The Colombo Terminal wasreflected as continuing operations and assets held for sale in the DPA Consolidated Financial Statementsas of and for the year ended December 31, 2006.
Antwerp Gateway
On April 26, 2007, we acquired an additional 20% economic interest in Antwerp Gateway N.V. from APMTerminals with the exclusive intent to resell. On August 2, 2007, we sold such additional interest to ZimIntegrated Shipping Services. Such additional interest was reflected as assets held for sale in the CompanyConsolidated Financial Statements.
Shanghai JiFa
On August 20, 2007, we entered into a Share Transfer Agreement with SIPG Logistic Co Ltd to dispose ofour existing 21.9885% shareholding in Shanghai JiFa Logistics Co Ltd, which in turn holds a 90% interestin Shanghai Pudong JiFa Logistics Company Limited and through which we operate our logistics facility inShanghai, China (‘‘Shanghai JiFa’’). The transaction is expected to be completed in December 2007.Shanghai JiFa was reflected as assets held for sale in the Company Consolidated Financial Statements.
POTA and P&O AGS
In April 2007, we sold 50% of the group of companies known as POTA, which operates a landside logisticsbusiness in Australia, and 75% of the business known as P&O AGS, which was previously part ofDP World Australia Limited and operates automotive and general stevedoring businesses in Australia, to aconsortium led by Kaplan Equity Limited. Prior to such sales, POTA and P&O AGS were classified as, orpart of companies classified as, subsidiaries, the results of which were consolidated in the DPAConsolidated Financial Statements as of and for the six months ended June 30, 2006 and the year endedDecember 31, 2006 and the Company Consolidated Financial Statements. For future reporting periods,POTA and the new company containing P&O AGS will be classified as associates, the results of which willnot be consolidated.
Separation of the Regulatory and Commercial Activities of DPA
As a result of the Restructuring, the Company, together with its operating subsidiaries, now conducts all ofthe ports-related commercial activities of Dubai World and DPA will continue to conduct all of the ports-related regulatory activities of the Government of Dubai. Such regulatory activities have not been and willnot be transferred to the Company. The regulatory activities of DPA did not account for a material amount
56
www.global-reports.com
of revenue from operations or profit for the year ended December 31, 2006 or net assets as ofDecember 31, 2006.
In connection with the Restructuring, on December 29, 2006, the Amended and Restated Credit Facilitywas amended and restated to, among other things, (i) transfer a portion of the borrowings thereunder fromThunder FZE to JAFZA, (ii) remove the requirement that the proceeds from the sale of POPNA be usedto prepay borrowings thereunder, (iii) upon the satisfaction of certain conditions, remove JAFZA as aborrower and guarantor thereunder and (iv) upon the satisfaction of certain conditions, remove PCFC as aguarantor thereunder. In addition, immediately prior to the transfer of Thunder FZE to the Company, theCompany became a borrower and guarantor under the Amended and Restated Credit Facility. OnMarch 29, 2007, the outstanding borrowings of DPA were transferred to DP World UAE and DP WorldUAE assumed all the obligations of DPA as a borrower under the Amended and Restated Credit Facility.For the year ended December 31, 2006 $76.7 million of finance costs that were reflected in DPAConsolidated Financial Statements relate to the portion of the borrowings transferred from Thunder FZEto JAFZA pursuant to the Amended and Restated Credit Facility.
On October 29, 2007, we repaid in full the amounts outstanding under the Amended and Restated CreditFacility with $1.3 billion in borrowings under the Syndicated Loan Facility.
For a description of the Syndicated Loan Facility, including the undertakings and covenants includedtherein, see ‘‘—Liquidity and Capital Resources—Working Capital and Indebtedness—Revolving CreditSyndicated Facility’’ below.
Comparability of Historical Financial Information
The comparability of the historical financial information of DPA has been significantly affected by theCSX WT Acquisition in February 2005 and the P&O Acquisition in March 2006. Similarly, our historicaland future results of operations are not and will not be directly comparable to the historical financialinformation of DPA principally because the DPA Consolidated Financial Statements include the financialresults of P&O for the period from March 9, 2006, the first day following the P&O Acquisition, throughDecember 31, 2006 only, but also because the DPA Consolidated Financial Statements include thefinancial results of the regulatory activities of DPA. In addition, the DPA Consolidated FinancialStatements as of and for the six months ended June 30, 2006 and the year ended December 31, 2006 andthe Company Consolidated Financial Statements as of and for the six months ended June 30, 2007 includethe financial results of (i) the P&O Ferries Business and (ii) POPNA and P&O Estates.
The DPA Consolidated Financial Statements as of and for the six months ended June 30, 2006 reflect(i) the P&O Ferries Business and P&O Estates as continuing operations and not assets held for salebecause the decision to transfer these businesses was not taken until after June 30, 2006 and (ii) POPNA asassets held for sale and discontinued operations. The DPA Consolidated Financial Statements as of and forthe year ended December 31, 2006 reflect (i) the P&O Ferries Business as continuing operations and notassets held for sale because the decision to transfer this business was not taken until after December 31,2006 and (ii) POPNA and P&O Estates as assets held for sale and discontinued operations. The CompanyConsolidated Financial Statements reflect (i) P&O Estates as assets held for sale and discontinuedoperations and (ii) the P&O Ferries Business and POPNA as discontinued operations.
See ‘‘Unaudited Pro Forma Consolidated Financial Information’’ for a presentation of our incomestatement data as if (i) the acquisition of P&O; (ii) the disposal of POPNA, the Shekou Terminals and theColombo Terminal and the transfer to affiliates of ours of the P&O Ferries Business and of P&O Estates,(iii) the effective commencement of the Concession Agreement and (iv) the sale of portions of POTA andP&O AGS had occurred at the beginning of the periods presented (as applicable).
Factors Affecting Financial Condition and Results of Operations
The following is a discussion of the most significant factors that have affected, or are expected to affect,our financial condition and results of operations.
Volume
Our revenue is dependent to a significant extent on the throughput volumes at our container terminaloperations. Factors that can impact throughput volumes include: (i) the levels of global and regional tradeand the continuing increase in globalisation of world trade, (ii) competition from other global container
57
terminal operators, (iii) developments in the container shipping industry and (iv) our capacity and abilityto handle additional volumes.
Levels of Global and Regional Trade and Globalisation
Our results of operations are affected by the volume of our business, which in turn depends on worldwidetrade volumes as well as the import and export volumes of the regions in which we operate. Global tradevolumes and the import and export volumes of the regions in which we operate are significantly affected bychanges in global and regional economic, financial and political conditions that are outside of our control.The recent growth in container volumes has in large part been driven by a systemic shift in globalmanufacturing capacity and output from west to east, especially towards China. We believe that futuregrowth in container volumes will be dependent on the health of East Asian economies and the continuingglobalisation of the developing world, where the trend of increasing demand for the containerisation ofcargo is most prevalent.
Competition from Other Global Container Terminal Operators
The container terminal industry has been characterised in recent years by the consolidation of participantsto create global terminal operators. According to Drewry, the four largest terminal operators collectivelyaccounted for 44.1% of global gross capacity as of December 31, 2006 and 45.8% of global grossthroughput for the year ended December 31, 2006. Global operators compete for throughput increasinglybased on the size and diversification of their terminal portfolios, which enable them to offer globalnetworks to their liner customers, which are themselves consolidating. While our terminal portfoliocurrently exhibits greater geographical diversification than the portfolio of any other terminal operator,industry consolidation has created increased competition for us as other global operators are able to offerour shipping line customers alternative global networks and, in some cases, leverage existing relationshipswith shipping lines in one region to support growth in other regions.
Developments in the Container Shipping Industry
Because the main customers of container terminal operators are container shipping lines, developments inthe container shipping industry directly influence the way in which we manage our operations.
Consolidation. In recent years, the container shipping industry has experienced significantconsolidation as the major shipping lines seek to capitalise on economies of scale and enhance their globalpresence. It is expected that the share of container trade volume carried by the top ten global containershipping lines, which, according to Drewry, rose from 46.2% and 46.8% in 2005 and 2006, respectively, willcontinue to increase as major shipping lines continue to consolidate both for these reasons and alsobecause of the excess of capacity over demand that is anticipated to characterise the container shippingindustry over the next few years. This trend has decreased the number of different potential customers forthe container terminal industry and increased the impact that losing an existing customer or gaining a newcustomer could have on a terminal operator’s business. For the year ended December 31, 2006, our fiveand ten largest customers accounted for approximately 42% and 59%, respectively, of the full-year grossthroughput for all terminals held by us as of December 31, 2006 (excluding the six container terminalsoperated by POPNA, the two Shekou Terminals and the one Colombo Terminal). See ‘‘Risk Factors—Risks Relating to our Ports Business—We are dependent on a small number of customers for a significantportion of our business’’.
Global network reach and mega-alliances. In addition to consolidation through mergers andacquisitions, shipping lines have increasingly entered into various forms of intra-industry cooperativearrangements, including the creation of liner alliances designed to increase the number of times ships sailon certain routes and broaden geographic coverage. These alliances provide terminal operators with thepotential to align themselves as network, or preferred, vendors and thereby mirror the growth of, andmake network propositions with respect to, such alliances. We expect that this trend will benefit the largestcontainer terminal operators because of the high investment costs associated with maintaining a portfoliowith the geographic scope necessary to offer a network proposition to the major shipping lines.
Equity relationships between container shipping lines and container terminal operators. In an attempt toensure guaranteed berthing in competitive locations and establish a predictable long-term cost structure,shipping lines are increasingly investing in container terminals. In addition, container terminal operatorshave acquired equity interests in container shipping lines. As a result, two of the top ten global container
58
www.global-reports.com
shipping lines currently have equity relationships with two of our three largest container terminaloperators. By entering into an equity relationship with a shipping line, a terminal operator can achieveincreased anchor volumes, but will have less flexibility to target other shipping line customers. Accordingly,such a relationship could positively or negatively affect throughput and revenue at a particular terminaldepending on the relative strength of the shipping line partner as compared to its competitors in therelevant region. As discussed above, although we have entered into partnerships with shipping lines at theterminal level, and may be required by the terms of the relevant concession agreement to have a shippingline partner at a particular terminal, our global strategy has been to operate our business on acommon-user basis and, consequently, we have not entered into an equity relationship to date with a majorshipping company.
Growing economies of scale. The increasing containerisation of cargoes in recent years has resultedin the construction of larger container vessels, which benefit from lower operating and voyage unit costs,such as fuel, port and canal fees, manning, repairs, insurance and ship management costs. According toDrewry, the average size of container vessels in the global container fleet increased from 1,824 TEUs in2000 to 2,377 TEUs in 2006 and vessels of 5,000 TEUs or more represented 35.4% of total fleet capacity asof July 2007. Drewry projects that this will increase to 43.7% of total fleet capacity by July 2011. Theincreasing number of relatively large ships puts pressure on container terminal operators to offer facilitieswith deepwater access and develop sophisticated shipping and port-related technology to meet thedemands of these larger vessels. We expect that we and other terminal operators that invest in facilities andequipment to accommodate more and larger ships will see both volume and productivity benefits asshipping lines choose terminals that can most quickly and effectively handle their cargo, although the leveland scope of this demand depends on many factors. In addition, as the largest ships increasingly becometoo wide or too deep to call at many ports in the world, shipping lines may instead seek to, or be requiredto, rationalise the number of port calls they make and hence increase transhipment between hub ports andfinal destinations. As a result, terminals that are capable of handling the largest ships may have thepotential to position themselves as transhipment hubs in a particular region. We believe that certain of ourterminals, including our operations at DP World Jebel Ali in the UAE, Pusan Newport Company in SouthKorea and Qingdao Qianwan Container Terminal in China, are well positioned to service these mega-shipsand take advantage of the opportunity for increased transhipment throughput. We are also in the processof developing new terminals in Doraleh, Djibouti, Jebel Ali, UAE and Vallarpadam, India that will allowfor the service of these mega-ships.
Projected excess capacity in the container shipping industry. According to Drewry, the aggregatecapacity of new container ships on order as of July 2007 was equivalent to 52.7% of the then-existing globalfleet capacity. As a result of this large order book, Drewry predicts that there will be an excess of capacityover demand in the container shipping industry over the next few years. Should the projected excesscapacity in the container shipping industry trigger a fall in freight rates, shipping lines may attempt toreduce costs by pressuring container terminal operators to provide a reduction in rates relating tostevedoring or other services. However, the effectiveness of any such attempt would be affected by thebalance between supply and demand for regional container terminal capacity. Based on confirmedexpansion plans, Drewry predicts that by 2012, demand for container terminal capacity may outpace thesupply of container terminal capacity in Eastern Europe, the Far East, South America, the Middle East,South Asia and Oceania.
Our Capacity and Ability to Handle Additional Volumes
We believe that we operate some of the most productive and efficient terminals in the world by usingmodern technology and processes. We believe that the maintenance and enhancement of our efficientoperations are critically important as they have a direct impact on our results of operations. In particular,by operating more efficiently we seek to generate additional value out of our existing facilities byincreasing capacity, which in turn permits increased throughput, and making each crane move moreprofitable. Increased operating efficiency also reduces our cost base as we are able to fully utilise ourexisting assets and do not need to invest additional capital in the deployment of new assets. See‘‘—Investment in the Development of New Terminals’’ below. At certain of our terminals we are not ableto expand our operations physically, and efficiency improvements are the only means for us to increase ourcapacity and throughput. Conversely, at terminals that could be expanded physically, we may use efficiencyimprovements to incrementally increase capacity until demand reaches a point that justifies the capitalexpenditure costs associated with physical expansion. Finally, efficient operations help us maintain goodcustomer relations and reduce customer defection, thereby maintaining our competitive position.
59
Increases in operational efficiency can be achieved by, among other things:
� introducing new technologies to speed up processes and reduce labour costs;
� improving landside support to ensure that containers are quickly and efficiently transported toand from our terminals;
� using external depot functions to increase the capacity for container storage;
� actively managing container storage times by incentivising customers to take delivery ofcontainers that have arrived in port as quickly as possible;
� maintaining schedule integrity with respect to vessel calls;
� increasing the number of berthing windows by loading and unloading vessels more quickly; and
� implementing rationalised berth utilisation, which involves arranging the timing of the arrival anddeparture of different-sized ships to ensure that a maximum of berth length is used.
Notable examples of increases in operational efficiency in our portfolio include DP World Constanta,Romania where, principally by improving landside support and using external depot functions, we wereable to increase capacity utilisation beyond initial estimates, which enhanced the terminal’s revenue andprofitability beyond initial estimates. Similarly, at DP World Nhava Sheva, India, rationalised berthutilisation has allowed us to significantly increase the percentage of the terminal’s 600 metre berth lengththat we are routinely able to use at any one time.
O&D and Transhipment Mix
For the year ended December 31, 2006, approximately 76% of our gross throughput was O&D throughput.O&D throughput differs from transhipment throughput primarily in that O&D throughput is usually mostcost-effectively handled by one terminal, preferably close to the point of consumption, which makes O&Dthroughput less likely to be lost to competitors and less price-sensitive than transhipment throughput.O&D throughput also provides terminal operators with an opportunity to earn additional revenue bycharging for delivery or reception of the container from the shipper or consignee, as well as by providingancillary services, such as container freight stations (‘‘CFS’’) and container cleaning. We will endeavour tomaintain a strong O&D component in each of our terminals or, where this is not possible, obtain volumecommitments from shipping lines to make our terminals less susceptible to the loss of transhipmentvolumes and price deterioration. However, the development of sophisticated route networks by shippinglines, together with the limited number of terminals that can efficiently service the growing number oflarge container ships, increases the potential for, and attractiveness of, additional transhipment volume.See ‘‘—Volume—Developments in the Container Shipping Industry—Growing economies of scale’’ above.
Capacity Development
Growth in our revenue is driven in large part by expansion of capacity at our existing terminals, thedevelopment of new terminals and acquisitions. Our growth strategy is based on achieving a balancebetween our ability to handle the large volumes demanded by our customers and our ability to targetregions that do not account for much of our total global throughput but deliver a high return on equity. Weintend to pursue growth opportunities that will allow us to continue to diversify the geographic spread ofour operations and allow us to take advantage of the typically stable returns on equity in lower-riskestablished markets such as Europe and Australia and the potential for greater returns on equity inhigher-risk emerging markets such as Latin America and Africa. However, from time to time, based on ourongoing business review, we may sell or divest businesses in the ordinary course of business.
Ability to Increase Capacity at Existing Facilities
We are focused on maximising our existing asset base to facilitate organic growth, which typically requiresless capital investment, generates incremental cash flow more quickly and has a lower opportunity cost ascompared to new development opportunities. We aim to maximise our latent capacity through productivityimprovements and concession extensions, which we expect will result in increasing returns on total capitalemployed. See ‘‘—Investment in the Development of New Terminals’’ below.
Our ability to achieve and manage future growth will depend upon a number of factors, both within andoutside of our control, including our ability to maintain, expand or develop relationships with ourcustomers, suppliers, contractors, lenders and other third parties, reach agreements with potential joint
60
www.global-reports.com
venture partners on commercial and technical terms satisfactory to us and expand our operating capacityon a timely and reasonable basis, as well as our ability to adjust and optimise the organisation of ouroperating structure. See ‘‘—Liquidity and Capital Resources—Capital Expenditures’’ below.
Ability to Win Concessions
We believe that we are able to differentiate ourselves from our competitors because of:
� our track-record of winning concessions globally based on our customer relationships andcommon-user status;
� our operating and technical credentials;
� our willingness and financial ability to invest in new capacity to meet demand;
� our ability to offer an ‘‘integrated port management’’ model, which combines container handlingfacilities with economic free zones and infrastructure developments; and
� our focus on key government issues such as security and sustainability.
Attractive concession opportunities will continue to arise globally and, as authorities granting concessionsincrease barriers to entry, we believe that our experience and qualifications will leave us well positioned tocontinue to win new concessions.
Ability to Acquire and Effectively Integrate Other Operators
Growth through the acquisition of existing terminal operations has been one of the primary ways by whichwe have increased our gross capacity over the past three years. Generally, our acquisition strategy has inthe past involved identifying and acquiring assets in target markets and then making operational orinfrastructure investments to increase their efficiency and improve capacity. However, the changing natureof the industry has meant that growth through such acquisitions has become increasingly limited, and thishas required a different approach to growth and value creation going forward. While acquisitions allow forthe rapid expansion of capacity and generally generate cash flow immediately, they often require a greatercapital investment, and are typically more expensive on a per-TEU basis, than other forms of capacitydevelopment. In addition, acquisitions involve risks inherent in identifying and assessing the value,strengths and weaknesses of suitable acquisition targets, as well as the potential for significant integrationand efficiency improvement costs. However, we believe that our position as one of the four largest globalterminal operators by capacity and throughput, together with our established track-record of acquiring andintegrating other operators, will allow us to benefit from the trend of container terminal industryconsolidation. While we seek to continue to exploit the synergies achieved through our recent acquisitions,some of the benefits that we have realised thus far include:
� our ability to leverage our strength across our terminal portfolio to procure equipment at moreattractive rates;
� our negotiations with insurance companies have resulted in wider coverage with lower premiums,through which we have achieved annualised savings since the P&O Acquisition of $5.3 million;and
� reductions in general and administration expenses associated with the maintenance of one headoffice instead of two and further rationalisation within our regional offices.
The success of the P&O integration process is demonstrated by the results to date from the time of theP&O Acquisition. We have stayed ahead of the integration schedule, achieved our objective of ‘‘business asusual’’ and maintained our customer base through the integration. More importantly, feedback fromcustomers has confirmed that the integration has been achieved in a smooth and seamless manner withoutadverse impact on the customers’ operations.
The integration has established a solid operational foundation through which we now manage ourbusiness. We believe that we are well positioned to execute our growth strategy as a result of thisexperience.
We will continue to consider and review potential acquisition targets, if and when they present themselves,as a strategic means of growing our portfolio, as well as strategic divestments as a means of ensuring thatwe maintain a balanced portfolio.
61
Regulatory Environment
Container terminals operate under a number of different ownership, operating and regulatory structures,which can vary by region and country. The majority of container terminals around the world currentlyoperate under a structure where both the state and private sector retain some form of involvement.However, the container terminal industry has experienced a trend over the past 15 years towards theprivatisation of existing assets by state-owned operators and private participation in greenfield and build/operate/transfer (‘‘BOT’’) schemes. The trend towards privatisation and BOT schemes largely reflects anattempt on the part of governments to fund much-needed container port development projects in order toimprove the trade competitiveness of their respective countries. Drewry estimates that the proportion ofglobal throughput handled at state-run terminals, other than those controlled by global terminal operatorswith a state as the controlling shareholder, has declined from approximately 42% in 1993 to 19.2% in 2006,which has increased the opportunities for global container terminal operators to broaden their portfolios.Similarly, the container terminal industry does not face stringent price regulation in general. In certainregions, most notably Africa and, to a lesser extent, South Asia and the Middle East, governments continueto have a significant ownership interest in container terminals and a considerable share of capacity andthroughput in their particular region. In other jurisdictions, such as India, the relevant port authority willnot operate terminals but will impose tariffs that set the rates that a terminal operator may charge.Conversely, in regions such as Northern Europe and Australia, governments retain an ownership interestin a relatively small amount of capacity and throughput and do not impose tariffs. We believe that ourposition as one of the four largest global terminal operators by capacity and throughput, together with ourability to significantly increase operational efficiency will allow us to capitalise on the trend in thecontainer terminal industry towards increased privatisation.
Investment in the Development of New Terminals
We believe that the development of our business and growth of our revenue is based upon increasing ourglobal capacity by continuing to increase the size of our portfolio. This growth can generally be achieved byeither acquiring existing terminals or building new terminals, whether on greenfield or brownfield sites, asa result of concession wins or otherwise. The development of a new terminal, however, is a long term andcapital intensive process as compared to the acquisition of existing operations, which generally generatecash flow immediately. For example, a significant portion of our capital expenditure relates todevelopments, such as Phase 1-2 of the expansion project at our terminal in Pusan, South Korea, which isnot expected to become operational or generate meaningful cash flow until 2009. Similarly, since 2003, wehave made a significant investment in the expansion project at DP World Jebel Ali in Dubai, the first phaseof which only became operational and started generating positive cash flow in the third quarter of 2007.We expect to continue to undertake long-term projects, such as our proposed development of the LondonGateway terminal, which will increase our expenses without contemporaneous growth in our revenueswhile in the development phase. See ‘‘—Liquidity and Capital Resources—Capital Expenditures’’ below.
Foreign Exchange Movements
Our reporting currency is the US dollar, while the reporting currency of our subsidiaries, affiliates andassociates varies depending on their geographic location. Accordingly, we are exposed to risks related tothe translation of assets and liabilities denominated in currencies other than, or not pegged to, theUS dollar. As of June 30, 2007, 71.7% of our assets were denominated in foreign currencies. In addition tothese translation risks, we are exposed to transaction risks as a result of differences in the currency mix ofour operating expenses, on the one hand, and cost of sales, on the other hand. As a result, a depreciationor appreciation of a particular local currency against the US dollar could have either a positive or negativeimpact on both our balance sheet and our profit margin and therefore our profit for the year. Foradditional discussion of the impact of foreign currency transactions and translations on our results ofoperations, see ‘‘—Quantitative and Qualitative Disclosures About Market Risk—Currency Risk’’ belowand ‘‘Risk Factors—Risks Relating to the Company—Fluctuations in currency exchange rates could havean adverse effect on our results of operations’’.
General Economic, Financial and Political Conditions
Our financial condition and results of operations are affected by global and regional economic, financialand political conditions that are outside of our control, including as a result of the imposition of tradebarriers, sanctions, boycotts and other measures, significant variations in the exchange rates applicable tocurrencies in the regions in which we operate, trade disputes and work stoppages, particularly in the
62
www.global-reports.com
transportation services industry, and acts of war, hostilities, natural disasters, epidemics or terrorism. See‘‘Risk Factors—Risks Relating to our Ports Business—Our operations could be adversely affected byterrorist attacks, natural disasters or other catastrophic events beyond our control’’. Conversely, certaineconomic, financial and political conditions, including those reflecting policies designed to liberalise tradein the regions and countries in which we operate, may have a positive effect on our financial condition andresults of operations.
Critical Accounting Policies and Estimates
The preparation of our financial statements in conformity with IFRS requires us to make many estimatesand judgments that affect the reported amounts of assets, liabilities, revenue and expenses. Thoseestimates and judgments are based on historical experience, available information, future expectations andother factors and assumptions that we believe are reasonable under the circumstances. We review ourestimates and judgments on an ongoing basis and revise them when necessary. Actual results may differfrom the original or revised estimates. Summaries of our significant accounting policies are contained inNote 2.3, ‘‘Summary of Significant Accounting Policies’’, of the Notes to the DPA Consolidated FinancialStatements as of and for the years ended December 31, 2005 and 2006 and Note 3, ‘‘Significant accountingpolicies’’, of the Notes to the Company Consolidated Financial Statements as of and for the six monthsended June 30, 2007. A description of our most critical policies, which we believe involve a significantdegree of judgment or complexity or are areas where assumptions and estimates are significant to thepreparation of our financial statements, follows.
Accounting for Impairment of Assets
Impairment of goodwill
As of June 30, 2007, we had total goodwill on our balance sheet of $2,553.8 million. We determine whethergoodwill is impaired at least on an annual basis. This requires an estimation of the value in use of thecash-generating units to which the goodwill is allocated. Estimating the value in use requires us to make anestimate of the expected future cash flows from the cash-generating unit and also to choose a suitablediscount rate in order to calculate the present value of those cash flows. These estimates can besignificantly affected by future changes in market conditions, the economic environment and inflation.
Impairment of other intangible assets
As of June 30, 2007, we had other intangible assets on our balance sheet of $3,434.6 million. We assess theimpairment of our intangible assets, which principally comprise our concessions, when there is anindication that an impairment loss may exist and at least annually. The impairment review compares theestimated recoverable amount to the carrying amount of the asset. The recoverable amount is the higher ofthe estimated fair value less cost to sell or the asset’s value-in-use. To estimate these values, we use theestimated market value or discounted cash flows, as relevant. An impairment loss is recognised when therecoverable amount of such asset is less than the carrying value of the asset. Estimates of future cash flowsare judgments based on our experience and knowledge of our operations and the industries in which weoperate. We also estimate the useful lives of other finite lived intangible assets based on estimates of theeconomic benefit expected to be received from the acquired assets, which could differ from actual results.These estimates can be significantly affected by future changes in market conditions, the economicenvironment and inflation.
Company and DPA Historical Results of Operations
The discussion and analysis of the six months ended June 30, 2007 compared to the six months endedJune 30, 2006 is based on the Company Consolidated Financial Statements as of and for the six monthsended June 30, 2007 and the DPA Consolidated Financial Statements as of and for the six months endedJune 30, 2006. The discussion and analysis of (i) the year ended December 31, 2006 compared to the yearended December 31, 2005 and (ii) the year ended December 31, 2005 compared to the year endedDecember 31, 2004 is based on the DPA Consolidated Financial Statements.
Our results of operations for the six months ended June 30, 2007 are not directly comparable to DPA’sresults of operations for the six months ended June 30, 2006. In addition, the comparability of thehistorical financial information of DPA has been significantly affected by the CSX WT Acquisition and theP&O Acquisition. See ‘‘Presentation of Certain Financial and Other Information—Comparability of
63
Historical Financial Information’’ and ‘‘—Factors Affecting the Comparability of the Periods underReview’’ above for further information.
Explanation of key historical financial statement items
Revenue from operations
Revenue from operations is comprised of income earned from the provision of various services such asstevedoring, warehousing and storage, CFS cargo handling, trucking, port management fees, warehousegate receipts and miscellaneous terminal services. See ‘‘—Factors Affecting Financial Condition andResults of Operations—Volume’’ and ‘‘—Factors Affecting Financial Condition and Results ofOperations—Capacity Development—Regulatory Environment’’ above.
Cost of sales
Cost of sales are comprised of costs incurred in connection with the operation, maintenance and security ofour facilities and other costs directly attributable to the various services provided by us. Major componentsof cost of sales include the amortisation cost of port concessions, marine cost of sales, garage cost of sales,warehousing expenses, transportation expenses and yard and gate operations expenses. Starting with theCompany Consolidated Financial Statements as of and for the six months ended June 30, 2007, wereallocated fees associated with concession agreements governing consolidated terminal operations fromgeneral and administration expenses to cost of sales to better reflect industry practice.
General and administration expenses
General and administration expenses include staff costs, facilities rental, travel and entertainment,insurance, advertising, marketing, printing and stationery, communication costs, legal expenses,consultancy costs, IT charges, repair and maintenance costs and other sundry expenses.
Other income
Other income includes interest income and duty free rental income.
Share of profit (loss) of joint ventures and associates
Share of profit (loss) of joint ventures and associates reflects our share of profits or losses from entitiesthat are associates or joint ventures. The results of operations of associates and joint ventures are notconsolidated and, consequently, only the earnings impact of these entities based on our shareholding isincorporated into our results.
64
www.global-reports.com
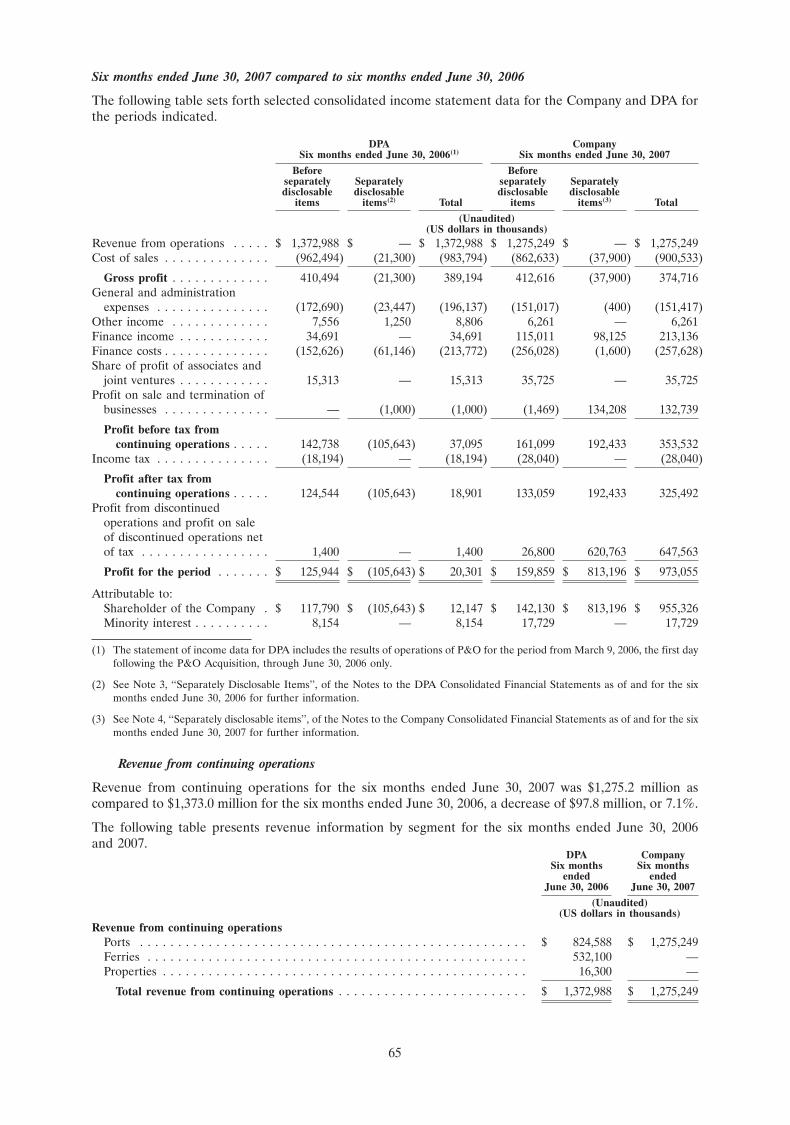
Six months ended June 30, 2007 compared to six months ended June 30, 2006
The following table sets forth selected consolidated income statement data for the Company and DPA forthe periods indicated.
DPA CompanySix months ended June 30, 2006(1) Six months ended June 30, 2007
Before Beforeseparately Separately separately Separatelydisclosable disclosable disclosable disclosable
items items(2) Total items items(3) Total
(Unaudited)(US dollars in thousands)
Revenue from operations . . . . . $ 1,372,988 $ — $ 1,372,988 $ 1,275,249 $ — $ 1,275,249Cost of sales . . . . . . . . . . . . . . (962,494) (21,300) (983,794) (862,633) (37,900) (900,533)
Gross profit . . . . . . . . . . . . . 410,494 (21,300) 389,194 412,616 (37,900) 374,716General and administration
expenses . . . . . . . . . . . . . . . (172,690) (23,447) (196,137) (151,017) (400) (151,417)Other income . . . . . . . . . . . . . 7,556 1,250 8,806 6,261 — 6,261Finance income . . . . . . . . . . . . 34,691 — 34,691 115,011 98,125 213,136Finance costs . . . . . . . . . . . . . . (152,626) (61,146) (213,772) (256,028) (1,600) (257,628)Share of profit of associates and
joint ventures . . . . . . . . . . . . 15,313 — 15,313 35,725 — 35,725Profit on sale and termination of
businesses . . . . . . . . . . . . . . — (1,000) (1,000) (1,469) 134,208 132,739
Profit before tax fromcontinuing operations . . . . . 142,738 (105,643) 37,095 161,099 192,433 353,532
Income tax . . . . . . . . . . . . . . . (18,194) — (18,194) (28,040) — (28,040)
Profit after tax fromcontinuing operations . . . . . 124,544 (105,643) 18,901 133,059 192,433 325,492
Profit from discontinuedoperations and profit on saleof discontinued operations netof tax . . . . . . . . . . . . . . . . . 1,400 — 1,400 26,800 620,763 647,563
Profit for the period . . . . . . . $ 125,944 $ (105,643) $ 20,301 $ 159,859 $ 813,196 $ 973,055
Attributable to:Shareholder of the Company . $ 117,790 $ (105,643) $ 12,147 $ 142,130 $ 813,196 $ 955,326Minority interest . . . . . . . . . . 8,154 — 8,154 17,729 — 17,729
(1) The statement of income data for DPA includes the results of operations of P&O for the period from March 9, 2006, the first dayfollowing the P&O Acquisition, through June 30, 2006 only.
(2) See Note 3, ‘‘Separately Disclosable Items’’, of the Notes to the DPA Consolidated Financial Statements as of and for the sixmonths ended June 30, 2006 for further information.
(3) See Note 4, ‘‘Separately disclosable items’’, of the Notes to the Company Consolidated Financial Statements as of and for the sixmonths ended June 30, 2007 for further information.
Revenue from continuing operations
Revenue from continuing operations for the six months ended June 30, 2007 was $1,275.2 million ascompared to $1,373.0 million for the six months ended June 30, 2006, a decrease of $97.8 million, or 7.1%.
The following table presents revenue information by segment for the six months ended June 30, 2006and 2007.
DPA CompanySix months Six months
ended endedJune 30, 2006 June 30, 2007
(Unaudited)(US dollars in thousands)
Revenue from continuing operationsPorts . . . . . . . . . . . . . . . . . . . . . . . . . . . . . . . . . . . . . . . . . . . . . . . . . . . $ 824,588 $ 1,275,249Ferries . . . . . . . . . . . . . . . . . . . . . . . . . . . . . . . . . . . . . . . . . . . . . . . . . . 532,100 —Properties . . . . . . . . . . . . . . . . . . . . . . . . . . . . . . . . . . . . . . . . . . . . . . . . 16,300 —
Total revenue from continuing operations . . . . . . . . . . . . . . . . . . . . . . . . . $ 1,372,988 $ 1,275,249
65
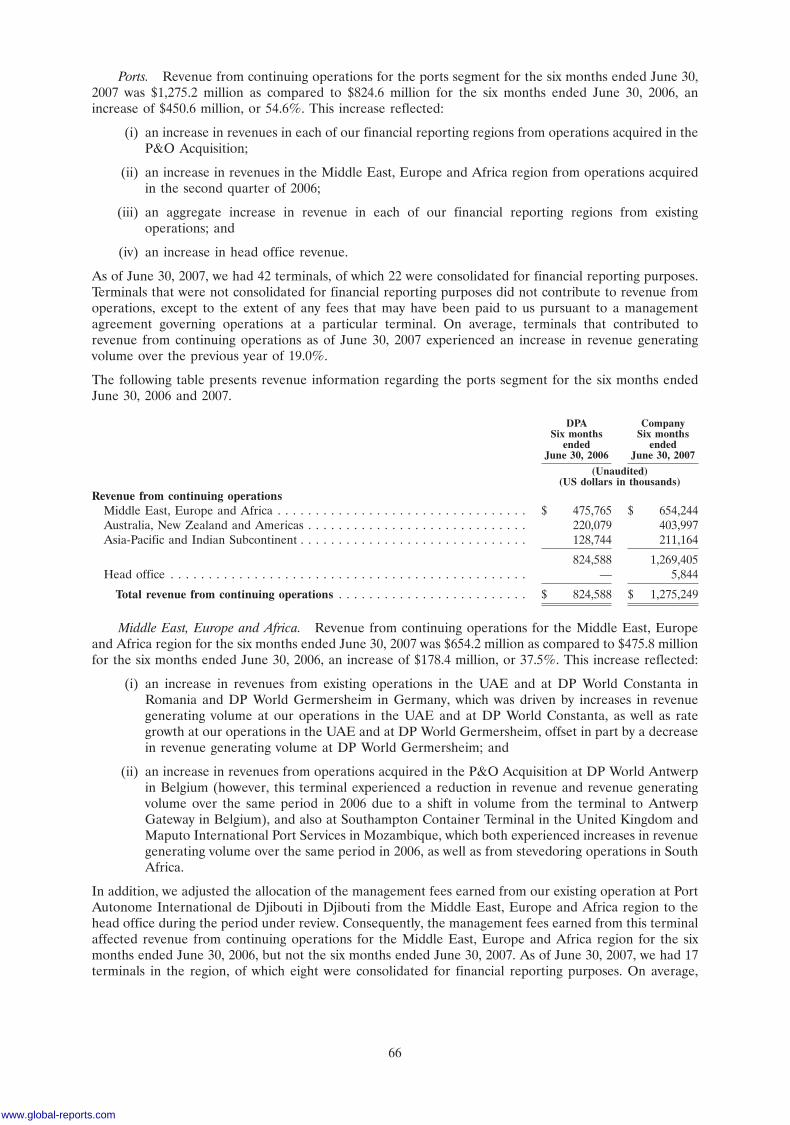
Ports. Revenue from continuing operations for the ports segment for the six months ended June 30,2007 was $1,275.2 million as compared to $824.6 million for the six months ended June 30, 2006, anincrease of $450.6 million, or 54.6%. This increase reflected:
(i) an increase in revenues in each of our financial reporting regions from operations acquired in theP&O Acquisition;
(ii) an increase in revenues in the Middle East, Europe and Africa region from operations acquiredin the second quarter of 2006;
(iii) an aggregate increase in revenue in each of our financial reporting regions from existingoperations; and
(iv) an increase in head office revenue.
As of June 30, 2007, we had 42 terminals, of which 22 were consolidated for financial reporting purposes.Terminals that were not consolidated for financial reporting purposes did not contribute to revenue fromoperations, except to the extent of any fees that may have been paid to us pursuant to a managementagreement governing operations at a particular terminal. On average, terminals that contributed torevenue from continuing operations as of June 30, 2007 experienced an increase in revenue generatingvolume over the previous year of 19.0%.
The following table presents revenue information regarding the ports segment for the six months endedJune 30, 2006 and 2007.
DPA CompanySix months Six months
ended endedJune 30, 2006 June 30, 2007
(Unaudited)(US dollars in thousands)
Revenue from continuing operationsMiddle East, Europe and Africa . . . . . . . . . . . . . . . . . . . . . . . . . . . . . . . . . $ 475,765 $ 654,244Australia, New Zealand and Americas . . . . . . . . . . . . . . . . . . . . . . . . . . . . . 220,079 403,997Asia-Pacific and Indian Subcontinent . . . . . . . . . . . . . . . . . . . . . . . . . . . . . . 128,744 211,164
824,588 1,269,405Head office . . . . . . . . . . . . . . . . . . . . . . . . . . . . . . . . . . . . . . . . . . . . . . . — 5,844
Total revenue from continuing operations . . . . . . . . . . . . . . . . . . . . . . . . . $ 824,588 $ 1,275,249
Middle East, Europe and Africa. Revenue from continuing operations for the Middle East, Europeand Africa region for the six months ended June 30, 2007 was $654.2 million as compared to $475.8 millionfor the six months ended June 30, 2006, an increase of $178.4 million, or 37.5%. This increase reflected:
(i) an increase in revenues from existing operations in the UAE and at DP World Constanta inRomania and DP World Germersheim in Germany, which was driven by increases in revenuegenerating volume at our operations in the UAE and at DP World Constanta, as well as rategrowth at our operations in the UAE and at DP World Germersheim, offset in part by a decreasein revenue generating volume at DP World Germersheim; and
(ii) an increase in revenues from operations acquired in the P&O Acquisition at DP World Antwerpin Belgium (however, this terminal experienced a reduction in revenue and revenue generatingvolume over the same period in 2006 due to a shift in volume from the terminal to AntwerpGateway in Belgium), and also at Southampton Container Terminal in the United Kingdom andMaputo International Port Services in Mozambique, which both experienced increases in revenuegenerating volume over the same period in 2006, as well as from stevedoring operations in SouthAfrica.
In addition, we adjusted the allocation of the management fees earned from our existing operation at PortAutonome International de Djibouti in Djibouti from the Middle East, Europe and Africa region to thehead office during the period under review. Consequently, the management fees earned from this terminalaffected revenue from continuing operations for the Middle East, Europe and Africa region for the sixmonths ended June 30, 2006, but not the six months ended June 30, 2007. As of June 30, 2007, we had 17terminals in the region, of which eight were consolidated for financial reporting purposes. On average,
66
www.global-reports.com
terminals that contributed to revenue from continuing operations for the region as of June 30, 2007experienced an increase in revenue generating volume over the same period in the previous year of 20.2%.
Australia, New Zealand and Americas. Revenue from continuing operations for the Australia, NewZealand and Americas region for the six months ended June 30, 2007 was $404.0 million as compared to$220.1 million for the six months ended June 30, 2006, an increase of $183.9 million, or 83.6%. Thisincrease reflected:
(i) an increase in revenues from existing operations at DP World Adelaide in Australia, which wasdriven by an increase in revenue generating volume;
(ii) an increase in revenues from operations acquired in the P&O Acquisition at DP World Brisbanein Australia (however, this terminal experienced a reduction in revenue generating volume overthe same period in 2006), and also at DP World Melbourne, DP World Sydney and DP WorldFremantle in Australia, Terminales Rio de la Plata (Buenos Aires) in Argentina and DP WorldVancouver in Canada, all of which experienced increases in revenue generating volume over thesame period in 2006, as well as from P&O Maritime Services; and
(iii) increases in management fees received by us from our existing operations at DP World Caucedoin the Dominican Republic and DP World Puerto Cabello in Venezuela, which were attributableto increases in revenue generating volume at both terminals.
As of June 30, 2007, we had nine terminals in the region, of which seven were consolidated for financialreporting purposes. On average, terminals that contributed to revenue from continuing operations for theregion as of June 30, 2007 experienced an increase in revenue generating volume over the same period inthe previous year of 10.6%.
Asia-Pacific and Indian Subcontinent. Revenue from continuing operations for the Asia-Pacific andIndian Subcontinent region for the six months ended June 30, 2007 was $211.2 million as compared to$128.7 million for the six months ended June 30, 2006, an increase of $82.5 million, or 64.1%. This increasereflected:
(i) an increase in revenues from existing operations at CT3 (Hong Kong) in China and DP WorldCochin in India, which reflected increases in revenue generating volume at such operations; and
(ii) an increase in revenues from operations acquired in the P&O Acquisition at Asia TerminalsIncorporated in the Philippines, DP World Chennai, Mundra International Container Terminaland DP World Nhava Sheva in India and DP World Karachi in Pakistan, all of which experiencedincreases in revenue generating volume over the same period in 2006.
As of June 30, 2007, we had 16 terminals in the region, of which seven were consolidated for financialreporting purposes. On average, terminals that contributed to revenue from continuing operations for theregion as of June 30, 2007 experienced an increase in revenue generating volume over the same period inthe previous year of 21.6%.
Head office. Head office revenue from continuing operations for the ports segment for the sixmonths ended June 30, 2007 was $5.8 million as compared to zero for the six months ended June 30, 2006,an increase of $5.8 million. This increase was principally due to our adjustment of the allocation of themanagement fees earned from our existing operation at Port Autonome International de Djibouti from theMiddle East, Europe and Africa region to the head office during the period under review. However, theamount of such management fees increased for the six months ended June 30, 2007 as compared to the sixmonths ended June 30, 2006 pursuant to the terms of the applicable management agreement as a result ofan increase in revenue generating volume at the terminal.
Ferries. Revenue from continuing operations for the ferries segment for the six months endedJune 30, 2006 was $532.1 million.
Property. Revenue from continuing operations for the property segment for the six months endedJune 30, 2006 was $16.3 million.
Cost of sales
Cost of sales for the six months ended June 30, 2007 were $900.5 million as compared to $983.8 million forthe six months ended June 30, 2006, a decrease of $83.3 million, or 8.5%. This decrease in cost of sales was
67
principally due to the exclusion of cost of sales relating to the P&O Ferries Business and P&O Estates,which amounted to $464.1 million for the six months ended June 30, 2006. This decrease was offset in partby (i) an increase in cost of sales relating to terminal operations acquired in the P&O Acquisition of $292.3million and (ii) an aggregate increase in cost of sales across the remainder of our terminal portfolio of$88.5 million, both of which were driven primarily by the reallocation of fees associated with concessionagreements governing consolidated terminal operations from general and administration expenses to costof sales to better reflect industry practice.
Cost of sales for the six months ended June 30, 2007 was also impacted by the inclusion of $37.9 million incost of sales associated with separately disclosable items, which consisted primarily of an impairment onsoftware costs caused by the discontinuation of the related software project. Cost of sales for the sixmonths ended June 30, 2006 was also impacted by the inclusion of $21.3 million in cost of sales associatedwith separately disclosable items, which consisted primarily of expenses in respect of relocation,redundancy and reorganization-related costs arising as a result of the P&O Acquisition.
General and administration expenses
General and administration expenses for the six months ended June 30, 2007 were $151.4 million ascompared to $196.1 million for the six months ended June 30, 2006, a decrease of $44.7 million, or 22.8%.This decrease in general and administration expenses was principally due to (i) the exclusion of generaland administration expenses relating to the P&O Ferries Business and P&O Estates, which amounted to$50.6 million for the six months ended June 30, 2006, and (ii) a decrease in general and administrationexpenses relating to terminal operations acquired in the P&O Acquisition of $24.4 million, which wasdriven primarily by the reallocation of fees associated with concession agreements governing consolidatedterminal operations from general and administration expenses to cost of sales to better reflect industrypractice. This decrease was offset in part by an increase in general and administration expenses across ourterminal portfolio (excluding terminal operations acquired in the P&O Acquisition) of $30.3 million.
General and administration expenses for the six months ended June 30, 2007 were also impacted by theinclusion of $0.4 million in general and administration expenses associated with separately disclosableitems, which consisted primarily of expenses arising from our buyout of certain members of pensionschemes acquired in the P&O Acquisition. General and administration expenses for the six months endedJune 30, 2006 were also impacted by the inclusion of $23.4 million in costs associated with separatelydisclosable items, which consisted primarily of expenses arising from the integration of P&O.
Other income
Other income for the six months ended June 30, 2007 was $6.3 million as compared to $8.8 million for thesix months ended June 30, 2006, a decrease of $2.5 million, or 28.4%. This decrease in other income wasdue to the absence of any contribution to other income by entities acquired in the P&O Acquisition, whichhad contributed $2.5 million in other income for the six months ended June 30, 2006.
Other income for the six months ended June 30, 2006 was also impacted by the inclusion of separatelydisclosable income of $1.3 million, which consisted primarily of profit on the disposal of assets prior to theend of their useful expected lives or at values significantly different from their previously-assessed residualvalue.
Finance income
Finance income for the six months ended June 30, 2007 was $213.1 million as compared to $34.7 millionfor the six months ended June 30, 2006, an increase of $178.4 million, or 5.1 times. This increase in financeincome was principally due to interest earned on bank deposits consisting of cash generated from thedisposal of POPNA, the Shekou Terminals and the Colombo Terminal.
Finance income for the six months ended June 30, 2007 was also impacted by the inclusion of separatelydisclosable income of $98.1 million, which consisted primarily of profit on the termination of two interestrate swaps.
Finance costs
Finance costs for the six months ended June 30, 2007 were $257.6 million as compared to $213.8 millionfor the six months ended June 30, 2006, an increase of $43.8 million, or 20.5%. This increase in financecosts was principally due to the full period impact of (i) debt of subsidiaries acquired in the P&O
68
www.global-reports.com
Acquisition and (ii) the $6,800.0 million term loan facility used to fund the acquisition of P&O. Thisincrease was offset in part by the exclusion of finance costs relating to the P&O Ferries Business and P&OEstates, which amounted to $5.7 million for the six months ended June 30, 2006.
Finance costs for the six months ended June 30, 2007 were also impacted by the inclusion of $1.6 million infinance costs associated with separately disclosable items, which represented the ineffective part of anAustralian Dollar currency hedge held in respect of the portion of our Australian landside logistics andautomotive and general stevedoring business that we sold during the period. This hedge was subsequentlyclosed out with a small gain in the second half of 2007. Finance costs for the six months ended June 30,2006 were also impacted by the inclusion of $61.1 million in finance costs associated with separatelydisclosable items, which consisted primarily of costs relating to derivative contracts entered into to hedgeagainst variability in cash flows arising as a result of movements in foreign exchange rates up until thecompletion of the P&O Acquisition.
Share of profit of associates and joint ventures
Share of profit of associates and joint ventures for the six months ended June 30, 2007 was $35.7 million ascompared to $15.3 million for the six months ended June 30, 2006, an increase of $20.4 million, or1.3 times. This increase in share of profit of associates and joint ventures was principally due to:
(i) an increase in net profit of existing operations at ACT (CT8) (Hong Kong) and Tianjin OrientContainer Terminals in China, which was driven by increases in revenue generating volume atsuch operations, as well as increases in net profit from the logistics centres in Hong Kong andYantian in China. These increases were offset in part by a decrease in net profit from DP WorldYantai in China, although this terminal experienced an increase in revenue generating volumeover the same period in the previous year;
(ii) a net profit at DP World Caucedo as opposed to a net loss over the same period in the previousyear, which reflected an increase in revenue generating volume, offset in part by a decrease in netprofit from DP World Puerto Cabello, although this terminal experienced an increase in revenuegenerating volume over the same period in the previous year;
(iii) an increase in net profit of operations at Terminal de Nord (Le Havre), Terminal de France (LeHavre), Fos Container Terminal (Fos sur Mer) and Mourepiane Container Terminal (Marseille)in France and Tilbury Container Services in the United Kingdom, all of which experiencedincreases in revenue generating volume, although Mourepiane Container Terminal (Marseille)experienced a reduction in profit over the same period in the previous year, and a decrease in thenet loss at Antwerp Gateway, which reflected an increase in revenue generating volume at theterminal;
(iv) an increase in net profit from operations at Qingdao Qianwan Container Terminal in China,Terminal Petikemas Surabaya in Indonesia and Vostochnaya Stevedore Company in Russia,which was driven by a net increase in revenue generating volume at the terminals, offset by adecrease in net profit at Laem Chabang International Terminal in Thailand, which was driven bya decrease in revenue generating volume; and
(v) a decrease in the net loss of operations that commenced in the first quarter of 2006 at PusanNewport Company in South Korea, which reflected an increase in revenue generating volume.
In addition, Visakha Container Terminal in India experienced a decrease in net loss over the same periodin the previous year, which reflected an increase in revenue generating volume, but did not impact share ofprofit of associates and joint ventures for the period under review because the carrying value of ourinvestment in Visakha Container Terminal had been reduced to zero as of December 31, 2005.
Share of profit of associates and joint ventures for the six months ended June 30, 2006 was also impactedby the inclusion of net profit from operations at the Shekou Terminals, the Colombo Terminal andShanghai JiFa. On average, the terminals that contributed to share of profit of associates and joint venturesas of June 30, 2007 experienced an increase in revenue generating volume over the previous year of 21.7%.
Income tax
Income tax for the six months ended June 30, 2007 was $28.0 million as compared to $18.2 million for thesix months ended June 30, 2006, an increase of $9.8 million, or 53.8%. This increase in income tax wasprincipally due to the full period impact of taxes in respect of operations acquired in the P&O Acquisition.
69
Profit after tax from continuing operations
As a result of the factors described above, profit after tax from continuing operations for the six monthsended June 30, 2007 was $325.5 million as compared to $18.9 million for the six months ended June 30,2006, an increase of $306.6 million, or 16.2 times.
The following table presents profit information by segment for the six months ended June 30, 2006 and2007.
DPA CompanySix months ended June 30, 2006 Six months ended June 30, 2007
Before Beforeseparately Separately separately Separatelydisclosable disclosable disclosable disclosable
items items(1) Total items items(2) Total
(Unaudited)(US dollars in thousands)
Profit after tax from continuingoperationsPorts . . . . . . . . . . . . . . . . . . $ 107,320 $ (105,643) $ 1,677 $ 133,059 $ 192,433 $ 325,492Ferries . . . . . . . . . . . . . . . . . 18,742 — 18,742 — — —Properties . . . . . . . . . . . . . . (1,518) — (1,518) — — —
Total profit after tax fromcontinuing operations . . . $ 124,544 $ (105,643) $ 18,901 $ 133,059 $ 192,433 $ 325,492
(1) See Note 3, ‘‘Separately Disclosable Items’’, of the Notes to the DPA Consolidated Financial Statements as of and for the sixmonths ended June 30, 2006 for further information.
(2) See Note 4, ‘‘Separately disclosable items’’, of the Notes to the Company Consolidated Financial Statements as of and for the sixmonths ended June 30, 2007 for further information.
Ports. Profit after tax from continuing operations for the ports segment for the six months endedJune 30, 2007 was $325.5 million as compared to $1.7 million for the six months ended June 30, 2006, anincrease of $323.8 million.
The following table presents profit information regarding the ports segment for the six months endedJune 30, 2006 and 2007.
DPA CompanySix months ended June 30, 2006 Six months ended June 30, 2007
Before Beforeseparately Separately separately Separatelydisclosable disclosable disclosable disclosable
items items(1) Total items items(2) Total
(Unaudited)(US dollars in thousands)
Profit after tax from continuingoperationsMiddle East, Europe and
Africa . . . . . . . . . . . . . . . $ 47,324 $ — $ 47,324 $ 223,862 $ — $ 223,862Asia-Pacific and Indian
Subcontinent . . . . . . . . . . . 43,740 — 43,740 77,851 58,208 136,059Australia, New Zealand and
Americas . . . . . . . . . . . . . 10,912 — 10,912 45,984 76,400 122,384
101,976 — 101,976 347,697 134,608 482,305Head office profit/(loss) . . . . . 5,344 (105,643) (100,299) (214,638) 57,825 (156,813)
Total profit after tax fromcontinuing operations . . . $ 107,320 $ (105,643) $ 1,677 $ 133,059 $ 192,433 $ 325,492
(1) See Note 3, ‘‘Separately Disclosable Items’’, of the Notes to the DPA Consolidated Financial Statements as of and for the sixmonths ended June 30, 2006 for further information.
(2) See Note 4, ‘‘Separately disclosable items’’, of the Notes to the Company Consolidated Financial Statements as of and for the sixmonths ended June 30, 2007 for further information.
Middle East, Europe and Africa. Profit after tax from continuing operations for the Middle East,Europe and Africa region for the six months ended June 30, 2007 was $223.9 million as compared to
70
www.global-reports.com
$47.3 million for the six months ended June 30, 2006, an increase of $176.6 million, or 3.7 times. Thisincrease reflected:
(i) increases in net profit in the UAE and at DP World Constanta, DP World Germersheim,Southampton Container Terminal and Maputo International Port Services, which were offset inpart by a decrease in net profit at DP World Antwerp as a result of the factors described above;and
(ii) increases in net profit at Terminal de Nord (Le Havre), Terminal de France (Le Havre), FosContainer Terminal (Fos sur Mer), Mourepiane Container Terminal (Marseille) and TilburyContainer Services and a decrease in the net loss at Antwerp Gateway as a result of the factorsdescribed above.
Asia-Pacific and Indian Subcontinent. Profit after tax from continuing operations for the Asia-Pacificand Indian Subcontinent region for the six months ended June 30, 2007 was $136.1 million as compared to$43.7 million for the six months ended June 30, 2006, an increase of $92.4 million, or 2.1 times. Thisincrease reflected:
(i) increases in net profit at CT3 (Hong Kong) and DP World Chennai and decreases in net loss atDP World Cochin, Mundra International Container Terminal, DP World Nhava Sheva andDP World Karachi as a result of the factors described above;
(ii) an increase in net profit from Asia Terminals Incorporated, although this terminal experienced areduction in net profit over the same period in 2006 due to the purchase of additional fixed assetsat the terminal, which resulted in an increase in a depreciation charge and a decrease in interestincome;
(iii) an increase in net profit from existing operations at ACT (CT8) (Hong Kong), Tianjin OrientContainer Terminals, Qingdao Qianwan Container Terminal, Terminal Petikemas Surabaya andVostochnaya Stevedore Company, as well as the logistics centres in Hong Kong and Yantian,which was offset in part by a decrease in net profit from DP World Yantai and Laem ChabangInternational Terminal as a result of the factors described above; and
(iv) a decrease in the net loss from operations that commenced in the first quarter of 2006 at PusanNewport Company as a result of the factors described above.
Profit after tax from continuing operations for the Asia-Pacific and Indian Subcontinent region for the sixmonths ended June 30, 2007 was also impacted by the inclusion of $58.2 million in separately disclosableprofit relating to the sale of the Shekou Terminals, the Colombo Terminal, Shanghai JiFa and otherinvestments in the region. Profit after tax from continuing operations for the Asia-Pacific and IndianSubcontinent region for the six months ended June 30, 2006 was also impacted by the inclusion of netprofit from operations at the Shekou Terminals and the Colombo Terminal.
Australia, New Zealand and Americas. Profit after tax from continuing operations for the Australia,New Zealand and Americas region for the six months ended June 30, 2007 was $122.4 million as comparedto $10.9 million for the six months ended June 30, 2006, an increase of $111.5 million, or 10.2 times. Thisincrease reflected:
(i) increases in net profit at DP World Adelaide, DP World Melbourne, DP World Sydney, DPWorld Fremantle and Terminales Rio de la Plata (Buenos Aires) and a decrease in the net loss atDP World Vancouver, offset by a decrease in net profit at DP World Brisbane as a result of thefactors described above; and
(ii) increases in management fees received by us from our operations at DP World Caucedo and DPWorld Puerto Cabello and a net profit at DP World Caucedo as opposed to a net loss over thesame period in the previous year, offset in part by a decrease in net profit from DP World PuertoCabello as a result of the factors described above.
Profit after tax from continuing operations for the Australia, New Zealand and Americas region for the sixmonths ended June 30, 2007 was also impacted by the inclusion of $76.4 million in separately disclosableprofit relating to the sale of portions of our landside logistics and automotive and general stevedoringbusinesses in the region.
Head office. Head office loss after tax from continuing operations for the six months ended June 30,2007 was $156.8 million as compared to $100.3 million for the six months ended June 30, 2006, an increase
71
of $56.5 million or 56.3%. This increase was principally due to the full period impact of the costs associatedwith managing a significantly broader scope of corporate operations following the P&O Acquisition,including the cost of operating the London office acquired in the P&O Acquisition.
Head office loss after tax from continuing operations for the six months ended June 30, 2007 were alsoimpacted by the inclusion of $57.8 million in separately disclosable profit, which consisted primarily of gainon the termination of two interest rate swaps, offset in part by impairment on software costs caused by thediscontinuation of the related software project. Head office loss after tax from continuing operations forthe six months ended June 30, 2006 were also impacted by the inclusion of $105.6 million in separatelydisclosable loss, which consisted primarily of (i) expenses in respect of relocation, redundancy andreorganization-related costs arising as a result of the P&O Acquisition, (ii) expenses arising from theintegration of P&O, (iii) profit on the disposal of assets prior to the end of their useful expected lives or atvalues significantly different from their previously-assessed residual value, (iv) costs relating to derivativecontracts entered into to hedge against variability in cash flows arising as a result of movements in foreignexchange rates up until the completion of the P&O Acquisition and (v) a loss on the sale and terminationof businesses.
Ferries. Profit after tax from continuing operations for the ferries segment for the six months endedJune 30, 2006 was $18.7 million.
Property. Loss after tax from continuing operations for the property segment for the six monthsended June 30, 2006 was $1.5 million.
Profit for the period
As a result of the factors described above, profit for the period for the six months ended June 30, 2007 was$973.1 million as compared to $20.3 million for the six months ended June 30, 2006, an increase of $952.8million, or 46.9 times. Profit for the period for the six months ended June 30, 2007 was also impacted bythe inclusion of $647.6 million in profit from discontinued operations and profit on sale of discontinuedoperations net of tax, as compared to $1.4 million for the six months ended June 30, 2006.
Our profit for the six months ended June 30, 2007 included amounts attributable to minority interests of$17.7 million as compared to $8.2 million for the six months ended June 30, 2006, an increase of$9.5 million or 1.2 times. This reflected (i) the full period impact of profit attributable to minority interestsassociated with consolidated operations acquired in the P&O Acquisition and (ii) increased profit fromconsolidated operations at which there is a minority shareholder.
72
www.global-reports.com
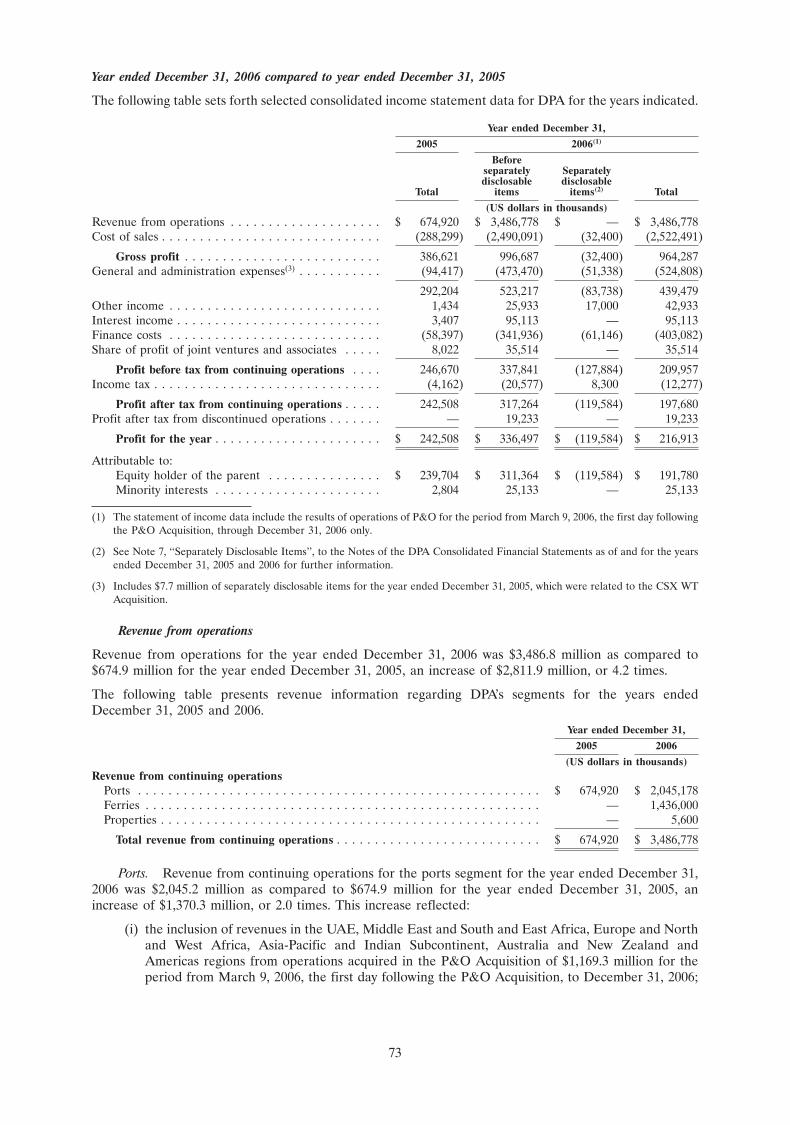
Year ended December 31, 2006 compared to year ended December 31, 2005
The following table sets forth selected consolidated income statement data for DPA for the years indicated.
Year ended December 31,
2005 2006(1)
Beforeseparately Separatelydisclosable disclosable
Total items items(2) Total
(US dollars in thousands)Revenue from operations . . . . . . . . . . . . . . . . . . . . $ 674,920 $ 3,486,778 $ — $ 3,486,778Cost of sales . . . . . . . . . . . . . . . . . . . . . . . . . . . . . (288,299) (2,490,091) (32,400) (2,522,491)
Gross profit . . . . . . . . . . . . . . . . . . . . . . . . . . 386,621 996,687 (32,400) 964,287General and administration expenses(3) . . . . . . . . . . . (94,417) (473,470) (51,338) (524,808)
292,204 523,217 (83,738) 439,479Other income . . . . . . . . . . . . . . . . . . . . . . . . . . . . 1,434 25,933 17,000 42,933Interest income . . . . . . . . . . . . . . . . . . . . . . . . . . . 3,407 95,113 — 95,113Finance costs . . . . . . . . . . . . . . . . . . . . . . . . . . . . (58,397) (341,936) (61,146) (403,082)Share of profit of joint ventures and associates . . . . . 8,022 35,514 — 35,514
Profit before tax from continuing operations . . . . 246,670 337,841 (127,884) 209,957Income tax . . . . . . . . . . . . . . . . . . . . . . . . . . . . . . (4,162) (20,577) 8,300 (12,277)
Profit after tax from continuing operations . . . . . 242,508 317,264 (119,584) 197,680Profit after tax from discontinued operations . . . . . . . — 19,233 — 19,233
Profit for the year . . . . . . . . . . . . . . . . . . . . . . $ 242,508 $ 336,497 $ (119,584) $ 216,913
Attributable to:Equity holder of the parent . . . . . . . . . . . . . . . $ 239,704 $ 311,364 $ (119,584) $ 191,780Minority interests . . . . . . . . . . . . . . . . . . . . . . 2,804 25,133 — 25,133
(1) The statement of income data include the results of operations of P&O for the period from March 9, 2006, the first day followingthe P&O Acquisition, through December 31, 2006 only.
(2) See Note 7, ‘‘Separately Disclosable Items’’, to the Notes of the DPA Consolidated Financial Statements as of and for the yearsended December 31, 2005 and 2006 for further information.
(3) Includes $7.7 million of separately disclosable items for the year ended December 31, 2005, which were related to the CSX WTAcquisition.
Revenue from operations
Revenue from operations for the year ended December 31, 2006 was $3,486.8 million as compared to$674.9 million for the year ended December 31, 2005, an increase of $2,811.9 million, or 4.2 times.
The following table presents revenue information regarding DPA’s segments for the years endedDecember 31, 2005 and 2006.
Year ended December 31,
2005 2006
(US dollars in thousands)Revenue from continuing operations
Ports . . . . . . . . . . . . . . . . . . . . . . . . . . . . . . . . . . . . . . . . . . . . . . . . . . . . . $ 674,920 $ 2,045,178Ferries . . . . . . . . . . . . . . . . . . . . . . . . . . . . . . . . . . . . . . . . . . . . . . . . . . . . — 1,436,000Properties . . . . . . . . . . . . . . . . . . . . . . . . . . . . . . . . . . . . . . . . . . . . . . . . . . — 5,600
Total revenue from continuing operations . . . . . . . . . . . . . . . . . . . . . . . . . . . $ 674,920 $ 3,486,778
Ports. Revenue from continuing operations for the ports segment for the year ended December 31,2006 was $2,045.2 million as compared to $674.9 million for the year ended December 31, 2005, anincrease of $1,370.3 million, or 2.0 times. This increase reflected:
(i) the inclusion of revenues in the UAE, Middle East and South and East Africa, Europe and Northand West Africa, Asia-Pacific and Indian Subcontinent, Australia and New Zealand andAmericas regions from operations acquired in the P&O Acquisition of $1,169.3 million for theperiod from March 9, 2006, the first day following the P&O Acquisition, to December 31, 2006;
73
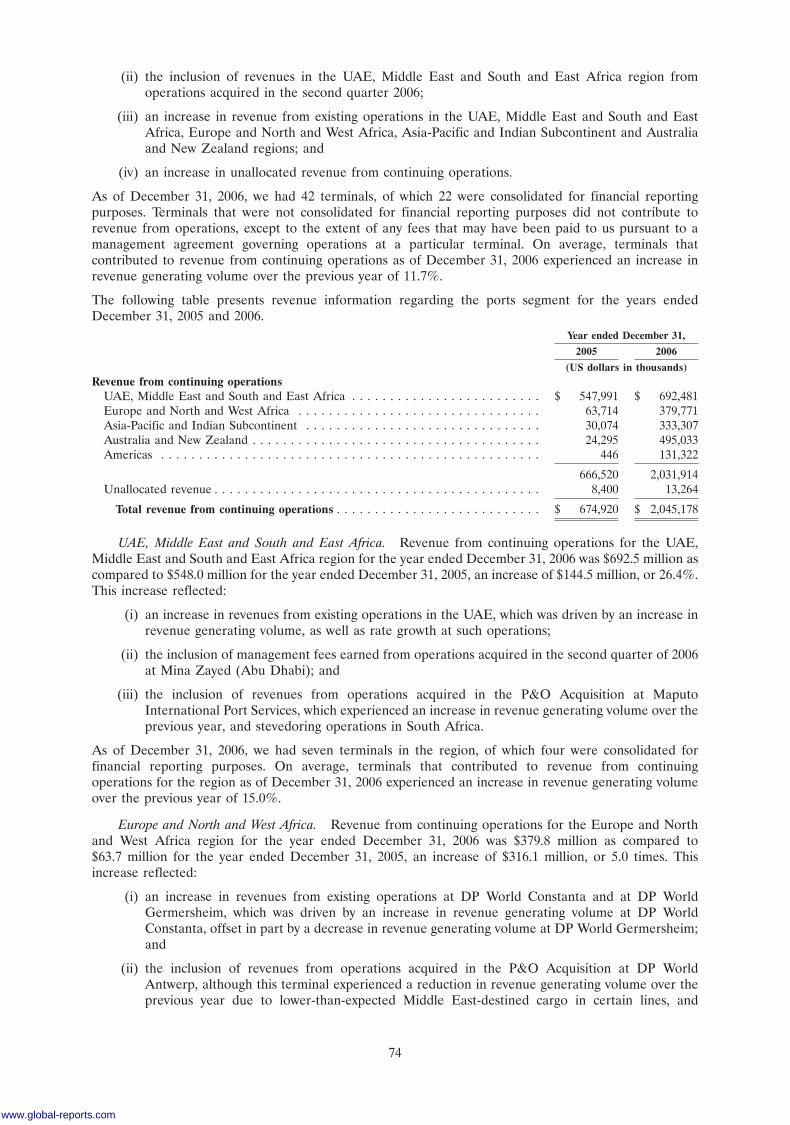
(ii) the inclusion of revenues in the UAE, Middle East and South and East Africa region fromoperations acquired in the second quarter 2006;
(iii) an increase in revenue from existing operations in the UAE, Middle East and South and EastAfrica, Europe and North and West Africa, Asia-Pacific and Indian Subcontinent and Australiaand New Zealand regions; and
(iv) an increase in unallocated revenue from continuing operations.
As of December 31, 2006, we had 42 terminals, of which 22 were consolidated for financial reportingpurposes. Terminals that were not consolidated for financial reporting purposes did not contribute torevenue from operations, except to the extent of any fees that may have been paid to us pursuant to amanagement agreement governing operations at a particular terminal. On average, terminals thatcontributed to revenue from continuing operations as of December 31, 2006 experienced an increase inrevenue generating volume over the previous year of 11.7%.
The following table presents revenue information regarding the ports segment for the years endedDecember 31, 2005 and 2006.
Year ended December 31,
2005 2006
(US dollars in thousands)Revenue from continuing operations
UAE, Middle East and South and East Africa . . . . . . . . . . . . . . . . . . . . . . . . . $ 547,991 $ 692,481Europe and North and West Africa . . . . . . . . . . . . . . . . . . . . . . . . . . . . . . . . 63,714 379,771Asia-Pacific and Indian Subcontinent . . . . . . . . . . . . . . . . . . . . . . . . . . . . . . . 30,074 333,307Australia and New Zealand . . . . . . . . . . . . . . . . . . . . . . . . . . . . . . . . . . . . . . 24,295 495,033Americas . . . . . . . . . . . . . . . . . . . . . . . . . . . . . . . . . . . . . . . . . . . . . . . . . . 446 131,322
666,520 2,031,914Unallocated revenue . . . . . . . . . . . . . . . . . . . . . . . . . . . . . . . . . . . . . . . . . . . 8,400 13,264
Total revenue from continuing operations . . . . . . . . . . . . . . . . . . . . . . . . . . . $ 674,920 $ 2,045,178
UAE, Middle East and South and East Africa. Revenue from continuing operations for the UAE,Middle East and South and East Africa region for the year ended December 31, 2006 was $692.5 million ascompared to $548.0 million for the year ended December 31, 2005, an increase of $144.5 million, or 26.4%.This increase reflected:
(i) an increase in revenues from existing operations in the UAE, which was driven by an increase inrevenue generating volume, as well as rate growth at such operations;
(ii) the inclusion of management fees earned from operations acquired in the second quarter of 2006at Mina Zayed (Abu Dhabi); and
(iii) the inclusion of revenues from operations acquired in the P&O Acquisition at MaputoInternational Port Services, which experienced an increase in revenue generating volume over theprevious year, and stevedoring operations in South Africa.
As of December 31, 2006, we had seven terminals in the region, of which four were consolidated forfinancial reporting purposes. On average, terminals that contributed to revenue from continuingoperations for the region as of December 31, 2006 experienced an increase in revenue generating volumeover the previous year of 15.0%.
Europe and North and West Africa. Revenue from continuing operations for the Europe and Northand West Africa region for the year ended December 31, 2006 was $379.8 million as compared to$63.7 million for the year ended December 31, 2005, an increase of $316.1 million, or 5.0 times. Thisincrease reflected:
(i) an increase in revenues from existing operations at DP World Constanta and at DP WorldGermersheim, which was driven by an increase in revenue generating volume at DP WorldConstanta, offset in part by a decrease in revenue generating volume at DP World Germersheim;and
(ii) the inclusion of revenues from operations acquired in the P&O Acquisition at DP WorldAntwerp, although this terminal experienced a reduction in revenue generating volume over theprevious year due to lower-than-expected Middle East-destined cargo in certain lines, and
74
www.global-reports.com
Southampton Container Terminal, which experienced an increase in revenue generating volumeover the previous year.
As of December 31, 2006, we had ten terminals in the region, of which four were consolidated for financialreporting purposes. On average, terminals that contributed to revenue from continuing operations for theregion as of December 31, 2006 experienced an increase in revenue generating volume over the previousyear of 4.2%.
Asia-Pacific and Indian Subcontinent. Revenue from continuing operations for the Asia-Pacific andIndian Subcontinent region for the year ended December 31, 2006 was $333.3 million as compared to$30.1 million for the year ended December 31, 2005, an increase of $303.2 million, or 10.1 times. Thisincrease reflected:
(i) an increase in revenues from existing operations at CT3 (Hong Kong) and DP World Cochin,which reflected increases in revenue generating volume at such operations; and
(ii) the inclusion of revenues from operations acquired in the P&O Acquisition at Asia TerminalsIncorporated, DP World Chennai, Mundra International Container Terminal, DP World NhavaSheva and DP World Karachi, all of which experienced increases in revenue generating volumeover the previous year.
As of December 31, 2006, we had 16 terminals in the region, of which seven were consolidated for financialreporting purposes. On average, terminals that contributed to revenue from continuing operations for theregion as of December 31, 2006 experienced an increase in revenue generating volume over the previousyear of 20.8%.
Australia and New Zealand. Revenue from continuing operations for the Australia and New Zealandregion for the year ended December 31, 2006 was $495.0 million as compared to $24.3 million for the yearended December 31, 2005, an increase of $470.7 million, or 19.4 times. This increase reflected:
(i) an increase in revenues from existing operations at DP World Adelaide, which was driven by anincrease in revenue generating volume; and
(ii) the inclusion of revenues from operations acquired in the P&O Acquisition at DP WorldMelbourne, DP World Sydney, DP World Brisbane and DP World Fremantle, all of whichexperienced increases in revenue generating volume over the previous year, as well as from P&OMaritime Services.
As of December 31, 2006, we had five terminals in the region, all of which were consolidated for financialreporting purposes. On average, terminals that contributed to revenue from continuing operations for theregion as of December 31, 2006 experienced an increase in revenue generating volume over the previousyear of 9.7%.
Americas. Revenue from continuing operations for the Americas region for the year endedDecember 31, 2006 was $131.3 million as compared to $0.4 million for the year ended December 31, 2005,an increase of $130.9 million. This increase reflected:
(i) an increase in management fees received by us from our existing operations at DP WorldCaucedo and DP World Puerto Cabello; and
(ii) the inclusion of revenues from operations acquired in the P&O Acquisition at DP WorldVancouver, although this terminal experienced a reduction in revenue generating volume overthe previous year, and Terminales Rio de la Plata (Buenos Aires), which experienced an increasein revenue generating volume over the previous year.
As of December 31, 2006, we had four terminals in the region, of which two were consolidated for financialreporting purposes. On average, terminals that contributed to revenue from continuing operations for theregion as of December 31, 2006 experienced an increase in revenue generating volume over the previousyear of 2.5%.
Unallocated revenue. Unallocated revenue from continuing operations for the ports segment for theyear ended December 31, 2006 was $13.3 million as compared to $8.4 million for the year endedDecember 31, 2005, an increase of $4.9 million, or 58.3%. This increase was principally due to an increasein management fees earned by the corporate head office from our existing operation at Port Autonome
75
International de Djibouti pursuant to the terms of the applicable management agreement, which wasattributable to an increase in revenue generating volume at the terminal.
Ferries. Revenue from continuing operations for the ferries segment for the year endedDecember 31, 2006 was $1,436.0 million.
Property. Revenue from continuing operations for the property segment for the year endedDecember 31, 2006 was $5.6 million.
Cost of sales
Cost of sales for the year ended December 31, 2006 were $2,522.5 million as compared to $288.3 millionfor the year ended December 31, 2005, an increase of $2,234.2 million, or 7.7 times. This increase in cost ofsales was principally due to (i) the inclusion of cost of sales relating to terminal operations acquired in theP&O Acquisition of $2,158.1 million and (ii) an increase in cost of sales at our existing operations in theUAE, Middle East and South and East Africa, Europe and North and West Africa, Asia-Pacific and IndianSubcontinent and Australia and New Zealand regions of $76.1 million.
Cost of sales for the year ended December 31, 2006 were also impacted by (i) the inclusion of cost of salesrelating to the P&O Ferries Business and P&O Estates of $1,388.9 million and (ii) the inclusion of $32.4million in cost of sales associated with separately disclosable items, which consisted primarily of expensesarising from the integration of P&O, including as a result of the closure of an IT centre in Australia, whichresulted in redundancy charges, short-term retention fees and writing off certain systems that were nolonger being used.
General and administration expenses
General and administration expenses for the year ended December 31, 2006 were $524.8 million ascompared to $94.4 million for the year ended December 31, 2005, an increase of $430.4 million, or 4.6times. This increase in general and administration expenses was principally due to (i) the inclusion ofgeneral and administration expenses relating to terminal operations acquired in the P&O Acquisition of$221.7 million, (ii) $57.5 million in additional expenses relating to the integration of P&O, (iii) an increasein general and administration expenses at our existing operations in the UAE, Middle East and South andEast Africa, Europe and North and West Africa, Asia-Pacific and Indian Subcontinent and Australia andNew Zealand regions of $77.4 million and (iv) the inclusion of general and administration expensesrelating to operations acquired in the second quarter of 2006 at Mina Zayed (Abu Dhabi).
General and administration expenses for the year ended December 31, 2006 were also impacted by (i) theinclusion of general and administration expenses relating to the P&O Ferries Business and P&O Estates of$152.5 million and (ii) the inclusion of $51.3 million in general and administration expenses associated withseparately disclosable items, which consisted primarily of expenses arising from the integration of P&O,including expenses that P&O incurred in anticipation of the P&O Acquisition, such as legal and otherprofessional fees and one-time bonus payments, and post acquisition integration-related costs, such astravel and professional fees, as well as short-term duplication of certain head office positions. General andadministration expenses for the year ended December 31, 2005 were impacted by the inclusion of$7.7 million in costs associated with separately disclosable items, which consisted of a one-time expenserelated to terminals acquired in the CSX WT Acquisition that could not be capitalised.
Other income
Other income for the year ended December 31, 2006 was $42.9 million as compared to $1.4 million for theyear ended December 31, 2005, an increase of $41.5 million, or 29.6 times. This increase in other incomewas principally due to an increase in hedge income.
Other income for the year ended December 31, 2006 was also impacted by (i) the inclusion of otherincome relating to the P&O Ferries Business and P&O Estates of $2.9 million and (ii) the inclusion of aseparately disclosable loss of $17.0 million, which consisted primarily of gains in respect of the terminationof an interest rate swap previously designated as a cash flow hedge and the disposal of property, plant andequipment.
76
www.global-reports.com
Interest income
Interest income for the year ended December 31, 2006 was $95.1 million as compared to $3.4 million forthe year ended December 31, 2005, an increase of $91.7 million, or 27.0 times. This increase in interestincome was principally due to interest earned on bank deposits.
Finance costs
Finance costs for the year ended December 31, 2006 were $403.1 million as compared to $58.4 million forthe year ended December 31, 2005, an increase of $344.7 million, or 5.9 times. This increase in financecosts was principally due to the $6,800.0 million term loan facility used to fund the P&O Acquisition.
Finance costs for the year ended December 31, 2006 were also impacted by (i) the inclusion of financecosts relating to the P&O Ferries Business and P&O Estates of $9.7 million and (ii) the inclusion of $61.1million in finance costs associated with separately disclosable items, which consisted primarily of costsrelating to derivative contracts entered into to hedge against variability in cash flows arising as a result ofmovements in foreign exchange rates up until the completion of the P&O Acquisition.
Share of profit (loss) of joint ventures and associates
Share of profit (loss) of joint ventures and associates for the year ended December 31, 2006 was$35.5 million as compared to $8.0 million for the year ended December 31, 2005, an increase of $27.5million, or 3.4 times. This increase in share of profit (loss) of joint ventures and associates was principallydue to:
(i) an increase in net profit from existing operations at ACT (CT8) (Hong Kong), DP World Yantaiand Tianjin Orient Container Terminals, which was driven by increases in revenue generatingvolume at such operations, as well as increases in net profit from the logistics centres in HongKong and Yantian, offset in part by a decrease in net profit from the logistics centre in Shanghai;
(ii) a decrease in the net loss and an increase in net profit from existing operations at DP WorldCaucedo and DP World Puerto Cabello, respectively, which reflected higher revenues at bothterminals despite a reduction in revenue generating volume at DP World Puerto Cabello;
(iii) the inclusion of net profit from operations at Terminal de Nord (Le Havre), Terminal de France(Le Havre), Fos Container Terminal (Fos sur Mer), Mourepiane Container Terminal (Marseille)and Tilbury Container Services, all of which experienced increases in revenue generating volume,offset in part by the inclusion of a net loss at Antwerp Gateway despite an increase in revenuegenerating volume at the terminal;
(iv) the inclusion of net profit from operations at Laem Chabang International Terminal, QingdaoQianwan Container Terminal, the Shekou Terminals, Terminal Petikemas Surabaya, VostochnayaStevedore Company and the Colombo Terminal, which was driven by a net increase in revenuegenerating volume at the terminals; and
(v) a net loss at our new operation at Pusan Newport Company, which commenced operations in thefirst quarter of 2006.
In addition, Visakha Container Terminal had a net loss in 2006 that did not impact share of profit (loss) ofjoint ventures and associates for the period under review because the carrying value of our investment inVisakha Container Terminal had been reduced to zero as of December 31, 2005. On average, the terminalsthat contributed to share of profit (loss) of joint ventures and associates as of December 31, 2006experienced an increase in revenue generating volume over the previous year of 17.5%.
Income tax
Income tax for the year ended December 31, 2006 was $12.3 million as compared to $4.2 million for theyear ended December 31, 2005, an increase of $8.1 million, or 1.9 times. This increase in income tax wasprincipally due to taxes related to our increased income attributable to the P&O Acquisition.
Profit for the year
As a result of the factors described above, profit for the year for the year ended December 31, 2006 was$216.9 million as compared to $242.5 million for the year ended December 31, 2005, a decrease of$25.6 million, or 10.6%.
77
Our profit for the year ended December 31, 2006 included amounts attributable to minority interestsof $25.1 million as compared to $2.8 million for the year ended December 31, 2005, an increase of$22.3 million. This reflected our acquisition of additional consolidated operations at which there is aminority shareholder in the P&O Acquisition.
The following table presents profit information regarding DPA’s segments for the years endedDecember 31, 2005 and 2006.
Year ended December 31,
2005 2006
Beforeseparately Separatelydisclosable disclosable
Total items items(1) Total
(US dollars in thousands)Net profit for the year
Ports . . . . . . . . . . . . . . . . . . . . . . . . . . . . . . . . $ 242,508 $ 252,197 $ (119,584) $ 132,613Ferries . . . . . . . . . . . . . . . . . . . . . . . . . . . . . . . — 98,900 — 98,900Properties . . . . . . . . . . . . . . . . . . . . . . . . . . . . . — (14,600) — (14,600)
Total profit for the year . . . . . . . . . . . . . . . . . . $ 242,508 $ 336,497 $ (119,584) $ 216,913
(1) See Note 7, ‘‘Separately Disclosable Items’’, of the Notes to the DPA Consolidated Financial Statements as of and for the yearsended December 31, 2005 and 2006 for further information.
Ports. Profit for the ports segment for the year ended December 31, 2006 was $132.6 million ascompared to $242.5 million for the year ended December 31, 2005, a decrease of $109.9 million, or 45.3%.
The following table presents profit information regarding the ports segment for the years endedDecember 31, 2005 and 2006.
Year ended December 31,
2005 2006
Beforeseparately Separatelydisclosable disclosable
Total items items(1) Total
(US dollars in thousands)Net profit for the year
UAE, Middle East and South and East Africa . . . . $ 325,366 $ 414,722 $ — $ 414,722Europe and North and West Africa . . . . . . . . . . . . 2,017 9,317 — 9,317Asia-Pacific and Indian Subcontinent . . . . . . . . . . . (25,639) 131,791 — 131,791Australia and New Zealand . . . . . . . . . . . . . . . . . 1,281 61,007 — 61,007Americas . . . . . . . . . . . . . . . . . . . . . . . . . . . . . (5,326) 54,378 — 54,378
297,699 671,215 — 671,215Unallocated loss . . . . . . . . . . . . . . . . . . . . . . . . . (55,191) (419,018) (119,584) (538,602)
Total profit . . . . . . . . . . . . . . . . . . . . . . . . . . $ 242,508 $ 252,197 $ (119,584) $ 132,613
(1) See Note 7, ‘‘Separately Disclosable Items’’, of the Notes to the DPA Consolidated Financial Statements as of and for the yearsended December 31, 2005 and 2006 for further information.
UAE, Middle East and South and East Africa. As a result of the factors described above, the UAE,Middle East and South and East Africa region had a profit of $414.7 million for the year endedDecember 31, 2006 as compared to $325.4 million for the year ended December 31, 2005, an increase of$89.3 million, or 27.4%.
Europe and North and West Africa. Profit for the Europe and North and West Africa region for theyear ended December 31, 2006 was $9.3 million as compared to $2.0 million for the year endedDecember 31, 2005, an increase of $7.3 million, or 3.7 times. This increase reflected:
(i) an increase in net profit at DP World Constanta, which was offset in part by a decrease in netprofit at DP World Germersheim as a result of the factors described above;
(ii) a net profit at DP World Antwerp where favourable rate realisation and efficiency improvementsoffset a reduction in revenue generating volume over the previous year; and
78
www.global-reports.com
(iii) net profits at Southampton Container Terminal, Terminal de Nord (Le Havre), Terminal deFrance (Le Havre), Fos Container Terminal (Fos sur Mer), Mourepiane Container Terminal(Marseille) and Tilbury Container Services as a result of the factors described above, offset inpart by the net loss at Antwerp Gateway.
Asia-Pacific and Indian Subcontinent. Profit for the Asia-Pacific and Indian Subcontinent region forthe year ended December 31, 2006 was $131.8 million as compared to a loss of $25.6 million for the yearended December 31, 2005, an increase of $157.4 million. This increase reflected:
(i) an increase in net profit at CT3 (Hong Kong) as a result of the factors described above, which wasoffset in part by an increase in net loss at DP World Cochin caused by an increase in cost of salesdespite increased revenue generating volume at the terminal;
(ii) an average increase in net profit from existing operations at ACT (CT8) (Hong Kong), DP WorldYantai and Tianjin Orient Container Terminals, as a result of the factors described above, as well asincreases in net profit from the logistics centres in Hong Kong and Yantian, offset in part by adecrease in net profit from the logistics centres in Shanghai;
(iii) the net profits at Asia Terminals Incorporated, DP World Chennai, DP World Nhava Sheva andDP World Karachi, which were offset in part by a net loss at Mundra International ContainerTerminal as a result of high finance costs despite increased revenue generating volume at theterminal;
(iv) the inclusion of net profit from operations at Laem Chabang International Terminal, QingdaoQianwan Container Terminal, the Shekou Terminals, Terminal Petikemas Surabaya, VostochnayaStevedore Company and the Colombo Terminal; and
(v) the net loss at our new operation at Pusan Newport Company, which commenced operations in thefirst quarter of 2006.
Australia and New Zealand. Profit for the Australia and New Zealand region for the year endedDecember 31, 2006 was $61.0 million as compared to $1.3 million for the year ended December 31, 2005,an increase of $59.7 million, or 45.9 times. This increase reflected:
(i) an increase in net profit at DP World Adelaide as a result of the factors described above; and
(ii) an aggregate net profit at DP World Melbourne, DP World Sydney, DP World Brisbane andDP World Fremantle as a result of the factors described above.
Americas. Profit for the Americas region for the year ended December 31, 2006 was $54.4 million ascompared to a loss of $5.3 million for the year ended December 31, 2005, an increase of $59.7 million. Thisincrease reflected:
(i) an increase in management fees received by us from our operations at DP World Caucedo andDP World Puerto Cabello and an increase in net profit from DP World Puerto Cabello, offset inpart by the net loss at DP World Caucedo; and
(ii) the net profits at Terminales Rio de la Plata (Buenos Aires), offset in part by a net loss at DP WorldVancouver as a result of the factors described above.
Unallocated loss. Unallocated loss for the ports segment for the year ended December 31, 2006 was$538.6 million as compared to a loss of $55.2 million for the year ended December 31, 2005, an increase of$483.4 million or 8.8 times. This increase was principally due to (i) finance costs associated with the$6,800.0 million term loan facility used to the fund the acquisition of P&O and (ii) offset by an increase inmanagement fees earned by the corporate head office from Port Autonome International de Djibouti.
Ferries. Profit for the ferries segment for the year ended December 31, 2006 was $98.9 million.
Property. The property segment had a loss of $14.6 million for the year ended December 31, 2006.
79
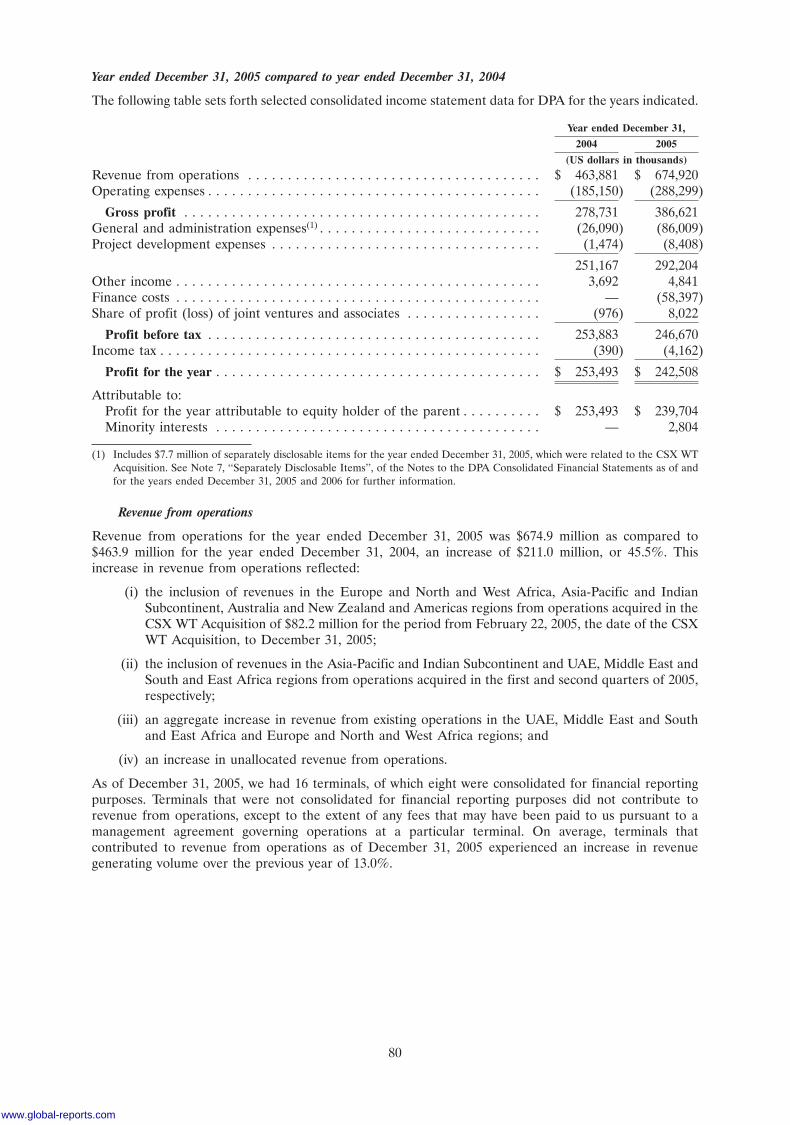
Year ended December 31, 2005 compared to year ended December 31, 2004
The following table sets forth selected consolidated income statement data for DPA for the years indicated.
Year ended December 31,
2004 2005
(US dollars in thousands)
Revenue from operations . . . . . . . . . . . . . . . . . . . . . . . . . . . . . . . . . . . . . $ 463,881 $ 674,920Operating expenses . . . . . . . . . . . . . . . . . . . . . . . . . . . . . . . . . . . . . . . . . . (185,150) (288,299)
Gross profit . . . . . . . . . . . . . . . . . . . . . . . . . . . . . . . . . . . . . . . . . . . . . 278,731 386,621General and administration expenses(1) . . . . . . . . . . . . . . . . . . . . . . . . . . . . (26,090) (86,009)Project development expenses . . . . . . . . . . . . . . . . . . . . . . . . . . . . . . . . . . (1,474) (8,408)
251,167 292,204Other income . . . . . . . . . . . . . . . . . . . . . . . . . . . . . . . . . . . . . . . . . . . . . . 3,692 4,841Finance costs . . . . . . . . . . . . . . . . . . . . . . . . . . . . . . . . . . . . . . . . . . . . . . — (58,397)Share of profit (loss) of joint ventures and associates . . . . . . . . . . . . . . . . . (976) 8,022
Profit before tax . . . . . . . . . . . . . . . . . . . . . . . . . . . . . . . . . . . . . . . . . . 253,883 246,670Income tax . . . . . . . . . . . . . . . . . . . . . . . . . . . . . . . . . . . . . . . . . . . . . . . . (390) (4,162)
Profit for the year . . . . . . . . . . . . . . . . . . . . . . . . . . . . . . . . . . . . . . . . . $ 253,493 $ 242,508
Attributable to:Profit for the year attributable to equity holder of the parent . . . . . . . . . . $ 253,493 $ 239,704Minority interests . . . . . . . . . . . . . . . . . . . . . . . . . . . . . . . . . . . . . . . . . — 2,804
(1) Includes $7.7 million of separately disclosable items for the year ended December 31, 2005, which were related to the CSX WTAcquisition. See Note 7, ‘‘Separately Disclosable Items’’, of the Notes to the DPA Consolidated Financial Statements as of andfor the years ended December 31, 2005 and 2006 for further information.
Revenue from operations
Revenue from operations for the year ended December 31, 2005 was $674.9 million as compared to$463.9 million for the year ended December 31, 2004, an increase of $211.0 million, or 45.5%. Thisincrease in revenue from operations reflected:
(i) the inclusion of revenues in the Europe and North and West Africa, Asia-Pacific and IndianSubcontinent, Australia and New Zealand and Americas regions from operations acquired in theCSX WT Acquisition of $82.2 million for the period from February 22, 2005, the date of the CSXWT Acquisition, to December 31, 2005;
(ii) the inclusion of revenues in the Asia-Pacific and Indian Subcontinent and UAE, Middle East andSouth and East Africa regions from operations acquired in the first and second quarters of 2005,respectively;
(iii) an aggregate increase in revenue from existing operations in the UAE, Middle East and Southand East Africa and Europe and North and West Africa regions; and
(iv) an increase in unallocated revenue from operations.
As of December 31, 2005, we had 16 terminals, of which eight were consolidated for financial reportingpurposes. Terminals that were not consolidated for financial reporting purposes did not contribute torevenue from operations, except to the extent of any fees that may have been paid to us pursuant to amanagement agreement governing operations at a particular terminal. On average, terminals thatcontributed to revenue from operations as of December 31, 2005 experienced an increase in revenuegenerating volume over the previous year of 13.0%.
80
www.global-reports.com
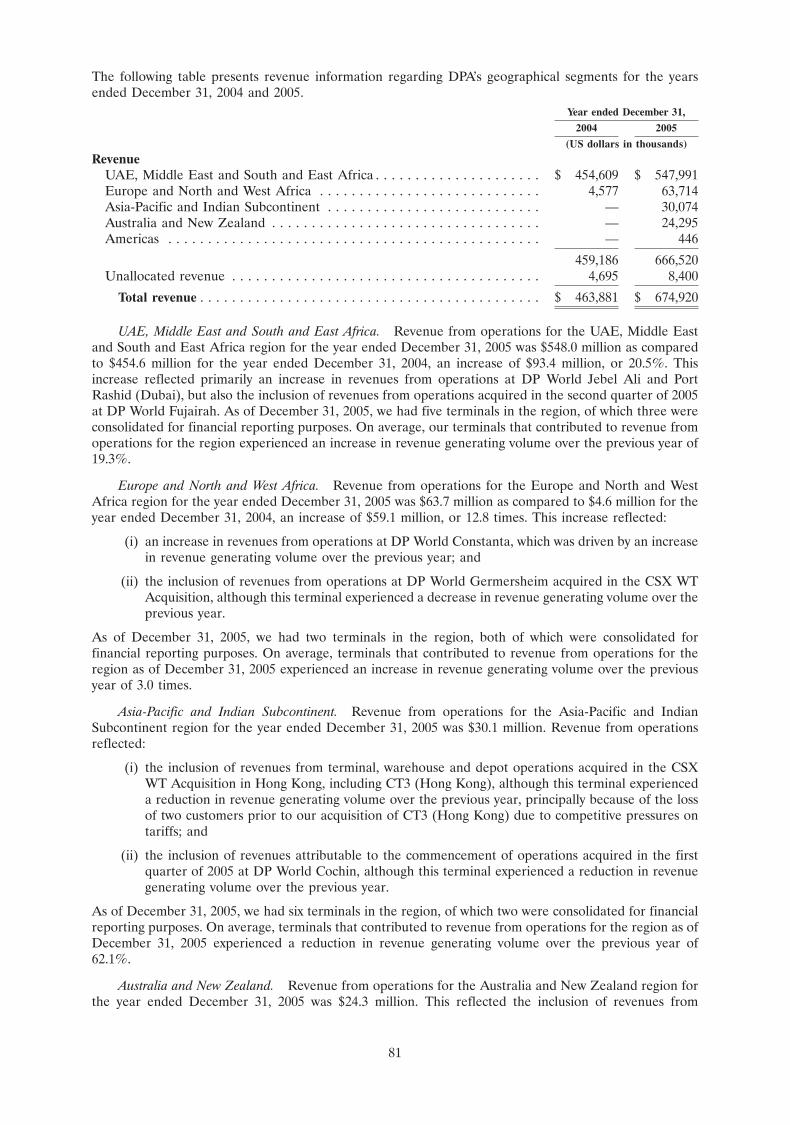
The following table presents revenue information regarding DPA’s geographical segments for the yearsended December 31, 2004 and 2005.
Year ended December 31,
2004 2005
(US dollars in thousands)
RevenueUAE, Middle East and South and East Africa . . . . . . . . . . . . . . . . . . . . . $ 454,609 $ 547,991Europe and North and West Africa . . . . . . . . . . . . . . . . . . . . . . . . . . . . 4,577 63,714Asia-Pacific and Indian Subcontinent . . . . . . . . . . . . . . . . . . . . . . . . . . . — 30,074Australia and New Zealand . . . . . . . . . . . . . . . . . . . . . . . . . . . . . . . . . . — 24,295Americas . . . . . . . . . . . . . . . . . . . . . . . . . . . . . . . . . . . . . . . . . . . . . . . — 446
459,186 666,520Unallocated revenue . . . . . . . . . . . . . . . . . . . . . . . . . . . . . . . . . . . . . . . 4,695 8,400
Total revenue . . . . . . . . . . . . . . . . . . . . . . . . . . . . . . . . . . . . . . . . . . . $ 463,881 $ 674,920
UAE, Middle East and South and East Africa. Revenue from operations for the UAE, Middle Eastand South and East Africa region for the year ended December 31, 2005 was $548.0 million as comparedto $454.6 million for the year ended December 31, 2004, an increase of $93.4 million, or 20.5%. Thisincrease reflected primarily an increase in revenues from operations at DP World Jebel Ali and PortRashid (Dubai), but also the inclusion of revenues from operations acquired in the second quarter of 2005at DP World Fujairah. As of December 31, 2005, we had five terminals in the region, of which three wereconsolidated for financial reporting purposes. On average, our terminals that contributed to revenue fromoperations for the region experienced an increase in revenue generating volume over the previous year of19.3%.
Europe and North and West Africa. Revenue from operations for the Europe and North and WestAfrica region for the year ended December 31, 2005 was $63.7 million as compared to $4.6 million for theyear ended December 31, 2004, an increase of $59.1 million, or 12.8 times. This increase reflected:
(i) an increase in revenues from operations at DP World Constanta, which was driven by an increasein revenue generating volume over the previous year; and
(ii) the inclusion of revenues from operations at DP World Germersheim acquired in the CSX WTAcquisition, although this terminal experienced a decrease in revenue generating volume over theprevious year.
As of December 31, 2005, we had two terminals in the region, both of which were consolidated forfinancial reporting purposes. On average, terminals that contributed to revenue from operations for theregion as of December 31, 2005 experienced an increase in revenue generating volume over the previousyear of 3.0 times.
Asia-Pacific and Indian Subcontinent. Revenue from operations for the Asia-Pacific and IndianSubcontinent region for the year ended December 31, 2005 was $30.1 million. Revenue from operationsreflected:
(i) the inclusion of revenues from terminal, warehouse and depot operations acquired in the CSXWT Acquisition in Hong Kong, including CT3 (Hong Kong), although this terminal experienceda reduction in revenue generating volume over the previous year, principally because of the lossof two customers prior to our acquisition of CT3 (Hong Kong) due to competitive pressures ontariffs; and
(ii) the inclusion of revenues attributable to the commencement of operations acquired in the firstquarter of 2005 at DP World Cochin, although this terminal experienced a reduction in revenuegenerating volume over the previous year.
As of December 31, 2005, we had six terminals in the region, of which two were consolidated for financialreporting purposes. On average, terminals that contributed to revenue from operations for the region as ofDecember 31, 2005 experienced a reduction in revenue generating volume over the previous year of62.1%.
Australia and New Zealand. Revenue from operations for the Australia and New Zealand region forthe year ended December 31, 2005 was $24.3 million. This reflected the inclusion of revenues from
81
operations at DP World Adelaide that we acquired in the CSX WT Acquisition, which experienced anincrease in revenue generating volume over the previous year and an increase in tariff rates over theprevious year. As of December 31, 2005, DP World Adelaide was our only terminal in the region.
Americas. Revenue from operations for the Americas region for the year ended December 31, 2005was $0.4 million. This reflected the inclusion of management fees received by us from our operations atDP World Caucedo and DP World Puerto Cabello, which were acquired in the CSX WT Acquisition.These terminals were not consolidated and, apart from management fees, did not contribute to revenuefrom operations for the period under review. As of December 31, 2005, DP World Caucedo and DP WorldPuerto Cabello were our only terminals in the region.
Unallocated revenue. Unallocated revenue from operations for the year ended December 31, 2005was $8.4 million as compared to $4.7 million for the year ended December 31, 2004, an increase of$3.7 million, or 78.7%. This increase was principally due to an increase in management fees earned by thecorporate head office from our existing operation at Port Autonome International de Djibouti pursuant tothe terms of the applicable management agreement, which was attributable to an increase in revenuegenerating volume over the previous year at the terminal.
Operating expenses
Operating expenses for the year ended December 31, 2005 were $288.3 million as compared to$185.2 million for the year ended December 31, 2004, an increase of $103.1 million, or 55.7%. This increasein operating expenses was principally due to (i) the inclusion of operating expenses relating to operationsacquired in the CSX WT Acquisition of $61.2 million, (ii) an increase in operating expenses at our operationsin the UAE, Middle East and South and East Africa region of $27.3 million, (iii) an increase in operatingexpenses at DP World Constanta of $3.6 million and (iv) the inclusion of operating expenses relating tooperations at DP World Cochin of $2.4 million. In addition, increases in salaries and business travel expensescaused by a substantial increase in personnel and a more geographically diverse portfolio following the CSXWT Acquisition contributed to an additional $8.2 million increase in operating expenses.
General and administration expenses
General and administration expenses for the year ended December 31, 2005 were $86.0 million ascompared to $26.1 million for the year ended December 31, 2004, an increase of $59.9 million, or 2.3 times.This increase in general and administration expenses was principally due to (i) the inclusion of general andadministration expenses relating to operations acquired in the CSX WT Acquisition of $45.2 million,(ii) the inclusion of general and administration expenses relating to operations at DP World Cochin of$8.7 million, (iii) an increase in general and administration expenses at DP World Constanta of$4.8 million and (iv) an increase in general and administration expenses at operations in the UAE, MiddleEast and South and East Africa region of $1.1 million. In addition, legal, consultancy and other expensesassociated with a business restructuring that we conducted following the CSX WT Acquisition contributedto an additional $5.9 million increase in general and administration expenses associated with separatelydisclosable items related to the CSX WT Acquisition.
General and administration expenses for the year ended December 31, 2005 were also impacted by theinclusion of $7.7 million in costs associated with separately disclosable items, which consisted of a one-timeexpense related to terminals acquired in the CSX WT Acquisition that could not be capitalised.
Project development expenses
Project development expenses for the year ended December 31, 2005 were $8.4 million as compared to$1.5 million for the year ended December 31, 2004, an increase of $6.9 million, or 4.6 times. This increasein project development expenses was principally due to the incurrence of legal and consultancy fees of$6.9 million related to the CSX WT Acquisition. Project development expenses for the year endedDecember 31, 2004 include expenses incurred in connection with unsuccessful projects and certainone-time consultancy expenses.
Other income
Other income for the year ended December 31, 2005 was $4.8 million as compared to $3.7 million for theyear ended December 31, 2004, an increase of $1.1 million, or 29.7%. This increase in other income wasprincipally due to (i) an increase in interest income of $2.3 million, which reflected $1.2 million of interest
82
www.global-reports.com
income from operations acquired in the CSX WT Acquisition, and (ii) an increase in miscellaneous incomeof $0.6 million. Other income for the year ended December 31, 2004 included a gain of $1.3 million fromthe disposal of available-for-sale investments and a gain of $0.5 million from the sale of property, plant andequipment.
Finance costs
Finance costs for the year ended December 31, 2005 were $58.4 million, representing interest paid onamounts drawn under the $1,650.0 million term loan facility used to fund the acquisition of Asia ContainerTerminals Holdings Limited and the CSX WT Acquisition.
Share of profit (loss) of joint ventures and associates
Share of profit (loss) of joint ventures and associates for the year ended December 31, 2005 was$8.0 million as compared to a loss of $1.0 million for the year ended December 31, 2004, an increase of$9.0 million. This increase in share of profit (loss) of joint ventures and associates reflected:
(i) the inclusion of the net profit from operations at ACT (CT8) (Hong Kong), DP World Yantai andTianjin Orient Container Terminals, which experienced an increase in revenue generating volumeover the previous year, and the logistics centres in Hong Kong, Yantian and Shanghai, but whichwere offset in part by a reduction in the amount of coal handled at the terminal in Tianjin, China;
(ii) the inclusion of the net losses of operations at DP World Caucedo and DP World Puerto Cabello,which reflected an increase in revenue generating volume over the previous year and increases intariff rates over the previous year at such terminals, but which were offset in full by high financecosts incurred by the terminal in DP World Caucedo as a result of financing incurred inconnection with the development of the terminal; and
(iii) a loss at Visakha Container Terminal, which reduced the carrying value of our investment inVisakha Container Terminal to zero as of December 31, 2005.
On average, the terminals that contributed to share of profit (loss) of joint ventures and associates as ofDecember 31, 2005 experienced an increase in revenue generating volume over the previous year of 27.0%.
Income tax
Income tax for the year ended December 31, 2005 was $4.2 million as compared to $0.4 million for the yearended December 31, 2004, an increase of $3.8 million. This increase in income tax was principally due tothe inclusion of income tax liabilities associated with operations acquired in the CSX WT Acquisition,mostly relating to US deferred income tax on unrepatriated foreign earnings of subsidiaries of $3.4 million,and an increase in withholding tax of $0.3 million associated with an increase in management fees paid tothe corporate head office by our existing operation at our terminal in Djibouti.
Profit for the year
As a result of the factors described above, profit for the year for the year ended December 31, 2005 was$242.5 million as compared to $253.5 million for the year ended December 31, 2004, a decrease of$11.0 million, or 4.3%.
Our profit for the year ended December 31, 2005 included amounts attributable to minority interests of$2.8 million related to our acquisition of consolidated operations at which there is a minority shareholderin the CSX WT Acquisition. There was no profit attributable to minority interests for the year endedDecember 31, 2004.
83
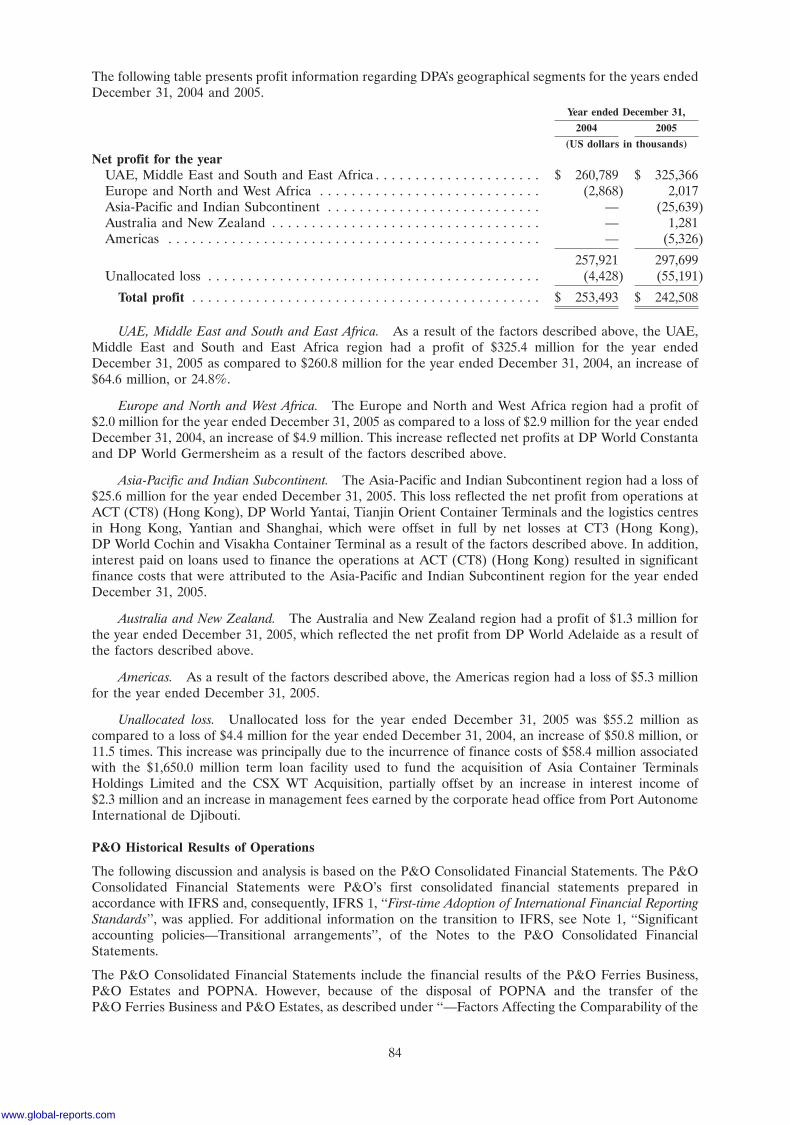
The following table presents profit information regarding DPA’s geographical segments for the years endedDecember 31, 2004 and 2005.
Year ended December 31,
2004 2005
(US dollars in thousands)
Net profit for the yearUAE, Middle East and South and East Africa . . . . . . . . . . . . . . . . . . . . . $ 260,789 $ 325,366Europe and North and West Africa . . . . . . . . . . . . . . . . . . . . . . . . . . . . (2,868) 2,017Asia-Pacific and Indian Subcontinent . . . . . . . . . . . . . . . . . . . . . . . . . . . — (25,639)Australia and New Zealand . . . . . . . . . . . . . . . . . . . . . . . . . . . . . . . . . . — 1,281Americas . . . . . . . . . . . . . . . . . . . . . . . . . . . . . . . . . . . . . . . . . . . . . . . — (5,326)
257,921 297,699Unallocated loss . . . . . . . . . . . . . . . . . . . . . . . . . . . . . . . . . . . . . . . . . . (4,428) (55,191)
Total profit . . . . . . . . . . . . . . . . . . . . . . . . . . . . . . . . . . . . . . . . . . . . $ 253,493 $ 242,508
UAE, Middle East and South and East Africa. As a result of the factors described above, the UAE,Middle East and South and East Africa region had a profit of $325.4 million for the year endedDecember 31, 2005 as compared to $260.8 million for the year ended December 31, 2004, an increase of$64.6 million, or 24.8%.
Europe and North and West Africa. The Europe and North and West Africa region had a profit of$2.0 million for the year ended December 31, 2005 as compared to a loss of $2.9 million for the year endedDecember 31, 2004, an increase of $4.9 million. This increase reflected net profits at DP World Constantaand DP World Germersheim as a result of the factors described above.
Asia-Pacific and Indian Subcontinent. The Asia-Pacific and Indian Subcontinent region had a loss of$25.6 million for the year ended December 31, 2005. This loss reflected the net profit from operations atACT (CT8) (Hong Kong), DP World Yantai, Tianjin Orient Container Terminals and the logistics centresin Hong Kong, Yantian and Shanghai, which were offset in full by net losses at CT3 (Hong Kong),DP World Cochin and Visakha Container Terminal as a result of the factors described above. In addition,interest paid on loans used to finance the operations at ACT (CT8) (Hong Kong) resulted in significantfinance costs that were attributed to the Asia-Pacific and Indian Subcontinent region for the year endedDecember 31, 2005.
Australia and New Zealand. The Australia and New Zealand region had a profit of $1.3 million forthe year ended December 31, 2005, which reflected the net profit from DP World Adelaide as a result ofthe factors described above.
Americas. As a result of the factors described above, the Americas region had a loss of $5.3 millionfor the year ended December 31, 2005.
Unallocated loss. Unallocated loss for the year ended December 31, 2005 was $55.2 million ascompared to a loss of $4.4 million for the year ended December 31, 2004, an increase of $50.8 million, or11.5 times. This increase was principally due to the incurrence of finance costs of $58.4 million associatedwith the $1,650.0 million term loan facility used to fund the acquisition of Asia Container TerminalsHoldings Limited and the CSX WT Acquisition, partially offset by an increase in interest income of$2.3 million and an increase in management fees earned by the corporate head office from Port AutonomeInternational de Djibouti.
P&O Historical Results of Operations
The following discussion and analysis is based on the P&O Consolidated Financial Statements. The P&OConsolidated Financial Statements were P&O’s first consolidated financial statements prepared inaccordance with IFRS and, consequently, IFRS 1, ‘‘First-time Adoption of International Financial ReportingStandards’’, was applied. For additional information on the transition to IFRS, see Note 1, ‘‘Significantaccounting policies—Transitional arrangements’’, of the Notes to the P&O Consolidated FinancialStatements.
The P&O Consolidated Financial Statements include the financial results of the P&O Ferries Business,P&O Estates and POPNA. However, because of the disposal of POPNA and the transfer of theP&O Ferries Business and P&O Estates, as described under ‘‘—Factors Affecting the Comparability of the
84
www.global-reports.com
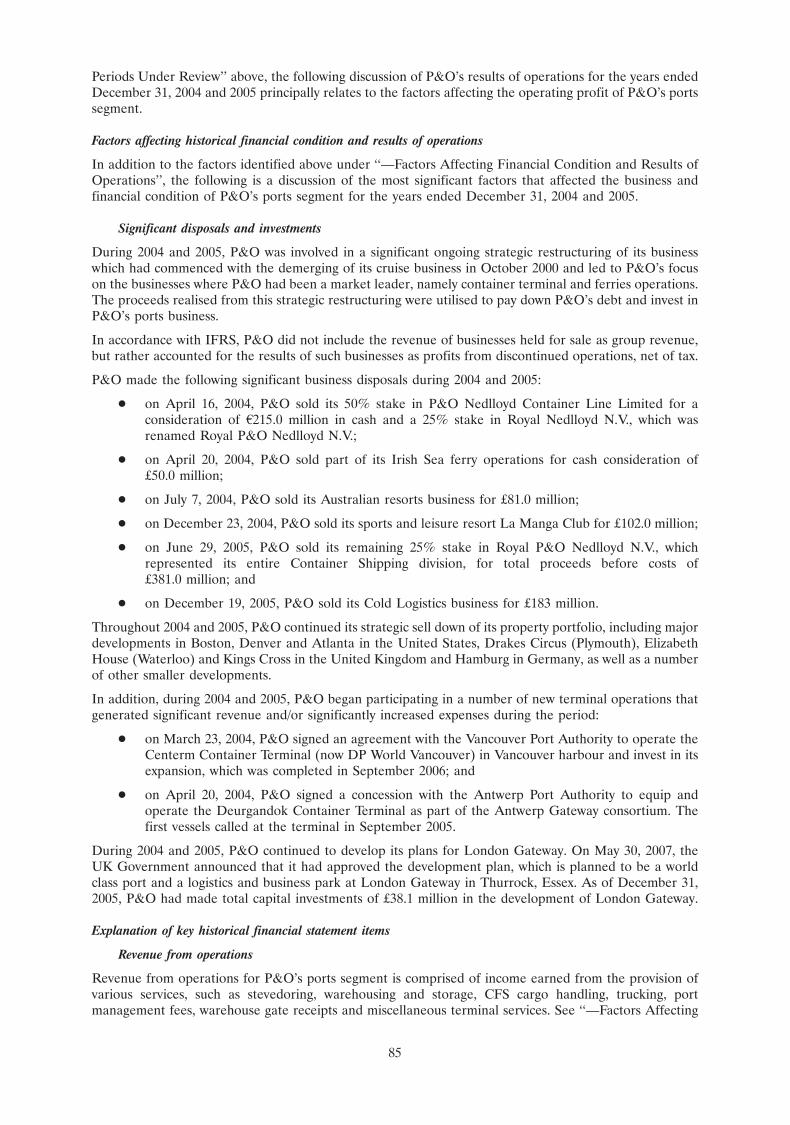
Periods Under Review’’ above, the following discussion of P&O’s results of operations for the years endedDecember 31, 2004 and 2005 principally relates to the factors affecting the operating profit of P&O’s portssegment.
Factors affecting historical financial condition and results of operations
In addition to the factors identified above under ‘‘—Factors Affecting Financial Condition and Results ofOperations’’, the following is a discussion of the most significant factors that affected the business andfinancial condition of P&O’s ports segment for the years ended December 31, 2004 and 2005.
Significant disposals and investments
During 2004 and 2005, P&O was involved in a significant ongoing strategic restructuring of its businesswhich had commenced with the demerging of its cruise business in October 2000 and led to P&O’s focuson the businesses where P&O had been a market leader, namely container terminal and ferries operations.The proceeds realised from this strategic restructuring were utilised to pay down P&O’s debt and invest inP&O’s ports business.
In accordance with IFRS, P&O did not include the revenue of businesses held for sale as group revenue,but rather accounted for the results of such businesses as profits from discontinued operations, net of tax.
P&O made the following significant business disposals during 2004 and 2005:
� on April 16, 2004, P&O sold its 50% stake in P&O Nedlloyd Container Line Limited for aconsideration of A215.0 million in cash and a 25% stake in Royal Nedlloyd N.V., which wasrenamed Royal P&O Nedlloyd N.V.;
� on April 20, 2004, P&O sold part of its Irish Sea ferry operations for cash consideration of£50.0 million;
� on July 7, 2004, P&O sold its Australian resorts business for £81.0 million;
� on December 23, 2004, P&O sold its sports and leisure resort La Manga Club for £102.0 million;
� on June 29, 2005, P&O sold its remaining 25% stake in Royal P&O Nedlloyd N.V., whichrepresented its entire Container Shipping division, for total proceeds before costs of£381.0 million; and
� on December 19, 2005, P&O sold its Cold Logistics business for £183 million.
Throughout 2004 and 2005, P&O continued its strategic sell down of its property portfolio, including majordevelopments in Boston, Denver and Atlanta in the United States, Drakes Circus (Plymouth), ElizabethHouse (Waterloo) and Kings Cross in the United Kingdom and Hamburg in Germany, as well as a numberof other smaller developments.
In addition, during 2004 and 2005, P&O began participating in a number of new terminal operations thatgenerated significant revenue and/or significantly increased expenses during the period:
� on March 23, 2004, P&O signed an agreement with the Vancouver Port Authority to operate theCenterm Container Terminal (now DP World Vancouver) in Vancouver harbour and invest in itsexpansion, which was completed in September 2006; and
� on April 20, 2004, P&O signed a concession with the Antwerp Port Authority to equip andoperate the Deurgandok Container Terminal as part of the Antwerp Gateway consortium. Thefirst vessels called at the terminal in September 2005.
During 2004 and 2005, P&O continued to develop its plans for London Gateway. On May 30, 2007, theUK Government announced that it had approved the development plan, which is planned to be a worldclass port and a logistics and business park at London Gateway in Thurrock, Essex. As of December 31,2005, P&O had made total capital investments of £38.1 million in the development of London Gateway.
Explanation of key historical financial statement items
Revenue from operations
Revenue from operations for P&O’s ports segment is comprised of income earned from the provision ofvarious services, such as stevedoring, warehousing and storage, CFS cargo handling, trucking, portmanagement fees, warehouse gate receipts and miscellaneous terminal services. See ‘‘—Factors Affecting
85
Financial Condition and Results of Operations—Volume’’ and ‘‘—Factors Affecting Financial Conditionand Results of Operations—Capacity Development—Regulatory Environment’’ above.
Cost of sales
Cost of sales includes costs incurred in connection with the operation, maintenance and security of P&O’sfacilities and other costs directly attributable to the various services provided by P&O. Major componentsof operating expenses include marine operating expenses, garage operating expenses, warehousingexpenses, transportation expenses, and yard and gate operations expenses.
General and administration expenses
General and administration expenses include amortisation cost of port concessions, staff costs, facilitiesrental, travel and entertainment, insurance, advertising, marketing, printing and stationery, communicationcosts, legal expenses, consultancy costs, IT charges, repair and maintenance costs and other sundryexpenses.
Other income
Other income includes gains on asset sales and other sundry income receipts.
Share of profit (loss) of joint ventures and associates
Share of profit (loss) of joint ventures and associates reflects P&O’s share of profits or losses from entitiesthat are associates or joint ventures. The results of operations of associates and joint ventures are notconsolidated and, consequently, only the earnings impact of these entities based on P&O’s shareholding isincorporated into P&O’s results.
Year ended December 31, 2005 compared to year ended December 31, 2004
As of December 31, 2005, P&O had three main business segments:
� ports, which includes the operation and development of terminals and related logisticaloperations worldwide as well as P&O Maritime Services, a maritime services company;
� ferries, which includes the operation of freight and passenger ferries within Europe and relatedroad haulage; and
� property, which includes a development property portfolio in the United States, the UnitedKingdom and Continental Europe.
In addition, P&O historically had two additional business segments, Container Shipping and ColdLogistics, which were sold in June 2005 and December 2005, respectively, and are shown as discontinuedoperations in the P&O Consolidated Financial Statements.
P&O further divided its ports segment geographically into the following regions: (i) Asia, (ii) Australasia,(iii) Americas and (iv) Europe, which included operations in Maputo and South Africa. The financialresults for the Maputo and South Africa operations are included in the UAE, Middle East and South andEast Africa financial reporting segment in DPA’s financial results for the year ended December 31, 2006.
As noted above, the following discussion of P&O’s results of operations for the years ended December 31,2004 and 2005 principally focuses on the material factors affecting the operating profit of P&O’s portssegment because of the transfer of the P&O Ferries Business and P&O Estates.
86
www.global-reports.com
The following table sets forth selected consolidated income statement data for P&O for the years indicated.Year ended December 31,
2004 2005
Before Beforeseparately Separately separately Separatelydisclosable disclosable disclosable disclosable
items items(1) Total items items(1) Total
(Unaudited)(Pounds Sterling in millions)
Group revenue . . . . . . . . . . . . . . . . . £ 2,265.9 £ — £ 2,265.9 £ 2,340.1 £ — £ 2,340.1Cost of sales . . . . . . . . . . . . . . . . . . (1,908.4) (122.9) (2,031.3) (2,014.4) — (2,014.4)
Gross profit . . . . . . . . . . . . . . . . . 357.5 (122.9) 234.6 325.7 — 325.7Other operating income . . . . . . . . . . . 19.5 13.5 33.0 12.8 4.1 16.9Administrative costs . . . . . . . . . . . . . (216.9) (217.3) (434.2) (192.5) (18.7) (211.2)Share of results of joint ventures and
associates . . . . . . . . . . . . . . . . . . . 30.5 — 30.5 40.9 (0.9) 40.0
Group operating profit . . . . . . . . . . 190.6 (326.7) (136.1) 186.9 (15.5) 171.4Profit on sale and termination of
businesses . . . . . . . . . . . . . . . . . . — 32.4 32.4 — — —Financial income . . . . . . . . . . . . . . . 11.4 — 11.4 7.9 — 7.9Financial expenses . . . . . . . . . . . . . . (94.9) — (94.9) (66.6) (12.1) (78.7)
Profit before taxation . . . . . . . . . . . 107.1 (294.3) (187.2) 128.2 (27.6) 100.6Taxation . . . . . . . . . . . . . . . . . . . . . (18.9) (1.9) (20.8) (23.6) (0.4) (24.0)
Profit on continuing operations aftertaxation . . . . . . . . . . . . . . . . . . . . 88.2 (296.2) (208.0) 104.6 (28.0) 76.6
Profit from discontinued operations,net of tax . . . . . . . . . . . . . . . . . . . 53.0 3.5 56.5 33.6 179.9 213.5
Profit for the year . . . . . . . . . . . . . £ 141.2 £ (292.7) £ (151.5) £ 138.2 £ 151.9 £ 290.1
(1) See Note 4, ‘‘Separately disclosable items’’, of the Notes to the P&O Consolidated Financial Statements for further information.
Group revenue
Group revenue for the year ended December 31, 2005 was £2,340.1 million as compared to£2,265.9 million for the year ended December 31, 2004, an increase of £74.2 million, or 3.3%.
The following table presents revenue information regarding P&O’s segments for the years endedDecember 31, 2004 and 2005.
Year ended December 31,
2004 2005
(Unaudited)(Pounds Sterling in millions)
RevenuePorts . . . . . . . . . . . . . . . . . . . . . . . . . . . . . . . . . . . . . . . . . . . . . . . . . . . . . £ 844.4 £ 913.9Ferries and property . . . . . . . . . . . . . . . . . . . . . . . . . . . . . . . . . . . . . . . . . . . 1,421.5 1,426.2
Revenue from continuing operations . . . . . . . . . . . . . . . . . . . . . . . . . . . . . . . . 2,265.9 2,340.1Revenue from discontinued operations . . . . . . . . . . . . . . . . . . . . . . . . . . . . . . 205.6 222.8
Revenue for the financial year . . . . . . . . . . . . . . . . . . . . . . . . . . . . . . . . . . £ 2,471.5 £ 2,562.9
Revenue for the ports segment for the year ended December 31, 2005 was £913.9 million as compared to£844.4 million for the year ended December 31, 2004, an increase of £69.5 million, or 8.2%. This increasein revenue for the ports segment was principally due to an increase in throughput volumes to 14.7 millionTEUs for the year ended December 31, 2005 from 13.8 million TEUs for the year ended December 31,2004, an increase of 868,000 TEUs, or 6.3%.
The remainder of the increase in group revenue reflected a net increase in revenues from the ferries andproperty segments of £4.7 million.
Cost of sales
Cost of sales for the year ended December 31, 2005 was £2,014.4 million as compared to £2,031.3 millionfor the year ended December 31, 2004, a decrease of £16.9 million, or 0.8%. This decrease in cost of saleswas principally due to an increase before separately disclosable items in the ports segment of £53.6 million,
87
or 7.8%, and an increase before separately disclosable items of £52.4 million, or 4.3%, in the ferries andproperty segments, which were offset by a reduction in total separately disclosable items of £122.9 million.Cost of sales for the year ended December 31, 2004 was impacted by the inclusion of £122.9 million in costof sales associated with separately disclosable items, which consisted primarily of property and otherimpairments and ferries reorganisation and impairment costs.
Other operating income
Other operating income for the year ended December 31, 2005 was £16.9 million as compared to£33.0 million for the year ended December 31, 2004, a decrease of £16.1 million, or 48.8%. This decreasein other operating income was principally due to a decrease before separately disclosable items in the portssegment of £0.8 million, or 8.5%, a decrease before separately disclosable items in the ferries and propertysegments of £5.9 million, or 58.4%, and a reduction in total separately disclosable items of £9.4 million.Other operating income for the year ended December 31, 2005 was impacted by the inclusion of£4.1 million in other operating income associated with separately disclosable items, which consistedprimarily of a net insurance recovery and a profit on the sale of premises, plant and equipment. Otheroperating income for the year ended December 31, 2004 was impacted by the inclusion of £13.5 million inother operating income associated with separately disclosable items, which consisted primarily of one-timerental refunds and one-time pension contribution refunds.
Administrative costs
Administrative costs for the year ended December 31, 2005 were £211.2 million as compared to£434.2 million for the year ended December 31, 2004, a decrease of £223.0 million, or 51.4%. This decreasein administrative costs was principally due to an increase before separately disclosable items in the portssegment of £8.2 million, or 14.2%, which were offset by a decrease before separately disclosable items inthe ferries and property segments of £32.6 million, or 20.4%, and a reduction in total separately disclosableitems of £198.6 million. Administrative costs for the year ended December 31, 2005 were impacted by theinclusion of £18.7 million in administrative costs associated with separately disclosable items, whichconsisted primarily of relocation and reorganisation costs of £15.4 million and costs associated with theP&O Acquisition of £3.3 million. Administrative costs for the year ended December 31, 2004 wereimpacted by the inclusion of £217.3 million in administrative costs associated with separately disclosableitems, which consisted primarily of ferries reorganisation and impairment costs.
Share of results of joint ventures and associates
Share of results of joint ventures and associates for the year ended December 31, 2005 was £40.0 million ascompared to £30.5 million for the year ended December 31, 2004, an increase of £9.5 million, or 31.1%.This increase in share of results of joint ventures and associates was principally due to an increase in theshare of results of joint ventures and associates before separately disclosable items in the ports segment of£13.4 million, or 46.7%, which was offset by a decrease in the share of results of joint ventures andassociates before separately disclosable items in the ferries and property segments of £3.0 million and atotal separately disclosable loss of £0.9 million. Share of results of joint ventures and associates for the yearended December 31, 2005 was impacted by the inclusion of a loss of £0.9 million associated with separatelydisclosable items, which consisted primarily of losses arising from the sale of assets in the propertysegment.
Group operating profit
Group operating profit for the year ended December 31, 2005 was £171.4 million as compared to a loss of£136.1 million for the year ended December 31, 2004, an increase of £307.5 million. This increase in groupoperating profit was principally due to an increase in the profit before separately disclosable items in theports segment of £20.3 million, or 14.2%, which was offset by a decrease in profit before separatelydisclosable items in the ferries and property segments of £24.0 million, or 49.9%, and a reduction of£311.2 million in the losses from separately disclosable items described above. The £16.0 million ofunallocated costs within separately disclosable items consisted primarily of corporate relocation andreorganisation costs and costs associated with the P&O Acquisition.
Historically, P&O presented underlying profit because of the distorting effect that net financing costs,taxation and minority interest relating to joint ventures and associates had on group operating profit.Underlying profit is a different financial measure from net profit for the year, as calculated by DPA. Thefollowing table presents underlying profit information regarding P&O’s segments, as well as a
88
www.global-reports.com
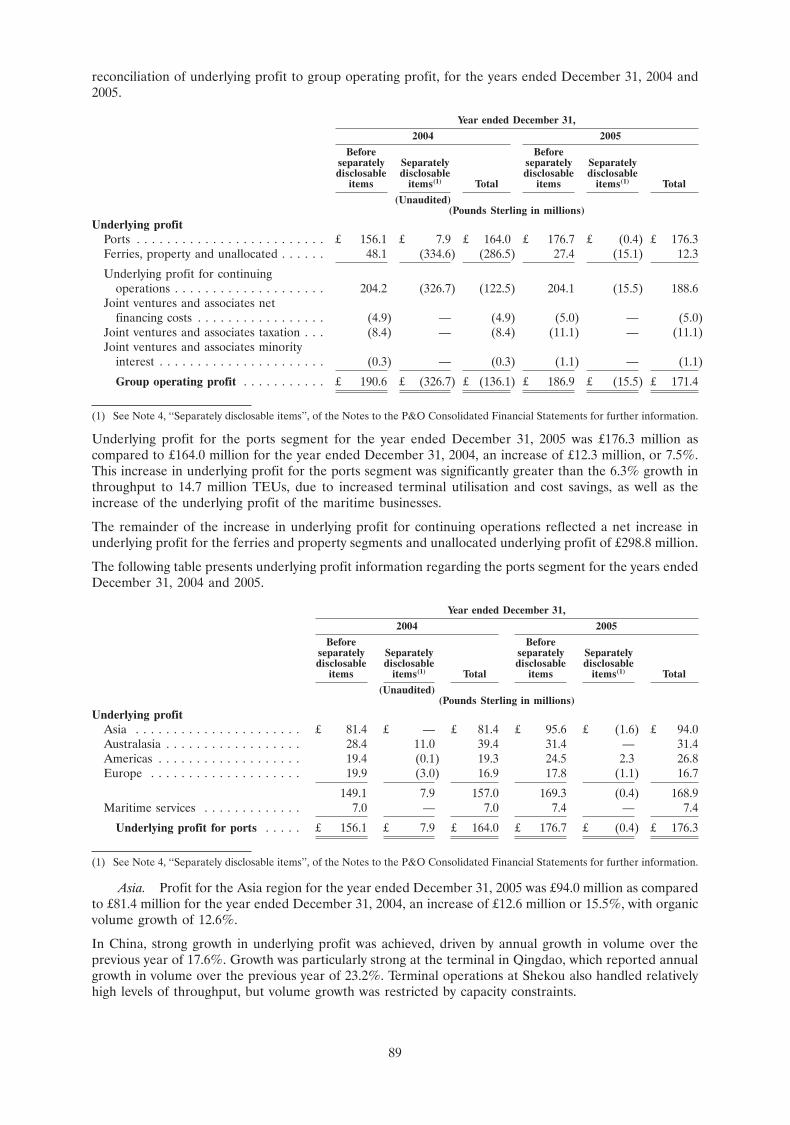
reconciliation of underlying profit to group operating profit, for the years ended December 31, 2004 and2005.
Year ended December 31,
2004 2005
Before Beforeseparately Separately separately Separatelydisclosable disclosable disclosable disclosable
items items(1) Total items items(1) Total
(Unaudited)(Pounds Sterling in millions)
Underlying profitPorts . . . . . . . . . . . . . . . . . . . . . . . . . £ 156.1 £ 7.9 £ 164.0 £ 176.7 £ (0.4) £ 176.3Ferries, property and unallocated . . . . . . 48.1 (334.6) (286.5) 27.4 (15.1) 12.3
Underlying profit for continuingoperations . . . . . . . . . . . . . . . . . . . . 204.2 (326.7) (122.5) 204.1 (15.5) 188.6
Joint ventures and associates netfinancing costs . . . . . . . . . . . . . . . . . (4.9) — (4.9) (5.0) — (5.0)
Joint ventures and associates taxation . . . (8.4) — (8.4) (11.1) — (11.1)Joint ventures and associates minority
interest . . . . . . . . . . . . . . . . . . . . . . (0.3) — (0.3) (1.1) — (1.1)
Group operating profit . . . . . . . . . . . £ 190.6 £ (326.7) £ (136.1) £ 186.9 £ (15.5) £ 171.4
(1) See Note 4, ‘‘Separately disclosable items’’, of the Notes to the P&O Consolidated Financial Statements for further information.
Underlying profit for the ports segment for the year ended December 31, 2005 was £176.3 million ascompared to £164.0 million for the year ended December 31, 2004, an increase of £12.3 million, or 7.5%.This increase in underlying profit for the ports segment was significantly greater than the 6.3% growth inthroughput to 14.7 million TEUs, due to increased terminal utilisation and cost savings, as well as theincrease of the underlying profit of the maritime businesses.
The remainder of the increase in underlying profit for continuing operations reflected a net increase inunderlying profit for the ferries and property segments and unallocated underlying profit of £298.8 million.
The following table presents underlying profit information regarding the ports segment for the years endedDecember 31, 2004 and 2005.
Year ended December 31,
2004 2005
Before Beforeseparately Separately separately Separatelydisclosable disclosable disclosable disclosable
items items(1) Total items items(1) Total
(Unaudited)(Pounds Sterling in millions)
Underlying profitAsia . . . . . . . . . . . . . . . . . . . . . . £ 81.4 £ — £ 81.4 £ 95.6 £ (1.6) £ 94.0Australasia . . . . . . . . . . . . . . . . . . 28.4 11.0 39.4 31.4 — 31.4Americas . . . . . . . . . . . . . . . . . . . 19.4 (0.1) 19.3 24.5 2.3 26.8Europe . . . . . . . . . . . . . . . . . . . . 19.9 (3.0) 16.9 17.8 (1.1) 16.7
149.1 7.9 157.0 169.3 (0.4) 168.9Maritime services . . . . . . . . . . . . . 7.0 — 7.0 7.4 — 7.4
Underlying profit for ports . . . . . £ 156.1 £ 7.9 £ 164.0 £ 176.7 £ (0.4) £ 176.3
(1) See Note 4, ‘‘Separately disclosable items’’, of the Notes to the P&O Consolidated Financial Statements for further information.
Asia. Profit for the Asia region for the year ended December 31, 2005 was £94.0 million as comparedto £81.4 million for the year ended December 31, 2004, an increase of £12.6 million or 15.5%, with organicvolume growth of 12.6%.
In China, strong growth in underlying profit was achieved, driven by annual growth in volume over theprevious year of 17.6%. Growth was particularly strong at the terminal in Qingdao, which reported annualgrowth in volume over the previous year of 23.2%. Terminal operations at Shekou also handled relativelyhigh levels of throughput, but volume growth was restricted by capacity constraints.
89
In India, DP World Nhava Sheva achieved volume growth despite being capacity constrained. However, areduction in the regulated tariff applicable to the terminal led to a decrease in operating profit of£3.0 million over the previous year. Growth in both volume and profit was achieved at the terminals inChennai and Mundra. In Pakistan, volume growth combined with a significant temporary contributionfrom ancillary services, such as storage, resulted in a notable increase in profit at DP World Karachi in2005.
In the Philippines, increases in the regulated tariff resulted in profit growth despite container volumesremaining static.
In Indonesia, container volumes and profit in 2005 were unchanged at the terminal in Surabaya ascompared to 2004.
Profit for the Asia region for the year ended December 31, 2005 was impacted by the inclusion of a loss of£1.6 million associated with separately disclosable items, which consisted primarily of restructuring andreorganisation.
Australasia. Profit for the Australasia region for the year ended December 31, 2005 was £31.4 millionas compared to £39.4 million for the year ended December 31, 2004, a decrease of £8.0 million, or 20.3%,with an annual volume growth of 3.7%. There were also improved contributions in 2005 from the logisticsand transport business, as well as non-container and container operations. Container volumes benefitedfrom strong Asian trade volumes at the start of 2005. However, this was offset by weakening consumerdemand through much of the rest of the year. Ancillary revenue from container operations was particularlystrong at the end of 2005 because of the high level of container storage at the terminals.
Profit for the Australasia region for the year ended December 31, 2004 was impacted by the inclusion of aprofit of £11.0 million associated with separately disclosable items, which consisted primarily of one-timerental refunds and one-time pension contribution refunds and holidays off-set by the write off/loss on saleof premises, plant and equipment.
Americas. Profit for the Americas region for the year ended December 31, 2005 was £26.8 million ascompared to £19.3 million for the year ended December 31, 2004, an increase of £7.5 million or 38.9%,with organic volume growth of 9.0%. The non-containerised business performed well in 2005 despitedisruptions caused by Hurricanes Katrina and Rita. The operations at New Orleans, Lake Charles andHouston were only temporarily affected, although the Gulfport terminal sustained long-term damage.Damage and business interruption costs were largely covered by insurance. The operations at the terminalin Miami performed particularly well in 2005 and benefited from high ancillary revenue. The terminal inPort Newark, New Jersey moved into profitability for 2005, benefiting from customer gains, improvedvolumes and enhanced utilisation following reconstruction of the main part of the terminal in 2004.
In Argentina, the market was competitive during 2005, with volumes at Terminales Rio de la Plata (BuenosAires) under pressure from competition and the poor Argentinean economy in the first half of 2005 butwith market share improving in the second half of the year. Consequently, overall volume growth of 11.0%was achieved, although profits were slightly lower for the year.
In Vancouver, the terminal achieved higher volumes and increased tariffs but redevelopment of theterminal and a truckers’ strike in the second half of 2005 reduced profit growth.
Profit for the Americas region for the year ended December 31, 2005 was impacted by the inclusion of aprofit of £2.3 million associated with separately disclosable items, which consisted primarily of a netinsurance recovery. Profit for the Americas region for the year ended December 31, 2004 was impacted bythe inclusion of a loss of £0.1 million associated with separately disclosable items, which consisted primarilyof losses on the sale of premises, plant and equipment.
Europe. Profit for the Europe region for the year ended December 31, 2005 was £16.7 million ascompared to £16.9 million for the year ended December 31, 2004, a decrease of £0.2 million, or 1.2%, withcontainer volumes down by 3.3%. Volumes at the terminal in Southampton were down 4.6% over theprevious year following the loss of a portion of a customer’s business to another terminal at the end of2004. Consequently, profits were reduced but were also impacted by an increase in local authority rates by£2.0 million per year and higher labour costs associated with an increase in gross capacity to 1.9 millionTEUs per annum.
Volumes were also down at the terminal in Antwerp following the planned relocation of a less profitablecustomer. However, this improved the business mix at the terminal and meant that profits were
90
www.global-reports.com
significantly ahead of the prior year. The new Antwerp Gateway terminal opened in the third quarter of2005. The volumes and profit at other European terminals improved year over year.
Profit for the Europe region for the year ended December 31, 2005 was impacted by the inclusion of a lossof £1.1 million associated with separately disclosable items, which consisted primarily of restructuring andreorganisation costs. Profit for the Europe region for the year ended December 31, 2004 was impacted bythe inclusion of a loss of £3.0 million associated with separately disclosable items, which consisted primarilyof the write-off of goodwill and losses on the sale of investment, premises, plant and equipment.
Maritime services. Profit for maritime services for the year ended December 31, 2005 was £7.4 millionas compared to £7.0 million for the year ended December 31, 2004, an increase of £0.4 million, or 5.7%.This increase in profit for maritime services was principally due to a strong result from the specialisedshipping contracts operated for the Australian Government and Royal Australian Navy.
Liquidity and Capital Resources
We expect to meet our ongoing capital requirements, including in respect of our 13 ongoing terminaldevelopment projects and 10 ongoing terminal expansion projects, as described in ‘‘Business—History—Future Expansion’’ and ‘‘Business—Our Ports Business—Portfolio’’, through dividends and repayments ofloans from our subsidiaries, as well as debt financing or the issuance of equity to the extent necessary. Webelieve that we have sufficient working capital for the foreseeable future. Where available, we intend tofinance terminal development and expansion projects through non-recourse debt of the relevant terminaloperating company. See ‘‘Risk Factors—Risks Related to the Shares—Because we are a holding companyand substantially all of our operations are conducted by our subsidiaries, unconsolidated joint ventures andassociates, our ability to pay dividends on the Shares depends on our ability to obtain cash dividends orother cash payments or obtain loans from such entities’’ and ‘‘Risk Factors—Risks Relating to theCompany—Our businesses require substantial capital investment, and we may not have sufficient capital tomake, or may be restricted by covenants in our financing agreements from making, future capitalexpenditures and other investments as we deem necessary or desirable’’. In addition, we may, from time totime, based on market conditions, access the banking and capital markets to borrow funds to meet ourliquidity and other financing needs.
Cash Flow
Company and DPA
Our cash flows for the six months ended June 30, 2007 are not directly comparable to DPA’s cash flows forthe six months ended June 30, 2006. See ‘‘Presentation of Certain Financial and Other Information—Comparability of Historical Financial Information’’ and ‘‘—Factors Affecting the Comparability of thePeriods under Review’’ above for further information.
91
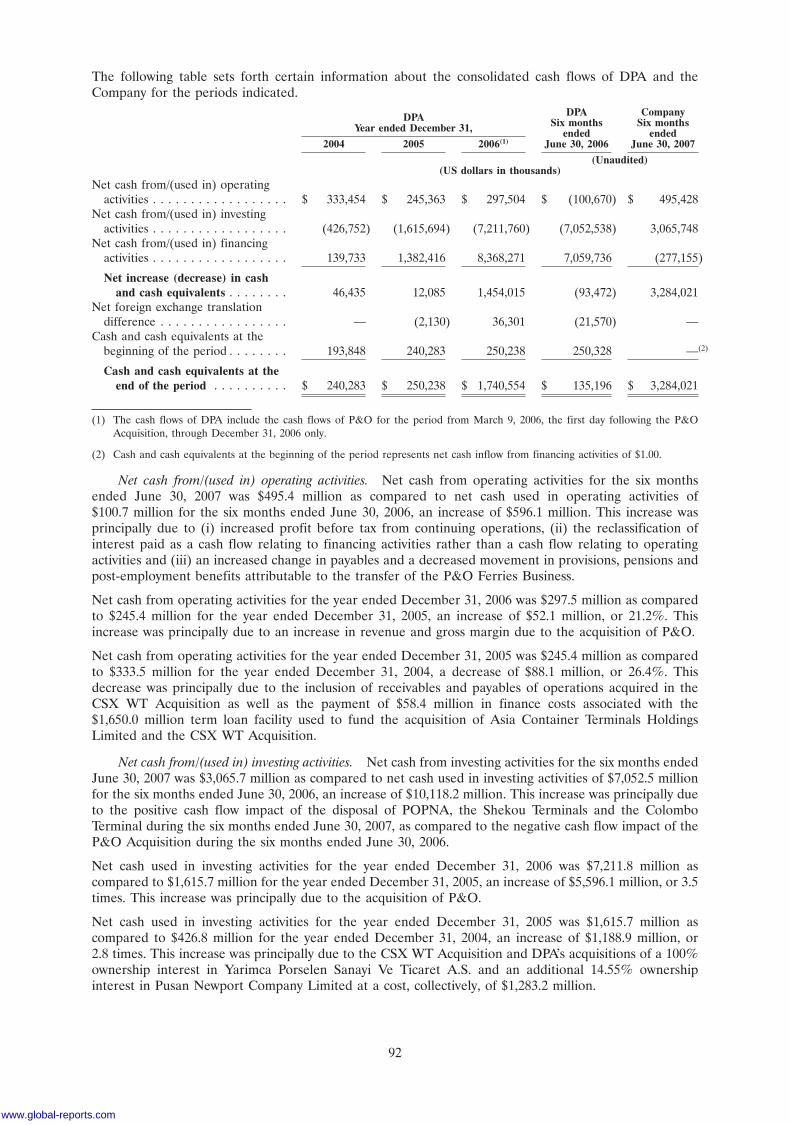
The following table sets forth certain information about the consolidated cash flows of DPA and theCompany for the periods indicated.
DPA CompanyDPA Six months Six monthsYear ended December 31, ended ended2004 2005 2006(1) June 30, 2006 June 30, 2007
(Unaudited)(US dollars in thousands)
Net cash from/(used in) operatingactivities . . . . . . . . . . . . . . . . . . $ 333,454 $ 245,363 $ 297,504 $ (100,670) $ 495,428
Net cash from/(used in) investingactivities . . . . . . . . . . . . . . . . . . (426,752) (1,615,694) (7,211,760) (7,052,538) 3,065,748
Net cash from/(used in) financingactivities . . . . . . . . . . . . . . . . . . 139,733 1,382,416 8,368,271 7,059,736 (277,155)
Net increase (decrease) in cashand cash equivalents . . . . . . . . 46,435 12,085 1,454,015 (93,472) 3,284,021
Net foreign exchange translationdifference . . . . . . . . . . . . . . . . . — (2,130) 36,301 (21,570) —
Cash and cash equivalents at thebeginning of the period . . . . . . . . 193,848 240,283 250,238 250,328 —(2)
Cash and cash equivalents at theend of the period . . . . . . . . . . $ 240,283 $ 250,238 $ 1,740,554 $ 135,196 $ 3,284,021
(1) The cash flows of DPA include the cash flows of P&O for the period from March 9, 2006, the first day following the P&OAcquisition, through December 31, 2006 only.
(2) Cash and cash equivalents at the beginning of the period represents net cash inflow from financing activities of $1.00.
Net cash from/(used in) operating activities. Net cash from operating activities for the six monthsended June 30, 2007 was $495.4 million as compared to net cash used in operating activities of$100.7 million for the six months ended June 30, 2006, an increase of $596.1 million. This increase wasprincipally due to (i) increased profit before tax from continuing operations, (ii) the reclassification ofinterest paid as a cash flow relating to financing activities rather than a cash flow relating to operatingactivities and (iii) an increased change in payables and a decreased movement in provisions, pensions andpost-employment benefits attributable to the transfer of the P&O Ferries Business.
Net cash from operating activities for the year ended December 31, 2006 was $297.5 million as comparedto $245.4 million for the year ended December 31, 2005, an increase of $52.1 million, or 21.2%. Thisincrease was principally due to an increase in revenue and gross margin due to the acquisition of P&O.
Net cash from operating activities for the year ended December 31, 2005 was $245.4 million as comparedto $333.5 million for the year ended December 31, 2004, a decrease of $88.1 million, or 26.4%. Thisdecrease was principally due to the inclusion of receivables and payables of operations acquired in theCSX WT Acquisition as well as the payment of $58.4 million in finance costs associated with the$1,650.0 million term loan facility used to fund the acquisition of Asia Container Terminals HoldingsLimited and the CSX WT Acquisition.
Net cash from/(used in) investing activities. Net cash from investing activities for the six months endedJune 30, 2007 was $3,065.7 million as compared to net cash used in investing activities of $7,052.5 millionfor the six months ended June 30, 2006, an increase of $10,118.2 million. This increase was principally dueto the positive cash flow impact of the disposal of POPNA, the Shekou Terminals and the ColomboTerminal during the six months ended June 30, 2007, as compared to the negative cash flow impact of theP&O Acquisition during the six months ended June 30, 2006.
Net cash used in investing activities for the year ended December 31, 2006 was $7,211.8 million ascompared to $1,615.7 million for the year ended December 31, 2005, an increase of $5,596.1 million, or 3.5times. This increase was principally due to the acquisition of P&O.
Net cash used in investing activities for the year ended December 31, 2005 was $1,615.7 million ascompared to $426.8 million for the year ended December 31, 2004, an increase of $1,188.9 million, or2.8 times. This increase was principally due to the CSX WT Acquisition and DPA’s acquisitions of a 100%ownership interest in Yarimca Porselen Sanayi Ve Ticaret A.S. and an additional 14.55% ownershipinterest in Pusan Newport Company Limited at a cost, collectively, of $1,283.2 million.
92
www.global-reports.com
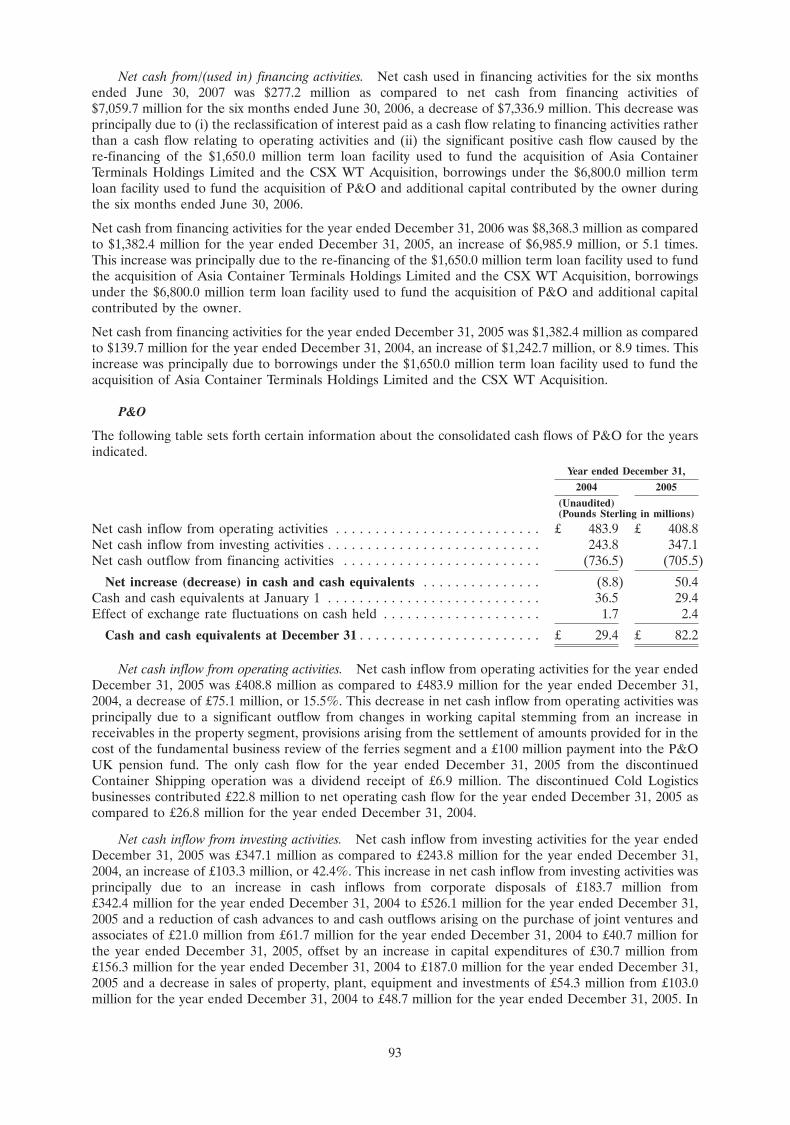
Net cash from/(used in) financing activities. Net cash used in financing activities for the six monthsended June 30, 2007 was $277.2 million as compared to net cash from financing activities of$7,059.7 million for the six months ended June 30, 2006, a decrease of $7,336.9 million. This decrease wasprincipally due to (i) the reclassification of interest paid as a cash flow relating to financing activities ratherthan a cash flow relating to operating activities and (ii) the significant positive cash flow caused by there-financing of the $1,650.0 million term loan facility used to fund the acquisition of Asia ContainerTerminals Holdings Limited and the CSX WT Acquisition, borrowings under the $6,800.0 million termloan facility used to fund the acquisition of P&O and additional capital contributed by the owner duringthe six months ended June 30, 2006.
Net cash from financing activities for the year ended December 31, 2006 was $8,368.3 million as comparedto $1,382.4 million for the year ended December 31, 2005, an increase of $6,985.9 million, or 5.1 times.This increase was principally due to the re-financing of the $1,650.0 million term loan facility used to fundthe acquisition of Asia Container Terminals Holdings Limited and the CSX WT Acquisition, borrowingsunder the $6,800.0 million term loan facility used to fund the acquisition of P&O and additional capitalcontributed by the owner.
Net cash from financing activities for the year ended December 31, 2005 was $1,382.4 million as comparedto $139.7 million for the year ended December 31, 2004, an increase of $1,242.7 million, or 8.9 times. Thisincrease was principally due to borrowings under the $1,650.0 million term loan facility used to fund theacquisition of Asia Container Terminals Holdings Limited and the CSX WT Acquisition.
P&O
The following table sets forth certain information about the consolidated cash flows of P&O for the yearsindicated.
Year ended December 31,
2004 2005
(Unaudited)(Pounds Sterling in millions)
Net cash inflow from operating activities . . . . . . . . . . . . . . . . . . . . . . . . . . £ 483.9 £ 408.8Net cash inflow from investing activities . . . . . . . . . . . . . . . . . . . . . . . . . . . 243.8 347.1Net cash outflow from financing activities . . . . . . . . . . . . . . . . . . . . . . . . . (736.5) (705.5)
Net increase (decrease) in cash and cash equivalents . . . . . . . . . . . . . . . (8.8) 50.4Cash and cash equivalents at January 1 . . . . . . . . . . . . . . . . . . . . . . . . . . . 36.5 29.4Effect of exchange rate fluctuations on cash held . . . . . . . . . . . . . . . . . . . . 1.7 2.4
Cash and cash equivalents at December 31 . . . . . . . . . . . . . . . . . . . . . . . £ 29.4 £ 82.2
Net cash inflow from operating activities. Net cash inflow from operating activities for the year endedDecember 31, 2005 was £408.8 million as compared to £483.9 million for the year ended December 31,2004, a decrease of £75.1 million, or 15.5%. This decrease in net cash inflow from operating activities wasprincipally due to a significant outflow from changes in working capital stemming from an increase inreceivables in the property segment, provisions arising from the settlement of amounts provided for in thecost of the fundamental business review of the ferries segment and a £100 million payment into the P&OUK pension fund. The only cash flow for the year ended December 31, 2005 from the discontinuedContainer Shipping operation was a dividend receipt of £6.9 million. The discontinued Cold Logisticsbusinesses contributed £22.8 million to net operating cash flow for the year ended December 31, 2005 ascompared to £26.8 million for the year ended December 31, 2004.
Net cash inflow from investing activities. Net cash inflow from investing activities for the year endedDecember 31, 2005 was £347.1 million as compared to £243.8 million for the year ended December 31,2004, an increase of £103.3 million, or 42.4%. This increase in net cash inflow from investing activities wasprincipally due to an increase in cash inflows from corporate disposals of £183.7 million from£342.4 million for the year ended December 31, 2004 to £526.1 million for the year ended December 31,2005 and a reduction of cash advances to and cash outflows arising on the purchase of joint ventures andassociates of £21.0 million from £61.7 million for the year ended December 31, 2004 to £40.7 million forthe year ended December 31, 2005, offset by an increase in capital expenditures of £30.7 million from£156.3 million for the year ended December 31, 2004 to £187.0 million for the year ended December 31,2005 and a decrease in sales of property, plant, equipment and investments of £54.3 million from £103.0million for the year ended December 31, 2004 to £48.7 million for the year ended December 31, 2005. In
93
addition, for the year ended December 31, 2004, P&O received £16.4 million in interest arising mainly ondeferred consideration from prior period corporate disposals. The discontinued Cold Logistics businessesgenerated £7.5 million in cash flow from investing activities for the year ended December 31, 2005 ascompared to £0.6 million for the year ended December 31, 2004.
Net cash outflow from financing activities. Net cash outflow from financing activities for the yearended December 31, 2005 was £705.5 million as compared to £736.5 million for the year endedDecember 31, 2004, a decrease of £31.0 million, or 4.2%. This decrease in net cash outflow from financingactivities was principally due to an increase in the cash outflow arising on net loan and lease repayments of£47.8 million from £521.7 million for the year ended December 31, 2004 to £569.5 million for the yearended December 31, 2005, a decrease in interest payments of £41.5 million from £117.0 million for the yearended December 31, 2004 to £75.5 million for the year ended December 31, 2005 and a reduction individends paid of £23.3 million from £96.2 million for the year ended December 31, 2004 to £72.9 millionfor the year ended December 31, 2005. In addition, P&O had a net cash inflow of £12.4 million for the yearended December 31, 2005 as compared to a net cash outflow of £1.6 million for the year endedDecember 31, 2004, in each case, from the issue/purchase of P&O stock. The discontinued Cold Logisticsbusinesses utilised £6.5 million in respect of financing activities for the year ended December 31, 2005 ascompared to £4.5 million for the year ended December 31, 2004.
Working Capital and Indebtedness
Syndicated Term Loan and Revolving Credit Facility
In connection with the Restructuring, on December 29, 2006, the Amended and Restated Credit Facilitywas amended and restated to, among other things, (i) transfer a portion of borrowings thereunder fromThunder FZE to JAFZA, (ii) remove the requirement that the proceeds from the sale of POPNA be usedto prepay borrowings thereunder, (iii) upon the satisfaction of certain conditions, remove JAFZA as aborrower and guarantor thereunder and (iv) upon the satisfaction of certain conditions, remove PCFC as aguarantor thereunder. In addition, immediately prior to the transfer of Thunder FZE to the Company, theCompany became a borrower and guarantor under the Amended and Restated Credit Facility. OnMarch 29, 2007, the outstanding borrowings of DPA were transferred to DP World UAE and DP WorldUAE assumed all the obligations of DPA as a borrower under the Amended and Restated Credit Facility.
The Amended and Restated Credit Facility consisted of a $4,524.0 million term loan facility that maturedin November 2010 and a $500.0 million revolving credit facility with a five-year maturity. On October 29,2007, we repaid in full the amounts outstanding under the Amended and Restated Credit Facility with$1.3 billion in borrowings under the Syndicated Loan Facility.
Revolving Credit Syndicated Facility
On October 22, 2007, the Company entered into an unsecured syndicated loan facility among theCompany, DP World Holdings (Australia) Limited and P&O, as borrowers, the Company, as the soleguarantor, the lenders from time to time party thereto, Barclays Capital, Citibank N.A., Deutsche BankAG, London Branch, and The Royal Bank of Scotland Plc, as mandated lead arrangers, The Royal Bank ofScotland Plc, as issuing bank, and Deutsche Bank Luxembourg S.A, as facility agent (the ‘‘Syndicated LoanFacility’’).
The Syndicated Loan Facility comprises a $3.0 billion syndicated loan facility with a maturity of five yearsfrom the date of the Syndicated Loan Facility agreement, and will be used towards financing the generalcorporate purposes of the Company and its subsidiaries, as well as refinancing outstanding amounts underthe Amended and Restated Credit Facility.
Guarantees. The obligations of the borrowers under the Syndicated Loan Facility are unconditionallyand irrevocably guaranteed by the Company.
Repayment and voluntary prepayments. Borrowings under the Syndicated Loan Facility must berepaid at final maturity. The Syndicated Loan Facility provides for voluntary prepayments of loans andvoluntary cancellations of the unutilised proportion of the commitments, without penalty, subject tocertain conditions pertaining to minimum notice and payment and cancellation amounts. Amounts prepaidmay be reborrowed in accordance with the terms of the Syndicated Loan Facility. The Syndicated LoanFacility also contains mandatory prepayment provisions that we believe are usual and customary forfacilities of this type.
94
www.global-reports.com
Undertakings and covenants. The Syndicated Loan Facility contains affirmative and negativeundertakings that we believe are usual and customary for facilities of this type. In addition, the SyndicatedLoan Facility contains a total debt to total debt plus equity financial covenant, where equity refers to theamount of equity on the balance sheet of the Company.
Events of default. The Syndicated Loan Facility contains certain customary events of default.
6.85 per cent. Notes due 2037
On July 2, 2007, the Company issued $1,750,000,000 aggregate principal amount of 6.85 per cent. Notesdue 2037 (the ‘‘Senior Notes’’) under its $5,000,000,000 Global Medium Term Note Programme. TheSenior Notes were issued in the United States in reliance on Rule 144A and outside of the United States tonon-US persons in reliance on Regulation S and are listed on the London Stock Exchange and the DIFX.
Ranking. The Senior Notes are senior unsecured obligations of the Company and rank equally inright of payment to all of the Company’s existing and future senior indebtedness and senior in right ofpayment to all of the Company’s existing and future senior subordinated indebtedness and subordinatedindebtedness. The Senior Notes are effectively subordinated in right of payment to the Company’s securedindebtedness to the extent of the value of the assets securing such indebtedness and are structurallysubordinated to all obligations of each of the Company’s existing and future subsidiaries.
Repayment and redemption. Upon the occurrence of a change of control of the Company, eachholder of the Senior Notes has the right to require the Company to repurchase such holder’s Senior Notesat a purchase price in cash equal to 100% of the principal amount thereof, plus accrued and unpaidinterest, if any, to the repurchase date. Subject to certain limited exceptions, the Senior Notes may not beredeemed at the Company’s option prior to maturity. Unless previously redeemed or purchased andcancelled, the Senior Notes must be redeemed at par on the maturity date.
Covenants. The Senior Notes have the benefit of a negative pledge that, subject to certain limitedexceptions, limits the Company’s ability and the ability of its restricted subsidiaries to guarantee debt andto create, or have outstanding, any mortgage, charge lien, pledge or other security interest on their assetsto secure debt.
Events of default. The Senior Notes are subject to certain customary events of default that, if any ofthem occurs, would permit the principal of and accrued interest on the Senior Notes to be declared dueand payable.
Trust Certificates (Sukuk Al-Mudaraba) due 2017
On July 2, 2007, DP World Sukuk Limited, a Cayman Islands special purpose vehicle (‘‘DP World Sukuk’’),issued $1,500,000,000 face amount of Trust Certificates due 2017 (the ‘‘Certificates’’). The Certificateswere issued in the United States in reliance on Rule 144A and outside of the United States to non-USpersons in reliance on Regulation S and are listed on the London Stock Exchange and the DIFX. TheCertificates evidence an undivided beneficial ownership interest in certain assets held in trust. Theproceeds from the Certificates were invested in the Company’s business activities in accordance with anagreed investment plan. Each holder of the Certificates is entitled to periodic distribution amounts in anamount equal to 6.25 per cent. per annum on the aggregate principal amount of Certificates held by suchholder. To the extent that the amount of profit generated through the investment plan is less than theamount necessary to make such periodic distribution amounts, the Company (as Mudareb under theCertificates) is required to provide Shari’a compliant liquidity financing to ensure that sufficient funds areavailable to pay such periodic distribution amounts. To the extent that the amount of profit generatedthrough the investment plan is greater than the amount necessary to make such periodic distributionamounts, the Company is entitled to retain such excess amount for its own account by way of an incentivefee for acting as Mudareb.
Redemption. Upon the occurrence of a change of control of the Company, each holder of theCertificates has the right to require DP World Sukuk to redeem any or all of such holder’s Certificates at apurchase price in cash equal to 100% of the aggregate principal amount thereof, plus accrued and unpaidperiodic distribution amounts, if any, to the redemption date. Subject to certain limited exceptions, theCertificates may not be redeemed at DP World Sukuk’s option prior to maturity. Unless previouslyredeemed or purchased and cancelled, the Certificates must be redeemed at par on the scheduledredemption date. Prior to any such redemption date, the Company will purchase all or, in the case of a
95
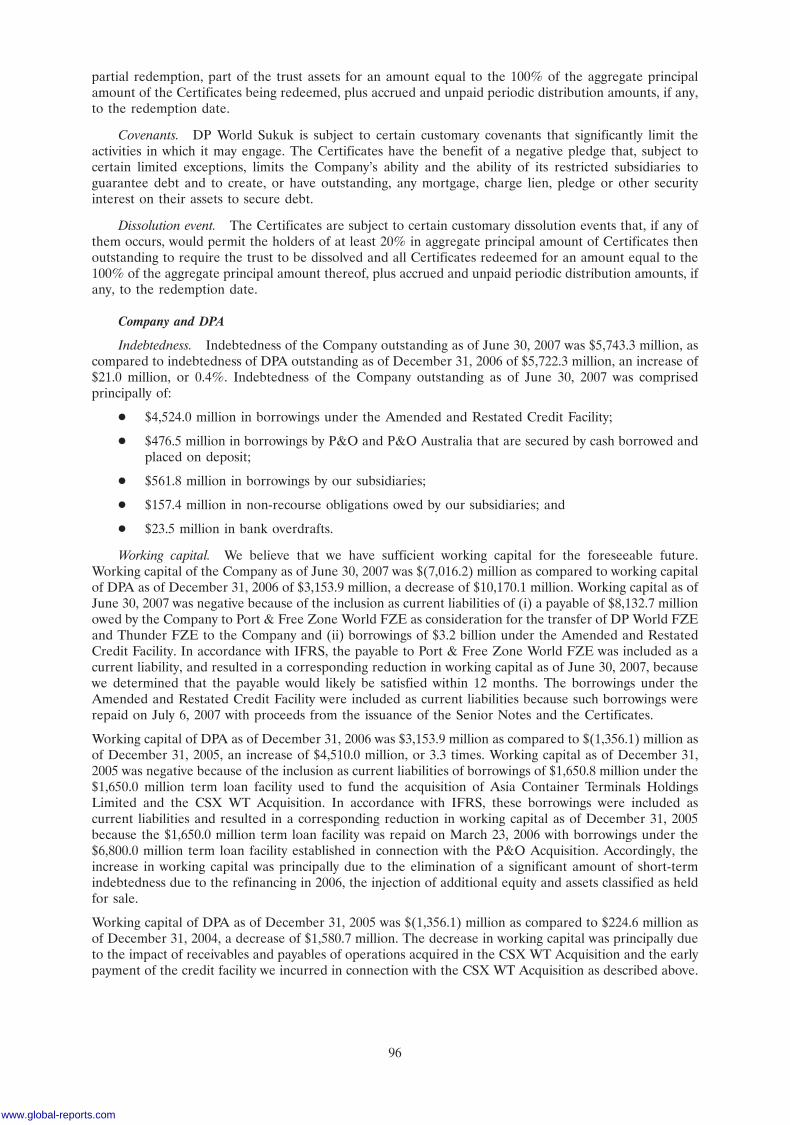
partial redemption, part of the trust assets for an amount equal to the 100% of the aggregate principalamount of the Certificates being redeemed, plus accrued and unpaid periodic distribution amounts, if any,to the redemption date.
Covenants. DP World Sukuk is subject to certain customary covenants that significantly limit theactivities in which it may engage. The Certificates have the benefit of a negative pledge that, subject tocertain limited exceptions, limits the Company’s ability and the ability of its restricted subsidiaries toguarantee debt and to create, or have outstanding, any mortgage, charge lien, pledge or other securityinterest on their assets to secure debt.
Dissolution event. The Certificates are subject to certain customary dissolution events that, if any ofthem occurs, would permit the holders of at least 20% in aggregate principal amount of Certificates thenoutstanding to require the trust to be dissolved and all Certificates redeemed for an amount equal to the100% of the aggregate principal amount thereof, plus accrued and unpaid periodic distribution amounts, ifany, to the redemption date.
Company and DPA
Indebtedness. Indebtedness of the Company outstanding as of June 30, 2007 was $5,743.3 million, ascompared to indebtedness of DPA outstanding as of December 31, 2006 of $5,722.3 million, an increase of$21.0 million, or 0.4%. Indebtedness of the Company outstanding as of June 30, 2007 was comprisedprincipally of:
� $4,524.0 million in borrowings under the Amended and Restated Credit Facility;
� $476.5 million in borrowings by P&O and P&O Australia that are secured by cash borrowed andplaced on deposit;
� $561.8 million in borrowings by our subsidiaries;
� $157.4 million in non-recourse obligations owed by our subsidiaries; and
� $23.5 million in bank overdrafts.
Working capital. We believe that we have sufficient working capital for the foreseeable future.Working capital of the Company as of June 30, 2007 was $(7,016.2) million as compared to working capitalof DPA as of December 31, 2006 of $3,153.9 million, a decrease of $10,170.1 million. Working capital as ofJune 30, 2007 was negative because of the inclusion as current liabilities of (i) a payable of $8,132.7 millionowed by the Company to Port & Free Zone World FZE as consideration for the transfer of DP World FZEand Thunder FZE to the Company and (ii) borrowings of $3.2 billion under the Amended and RestatedCredit Facility. In accordance with IFRS, the payable to Port & Free Zone World FZE was included as acurrent liability, and resulted in a corresponding reduction in working capital as of June 30, 2007, becausewe determined that the payable would likely be satisfied within 12 months. The borrowings under theAmended and Restated Credit Facility were included as current liabilities because such borrowings wererepaid on July 6, 2007 with proceeds from the issuance of the Senior Notes and the Certificates.
Working capital of DPA as of December 31, 2006 was $3,153.9 million as compared to $(1,356.1) million asof December 31, 2005, an increase of $4,510.0 million, or 3.3 times. Working capital as of December 31,2005 was negative because of the inclusion as current liabilities of borrowings of $1,650.8 million under the$1,650.0 million term loan facility used to fund the acquisition of Asia Container Terminals HoldingsLimited and the CSX WT Acquisition. In accordance with IFRS, these borrowings were included ascurrent liabilities and resulted in a corresponding reduction in working capital as of December 31, 2005because the $1,650.0 million term loan facility was repaid on March 23, 2006 with borrowings under the$6,800.0 million term loan facility established in connection with the P&O Acquisition. Accordingly, theincrease in working capital was principally due to the elimination of a significant amount of short-termindebtedness due to the refinancing in 2006, the injection of additional equity and assets classified as heldfor sale.
Working capital of DPA as of December 31, 2005 was $(1,356.1) million as compared to $224.6 million asof December 31, 2004, a decrease of $1,580.7 million. The decrease in working capital was principally dueto the impact of receivables and payables of operations acquired in the CSX WT Acquisition and the earlypayment of the credit facility we incurred in connection with the CSX WT Acquisition as described above.
96
www.global-reports.com
Contractual Obligations
The following table presents DPA’s contractual obligations as of December 31, 2006, all of which weretransferred to the Company.
Payments due by period
Less than More thanTotal 1 year 1-3 years 3-5 years 5 years
(US dollars in thousands)
Long-term debt obligations . . . . . . $ 5,718,038 $ 191,977 $ 342,621 $ 5,051,176 $ 132,264Financial lease obligations . . . . . . . 36,792 4,697 7,824 6,071 18,200Operating lease obligations . . . . . . 3,844,589 280,369 927,652 — 2,636,568Capital expenditure commitments . 123,490 123,490 — — —
Total . . . . . . . . . . . . . . . . . . . . . . $ 9,722,909 $ 600,533 $ 1,278,097 $ 5,057,247 $ 2,787,032
Capital Expenditures
For the six months ended June 30, 2007, the Company made capital expenditures of $294.8 million, ascompared to capital expenditures made by DPA relating to its ports segment of $317.8 million for the sixmonths ended June 30, 2006. For the years ended December 31, 2004, 2005 and 2006, DPA made capitalexpenditures relating to its ports segment of $276.6 million, $320.6 million and $690.0 million, respectively.For the years ended December 31, 2004 and 2005, P&O made capital investments of approximately£140 million and £170 million, respectively, in developing its ports business.
We estimate that capital expenditures in 2007 will total approximately $1.1 billion, of which $294.8 millionhad been spent as of June 30, 2007. We expect to finance our future commitments for capital expenditures,including in respect of our 13 ongoing terminal development projects and 10 ongoing terminal expansionprojects, through dividends and repayments of loans from our subsidiaries, as well as debt financing orequity to the extent necessary. Where available, we intend to finance terminal development and expansionprojects through non-recourse debt at the relevant terminal operating company level. In addition, we mayelect or be required to make additional capital expenditures related to our concessions in the future and,as a result, our future capital expenditures may be significantly higher than the amounts indicated under‘‘—Liquidity and Capital Resources—Contractual Obligations’’ above. In addition, such amounts do notreflect other investments that we may make related to such concessions, or any capital expenditures orother investments that we may make in connection with any concessions that we acquire or are awarded inthe future. We believe that our operating cash flows and borrowing capacity, taken together, provideadequate resources to fund capital expenditures relating to our ongoing operations and future investmentsassociated with the expansion of our business for the foreseeable future. See ‘‘—Factors AffectingFinancial Condition and Results of Operations—Investment in the Development of New Terminals’’above.
Current Trading
Since December 31, 2006, our levels of business activity and growth have continued to develop as expected.For a discussion and analysis of our results of operations for the six months ended June 30, 2007, see‘‘—Company and DPA Historical Results of Operations—Six months ended June 30, 2007 compared to sixmonths ended June 30, 2006’’ above. Since June 30, 2007, we have not increased the number of terminalsin our portfolio and levels of gross throughput have been in line with management’s expectations. In thethird quarter of 2007, we commenced operations at the first phase of the expansion project at DP WorldJebel Ali, which added 2.0 million TEUs of gross capacity.
The trading prospects for the full year ending December 31, 2007 remain in line with our expectations, andmanagement is confident of our prospects for the year. For a discussion of the most significant factors thathave affected, or that we expect will affect, our financial condition and results of operations, see ‘‘—FactorsAffecting Financial Condition and Results of Operations’’ above.
Off-Balance Sheet Arrangements
We do not have any off-balance sheet arrangements that have or are reasonably expected to have amaterial current or future effect on our financial condition, revenues, expenses, results of operations,liquidity, capital expenditures or capital resources.
97
Quantitative and Qualitative Disclosures About Market Risk
Interest Rate Risk
We use interest rate swaps to fix the interest cost on our floating rate borrowings in order to limit theimpact of increases in interest rates. In the medium term, our policy is to maintain between 70% and 100%of borrowings at a fixed rate of interest. In the short term, the level of fixed rate borrowings may move outof the 70% to 100% range, in which case a plan is put in place to move back within this range. Interest rateswaps had a weighted average life of 3.5 years at June 30, 2007. Virtually all of our US dollar-denominatedborrowings as of June 30, 2007 were at fixed rates of interest, either directly or indirectly through swapagreements. As of June 30, 2007, approximately $5.1 billion of our interest bearing loans and borrowings,comprising US dollar, Pound Sterling and Australian and Canadian dollar borrowings, carried interest atfloating rates. A hypothetical 1% change in interest rates on this portion of our interest bearing loans andborrowings would result in a change in our interest expense of approximately $51 million per year. OnJuly 6, 2007, we repaid $3.2 billion of borrowings under the Amended & Restated Credit Facility, whichcarried interest at floating rates, with the net proceeds from the issuances of the Senior Notes and theCertificates, which carry interest at fixed rates.
Credit Risk
We seek to trade only with recognised, creditworthy third parties. It is our policy that all customers whowish to trade on credit terms are subject to credit verification procedures and may be required to submitfinancial guarantees based on their creditworthiness. In addition, receivable balances are monitored on anongoing basis with the result that our exposure to bad debts is not significant.
With respect to credit risk arising from our other financial assets, which comprise cash and cashequivalents and certain derivative instruments, our exposure to credit risk arises from default of thecounterparty, with a maximum exposure equal to the carrying amount of these instruments.
We limit our credit risk with regard to bank deposits by only dealing with reputable banks.
Liquidity Risk
We have cash balances and undrawn committed facilities to provide liquidity as required. As of June 30,2007, committed undrawn facilities totalled $500.0 million. Most of this borrowing capacity was availableunder the revolving credit portion of the Amended and Restated Credit Facility. On October 29, 2007, werepaid in full the amounts outstanding under the Amended and Restated Credit Facility with $1.3 billion inborrowings under the Syndicated Loan Facility. See ‘‘—Liquidity and Capital Resources—Working Capitaland Indebtedness—Revolving Credit Syndicated Facility’’ above for a description of the Syndicated LoanFacility.
Our terms of business require amounts to be paid within 60 days of the provision of the service. Tradepayables are normally settled within 45 days of the date of purchase.
Currency Risk
We have extensive overseas and international business operations and operate in a number of foreigncurrencies, which gives rise to transactional and translational foreign exchange risk. The most importantforeign currencies for us are the Pound Sterling, euro, Hong Kong Dollar, Indian Rupee, Chinese Yuan,Australian Dollar, Korean Won and Dominican Republic Peso. We do not seek to hedge these currencyexposures. In general, our profits and shareholders’ funds benefit if these currencies are strong against theUS dollar.
Translational currency risk
As of June 30, 2007, approximately 71.7% of our assets were denominated in foreign currencies, with theresult that our US dollar consolidated balance sheet, and in particular shareholders’ funds, can besignificantly affected by currency movements when underlying currency balance sheets are retranslated ateach period end rate. We mitigate the effect of such movements by borrowing in the same currencies asthose in which the assets are denominated and using cross-currency swaps. In addition the majority of ouroperating profit for the six months ended June 30, 2007 and the year ended December 31, 2006 wasgenerated by businesses with functional currencies other than, or not pegged to, the US dollar. The resultsof these businesses are translated into US dollars at average exchange rates for the purposes of
98
www.global-reports.com
consolidation. The impact of currency movements on operating profit is mitigated partially by interestcosts being incurred in foreign currencies, partially hedging net profit.
Exchange gains or losses arising on foreign currency investments are taken directly to equity. Most foreigncurrency loans are accounted for as hedges and the exchange arising from retranslating these loans at eachbalance sheet date is taken to equity to the extent that this hedge is deemed to be effective. Where crosscurrency swaps are used to hedge overseas equity investments the movement in the fair value of theinstrument is also taken to equity.
Transactional currency risk
A portion of our businesses generate part of their revenue and incur some costs outside their mainfunctional currency. Due to the diverse number of locations in which we operate there is some naturalhedging that occurs within the Company. When it is considered that currency volatility could have amaterial impact on the results of an operation, hedging, generally up to 12 months using forward contracts,is undertaken to reduce the short term effect of currency movements.
When our businesses enter into capital expenditure or lease commitments in currencies other than theirmain functional currency, these commitments are hedged in most instances using forward contracts andcurrency swaps in order to fix the cost when converted to the functional currency. Forward contracts matchthe expected cash flows of capital and lease commitments.
As well as the direct effect on cash flows, exchange rates also affect our businesses because of their overalleconomic influence. In particular, exchange rates affect international trade flows which impact on ouractivities.
99
INDUSTRY OVERVIEW
Overview
The container terminal industry has grown in line with the growth of the container shipping industry, whichin turn has benefited in particular from the globalisation of world trade. Container shipping was firstintroduced in the 1950s and has expanded rapidly and continuously since that time to emerge as thedominant method for the international transportation of a broad spectrum of industrial and consumergoods, including agricultural products, raw materials and semi-manufactured and finished consumer goods.According to Drewry, global throughput reached 441.3 million TEUs in 2006, up from 236.3 million TEUsin 2000, a compound annual growth rate of 11.0%.
Global seaborne trade consists of three main segments: general cargo, which is carried by conventionalshipping vessels; liquid cargo, which is carried by specialised vessels such as tankers; and containerisedcargo, which is carried by container vessels.
The containerisation of cargo increases the efficiency of its transportation by standardising the containerused for both seaborne and overland transportation of cargo. This facilitates the integrated multi-modaltransportation of cargo by sea, rail and road. Containerisation also allows for the efficient storage of goodson ships or on land, provides protection against damage to goods in transit, increases the security of thecargo during transport and enables faster loading and unloading of cargo.
Industry Demand
Global container terminal throughput has historically grown at a multiple of approximately four times thatof global gross domestic product (‘‘GDP’’), which reflects the important relationship noted above betweencontainerisation and globalisation.
World Trade in Goods
Between 1990 and 2006, global GDP grew by an average of 2.9% per annum, while the world trade ingoods grew by an average of 8.2% per annum, which equates to a multiple of growth in world trade ingoods over growth in global GDP of 2.9 times for the period. Factors that have influenced this trendinclude: (i) overall reductions in the costs of trade; (ii) productivity growth in the tradable goods sector and(iii) global increases in per capita income.
Costs of Trade
Over the past 20 years, frictional costs associated with global trade, including transportation,communication and search costs, tariff and non-tariff-related trade barriers and foreign exchangetransaction costs and risks, have decreased significantly. In particular, advances in technology have greatlyimproved the amount and quality of available market information, while decreasing the costs oftransportation through the implementation of more efficient processes. Similarly, the widespread adoptionof increasingly liberal trade policies, as evidenced by the execution of successive multilateral and bilateraltrade agreements globally, coupled with larger and more liquid capital markets have reduced government-imposed and transaction costs relating to international trade and created the ability to hedge moreeffectively against foreign exchange risk.
As the costs of trade fall, specialization becomes more profitable as labour, capital, technology andresources can be sourced on a global, and increasingly efficient, basis. This trend generally results inincreases in levels of both inter and intra-industry trade and has largely been reflected in the systemic shiftin global manufacturing capacity and output from west to east, especially towards China.
Productivity in the Tradable Goods Sector
Productivity has historically been higher in the tradable goods sector than in the non-tradable goods sector,largely because the latter tends to be more labour-intensive and restricted to national labour markets thanis the case for the former. Consequently, the prices of non-tradable goods are generally higher, and havebeen increasing, relative to those of tradable goods, most notably in counties that have higher averagewages. This trend has resulted in an increase in the global consumption of tradable goods relative to that ofnon-tradable goods. In addition, reductions in the costs of trade of the sort referred to above haveincreased the number of goods that constitute tradable goods and, accordingly, the proportion of GDPrepresented by the production of tradable goods.
100
www.global-reports.com
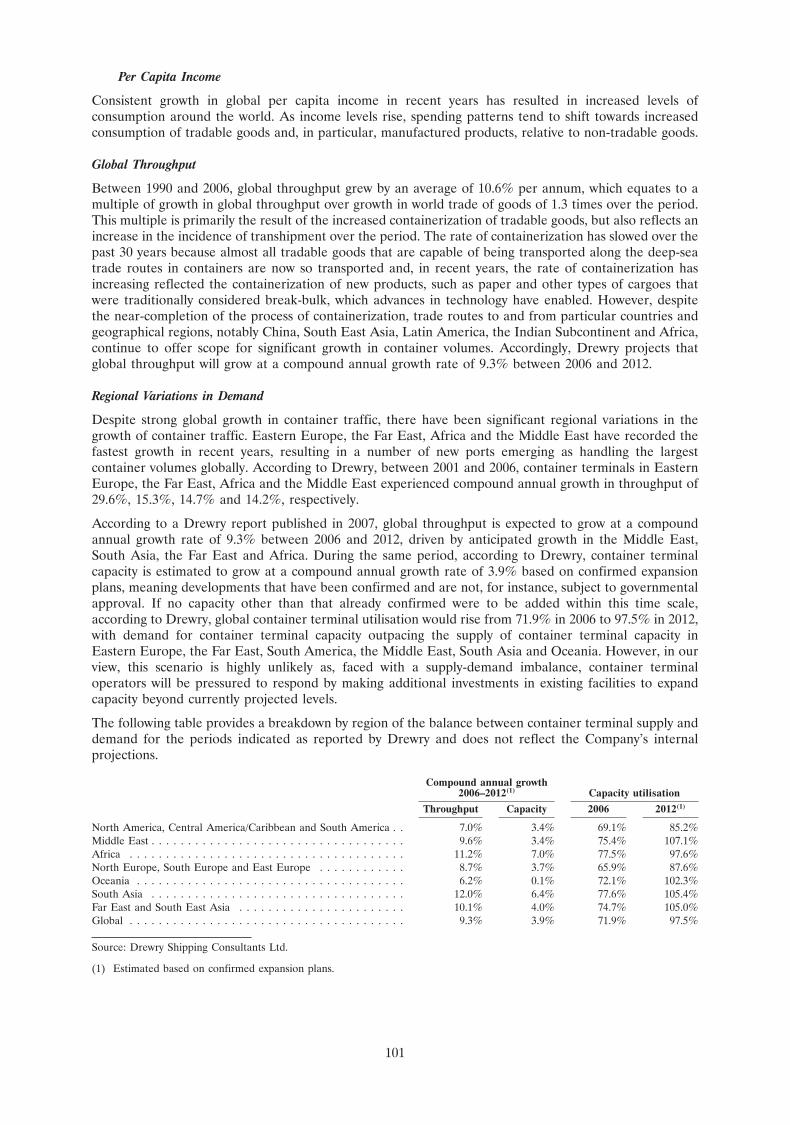
Per Capita Income
Consistent growth in global per capita income in recent years has resulted in increased levels ofconsumption around the world. As income levels rise, spending patterns tend to shift towards increasedconsumption of tradable goods and, in particular, manufactured products, relative to non-tradable goods.
Global Throughput
Between 1990 and 2006, global throughput grew by an average of 10.6% per annum, which equates to amultiple of growth in global throughput over growth in world trade of goods of 1.3 times over the period.This multiple is primarily the result of the increased containerization of tradable goods, but also reflects anincrease in the incidence of transhipment over the period. The rate of containerization has slowed over thepast 30 years because almost all tradable goods that are capable of being transported along the deep-seatrade routes in containers are now so transported and, in recent years, the rate of containerization hasincreasing reflected the containerization of new products, such as paper and other types of cargoes thatwere traditionally considered break-bulk, which advances in technology have enabled. However, despitethe near-completion of the process of containerization, trade routes to and from particular countries andgeographical regions, notably China, South East Asia, Latin America, the Indian Subcontinent and Africa,continue to offer scope for significant growth in container volumes. Accordingly, Drewry projects thatglobal throughput will grow at a compound annual growth rate of 9.3% between 2006 and 2012.
Regional Variations in Demand
Despite strong global growth in container traffic, there have been significant regional variations in thegrowth of container traffic. Eastern Europe, the Far East, Africa and the Middle East have recorded thefastest growth in recent years, resulting in a number of new ports emerging as handling the largestcontainer volumes globally. According to Drewry, between 2001 and 2006, container terminals in EasternEurope, the Far East, Africa and the Middle East experienced compound annual growth in throughput of29.6%, 15.3%, 14.7% and 14.2%, respectively.
According to a Drewry report published in 2007, global throughput is expected to grow at a compoundannual growth rate of 9.3% between 2006 and 2012, driven by anticipated growth in the Middle East,South Asia, the Far East and Africa. During the same period, according to Drewry, container terminalcapacity is estimated to grow at a compound annual growth rate of 3.9% based on confirmed expansionplans, meaning developments that have been confirmed and are not, for instance, subject to governmentalapproval. If no capacity other than that already confirmed were to be added within this time scale,according to Drewry, global container terminal utilisation would rise from 71.9% in 2006 to 97.5% in 2012,with demand for container terminal capacity outpacing the supply of container terminal capacity inEastern Europe, the Far East, South America, the Middle East, South Asia and Oceania. However, in ourview, this scenario is highly unlikely as, faced with a supply-demand imbalance, container terminaloperators will be pressured to respond by making additional investments in existing facilities to expandcapacity beyond currently projected levels.
The following table provides a breakdown by region of the balance between container terminal supply anddemand for the periods indicated as reported by Drewry and does not reflect the Company’s internalprojections.
Compound annual growth2006–2012(1) Capacity utilisation
Throughput Capacity 2006 2012(1)
North America, Central America/Caribbean and South America . . 7.0% 3.4% 69.1% 85.2%Middle East . . . . . . . . . . . . . . . . . . . . . . . . . . . . . . . . . . . 9.6% 3.4% 75.4% 107.1%Africa . . . . . . . . . . . . . . . . . . . . . . . . . . . . . . . . . . . . . . 11.2% 7.0% 77.5% 97.6%North Europe, South Europe and East Europe . . . . . . . . . . . . 8.7% 3.7% 65.9% 87.6%Oceania . . . . . . . . . . . . . . . . . . . . . . . . . . . . . . . . . . . . . 6.2% 0.1% 72.1% 102.3%South Asia . . . . . . . . . . . . . . . . . . . . . . . . . . . . . . . . . . . 12.0% 6.4% 77.6% 105.4%Far East and South East Asia . . . . . . . . . . . . . . . . . . . . . . . 10.1% 4.0% 74.7% 105.0%Global . . . . . . . . . . . . . . . . . . . . . . . . . . . . . . . . . . . . . . 9.3% 3.9% 71.9% 97.5%
Source: Drewry Shipping Consultants Ltd.
(1) Estimated based on confirmed expansion plans.
101
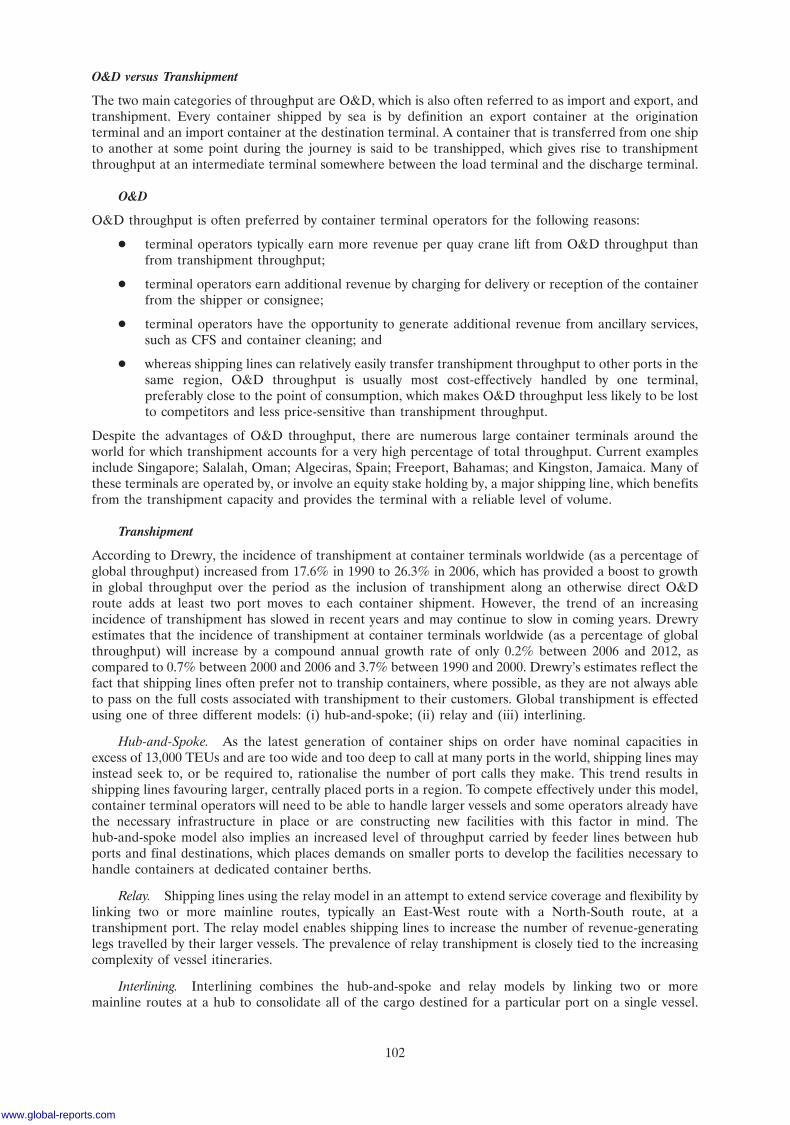
O&D versus Transhipment
The two main categories of throughput are O&D, which is also often referred to as import and export, andtranshipment. Every container shipped by sea is by definition an export container at the originationterminal and an import container at the destination terminal. A container that is transferred from one shipto another at some point during the journey is said to be transhipped, which gives rise to transhipmentthroughput at an intermediate terminal somewhere between the load terminal and the discharge terminal.
O&D
O&D throughput is often preferred by container terminal operators for the following reasons:
� terminal operators typically earn more revenue per quay crane lift from O&D throughput thanfrom transhipment throughput;
� terminal operators earn additional revenue by charging for delivery or reception of the containerfrom the shipper or consignee;
� terminal operators have the opportunity to generate additional revenue from ancillary services,such as CFS and container cleaning; and
� whereas shipping lines can relatively easily transfer transhipment throughput to other ports in thesame region, O&D throughput is usually most cost-effectively handled by one terminal,preferably close to the point of consumption, which makes O&D throughput less likely to be lostto competitors and less price-sensitive than transhipment throughput.
Despite the advantages of O&D throughput, there are numerous large container terminals around theworld for which transhipment accounts for a very high percentage of total throughput. Current examplesinclude Singapore; Salalah, Oman; Algeciras, Spain; Freeport, Bahamas; and Kingston, Jamaica. Many ofthese terminals are operated by, or involve an equity stake holding by, a major shipping line, which benefitsfrom the transhipment capacity and provides the terminal with a reliable level of volume.
Transhipment
According to Drewry, the incidence of transhipment at container terminals worldwide (as a percentage ofglobal throughput) increased from 17.6% in 1990 to 26.3% in 2006, which has provided a boost to growthin global throughput over the period as the inclusion of transhipment along an otherwise direct O&Droute adds at least two port moves to each container shipment. However, the trend of an increasingincidence of transhipment has slowed in recent years and may continue to slow in coming years. Drewryestimates that the incidence of transhipment at container terminals worldwide (as a percentage of globalthroughput) will increase by a compound annual growth rate of only 0.2% between 2006 and 2012, ascompared to 0.7% between 2000 and 2006 and 3.7% between 1990 and 2000. Drewry’s estimates reflect thefact that shipping lines often prefer not to tranship containers, where possible, as they are not always ableto pass on the full costs associated with transhipment to their customers. Global transhipment is effectedusing one of three different models: (i) hub-and-spoke; (ii) relay and (iii) interlining.
Hub-and-Spoke. As the latest generation of container ships on order have nominal capacities inexcess of 13,000 TEUs and are too wide and too deep to call at many ports in the world, shipping lines mayinstead seek to, or be required to, rationalise the number of port calls they make. This trend results inshipping lines favouring larger, centrally placed ports in a region. To compete effectively under this model,container terminal operators will need to be able to handle larger vessels and some operators already havethe necessary infrastructure in place or are constructing new facilities with this factor in mind. Thehub-and-spoke model also implies an increased level of throughput carried by feeder lines between hubports and final destinations, which places demands on smaller ports to develop the facilities necessary tohandle containers at dedicated container berths.
Relay. Shipping lines using the relay model in an attempt to extend service coverage and flexibility bylinking two or more mainline routes, typically an East-West route with a North-South route, at atranshipment port. The relay model enables shipping lines to increase the number of revenue-generatinglegs travelled by their larger vessels. The prevalence of relay transhipment is closely tied to the increasingcomplexity of vessel itineraries.
Interlining. Interlining combines the hub-and-spoke and relay models by linking two or moremainline routes at a hub to consolidate all of the cargo destined for a particular port on a single vessel.
102
www.global-reports.com
Interlining enables each vessel to minimise the number of port calls, while increasing the number of portscovered by a shipping line’s routes. Because it incorporates the relay model, the prevalence of interlining isalso closely tied to the number and complexity of vessel itineraries.
Leading Container Terminal Operators
The container terminal industry is characterised by a small number of large operators, the four largest ofwhich collectively accounted for 44.1% of global gross capacity as of December 31, 2006 and 45.8% ofglobal gross throughput for the year ended December 31, 2006. Global terminal operators competeincreasingly based on the size and diversification of their terminal portfolios, which enable them to offerglobal networks to their liner customers, who are themselves consolidating and becoming increasinglylarge. Consequently, new container terminal market participants face significant barriers to entry.
The following table provides a breakdown of terminal operators by gross throughput and equity-adjustedthroughput for the years ended December 31, 2005 and 2006.
Gross throughput(1) Equity-adjusted throughput(2)
2005 2006 2005 2006
(TEUs in millions, except percentages)Hutchison Port Holdings . . . . . . . . . . . . . . . . . . . . . . . 51.8 60.9 33.2 30.8APM Terminals(3) . . . . . . . . . . . . . . . . . . . . . . . . . . . . 41.3 52.0 24.8 32.4PSA International(4) . . . . . . . . . . . . . . . . . . . . . . . . . . 40.3 47.4 32.4 41.2DP World(5)(6) . . . . . . . . . . . . . . . . . . . . . . . . . . . . . . 35.1 41.6 22.7 26.2Cosco(7) . . . . . . . . . . . . . . . . . . . . . . . . . . . . . . . . . . 14.7 22.0 5.9 7.9Eurogate . . . . . . . . . . . . . . . . . . . . . . . . . . . . . . . . . 11.2 11.7 6.3 6.6Evergreen . . . . . . . . . . . . . . . . . . . . . . . . . . . . . . . . . 8.7 9.4 6.6 8.1MSC . . . . . . . . . . . . . . . . . . . . . . . . . . . . . . . . . . . . 7.8 8.8 3.5 4.0SSA Marine(8) . . . . . . . . . . . . . . . . . . . . . . . . . . . . . . 7.3 7.6 5.4 4.5HHLA . . . . . . . . . . . . . . . . . . . . . . . . . . . . . . . . . . . 6.0 6.6 5.3 6.0
Ten largest terminal operators(9) . . . . . . . . . . . . . . . . . . . 224.2 268.0 146.1 167.7Remaining terminal operators . . . . . . . . . . . . . . . . . . . . 174.1 173.3 252.2 273.6
Total . . . . . . . . . . . . . . . . . . . . . . . . . . . . . . . . . . . 398.3 441.3 398.3 441.3
Source: Drewry Shipping Consultants Ltd.
(1) Figures include throughput for all terminals in which 10% or more shareholding was held as of December 31, 2005 or 2006 (asapplicable).
(2) Equity-adjusted throughput is determined by multiplying the gross throughput of a particular container terminal by the relevantterminal operator’s economic interest in such terminal.
(3) Includes gross throughput and equity-adjusted throughput of 2.5 million TEUs and 0.7 million TEUs, respectively, for 2005handled by P&O Nedlloyd.
(4) PSA acquired 20% of HPH in 2006.
(5) Figures as reported by Drewry.
(6) Includes gross throughput and equity-adjusted throughput of 23.8 million TEUs and 12.8 million TEUs, respectively, for 2005handled by P&O Ports.
(7) Includes Cosco Container Lines and Cosco Pacific.
(8) 49% of SSA Marine sold to Goldman Sachs during 2007.
(9) Represents ten largest terminal operators by gross throughput in 2006.
Drewry divides global terminal operators into three broad categories:
� Global stevedores—these are companies whose primary business is port operations and that viewterminals as profit centres;
� Global carriers—these are companies whose main business is container shipping, but which haveinvestments in container terminals to support this core activity and that often run terminals ascost centres; and
103
� Global hybrids—these are companies where the main activity, or that of the parent group, iscontainer shipping, but which have established separate terminal operating business units thathandle a significant amount of third-party business, as well as in-house traffic.
Of the top ten largest terminal operators by gross throughput, Drewry considers six to be global stevedores(comprised of Hutchison Port Holdings, PSA International, Eurogate, SSA Marine, HHLA and us); two tobe global carriers (comprised of Evergreen and MSC); and two to be global hybrids (comprised of APMTerminals and Cosco).
As a result of merger & acquisition activity in North America and Europe, industry experts have suggestedthe emergence of a fourth category of terminal owner/operator: infrastructure investors. Recent examplescited in support of this notion include:
� the acquisition of 49% of SSA Marine by Goldman Sachs in the second half of 2007;
� the acquisition by RREEF Infrastructure, the real estate arm of Deutsche Bank, of MaherTerminals, which operates terminal facilities in Port Elizabeth, New Jersey and Prince Rupert,British Columbia, in the second half of 2007;
� the acquisition by AIG Global Investment Group of San Francisco-based Marine Terminals in thesecond half of 2007;
� our sale of POPNA to a wholly-owned subsidiary of AIG Global Investment Group in the firsthalf of 2007;
� the acquisition of 80% of Montreal Gateway Terminals by Morgan Stanley from TUI AG, aGerman tourism and shipping company, in the first half of 2007;
� the acquisition by Macquarie Infrastructure Partners of Halterm Limited, which operates aterminal in Halifax, Nova Scotia, in the second half of 2006;
� the acquisition by Ontario Teachers Pension Fund of OOCL’s interests in terminals in Vancouver,British Columbia; Staten Island, New York; and Bayonne, New Jersey, in the second half of 2006;
� the acquisition of Associated British Ports by Admiral Acquisitions UK, a consortium comprisedof Goldman Sachs, Canada’s Borealis Infrastructure Management, Singapore’s GIC SpecialInvestments and Prudential, in the second half of 2006; and
� the acquisition by Babcock & Brown Infrastructure of PD Ports plc, which operates Teesport inthe United Kingdom, in the first half of 2006.
Home Ports
Several of the global stevedores have a ‘‘home port’’ that has traditionally accounted for a large percentageof their total throughput. While the relative significance of the home port business has steadily diminishedfor most of these stevedores in recent years, there were three exceptions for whom the home port’s shareincreased in 2006: HHLA, whose home port of Hamburg, Germany accounted for 86.8% of its totalthroughput for 2006, up from 84.4% for 2005; Eurogate, whose home port of Bremerhaven, Germanyaccounted for 35.3% of its total throughput for 2006, up from 30.7% for 2005; and SSA Marine, whosehome port of Seattle, Washington accounted for 13.7% of its total throughput, up from 12.3% for 2005.Among the top four terminal operators by gross throughput, PSA International had the highest share oftotal throughput accounted for by a home port business. PSA International’s home port of Singaporeaccounted for 48.8% of its total throughput for 2006, although this is down from 54.1% and 60.5% for 2005and 2004, respectively.
Industry Supply
The container terminal industry faces high barriers to entry. Principal factors affecting capacity in thecontainer terminal industry include:
� government restrictions and/or prohibitions on the development of private terminals on freeholdland;
104
www.global-reports.com
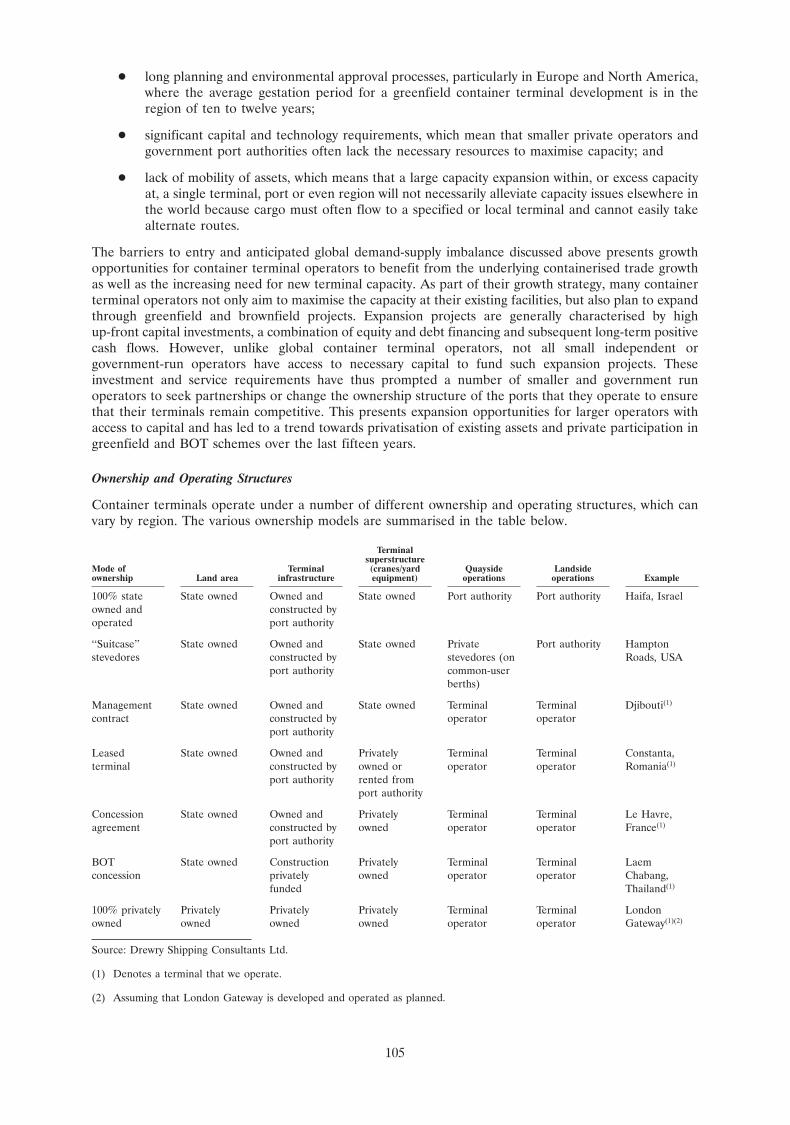
� long planning and environmental approval processes, particularly in Europe and North America,where the average gestation period for a greenfield container terminal development is in theregion of ten to twelve years;
� significant capital and technology requirements, which mean that smaller private operators andgovernment port authorities often lack the necessary resources to maximise capacity; and
� lack of mobility of assets, which means that a large capacity expansion within, or excess capacityat, a single terminal, port or even region will not necessarily alleviate capacity issues elsewhere inthe world because cargo must often flow to a specified or local terminal and cannot easily takealternate routes.
The barriers to entry and anticipated global demand-supply imbalance discussed above presents growthopportunities for container terminal operators to benefit from the underlying containerised trade growthas well as the increasing need for new terminal capacity. As part of their growth strategy, many containerterminal operators not only aim to maximise the capacity at their existing facilities, but also plan to expandthrough greenfield and brownfield projects. Expansion projects are generally characterised by highup-front capital investments, a combination of equity and debt financing and subsequent long-term positivecash flows. However, unlike global container terminal operators, not all small independent orgovernment-run operators have access to necessary capital to fund such expansion projects. Theseinvestment and service requirements have thus prompted a number of smaller and government runoperators to seek partnerships or change the ownership structure of the ports that they operate to ensurethat their terminals remain competitive. This presents expansion opportunities for larger operators withaccess to capital and has led to a trend towards privatisation of existing assets and private participation ingreenfield and BOT schemes over the last fifteen years.
Ownership and Operating Structures
Container terminals operate under a number of different ownership and operating structures, which canvary by region. The various ownership models are summarised in the table below.
Terminalsuperstructure
Mode of Terminal (cranes/yard Quayside Landsideownership Land area infrastructure equipment) operations operations Example
100% state State owned Owned and State owned Port authority Port authority Haifa, Israelowned and constructed byoperated port authority
‘‘Suitcase’’ State owned Owned and State owned Private Port authority Hamptonstevedores constructed by stevedores (on Roads, USA
port authority common-userberths)
Management State owned Owned and State owned Terminal Terminal Djibouti(1)
contract constructed by operator operatorport authority
Leased State owned Owned and Privately Terminal Terminal Constanta,terminal constructed by owned or operator operator Romania(1)
port authority rented fromport authority
Concession State owned Owned and Privately Terminal Terminal Le Havre,agreement constructed by owned operator operator France(1)
port authority
BOT State owned Construction Privately Terminal Terminal Laemconcession privately owned operator operator Chabang,
funded Thailand(1)
100% privately Privately Privately Privately Terminal Terminal Londonowned owned owned owned operator operator Gateway(1)(2)
Source: Drewry Shipping Consultants Ltd.
(1) Denotes a terminal that we operate.
(2) Assuming that London Gateway is developed and operated as planned.
105
A large number of countries around the world still operate under the state-owned model, whereby the portland remains the property of the state and an operator has varying degrees of rights and obligations. In theUnited Kingdom, most container terminals are 100% privately owned, although this is a relatively rarestructure. Conversely, in the United States, container terminal operators will usually lease the terminalinfrastructure and equipment from the state.
Concession agreements have traditionally been used in developed economies, but in recent years havestarted to be used as a privatisation vehicle for emerging economies. Typical concession terms include:royalty fees as a percentage of revenue and/or volume; up-front payment and/or commitment to makecapital expenditure; nominal rent per hectare or per metre; and 25 to 50 year duration.
Due to the typical length of concession agreements and the recent proliferation of their use, factorsinfluencing concession renewal are likely to become more apparent in the future. Based on our experience,we would expect that incumbent operators will typically be granted concession renewal, often because itcan be costly, both administratively and due to initial inexperience or inefficiency of a new operator, for aport owner to switch operators.
The trend towards privatisation and BOT schemes discussed above has been driven largely by governmentsattempting to fund much-needed container port development projects in order to improve the tradecompetitiveness of their respective countries. Drewry estimates that the proportion of global throughputhandled at state-run terminals, other than those controlled by global terminal operators with a state as thecontrolling shareholder, has declined from approximately 42% in 1993 to 19.2% in 2006. Privatisation andBOT initiatives are aimed specifically at expanding quay length and yard area to increase throughputcapacity, increasing port efficiency by adding container handling equipment and implementingtechnological improvements.
Recent privatisations include:
� the winning of concessions by Hutchison Port Holdings and PSA International to operate theTurkish ports of Izmir and Mersin, respectively;
� the winning of concessions by APM Terminals to operate Apapa Container Terminal in Nigeriaand Khalifa bin Salman Port in Bahrain;
� our winning of the concession to develop and operate the existing container terminal in the Portof Dakar, Senegal and invest in a new terminal at the Port; and
� the winning of concessions by ICTSI to operate Tartous Container Terminal in Syria and the Portof Guayaquil in Equador.
Recent BOT schemes include:
� APM Terminals projects in Portsmouth, Virginia and Mobile, Texas;
� our terminal development projects in Rotterdam, Netherlands and Ho Chi Minh City, Vietnam;and
� the joint Eurogate/APM Terminals project in Wilhemshaven, Germany.
Revenue and Cost Structures
Revenue and cost structures are typically similar among container terminal operators using similaroperating models.
The following revenue streams are often generated by companies operating container terminals:
� lift-on/lift-off tariff for lifting containers on and off the vessel, usually charged on a per-containerbasis, sometimes with variation between 20-foot and 40-foot containers, and between full andempty containers;
� storage of containers, typically on a per TEU per day basis, although a number of free days ofstorage are usually included as part of the lift-on/lift-off tariff;
� delivery and reception fees to and from the consignee’s or shipper’s truck, rail, or barge;
106
www.global-reports.com
� electricity and monitoring charges for refrigerated containers while being stored;
� removal and replacement of ship hatchcovers;
� re-stowing of containers on board a ship;
� cleaning of empty containers; and
� stuffing and unstuffing of containerised cargo into a warehouse.
In a typical container terminal operation, the core services of lift-on/lift-off, storage and delivery orreception are the key drivers of revenue, with ancillary services of varying prevalence and importancemaking up the balance.
The typical cost structure of a container terminal includes:
� land rent and/or concession fees payable to the relevant port authority;
� labour costs for management, supervision, administration and stevedoring;
� electricity and/or diesel fuel for operating equipment;
� depreciation on civil works, as appropriate, and equipment, such as quay cranes and yard cranes;and
� interest payments for debt servicing.
In developing economies, electricity and fuel costs tend to be the largest single cost item, whereas inEurope and North America, the labour cost is typically the single largest operating cost and may have agreater fixed cost element than in a developing economy.
In general, the container terminal industry does not face stringent price regulation. However, in certainjurisdictions, the relevant port authority or central regulatory body will impose tariffs that set the maximumrates that a terminal operator may charge. For example, all of our current operations in India, with theexception of our operations at Mundra International Container Terminal, fall within the purview of theIndian Tariff Authority for Major Ports (‘‘TAMP’’), which regulates tariffs at such operations. See ‘‘RiskFactors—Risks Relating to our Ports Business—We are subject to a wide variety of regulations and mayface substantial liability if we fail to comply with existing or future regulations applicable to ourbusinesses’’.
Customers
The main customers of container terminal operators are container shipping lines, which transportcontainerised cargo in container vessels between ports. Container shipping lines and, consequently,container terminal operators are highly dependent on the levels of world seaborne trade and thecorresponding demand for container terminal services that such levels generate. According to Drewry,global container trade volume reached 128.3 million TEUs in 2006, up from 92.1 million TEUs in 2003, acompound annual growth rate of 11.7%. Container trade volume relates to trade rather than throughputand excludes, among other things, the handling of empty containers and transhipments.
107
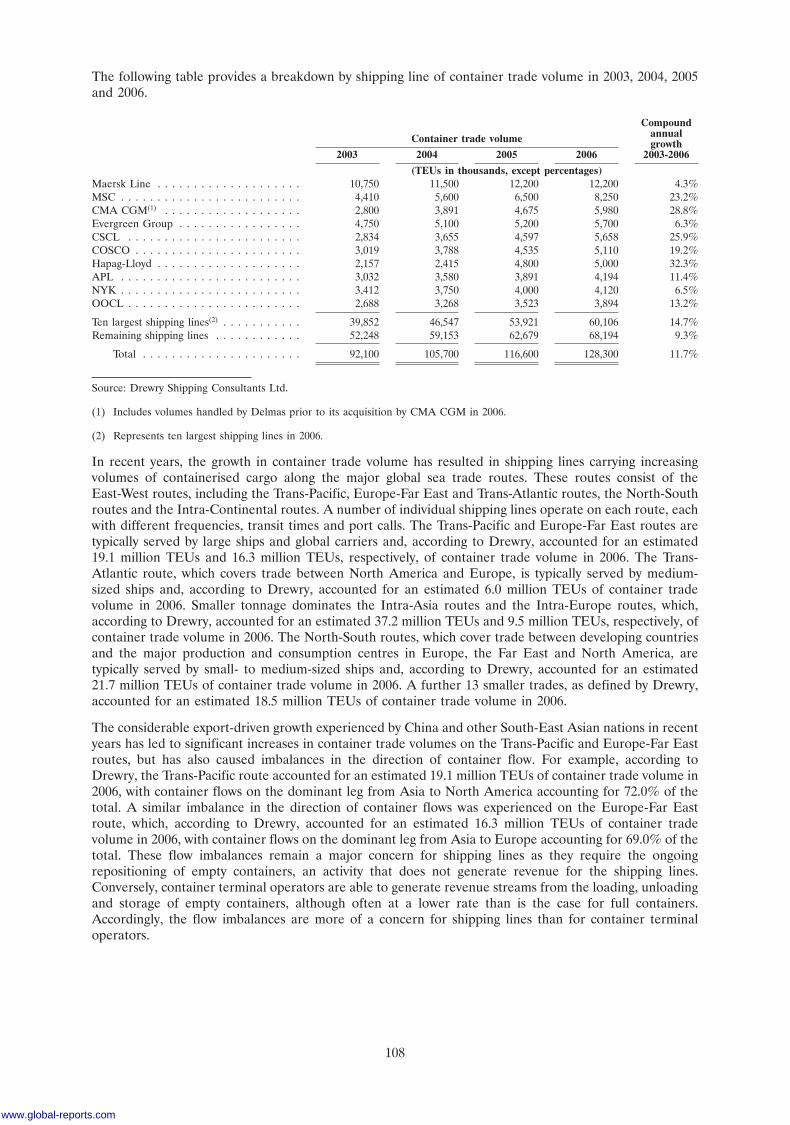
The following table provides a breakdown by shipping line of container trade volume in 2003, 2004, 2005and 2006.
CompoundannualContainer trade volume growth
2003 2004 2005 2006 2003-2006
(TEUs in thousands, except percentages)Maersk Line . . . . . . . . . . . . . . . . . . . . 10,750 11,500 12,200 12,200 4.3%MSC . . . . . . . . . . . . . . . . . . . . . . . . . 4,410 5,600 6,500 8,250 23.2%CMA CGM(1) . . . . . . . . . . . . . . . . . . . 2,800 3,891 4,675 5,980 28.8%Evergreen Group . . . . . . . . . . . . . . . . . 4,750 5,100 5,200 5,700 6.3%CSCL . . . . . . . . . . . . . . . . . . . . . . . . 2,834 3,655 4,597 5,658 25.9%COSCO . . . . . . . . . . . . . . . . . . . . . . . 3,019 3,788 4,535 5,110 19.2%Hapag-Lloyd . . . . . . . . . . . . . . . . . . . . 2,157 2,415 4,800 5,000 32.3%APL . . . . . . . . . . . . . . . . . . . . . . . . . 3,032 3,580 3,891 4,194 11.4%NYK . . . . . . . . . . . . . . . . . . . . . . . . . 3,412 3,750 4,000 4,120 6.5%OOCL . . . . . . . . . . . . . . . . . . . . . . . . 2,688 3,268 3,523 3,894 13.2%
Ten largest shipping lines(2) . . . . . . . . . . . 39,852 46,547 53,921 60,106 14.7%Remaining shipping lines . . . . . . . . . . . . 52,248 59,153 62,679 68,194 9.3%
Total . . . . . . . . . . . . . . . . . . . . . . 92,100 105,700 116,600 128,300 11.7%
Source: Drewry Shipping Consultants Ltd.
(1) Includes volumes handled by Delmas prior to its acquisition by CMA CGM in 2006.
(2) Represents ten largest shipping lines in 2006.
In recent years, the growth in container trade volume has resulted in shipping lines carrying increasingvolumes of containerised cargo along the major global sea trade routes. These routes consist of theEast-West routes, including the Trans-Pacific, Europe-Far East and Trans-Atlantic routes, the North-Southroutes and the Intra-Continental routes. A number of individual shipping lines operate on each route, eachwith different frequencies, transit times and port calls. The Trans-Pacific and Europe-Far East routes aretypically served by large ships and global carriers and, according to Drewry, accounted for an estimated19.1 million TEUs and 16.3 million TEUs, respectively, of container trade volume in 2006. The Trans-Atlantic route, which covers trade between North America and Europe, is typically served by medium-sized ships and, according to Drewry, accounted for an estimated 6.0 million TEUs of container tradevolume in 2006. Smaller tonnage dominates the Intra-Asia routes and the Intra-Europe routes, which,according to Drewry, accounted for an estimated 37.2 million TEUs and 9.5 million TEUs, respectively, ofcontainer trade volume in 2006. The North-South routes, which cover trade between developing countriesand the major production and consumption centres in Europe, the Far East and North America, aretypically served by small- to medium-sized ships and, according to Drewry, accounted for an estimated21.7 million TEUs of container trade volume in 2006. A further 13 smaller trades, as defined by Drewry,accounted for an estimated 18.5 million TEUs of container trade volume in 2006.
The considerable export-driven growth experienced by China and other South-East Asian nations in recentyears has led to significant increases in container trade volumes on the Trans-Pacific and Europe-Far Eastroutes, but has also caused imbalances in the direction of container flow. For example, according toDrewry, the Trans-Pacific route accounted for an estimated 19.1 million TEUs of container trade volume in2006, with container flows on the dominant leg from Asia to North America accounting for 72.0% of thetotal. A similar imbalance in the direction of container flows was experienced on the Europe-Far Eastroute, which, according to Drewry, accounted for an estimated 16.3 million TEUs of container tradevolume in 2006, with container flows on the dominant leg from Asia to Europe accounting for 69.0% of thetotal. These flow imbalances remain a major concern for shipping lines as they require the ongoingrepositioning of empty containers, an activity that does not generate revenue for the shipping lines.Conversely, container terminal operators are able to generate revenue streams from the loading, unloadingand storage of empty containers, although often at a lower rate than is the case for full containers.Accordingly, the flow imbalances are more of a concern for shipping lines than for container terminaloperators.
108
www.global-reports.com
Trend towards Bigger Ships
Increasing containerisation of cargoes has also resulted in the construction of larger container vessels.These larger vessels benefit from lower operating and voyage unit costs, such as fuel, port and canal fees,manning, repairs, insurance and ship management costs. According to Drewry, the average size ofcontainer vessels in the global container fleet increased from 1,824 TEUs in 2000 to 2,377 TEUs in 2006and vessels of 5,000 TEUs or more represented 35.4% of total global fleet capacity as of July 2007. Drewryprojects that this will increase to 43.7% of total fleet capacity by July 2011. This trend is also reflected inthe composition of the container ship order book. According to Drewry, the total capacity of vessels onorder to be delivered through 2011 constitutes 52.7% of existing fleet capacity as of July 2007. 59.2% ofthis new capacity will be available on vessels of 5,000 TEUs or more.
The shift to larger vessels has been particularly prominent on the Europe-Far East and Trans-Pacificroutes, which traditionally exhibit some of the most intense volume and competitive pressures in thecontainer shipping line industry. The increasing number of relatively large ships puts pressure on containerterminal operators to offer facilities with deepwater access and to develop sophisticated shipping andport-related equipment and technology to meet the demands of these larger vessels. Only a handful ofterminal operators can compete globally with such ongoing investment needs. This has resulted in a selectgroup of four, including us, who are moving steadily ahead of other operators as this barrier to entry in theindustry becomes an increasingly significant factor.
Consolidation of Shipping Lines
The container shipping industry remains highly fragmented and very competitive, with over 400 linercompanies operating in the international container shipping market. In recent years, however, thecontainer shipping industry has experienced significant consolidation as the major shipping lines seek tocapitalise on economies of scale and enhance their global presence. It is expected that the share ofcontainer trade volume carried by the top ten global container shipping lines will continue to increase,from 46.2% and 46.8% in 2005 and 2006, respectively, as major shipping lines continue to consolidate bothfor these reasons and also because of the excess of capacity over demand that is anticipated in the shippingline industry over the next few years. In addition to consolidation through mergers and acquisitions,shipping lines have entered into various forms of intra-industry cooperation, including liner alliancesdesigned to increase frequency on certain routes and broaden geographic coverage, as well by agreeing tovessel sharing and swap and slot purchase arrangements. As of December 31, 2006, five of the top tencontainer shipping lines, namely Hapag-Lloyd, Cosco, NYK, APL and OOCL, were members of lineralliances. This trend towards consolidation and intra-industry cooperation has placed pressure oncontainer terminal operators to pursue similar forms of consolidation to meet the needs of shipping linesand to maintain bargaining power when dealing with larger customers.
109
BUSINESS
Overview
We are one of the largest container terminal operators in the world by capacity and throughput. We arealso one of the most geographically diversified container terminal operators in the world. Our 42 containerterminals, which span 22 countries, had a gross capacity of approximately 48.6 million TEUs as ofDecember 31, 2006 and generated gross throughput of 36.8 million TEUs (of which approximately 76%was O&D throughput) and 20.3 million TEUs for the year ended December 31, 2006 and the six monthsended June 30, 2007, respectively (in each case, excluding the six container terminals operated by POPNA,the two Shekou Terminals and the one Colombo Terminal). For the year ended December 31, 2006 and thesix months ended June 30, 2007, we generated pro forma revenue from operations (which does not includerevenue attributable to our joint ventures and associates) of $2,076.0 million and $1,209.0 million,respectively, and pro forma Adjusted EBITDA of $705.3 million and $453.7 million, respectively.
The creation of the Company represents an important step in the development of a global containerterminal business designed to serve the needs of a global and consolidating customer base. As a result ofthe winning of new concessions and our acquisitions of CSX WT in February 2005 and P&O in March2006, our business has been transformed from one focused principally on container terminal operationslocated primarily in the UAE to a truly global container terminal business, reporting across the followingthree regions:
Middle East, Europe and Africa
� UAE—Our UAE operating region is at the core of our portfolio and is comprised of fouroperating terminals. In addition, the first phase of our expansion project at DP World Jebel Ali,which has been designed to add 5.0 million TEUs of capacity when fully developed, commencedoperations in the third quarter of 2007. We also have a development project in Abu Dhabi (whichwill replace our existing operations at Mina Zayed (Abu Dhabi). Our operations in the regionaccounted for 9.2 million TEUs (or 25.0%) and 5.1 million TEUs (or 25.3%) of our grossthroughput for the year ended December 31, 2006 and the six months ended June 30, 2007,respectively.
� Middle East (excluding UAE)—We currently have one operating terminal in this region. Ouroperations in the region accounted for 1.5 million TEUs (or 4.1%) and 0.7 million TEUs (or3.6%) of our gross throughput for the year ended December 31, 2006 and the six months endedJune 30, 2007, respectively.
� Europe and North Africa—In Europe, we operate ten terminals in five countries. In addition, wehave development projects in the United Kingdom, Turkey, France and the Netherlands. We alsohave a recent concession win and a development project in Dakar, Senegal. Our operations in theregion accounted for 6.1 million TEUs (or 16.6%) and 3.5 million TEUs (or 17.2%) of our grossthroughput for the year ended December 31, 2006 and the six months ended June 30, 2007,respectively.
� Africa—We currently have two operating terminals in this region, with a third terminal underconstruction in Doraleh, Djibouti (which will replace our existing terminal in Djibouti).Additionally, we operate general and bulk cargo stevedoring in all five of South Africa’s state-owned ports. Our operations in the region accounted for 0.3 million TEUs (or 0.8%) and0.2 million TEUs (or 0.8%) of our gross throughput for the year ended December 31, 2006 andthe six months ended June 30, 2007, respectively.
Asia-Pacific and Indian Subcontinent
� Asia-Pacific—We have an extensive network of ten container terminals throughout theAsia-Pacific region. Additionally, we operate three logistics centres in the region, which arelocated in Hong Kong (ATL Logistics Centre), Yantian (ATL Logistics Centre Yantian) andShanghai (Shanghai JiFa), although we have entered into a contract to dispose of Shanghai JiFa.Currently, we have development projects in Vietnam and China. Our operations in the regionaccounted for 12.2 million TEUs (or 33.2%) and 6.6 million TEUs (or 32.5%) of our grossthroughput for the year ended December 31, 2006 and the six months ended June 30, 2007,respectively.
110
www.global-reports.com
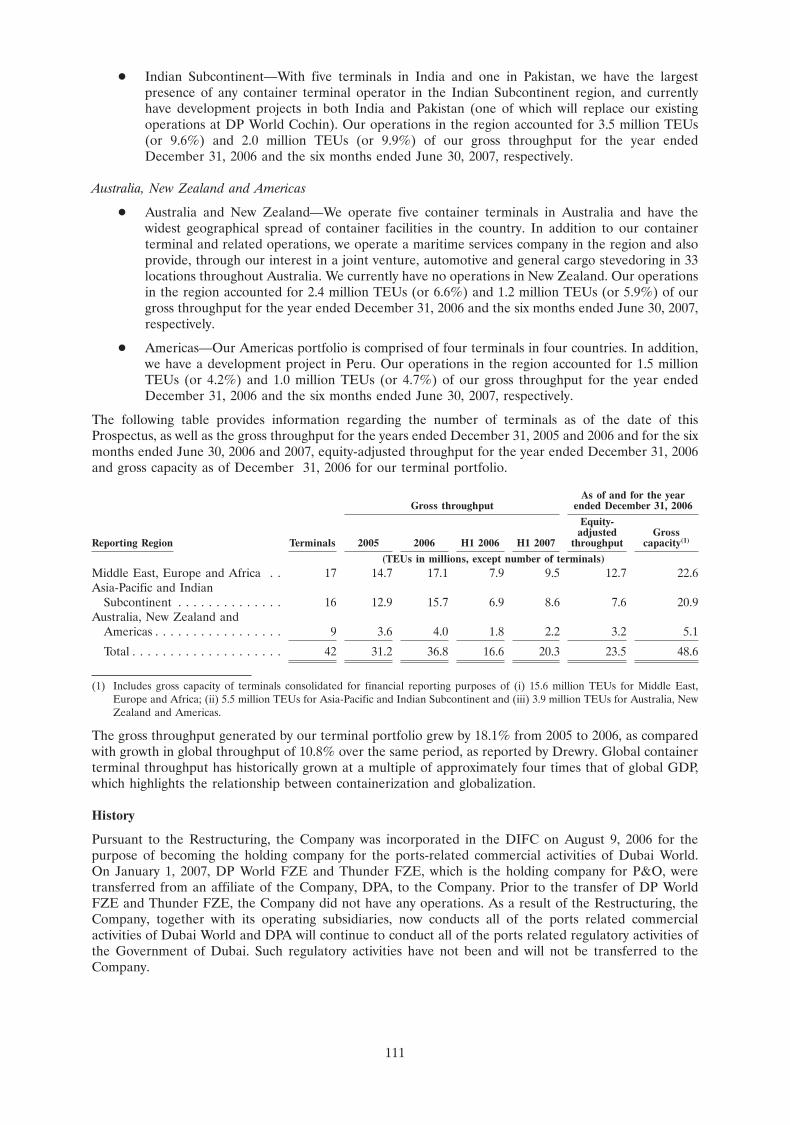
� Indian Subcontinent—With five terminals in India and one in Pakistan, we have the largestpresence of any container terminal operator in the Indian Subcontinent region, and currentlyhave development projects in both India and Pakistan (one of which will replace our existingoperations at DP World Cochin). Our operations in the region accounted for 3.5 million TEUs(or 9.6%) and 2.0 million TEUs (or 9.9%) of our gross throughput for the year endedDecember 31, 2006 and the six months ended June 30, 2007, respectively.
Australia, New Zealand and Americas
� Australia and New Zealand—We operate five container terminals in Australia and have thewidest geographical spread of container facilities in the country. In addition to our containerterminal and related operations, we operate a maritime services company in the region and alsoprovide, through our interest in a joint venture, automotive and general cargo stevedoring in 33locations throughout Australia. We currently have no operations in New Zealand. Our operationsin the region accounted for 2.4 million TEUs (or 6.6%) and 1.2 million TEUs (or 5.9%) of ourgross throughput for the year ended December 31, 2006 and the six months ended June 30, 2007,respectively.
� Americas—Our Americas portfolio is comprised of four terminals in four countries. In addition,we have a development project in Peru. Our operations in the region accounted for 1.5 millionTEUs (or 4.2%) and 1.0 million TEUs (or 4.7%) of our gross throughput for the year endedDecember 31, 2006 and the six months ended June 30, 2007, respectively.
The following table provides information regarding the number of terminals as of the date of thisProspectus, as well as the gross throughput for the years ended December 31, 2005 and 2006 and for the sixmonths ended June 30, 2006 and 2007, equity-adjusted throughput for the year ended December 31, 2006and gross capacity as of December 31, 2006 for our terminal portfolio.
As of and for the yearGross throughput ended December 31, 2006
Equity-adjusted Gross
Reporting Region Terminals 2005 2006 H1 2006 H1 2007 throughput capacity(1)
(TEUs in millions, except number of terminals)Middle East, Europe and Africa . . 17 14.7 17.1 7.9 9.5 12.7 22.6Asia-Pacific and Indian
Subcontinent . . . . . . . . . . . . . . 16 12.9 15.7 6.9 8.6 7.6 20.9Australia, New Zealand and
Americas . . . . . . . . . . . . . . . . . 9 3.6 4.0 1.8 2.2 3.2 5.1
Total . . . . . . . . . . . . . . . . . . . . 42 31.2 36.8 16.6 20.3 23.5 48.6
(1) Includes gross capacity of terminals consolidated for financial reporting purposes of (i) 15.6 million TEUs for Middle East,Europe and Africa; (ii) 5.5 million TEUs for Asia-Pacific and Indian Subcontinent and (iii) 3.9 million TEUs for Australia, NewZealand and Americas.
The gross throughput generated by our terminal portfolio grew by 18.1% from 2005 to 2006, as comparedwith growth in global throughput of 10.8% over the same period, as reported by Drewry. Global containerterminal throughput has historically grown at a multiple of approximately four times that of global GDP,which highlights the relationship between containerization and globalization.
History
Pursuant to the Restructuring, the Company was incorporated in the DIFC on August 9, 2006 for thepurpose of becoming the holding company for the ports-related commercial activities of Dubai World.On January 1, 2007, DP World FZE and Thunder FZE, which is the holding company for P&O, weretransferred from an affiliate of the Company, DPA, to the Company. Prior to the transfer of DP WorldFZE and Thunder FZE, the Company did not have any operations. As a result of the Restructuring, theCompany, together with its operating subsidiaries, now conducts all of the ports related commercialactivities of Dubai World and DPA will continue to conduct all of the ports related regulatory activities ofthe Government of Dubai. Such regulatory activities have not been and will not be transferred to theCompany.
111
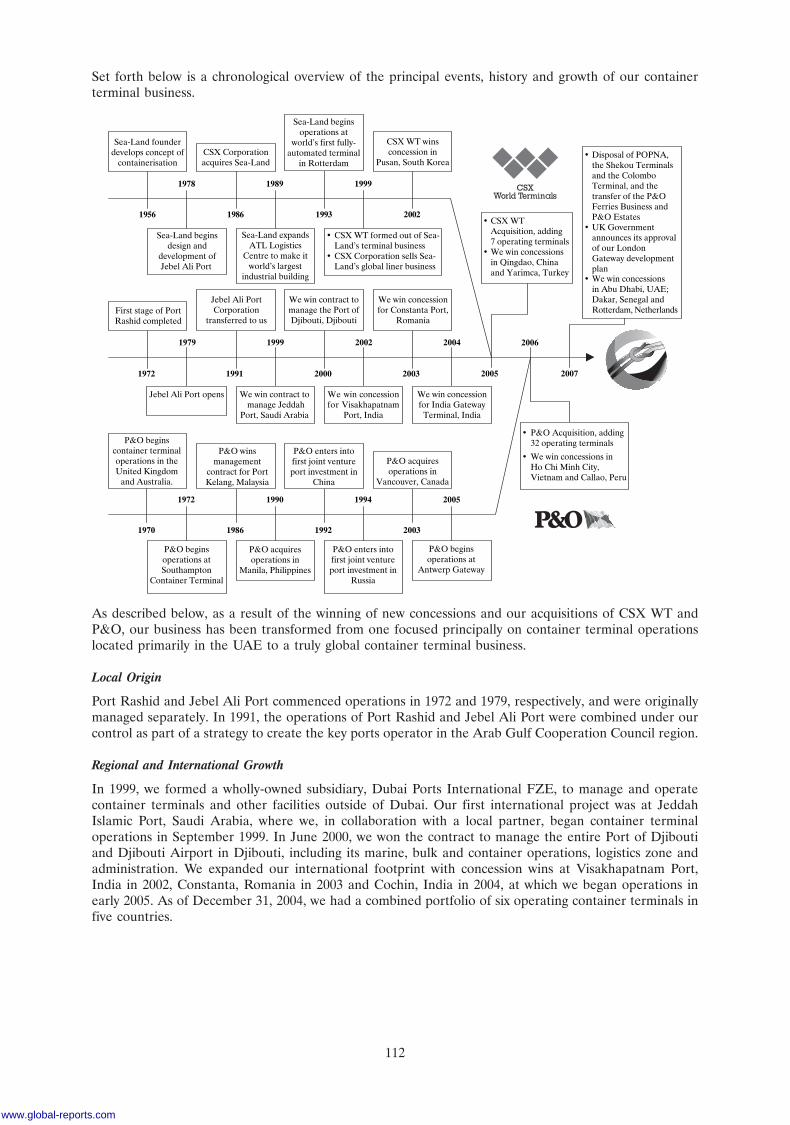
1NOV200707420300
Set forth below is a chronological overview of the principal events, history and growth of our containerterminal business.
19911972
1970
1972
1986
1990
1992
1994
2003
2005
20021999
2003 2005
2004 2006
We win contract tomanage Jeddah
Port, Saudi Arabia
We win concessionfor Visakhapatnam
Port, India
We win concessionfor India Gateway
Terminal, India
• P&O Acquisition, adding 32 operating terminals
• We win concessions in Ho Chi Minh City, Vietnam and Callao, Peru
We win contract tomanage the Port ofDjibouti, Djibouti
We win concessionfor Constanta Port,
Romania
Jebel Ali Port opens
First stage of PortRashid completed
1979
Jebel Ali PortCorporation
transferred to us
2000
1956
P&O beginsoperations atSouthampton
Container Terminal
P&O winsmanagement
contract for PortKelang, Malaysia
P&O enters intofirst joint ventureport investment in
China
P&O acquiresoperations in
Vancouver, Canada
P&O acquiresoperations in
Manila, Philippines
P&O enters intofirst joint ventureport investment in
Russia
P&O beginsoperations at
Antwerp Gateway
Sea-Land beginsdesign and
development ofJebel Ali Port
Sea-Land founderdevelops concept of
containerisation
Sea-Land expandsATL Logistics
Centre to make itworld’s largest
industrial building
• CSX WT formed out of Sea- Land’s terminal business• CSX Corporation sells Sea- Land’s global liner business
CSX WT winsconcession in
Pusan, South Korea
Sea-Land beginsoperations at
world’s first fully-automated terminal
in RotterdamCSX Corporationacquires Sea-Land
2002
1999
1993
1989
1986
1978
• Disposal of POPNA,the Shekou Terminalsand the ColomboTerminal, and thetransfer of the P&OFerries Business andP&O Estates
• UK Governmentannounces its approvalof our LondonGateway developmentplan
2007
• CSX WT Acquisition, adding 7 operating terminals• We win concessions in Qingdao, China and Yarimca, Turkey
P&O beginscontainer terminaloperations in theUnited Kingdom
and Australia.
• We win concessions in Abu Dhabi, UAE;Dakar, Senegal andRotterdam, Netherlands
As described below, as a result of the winning of new concessions and our acquisitions of CSX WT andP&O, our business has been transformed from one focused principally on container terminal operationslocated primarily in the UAE to a truly global container terminal business.
Local Origin
Port Rashid and Jebel Ali Port commenced operations in 1972 and 1979, respectively, and were originallymanaged separately. In 1991, the operations of Port Rashid and Jebel Ali Port were combined under ourcontrol as part of a strategy to create the key ports operator in the Arab Gulf Cooperation Council region.
Regional and International Growth
In 1999, we formed a wholly-owned subsidiary, Dubai Ports International FZE, to manage and operatecontainer terminals and other facilities outside of Dubai. Our first international project was at JeddahIslamic Port, Saudi Arabia, where we, in collaboration with a local partner, began container terminaloperations in September 1999. In June 2000, we won the contract to manage the entire Port of Djiboutiand Djibouti Airport in Djibouti, including its marine, bulk and container operations, logistics zone andadministration. We expanded our international footprint with concession wins at Visakhapatnam Port,India in 2002, Constanta, Romania in 2003 and Cochin, India in 2004, at which we began operations inearly 2005. As of December 31, 2004, we had a combined portfolio of six operating container terminals infive countries.
112
www.global-reports.com
Global Expansion
CSX WT
In February 2005, we completed the CSX WT Acquisition. CSX WT was a leading global containerterminal operator with key strategic assets in some of the world’s fastest growing markets, including Asiaand South America. Following our successful bids in Saudi Arabia, Djibouti, India and Romania, the CSXWT Acquisition represented an important step in our global expansion strategy by increasing ourinternational presence in the container terminal industry and enhancing our geographic diversification.
The CSX WT Acquisition provided us with a portfolio of terminals in Asia, Australia, Europe and theAmericas that was a complementary fit with our existing terminal portfolio. Among other things, the CSXWT Acquisition was designed to allow us to:
� participate more fully in the growth of the global transportation and logistics industry;
� serve our customers from a broader geographic base;
� exploit immediate and long-term synergies between our and CSX WT’s businesses;
� access new high-growth markets, especially Asia and South America; and
� achieve revenue growth through the opportunity to increase volumes and expand our level ofservice.
CSX WT’s key operations included CT3 (Hong Kong), ACT (CT8) (Hong Kong) and the ATL LogisticsCentre at Hong Kong’s Kwai Chung port, as well as the terminal facilities at the Ports of Yantai andTianjin in China. The CSX WT Acquisition also provided us with a project pipeline for furtherdevelopment and expansion of our global network through greenfield and expansion projects in Pusan,South Korea and Qingdao, China.
The CSX WT Acquisition contributed interests in seven operating terminals and three terminals underconstruction or in the planning stage. As of the closing of the CSX WT Acquisition, our terminal portfolioincluded 14 operating container terminals in ten countries.
P&O
In March 2006, we completed the P&O Acquisition. P&O was a leading global container terminal operatorand also had significant operations in ferries, as well as maritime services and property developmentbusinesses. The P&O Acquisition represented a unique opportunity to significantly increase our globalnetwork and market position by incorporating P&O’s largely complementary portfolio of terminals in Asia,India, Australia, the Americas, Europe and Africa into our terminal portfolio.
We believe that the P&O Acquisition has, among other things, enabled us to:
� increase our focus on O&D traffic because of the relatively high percentage of origin anddestination trade conducted at P&O’s terminals;
� diversify our customer base and address the changing needs of a consolidating customer pool byoffering our customers a globally balanced portfolio of container terminals;
� gain further exposure to high-growth markets in Asia and South America, while strengtheningour position in more established markets in Europe and Australia;
� benefit from the collective experience of P&O’s operational management; and
� improve the efficiency of certain aspects of the management and operational structure of P&Oand realise synergies through greater economies of scale.
P&O’s portfolio included key operations in Australia and at Qingdao Qianwan Container Terminal, wherewe already had a business development project that we acquired in the CSX WT Acquisition, in NaviMumbai, India, at two terminals in Antwerp, Belgium and in Southampton, United Kingdom. In addition,P&O had significant projects in development in Ho Chi Minh City, Vietnam and Kulpi Port, India and wasin the process of obtaining regulatory approval to develop London Gateway, a new deep-sea containerterminal that is expected to be constructed on the River Thames near London, all of which we havecontinued to pursue. On May 30, 2007, the UK Government announced that it had approved thedevelopment plan for London Gateway.
113
The P&O Acquisition contributed interests in 32 operating terminals and five terminals under constructionor in the planning stage. As of the closing of the P&O Acquisition, our terminal portfolio included 49operating container terminals in 24 countries.
In connection with the P&O Acquisition, we acquired the assets of POPNA, which included concessions atsix container terminal operations and three non-container terminal operations in the United States, as wellas stevedoring operations at an additional 16 US ports. On March 16, 2007, P&O Holdings, Inc., a wholly-owned subsidiary of ours, completed the sale of 100% of POPNA to a wholly-owned subsidiary of AIGGlobal Investment Group.
To focus our business on container terminal operations, we have transferred and have entered intoagreements to transfer the P&O Ferries Business and P&O Estates, respectively, which we acquired in theP&O Acquisition, to affiliates of ours. See ‘‘Related Party Transactions—Relationship with Dubai Worldand the Government of Dubai—Ongoing Relationship—Transfer of P&O Estates’’ and ‘‘Related PartyTransactions—Relationship with Dubai World and the Government of Dubai—Ongoing Relationship—Transfer of P&O Ferries’’.
Future Expansion
Following the P&O Acquisition, we continued to enhance our portfolio by securing new developmentprojects in Qasim, Pakistan; Callao, Peru; Dakar, Senegal; Abu Dhabi, UAE and Rotterdam, Netherlands.These were in addition to our existing development projects in Ho Chi Minh City, Vietnam; Doraleh,Djibouti; Vallarpadam and Kulpi, India; Yarimca, Turkey; Fos, France; Qingdao, China; and LondonGateway, United Kingdom. In addition, we currently have a total of 10 terminal expansion projects at JebelAli, UAE; Le Havre, France; Caucedo, Dominican Republic; Germersheim, Germany; Vancouver,Canada; Constanta, Romania; Buenos Aires, Argentina; Antwerp, Belgium; Pusan, South Korea andAdelaide, Australia. In some cases, projects are subject to various final regulatory approvals. We intend tocontinue to evaluate and review opportunities for expansion and construction projects in line with ourgrowth strategy.
Competitive Strengths
As described above, we have built our global container terminal business through the combination of ourregional and international operations, the CSX WT Acquisition, the P&O Acquisition and our terminaldevelopment and expansion projects. We believe that each of these components provides us withcomplementary strengths, which together position us as a market leader in the global container terminalindustry. In particular, we believe that our business is characterised by the following key competitivestrengths.
A Globally Diversified, Market-Leading and Balanced Portfolio of Terminals
With 42 terminals in 22 countries, we believe that we have the most geographically diversified portfolio ofterminals in the industry and that the size and diversity of our portfolio gives us a competitive advantageover smaller and more concentrated operators because of the relatively high barriers to entry thatcharacterise the container terminal industry. Our asset base includes a diverse mixture of both establishedand newer terminals and a significant number of greenfield and brownfield projects that we are in theprocess of developing. We believe that this combination of development sites and fully operating facilitiesis key to facilitating our future growth strategies and that our portfolio allows us to take advantage of thetypically stable returns on equity in lower-risk established markets such as Europe and Australia and thepotential for greater returns on equity in higher-risk emerging markets such as Latin America and Africa,which have experienced high growth in recent years. In addition, we believe that our portfolio, which isdiversified within the regions in which we operate, should help to mitigate any region-specific downturns.
Strong Pipeline of New Projects and Additional Growth Potential
We have extensive experience in developing terminal operations around the globe, including byconstructing new terminals on both greenfield sites and brownfield sites as a result of concession wins. Wehave a strong track record of winning concessions globally based on our customer and business partnerrelationships, operating and technical credentials, willingness to invest in new capacity to meet demandand focus on key governmental issues, such as security and sustainability. Consequently, we believe that wewill win, on financial terms that we consider to be attractive, the majority of the concessions that weactively pursue and where we submit a bid.
114
www.global-reports.com
Our new projects currently in development include a total of 13 terminal development projects and10 terminal expansion projects, which, subject to various final regulatory approvals in some cases, areexpected to become operational at various times over the next 10 years and to add 27.7 million TEUs and10.2 million TEUs, respectively, of gross capacity to our portfolio, based on anticipated capacity as ofcompletion, of which we expect 9.8 million TEUs and 9.2 million TEUs, respectively, will be operational bythe end of 2010. In addition, we commenced operations at the first phase of the expansion project at DPWorld Jebel Ali and the Phase III(b) expansion project at Qingdao Qianwan Container Terminal earlierthis year, which together added 4.0 million TEUs of gross capacity to our portfolio. We anticipate that14.5 million TEUs and 4.8 million TEUs of the expected additional gross capacity to be provided by ourterminal development projects and terminal expansion projects, respectively, will be provided by projectsthat we expect will be consolidated for financial reporting purposes, of which we expect 6.2 million TEUsand 4.0 million TEUs, respectively, will be operational by the end of 2010. We also have a pipeline ofpotential projects in various stages of review, and continue to look for innovative opportunities for theownership and management of terminal and terminal-related assets both inside and outside of ports.
Strong Relationships with Key Customers
We maintain a diverse customer base and enjoy close and long-standing relationships with our keycustomers, who are, for the most part, leaders in the global shipping industry. We believe that we havebeen successful in attracting and maintaining key customers as a result of our strong reputation in theindustry, continued achievement of operational excellence and the diversification of our global portfolio,each of which helps our customers succeed in their businesses. For example, seven of our current top tenglobal customers were also our customers ten years ago. We target key customers and seek to buildstrategic relationships based on an internal programme of customer segmentation, which we believe isunique to our industry. Through this programme, we seek to identify key commercial relationships byconsidering a number of different factors that we believe will assist us in evaluating our customers anddetermining how we can best serve them in the future.
Strategic Relationships with Dubai World and its Affiliates
As a majority-owned indirect subsidiary of Dubai World, a holding company owned by the Government ofDubai, following the Global Offering, we expect to continue to benefit from the commitment of DubaiWorld to promote Dubai and its portfolio of businesses and projects both domestically and internationally.In addition, we have in the past benefited from and expect to continue to leverage relationships withaffiliates that engage in complementary businesses, which we believe allows us to offer a combination ofservices that is unique in the container terminal industry and provides us with an advantage over ourcompetitors.
Operational Excellence and Innovation
We are one of the innovators in the container terminal industry and have been successful in developing andenhancing container terminal capacity and efficiency in the regions in which we operate based on the needsand attributes of particular terminals. In 2007, our international achievements were recognised by ourwinning Best Seaport in the Middle East for DP World Jebel Ali for the 13th year in a row and Best ContainerTerminal in Asia under 4 million TEUs per annum for CT3 (Hong Kong) at the Asian Freight & SupplyChain Awards. We also won various awards in 2006, including the Lloyd’s List’s Port Operator of the YearAward. Our commitment to operational excellence is reflected in the increase in our average global craneproductivity from approximately 25 gross moves per hour for the year ended December 31, 2005 toapproximately 27 gross moves per hour for the year ended December 31, 2006. This increase in ouraverage global crane productivity is made possible not only through the implementation of newtechnologies but also by significant improvements in operating efficiency that we have been able to makeat existing terminals, as well as at new terminals constructed on greenfield sites.
Experienced and International Management Team
Our global business is run out of our head office in Dubai by the 11 members of our executivemanagement team, who have significant industry experience, and some of whom also have experience inthe container shipping industry. In addition, our local operations are managed by eight regional managers,who also have significant experience in the container terminal industry and extensive local and regionalknowledge, and are supported by a highly experienced team of local container terminal managers. See‘‘Management’’.
115
Our Vision and Mission
Our vision is to be the ‘‘Port of Choice’’ for our customers in each of our locations, to excel in operations,sales and customer service to our clients and to enhance the position of the local communities andcountries in which we operate as gateways for global trade. Our mission is to provide world-class portservices and to be a global player in operating and managing ports. We aim to provide value-for-money,high quality services to our customers through motivated and innovative employees who are empowered tomake optimum use of modern facilities, technology and resources while ensuring a reasonable return oninvestment.
Corporate Strategy
We have historically grown our business through a combination of organic growth and corporateacquisitions, which have helped to establish our global footprint and fundamentally change thecomposition and dynamics of our industry. Going forward, we have a strong pipeline of terminaldevelopment projects, which are expected to add 27.7 million TEUs of gross capacity to our portfolio overthe next 10 years, based on anticipated capacity as of completion. We will adopt a selective approachtowards future acquisition opportunities. The following strategic principles have therefore been developedto aid our objectives, with a focus on people, customers, quality and global reach.
Optimise Existing Asset Base and Current Capacity
We believe that operational excellence and innovation create opportunities to generate additional valueout of our existing facilities. We seek to improve our operational efficiency and increase the capacity of ourexisting facilities by investing in advanced handling equipment and streamlining our operational processes.We believe that this strategy is one of the most cost-effective methods for increasing capacity at ourexisting facilities. In addition, we continually communicate with our customers and essential stakeholdersin the port and shipping community to maximise the connectivity, responsiveness, accuracy and speed thatwe are able to offer.
Maximise Customer Satisfaction with Innovative and Tailored Solutions
Providing our global customers and their customers with value enhancing port and logistics solutions is acornerstone of our operating strategy. We seek to sustain our consultative approach to customerrelationship management to ensure we invest in facilities around the globe where our services are required.We employ a proactive management process that focuses on the key elements of connectivity, informationsharing and security, which can provide strategic solutions in inventory and cost control in the global supplychain. We believe that the reliability and efficiency of our operations and information flow will enhanceour customers’ competitive edge.
Enhance Relationships with Sector Participants
We continually evaluate our relationships with both current and potential future partners and stakeholdersto ensure that we stay at the forefront of our industry, seizing the most attractive commercial opportunitiesby involving the relevant stakeholders from the outset. We believe that our credentials as one of theworld’s largest container terminal operators make us a natural partner of choice, and we seek to enhancethis perception across the globe. In addition, we believe that leveraging our relationships with our affiliateswithin Dubai World as we explore new opportunities will ultimately transform the local economies of thecountries in which we operate and consequently enhance the value proposition for our business.
Deploy Capital for Sustained Growth, Profitability and Market Leadership
We intend to pursue investment opportunities based on our assessment of their potential for valuecreation, growth and sustained profitability. We continue to ensure that our assessment of potentialinvestment opportunities is performed on a risk-adjusted basis, such that any capital deployed in morevolatile markets is accompanied by a commensurate increase in the expected return. Within thisframework, we emphasise operational control of new projects while ensuring that we have the mostappropriate partners on board where required. We seek to position ourselves to react to changes in bothour and our customers’ industries to ensure that we remain the port operator of choice.
116
www.global-reports.com
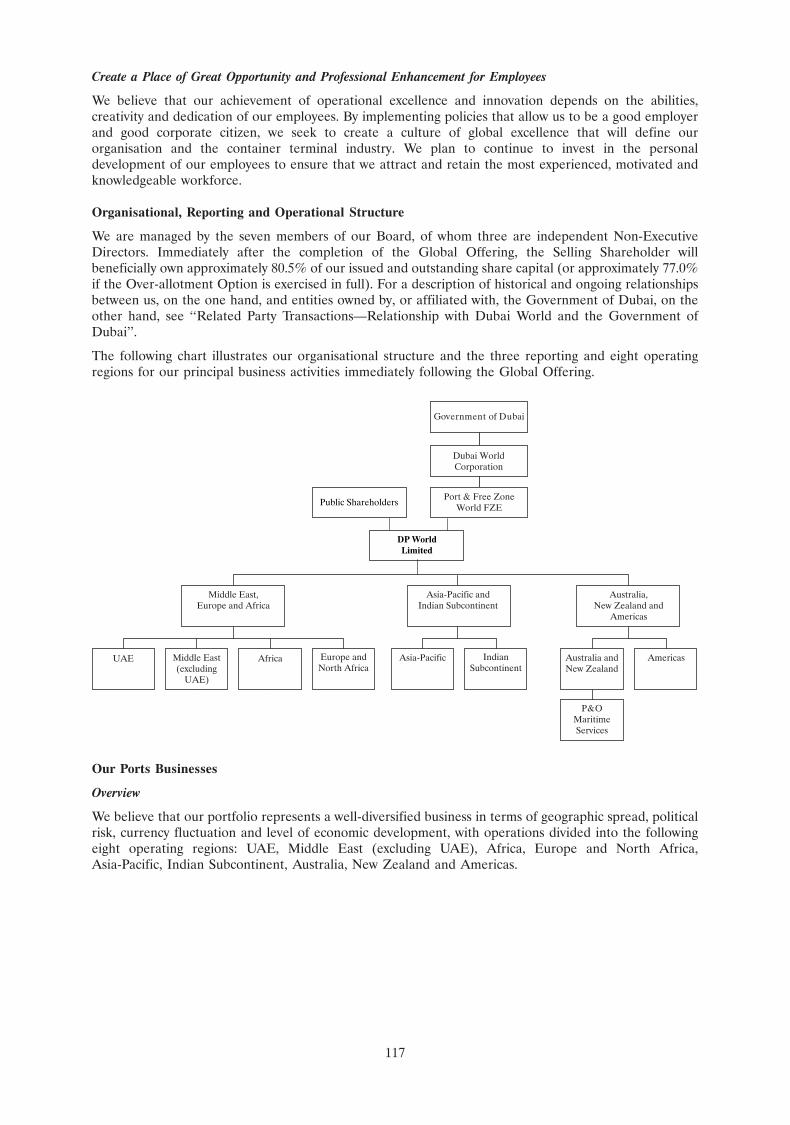
22SEP200718423235
Create a Place of Great Opportunity and Professional Enhancement for Employees
We believe that our achievement of operational excellence and innovation depends on the abilities,creativity and dedication of our employees. By implementing policies that allow us to be a good employerand good corporate citizen, we seek to create a culture of global excellence that will define ourorganisation and the container terminal industry. We plan to continue to invest in the personaldevelopment of our employees to ensure that we attract and retain the most experienced, motivated andknowledgeable workforce.
Organisational, Reporting and Operational Structure
We are managed by the seven members of our Board, of whom three are independent Non-ExecutiveDirectors. Immediately after the completion of the Global Offering, the Selling Shareholder willbeneficially own approximately 80.5% of our issued and outstanding share capital (or approximately 77.0%if the Over-allotment Option is exercised in full). For a description of historical and ongoing relationshipsbetween us, on the one hand, and entities owned by, or affiliated with, the Government of Dubai, on theother hand, see ‘‘Related Party Transactions—Relationship with Dubai World and the Government ofDubai’’.
The following chart illustrates our organisational structure and the three reporting and eight operatingregions for our principal business activities immediately following the Global Offering.
DP WorldLimited
Port & Free ZoneWorld FZE
Dubai WorldCorporation
Government of Dubai
Middle East,Europe and Africa
Asia-Pacific andIndian Subcontinent
Australia,New Zealand and
Americas
UAE Middle East(excluding
UAE)
Europe andNorth Africa
IndianSubcontinent
Asia-PacificAfrica Americas
P&OMaritimeServices
Australia andNew Zealand
Public Shareholders
Our Ports Businesses
Overview
We believe that our portfolio represents a well-diversified business in terms of geographic spread, politicalrisk, currency fluctuation and level of economic development, with operations divided into the followingeight operating regions: UAE, Middle East (excluding UAE), Africa, Europe and North Africa,Asia-Pacific, Indian Subcontinent, Australia, New Zealand and Americas.
117
The following chart lists our container terminals by reporting and operating regions.
Middle East, Europe and Africa
UAE Region Europe and North Africa RegionUAE Belgium� DP World Jebel Ali � DP World Antwerp� Port Rashid (Dubai) � Antwerp Gateway� Mina Zayed (Abu Dhabi) France� DP World Fujairah � Terminal de Nord (Le Havre)
� Terminal de France (Le Havre)Middle East (excluding UAE) Region � Fos Container Terminal (Fos sur Mer)Saudi Arabia � Mourepiane Container Terminal (Marseille)� Jeddah South Container Terminal Germany
� DP World GermersheimAfrica Region RomaniaDjibouti � DP World Constanta� Port Autonome International de Djibouti United KingdomMozambique � Southampton Container Terminal� Maputo International Port Services � Tilbury Container Services
Asia-Pacific and Indian Subcontinent
Asia-Pacific Region Indian Subcontinent RegionChina India� Qingdao Qianwan Container Terminal � DP World Nhava Sheva� Tianjin Orient Container Terminals � DP World Chennai� ACT (CT8) (Hong Kong) � Mundra International Container Terminal� CT3 (Hong Kong) � DP World Cochin� DP World Yantai � Visakha Container TerminalIndonesia Pakistan� Terminal Petikemas Surabaya � DP World KarachiPhilippines� Asia Terminals IncorporatedRussia� Vostochnaya Stevedore CompanySouth Korea� Pusan Newport CompanyThailand� Laem Chabang International Terminal
Australia, New Zealand and Americas
Australia and New Zealand Region Americas RegionAustralia Argentina� DP World Melbourne � Terminales Rio de la Plata (Buenos Aires)� DP World Sydney Canada� DP World Brisbane � DP World Vancouver� DP World Fremantle Dominican Republic� DP World Adelaide � DP World Caucedo
Venezuela� DP World Puerto Cabello
Core Services
Our core ports services are comprised of container cargo handling and storage, which accounts for thesignificant majority of our revenue from operations and net profit, as well as general cargo handling andRoll On-Roll Off (‘‘Ro-Ro’’) services. In addition to the foregoing core services, certain of our operationsoffer one or more of the following other services: refrigerated container, or reefer, facilities, sea-air cargo,commercial trucking, passenger services and logistics.
Container cargo handling and storage
The core services for containerised handling consist of lifting containers on and off of vessels, storingcontainers in the relevant terminal and facilitating the delivery and receipt of containers. The two maincategories of throughput are O&D, which is also often referred to as import and export, and transhipment.
118
www.global-reports.com
O&D throughput differs from transhipment throughput primarily in that O&D throughput is usually mostcost effectively handled by one terminal, preferably close to the point of consumption, which makes O&Dthroughput less likely to be lost to competitors and less price-sensitive than transhipment throughput.O&D throughput also provides us with opportunity to earn additional revenue by charging for delivery orreception of the container from the shipper or consignee, as well as by providing ancillary services, such asCFS and container cleaning. For the year ended December 31, 2006, approximately 76% of our grossthroughput was O&D throughput.
The storage of containers on behalf of customers for varying periods of time within our terminalsrepresents an additional income stream and is based on charging an amount per TEU rather than per liftbased on the size of container. Rates vary between locations and among customers within the samelocation and are different for full and empty containers and also vary depending on the duration ofstorage.
General cargo handling and Ro-Ro services
In addition to container cargo handling and storage services, we also offer general cargo handling andRo-Ro services. By offering superior service and handling facilities, we have attracted general cargo vesselscarrying a wide variety of non-containerised goods. As well as serving the growing local markets forcommodities and specialised cargos, such as frozen and chilled foodstuffs and various types of constructionmaterials, the location of many of our general cargo handling facilities at hubs of the east-west andnorth-south trade routes makes them attractive for stockpiling cargo for re-export. Our Ro-Ro facilities aredesigned to accommodate vessels that carry wheeled cargo, such as automobiles. The defining feature ofRo-Ro vessels is a built-in ramp, which allows cargo to be efficiently ‘‘rolled on’’ and ‘‘rolled off’’ the vesselwhen in port.
We consider our general cargo handling and Ro-Ro businesses to be important components of ourbusiness and we offer general cargo handling, operate a Ro-Ro facility and/or offer other Ro-Ro services atmany of our locations. We believe that we are well placed to benefit from growing global trade volumesand we expect to continue to develop and expand our facilities and special equipment for handlingnon-containerised cargo with a view to increasing revenue from our general cargo handling and Ro-Roservices.
P&O Maritime Services
As part of the P&O Acquisition, we acquired P&O Maritime Services, which is based in Melbourne,Australia. Through its ownership, operation and management of a fleet of specialised vessels, P&OMaritime Services provides government shipping, cargo, defence and port and charter and agency servicesto a diverse range of government and industrial customers in Australia, as well as Papua New Guinea,Singapore, Ireland and Argentina.
A significant majority of the revenue of P&O Maritime Services is derived from contracts with a term offive or more years with its major clients, including the Australian Government Antarctic Division, theDepartment of Defence, Australian Customs Service, CSIRO and Xstrata. The defence business of P&OMaritime Services in Australia is operated through Defence Maritime Services Pty Ltd, a 50% owned jointventure with Serco Group plc of the United Kingdom.
Customers
Our customers comprise over 150 carriers and cargo interests, including all of the top ten global containershipping lines, as well as general cargo and car carriers. We also perform logistics activities whereby wedeal directly with both transport companies and the ultimate owners of the relevant cargo, such asmanufacturers, traders and importers. For the year ended December 31, 2006, our top five, ten and twentycustomers accounted for approximately 42%, 59% and 76%, respectively, of the full-year gross throughputfor all terminals as of December 31, 2006 (excluding the six container terminals operated by POPNA thetwo Shekou Terminals and the one Colombo Terminal). We have long-standing relationships with our topten customers, many of whom have been customers of ours since the beginning of containerised operationsat our terminal locations. Eight of our top ten customers are also among the top ten largest global shippingcompanies. Selected customers of ours include: Maersk Line, MSC, Evergreen, Hapag-Lloyd, CMA CGM,CSCL, NYK, APL, OOCL, UASC and ZIM. We believe that these relationships are increasingly importantbecause of the consolidation of the shipping line industry, which has resulted in a smaller pool of majorcustomers. Customer relations are managed on a local, regional and global basis.
119
Contracts in the container terminal industry are characterised by relatively long terms, usually in the rangeof two to five years, and typically, although not exclusively, require cause in operational failing to allowearly termination. However, in certain regions, such as Europe, contracts may have relatively short noticeperiods and allow termination without cause. As a general matter, shipping lines tend to change terminaloperators infrequently as they have a limited selection of operators in many ports and are often tied to thehinterland served by a particular port. Both terminal operators and their shipping line customers attachimportance to long-term relationships and a global portfolio, thereby encouraging an alignment ofinterests and a structured commercial approach at a global and regional level, rather than just at anindividual terminal level. We believe that our global portfolio offers us a competitive advantage in thisrespect.
We believe that among the most important factors that our customers take into consideration whenselecting a vendor are a commitment to the provision of a fixed day berthing slot and defined craneproductivity rates, which we believe we are well placed to deliver because of our operating efficiency.
Business Development
We have dedicated teams of business development professionals located in each of our operating regions,as well as a core team of staff in Dubai that supports and augments our regional teams. In addition tounsolicited project proposals, our head office, regional and local terminal management teams areconstantly working to identify and develop new projects. Our strong relationships with our containershipping line customers also provide an additional way to identify new projects. These businessdevelopment opportunities come in the form of acquisitions of existing single or multi-site operations andnew greenfield and brownfield terminal projects. We typically maintain a project pipeline comprised ofbetween 20 and 40 developments that we are actively reviewing at any one time. Our Senior Vice Presidentof Business Development reports directly to our Chief Executive Officer, reflecting the importance of thisfunction within the organisation.
New opportunities are identified by multiple sources throughout the organisation and through the manydifferent channels yielded by our extensive network, including discussions with our customers and withgovernment representatives and authorities. We have a clearly defined strategy for our businessdevelopment activity that allows us to efficiently short-list and pursue opportunities that will likely add thegreatest potential value to our business. We evaluate new business opportunities based both on the initialinvestment we will be required to make and the potential future expected growth opportunity associatedwith the asset. Therefore, on certain projects, we have elected to put in place management contracts tooperate the asset, which has allowed us to minimise our investment but remain well-positioned for futuregrowth. An efficient portfolio of terminals must have an appropriate balance between established,developing and greenfield sites; O&D and transhipment throughput; and locations in emerging market anddeveloped economies. We constantly re-evaluate our current portfolio positioning and adjust our businessdevelopment priorities as we deem appropriate.
Our new projects currently in development include a total of 13 terminal development projects in theUAE, Vietnam, Djibouti, Pakistan, India (Kulpi and Vallarpadam), Turkey, France, China, Peru, Senegal,the Netherlands and the United Kingdom. We also currently have a total of 10 terminal expansion projectsin the UAE, France, the Dominican Republic, Germany, Canada, Romania, Argentina, Belgium, SouthKorea and Australia. In some cases, projects are subject to receipt of various final regulatory approvals. Inaddition, we are in advanced negotiations on several other projects and have signed confidentialmemoranda of understanding for numerous further projects in a range of geographical regions, mostly inemerging markets, but also within developed markets, which may or may not lead to definitive agreements.Finally, from time to time, based on our ongoing business review, we may sell or divest businesses in theordinary course of business.
Concessions
Substantially all of our terminal operations are conducted pursuant to long-term operating concessions orleases entered into with the owner of a relevant port for terms generally between 25 and 50 years. As ofDecember 31, 2006, 23 of our 37 terminals that we operate under concession agreements had termsexpiring after December 31, 2024. We commonly start negotiations regarding the renewal of concessionagreements with approximately five to ten years remaining on the term and often obtain renewals of orextensions on concession agreements in advance of their expiration in return for a commitment to makecertain capital expenditures in respect of the subject terminal. In addition, such negotiations may result ina re-base of rental charges to reflect current market rates. Due to the typical length of concession
120
www.global-reports.com
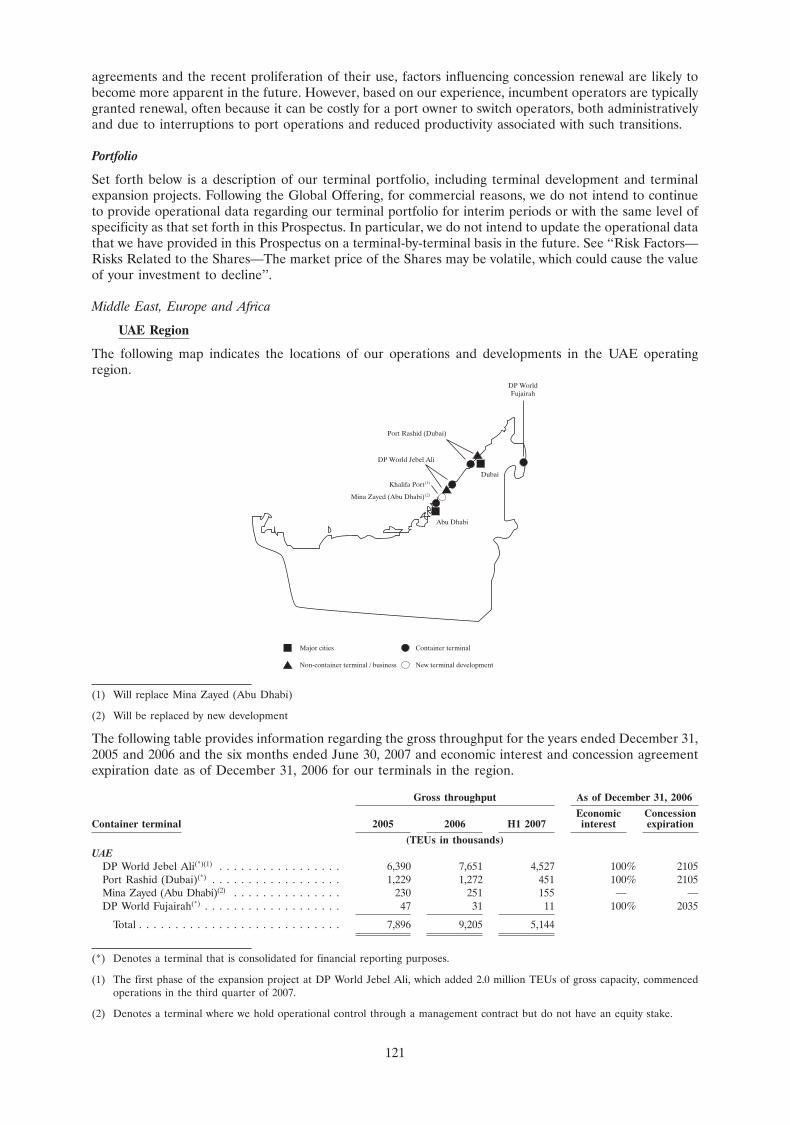
4SEP200722041279
agreements and the recent proliferation of their use, factors influencing concession renewal are likely tobecome more apparent in the future. However, based on our experience, incumbent operators are typicallygranted renewal, often because it can be costly for a port owner to switch operators, both administrativelyand due to interruptions to port operations and reduced productivity associated with such transitions.
Portfolio
Set forth below is a description of our terminal portfolio, including terminal development and terminalexpansion projects. Following the Global Offering, for commercial reasons, we do not intend to continueto provide operational data regarding our terminal portfolio for interim periods or with the same level ofspecificity as that set forth in this Prospectus. In particular, we do not intend to update the operational datathat we have provided in this Prospectus on a terminal-by-terminal basis in the future. See ‘‘Risk Factors—Risks Related to the Shares—The market price of the Shares may be volatile, which could cause the valueof your investment to decline’’.
Middle East, Europe and Africa
UAE Region
The following map indicates the locations of our operations and developments in the UAE operatingregion.
Port Rashid (Dubai)
Mina Zayed (Abu Dhabi)(2)
Abu Dhabi
Dubai
DP WorldFujairah
DP World Jebel Ali
Major cities
Non-container terminal / business
Container terminal
New terminal development
Khalifa Port(1)
(1) Will replace Mina Zayed (Abu Dhabi)
(2) Will be replaced by new development
The following table provides information regarding the gross throughput for the years ended December 31,2005 and 2006 and the six months ended June 30, 2007 and economic interest and concession agreementexpiration date as of December 31, 2006 for our terminals in the region.
Gross throughput As of December 31, 2006
Economic ConcessionContainer terminal 2005 2006 H1 2007 interest expiration
(TEUs in thousands)UAE
DP World Jebel Ali(*)(1) . . . . . . . . . . . . . . . . . 6,390 7,651 4,527 100% 2105Port Rashid (Dubai)(*) . . . . . . . . . . . . . . . . . . 1,229 1,272 451 100% 2105Mina Zayed (Abu Dhabi)(2) . . . . . . . . . . . . . . . 230 251 155 — —DP World Fujairah(*) . . . . . . . . . . . . . . . . . . . 47 31 11 100% 2035
Total . . . . . . . . . . . . . . . . . . . . . . . . . . . . 7,896 9,205 5,144
(*) Denotes a terminal that is consolidated for financial reporting purposes.
(1) The first phase of the expansion project at DP World Jebel Ali, which added 2.0 million TEUs of gross capacity, commencedoperations in the third quarter of 2007.
(2) Denotes a terminal where we hold operational control through a management contract but do not have an equity stake.
121
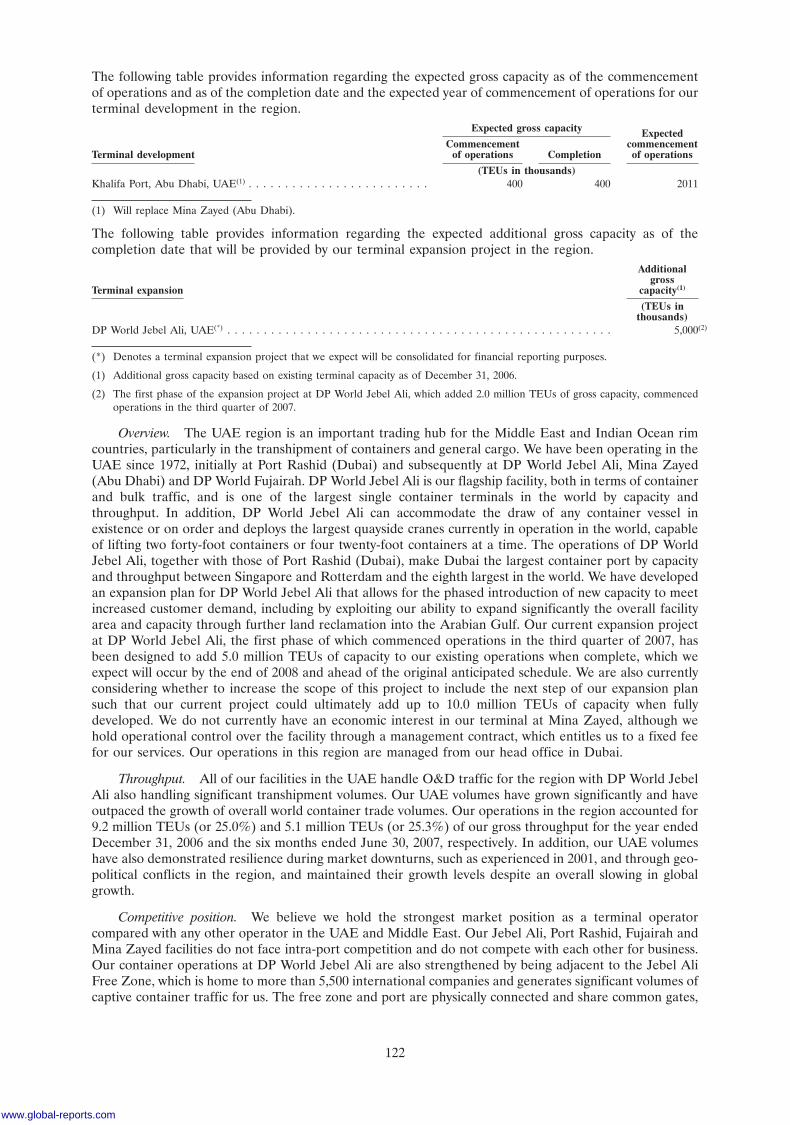
The following table provides information regarding the expected gross capacity as of the commencementof operations and as of the completion date and the expected year of commencement of operations for ourterminal development in the region.
Expected gross capacity ExpectedCommencement commencement
Terminal development of operations Completion of operations
(TEUs in thousands)Khalifa Port, Abu Dhabi, UAE(1) . . . . . . . . . . . . . . . . . . . . . . . . . 400 400 2011
(1) Will replace Mina Zayed (Abu Dhabi).
The following table provides information regarding the expected additional gross capacity as of thecompletion date that will be provided by our terminal expansion project in the region.
Additionalgross
Terminal expansion capacity(1)
(TEUs inthousands)
DP World Jebel Ali, UAE(*) . . . . . . . . . . . . . . . . . . . . . . . . . . . . . . . . . . . . . . . . . . . . . . . . . . . . . 5,000(2)
(*) Denotes a terminal expansion project that we expect will be consolidated for financial reporting purposes.
(1) Additional gross capacity based on existing terminal capacity as of December 31, 2006.
(2) The first phase of the expansion project at DP World Jebel Ali, which added 2.0 million TEUs of gross capacity, commencedoperations in the third quarter of 2007.
Overview. The UAE region is an important trading hub for the Middle East and Indian Ocean rimcountries, particularly in the transhipment of containers and general cargo. We have been operating in theUAE since 1972, initially at Port Rashid (Dubai) and subsequently at DP World Jebel Ali, Mina Zayed(Abu Dhabi) and DP World Fujairah. DP World Jebel Ali is our flagship facility, both in terms of containerand bulk traffic, and is one of the largest single container terminals in the world by capacity andthroughput. In addition, DP World Jebel Ali can accommodate the draw of any container vessel inexistence or on order and deploys the largest quayside cranes currently in operation in the world, capableof lifting two forty-foot containers or four twenty-foot containers at a time. The operations of DP WorldJebel Ali, together with those of Port Rashid (Dubai), make Dubai the largest container port by capacityand throughput between Singapore and Rotterdam and the eighth largest in the world. We have developedan expansion plan for DP World Jebel Ali that allows for the phased introduction of new capacity to meetincreased customer demand, including by exploiting our ability to expand significantly the overall facilityarea and capacity through further land reclamation into the Arabian Gulf. Our current expansion projectat DP World Jebel Ali, the first phase of which commenced operations in the third quarter of 2007, hasbeen designed to add 5.0 million TEUs of capacity to our existing operations when complete, which weexpect will occur by the end of 2008 and ahead of the original anticipated schedule. We are also currentlyconsidering whether to increase the scope of this project to include the next step of our expansion plansuch that our current project could ultimately add up to 10.0 million TEUs of capacity when fullydeveloped. We do not currently have an economic interest in our terminal at Mina Zayed, although wehold operational control over the facility through a management contract, which entitles us to a fixed feefor our services. Our operations in this region are managed from our head office in Dubai.
Throughput. All of our facilities in the UAE handle O&D traffic for the region with DP World JebelAli also handling significant transhipment volumes. Our UAE volumes have grown significantly and haveoutpaced the growth of overall world container trade volumes. Our operations in the region accounted for9.2 million TEUs (or 25.0%) and 5.1 million TEUs (or 25.3%) of our gross throughput for the year endedDecember 31, 2006 and the six months ended June 30, 2007, respectively. In addition, our UAE volumeshave also demonstrated resilience during market downturns, such as experienced in 2001, and through geo-political conflicts in the region, and maintained their growth levels despite an overall slowing in globalgrowth.
Competitive position. We believe we hold the strongest market position as a terminal operatorcompared with any other operator in the UAE and Middle East. Our Jebel Ali, Port Rashid, Fujairah andMina Zayed facilities do not face intra-port competition and do not compete with each other for business.Our container operations at DP World Jebel Ali are also strengthened by being adjacent to the Jebel AliFree Zone, which is home to more than 5,500 international companies and generates significant volumes ofcaptive container traffic for us. The free zone and port are physically connected and share common gates,
122
www.global-reports.com
29AUG200717130325
internal customs-bonded links and road systems, creating a logistics hub potentially capable of serving over2 billion consumers from West Asia to East Africa. We expect that Dubai World Central InternationalAirport, which is scheduled to commence initial operations by mid-2008, will increase considerably the sizeand scope of this world-class logistics zone and provide additional opportunities for sea-air freight services.When fully developed, the Dubai World Central International Airport is expected to have six parallelrunways and serve both cargo and passenger traffic. Our competition in the UAE Region is with otherregional ports such as Khorfakkan, UAE and Salalah, Oman.
Other activities. In addition to container cargo handling, certain of our facilities in the region offergeneral and bulk cargo handling, Ro-Ro, reefer and tanker facilities and container repair, commercialtrucking, sea-air cargo, logistics and/or other terminal services.
Strategy and business development. Our strategy at DP World Jebel Ali and Port Rashid (Dubai) is tocontinue to operate the two facilities as a combined operation in Dubai. At the request of our customers,we are currently moving the container handling facilities at Port Rashid (Dubai) to DP World Jebel Ali,which will allow Port Rashid (Dubai) to focus on bulk cargo, Ro-Ro and cruise ship handling. Given itssignificant excess capacity and location outside of the Strait of Hormuz, DP World Fujairah holds thepotential to develop as a deep-sea transhipment facility and we are exploring opportunities to promote itwith container shipping lines. This is helped by Fujairah Port being one of the largest bunkering ports inthe world, offering what we believe are competitive fuel prices for ships. At Mina Zayed (Abu Dhabi), weaim to focus operations on capturing growth from the robust economic developments that Abu Dhabi isexperiencing.
Our current development pipeline in the UAE is focused on the on-going terminal expansion at DP WorldJebel Ali pursuant to our existing expansion plan, which provides for the phased introduction of newcapacity to meet increased customer demand, including by exploiting our ability to expand significantly theoverall facility area and capacity through further land reclamation into the Arabian Gulf. We believe thatour expansion plan will ensure that DP World Jebel Ali remains the largest container port by capacity andthroughput in the wider Middle East region by a considerable margin for the foreseeable future. We expectthat our current expansion project at DP World Jebel Ali, which has been designed to add 5.0 millionTEUs of capacity to our existing operations when complete, will be completed by the end of 2008 andahead of the original anticipated schedule, and we are currently considering whether to increase the scopeof this project to include the next step of our expansion plan such that our current project could ultimatelyadd up to 10.0 million TEUs of capacity when fully developed, thereby doubling the terminal’s existingcapacity as of December 31, 2006. The commencement of development of further projects pursuant to ourexpansion plan will depend on the growth of market demand. In addition, in the second quarter of 2007,we and an affiliate of ours entered into cooperation agreements with Abu Dhabi Ports Company, whichwill see us operating the Khalifa Port in Abu Dhabi (which will replace our existing operations at MinaZayed (Abu Dhabi)).
Middle East (excluding UAE) Region
The following map indicates the locations of our operation in the Middle East (excluding UAE) operatingregion.
Container terminal
JeddahSouth Container
Terminal
123
The following table provides information regarding the gross throughput for the years ended December 31,2005 and 2006 and the six months ended June 30, 2007 and economic interest and concession agreementexpiration date as of December 31, 2006 for our terminal in the region.
Gross throughput As of December 31, 2006
Economic ConcessionContainer terminal 2005 2006 H1 2007 interest expiration
(TEUs in thousands)Saudi Arabia
Jeddah South Container Terminal(1) . . . . . . . . . . 1,568 1,503 738 — —
(1) Denotes a terminal where we hold operational control through a management contract but do not have an equity stake.
Overview. We have been present in Jeddah, Saudi Arabia since we won the contract to manageJeddah Port in 1999. We hold a management contract to manage our terminal at Jeddah, which is thelargest facility by capacity on the Red Sea. Our operations in this region are managed from Jeddah.
Throughput. Jeddah South Container Terminal targets both O&D and transhipment traffic, withtranshipment constituting the majority of throughput at the terminal. Our operations in the regionaccounted for 1.5 million TEUs (or 4.1%) and 0.7 million TEUs (or 3.6%) of our gross throughput for theyear ended December 31, 2006 and the six months ended June 30, 2007, respectively.
Competitive position. We currently face intra-port competition at Jeddah Port from the NorthTerminal in Jeddah. The Port Authority has also recently announced lease of a new container terminal,TUSDEER, that will be developed on existing land within the port adjoining the North Terminal, whichwill further increase competition. We face inter-port competition for regional transhipment throughputfrom Salalah and the Mediterranean hub ports for mainline relay business.
Other activities. In addition to our container terminal business, our terminal at Jeddah offers reeferfacilities.
Strategy and business development. Our strategy at Jeddah Port is to focus our efforts on securing ahigher proportion of high-paying domestic traffic at the expense of transhipment activity. Over the mediumterm, we will be working to ensure that our shipping line customers remain at the terminal when additionalcapacity is introduced to the market. We also intend to capture a much greater share of the local Riyadhcontainer cargo market, which will be realised by the rail land bridge that the Saudi Arabian Governmentintends to construct. The railway will connect Jeddah, Riyadh, and Damman in the Arabian Gulf, and willallow for the transhipment of containers destined for the Arabian Gulf at Jeddah, rather than havingvessels call inside the Gulf.
Our strategy for the region is to continue to review selected opportunities that display good growthprospects and weaker tariff constraints.
124
www.global-reports.com
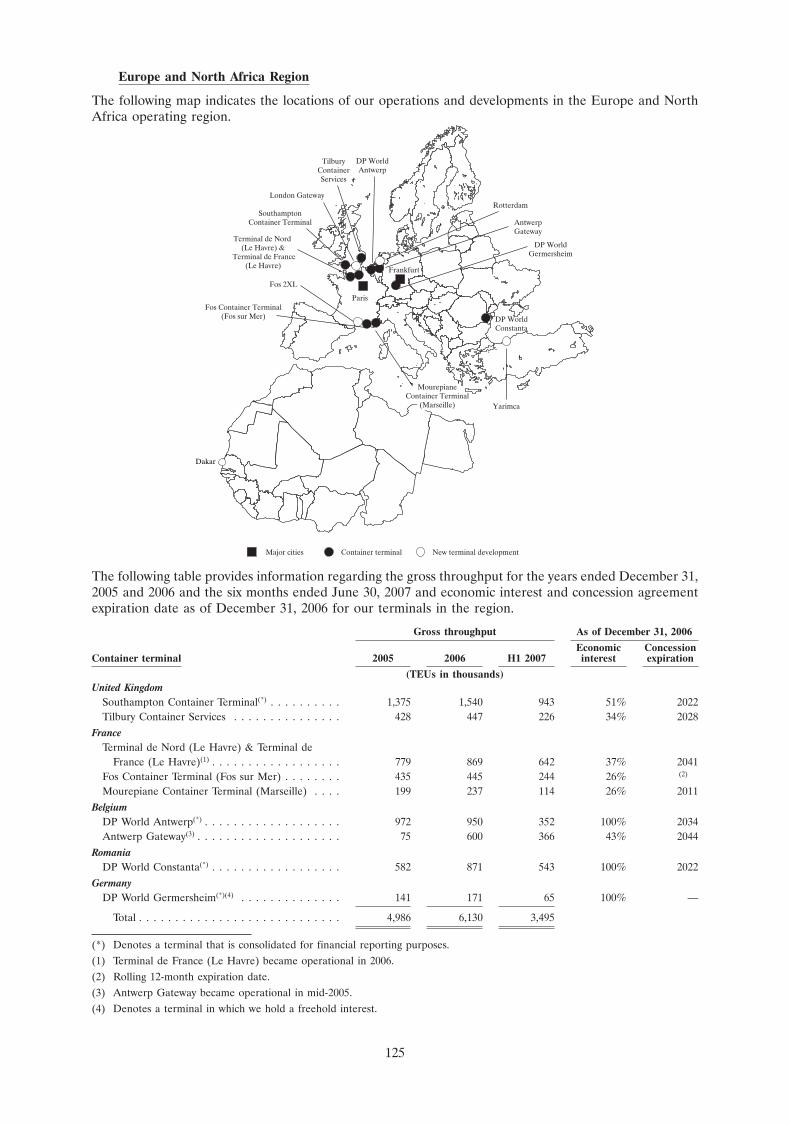
13NOV200710200425
Europe and North Africa Region
The following map indicates the locations of our operations and developments in the Europe and NorthAfrica operating region.
Major cities Container terminal New terminal development
Yarimca
DP WorldConstanta
Fos 2XL
Frankfurt
Fos Container Terminal(Fos sur Mer)
Paris
Terminal de Nord (Le Havre) &
Terminal de France(Le Havre)
SouthamptonContainer Terminal
London Gateway
TilburyContainerServices
DP WorldAntwerp
AntwerpGateway
Rotterdam
MourepianeContainer Terminal
(Marseille)
DP WorldGermersheim
Dakar
The following table provides information regarding the gross throughput for the years ended December 31,2005 and 2006 and the six months ended June 30, 2007 and economic interest and concession agreementexpiration date as of December 31, 2006 for our terminals in the region.
Gross throughput As of December 31, 2006
Economic ConcessionContainer terminal 2005 2006 H1 2007 interest expiration
(TEUs in thousands)United Kingdom
Southampton Container Terminal(*) . . . . . . . . . . 1,375 1,540 943 51% 2022Tilbury Container Services . . . . . . . . . . . . . . . 428 447 226 34% 2028
FranceTerminal de Nord (Le Havre) & Terminal de
France (Le Havre)(1) . . . . . . . . . . . . . . . . . . 779 869 642 37% 2041Fos Container Terminal (Fos sur Mer) . . . . . . . . 435 445 244 26% (2)
Mourepiane Container Terminal (Marseille) . . . . 199 237 114 26% 2011Belgium
DP World Antwerp(*) . . . . . . . . . . . . . . . . . . . 972 950 352 100% 2034Antwerp Gateway(3) . . . . . . . . . . . . . . . . . . . . 75 600 366 43% 2044
RomaniaDP World Constanta(*) . . . . . . . . . . . . . . . . . . 582 871 543 100% 2022
GermanyDP World Germersheim(*)(4) . . . . . . . . . . . . . . 141 171 65 100% —
Total . . . . . . . . . . . . . . . . . . . . . . . . . . . . 4,986 6,130 3,495
(*) Denotes a terminal that is consolidated for financial reporting purposes.(1) Terminal de France (Le Havre) became operational in 2006.(2) Rolling 12-month expiration date.(3) Antwerp Gateway became operational in mid-2005.(4) Denotes a terminal in which we hold a freehold interest.
125
The following table provides information regarding the expected gross capacity as of the commencementof operations and as of the completion date and the expected year of commencement of operations for ourterminal developments in the region.
Expected gross capacity ExpectedCommencement commencement
Terminal development of operations Completion of operations
(TEUs in thousands)
Fos 2XL, France . . . . . . . . . . . . . . . . . . . . . . . . . . . . . . . . . . . . 600 1,100 2009Yarimca, Turkey(*) . . . . . . . . . . . . . . . . . . . . . . . . . . . . . . . . . . . 1,000 1,000 2009London Gateway, United Kingdom(*) . . . . . . . . . . . . . . . . . . . . . . . 1,500 3,500 2010Dakar, Senegal(*)(1) . . . . . . . . . . . . . . . . . . . . . . . . . . . . . . . . . . 1,000 1,500 2011Rotterdam, Netherlands . . . . . . . . . . . . . . . . . . . . . . . . . . . . . . . 450 4,200 2013
(*) Denotes a terminal development project that we expect will be consolidated for financial reporting purposes.
(1) Excludes capacity at existing terminal in the Port of Dakar, Senegal, at which we expect to commence operations in 2008.
The following table provides information regarding the expected additional gross capacity as of therelevant completion date that will be provided by our terminal expansion projects in the region.
Additionalgross
Terminal expansion capacity(1)
(TEUs inthousands)
Deurganckdok, Belgium . . . . . . . . . . . . . . . . . . . . . . . . . . . . . . . . . . . . . . . . . . . . . . . . . . . . . . . 2,300Le Havre, France . . . . . . . . . . . . . . . . . . . . . . . . . . . . . . . . . . . . . . . . . . . . . . . . . . . . . . . . . . . . 500Constanta, Romania(*) . . . . . . . . . . . . . . . . . . . . . . . . . . . . . . . . . . . . . . . . . . . . . . . . . . . . . . . . . 400Germersheim, Germany(*) . . . . . . . . . . . . . . . . . . . . . . . . . . . . . . . . . . . . . . . . . . . . . . . . . . . . . . 200
(*) Denotes a terminal expansion project that we expect will be consolidated for financial reporting purposes.
(1) Additional gross capacity based on existing terminal capacity as of December 31, 2006.
Overview. We can trace our presence in the United Kingdom back to P&O’s formation in 1853 andwe currently operate container terminals in the ports of Southampton and Tilbury in the United Kingdom.With its acquisition of facilities in Belgium in 2000, P&O started a period of expansion into ContinentalEurope and we have since acquired or built facilities in France, Romania and Germany. With the exceptionof DP World Germersheim, our terminals offer deep-water facilities, which are strategically located toreach the major markets of the United Kingdom and Continental Europe. Our European operations aremanaged from London. Although we do not currently have any operations in North Africa, our businessdevelopment initiatives for this region are managed from London.
Throughput. Most of our facilities in Europe are focused on O&D traffic, which accounts for asignificant majority of regional throughput. Our operations at DP World Constanta, which handles asignificant amount of transhipment, is the most notable exception. Our operations in the region accountedfor 6.1 million TEUs (or 16.6%) and 3.5 million TEUs (or 17.2%) of our gross throughput for the yearended December 31, 2006 and the six months ended June 30, 2007, respectively. Our portfolio in Europe iswell established and enjoys moderate growth.
Competitive position. Western Europe is a well-established market characterised by high stability ofthroughput with moderate growth. Competition between ports across Western Europe is well developed,and our key global competitors HPH, APMT and PSA are well established there.
In the UK, HPH has recently received conditional approvals to expand the capacity of Felixstowe and todevelop the nearby Bathside Bay facility. As the dominant market player in the UK, it is expected thatFelixstowe’s expansion will allow growth of their existing customer base, the rate and extent of which willinfluence the growth of our operations. The next large capacity additions in Northern Europe will come inthe form of the Euromax terminal at Rotterdam, which is expected to start operations in 2008, and theMaasvlakte 2 project (also at Rotterdam), in which we will be involved. Other container terminal capacitywill be available in Hamburg and Port 2000 in Le Havre. The typical minimum development period fornew port projects in Northern Europe is at least 10 years (including planning, environmental approvals,funding and construction), and can take up to 20 years, meaning that there is good visibility regarding thelikely supply of terminal capacity over the next two decades.
126
www.global-reports.com
The Eastern European market is less well developed and has recently enjoyed high volume growth.DP World Constanta is the largest and most modern facility on the Black Sea and acts as a hub for otherBlack Sea ports in Ukraine, Bulgaria and Turkey. While Constanta Port is currently the only deep-sea portwith direct access to the Danube inland waterway (which handles container barge traffic to the formerYugoslavia), the Ukraine and Turkey are both developing modern, deep-water container terminals, whichmay compete with DP World Constanta for transhipment traffic or reduce the need for transhipment atConstanta Port. Nevertheless, we expect that overall growth in the Black Sea will compensate for this.
Other activities. In addition to container cargo handling, certain of our facilities in the region offergeneral and bulk cargo handling, Ro-Ro services, container freight station, stuffing and unstuffingwarehousing and reefer facilities and logistics, empty depot, custom documentation and/or other terminalservices. We also operate a fleet of Rhine River barges that connect DP World Germersheim with thedeep-water ports of Rotterdam and Antwerp and receive daily shuttle trains at the terminal with containersfrom Rotterdam.
Strategy and business development. Our strategy differs by terminal and is dependent on the dynamicsof the local market. In Western Europe, we will expand our operations where our customers have a strongrequirement for container handling capacity, most notably in the United Kingdom and France, whichcurrently have a considerable deficit of container-handling capacity. An increasingly congested transportinfrastructure is another issue that container terminals in the UK have faced in recent years, which,together with the lack of adequate capacity, has caused some shipping lines to consider dropping south-east UK ports from some of their deep-sea services and instead feed the UK market from ContinentalEurope. To meet demand for capacity, we are planning to construct a new container terminal and businesspark at London Gateway near London, United Kingdom. London Gateway will be a state-of-the-artfreehold container terminal facility and we believe that, once developed, it will be our flagship facility inthe United Kingdom and will help to encourage shipping lines to maintain UK calls as part of theirmainline services. In France, our Fos 2XL joint-venture development project will result in the significantexpansion of the Port of Fos (which is near Marseille) and, given that we will have full operational rights,we believe that the project will allow us to improve efficiency levels at the port. Also, in the third quarter of2007, a consortium of which we are part was awarded the right to equip and operate the first terminal inthe Maasvlakte 2 development in Rotterdam, Netherlands.
In Eastern Europe, we plan to focus on expanding the natural hinterland of our operations at DP WorldConstanta further into Eastern Europe by promoting rail and barge connectivity in order to increasecaptive traffic, as transhipment activity may decline in the future for the reasons discussed above.
In addition, we will seek to expand our presence in the Mediterranean and Black Sea regions and alsoestablish a base in North Africa, as we believe that this region offers untapped potential for rapidthroughput growth and strong earnings and will be an important region for future business development.As part of this strategy, we secured a new concession at Yarimca, Turkey, which is located in the Gulf ofIzmit, where there are currently no deep-water ports capable of servicing the many car manufacturers, tyreand white goods industries located in the region or the growing consumer population and, consequently,we expect considerable growth in demand from local manufacturers to support the development as a majorO&D terminal for the region. We believe that our Yarimca development will also benefit from its strategicposition outside the Bosporus Straits by offering an alternative for periods when the Bosporus may betemporarily inaccessible because of congestion or poor weather conditions. Also, in the second quarter of2007, we were awarded the concession to develop and operate the existing container terminal in the Port ofDakar, Senegal and invest in a new terminal at the Port. We expect that the first phase of developmentof the existing terminal will be operational by 2008 and that the new terminal will be operational by 2011.
127
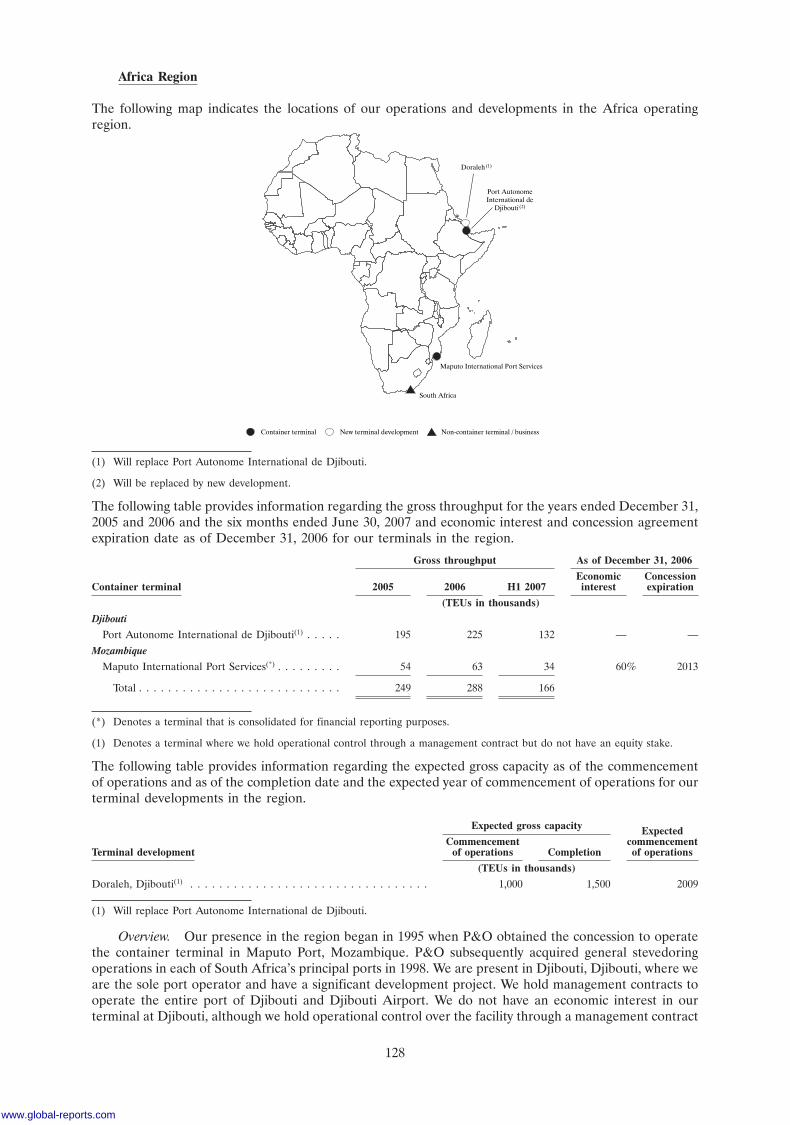
25SEP200720084083
Africa Region
The following map indicates the locations of our operations and developments in the Africa operatingregion.
Container terminal New terminal development Non-container terminal / business
Doraleh(1)
Port AutonomeInternational de
Djibouti (2)
Maputo International Port Services
South Africa
(1) Will replace Port Autonome International de Djibouti.
(2) Will be replaced by new development.
The following table provides information regarding the gross throughput for the years ended December 31,2005 and 2006 and the six months ended June 30, 2007 and economic interest and concession agreementexpiration date as of December 31, 2006 for our terminals in the region.
Gross throughput As of December 31, 2006
Economic ConcessionContainer terminal 2005 2006 H1 2007 interest expiration
(TEUs in thousands)
Djibouti
Port Autonome International de Djibouti(1) . . . . . 195 225 132 — —Mozambique
Maputo International Port Services(*) . . . . . . . . . 54 63 34 60% 2013
Total . . . . . . . . . . . . . . . . . . . . . . . . . . . . 249 288 166
(*) Denotes a terminal that is consolidated for financial reporting purposes.
(1) Denotes a terminal where we hold operational control through a management contract but do not have an equity stake.
The following table provides information regarding the expected gross capacity as of the commencementof operations and as of the completion date and the expected year of commencement of operations for ourterminal developments in the region.
Expected gross capacity ExpectedCommencement commencement
Terminal development of operations Completion of operations
(TEUs in thousands)
Doraleh, Djibouti(1) . . . . . . . . . . . . . . . . . . . . . . . . . . . . . . . . . 1,000 1,500 2009
(1) Will replace Port Autonome International de Djibouti.
Overview. Our presence in the region began in 1995 when P&O obtained the concession to operatethe container terminal in Maputo Port, Mozambique. P&O subsequently acquired general stevedoringoperations in each of South Africa’s principal ports in 1998. We are present in Djibouti, Djibouti, where weare the sole port operator and have a significant development project. We hold management contracts tooperate the entire port of Djibouti and Djibouti Airport. We do not have an economic interest in ourterminal at Djibouti, although we hold operational control over the facility through a management contract
128
www.global-reports.com
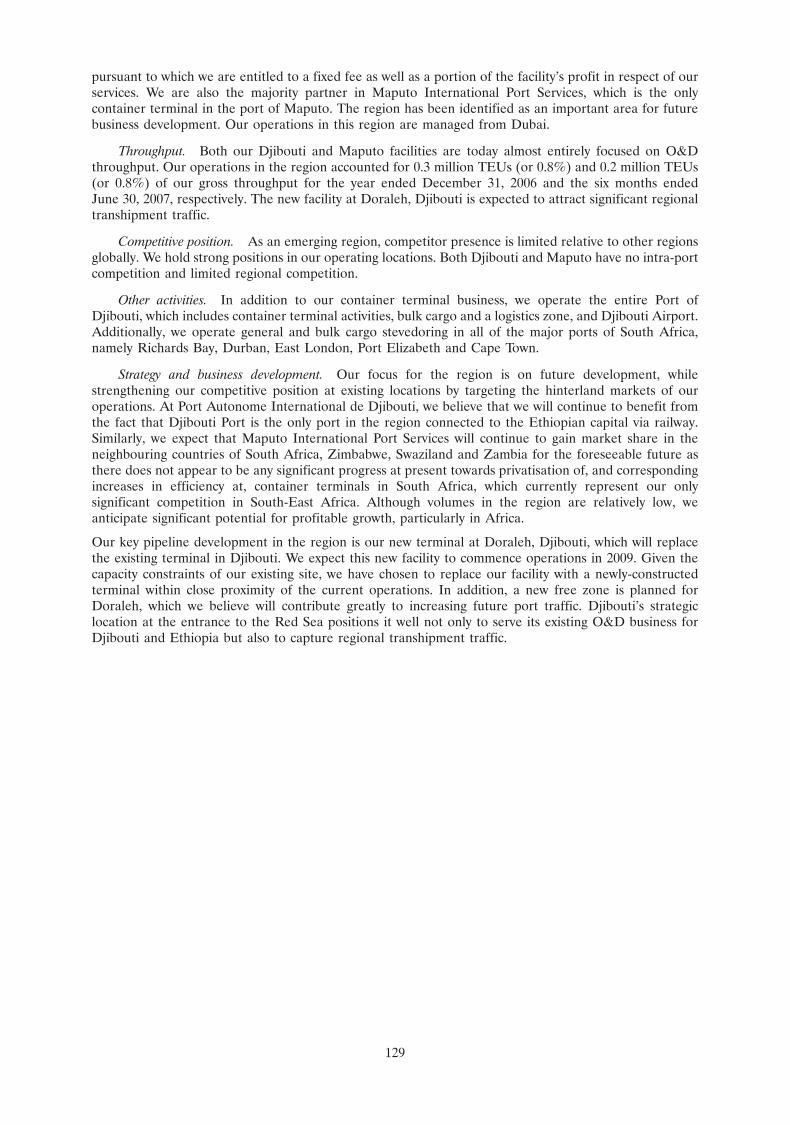
pursuant to which we are entitled to a fixed fee as well as a portion of the facility’s profit in respect of ourservices. We are also the majority partner in Maputo International Port Services, which is the onlycontainer terminal in the port of Maputo. The region has been identified as an important area for futurebusiness development. Our operations in this region are managed from Dubai.
Throughput. Both our Djibouti and Maputo facilities are today almost entirely focused on O&Dthroughput. Our operations in the region accounted for 0.3 million TEUs (or 0.8%) and 0.2 million TEUs(or 0.8%) of our gross throughput for the year ended December 31, 2006 and the six months endedJune 30, 2007, respectively. The new facility at Doraleh, Djibouti is expected to attract significant regionaltranshipment traffic.
Competitive position. As an emerging region, competitor presence is limited relative to other regionsglobally. We hold strong positions in our operating locations. Both Djibouti and Maputo have no intra-portcompetition and limited regional competition.
Other activities. In addition to our container terminal business, we operate the entire Port ofDjibouti, which includes container terminal activities, bulk cargo and a logistics zone, and Djibouti Airport.Additionally, we operate general and bulk cargo stevedoring in all of the major ports of South Africa,namely Richards Bay, Durban, East London, Port Elizabeth and Cape Town.
Strategy and business development. Our focus for the region is on future development, whilestrengthening our competitive position at existing locations by targeting the hinterland markets of ouroperations. At Port Autonome International de Djibouti, we believe that we will continue to benefit fromthe fact that Djibouti Port is the only port in the region connected to the Ethiopian capital via railway.Similarly, we expect that Maputo International Port Services will continue to gain market share in theneighbouring countries of South Africa, Zimbabwe, Swaziland and Zambia for the foreseeable future asthere does not appear to be any significant progress at present towards privatisation of, and correspondingincreases in efficiency at, container terminals in South Africa, which currently represent our onlysignificant competition in South-East Africa. Although volumes in the region are relatively low, weanticipate significant potential for profitable growth, particularly in Africa.
Our key pipeline development in the region is our new terminal at Doraleh, Djibouti, which will replacethe existing terminal in Djibouti. We expect this new facility to commence operations in 2009. Given thecapacity constraints of our existing site, we have chosen to replace our facility with a newly-constructedterminal within close proximity of the current operations. In addition, a new free zone is planned forDoraleh, which we believe will contribute greatly to increasing future port traffic. Djibouti’s strategiclocation at the entrance to the Red Sea positions it well not only to serve its existing O&D business forDjibouti and Ethiopia but also to capture regional transhipment traffic.
129
23OCT200718274038
Asia-Pacific and Indian Subcontinent
Asia-Pacific Region
The following map indicates the locations of our operations and developments in the Asia-Pacificoperating region.
Major cities
Non-container terminal / business
Container terminal
New terminal development
Beijing
PusanNewport Company
Seoul
VostochnayaStevedore Company
DP WorldYantai
ShanghaiQingdao (Phase IV)
Asia TerminalsIncorporated
Yantian
ACT (CT8) (Hong Kong)CT3 (Hong Kong)
TerminalPetikemas Surabaya
Jakarta
Bangkok
Hong Kong
Laem ChabangInternational Terminal
Ho Chi Minh City
QingdaoQianwan Container
Terminal
TianjinOrient Container
Terminals
The following table provides information regarding the gross throughput for the years ended December 31,2005 and 2006 and the six months ended June 30, 2007 and economic interest and concession agreementexpiration date as of December 31, 2006 for our terminals in the region.
Gross throughput As of December 31, 2006
Economic ConcessionContainer terminal 2005 2006 H1 2007 interest expiration
(TEUs in thousands)
China
Qingdao Qianwan Container Terminal(1) . . . . . . . . . 4,619 5,580 3,142 29% (2)
Tianjin Orient Container Terminals . . . . . . . . . . . . 1,078 1,125 594 25% 2027ACT (CT8) (Hong Kong) . . . . . . . . . . . . . . . . . . . 344 1,041 530 55% 2047CT3 (Hong Kong)(*) . . . . . . . . . . . . . . . . . . . . . . 276 542 229 67% 2047DP World Yantai . . . . . . . . . . . . . . . . . . . . . . . . 241 320 176 33%(3) 2033
Thailand
Laem Chabang International Terminal . . . . . . . . . . . 1,273 1,286 570 35% (4)
Indonesia
Terminal Petikemas Surabaya . . . . . . . . . . . . . . . . 1,073 1,059 558 49% 2019
Philippines
Asia Terminals Incorporated(*) . . . . . . . . . . . . . . . . 643 717 380 84% 2013(5)
Russia
Vostochnaya Stevedore Company(6) . . . . . . . . . . . . . 296 291 175 25% —
South Korea
Pusan Newport Company(7) . . . . . . . . . . . . . . . . . . — 250 246 40% 2056
Total . . . . . . . . . . . . . . . . . . . . . . . . . . . . . . 9,843 12,211 6,600
(*) Denotes a terminal that is consolidated for financial reporting purposes.
(1) The Phase III(b) expansion project at Qingdao Qianwan Container Terminal, which added 2.0 million TEUs of gross capacity,commenced operations in the second quarter of 2007.
(2) Phase II: 2030; Phase III(a): 2034; Phase III(b): 2037.
130
www.global-reports.com
(3) Effective August 1, 2006, our economic interest reduced to 33% from 50%.
(4) Container terminal B5: 2026; Container terminal C3: 2033.
(5) Effective October 19, 2007, the expiration date was extended to 2038.
(6) Denotes a terminal in which we hold a freehold interest.
(7) Phases 1-1A and 1-1B became operational in 2006 and 2007, respectively.
The following table provides information regarding the expected gross capacity as of the commencementof operations and as of the completion date and the expected year of commencement of operations for ourterminal developments in the region.
Expected gross capacity ExpectedCommencement commencement
Terminal development of operations Completion of operations
(TEUs in thousands)
Ho Chi Minh City, Vietnam(*) . . . . . . . . . . . . . . . . . . . . . . . . . . . 800 1,500 2009Qingdao (Phase IV), China . . . . . . . . . . . . . . . . . . . . . . . . . . . . . 2,000 6,000 2010
(*) Denotes a terminal development project that we expect will be consolidated for financial reporting purposes.
The following table provides information regarding the expected additional gross capacity as of therelevant completion date that will be provided by our terminal expansion projects in the region.
Additionalgross
Terminal expansion capacity(1)
(TEUs inthousands)
Pusan (Phase 1-2), South Korea . . . . . . . . . . . . . . . . . . . . . . . . . . . . . . . . . . . . . . . . . . . . . . . . . . 2,200Qingdao (Phase III(b)), China . . . . . . . . . . . . . . . . . . . . . . . . . . . . . . . . . . . . . . . . . . . . . . . . . . . 2,000(2)
(1) Additional gross capacity based on existing terminal capacity as of December 31, 2006.
(2) The Phase III(b) expansion project at Qingdao Qianwan Container Terminal, which added 2.0 million TEUs of gross capacity,commenced operations in the second quarter of 2007.
Overview. Our origins in the region date back to 1973, when Sea-Land Service, Inc. (‘‘Sea-Land’’),which was acquired by CSX Corporation in 1986, developed CT3 (Hong Kong). It subsequently developedadditional significant operations in China (including Hong Kong), as well as a greenfield project in Pusan,South Korea, which commenced operations in 2006. P&O also had an established presence in the region,participating in the privatisation of the container terminal at Port Kelang, Malaysia, which it subsequentlydivested. Since the early 1990s, P&O gradually acquired or built facilities in China (including Hong Kong),the Philippines, Indonesia, Russia and Thailand. We currently have a strong presence in key manufacturingheartlands of China and also have interests in the fast growing economies of South-East Asia. OurAsia-Pacific operations are managed from Hong Kong, with sub-regional offices in Shanghai, whichfocuses on north and central China, and Manila, which focuses on South-East Asia and Russia.
Throughput. For most of the past decade, China and, to a lesser extent, the other South-East Asiannations have been driving world trade growth. Our operations in the region accounted for 12.2 millionTEUs (or 33.2%) and 6.6 million TEUs (or 32.5%) of our gross throughput for the year endedDecember 31, 2006 and the six months ended June 30, 2007, respectively. Our terminals are focused onO&D trade, with the exceptions of Hong Kong, which, alongside Singapore, is a major transhipment hubfor the region, and our new operations at Pusan Newport Company in South Korea, which targets bothO&D and regional transhipment volume.
Competitive position. With ten container terminals, we have a significant presence in the Asia-Pacificmarket, with a strong presence in the key gateway ports in China and in many strategic locations across theregion. We face intra-port competition at many of our terminals, and our key global competitors HPH andPSA both have a strong presence in the region, particularly in China and Singapore, respectively. Inaddition, our operations at Qingdao Qianwan Container Terminal, DP World Yantai and Laem ChabangInternational Terminal each face intra-port competition from new terminals that have already commencedoperations or will do so in the near future. Compared to our competitors, our focus in China is in BohaiBasin, which is one of the key manufacturing regions in China, and Southern China.
131
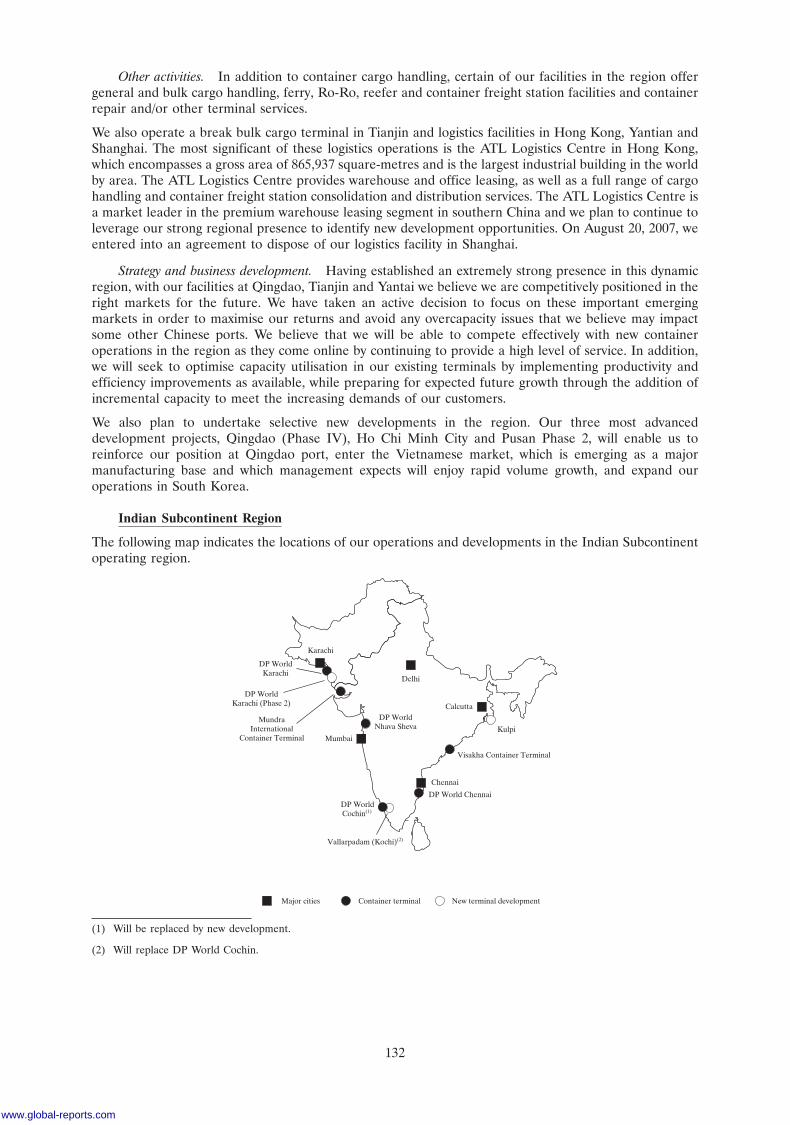
29AUG200717130196
Other activities. In addition to container cargo handling, certain of our facilities in the region offergeneral and bulk cargo handling, ferry, Ro-Ro, reefer and container freight station facilities and containerrepair and/or other terminal services.
We also operate a break bulk cargo terminal in Tianjin and logistics facilities in Hong Kong, Yantian andShanghai. The most significant of these logistics operations is the ATL Logistics Centre in Hong Kong,which encompasses a gross area of 865,937 square-metres and is the largest industrial building in the worldby area. The ATL Logistics Centre provides warehouse and office leasing, as well as a full range of cargohandling and container freight station consolidation and distribution services. The ATL Logistics Centre isa market leader in the premium warehouse leasing segment in southern China and we plan to continue toleverage our strong regional presence to identify new development opportunities. On August 20, 2007, weentered into an agreement to dispose of our logistics facility in Shanghai.
Strategy and business development. Having established an extremely strong presence in this dynamicregion, with our facilities at Qingdao, Tianjin and Yantai we believe we are competitively positioned in theright markets for the future. We have taken an active decision to focus on these important emergingmarkets in order to maximise our returns and avoid any overcapacity issues that we believe may impactsome other Chinese ports. We believe that we will be able to compete effectively with new containeroperations in the region as they come online by continuing to provide a high level of service. In addition,we will seek to optimise capacity utilisation in our existing terminals by implementing productivity andefficiency improvements as available, while preparing for expected future growth through the addition ofincremental capacity to meet the increasing demands of our customers.
We also plan to undertake selective new developments in the region. Our three most advanceddevelopment projects, Qingdao (Phase IV), Ho Chi Minh City and Pusan Phase 2, will enable us toreinforce our position at Qingdao port, enter the Vietnamese market, which is emerging as a majormanufacturing base and which management expects will enjoy rapid volume growth, and expand ouroperations in South Korea.
Indian Subcontinent Region
The following map indicates the locations of our operations and developments in the Indian Subcontinentoperating region.
Major cities Container terminal New terminal development
DP WorldCochin(1)
Vallarpadam (Kochi)(2)
DP World Chennai
Chennai
Visakha Container Terminal
Kulpi
Calcutta
Delhi
Mumbai
MundraInternational
Container Terminal
DP WorldNhava Sheva
Karachi
DP WorldKarachi
DP WorldKarachi (Phase 2)
(1) Will be replaced by new development.
(2) Will replace DP World Cochin.
132
www.global-reports.com
The following table provides information regarding the gross throughput for the years ended December 31,2005 and 2006 and the six months ended June 30, 2007 and economic interest and concession agreementexpiration date as of December 31, 2006 for our terminals in the region.
Gross throughput As of December 31, 2006
Economic ConcessionContainer terminal 2005 2006 H1 2007 interest expiration
(TEUs in thousands)India
DP World Nhava Sheva(*) . . . . . . . . . . . . . . . . . . . 1,311 1,344 718 100% 2027DP World Chennai(*) . . . . . . . . . . . . . . . . . . . . . . 700 829 499 75% 2031Mundra International Container Terminal(*) . . . . . . . 298 460 324 100% 2031DP World Cochin(*) . . . . . . . . . . . . . . . . . . . . . . 150 219 115 76% 2035Visakha Container Terminal . . . . . . . . . . . . . . . . . 48 53 29 26% 2032
PakistanDP World Karachi(*) . . . . . . . . . . . . . . . . . . . . . . 544 629 332 55% 2025
Total . . . . . . . . . . . . . . . . . . . . . . . . . . . . . . 3,051 3,534 2,017
(*) Denotes a terminal that is consolidated for financial reporting purposes.
The following table provides information regarding the expected gross capacity as of the commencementof operations and as of the completion date and the expected year of commencement of operations for ourterminal developments in the region.
Expected gross capacity ExpectedCommencement commencement
Terminal development of operations Completion of operations
(TEUs in thousands)Vallarpadam (Kochi), India(*)(1) . . . . . . . . . . . . . . . . . . . . . . . . . . 1,000 3,000 2009Kulpi, India(*) . . . . . . . . . . . . . . . . . . . . . . . . . . . . . . . . . . . . . 600 1,400 2009DP World Karachi Phase 2, Pakistan(*) . . . . . . . . . . . . . . . . . . . . . . 400 1,200 2009
(*) Denotes a terminal development project that we expect will be consolidated for financial reporting purposes.
(1) Will replace DP World Cochin.
Overview. We have had a decade-long presence in the region, which started in 1997 with P&Oobtaining the concession to operate Qasim International Container Terminal (now DP World Karachi) inBin Qasim, Pakistan and participating in the first Indian port privatisation at Nhava Sheva InternationalContainer Terminal (now DP World Nhava Sheva) in the Jawaharlal Nehru Port Trust, Navi Mumbai.Since then, we have expanded our presence in the region significantly. Our terminals are well-positioned toservice customers in the hinterlands of India and Pakistan and, with the addition of Kulpi, we will have astrategic gateway presence around the entire circumference of the Subcontinent. We manage our activitiesin the Indian Subcontinent region from our regional office in Mumbai.
Throughput. Our terminals in the region have experienced strong volume growth driven by robusteconomic activity levels. All of our terminals in the region are significantly focussed on the O&D trade.Our operations in the region accounted for 3.5 million TEUs (or 9.6%) and 2.0 million TEUs (or 9.9%) ofour gross throughput for the year ended December 31, 2006 and the six months ended June 30, 2007,respectively.
Competitive position. We are a market leader in the Indian Subcontinent region. We face intra-portand regional competition from other global operators. Our strong position, combined with a highproportion of O&D traffic and market growth potential, makes the region an extremely important part ofour global portfolio. With the exception of our operations at Mundra International Container Terminal, allof our operations in India fall within the purview of the Indian Tariff Authority for Major Ports (‘‘TAMP’’),which regulates tariffs at such operations.
Other activities. In addition to container cargo handling, certain of our facilities in the region offergeneral and bulk cargo handling, container storage, internal terminal transport, reefer and containerfreight station facilities, lashing, stuffing and de-stuffing and/or other terminal services.
Strategy and business development. The outlook for demand in the region is very promising, given theemergence of India as a major manufacturing base and the growing levels of consumer demand. Againstthis backdrop, supply of capacity remains very limited, in part due to landside logistic limitations. In 2006,
133
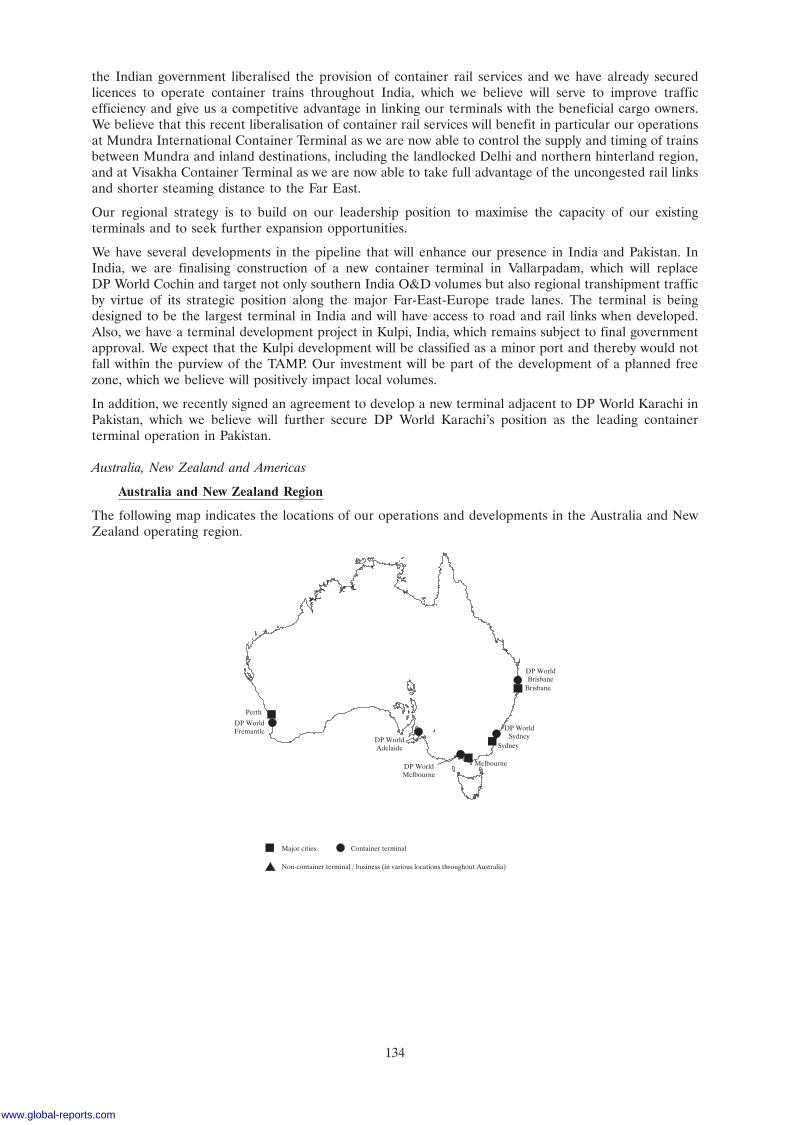
29AUG200717125357
the Indian government liberalised the provision of container rail services and we have already securedlicences to operate container trains throughout India, which we believe will serve to improve trafficefficiency and give us a competitive advantage in linking our terminals with the beneficial cargo owners.We believe that this recent liberalisation of container rail services will benefit in particular our operationsat Mundra International Container Terminal as we are now able to control the supply and timing of trainsbetween Mundra and inland destinations, including the landlocked Delhi and northern hinterland region,and at Visakha Container Terminal as we are now able to take full advantage of the uncongested rail linksand shorter steaming distance to the Far East.
Our regional strategy is to build on our leadership position to maximise the capacity of our existingterminals and to seek further expansion opportunities.
We have several developments in the pipeline that will enhance our presence in India and Pakistan. InIndia, we are finalising construction of a new container terminal in Vallarpadam, which will replaceDP World Cochin and target not only southern India O&D volumes but also regional transhipment trafficby virtue of its strategic position along the major Far-East-Europe trade lanes. The terminal is beingdesigned to be the largest terminal in India and will have access to road and rail links when developed.Also, we have a terminal development project in Kulpi, India, which remains subject to final governmentapproval. We expect that the Kulpi development will be classified as a minor port and thereby would notfall within the purview of the TAMP. Our investment will be part of the development of a planned freezone, which we believe will positively impact local volumes.
In addition, we recently signed an agreement to develop a new terminal adjacent to DP World Karachi inPakistan, which we believe will further secure DP World Karachi’s position as the leading containerterminal operation in Pakistan.
Australia, New Zealand and Americas
Australia and New Zealand Region
The following map indicates the locations of our operations and developments in the Australia and NewZealand operating region.
Major cities Container terminal
Non-container terminal / business (in various locations throughout Australia)
Perth
DP WorldFremantle
DP WorldAdelaide
DP WorldMelbourne
Melbourne
Sydney
DP WorldSydney
Brisbane
DP WorldBrisbane
134
www.global-reports.com
The following table provides information regarding the gross throughput for the years ended December 31,2005 and 2006 and the six months ended June 30, 2007 and economic interest and concession agreementexpiration date as of December 31, 2006 for our terminals in the region.
Gross throughput As of December 31, 2006
Economic ConcessionContainer terminal 2005 2006 H1 2007 interest expiration
(TEUs in thousands)Australia
DP World Melbourne(*) . . . . . . . . . . . . . . . . . . . . 739 805 401 100% 2033DP World Sydney(*) . . . . . . . . . . . . . . . . . . . . . . 646 721 338 90% 2009DP World Brisbane(*) . . . . . . . . . . . . . . . . . . . . . 380 439 204 100% 2012DP World Fremantle(*) . . . . . . . . . . . . . . . . . . . . 223 259 131 100% 2017DP World Adelaide(*) . . . . . . . . . . . . . . . . . . . . . 193 202 117 85%(1) 2009
Total . . . . . . . . . . . . . . . . . . . . . . . . . . . . . . 2,181 2,426 1,191
(*) Denotes a terminal that is consolidated for financial reporting purposes
(1) Effective February 28, 2007, our economic interest increased to 100% from 85%.
The following table provides information regarding the expected additional gross capacity as of thecompletion date that will be provided by our terminal expansion project in the region.
Additionalgross
Terminal expansion capacity(1)
(TEUs inthousands)
Adelaide, Australia(*) . . . . . . . . . . . . . . . . . . . . . . . . . . . . . . . . . . . . . . . . . . . . . . . . . . . . . . . . . 350
(*) Denotes a terminal expansion project that we expect will be consolidated for financial reporting purposes.
(1) Additional gross capacity based on existing terminal capacity as of December 31, 2006.
Overview. We operate container terminals in each of five state capital cities of Australia—Brisbane,Sydney, Melbourne, Adelaide and Fremantle (serving Perth)—and can trace the origins of our operationsin Australia to the formation of P&O in 1853. We also have significant investments in Australia inautomotive and general cargo stevedoring and logistics businesses, which act as an off-wharf complementto our container terminals. We consider the region to be an extremely valuable portion of our portfolio dueto its attractive business mix and our sizeable market presence in established facilities. In addition, all ofour terminal operations in Australia benefit from excellent rail links between the terminals and therelevant surrounding hinterland. In July 2006, we disposed of our New Zealand-based transport andgeneral stevedoring business and, consequently, we currently do not have any operations in New Zealand.Our facilities in Australia are managed out of our Sydney office.
Throughput. Our facilities in Australia are principally focused on O&D traffic. Our operations in theregion accounted for 2.4 million TEUs (or 6.6%) and 1.2 million TEUs (or 5.9%) of our gross throughputfor the year ended December 31, 2006 and the six months ended June 30, 2007, respectively.
Competitive position. Historically, the major Australian ports of Sydney, Melbourne, Brisbane andFremantle have each developed dual container terminal operator structures to ensure that competitionexists within each port and we are one of only two companies that currently operate container terminals inAustralia. Our competitor is the Asciano Group’s Patrick Stevedores division, which it acquired in 2006and is present in every port in which we operate except Adelaide, where we operate the only containerterminal. Recently, however, there has been a push towards the inclusion of additional operators. Forinstance, in April 2007, the Port of Brisbane announced that its preferred operator in respect of a new two-berth container terminal is HPH, thereby introducing a third operator into the Australian market. Thesetwo new berths are expected to commence operations in 2012 and 2014. Similarly, the New South WalesGovernment has approved a new four-berth expansion of the Port Botany container facilities, where DPWorld Sydney is located, to be completed by 2011 and has expressed a desire to see a third operator enterthe port following the expansion.
Other activities. In April 2007, we sold a 50% stake in the group of companies known as POTA,which operates a landside logistics business in Australia (other than in South Australia), and a 75% stakein the business known as P&O AGS, which was previously part of DP World Australia Limited and
135
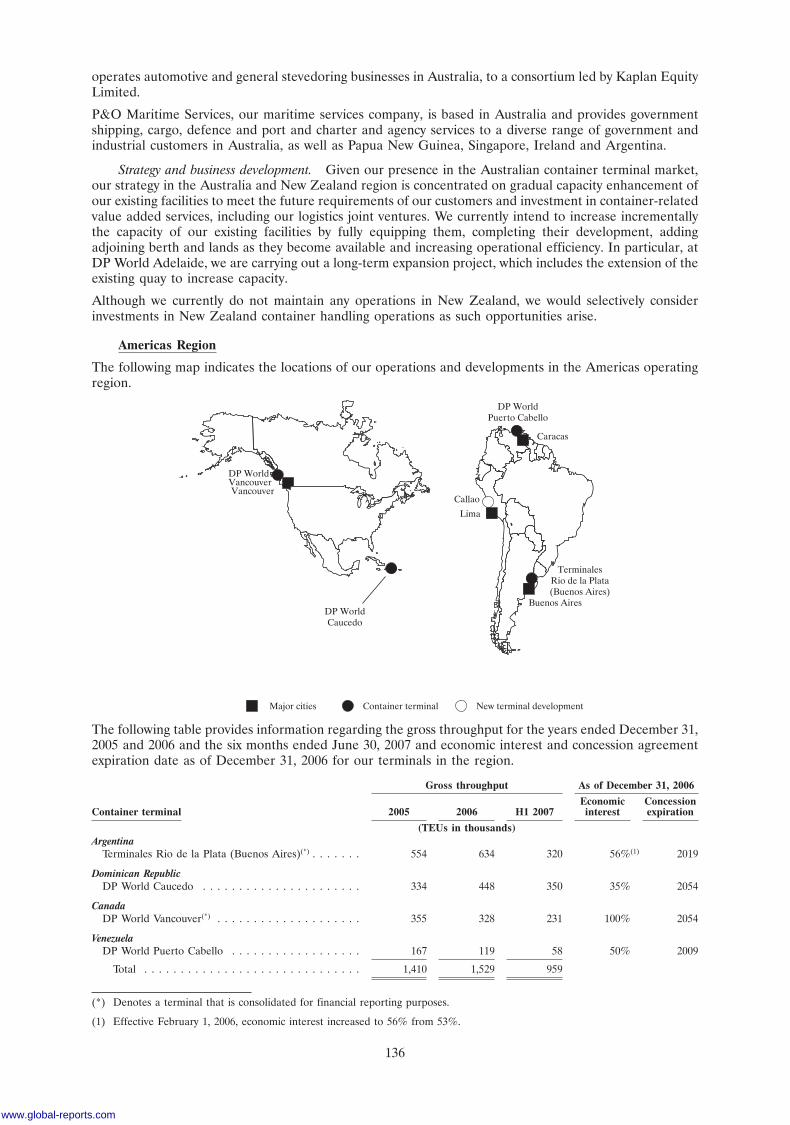
25SEP200721033961
operates automotive and general stevedoring businesses in Australia, to a consortium led by Kaplan EquityLimited.
P&O Maritime Services, our maritime services company, is based in Australia and provides governmentshipping, cargo, defence and port and charter and agency services to a diverse range of government andindustrial customers in Australia, as well as Papua New Guinea, Singapore, Ireland and Argentina.
Strategy and business development. Given our presence in the Australian container terminal market,our strategy in the Australia and New Zealand region is concentrated on gradual capacity enhancement ofour existing facilities to meet the future requirements of our customers and investment in container-relatedvalue added services, including our logistics joint ventures. We currently intend to increase incrementallythe capacity of our existing facilities by fully equipping them, completing their development, addingadjoining berth and lands as they become available and increasing operational efficiency. In particular, atDP World Adelaide, we are carrying out a long-term expansion project, which includes the extension of theexisting quay to increase capacity.
Although we currently do not maintain any operations in New Zealand, we would selectively considerinvestments in New Zealand container handling operations as such opportunities arise.
Americas Region
The following map indicates the locations of our operations and developments in the Americas operatingregion.
Major cities Container terminal New terminal development
DP WorldCaucedo
DP WorldVancouver
TerminalesRio de la Plata(Buenos Aires)
DP WorldPuerto Cabello
Caracas
Callao
Lima
Buenos Aires
Vancouver
The following table provides information regarding the gross throughput for the years ended December 31,2005 and 2006 and the six months ended June 30, 2007 and economic interest and concession agreementexpiration date as of December 31, 2006 for our terminals in the region.
Gross throughput As of December 31, 2006
Economic ConcessionContainer terminal 2005 2006 H1 2007 interest expiration
(TEUs in thousands)Argentina
Terminales Rio de la Plata (Buenos Aires)(*) . . . . . . . 554 634 320 56%(1) 2019
Dominican RepublicDP World Caucedo . . . . . . . . . . . . . . . . . . . . . . 334 448 350 35% 2054
CanadaDP World Vancouver(*) . . . . . . . . . . . . . . . . . . . . 355 328 231 100% 2054
VenezuelaDP World Puerto Cabello . . . . . . . . . . . . . . . . . . 167 119 58 50% 2009
Total . . . . . . . . . . . . . . . . . . . . . . . . . . . . . . 1,410 1,529 959
(*) Denotes a terminal that is consolidated for financial reporting purposes.
(1) Effective February 1, 2006, economic interest increased to 56% from 53%.
136
www.global-reports.com
The following table provides information regarding the expected gross capacity as of the commencementof operations and as of the completion date and the expected year of commencement of operations for ourterminal development in the region.
Expected gross capacity ExpectedCommencement commencement
Terminal development of operations Completion of operations
(TEUs in thousands)Callao, Peru(*) . . . . . . . . . . . . . . . . . . . . . . . . . . . . . . . . . . . . . 900 1,400 2010
(*) Denotes a terminal development project that we expect will be consolidated for financial reporting purposes.
The following table provides information regarding the expected additional gross capacity as of therelevant completion date that will be provided by our terminal expansion projects in the region.
Additionalgross
Terminal expansion capacity(1)
(TEUs inthousands)
Buenos Aires, Argentina(*) . . . . . . . . . . . . . . . . . . . . . . . . . . . . . . . . . . . . . . . . . . . . . . . . . . . . . . 450Caucedo, Dominican Republic . . . . . . . . . . . . . . . . . . . . . . . . . . . . . . . . . . . . . . . . . . . . . . . . . . . 450Vancouver, Canada(*) . . . . . . . . . . . . . . . . . . . . . . . . . . . . . . . . . . . . . . . . . . . . . . . . . . . . . . . . . 350
(*) Denotes a terminal expansion project that we expect will be consolidated for financial reporting purposes.
(1) Additional gross capacity based on existing terminal capacity as of December 31, 2006.
Overview. P&O entered the South American market in 1994 when it was awarded the concession tooperate Terminales Rio de la Plata (Buenos Aires). In addition, CSX WT has had a presence in SouthAmerica since 2001 when it commenced operations in Cabello, Venezuela. Since then, CSX WT developedadditional operations at Caucedo, Dominican Republic and P&O acquired operations in Vancouver,Canada. Our portfolio in the Americas region has been recently strengthened by a concession win atCallao, Peru, which is expected to commence operations in 2009.
Throughput. Container traffic at DP World Vancouver, DP World Puerto Cabello and TerminalesRio de la Plata (Buenos Aires) is primarily O&D, although Terminales Rio de la Plata (Buenos Aires)receives a moderate level of transhipment traffic. DP World Caucedo competes for both O&D andtranshipment traffic, which we expect will increase as Caucedo takes on increased importance as a regionalhub. Our operations in the region accounted for 1.5 million TEUs (or 4.2%) and 1.0 million TEUs (or4.7%) of our gross throughput for the year ended December 31, 2006 and the six months ended June 30,2007, respectively.
Competitive position. The Americas operating region remains highly fragmented, with manyindependent companies operating single terminals in key markets and government-owned entitiesmaintaining a significant presence. Given the strategic position of our facilities as regional gateway ports,our facilities have a strong position in their respective selected markets. In addition, we believe that DPWorld Caucedo and DP World Vancouver will benefit from their certification as ISO/PAS28000:2005/2006-complaint, which will facilitate the movement of trade from such terminals into theUnited States.
The competitive situation at DP World Puerto Cabello is unique in that we do not have the rights to anydedicated berths within the port. The port authority controls the reservation of the berths and there are noshore based gantry cranes. As a result, we stevedore the vessels on common-user berths using our ownmobile cranes and ship gear, but then operate a dedicated shore-side terminal in which containers arestored and delivered to our customers. We are currently the only operator at the port with rubber-tyregantries and a NAVIS-based IT system.
Other activities. In addition to container cargo handling, certain of our facilities in the region offergeneral and bulk cargo handling, reefer, on-dock rail and cruise and ferry passenger facilities and/or otherterminal services.
Strategy and business development. Our focus in the Americas region is to optimise the performanceof our existing portfolio, including through the expansion of our terminals in Vancouver and Buenos Aires,to meet project growth requirements. At DP World Puerto Cabello, we also intend to consolidate ouroperations with several of our competitors and eventually join our terminals and negotiate a new operating
137
concession period with the port authority, as well as control of the berthing capacity adjacent to theterminals. We believe that this would enable us to develop a competitive operating facility with shorecranes that would operate similarly to other regional facilities. We will also continue to seek additionalgrowth opportunities, particularly in Latin America, which we believe is starting to exhibit some of thesame growth fundamentals that China and India have experienced in past years and expect will provideprospects for similar opportunities for growth in container traffic. Our concession to build a terminal inCallao, Peru will position us to continue to expand our presence in this region. Callao, with access to Lima,already handles 85% of domestic traffic and we are currently in the planning stages for a new facility thatwe expect will attract further transhipment traffic, once operational.
Security and Business Resilience
We are committed to improving our security on an ongoing basis in order to enhance our position as aleading global operator, while assuring quality service and continued customer satisfaction. Our corporatesecurity policy is designed to protect our personnel, assets, reputation and customers’ interests byemploying the highest corporate, ethical and operational standards to meet our vision of excellence.
We have dedicated strategic security resources at the corporate level, which provide expert counsel to ourexecutive management and direction to our business units around the world. We have set ourselves a seriesof primary security objectives that are designed to implement our corporate security policy across ournetwork of container terminals. Simultaneously, in conjunction with other internal departmentalobjectives, we are building business resilience capacity in the critical areas of asset protection, corporategovernance, information assurance, business continuity, reputation management and crisis management.
Our security and business resilience objectives are met through the implementation of a planned set ofsecurity initiatives and internal programs. These are consistent with international security legislation andappropriately recognised and accredited quality management systems. For example, we hold the ISO9001:2000 accreditation, which sets forth the criteria for a quality management system. Similarly, inaccordance with our commitment to quality assurance, our corporate head office in Dubai and ouroperations at Port Autonome International de Djibouti in Djibouti, Vancouver, Canada and Caucedo,Dominican Republic have been certified ISO/PAS 28000:2005/2006-compliant by Lloyd’s Register QualityAssurance. ISO/PAS 28000, which was published by the International Organisation for Standardisation atthe end of 2005, outlines the requirements to enable an organisation to establish, implement, maintain andimprove a security management system, including those aspects critical to security assurance of the supplychain.
In connection with our corporate security policy, we have initiated an ISO 28000 roll-out programme toobtain ISO/PAS 28000:2005 certification for 12 of our terminals in 2007, which have been strategicallyselected based on their geographical, political and commercial attributes. We plan to continue our roll-outplan at our flagship terminals in the UAE region and our terminals in the European Union, which willserve as a precursor to acceptance into the EU ‘‘Approved Economic Operator’’ customs security initiativeexpected to be legislated in 2008 and 2009. As a result of our ISO 28000 commitment and roll-outprogramme, we were the first, and are currently the only, global container terminal operator to become acertified partner in the US Department of Homeland Security’s Customs-Trade Partnership AgainstTerrorism supply chain initiative.
Safety and Environment
We consider safety and environment (‘‘S&E’’) to be of fundamental importance in every aspect of ourglobal operations. We understand and take very seriously the S&E responsibilities that we have toemployees, customers, contractors, visitors, government agencies and communities.
We have dedicated S&E resources throughout the world that provide expert advice for management inexercising our corporate obligations in this critical area. Management, staff and employees are guided byour corporate Safety and Environment Policy, which has been authorised by our Chief Executive Officer,and all business units, irrespective of the jurisdiction in which they operate, are required to implement thispolicy.
Complementing our Safety and Environment Policy are a set of primary S&E objectives that we haveestablished, including:
� elimination of workplace fatalities by targeting major hazards and establishing robustmanagement controls;
138
www.global-reports.com
� 20% reduction in workplace injury rates per annum;
� zero serious environmental spills;
� 1% improvement in energy efficiency to reduce greenhouse gases; and
� zero fines or prosecutions for S&E breaches.
We believe that these goals will be achieved through implementation of a structured set of initiatives andS&E programmes that are consistent with industry-leading practice and internationally-recognisedmanagement systems. For example, environmental pilot projects have been initiated to progress spillprevention and response plans, as well as to improve energy efficiency in an effort to achieve greenhousegas reduction targets. In addition, many of our operations are already accredited to ISO 14001Environment and OHSAS 18001 Safety standards and it is our intention for all of our operations to workprogressively towards this level of S&E management.
Information Technology and Operating Systems
Our IT strategy is designed to enable local IT groups at our terminals to meet their requirements with littledependency on a company-wide IT infrastructure, although we provide some centralised IT services, suchas hosting and network services, to varying degrees at a regional level. While our central IT departmentplays a vital role in strategic planning, governance and standardisation of IT across our portfolio and, inthe case of new terminal operations, provides guidance, consulting and reviews, it is not involved in theday-to-day IT operations of our terminals. We believe that this strategy provides our local IT groups withthe flexibility to design IT solutions that best fit the needs of a particular terminal. When designing suchsolutions, we encourage our local IT groups to purchase readily available off-the-shelf software whereverpossible.
Our systems can be categorised into core business applications and value added systems. We use corebusiness applications to deliver efficient terminal processes to our container shipping line customers andvalue added systems to differentiate our services from those of our competitors and facilitate integrationwith local authorities and trading partners. We consider the terminal operating system to be at the core ofall business applications at the terminal level. The majority of our terminals currently use the synchronousplanning and real time control system (SPARCS) as their terminal operating system, which is a softwaresolution designed by Navis, a vendor of supply chain-related software. Our relationship with Navis isgoverned by a master agreement that outlines software licence structures, maintenance and support andother professional services. See ‘‘Risk Factors—Risks Relating to our Ports Business—Failure in ourinformation and technology systems could result in delays to our business operations’’.
Each of our terminals, based on the nature of its business, is configured to keep its systems operational,including with respect to business processes and procedures, under abnormal conditions. Although ITsystems are essential to the functioning of our terminals, proper manual backup procedures have beendevised to support our operations in case of a rare unexpected system downtime. We have defined ITcomponent topologies and recovery time objectives for each business process, which prescribe theappropriate level of IT infrastructure depending on the importance of the relevant business process. Forexample, a business process, such as container movement operations at a large terminal, that is categorisedas ‘‘mission critical’’ would be allocated an IT infrastructure consisting of a clustered server environmentwith significant resilience, extensive focus on backup and IT disaster recovery plans, with the aim ofproviding for 99.99% availability.
Marketing and Corporate Communication
At a corporate level, the marketing and corporate communication function sits within our commercialdivision. It is focused on promoting and protecting the reputation of the Company and buildingrelationships with key stakeholders, including customers and the communities in which we operate. Ouraim is to provide information to generate confidence and credibility in the Company and our operations inorder to achieve our business objectives.
Marketing and corporate communication activities for our container terminal operations are devolved tothe regions and are tightly targeted and focused on customers and community and government relations.Resources vary among the eight regions, with the greatest concentration in the UAE.
There is a dotted line reporting relationship between regional and business unit communication personneland the head office in Dubai to maintain consistency, coordinate messaging and ensure effective, timelyissues or crisis management.
139
The integration process following the P&O Acquisition involved the rebranding of our wholly-ownedcontainer terminals under the DP World name. This initial exercise is largely complete and efforts will bemade to work with joint venture partners to rebrand the remainder of our terminals under the DP Worldname over time.
Employees
As of December 31, 2004 and 2005, DPA had 3,784 and 4,375 employees, respectively. As of December 31,2006, we had approximately 28,000 employees (excluding employees of the P&O Ferries Business,P&O Estates, POPNA, the Shekou Terminals and the Colombo Terminal). Our employees are engagedunder a variety of employment arrangements, including as direct hires, pursuant to collective bargainingagreements and through third-party sourcing. A significant majority of our employees in Australia,Argentina, Peru, Venezuela, Dominican Republic, Canada, the United Kingdom, France, Belgium, SouthEast Asia, China, Korea, South Africa, India and Pakistan operate pursuant to collective bargainingagreements that typically cover employees in the relevant countries. We believe that the material terms ofour collective bargaining agreements and other terms of employment are customary for the countries andindustries in which we operate and that we have a good relationship with our employees.
Legal Proceedings
Although we are involved in legal proceedings, including commercial arbitration, employment matters,disputes with port authorities, other concessionaires and partners and general commercial disputes thatarise from time to time in the ordinary course of our business, there are, and have been, no governmental,legal or arbitration proceedings (including any such proceedings that are pending or threatened of whichwe are aware) during the twelve months preceding the date of this Prospectus that may have, or have had,significant effects on our financial position or profitability.
Insurance
Our operations are subject to normal hazards of operational and geographic risks, including accidents, fireand weather-related perils. Globally, we maintain various types of insurance policies to protect against thefinancial impact arising from unexpected events when the amount of the potential loss would be significantenough to prevent normal business operations. The purchase of these policies is co-ordinated by aninternal insurance department, with applicable limits, coverage, scope and deductibles that we, with theadvice of our insurance advisors, believe are reasonable and prudent after all means of controlling orpreventing the risk have been considered. We cannot, however, assure you that this insurance will beadequate to protect us from all expenses related to potential future claims for personal injury and propertydamage or that these levels of insurance will be available in the future at commercially reasonable prices.We do not fully insure against certain risks to the extent that such risks may not be fully insurable orrelated coverage is unavailable at what we consider to be appropriate price levels. See ‘‘Risk Factors—Risks Relating to the Company—We may not maintain sufficient insurance coverage for the risksassociated with the operation of our business’’.
140
www.global-reports.com
MANAGEMENT
Board of Directors
As at the date of this Prospectus, the Board of Directors is comprised of the seven members (each, a‘‘Director’’) listed below.
Date ofName Position(s) appointment
Sultan Ahmed Bin Sulayem . . . . . . . . Chairman of the Board May 30, 2007Jamal Majid Bin Thaniah . . . . . . . . . Director; Executive Vice Chairman May 30, 2007Mohammed Sharaf . . . . . . . . . . . . . . Chief Executive Officer; Director May 30, 2007Yuvraj Narayan . . . . . . . . . . . . . . . . . Chief Financial Officer; Director August 9, 2006Sir John Parker(1) . . . . . . . . . . . . . . . Director; Vice Chairman May 30, 2007David Williams(1) . . . . . . . . . . . . . . . . Director May 30, 2007Cho Ying Davy Ho(1) . . . . . . . . . . . . . Director May 30, 2007
(1) Denotes an independent Non-Executive Director.
Sultan Ahmed Bin Sulayem has served as Chairman of the Board of the Company since May 30, 2007. He isalso Chairman of Dubai World. As leader of Dubai World, he oversees businesses in industries as diverseas real estate development, hospitality, retail, e-commerce and various commodities exchanges, as well asthose associated with transportation and logistics. He has more than 25 years’ experience in the marineterminal industry and is a leading Dubai and international businessman.
Jamal Majid Bin Thaniah has served as a Director and Executive Vice Chairman of the Company sinceMay 30, 2007. He joined Dubai Ports in 1981 and, from 2001, led DPA, which operated DP World Jebel Aliand Port Rashid (Dubai). He is also Group Chief Executive Officer of Port and Free Zone World FZE. AsGroup Chief Executive Officer of Port and Free Zone World FZE, he also oversees the free zone andbusiness park company, Economic Zones World, which includes Jafza International, Jebel Ali Free Zoneand the P&O Ferries Business. As Executive Director of the Board of Dubai World, he also acts as ViceChairman supporting the Dubai World Chairman in managing the portfolio.
Mohammed Sharaf has served as Chief Executive Officer since 2005 and a Director of the Company sinceMay 30, 2007. He joined DPA in 1992 and became Managing Director of Dubai Ports International in2003. He began his shipping career at Holland Hook terminal in The Port of New York/New Jersey and hasmore than 20 years’ experience in the transport and logistics business.
Yuvraj Narayan has served as Chief Financial Officer since 2005 and a Director of the Company sinceAugust 9, 2006. He joined DP World in 2004. He previously served as ANZ Group’s Head of Corporateand Project Finance for South Asia before becoming Chief Financial Officer of Salalah Port Services inOman. He is a qualified Chartered Accountant and has more than 23 years’ experience in the ports andinternational banking sectors.
Sir John Parker has served as a Director and Vice Chairman of the Company since May 30, 2007. He servesas a Non-Executive Director of Carnival plc and Carnival Corporation, Non-Executive Chairman ofNational Grid plc, Senior Non-Executive Director (Chair) of the Court of the Bank of England and JointChairman of Mondi plc. He previously served as a Non-Executive Director and Deputy Chairman and,subsequently, Chairman of P&O and as Vice Chairman of Port & Free Zone World FZE.
David Williams has served as a Director of the Company since May 30, 2007. He is currently a director ofTaylor Wimpey plc, Tullow Oil plc, Meggitt plc and Mondi plc. He previously served as a Non-ExecutiveDirector of P&O and George Wimpey plc. He has also served as a Non-Executive Director of DewhirstGroup plc, a Non-Executive Director of Medeva plc and as Finance Director of Bunzl plc. He is a qualifiedChartered Accountant.
Cho Ying Davy Ho has served as a Director of the Company since May 30, 2007. He joined the Swire Groupin 1970 and currently serves as a director of various Swire Group entities. In addition, he is a director ofSwire Pacific Limited, Hong Kong Aircraft Engineering Company Limited, Hongkong UnitedDockyards Ltd., Hongkong Salvage & Towage Co. Ltd. and Hong Kong Air Cargo Terminals Ltd. Hepreviously served as a director of Cathay Pacific Airways Limited, Modern Terminals Ltd. and ShekouContainer Terminals Ltd. and as Chairman of the Shipping Committee of Hong Kong General Chamber ofCommerce.
141
Our Directors are not under service contracts with us with respect to their roles as directors and we do nothave contractual obligations to provide benefits to our Directors upon termination of their directorships.
The business address for each of our Directors is c/o DP World Limited, PO Box 17000, Dubai, UAE.
We are not aware of any potential conflicts of interest between the duties owed by the Directors to theCompany and their private interests or other duties.
Senior Management
In addition to the executive management appointed to the Board, the day-to-day management of ourbusiness is conducted by the following senior managers (the ‘‘Senior Managers’’) who are consideredrelevant to establishing that the Company has the appropriate expertise and experience for themanagement of its business:
Senior Management—Head office
Name Position(s)
Mohammed Sharaf(1) . . . . Chief Executive OfficerAnil Wats . . . . . . . . . . . . Executive Vice President and Chief Operating OfficerYuvraj Narayan(1) . . . . . . . Chief Financial OfficerSuhail Al Banna . . . . . . . Acting Chief Information OfficerAdnan Al Abbar . . . . . . . Senior Vice President—Planning and DevelopmentGeorge Dalton . . . . . . . . . Senior Vice President—LegalPaul Hayward Smith . . . . . Senior Vice President—Human ResourcesMatthew Leech . . . . . . . . Senior Vice President—Business DevelopmentMichael Moore . . . . . . . . Senior Vice President—CommercialAnwar Wajdi . . . . . . . . . . Senior Vice President—Corporate Strategy
(1) Please refer to ‘‘—Board of Directors’’ above for biographical details.
Anil Wats has served as Executive Vice President and Chief Operating Officer since 2005. He joinedDP World in 2003 as Global Commercial Director. He began his career with Sea-Land and served as VicePresident and, later, Chief Executive Officer responsible for group activities covering the Middle East andthe Subcontinent. Following the acquisition of Sea-Land by the A.P. Moller-Maersk Group, he wasappointed Chief Executive Officer for the A.P. Moller-Maersk Group activities for Indonesia and, later,the UAE. He has more than 25 years’ experience in the international shipping and logistics industry.
Suhail Al Banna serves as Acting Chief Information Officer. He also serves as Director and Executive VicePresident for Asian Terminals Incorporated in Manila, Philippines. As Acting Chief Information Officer,he plays a decisive role in strategy, planning, project management and development of the Company’s ITdirection, particularly at the port and terminal sites.
Adnan Al Abbar serves as Senior Vice President—Planning and Development and is responsible for leadingthe planning and infrastructure development activities for the Company generally. He joined DP World in1991 and has served as Container Terminal Manager, Development Manager, Director of Port Planning &Information Systems and Chief Operating Officer. He has more than 15 years’ experience with DP Worldand has headed projects relating to master planning, IT development, process re-engineering andoperations development.
George Dalton serves as Senior Vice President—Legal. He previously served as Vice President and GeneralCounsel of CSX WT which he joined in 1999, and was with Sea-Land beginning in 1995 as counsel to theNorth America Terminal Operating Group and the Americas Division, which covered activities in Northand South America and the Caribbean. He has more than 25 years’ legal experience, including privatepractice, with a background in corporate, financing and international transactions.
Paul Hayward Smith serves as Senior Vice President—Human Resources. He previously served as amanaging consultant for the Hay Group based in Dubai, and for six years before that he was the CorporateHead of Reward/Policy for the Boots Company plc. He has 30 years’ business experience acrossHR Management, HR Consulting and Line Management, operating across a range of sectors andgeographies. He has led international HR projects and worked extensively in Turkey and Egypt.
142
www.global-reports.com
Matthew Leech serves as Senior Vice President—Business Development and joined the Company in 2005following the acquisition of CSX WT. He previously served as Vice President, Operations and BusinessDevelopment at CSX WT, and led many of their key expansion initiatives, including the acquisition ofterminal facilities in Korea, China and Venezuela, as well as managing their terminals in Australia,Germany, Venezuela and Russia. He has 14 years’ experience in the finance and container transportationindustries.
Michael Moore serves as Senior Vice President—Commercial and joined the Company in 2005. Hepreviously served as Vice President of Global Sales—Europe for the A.P. Moller-Maersk Group for sixyears. He has more than 20 years’ experience in the transportation industry, having started as amanagement trainee in the trucking industry in the United States and later with Sea-Land in 1984. Hisbroad experience in container shipping spans terminal operations, sales, logistics, and pricing and trademanagement.
Anwar Wajdi serves as Senior Vice President—Corporate Strategy. He joined DP World in 1992 as a traineeand previously served as Deputy Managing Director for the UAE Region. He has played a role in securingprojects for the Company and has led the development of the DP World UAE commercial systems,procedures and policies.
Senior Management—Regional Managers
Name Position(s)
Mohammed Al Muallem . Senior Vice President and Managing Director—UAE RegionArif Al Dehail . . . . . . . . Senior Vice President—Operations and acting Managing Director—Africa RegionCaptain Faisal Al Qahtani Senior Vice President and Managing Director—Middle East RegionPeter Wong . . . . . . . . . . Senior Vice President and Managing Director—Asia-Pacific RegionGanesh Raj . . . . . . . . . . Senior Vice President and Managing Director—Indian Subcontinent RegionPatrick Walters . . . . . . . . Senior Vice President and Managing Director—Europe and North Africa RegionJack Williams . . . . . . . . . Senior Vice President and Managing Director—Australia and New Zealand RegionDave Sanborn . . . . . . . . . Senior Vice President and Managing Director—Americas Region
Mohammed Al Muallem serves as Senior Vice President and Managing Director – UAE Region. He beganhis career with DP World at Port Rashid more than 20 years ago and has led the integration of DPA, DubaiCustoms and the Free Zone Organisation.
Arif Al Dehail serves as Senior Vice President—Operations and acting Managing Director—Africa Region.He joined Dubai Ports as Superintendent, Container Terminal in 1991 and has since served in numerousroles during his career with DP World.
Captain Faisal Al Qahtani serves as Senior Vice President and Managing Director—Middle East Regionand joined DP World in 2007. He has extensive knowledge of and experience in the shipping and portsindustries, having worked extensively in the region and in Saudi Arabia in particular. In his last assignment,Captain Faisal was managing operations at United Maritime Lines in Jeddah and was previously with theNational Shipping Company of Saudi Arabia (NSCSA).
Peter Wong serves as Senior Vice President and Managing Director—Asia-Pacific Region and joinedDP World as part of the acquisition of CSX WT in 2005. He has extensive experience in the shippingindustry, having worked in North America, Europe and the Far East.
Ganesh Raj serves as Senior Vice President and Managing Director—Indian Subcontinent Region. Hepreviously served as Terminal Manager at Nhava Sheva International Container Terminal (now DP WorldNhava Sheva) and as Chief Executive Officer of the P&O Ports Chennai Facility. He has 20 years’experience in the port and liner industry, having worked for the A.P. Moller-Maersk Group and P&O Portsprior to joining DP World.
Patrick Walters serves as Senior Vice President and Managing Director—Europe and North Africa Region.He joined the P&O Group in 1995 where his roles included Managing Director of Southampton ContainerTerminal Ltd. and Tilbury Container Services Ltd. He has nearly 20 years’ experience in internationalbusiness, primarily in the ports and container terminals sector.
Jack Williams serves as Senior Vice President and Managing Director—Australia and New Zealand Regionand joined the Company in 2005. He spent many years in the United States, where he managed shippingoperations for various national and international carriers and agents. He has more than 45 years’experience in the shipping and ports industry and has lived and worked in Asia, Africa and Europe.
143
Dave Sanborn serves as Senior Vice President and Managing Director—Americas Region since 2005. Hepreviously worked with Sea-Land Service and then served various senior management positions with APLand CMA-CGM. He has managed numerous container ports and has been involved in concept and designprocesses for logistics facilities around the world.
Each of the Senior Managers can be contacted at our registered office, c/o DP World Limited,PO Box 17000, Dubai, UAE.
We are not aware of any potential conflicts of interest between the duties owed by the Senior Managers tothe Company and their private interests or other duties.
Compensation
For the year ended December 31, 2006, the aggregate total remuneration paid by DPA (includingcontingent or deferred compensation) to its directors and key management was $7.02 million. Followingthe Restructuring and appointment of additional Directors and Senior Management of the Company, theCompany’s Directors and Senior Management group is now larger than DPA’s corresponding group for2006.
Short-Term Bonus and Long-Term Incentive Plans
We do not currently have any equity or share-based short-term bonus or long-term incentive plans. Fromtime to time, we or our Selling Shareholder may make grants of our ordinary shares to our Directors,Senior Managers and/or other employees as part of their compensation or otherwise.
Directors’ and Senior Managers’ Interests
None of our Directors or Senior Managers currently hold any interest in the Company’s issued sharecapital. As part of the Global Offering, certain of our Directors and/or Senior Managers may purchaseShares at the Offer Price. In addition, certain of our Directors and/or Senior Managers may receive Sharesin respect of their holdings in the PCFC Development Sukuk. See ‘‘Description of the PCFC DevelopmentFZCO Sukuk’’ for more information.
Corporate Governance
The corporate governance requirements of the DFSA are prescribed in Appendix 4 (CorporateGovernance and Directors’ Dealings) of the Offered Securities Rules and will apply to the Companyfollowing the DIFX Admission. The requirements include, among other things:
� at least one third of the board of directors must be comprised of non-executive directors, and atleast two of these non-executive directors must be independent;
� an audit committee must be formed, and at least two independent non-executive directors mustbe appointed to that committee;
� a sound internal control system must be implemented to safeguard shareholders’ investment andthe entity’s assets;
� an annual report must be filed with the DFSA, and the report must include a statement on howthe entity is complying with the corporate governance requirements; and
� directors must not deal in securities of, or investments related to, the Company when inpossession of undisclosed material information, during a period of one month preceding theannouncement of annual results or the publication of the half-yearly report, or otherwise unlessgiven written clearance to deal.
On DIFX Admission, the Company will comply with the corporate governance requirements of the DFSA.
Our Board has established a Remuneration Committee, an Audit Committee and a Nominations andGovernance Committee, with formally delegated duties and responsibilities and with written terms ofreference. From time to time, separate committees may be set up by the Board to consider specific issueswhen the need arises. The Remuneration and Nominations and Governance Committees have not met asof the date of this Prospectus.
144
www.global-reports.com
Remuneration Committee
The Remuneration Committee will assist the Board in determining its responsibilities in relation toremuneration, including making recommendations to the Board on the Company’s policy on executiveremuneration, determining the individual remuneration and benefits package of each of the ExecutiveDirectors and recommending and monitoring the remuneration of senior management below Board level.No committee member may participate in any discussion or decision regarding their own remuneration.
The membership of the company’s Remuneration Committee comprises three independent Non-ExecutiveDirectors (namely, Sir John Parker, David Williams and Cho Ying Davy Ho). The Chairman of theRemuneration Committee is Sir John Parker.
The Remuneration Committee will meet formally at least once a year and otherwise as required.
Audit Committee
The Audit Committee assists the Board in discharging its responsibilities with regard to financial reporting,external and internal audits and controls, including reviewing the Company’s annual financial statements,reviewing and monitoring the extent of the non audit work undertaken by external auditors, advising onthe appointment of external auditors and reviewing the effectiveness of the Company’s internal auditactivities, internal controls and risk management systems. The ultimate responsibility for reviewing andapproving the accounts and the half yearly reports remains with the Board.
The membership of the company’s Audit Committee comprises three independent Non-ExecutiveDirectors (namely, Sir John Parker, David Williams and Cho Ying Davy Ho). David Williams is consideredby the Board to have recent and relevant financial experience and therefore has been appointed asChairman of the Audit Committee.
The Audit Committee meets formally at least three times a year and otherwise as required.
Nominations and Governance Committee
The Nominations and Governance Committee will assist the Board in discharging its responsibilitiesrelating to the composition of the Board. The Nominations and Governance Committee is responsible forevaluating the balance of skills, knowledge and experience of the Board and, in particular: (i) identifyingindividuals qualified to become Board members, (ii) recommending individuals to be considered forelection at the next annual general meeting of the Company or to fill vacancies, (iii) preparing adescription of the role and capabilities required for a particular appointment and (iv) developing andrecommending to the Board appropriate corporate governance guidelines.
The Nominations and Governance Committee comprises three independent Non-Executive Directors(namely, Sir John Parker, David Williams and Cho Ying Davy Ho) and two Executive Directors (namelyJamal Majid Bin Thaniah and Mohammed Sharaf). The Chairman of the Nominations & GovernanceCommittee is Sir John Parker.
The Nominations and Governance Committee will meet formally at least once a year and otherwise asrequired.
145
RELATED PARTY TRANSACTIONS
Save as described below or in Note 25, ‘‘Related Party Transactions’’, of the Notes to the DPAConsolidated Financial Statements, no related party transactions between the Company and its affiliates orshareholders or directors have occurred or been entered into in the past three fiscal years.
Relationship with Dubai World and the Government of Dubai
Formation
Pursuant to the Restructuring, the Company was incorporated in the DIFC on August 9, 2006 for thepurpose of becoming the holding company for the ports-related commercial activities of Dubai World. OnJanuary 1, 2007, DP World FZE and Thunder FZE were transferred from an affiliate of the Company,DPA, to the Company. Consideration for the transfer of DP World FZE and Thunder FZE is reflected inthe Company Consolidated Financial Statements as a payable to Port & Free Zone World FZE, whichequalled $8,132.7 million as of June 30, 2007. Prior to the consummation of the Global Offering, we expectthat we will have satisfied the Intercompany Payable through (i) the payment of $2.0 billion of theIntercompany Payable in cash, (ii) the conversion of $2.0 billion of the Intercompany Payable intoShareholder’s reserve, based on the waiver of this amount by Port & Free Zone World FZE and (iii) theconversion of the remaining $4.1 billion of the Intercompany Payable into Share capital, based on Port &Free Zone World FZE agreeing to subscribe for shares in the Company in consideration for thecapitalisation of $4.1 billion of the Intercompany Payable.
On the date of the transfer of DP World FZE and Thunder FZE, property, plant and equipment wererevalued and transferred at fair market value, which required that we incur an additional depreciationcharge of $13.0 million per annum. Prior to the transfer of DP World FZE and Thunder FZE, theCompany did not have any operations.
Ongoing Relationship
Amended and Restated Credit Agreement. Immediately prior to the transfer of Thunder FZE to theCompany, the Company became a borrower and guarantor under the Amended and Restated CreditFacility, which reflected amendments related to, among other things, (i) the transfer of a portion ofborrowings thereunder from Thunder FZE to JAFZA, (ii) the removal of the requirement that theproceeds from the sale of POPNA be used to prepay borrowings thereunder, (iii) on the satisfaction ofcertain conditions, the removal of JAFZA as a borrower and guarantor thereunder and (iv) on thesatisfaction of certain conditions, the removal of PCFC as a guarantor thereunder. DPA and PCFCprovided credit support for the outstanding amounts under the Amended and Restated Credit Facility inthe form of an unconditional and irrevocable guarantee. Approximately $76.7 million of finance costs forthe year ended December 31, 2006 reflected in DPA Consolidated Financial Statements relate to theportion of borrowings transferred from Thunder FZE to JAFZA pursuant to the Amended and RestatedCredit Facility.
On October 29, 2007, we repaid in full the amounts outstanding under the Amended and Restated CreditFacility with $1.3 billion in borrowings under the Syndicated Loan Facility.
For a description of the Syndicated Loan Facility, including the undertakings and covenants includedtherein, see ‘‘Management’s Discussion and Analysis of Financial Condition and Results ofOperations—Liquidity and Capital Resources—Working Capital and Indebtedness—Revolving CreditSyndicated Facility’’.
Concession Agreement. On December 31, 2006, our wholly-owned subsidiary DP World UAEentered into the Concession Agreement with DPA to operate DP World Jebel Ali, Port Rashid (Dubai)and Hamriya Port in Dubai on an arm’s-length basis. The ownership of these ports has been retained byDPA. The Concession Agreement became effective as of July 1, 2006 for a term of 99 years and is governedby the federal law of the UAE and the laws of the Emirate of Dubai.
During the term of the Concession Agreement, DP World UAE has exclusive rights to use the relevantland and existing infrastructure and superstructure within the concession area. DP World UAE has paidconsideration calculated on a fair market basis for such infrastructure and superstructure as if those assetswere transferred outright to it. Other existing assets have also been transferred by DPA to DP World UAE
146
www.global-reports.com
for consideration calculated on a fair market basis. On expiration of the term, all assets developed, leased,acquired by or transferred to DP World UAE shall be transferred to DPA on a fair market valuation basis.
DPA has the right to nominate priority users to be given priority access to the ports at tariffs stipulated byDPA.
DP World UAE is not obligated to pay any annual concession fee until December 31, 2012. After that date,calculation of the annual concession fee is based on the greater of a certain percentage of revenue and afixed monetary amount. However, we have started to accrue such fees in an amount equal to $47.0 millionper annum, which represents the average annual minimum fee payable over the term of the ConcessionAgreement.
DPA has the right to terminate the Concession Agreement on an event of default by DP World UAE,which include material breach of an obligation, failure to pay, abandonment and change of control.Change of control means a change in the ability to appoint or remove a majority of the board of directorsor the power to control the affairs of DP World UAE or in the ownership of 51% or more of its shares.DP World UAE can be relieved from performance of its obligations under the Concession Agreement as aresult of natural or political force majeure events and/or change of law.
Commercial Agreements and Arrangements. From time to time in the ordinary course of our business,we may enter into commercial contracts and arrangements with, or otherwise provide services to, or obtaingoods and services from, affiliates. These commercial arrangements are generally on an arm’s length basisand subject to customary market terms.
Transfer of P&O Estates. On May 11, 2007, P&O entered into an agreement with Istithmar P&OEstates FZE (‘‘Istithmar P&O’’), an indirect wholly-owned subsidiary of Dubai World, pursuant to whichP&O Estates would be transferred to Istithmar P&O or its subsidiaries for a purchase price equal to themarket value of the assets transferred plus a premium, subject to specific adjustments. We transferredP&O Estates in furtherance of our aim to focus our business on container terminal operations. Theconsideration for this transfer has not been paid and none of the shares of P&O Estates have beentransferred. It is anticipated that the transfer will be completed later this year.
In addition to assuming liabilities for all matters relating to P&O Estates, Istithmar P&O has also agreedto indemnify P&O in the event that P&O pays any amounts or incurs any actual liabilities in respect ofcertain guarantees provided by P&O in respect of the operations of P&O Estates, which could not bereleased or transferred prior to the sale. The parties have agreed to seek the release of these guarantees,and pending such release, Istithmar P&O has agreed to provide indemnification. Additionally, P&O isentitled to receive fees in respect of the provision of some of these guarantees.
P&O and Istithmar P&O are also parties to a transitional services agreement, under which P&O is toprovide certain administrative and other support services to P&O Estates, including payroll services,pensions administration, tax services and IT support. Payment for these services will be on an arm’s lengthbasis. The agreement may be terminated by either party following breach, insolvency or the provision ofnotice.
Transfer of P&O Ferries. On March 30, 2007, P&O and certain of its subsidiaries entered into anagreement with P&O Ferries Division Holdings, an indirect wholly-owned subsidiary of Port & Free ZoneWorld FZE, and certain of its subsidiaries pursuant to which the P&O Ferries Business was transferred toP&O Ferries Division Holdings for a market value consideration. Consideration for the transfer of theP&O Ferries Business is reflected in the Company Consolidated Financial Statements as a receivable froma related party, which as of June 30, 2007 equalled $1,069.0 million. We transferred the P&O FerriesBusiness in furtherance of our aim to focus our business on container terminal operations. This transactionhas now completed.
Under the terms of the agreement, P&O Ferries Division Holdings and its subsidiaries agreed to indemnifyP&O and its subsidiaries if P&O pays any amounts or incurs any actual liabilities in respect of the P&OFerries Business. Additionally, P&O had granted a number of guarantees in respect of the P&O FerriesBusiness that could not be released or transferred prior to completion of the transfer of the P&O FerriesBusiness. The parties are obliged to continue to seek the release of these guarantees and, until they arereleased, P&O Ferries Division Holdings and its subsidiaries have agreed to indemnify P&O in respect ofany liability arising under such guarantees.
147
P&O continues to provide certain administrative and other support services with respect to the P&OFerries Business, including payroll services, pensions administration and tax services. Payment for theseservices is on an arm’s-length basis. The arrangements may be terminated by either party on the provisionof notice.
As part of the transitional arrangements following the transfer of the P&O Ferries Business, P&O hasagreed to allow certain entities within P&O Ferries Division Holdings group to continue to be part of itsworking capital pooling arrangements and to fund their working capital needs from such arrangements.P&O Ferries Division Holdings is presently seeking to put in place its own separate working capital facilitywith third party financiers and it has granted indemnities to P&O in respect of any liabilities or costsincurred by P&O in connection with the use of the working capital pooling arrangements.
148
www.global-reports.com
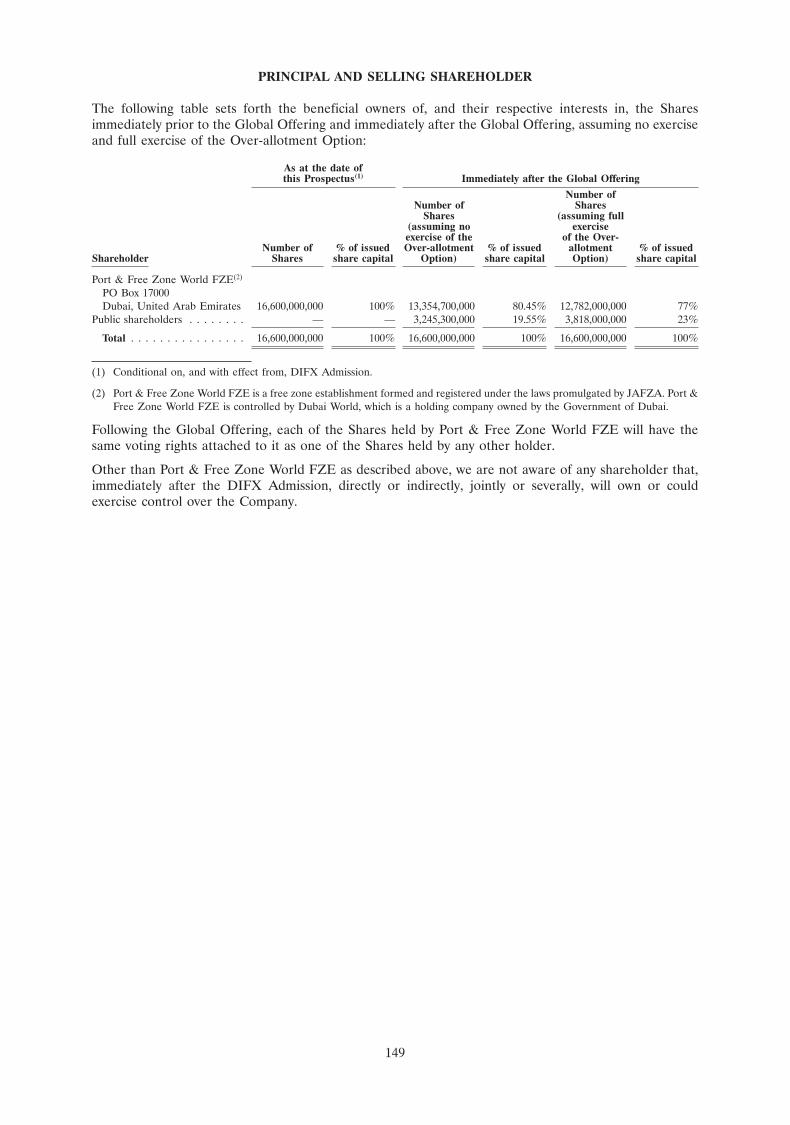
PRINCIPAL AND SELLING SHAREHOLDER
The following table sets forth the beneficial owners of, and their respective interests in, the Sharesimmediately prior to the Global Offering and immediately after the Global Offering, assuming no exerciseand full exercise of the Over-allotment Option:
As at the date ofthis Prospectus(1) Immediately after the Global Offering
Number ofNumber of Shares
Shares (assuming full(assuming no exerciseexercise of the of the Over-
Number of % of issued Over-allotment % of issued allotment % of issuedShareholder Shares share capital Option) share capital Option) share capital
Port & Free Zone World FZE(2)
PO Box 17000Dubai, United Arab Emirates 16,600,000,000 100% 13,354,700,000 80.45% 12,782,000,000 77%
Public shareholders . . . . . . . . — — 3,245,300,000 19.55% 3,818,000,000 23%
Total . . . . . . . . . . . . . . . . 16,600,000,000 100% 16,600,000,000 100% 16,600,000,000 100%
(1) Conditional on, and with effect from, DIFX Admission.
(2) Port & Free Zone World FZE is a free zone establishment formed and registered under the laws promulgated by JAFZA. Port &Free Zone World FZE is controlled by Dubai World, which is a holding company owned by the Government of Dubai.
Following the Global Offering, each of the Shares held by Port & Free Zone World FZE will have thesame voting rights attached to it as one of the Shares held by any other holder.
Other than Port & Free Zone World FZE as described above, we are not aware of any shareholder that,immediately after the DIFX Admission, directly or indirectly, jointly or severally, will own or couldexercise control over the Company.
149
DESCRIPTION OF SHARE CAPITAL
Set out below is a summary of certain information concerning the shares, certain provisions of our Articles ofAssociation (the ‘‘Articles’’) to be adopted with effect from, and conditional upon, DIFX Admission, andcertain requirements of applicable laws and regulations in effect as at the date hereof. This summary does notpurport to be complete.
Our Share Capital
On incorporation on August 9, 2006, our initial authorised share capital was $100.00 divided into 100ordinary shares of $1.00 each, of which one share was issued to the Selling Shareholder as the initialsubscriber.
As of December 31, 2006, our issued share capital was $1.00, consisting of one fully paid share of $1.00.
At the annual general meeting of the Company held on November 20, 2007 (the ‘‘AGM’’), our soleshareholder authorised the allotment and issue by our Directors of 99 shares of $1.00 each. At a meeting ofthe Board held on November 20, 2007, the Directors resolved to allot, with effect from and conditionalupon DIFX Admission, 99 shares of $1.00 each to the Selling Shareholder in consideration for thecapitalisation of $4,132,655,000 of the Intercompany Payable (the ‘‘Initial Allotment’’), thereby resulting inthe amount of $4,132,654,901 being credited to the Company’s share premium account.
The Company’s sole shareholder also resolved at the AGM that, with effect from, and conditional upon,DIFX Admission and the Initial Allotment having been made:
� the Company’s issued share capital be sub-divided into 1,000 shares of US$0.10 each;
� the Company’s authorised share capital be increased from $100 to $2,500,000,000 by the creation of24,999,999,000 shares of US$0.10 each;
� conditional upon the Initial Allotment having been made, the Directors be authorised to capitalise$1,659,999,900, being part of the sum which will stand to the credit of the Company’s share premiumaccount immediately following the Initial Allotment, and to apply such sum on behalf of the holders ofshares on the register of members at the close of business on the day before DIFX Admissionbecomes effective (the ‘‘Record Date’’) in paying up in full 16,599,999,000 new shares of $0.10 each tobe allotted to such holders in proportion to the number of shares held by them on the Record Date(the ‘‘Bonus Issue’’);
� the Company adopt the Articles;
� in substitution for all existing authorities and/or powers, the Directors be generally andunconditionally authorised for the purposes of the Articles to exercise all powers of the Company toallot Relevant Securities (as defined in the Articles) up to an aggregate nominal amount equal toone-third of the issued and unconditionally allotted share capital of the Company following theallotment of shares in connection with the Initial Allotment and the Bonus Issue, such authority toexpire on the earlier of the conclusion of the annual general meeting of the Company to be heldin 2008 and 30 June 2008;
� in substitution for all existing authorities and/or powers, the Directors be generally empoweredpursuant to the Articles to allot Equity Securities (as defined in the Articles) pursuant to the generalauthority referred to above as if Article 7 of the Articles (Pre-Emption Rights) did not apply to suchallotment, such power to expire on the earlier of the conclusion of the annual general meeting of theCompany to be held in 2008 and 30 June 2008 provided that such authority be limited to:
(i) the allotment of Equity Securities in connection with a rights issue, open offer or any otherpre-emptive offer in favour of ordinary shareholders but subject to such exclusions as may benecessary to deal with fractional entitlements or legal or practical problems under any laws orrequirements of any regulatory body in any jurisdiction; and
(ii) the allotment (other than pursuant to (i) above) of Equity Securities for cash up to an aggregatenominal amount equal to 5 per cent. of the issued and unconditionally allotted share capital ofthe Company following the allotment of shares in connection with the Initial Allotment and theBonus Issue; and
150
www.global-reports.com
� the conversion of the entire class of shares of US$0.10 in the capital of the Company intouncertificated form be approved.
Our Articles of Association
The following is a summary of the rights under our Articles and the DIFC Companies Law No. 3 of 2006(the ‘‘Companies Law’’) which attach to the existing shares of the Company, with which the new Shares willrank pari passu in all respects when unconditionally allotted and fully paid.
In the following description of the rights attaching to the Company’s shares, a holder of shares and ashareholder is, in both cases, the person registered in the Company’s register of shareholders as the holderof the relevant shares.
Objective
As set out in article 4 of our Articles, the principal business activities of the Company are the acquisition,holding, management and operation of interests in undertakings operating in the port sector, including themanagement, operation and ownership of ports and related businesses and the maritime industry generallyand, in general, to engage in any lawful act or activity for which companies may be incorporated under theCompanies Law.
Share Capital
All shares rank in all respects equally with other shares of the same class. If at any time the Company’sshare capital is divided into different classes of shares, the rights attached to any class may only be variedor aggregated either with the consent in writing of the holders of two-thirds of the shares of that class orwith the sanction of an ordinary resolution passed at a separate meeting of the holders of the issued sharesof that class. Pursuant to the Companies Law, any alteration of a provision in the Articles for the variationof the rights attached to a class of shares, or the insertion of any such provision into the Articles is itself tobe treated as a variation of those rights.
Subject to the Companies Law and to the rights attached to any existing shares, new shares may be issuedwith, or have attached to them, such rights or restrictions as the Company may by ordinary resolutiondetermine. The Company may issue, or convert existing non-redeemable shares, whether issued or not,into redeemable shares at the option of the Company or the shareholder. All shares must be fully paidwhen allotted and the Company may not take a lien over any of the shares.
The Companies Law provides that the Company may purchase its own shares (including any redeemableshares). The shares may only be purchased if approved in advance by an ordinary resolution of theCompany (on which the shares to be purchased do not carry an entitlement to vote).
Share Certificates
Subject to the Companies Law, the DIFC Dematerialised Investments Regulations and to any otherapplicable laws and regulations and the facilities and requirements of any relevant system concerned, theDirectors have the power to implement any arrangements as they may, in their absolute discretion, think fitin relation to the evidencing of title to and transfer of uncertificated shares. Unless otherwise determinedby the Directors or permitted by the Companies Law, the DIFC Dematerialised Investments Regulationsor other applicable laws and regulations, no person shall be entitled to receive a certificate in respect ofany share for so long as the title of the share is evidenced otherwise than by a certificate and for so long asany transfers of that share may be made otherwise than by a written instrument.
Always subject to the Companies Law, the DIFC Dematerialised Investments Regulations and to any otherapplicable laws and regulations and the facilities and requirements of any relevant system concerned:
� the Directors may in their absolute discretion convert certificated shares into uncertificatedshares and vice versa, in such manner as they may think fit, subject (in both cases) to the approvalof the majority of the holders of the relevant shares;
� the Company shall enter on the register of members how many shares are held in uncertificatedform and in certificated form and holdings in certificated form and uncertificated form shall betreated as separate holdings; and
151
� a class of shares is not to be treated as two classes by virtue of the fact that such class comprisesboth certificated shares and uncertificated shares or as a result of an provision of the Articles, theCompanies Law or any other applicable law or regulation which applies only in respect ofcertificated or uncertificated shares.
Every person whose name is entered on the register of members as a holder of certificated shares isentitled, without charge, to receive within 14 days of allotment or lodgement with the Company of atransfer to him of those shares one certificate for all the certificated shares of a class registered in his name(or several certificates each for one or more of his shares upon payment of $10 for every certificate afterthe first or such lesser sum as the Directors shall from time to time determine) or, in the case ofcertificated shares of more than one class being registered in his name, to a separate certificate for eachclass of shares. Where a shareholder transfers part of his shares comprised in a certificate he is entitled,without charge, to one certificate for the balance of certificated shares retained by him.
Where a certificate is worn out or defaced, the Board may require the certificate to be delivered to it andpayment of any exceptional out-of-pocket expenses incurred by the Company before issuing a replacementand cancelling the original. If a certificate is lost or destroyed, the Board may cancel it and issue areplacement certificate on such terms as to provision of evidence and indemnity and to payment of anyexceptional out-of-pocket expenses incurred by the Company in the investigation of that evidence and thepreparation of that indemnity as the Board may decide.
Untraced Shareholders
The Company may sell the share of a shareholder or of a person entitled by transmission at the best pricereasonably obtainable at the time of sale, if:
� during a period of not less than 7 years before the date of publication of the advertisementsreferred to below (or, if published on two different dates, the first date) (the ‘‘relevant period’’) atleast three cash dividends (whether interim or final) have become payable in respect of the shareand no dividend during that period has been claimed;
� throughout the relevant period no check, warrant or money order payable on the share has beencashed and the Company has not at any time during the relevant period received anycommunication from the holder of, or person entitled by transmission to, the share;
� on expiry of the relevant period the Company has given notice of its intention to sell the share byadvertisement in a national newspaper in the UAE, England and in a newspaper circulating in thearea of the address of the holder of, or person entitled by transmission to, the share shown in theregister;
� the Company has not during a further period of three months after the date of suchadvertisements and before the exercise of the power of sale received a communication from theholder of, or person entitled by transmission to, the share; and
� if the shares are admitted to the Official List or dealt in on the DIFX, the Company has givennotice to the DIFX of its intention to sell such shares.
The Company shall be indebted to the shareholder or other person entitled by transmission to the sharefor the net proceeds of sale and shall carry any amount received on sale to a separate account. No trustshall be created in respect of the debt and such net proceeds may be employed in the business of theCompany or invested as the Board may think fit.
Changes in Share Capital
The Company may by special resolution:
� increase its share capital by creating new shares;
� consolidate and divide all or any of its shares (whether allotted or not) into shares representing alarger value than its existing shares;
� sub-divide all or any of its shares into shares of a smaller amount; and
� cancel shares which, at the date of the passing of the resolution to cancel them, have not beentaken or agreed to be taken by any person and diminish the amount of its share capital by theamount of the shares so cancelled.
152
www.global-reports.com
Any fractions of shares resulting from a consolidation and division or sub-division of shares may be dealtwith by the Board on behalf of the shareholders as it thinks fit.
The Company may, in accordance with the Companies Law, reduce its share capital in any way and on suchterms as it may decide.
Pre-emption Rights
The Articles contain provisions giving pre-emption rights to holders of ‘‘ordinary shares’’ (meaning sharesother than those shares giving rights only up to a specified amount of dividend and capital in adistribution), entitling them to be offered any equity securities proposed to be issued by the Company inproportion to their existing shareholdings. For this purpose, ‘‘equity securities’’ means ordinary shares orrights to subscribe for or convert securities into ordinary shares.
These pre-emption provisions do not apply:
� to allotments of equity securities which are to be paid (wholly or partly) otherwise than in cash;
� to the allotment of equity securities that would, apart from any renunciation or assignment of theright to their allotment, be held under an employees’ share scheme; and
� in relation to the allotment of bonus shares.
Any equity securities which the Company has offered to a holder of ordinary shares may be allotted to him,or to anyone in whose favour he has renounced his right to their allotment, without contravening theseprovisions. Any offer made under these provisions may be in hard copy or electronic form and must state aperiod of not less than 21 days during which it may be accepted and may not be withdrawn before the endof such period.
Disapplication of Pre-emption Rights
The pre-emption rights summarised above may also be disapplied in whole or modified as the Directorsdetermine, provided the Directors are authorised to do so by special resolution, which shall not beproposed unless recommended by the Directors and a notice is circulated to shareholders with a Directors’statement setting out reasons for making such recommendation, the amount to be paid to the Company inrespect of such allotment, and the Directors’ justification of such amount.
Dividends
Subject to the provisions of the Companies Law, the Company may by ordinary resolution declaredividends in accordance with the respective rights and interests of the shareholders, but no dividend shallexceed the amount recommended by the directors.
The Company may declare a dividend or resolve to make a distribution at any time if the Board hasresolved, on reasonable grounds, that the Company will, immediately after the dividend is paid or thedistribution is made, be able to pay its debts as they become due in the normal course of business.
The Company may pay a dividend or make a distribution at any time if:
� the dividend has been declared or the distribution has been resolved to be made as set out above;
� the dividend will be paid, or the distribution will be made, out of profits and/or surplus of theCompany as shown in the accounts of the Company prepared as at the end of the last financialyear or, in the case of an interim dividend or distribution, at the end of such period as is sufficientto enable the directors to form a reasonable view as to the amount of the profits and/or surplusfrom which the dividend will be paid or the distribution will be made; and
� the Board has resolved immediately prior to the payment of the dividend or the making of thedistribution, on reasonable grounds, that the Company will, immediately after the dividend ispaid or the distribution is made, be able to pay its debts as they become due in the normal courseof business and at no time between the date of the resolution of the Board declaring the dividendor distribution and the date of the resolution immediately prior to the payment did the Boardconsider that the Company would not, after the dividend has been paid or the distribution hasbeen made, be able to pay its debts as they become due in the normal course of business.
153
Subject to the provisions of the Companies Law, the Board may declare and pay such interim dividends asappears to it to be justified by the profits of the Company available for distribution. If the share capital isdivided into different classes, no interim dividend shall be paid on shares carrying deferred ornon-preferred rights if, at the time of payment, any preferential dividend is in arrears.
The Board may, with the prior authority of an ordinary resolution of the Company, direct that payment ofa dividend may be satisfied wholly or in part by the distribution of specific assets and, in particular, of paidup shares or the debentures of another company.
A dividend unclaimed by a shareholder for a period of 7 years from the date it was declared or became duefor payment is forfeited and ceases to remain owing to by the Company.
For more information relating to dividends, see ‘‘Dividend Policy’’.
Transfer of Shares
A shareholder may transfer all or any of his certificated shares by instrument of transfer in writing in anyusual form or in any other form approved by the Board and the instrument shall be executed by or onbehalf of the transferor. All transfers of uncertificated shares are to be made in accordance with and besubject to the provisions of the DIFC Dematerialised Securities Regulations, the facilities andrequirements of any relevant system and in accordance with any arrangements made by the Directorspursuant to the Articles.
In exceptional circumstances approved by the DIFX, the Board may refuse to register a transfer ofcertificated shares provided that such refusal would not disturb the market in those shares. The Board mayalso refuse to register any transfer of a share in certificated form unless it:
� is only in respect of only one class of shares;
� is in favour of a single transferee or not more than four joint transferees; and
� is delivered for registration to the registered office of the Company or such other place as theBoard may decide, accompanied by the certificate for the shares to which it relates and suchother evidence as the Board may reasonably require to prove the title of the transferor or personrenouncing and the due execution by him of the transfer, if the transfer is executed by some otherperson on his behalf, the authority of that person to do so.
The registration of transfers may be suspended at such times and for such periods (not exceeding 30 daysin any year) as the Board may decide in its discretion and either generally or in respect of a particular classof shares as determined by it. Except where required by the Companies Law, the Company may not chargeany fee for registering the transfer of a share. The Company may retain any instrument of transfer which isregistered.
Disclosure of Interests and Power of the Company to investigate interests in shares
In accordance with Rules 9.2.2 and 9.2.3 of the Offered Securities Rules of the DFSA, any person owningor beneficially owing shares carrying more than 5% of the votes attached to all of the Company’s sharesmust file a report with the Company and the DFSA and thereafter file a further report with the Companyand the DFSA with respect to each increase or decrease in its holding that exceeds one full percentagepoint from the level reported by such person in its previous report.
The Company may give written notice to a person, whom it knows or has reasonable cause to believe to be,or in the previous 3 years to have been, interested in the Company’s shares, requiring him to confirm ordeny such interest and to give such further information as may be requested.
If it shall come to the notice of the Directors that a shareholder has not complied with his notificationobligation pursuant to the Offered Securities Rules of the DFSA or if the person on whom notice is servedfails within 14 days to supply to the Company the information thereby requested, unless the Boardotherwise decides, the shareholder is no longer entitled in respect of the default shares to be present atgeneral meetings or to vote on any question, or to be reckoned in a quorum. Where the default sharesrepresent 0.25% in nominal value of the issued shares of the relevant class, the Company may also suspendpayment of dividends which would have been payable in respect of the shares in relation to which thedefault has occurred; treat any election made by the defaulting shareholder to receive shares instead ofcash as ineffective; and, in certain circumstances, refuse to register a transfer of shares held by thedefaulting shareholder.
154
www.global-reports.com
General Meetings
The Company must hold an annual general meeting once every year. Such meetings shall be convened bythe Board at such time and place as it thinks fit provided that there must not be a gap of more than fifteenmonths between one annual general meeting and the next and not more than six months shall elapsebetween the end of the Company’s financial year and its next annual general meeting. All general meetingsof the Company other than annual general meetings are called extraordinary general meetings.
At least 21 clear days’ notice must be given of a general meeting. The quorum for a general meeting is twoshareholders present in person or by proxy and entitled to vote.
Voting Rights
At a general meeting every shareholder present in person or by proxy has on a show of hands one vote andevery shareholder present in person or by proxy has on a poll vote one vote for every share of which he isthe holder.
In the case of joint holders of a share, the vote of the senior who tenders a vote, whether in person or byproxy, shall be accepted to the exclusion of the vote or votes of the other joint holder or holders, andseniority is determined by the order in which the names of the holders stand in the register.
An instrument appointing a proxy shall be in writing in any usual form (or in another form approved by theboard) executed under the hand of the appointor or his duly constituted attorney or, if the appointor is acompany, under its seal or under the hand of its duly authorised officer or attorney or other personauthorised to sign.
Proceedings at General Meetings
The Chairman of the Board or, in his absence, the Vice Chairman shall preside as chairman at a generalmeeting. If there is no Chairman or Vice Chairman, or if at a meeting neither is present and willing andable to act within five minutes after the time fixed for the start of the meeting, the Directors present shallselect one of their number to be chairman. If only one Director is present and willing and able to act, heshall be chairman. In default, the members present in person and entitled to vote shall choose one of theirnumber to be chairman.
At a general meeting, a resolution put to the vote of the meeting shall be decided on a show of handsunless (before or on the declaration of the result of the show of hands) a poll is properly demanded by:
� the chairman of the meeting;
� not less than five shareholders present in person or by proxy and entitled to vote; or
� a shareholder or shareholders present in person or by proxy representing in aggregate not lessthan 5 per cent. of the total voting rights of all the shareholders having the right to vote at themeeting.
The demand for a poll may be withdrawn but only with the consent of the chairman. A demand withdrawnin this way validates the result of a show of hands declared immediately before the demand was made. If apoll is demanded before the declaration of the result of a show of hands and the demand is dulywithdrawn, the meeting shall continue as if the demand had not been made.
In the case of an equality of votes whether on a show of hands or on a poll, the chairman of the meeting atwhich the show of hands takes place or at which the poll is demanded shall be entitled to a casting vote inaddition to any vote to which he is entitled as a shareholder.
Powers and Duties of the Board
Subject to the Companies Law and the Articles and to directions given by special resolution of theCompany, the business and affairs of the Company shall be managed by the Board which may exercise allthe powers of the Company whether relating to the management of the business or not.
The Board may delegate to a Director holding executive office or to a committee consisting of one or morepersons (whether a member or members of the Board or not) any of its powers, authorities and discretionsfor such time and on such terms and conditions as it thinks fit.
155
Appointment and Retirement of Directors
The Company may by ordinary resolution appoint a person who is willing to act to be a director, either tofill a vacancy or as an addition to the Board, subject to the total number of directors not exceeding anymaximum number decided by the Company by ordinary resolution.
The Board may appoint a person who is willing to act as a director to fill a vacancy created by the death,resignation or removal of a director. A director appointed in this way may hold office only until thedissolution of the next annual general meeting after his appointment unless he is reappointed during thatmeeting. He is not taken into account in determining the number of directors who are to retire by rotationat the meeting.
At each annual general meeting one third of the Directors who are subject to retirement by rotation or, iftheir number is not three or a multiple of three, the number nearest to but not less than one third, shallretire from office provided that if there are fewer than three Directors who are subject to retirement byrotation, one shall retire from office. A retiring Director shall be eligible for reappointment.
The Directors to retire by rotation at an annual general meeting include, so far as necessary to obtain thenumber required, first, a Director who wishes to retire and not offer himself for reappointment, and,second, those Directors who have been longest in office since their last appointment or reappointment. Asbetween two or more who have been in office an equal length of time, the Director to retire shall, indefault of agreement between them, be determined by lot.
Directors’ Interests
A Director shall declare the nature of his interest in any contract, arrangement, transaction or proposalwith the Company at the first opportunity at a meeting of the Board after he knows that he is or hasbecome interested or by writing to the Directors as required by the Companies Law. Except in particularcircumstances, a director may not vote on or be counted in the quorum in relation to a resolution of theBoard or of a committee of the Board concerning a contract, arrangement, transaction or proposal towhich the Company is or is to be a party and in which he has an interest which is, to his knowledge, amaterial interest (otherwise than by virtue of his interest in shares or debentures or other securities of orotherwise in or through the Company).
A Director shall not vote or be counted in the quorum at a meeting of the Directors or committee meetingin respect of any resolution concerning his own appointment as the holder of any office or place of profitwith the Company or any other company in which the Company is interested. Where proposals are underconsideration concerning the appointment of two or more Directors to any such office or place of profit,those proposals shall be divided and considered in relation to each director separately and each of theDirectors concerned (if not otherwise debarred from voting under the Articles) shall be entitled to voteand be counted in the quorum in respect of each resolution except that concerning his own appointment.
Directors’ Remuneration
The salary or other remuneration of a Director appointed to hold employment or executive office inaccordance with the Articles may be a fixed sum of money, or wholly or in part governed by business doneor profits made, or as otherwise decided by the Board, and may be in addition to or instead of a feepayable to him for his services as director pursuant to the Articles.
Unless otherwise decided by the Company by ordinary resolution, the Company shall pay to the Directors(but not alternate directors) for their services as Directors such amount of aggregate fees as the Boarddecides. The aggregate fees shall be divided among the Directors in such proportions as the Board decidesor, if no decision is made, equally. A fee payable to a Director for his services as Director is distinct fromany salary, remuneration or other amount payable to him pursuant to other provisions of the Articles orotherwise and accrues from day to day.
A Director who, at the request of the Board, goes or resides abroad, makes a special journey or performs aspecial service on behalf of the Company may be paid such reasonable additional remuneration (whetherby way of salary, percentage of profits or otherwise) and expenses as the Board may decide.
A Director is entitled to be repaid all reasonable travelling, hotel and other expenses properly incurred byhim in the performance of his duties as director including, without limitation, expenses incurred inattending meetings of the Board or of committees of the Board or general meetings or separate meetingsof the holders of a class of shares or debentures.
156
www.global-reports.com
Indemnity of Officers
Subject to certain exceptions, to the extent permitted by the Companies Law and without prejudice to anyindemnity to which he may otherwise be entitled, the Company shall and shall keep indemnified out of theassets of the Company every person who is or was a director or other officer of the Company (other thanany person (whether or not an officer of the Company) engaged by the Company as auditor) against allcosts, charges, losses and liabilities incurred by him (whether in connection with any negligence, default,breach of duty or breach of trust by him or otherwise) in relation to the Company or its affairs.
Distributions on Liquidation to Shareholders
On a voluntary winding up of the Company the liquidator may, on obtaining any sanction required by law,divide among the shareholders in kind the whole or any part of the assets of the Company, whether or notthe assets consist of property of one kind or of different kinds, and vest the whole or any part of the assetsin trustees upon such trusts for the benefit of the shareholders as he, with the like sanction, shalldetermine. For this purpose the liquidator may set the value he deems fair on a class or classes of property,and may determine on the basis of that valuation and in accordance with the then existing rights ofshareholders how the division is to be carried out between shareholders or classes of shareholders. Theliquidator may not, however, distribute to a shareholder without his consent an asset to which there isattached a liability or potential liability for the owner.
Form of Notices and Communications
Unless the Articles expressly require otherwise, any notice, document or information to be sent or suppliedby the Company to shareholders (including forms of appointment of a proxy and copies of the Company’sannual accounts) may be sent or supplied in hard copy form, in electronic form (for example, by email orfacsimile) or by means of the Company’s or another website.
157

CLEARANCE AND SETTLEMENT
Trading of the Shares will take place through the trading system of the DIFX. Shares may be held either inaccounts opened with the CSD by the holders thereof or through custodian omnibus accounts and theownership of the Shares will be evidenced by the holdings in such accounts. Clearing and settlement oftrades on the DIFX by brokers or custodians may be performed only through members of the DIFX thatare Clearing Members. Each Clearing Member must hold a securities account with the CSD and a cashaccount with a designated settlement bank for settlement purposes. Similarly, a custodian needs to hold anomnibus account with the CSD and a cash account with a settlement bank for settlement of off-exchangetrades. Settlement of securities trading on the DIFX is governed by the DIFX Business Rules.
158
www.global-reports.com
DESCRIPTION OF THE PCFC DEVELOPMENT FZCO SUKUK
Overview
On January 23, 2006, PCFC Development FZCO, an affiliate of ours, issued the PCFC DevelopmentSukuk, which evidences an undivided beneficial interest in certain assets held in trust. The proceeds of thePCFC Development Sukuk, together with a $1.5 billion contribution in kind made by PCFC, were investedat the discretion of PCFC in Shari’a-compliant business activities of PCFC’s subsidiaries in accordancewith an agreed business plan.
In connection with the Restructuring and pursuant to the terms of the PCFC Development Sukuk, DubaiWorld, our indirect parent company, provided certain undertakings in respect of the PCFC DevelopmentSukuk and Port & Free Zone World FZE, our direct parent, granted a share pledge for the benefit of theSukukholders over all of our shares, which, in each case, will remain in effect until the PCFC DevelopmentSukuk is redeemed in full; provided that, pursuant to the terms of the PCFC Development Sukuk, Sharessold pursuant to the Global Offering will be automatically released from the share pledge granted byPort & Free Zone World FZE. However, neither we, nor our subsidiaries, are subject to the covenantscontained in, or have any liability in respect of, the PCFC Development Sukuk.
Redemption and Repayment
In the event of certain equity offerings by members of the Dubai World group (each a ‘‘Qualifying PublicOffering’’, which includes the Global Offering), the PCFC Development Sukuk must be redeemed pro rataat par, plus an accumulated return of 7.125 per cent. per annum on the outstanding aggregate principalamount thereof, with an amount (the ‘‘Sukuk Repayment Amount’’) equal to the lesser of (i) 83% of thegross proceeds of the relevant Qualifying Public Offering and (ii) an amount sufficient to redeem thePCFC Development Sukuk in full. Pursuant to the terms of the PCFC Development Sukuk, 70% ofthe Sukuk Repayment Amount is payable in cash and the remaining 30% is payable in the form of shares(including depositary receipts) or other equity (or equity linked) securities (collectively, the ‘‘QPOShares’’) issued in the relevant Qualifying Public Offering. Any such redemption may be in whole or inpart depending on the size of the applicable Qualifying Public Offering.
On the business day falling 30 days after the closing date of the relevant Qualifying Public Offering (the‘‘QPO Redemption Date’’), each Sukukholder shall receive 100% of its pro rata entitlement to the cashportion of the Sukuk Repayment Amount and 50% of its pro rata entitlement to QPO Shares, with theremaining 50% to be delivered on the business day falling three months following the closing date of suchQualifying Public Offering (the ‘‘Deferred QPO Redemption Date’’).
If a Sukukholder fails to comply with the procedures governing the delivery of QPO Shares set forth in thePCFC Development Sukuk or is prohibited from receiving QPO Shares by virtue of the applicable sellingrestrictions of the relevant Qualifying Public Offering, then the Principal Paying and Exchange Agent shalluse reasonable endeavours to dispose of such Sukukholder’s pro rata entitlement of QPO Shares on anarm’s length basis to (or to the order of) the lead managers and bookrunners of the relevant QualifyingPublic Offering and deliver to such Sukukholder the cash proceeds from the sale of 50% of such QPOShares on or before the business day falling 30 days after the QPO Redemption Date, with the remaining50% to be delivered on or before the business day falling 30 days after the Deferred QPO RedemptionDate.
Unless previously redeemed in full, the PCFC Development Sukuk must be redeemed in cash at par, plusan accumulated return of 10.125 per cent. per annum on the then-outstanding aggregate principal amountthereof, on January 23, 2008 (the ‘‘Final Redemption Date’’). However, subject to certain conditionscontained in the PCFC Development Sukuk, Sukukholders as of Final Redemption Date retain the optionto subscribe for QPO Shares issued pursuant to a Qualifying Public Offering that occurs during the twelvemonths following the Final Redemption Date.
Sukuk Allocation
Because the Global Offering constitutes a Qualifying Public Offering, the PCFC Development Sukuk mustbe redeemed as set forth above. The Sukuk Repayment Amount will equal the lesser of (i) 83% of thegross proceeds of the Global Offering and the Over-allotment Option (to the extent exercised) and (ii) anamount sufficient to redeem the PCFC Development Sukuk in full, in each case, with the Sukuk Allocation
159
comprising the number of Shares that could be purchased at the Offer Price with 30% of the SukukRepayment Amount.
We expect that the redemption in part of the PCFC Development Sukuk following the Global Offering willoccur as follows:
(i) on the Closing Date, the Selling Shareholder will deliver the Shares constituting the SukukAllocation to an escrow account in the name of PCFC;
(ii) prior to the QPO Redemption Date (which will be the business day falling 30 days after theClosing Date), PCFC will (A) transfer the Sukuk Allocation from the escrow account to a custodyaccount opened and maintained in the name of PCFC Development FZCO (as trustee for and onbehalf of the Sukukholders) and (B) pay an amount in cash equal to 70% of the SukukRepayment Amount into a transaction account opened and maintained in the name of PCFCDevelopment FZCO (as trustee for and on behalf of the Sukukholders);
(iii) on the QPO Redemption Date, each Sukukholder will receive 100% of its pro rata entitlement tothe cash portion of the Sukuk Repayment Amount and 50% of its pro rata entitlement to theSukuk Allocation, with the remaining 50% to be delivered on the Deferred QPO RedemptionDate (which will be the business day falling three months following the Closing Date);
(iv) following the QPO Redemption Date, the Principal Paying and Exchange Agent will usereasonable endeavours in accordance with the terms of the PCFC Development Sukuk to disposeof the pro rata Sukuk Allocation of Sukukholders (the ‘‘Non-Complying Sukukholders’’) thatfailed to comply with the procedures governing the delivery of the Sukuk Allocation or wereprohibited from receiving the Sukuk Allocation by virtue of the selling restrictions applicable tothe Global Offering; and
(v) on or before the business day falling 30 days after the QPO Redemption Date, the PrincipalPaying and Exchange Agent will deliver to each Non-Complying Sukukholder the cash proceedsfrom the sale of 50% of such Non-Complying Sukukholder’s pro rata Sukuk Allocation, with theremaining 50% to be delivered on or before the business day falling 30 days after the DeferredQPO Redemption Date.
160
www.global-reports.com
OVERVIEW OF THE UAE
Introduction
The UAE is a federation of seven emirates made up of Abu Dhabi, Dubai, Sharjah, Ajman, Umm AlQuwain, Fujairah and Ras Al Khaimah. The UAE has one of the most liberal business environments in theMiddle East focused around economic liberalisation and promoting the role of the private sector. Thereare currently no corporate taxes in most business sectors, other than oil producing companies and foreignbanks, no personal taxes and no exchange controls on the remittance of profits or repatriation of capital.Additionally, the UAE enjoys low tariffs and there are virtually no restrictions on foreign trade.
Legal System
There are three primary sources or types of law in the UAE: federal laws and decrees, local laws andShari’a (Islamic law). The secondary source of law is trade custom or practice. In the absence of federallegislation on areas specifically reserved to federal authority, the ruler or local government of each emiratewill apply his or its own rules, regulations and practices. As is its right under the Constitution, Dubai, likethe emirate of Ras Al Khaimah, has elected to maintain its own court system, separate from that of thefederation, and the courts of Dubai have sole jurisdiction to hear cases brought in Dubai. Although bothfederal and Dubai courts have a similar three-tier structure (Court of First Instance, Court of Appeal andCourt of Cassation/Supreme Court), Dubai has retained complete autonomy over its courts in all matters,including the appointment of judges. In accordance with the Constitution, however, the Dubai courts willfirst apply federal law where this exists and, in its absence, the laws of Dubai. The Company isincorporated in the DIFC, which is a newly established jurisdiction with its own civil and commercial lawsapplicable to it and other companies domiciled in the DIFC. As such the DIFC will have jurisdiction onmatters which fall within the laws of the DIFC. DIFC Law No. 12 of 2004 states that judgments, awards ororders made by the DIFC Court will be enforced by the Dubai Courts (provided the judgment, award ororder is final and ‘‘appropriate’’ for enforcement. The Dubai Courts have no jurisdiction to review themerit of a DIFC judgment. See ‘‘Risk Factors—Risks Relating to the Shares—We are a DIFC company,and it may be difficult for you to enforce judgments against us or our directors and senior management’’.
The Emirate of Dubai
Dubai is, after the emirate of Abu Dhabi, the largest emirate in the UAE, and is situated on the west coastof the UAE in the south western part of the Arabian Gulf. It covers an area of 3,885 square kilometres andlies approximately at longitude 55 degrees east and latitude 25 degrees north. Except for a tiny enclave inthe Hajar Mountains at Hatta, the emirate of Dubai comprises one contiguous block of territory.
The population of Dubai was estimated at 1,300,000 in 2006. Approximately 75% of the population isestimated to be non-UAE nationals, mainly drawn from the Indian subcontinent, Europe and other Arabcountries. Approximately 75% of the population is estimated to be male and 25% female, reflecting thelarge male expatriate workforce.
History
Dubai started as a pearl and fishing village sometime in the first half of the eighteenth century. From the1850s until the formation of the UAE in 1971, the British were the dominant influence in the region, andeach emirate entered into a separate treaty with Great Britain. The emirates were then collectively knownas the Trucial States or Sheikhdoms and the area was generally known as the Trucial Coast. TheSheikhdoms were each led by a sheikh, who usually belonged to the most influential tribe in that area.
The growth of Dubai began in the early part of the nineteenth century when members of the Bani Yastribe, led by Sheikh Maktoum Bin Butti, left Abu Dhabi and migrated north to found an independentSheikhdom in the area now known as Dubai.
During the nineteenth century, Dubai, split by a 14 kilometre long creek, which led into a natural harbour,established itself as a flourishing centre for the import and re-export of merchandise (the entrepot trade).Another important economic activity at that time was pearling. Offshore from Dubai and Abu Dhabi, thewaters were rich with pearl beds. However, the Great Depression of the 1930s and the emergence ofartificial pearls in 1929 dented Dubai’s prosperity.
To counter the loss of economic activity from the decline in pearling, Dubai encouraged traders from Indiaand Iran to establish their business in Dubai. Traders, attracted by Dubai’s liberal policies, especially its
161
lower taxes on foreigners compared to its neighbours, made it their base and Dubai quickly establisheditself as a leading centre for trade in gold bullion, textiles and consumer durables.
In the 1930s and 1940s, oil was discovered in Kuwait, Qatar and Saudi Arabia—adding to that alreadyfound in Bahrain, Iran and Iraq. In 1958, oil was found off the shore of Abu Dhabi and, in 1966, oil wasfirst discovered by the Dubai Petroleum Company at Fateh, which lies 92 kilometres off the coast of Dubai.As the primary regional trading hub, Dubai was well placed to capitalise on the upturn in Middle Eastbusiness activity that came with oil exports.
The Economy of Dubai
Dubai’s strategic position at the crossroads between the East and West has helped establish it as a leadingtrading and services hub between the Far East and Europe.
Dubai’s economy is more diversified than that of Abu Dhabi and it is one of the most importantcommercial centres in the Middle East, with growing banking, tourism and real estate sectors. However,with only a fraction of the fossil fuel reserves of Abu Dhabi, it has gradually reduced its dependency on oiland gas revenues. The Government of Dubai continues to invest heavily in the infrastructure of theemirate and its economic development. Much of the infrastructure that has been created in recent years,both public and private, is aimed at reinforcing Dubai’s strategic position at the East-West crossroads.
Dubai has focused on developing itself as a centre for tourism, trade and commerce in order to diversify itseconomy away from oil. The emirate has successfully pioneered the use of free zones to spur economicactivity and attract companies to its shores. These free zones offer 100% ownership to non-nationals, andserve as an attractive location for companies seeking to serve the growing markets of the Middle East,South Asia and Central Asia.
Some free zones currently operating in Dubai include JAFZ, the Technology Electronic Commerce andMedia Free Zone (TECOM) and the DIFC. The DIFC is a financial free zone, aimed at attractinginternational commercial banks, investment banks, insurance companies and other financial institutions.TECOM consists of Dubai Internet City, Dubai Media City and Knowledge Village and aims to attractglobal companies that serve the technology, media and training industry. TECOM’s tenants includeprestigious international and regional IT and media companies such as Microsoft, IBM, Reuters, CNN,CNBC, and MBC, among others. JAFZA was established in 1980 with the specific purpose of facilitatinginvestment in manufacturing and distribution businesses. Currently, around 6,000 companies are registeredwith JAFZA, including over 160 Fortune Global 500 companies.
Other free zones include the Dubai Multi Commodities Centre, the Airport Free Zone and DubaiHealthcare City. Upcoming free zones include Dubai Logistics City, Dubai Aid City, Dubai Biotech FreeZone, and Dubai Silicon Oasis, in addition to a number of others.
For more information on the DIFC, see ‘‘—The Emirate of Dubai—DIFC’’ below.
The Government of Dubai
All powers of government in Dubai are vested in the Ruler. The various departments and other arms of theGovernment and their respective executives operate under the powers and responsibilities specificallydelegated to them from time to time by the Ruler. Laws of Dubai are passed by Decree of the Ruler. Thepresent Ruler is H.H. General Sheikh Mohammed bin Rashid Al Maktoum.
In Dubai, there are various local governing bodies charged with regulating and administering local law andpolicy, including the Dubai Department of Economic Development, Dubai Municipality and theDepartment of Civil Aviation.
DIFC
The DIFC is a financial free zone with its own civil and commercial laws established in 2004 in the emirateof Dubai. The DIFC has been granted authority to self-legislate in civil and commercial areas. Companiesoperating in the DIFC are subject to the Companies Law. Financial services in the DIFC are governed bythe DIFC Regulatory Law No. 1 of 2004, which also governs the operation of the Dubai Financial ServicesAuthority, a financially and administratively independent body created by Law No. (9) of 2004 issued bythe Ruler of Dubai on September 13, 2004 (the ‘‘DIFC Law’’) that acts as the independent financialregulator in the DIFC. Legislation, rules and regulations governing companies incorporated in the DIFCand financial activities in the DIFC are available on the websites of the DIFC and the DFSA at www.difc.aeand www.dfsa.ae, respectively. We have not independently verified the information contained on these
162
www.global-reports.com
websites, can provide no assurance as to the accuracy or completeness of such information and do notincorporate the information contained on these websites into, or otherwise include in, this Prospectus.
DIFX
The DIFX is a securities exchange located in the DIFC. The DIFX commenced operations onSeptember 26, 2005. The DIFX was incorporated as a limited liability company under the Companies Lawon September 29, 2004 and is a wholly owned subsidiary of the DIFC Authority, a financially andadministratively independent body created by the DIFC Law. Twelve companies currently have theirshares or other equity securities admitted to trading on the exchange and the total trading volume for 2006and the six months ended June 30, 2007 was $26.3 million and $15.7 million, respectively. As of October 26,2007, the market capitalisation of all securities listed on the DIFX was approximately $32.3 billion, ofwhich equity securities accounted for approximately $4.2 billion.
To date, the DIFX has adopted two sets of rules: the Business Rules and the Listing Rules. The BusinessRules govern membership of the DIFX, including eligibility requirements for financial institutions,categories of membership, rights and obligations of members and the process for membership applications.The Business Rules also govern procedures, responsibilities and fees regarding clearing and settlement ofsecurities traded on the DIFX. The Listing Rules govern the listing of equity, debt and other securities onthe DIFX, covering such areas as eligibility of issuers for listing, the listing application process, continuingobligations following a listing and sanctions for non-compliance with the Listing Rules. The Business Rulesand the Listing Rules are available on the website of the DIFX at www.difx.ae. Neither the Joint GlobalCoordinators, the Underwriters nor we have independently verified the information contained on DIFX’swebsite and we can provide no assurance as to the accuracy or completeness of such information. Theinformation contained on DIFX’s website is not incorporated by reference into, or otherwise included in,this Prospectus.
The DIFX is governed by its board of directors, comprised of 7 non-executive directors and three standingcommittees: the audit and risk management committee, the market oversight committee and thenomination and remuneration committee, all of which have formal charters. The market oversightcommittee is responsible for the independent oversight of the Markets Authority function which includesthe Listing Authority, compliance, surveillance and enforcement departments. It also supervises theregulatory functions carried out by other areas of DIFX. The audit and risk management committee isresponsible for the independent and objective oversight of legal and regulatory compliance, governanceissues, internal control and risk management, financial reporting, external and internal auditors andfinancial controls. The nomination and remuneration committee is responsible for recommending newmembers to the board, succession planning for the board and senior management, performance evaluationof the board and key executives and determining remuneration of directors and senior managers andemployee benefit structures.
163
TAXATION
United States Federal Income Taxation
The discussion of US tax matters set forth in this Prospectus was written in connection with the promotion ormarketing of the Global Offering and was not intended or written to be used, and cannot be used, by any taxpayer,for the purpose of avoiding tax-related penalties under US federal, state or local tax law. Each taxpayer should seekadvice based on its particular circumstances from an independent tax advisor.
General
The following summary is a general discussion of certain US federal income tax considerations toUS Holders (as defined below) of acquiring, holding and disposing of Shares. The following summaryapplies only to US Holders that purchase the Shares in the Global Offer and will hold Shares as capitalassets (generally, property held for investment). The following summary is not a complete analysis of allUS federal income tax consequences that may be relevant to a prospective investor’s decision to acquire,hold or dispose of the Shares. In particular, this summary does not address US federal income taxconsequences that apply to prospective investors subject to special tax rules, including, among others,financial institutions, insurance companies, real estate investment trusts, regulated investment companies,dealers or traders in securities or currencies, tax-exempt entities, investors that will hold the Shares as partof an ‘‘integrated’’, ‘‘hedging’’ or ‘‘conversion’’ transaction or as a position in a ‘‘straddle’’ for US federalincome tax purposes, grantor trusts, investors that have a ‘‘functional currency’’ other than the US dollar,investors that will own (directly or by attribution) 10% or more (by voting power) of the Company’s stockand certain US expatriates or investors subject to the alternative minimum tax.
This summary does not discuss the tax consequences of the purchase, ownership or disposition of theShares under the tax laws of any state, locality or non-US jurisdiction. Prospective investors considering aninvestment in the Shares should consult their own tax advisors in determining the US federal, state, local,non-US and any other tax consequences to them of an investment in the Shares and the purchase,ownership and disposition thereof.
The following summary is based on the US Internal Revenue Code of 1986, as amended (the ‘‘Code’’), USTreasury Regulations thereunder, published rulings of the US Internal Revenue Service (the ‘‘IRS’’), andjudicial and administrative interpretations thereof, in each case as in effect and available on the date of thisdocument. Changes to any of the foregoing, or changes in how any of these authorities are interpreted,may affect the tax consequences set out below, possibly retroactively. No ruling will be sought from the IRSwith respect to any statement or conclusion in this discussion, and the Company cannot assure you that theIRS will not challenge such statement or conclusion in the following discussion or, if challenged, a courtwill uphold such statement or conclusion.
For purposes of the following summary, a ‘‘US Holder’’ is a beneficial owner of Shares that is for USfederal income tax purposes: (i) a citizen or resident alien of the United States, (ii) a corporation or otherentity treated as a corporation for US federal income tax purposes created or organised in or under thelaws of the United States or any state thereof or the District of Columbia, (iii) an estate, the income ofwhich is subject to US federal income taxation regardless of its source or (iv) a trust if (x) a court within theUnited States is able to exercise primary supervision over its administration and (y) one or more UnitedStates persons (as defined in the Code) have the authority to control all of the substantial decisions of suchtrust.
If a partnership (including any entity treated as a partnership for US federal income tax purposes) holdsShares, the US federal income tax consequences to the partners of such partnership will depend on theactivities of the partnership and the status of the partners. A partnership considering an investment in theShares should consult its own tax advisors about the consequences to its partners of the acquisition,ownership and disposition of the Shares by the partnership.
Prospective investors should consult their own tax advisors with respect to the US federal, state, local andnon-US tax consequences to them in their particular circumstances of acquiring, holding, and disposing ofShares.
Distributions by the Company
Subject to the discussion under ‘‘—Passive Foreign Investment Company’’ below, generally, the fullamount paid to a US Holder with respect to the Shares will be includible in a US Holder’s ordinary income
164
www.global-reports.com
as a foreign source dividend to the extent of the Company’s current and accumulated earnings and profits(as determined under US federal income tax principles) at the time the US Holder receives (orconstructively receives) such amount in accordance with the US Holder’s usual method of accounting forUS federal income tax purposes.
In the case of a US Holder that is a corporation, a dividend from non-US corporations will generally betaxable at regular corporate rates of up to 35% and generally will not qualify for a dividends-receiveddeduction. In the case of non-corporate US Holders, dividends are generally subject to tax at ordinaryincome rates. Certain dividends received by non-corporate taxpayers through taxable years beginning on orbefore December 31, 2010 may be subject to a reduced maximum tax rate of 15%, if certain requirementsare met. Dividends paid on the Shares will not be eligible for such reduced maximum rates.
Proceeds from the Sale or Other Disposition of the Shares
Subject to the discussion under ‘‘—Passive Foreign Investment Company’’ below, upon the sale or otherdisposition of a Share, a US Holder will generally recognise US source capital gain or loss equal to thedifference, if any, between the amount realised on the sale or other disposition and the US Holder’sadjusted tax basis in the Shares.
Generally, any gain or loss will be long-term capital gain or loss if the Shares have been held for more thana year. In the case of a non-corporate US Holder that has held the Shares for more than one year, any suchgain may be subject to lower rates of tax. The deductibility of capital losses is subject to limitations.
Passive Foreign Investment Company
Based on the information currently available, the Company does not believe it will be classified as a passiveforeign investment company (a ‘‘PFIC’’) for the current year or for the foreseeable future. However,because PFIC status depends upon the composition of a company’s income and assets and the marketvalue of its assets from time to time, the Company cannot assure prospective investors that it will not beconsidered a PFIC for any taxable year. In general, a non-US corporation will be classified as a PFIC if inany taxable year either (i) 75 per cent. or more of its gross income consists of passive income(e.g., dividends, interest and certain rents and royalties) or (ii) 50 per cent. or more of its assets, by value,determined on the basis of a quarterly average, consists of assets that produce, or are held for theproduction of, passive income.
For purposes of the income test and the asset test, if a non-US corporation owns directly or indirectly atleast 25 per cent. (by value) of the stock of another corporation, that non-US corporation will be treated asif it held its proportionate share of the assets of the other corporation and received directly itsproportionate share of the income of that other corporation. Also, for the purposes of the income test andthe asset test, passive income does not include any income that is interest, a dividend or a rent or royalty,which is received or accrued from a related person to the extent that amount is properly allocable to theincome of the related person that is not passive income.
If the Company is classified as a PFIC, a US Holder could be subject to significantly greater amounts ofUS tax than would otherwise apply with respect to (i) any gain on the sale or exchange of the Shares and(ii) certain distributions. The US Holder would also be subject to more burdensome US tax reportingobligations. US Holders should consult their tax advisors concerning the application of the PFIC rules, andalternative tax reporting methods that may be available.
Backup Withholding and Information Reporting Requirements
US Holders may be subject to information reporting on the amounts paid to them, unless they provideproof of an applicable exemption. If a US Holder does not provide this proof of exemption, it may besubject to backup withholding on the amounts paid to it unless the US Holder provides its taxpayeridentification number and otherwise complies with the requirements of the backup withholding rules. Theamount of any backup withholding from a payment to a US Holder will be allowed as a credit against theUS Holder’s US federal income tax liability and may entitle the US Holder to a refund, provided that therequired information is furnished to the IRS.
The discussion of US tax matters set forth in this Prospectus is not intended to constitute a completeanalysis of all US federal income tax consequences to a US Holder of acquiring, holding, and disposing of
165
the Shares. Each US Holder should consult its own tax advisor with respect to the US federal, state, localand non-US consequences of acquiring, holding and disposing of Shares.
Taxation of Holders in the DIFC
No taxes currently apply to our Group or to the holders of the Shares in the DIFC, including dividend tax,capital gains tax, stamp duty or other tax.
As a company domiciled in the DIFC, we are subject to a zero rate of corporate income tax for 50 yearsbeginning from September 13, 2004, including the income tax relating to our business operations in theDIFC. This zero tax rate also applies to transfers of assets, profits or salaries in any currency to any partyoutside the DIFC for 50 years from September 13, 2004.
166
www.global-reports.com
SUBSCRIPTION AND SALE
Description of the Distribution
In connection with the Global Offering, we, the Selling Shareholder, the Joint Global Coordinators andthe Underwriters have entered into an underwriting agreement dated November 21, 2007 (the‘‘Underwriting Agreement’’). Subject to the satisfaction of certain conditions set out in the UnderwritingAgreement, each Underwriter has agreed, severally but not jointly, to procure purchasers for, or failingwhich, to purchase, at the Offer Price, the number of Shares as are set out opposite its name as indicatedbelow. The Selling Shareholder has agreed to make available to the Underwriters, at the Offer Price, thenumber of Shares as are set out opposite ‘‘International Offering’’ as indicated below:
Number ofUnderwriters Shares
Deutsche Bank AG, London Branch(1) . . . . . . . . . . . . . . . . . . . . . . . . . . . . . . . . . . . . 638,858,398Merrill Lynch International(2) . . . . . . . . . . . . . . . . . . . . . . . . . . . . . . . . . . . . . . . . . . 638,858,398Dubai Islamic Bank PJSC(3) . . . . . . . . . . . . . . . . . . . . . . . . . . . . . . . . . . . . . . . . . . . 425,905,599SHUAA Capital psc(4) . . . . . . . . . . . . . . . . . . . . . . . . . . . . . . . . . . . . . . . . . . . . . . . . 425,905,599
International Offering(5) . . . . . . . . . . . . . . . . . . . . . . . . . . . . . . . . . . . . . . . . . . . . . 2,129,527,994UAE Retail Offer . . . . . . . . . . . . . . . . . . . . . . . . . . . . . . . . . . . . . . . . . . . . . . . . . . . 307,692,306Sukuk Allocation . . . . . . . . . . . . . . . . . . . . . . . . . . . . . . . . . . . . . . . . . . . . . . . . . . . 808,079,700
Global Offering . . . . . . . . . . . . . . . . . . . . . . . . . . . . . . . . . . . . . . . . . . . . . . . . . . 3,245,300,000
(1) The offices of Deutsche Bank AG, London Branch, in London are located at Winchester House, 1 Great Winchester Street,London, EC2N 2DB, United Kingdom.
(2) The offices of Merrill Lynch International in London are located at Merrill Lynch Financial Centre, 2 King Edward Street,London, EC1A 1HQ, United Kingdom.
(3) The offices of Dubai Islamic Bank PJSC in Dubai are located at DIB Head Office, near Clock Tower, Deira, P.O. Box 1080,Dubai, UAE.
(4) The offices of SHUAA Capital psc in Dubai are located at Emirates Towers, Level 28, P.O. Box 31045, Dubai, UAE.
(5) Includes the Exempt Offer.
The Offer Price is $1.30 per Share. All of the net proceeds from the sale of the Shares in the GlobalOffering, totalling approximately $3,109.3 million (or approximately $3,699.7 million if the Over-allotmentOption is exercised in full) (in each case, after deduction of commissions), will be for the account of theSelling Shareholder. All of the expenses of the Global Offering will be met by the Selling Shareholder.
The Underwriting Agreement contains, among others, the following further provisions:
� The Selling Shareholder has granted the Stabilisation Manager, on behalf of the severalUnderwriters, the Over-allotment Option pursuant to which the Stabilisation Manager maypurchase up to an additional 462,147,489 Shares at the Offer Price within 30 days from theClosing Date to cover over-allotments, if any, made in connection with the Global Offering andto cover any short positions resulting from stabilisation transactions. If the Stabilisation Managerexercises the Over-allotment Option, the Selling Shareholder will be obligated to sell, and theStabilisation Manager will be obligated, subject to the conditions contained in the UnderwritingAgreement, to purchase additional Shares. In addition, to the extent that the Over-allotmentOption is exercised, up to an additional 110,552,511 Shares will be allocated to, or on behalf of,Sukukholders.
� The Joint Global Coordinators and the Underwriters will deduct from the proceeds of the GlobalOffering and the Over-allotment Option (if any):
(i) costs and expenses incurred by the Joint Global Coordinators and the Underwriters inconnection with the Global Offering; and
(ii) a commission of 1.40%, which includes management, underwriting and selling commissions,payable by the Selling Shareholder, of the amount equal to the Offer Price multiplied by thenumber of Shares sold or allocated in the Global Offering and in connection with theexercise of the Over-allotment Option (to the extent exercised). The commission will beapproximately $59.1 million (or approximately $69.5 million if the Over-allotment Option is
167
exercised in full and the additional 110,552,511 Shares are allocated to, or on behalf of,Sukukholders).
� In addition, incentive fees may be payable to any or all of the Joint Global Coordinators and theUnderwriters in the sole discretion of the Selling Shareholder.
� We have given customary representations and warranties to the Joint Global Coordinators andthe Underwriters in the Underwriting Agreement, including in relation to our businesses, theShares and the contents of this Prospectus. The Selling Shareholder has given certainrepresentations and warranties to the Joint Global Coordinators and the Underwriters, includingin relation to its capacity and title to the Shares.
� We and the Selling Shareholder have given a customary indemnity to the Joint GlobalCoordinators and the Underwriters in connection with the Global Offering.
� If an Underwriter defaults, the Underwriting Agreement provides that, in certain circumstances,the purchase commitment of the non-defaulting Underwriters may be increased or theUnderwriting Agreement may be terminated.
� The Underwriting Agreement provides that the obligations of the Joint Global Coordinators andthe Underwriters are subject to certain conditions precedent that are typical for an agreement ofthis nature. These conditions include, among others, the accuracy of the representations andwarranties and the application for the DIFX Admission having been approved on or prior to theClosing Date. In addition, the Joint Global Coordinators and the Underwriters may terminatethe Underwriting Agreement prior to the Closing Date in certain specified circumstances that aretypical for an agreement of this nature. These include the occurrence of certain material changesin our condition, financial or otherwise, or in our earnings, business affairs or business prospectsand certain changes in financial, political or economic conditions (as more fully set out in theUnderwriting Agreement). If any of the above-mentioned conditions are not satisfied (or waived,where capable of being waived) by, or the Underwriting Agreement is terminated prior to, theClosing Date, then this Global Offering will lapse.
Lock-Up Agreements
We and the Selling Shareholder, which held 100% of the Shares immediately prior to the Global Offering,have agreed, for a period of 180 days after the Closing Date, subject to certain exceptions including thesale of Shares by the Selling Shareholder pursuant to the Over-allotment Option, the loan of Shares by theSelling Shareholder to parties authorised to provide market-making facilities in respect of the Shares onthe DIFX and to facilitate the redemption of the PCFC Development Sukuk in accordance with its terms,and subject as further provided below, not to (A) directly or indirectly, issue, offer, sell, contract to sell, sellor grant any option, right, warrant, or contract to purchase, exercise any option to sell, purchase any optionor contract to sell, or lend or otherwise transfer or dispose of any of our ordinary shares or other shares ofours, (B) enter into any swap, or any other agreement or any transaction that transfers, in whole or in part,directly or indirectly, the economic consequence of ownership of our ordinary shares, in each case, whetherany such transaction is to be settled by delivery of ordinary shares or other securities, in cash or otherwise,or (C) publicly announce such an intention to effect any such transaction, in each case, without the priorwritten consent of the Joint Global Coordinators, such consent not to be unreasonably withheld ordelayed. The restrictions set out above will not prohibit us or the Selling Shareholder from, among otherthings, charging, pledging or otherwise providing any of our ordinary shares as security for anyindebtedness or financing.
Pricing of this Global Offering
Prior to this Global Offering, there has been no public market for the Shares. The Offer Price has beendetermined by negotiations between the Joint Global Coordinators, the Underwriters, the SellingShareholder and us. Among the factors considered in determining the Offer Price following thebookbuilding process were our future prospects and the prospects of our industry in general, our revenue,our net profit and certain other financial operating information with respect to us in recent periods, andthe financial ratios, market prices of securities and certain financial and operating information ofcompanies engaged in activities similar to ours.
This pricing methodology differs significantly from that used in certain other initial public offerings forMiddle Eastern companies, many of which are marketed on a fixed price basis or are priced at nominal
168
www.global-reports.com
value. Consequently, the performance of the price of the Shares in the secondary market is likely to besubstantially different from that in other Middle Eastern initial public offerings.
Price Stabilisation
In order to facilitate the Global Offering, the Stabilisation Manager may engage in transactions thatstabilise, support, maintain or otherwise affect the price of the Shares in accordance with the PriceStabilisation Module of the DFSA Rulebook. Specifically, the Stabilisation Manager, on behalf of theseveral Underwriters, or persons acting on its behalf, may sell more Shares than are required to bepurchased, creating a short position. A short sale is covered if the short position is no greater than thenumber of Shares available for purchase under the Over-allotment Option. The Stabilisation Manager canclose out a covered short sale by exercising the Over-allotment Option on behalf of the severalUnderwriters or purchasing Shares in the open market. The Stabilisation Manager has advised us that indetermining the source of the Shares to close out a covered short sale, the Stabilisation Manager willconsider, among other things, the open market price of the Shares compared to the price available underthe Over-allotment Option.
As an additional means of facilitating the Global Offering, the Stabilisation Manager, or its agent, may bidfor, and purchase, Shares in the open market to stabilise the price of the Shares for a period commencingon the announcement of the Offer Price and ending on the date 30 days after the Closing Date. Suchstabilisation, if commenced, may be discontinued at any time without prior notice.
The Joint Global Coordinators and the Underwriters have advised us that certain of the Joint GlobalCoordinators and the Underwriters (or their affiliated entities) presently intend, following the stabilisationperiod, to trade actively in the Shares as permitted by applicable laws and regulations. Neither the JointGlobal Coordinators nor the Underwriters (nor their affiliated entities) are required to engage in theseactivities, and may end any of these activities at any time. Accordingly, no assurance can be given as to theliquidity of, or trading markets for, the Shares. Buyers of the Shares may be required to pay stamp taxesand other charges in accordance with the laws and practices of the country of purchase in addition to theOffer Price.
Allocation
The Global Offering comprises the International Offering (including the Exempt Offer), the UAE RetailOffer and the Sukuk Allocation. The allocation of Shares among the International Offering (including theExempt Offer) and the UAE Retail Offer was determined by the Joint Global Coordinators, the SellingShareholder and us. The number of Shares to be allocated pursuant to the Sukuk Allocation wasdetermined pursuant to the terms of the PCFC Development Sukuk. See ‘‘Description of the PCFCDevelopment FZCO Sukuk’’ for more information.
As part of the UAE Retail Offer, a number of Shares to be determined by the Joint Global Coordinators,the Selling Shareholder and us are being offered as a part of a preferential allocation to our employees andemployees of Dubai World.
Factors that may be taken into account by the Joint Global Coordinators, the Selling Shareholder and uswhen determining the allocations between prospective investors in the event of over-subscription mayinclude participation in the marketing process for the Global Offering, holding behaviour in previousofferings, holdings in similar companies, pre-funding of indication of interest and other factors that we, theJoint Global Coordinators and the Selling Shareholder may deem relevant.
Conditional and Unconditional Dealings
There will be no conditional dealings in the Shares prior to the DIFX Admission
It is expected that the DIFX Admission will become effective and that dealings in the Shares willcommence on the DIFX on or about the Closing Date.
Relationship between the Company, our controlling shareholder, the Joint Global Coordinators and theUnderwriters in the Global Offering
Our controlling shareholder, Dubai World, is owned by the Government of Dubai. Millennium FinanceCorporation Ltd., one of the Joint Global Coordinators, is majority owned by the Dubai Islamic BankPJSC, a UAE incorporated public joint stock company partly owned by the Government of Dubai, and one
169
of the Underwriters. Any references in this Prospectus to an ‘‘affiliate’’ of the Company or the SellingShareholder shall be deemed to include neither Millennium Finance Corporation Ltd. nor Dubai IslamicBank PJSC.
The Joint Global Coordinators and the Underwriters and their respective affiliates have, from time totime, performed, and may in the future perform, various financial advisory, investment and commercialbanking and other services for us or for our affiliates or shareholders, for which they received or willreceive fees and expenses. Deutsche Bank AG, London Branch, one of the Joint Global Coordinators andUnderwriters, served as a mandated lead arranger for the Syndicated Loan Facility and Deutsche BankLuxembourg S.A., an affiliate of Deutsche Bank AG, London Branch, serves as facility agent for theSyndicated Loan Facility. In addition, each of Deutsche Bank AG, London Branch, SHUAA Capital pscand Dubai Islamic Bank PJSC and/or their respective affiliates held, as of November 19, 2007, thefollowing approximate interests in the PCFC Development Sukuk: $8 million, $4 million and $500 million,respectively. Consequently, they may receive Shares and a portion of the proceeds from the GlobalOffering in connection with the Sukuk Allocation and redemption of the PCFC Development Sukuk inaccordance with its terms following the Global Offering.
Selling Restrictions
United States
The Shares have not been and will not be registered under the Securities Act, and may not be offered orsold within the United States, except pursuant to an exemption from the registration requirements of theSecurities Act.
The Shares will be offered (1) to investors outside the United States in accordance with Regulation S and(2) through the US selling agents of certain of the Underwriters, only to QIBs in the United States inaccordance with Rule 144A.
Public Offer Selling Restriction Under the Prospectus Directive
In relation to each Member State of the EEA which has implemented the Prospectus Directive (each, a‘‘Relevant Member State’’), with effect from and including the date on which the Prospectus Directive isimplemented in that Relevant Member State (the ‘‘Relevant Implementation Date’’), an offer of Shareshas not been made and will not be made to the public in that Relevant Member State prior to thepublication of a prospectus in relation to the Shares which has been approved by the competent authorityin that Relevant Member State or, where appropriate, approved in another Relevant Member State andnotified to the competent authority in that Relevant Member State, all in accordance with the ProspectusDirective, except that, with effect from and including the Relevant Implementation Date, an offer ofShares may be made to the public in that Relevant Member State at any time:
� to legal entities which are authorised or regulated to operate in the financial markets or, if not soauthorised or regulated, whose corporate purpose is solely to invest in securities;
� to any legal entity which has two or more of (1) an average of at least 250 employees during thelast financial year; (2) a total balance sheet of more than A43,000,000 and (3) an annual netturnover of more than A50,000,000, as shown in its last annual or consolidated accounts;
� to fewer than 100 natural or legal persons (other than qualified investors as defined in theProspectus Directive) subject to obtaining the prior consent of the Underwriters for any suchoffer; or
� in any other circumstances falling within Article 3(2) of the Prospectus Directive,
in each case provided that no such offer of Shares shall result in a requirement for the publication of aprospectus pursuant to Article 3 of the Prospectus Directive and each person who initially acquires anyShares to whom any offer is made under the Global Offering will be deemed to have represented,acknowledged and agreed that it is a ‘‘qualified investor’’ within the meaning of Article 2(1)(e) of theProspectus Directive.
For the purposes of this provision, the expression an ‘‘offer of any Shares to the public’’ in relation to anyShares in any Relevant Member State means the communication in any form and by any means ofsufficient information on the terms of the offer of any Shares to be offered so as to enable an investor todecide to purchase any Shares, as the same may be varied in that Relevant Member State by any measure
170
www.global-reports.com
implementing the Prospectus Directive in that Relevant Member State and the expression ‘‘ProspectusDirective’’ means Directive 2003/71/EC and includes any relevant implementing measure in each RelevantMember State.
In the case of any Shares being offered to a financial intermediary as that term is used in Article 3(2) of theProspectus Directive, such financial intermediary will also be deemed to have represented, acknowledgedand agreed that the Shares acquired by it in the Global Offering have not been acquired on anon-discretionary basis on behalf of, nor have they been acquired with a view to their offer or resale to,persons in circumstances which may give rise to an offer of any Shares to the public other than their offeror resale in a Relevant Member State to qualified investors as so defined or in circumstances in which theprior consent of the Underwriters has been obtained to each such proposed offer or resale. We, the SellingShareholders, the Joint Global Coordinators and the Underwriters and our and their affiliates, and otherswill rely upon the truth and accuracy of the foregoing representation, acknowledgement and agreement.Notwithstanding the above, a person who is not a qualified investor may, with the consent of theUnderwriters, be permitted to purchase Shares in the Global Offering.
Selling Restrictions Addressing Additional United Kingdom Securities Laws
No invitation or inducement to engage in investment activity (within the meaning of section 21 of theFinancial Services and Markets Act 2000 (the ‘‘FSMA’’)) in connection with the issue or sale of any Sharesmay be communicated or caused to be communicated except in circumstances in which section 21(1) of theFSMA does not apply to the Company. In addition, all applicable provisions of the FSMA must becomplied with with respect to anything done in relation to the Shares in, from or otherwise involving theUnited Kingdom.
Japan
The Shares offered hereby have not and will not be registered under the Financial Instruments andExchange Law (the ‘‘Financial Instruments and Exchange Law’’). Accordingly, in connection with theGlobal Offering, no Shares will be offered or sold, directly or indirectly, in Japan or to or for the benefit of,any resident of Japan (which term as used herein means any person resident in Japan, including anycorporation or other entity organised under the law of Japan) or to others for re-offering or re-sale,directly or indirectly, in Japan or to, or for the benefit of, any resident of Japan, except pursuant to anexemption from the registration requirements of, and otherwise in compliance with, the FinancialInstruments and Exchange Law and other relevant laws and regulations of Japan.
Singapore
This prospectus has not been registered as a prospectus with the Monetary Authority of Singapore.Accordingly, no Shares have been or will be offered or sold or caused to be made the subject of aninvitation for purchase, and this Prospectus has not been and will not be circulated or distributed, nor willany other document or material in connection with the offer or sale, or invitation for purchase, of suchShares be circulated or distributed, whether directly or indirectly, to persons in Singapore other than (i) toan institutional investor under Section 274 of the Securities and Futures Act, Chapter 289 of Singapore(the ‘‘SFA’’), (ii) to a relevant person pursuant to Section 275(1), or any person pursuant toSection 275(1A), and in accordance with the conditions specified in Section 275, of the SFA or(iii) otherwise pursuant to, and in accordance with the conditions of, any other applicable provision of theSFA.
Where Shares are purchased under Section 275 of the SFA by a relevant person which is:
(a) a corporation (which is not an accredited investor (as defined in Section 4A of the SFA)) the solebusiness of which is to hold investments and the entire share capital of which is owned by one or moreindividuals, each of whom is an accredited investor; or
(b) a trust (where the trustee is not an accredited investor) whose sole purpose is to hold investments andeach beneficiary of the trust is an individual who is an accredited investor,
171
shares, debentures and units of shares and debentures of that corporation or the beneficiaries’ rights andinterest (howsoever described) in that trust shall not be transferred within six months after thatcorporation or that trust has acquired the Shares pursuant to an offer made under Section 275 except:
(1) to an institutional investor (for corporations, under Section 274 of the SFA) or to a relevant persondefined in Section 275(2) of the SFA, or to any person pursuant to an offer that is made on terms thatsuch shares, debentures and units of shares and debentures of that corporation or such rights andinterest in that trust are acquired at a consideration of not less than S$200,000 (or its equivalent in aforeign currency) for each transaction, whether such amount is to be paid for in cash or by exchangeof securities or other assets, and further for corporations, in accordance with the conditions specifiedin Section 275 of the SFA;
(2) where no consideration is or will be given for the transfer; or
(3) where the transfer is by operation of law.
Hong Kong
Shares may not be offered or sold in Hong Kong, by means of any document, other than (a) to‘‘professional investors’’ as defined in the Securities and Futures Ordinance (Cap. 571) of Hong Kong andany rules made under that Ordinance; or (b) in other circumstances which do not result in the documentbeing a ‘‘prospectus’’ as defined in the Companies Ordinance (Cap. 32) of Hong Kong or which do notconstitute an offer to the public within the meaning of that Ordinance. In addition, no advertisement,invitation or document relating to the Shares, which is directed at, or the contents of which are likely to beaccessed or read by, the public of Hong Kong (except if permitted to do so under the securities laws ofHong Kong) other than with respect to Shares which are or are intended to be disposed of only to personsoutside Hong Kong or only to ‘‘professional investors’’ as defined in the Securities and Futures Ordinanceand any rules made under that Ordinance may be issued, possessed or possessed for the purposes of issue.
Australia
This Prospectus has not been lodged with the Australian Securities and Investments Commission as adisclosure document under Chapter 6D of the Corporations Act 2001 (Cwth) (the ‘‘AustralianCorporations Act’’).
The Shares may not be offered or sold and neither this Prospectus nor any other document or material inconnection with the offer, sale, or invitation to purchase of any Shares may be distributed or circulated,whether directly or indirectly, to persons in the Commonwealth of Australia other than to:
� investors falling within section 708(11) of the Australian Corporations Act; or
� investors falling within section 708(8) of the Australian Corporations Act.
DIFC
The Shares may not be, are not and will not be sold, subscribed for, transferred or delivered, directly orindirectly, to any person in the DIFC who is not a client within the meaning of the Conduct of BusinessModule of the Rules of the DFSA or a qualified investor within the meaning of the Offered SecuritiesRules of the DFSA.
UAE
The Shares may not be, have not been and are not being sold, subscribed for, transferred or delivered inthe UAE other than in compliance with the laws of the UAE governing the sale, subscription for, transferand delivery of securities.
Kingdom of Bahrain
This Prospectus has not been reviewed by the Central Bank of Bahrain. This Prospectus may not becirculated within the Kingdom of Bahrain nor may any of the Shares be offered for subscription or sold,directly or indirectly, nor may any invitation or offer to subscribe for any Shares be made to persons in theKingdom of Bahrain. The CBB is not responsible for our performance.
172
www.global-reports.com
Kingdom of Saudi Arabia
No action has been or will be taken in the Kingdom of Saudi Arabia that would permit a public offering orprivate placement of our Shares in the Kingdom of Saudi Arabia, or possession or distribution of anyoffering materials in the Kingdom of Saudi Arabia in relation thereto.
The Shares may only be offered and sold in the Kingdom of Saudi Arabia in accordance with Part 5(Exempt Offers) of the Offers of Securities Regulations dated 20/8/1425 H (corresponding to 4/10/2004)(as amended) (the ‘‘Regulations’’) and, in accordance with Article 16(a)(3) of the Regulations, the Shareswill be offered to no more than 60 offerees in the Kingdom of Saudi Arabia with each such offeree payingan amount not less than Saudi Riyals one million or its equivalent.
Prospective investors are informed that Article 19 of the Regulations places restrictions on secondarymarket activity with respect to the Shares.
Any resale or other transfer, or attempted resale or other transfer, made other than in compliance with theabove stated restrictions shall not be recognised by us.
State of Qatar
This Prospectus has not been filed with, reviewed or approved by Qatari Central Bank, the Doha SecuritiesMarket or any other relevant Qatar regulatory body. No general offering of the Shares has been or will bemade in Qatar and the Shares may only be offered, distributed or sold in Qatar to a limited number ofinvestors.
General
The Shares may not be offered or sold, directly or indirectly, nor may this Prospectus or any other offeringmaterial or advertisement in connection with the Shares be distributed or published, in or from anycountry or jurisdiction except under circumstances that will result in compliance with any applicable rulesand regulations of any such country or jurisdiction.
No dealer, salesperson or other person has been authorised to give any information or to make anyrepresentation not contained in this Prospectus, and, if given or made, such information or representationmust not be relied upon as having been authorised by us or any of the Joint Global Coordinators orUnderwriters. This Prospectus does not constitute an offer to sell or the solicitation of an offer to buy anysecurities other than the securities to which it relates or an offer to sell or the solicitation of an offer to buysuch securities in any circumstances in which such offer or solicitation is unlawful. Neither the delivery ofthis Prospectus nor any sale made hereunder shall, under any circumstances, create any implication thatthere has been no change in our affairs since the date hereof or that the information contained in thisProspectus is correct as of a date after its date.
173
TRANSFER RESTRICTIONS
As a result of the following restrictions, purchasers are advised to contact legal counsel prior to making any offerfor, resale, pledge or transfer of the Shares.
United States
The Shares offered hereby are being offered in accordance with Rule 144A and Regulation S under theSecurities Act. Terms used in this section that are defined in Rule 144A or Regulation S, as applicable,under the Securities Act are used herein as defined therein. The Shares have not been and will not beregistered under the Securities Act or with any securities regulatory authority of any state or otherjurisdiction within the United States and accordingly may not be offered or sold in the United Statesexcept pursuant to an exemption from, or a transaction not subject to, the registration requirements of theSecurities Act and applicable state securities laws.
Rule 144A
Each purchaser of the Shares within the United States pursuant to Rule 144A, by its acceptance of deliveryof this Prospectus and the Shares will be deemed to have represented, agreed and acknowledged asfollows:
� The purchaser (i) is a QIB, (ii) is aware, and each beneficial owner of such Shares has been advised,that the sale to it is being made in reliance on Rule 144A and (iii) is acquiring such Shares for itsown account or for the account of a QIB.
� The purchaser is aware that such Shares are subject to significant restrictions on transfer and havenot been and will not be registered under the Securities Act or with any securities regulatoryauthority of any state or other jurisdiction within the United States and are being offered in theUnited States in reliance on Rule 144A only in a transaction not involving any public offering in theUnited States within the meaning of the Securities Act.
� The purchaser agrees (or if the purchaser is acting for the account of another person, such personhas confirmed to the purchaser that such person agrees) that it (or such person) will not offer,resell, pledge or otherwise transfer such Shares except: (a) in accordance with Rule 144A to aperson that it, and any other person acting on its behalf, reasonably believes is a QIB purchasing forits own account or the account of a QIB, (b) in an ‘‘offshore transaction’’ in accordance withRule 903 or 904 of Regulation S or (c) in accordance with Rule 144 under the Securities Act (ifavailable), in each case, in accordance with any applicable securities laws of any state within theUnited States. The purchaser will, and each subsequent holder is required to, notify any subsequentpurchasers of such Shares of the resale restrictions described in this Prospectus.
� If in the future the purchaser decides to offer, resell, pledge or otherwise transfer such Shares, suchShares may be offered, sold, pledged or otherwise transferred only in accordance with the followinglegend:
THE ORDINARY SHARES OF DP WORLD LIMITED REPRESENTED HEREBY (THE‘‘SHARES’’) HAVE NOT BEEN AND WILL NOT BE REGISTERED UNDER THE UNITEDSTATES SECURITIES ACT OF 1933, AS AMENDED (THE ‘‘SECURITIES ACT’’), OR WITH ANYSECURITIES REGULATORY AUTHORITY OF ANY STATE OR OTHER JURISDICTION OFTHE UNITED STATES AND MAY NOT BE OFFERED, SOLD, PLEDGED OR OTHERWISETRANSFERRED EXCEPT (1) TO A PERSON WHOM THE SELLER AND ANY PERSON ACTINGON ITS BEHALF REASONABLY BELIEVE IS A QUALIFIED INSTITUTIONAL BUYER (‘‘QIB’’)(WITHIN THE MEANING OF RULE 144A UNDER THE SECURITIES ACT) IN ATRANSACTION MEETING THE REQUIREMENTS OF RULE 144A PURCHASING FOR ITSOWN ACCOUNT OR THE ACCOUNT OF A QIB, (2) IN AN OFFSHORE TRANSACTION INACCORDANCE WITH RULE 903 OR RULE 904 OF REGULATION S UNDER THE SECURITIESACT OR (3) PURSUANT TO AN EXEMPTION FROM REGISTRATION PROVIDED BYRULE 144 UNDER THE SECURITIES ACT (IF AVAILABLE), IN EACH CASE, IN ACCORDANCEWITH ANY APPLICABLE SECURITIES LAWS OF ANY STATE OR OTHER JURISDICTION OFTHE UNITED STATES. THE HOLDER HEREOF WILL, AND EACH SUBSEQUENT HOLDER ISREQUIRED TO, NOTIFY ANY SUBSEQUENT PURCHASER OF SUCH SHARES OF THERESALE RESTRICTIONS REFERRED TO ABOVE. NO REPRESENTATION CAN BE MADE AS
174
www.global-reports.com
TO THE AVAILABILITY OF THE EXEMPTION PROVIDED BY RULE 144 UNDER THESECURITIES ACT FOR RESALE OF THE SHARES.
� Prospective purchasers are hereby notified that sellers of the Shares may be relying on theexemption from the provisions of Section 5 of the Securities Act provided by Rule 144A.
The purchaser acknowledges that the Company, the Selling Shareholder, the Joint Global Coordinatorsand the Underwriters and their respective affiliates will rely upon the truth and accuracy of theacknowledgements, representations and agreements in the foregoing paragraphs. If it is acquiring Sharesfor the account of one or more QIBs, it represents that it has sole investment discretion with respect toeach such account and that it has full power to make the foregoing acknowledgements, representations andagreements on behalf of each such account.
Regulation S
Each purchaser of the Shares outside of the United States pursuant to Regulation S, by its acceptance ofdelivery of this Prospectus and the Shares, will be deemed to have represented, agreed and acknowledgedas follows:
� The purchaser is, or at the time the Shares were purchased will be, the beneficial owner of suchShares and (i) is, and the person, if any, for whose account it is acquiring the Shares is, outside theUnited States, (ii) is not an affiliate of the company or a person acting on behalf of such an affiliateand (iii) is not in the business of buying or selling securities or, if it is in such business, it did notacquire such Shares from the company or an affiliate thereof in the initial distribution of suchShares.
� The purchaser (i) is aware that such Shares (a) have not been and will not be registered under theSecurities Act or with any securities regulatory authority of any state or other jurisdiction within theUnited States and (b) are being sold in accordance with Rule 903 or 904 of Regulation S and (ii) ispurchasing such Shares in an ‘‘offshore transaction’’ meeting the requirements of Regulation S.
� That the Company, the Selling Shareholder, the Joint Global Coordinators and the Underwritersand their respective affiliates will rely upon the truth and accuracy of the acknowledgements,representations and agreements in the foregoing paragraphs.
175

LEGAL MATTERS
Certain matters governed by UAE law, DIFC law, US law and English law will be passed on for theCompany by Clifford Chance LLP, UAE, DIFC, US and English counsel to the Company. Certain mattersgoverned by UAE law will be passed on for the Company by Al Tamimi & Company, special UAE counselto the Company.
Certain matters governed by DIFC law, US law and English law will be passed on for the Joint GlobalCoordinators and the Underwriters by Linklaters LLP, DIFC, US and English counsel to the Joint GlobalCoordinators and the Underwriters.
176
www.global-reports.com
INDEPENDENT AUDITORS
The condensed consolidated interim financial statements of DP World Limited and its subsidiaries as ofJune 30, 2007, and for the six months then ended, included in this Prospectus, have been reviewed byKPMG LLP, independent auditors, as stated in their review report appearing herein. The registered officeof KPMG LLP is at P.O. Box 3800, Level 32, Emirates Towers, Sheikh Zayed Road, Dubai, UAE.
The consolidated interim condensed financial statements of Dubai Ports Authority and its subsidiaries asof June 30, 2005 and 2006, and for the six months then ended, included in this Prospectus, have beenreviewed by Ernst & Young, independent auditors, as stated in their review report appearing herein. Theregistered office of Ernst & Young is at P.O. Box 9267, 28th Floor, Al Attar Business Tower, Dubai, UAE.
The consolidated financial statements of Dubai Ports Authority and its subsidiaries as of December 31,2004, 2005 and 2006, and for the years then ended, included in this Prospectus have been audited byErnst & Young, independent auditors, as stated in their audit reports appearing herein. The registeredoffice of Ernst & Young is at P.O. Box 9267, 28th Floor, Al Attar Business Tower, Dubai, UAE.
The consolidated financial statements of the Peninsular and Oriental Steam Navigation Company as ofDecember 31, 2005 and for the year then ended, included in this Prospectus, have been audited by KPMGAudit Plc, independent auditors and members of the Institute of Chartered Accountants in England andWales, as stated in their audit reports appearing herein. The registered office of KMPG Audit Plc is at8 Salisbury Square, London EC4Y 8BB, United Kingdom.
177
SUMMARY OF CERTAIN DIFFERENCES BETWEEN IFRS AND US GAAP
Our consolidated financial statements have been prepared in accordance with IFRS. There are a numberof differences between IFRS and US generally accepted accounting procedures (‘‘US GAAP’’) (hereafterreferred to as ‘‘GAAP differences’’).
The discussion below primarily focuses on GAAP differences in recognition and measurementrequirements affecting our balance sheet and income statement. Consequently, this summary does notdescribe differences related to the statement of cash flows, statement of recognised income and expenses,and presentation and disclosure requirements.
For purposes of this summary, the GAAP differences described are differences that existed during 2006.IFRS and US GAAP have moved towards convergence in recent years. Accordingly, additional GAAPdifferences that existed prior to 2006 are not described below. Also, as accounting rules are furtherdeveloped or changed over time, additional GAAP differences may arise in the future.
Accordingly, no assurance is provided that the following summary of GAAP differences is complete.Potential investors should consult their own professional advisers for an understanding of the GAAPdifferences and how those differences might affect the financial information included in this Prospectus.
Impairment of assets
Under IFRS, when there is an indication of impairment, a detailed calculation must be performed. If anasset’s carrying value exceeds the higher of the asset’s value-in-use (discounted present value of the asset’sexpected future cash flows) and net selling price (after deducting selling costs), an impairment loss shouldbe recognised. Subsequent reversal of previously recognised impairment losses is required if certaincriteria are met.
Under US GAAP, where impairment is indicated, a detailed calculation also must be performed. If anasset’s carrying value exceeds the expected future cash flows to be derived from the asset on anundiscounted basis then the measurement of an impairment loss is based on fair value. Subsequentreversal of previously recognised impairment losses is prohibited under US GAAP.
Goodwill
Under IFRS, goodwill is not amortised but is tested for impairment annually or more frequently if eventsor circumstances indicate that the asset might be impaired. The impairment testing is performed in aone-step test by comparing the carrying value of the cash-generating unit including goodwill with itsrecoverable amount. If the carrying value of the cash-generating unit exceeds the recoverable amount animpairment loss is recognised.
Under US GAAP, goodwill is not amortised but is tested for impairment annually or more frequently ifevents or circumstances indicate that the asset might be impaired. The impairment testing is performed ina two-step test. In the first step, the fair value of the reporting unit is compared to the carrying value of thereporting unit including goodwill. If the carrying value of the reporting unit exceeds the fair value of thereporting unit, then the second step must be performed requiring the impairment to be measured, andrecorded, as the excess of recorded goodwill over the implied fair value of goodwill. The implied fair valueof goodwill is calculated as the excess of the fair value of the reporting unit over the amount allocated tothe assets and liabilities of the reporting unit.
178
www.global-reports.com
LISTING AND GENERAL INFORMATION
1. We are incorporated under the Companies Law under the name DP World Limited as a companylimited by shares in the DIFC with Registration Number 0226. Our registered office is PO Box 17000,Dubai, UAE and our telephone number is +971 4 881 1110. Our website address is www.dpworld.com.The content of our website is not incorporated into, and does not form part of, this Prospectus.
2. The Shares are in registered, book-entry form.
3. Each Share has a nominal value of $0.10. The Shares are governed by the laws of the DIFC.Purchasers of Shares will not be required to pay any expenses incurred in connection with the GlobalOffering.
4. Save as otherwise disclosed in this Prospectus, there has been no significant change in our financial ortrading position since June 30, 2007, the date of publication of our latest interim accounts.
5. The following contracts (not being contracts entered into in the ordinary course of business) havebeen entered into by a member of the Group within the two years immediately preceding the date ofthis Prospectus and are, or may be, material or have been entered into at any time by any member ofthe Group and contain provisions under which any member of the Group has an obligation orentitlement which is, or may be, material to the Group as at the date of this Prospectus:
5.1 Underwriting Agreement
For information on the Underwriting Agreement, see ‘‘Subscription and Sale—Description of theDistribution’’.
5.2 Concession Agreement
For information on the Concession Agreement, see ‘‘Related Party Transactions—Relationshipwith Dubai World and the Government of Dubai—Ongoing Relationship—ConcessionAgreement’’.
5.3 Amended and Restated Credit Facility
For information on the Amended and Restated Credit Facility, see ‘‘Management Discussion andAnalysis of Financial Condition and Results of Operations—Liquidity and Capital Resources—Working Capital and Indebtedness—Syndicated Term Loan and Revolving Credit Facility’’.
5.4 Revolving Credit Syndicated Facility
For information on the Syndicated Loan Facility, see ‘‘Management Discussion and Analysis ofFinancial Condition and Results of Operations—Liquidity and Capital Resources—WorkingCapital and Indebtedness—Revolving Credit Syndicated Facility’’.
5.5 Senior Notes
For information on the Senior Notes, see ‘‘Management Discussion and Analysis of FinancialCondition and Results of Operations—Liquidity and Capital Resources—Working Capital andIndebtedness—6.85 per cent. Notes due 2037’’.
5.6 Certificates
For information on the Certificates, see ‘‘Management Discussion and Analysis of FinancialCondition and Results of Operations—Liquidity and Capital Resources—Working Capital andIndebtedness—Trust Certificates (Sukuk Al-Mudaraba) due 2017’’.
6. Within the period of five years preceding the date of this Prospectus, none of the Directors or any ofthe Senior Managers:
6.1 has had any convictions in relation to fraudulent offences; nor
6.2 has held an executive function in the form of a senior manager or a member of theadministrative, management or supervisory bodies, of any company or partnership at the time ofany bankruptcy, receivership or liquidation of such company or partnership; nor
6.3 has been subject to any official public incrimination and/or sanction by any statutory or regulatoryauthority (including any designated professional body) nor has been disqualified by a court from
179
acting as a member of the administrative, management or supervisory bodies of an entity or fromacting in the management or conduct of the affairs of any entity.
7. None of the Directors nor any of the Senior Managers has any potential conflicts of interests betweentheir duties to the Company and their private interests or other duties.
8. The following table presents our significant subsidiaries, associates and affiliates and their countries ofincorporation, as at the date of this Prospectus:
Company’sownership Country of
Name interest incorporation Principal activities
Subsidiaries:
DP World FZE 100% United Arab Management and operation of SeaportsEmirates and airports and leasing of port
equipment
Peninsular and Oriental Steam 100% United Kingdom Management and operations ofNavigation Company Limited Seaports, running ferries and real estate
investment, development andmanagement
Thunder FZE 100% United Arab Holding CompanyEmirates
DP World UAE Region FZE 100% United Arab Terminal OperationsEmirates
CSX World Crane Services (Shanghai) 100% People’s Republic Technical Support, Services andLimited of China Consulting to Crane Manufacturers
DPI Crane Services UK Limited 100% United Kingdom Investment Holding Company
DPI Terminals (Bermuda) Limited 100% Bermuda Holding Company
DPI Terminals (Europe) Limited 100% United Kingdom Holding Company
DP World Germersheim 100% Germany Holding CompanyBeteiligungs, GmbH
DP World Germersheim, GmbH 100% Germany Terminal and Barge Managementand Co. KG (Operator)
CSX World Terminals Hong Kong 66.66% Hong Kong Terminal Operator (Construction,Limited Maintenance, Warehousing)
DPI Terminals Latin Holdings Limited 100% Bermuda Holding Company
CSX World Terminals South African 100% Republic of South Holding Company(Proprietary) Limited Africa
DP World Zurich I LLC 100% Delaware, USA Holding Company
DP World Asia Limited 100% Hong Kong Investment Holding Company
DP World Zurich II LLC 100% Delaware, USA Holding Company
DP World China (Yantai) Limited 100% Cayman Islands Holding Company
DPI Terminals (Latin America) 100% British Virgin Management CompanyManagement Ltd. Islands
DP World 8 Limited 66.66% British Virgin Investment Holding CompanyIslands
DP World Adelaide PTY Ltd. 100% Australia Terminal Operations
DPI Terminals Asia (BVI) Ltd. 100% British Virgin Holding CompanyIslands
DPI Terminals Asia Holdings Ltd. 100% British Virgin Holding CompanyIslands
DP World Australia Pty. Ltd 100% Australia Holding Company
DPI Terminals (BVI) Limited 100% British Virgin Holding CompanyIslands
DPI Terminals Dominicana Limited 70% British Virgin Holding CompanyIslands
DP World Germesheim B.V. 100% The Netherlands Terminal and Barge Operator
DPI Terminals Holding C.V. 100% The Netherlands Holding Company
180
www.global-reports.com
Company’sownership Country of
Name interest incorporation Principal activities
Subsidiaries (Continued):
DP World International B.V. 100% The Netherlands Holding Company
DP World Management B.V. 100% The Netherlands Management Company
DPI Terminals Management 100% People’s Republic Management CompanyConsultation (Shanghai) Co. Ltd of China
Dubai International Djibouti FZE 100% UAE Terminal Operator
Greenstone Overseas, Inc. 100% British Virgin Holding CompanyIslands
India Gateway Terminal Pvt. Ltd 76% Cochin, India Terminal Operator
Kingsfund Limited 100% Hong Kong Investment Holding Company
Linerbulk Shipping Pty Limited 100% Australia Investment Holding Company
Network Financing, B.V. 100% The Netherlands Holding and Finance Company
Pacific Container Limited 66.66% British Virgin Holding CompanyIslands
Pacific Owner Limited 66.66% British Virgin Investment Holding CompanyIslands
DP World Switzerland LLC 100% Delaware, USA Holding Company
Yarimca Porselen Sanayi Ve Ticaret A.S 100% Turkey Terminal Operator
Constanta South Container 100% Romania Terminal OperatorTerminal SRL
DP World Infrastructure Ltd 100% Hong Kong Holding Company
DP World Financial Management Inc. 100% Delaware, USA Holding Company
DP World China Investments Ltd 100% British Virgin Holding CompanyIslands
DP World Luxembourg S.A.R.L. 100% Luxembourg Holding Company
DP World Crane Services LLC 100% Delaware, USA Crane Maintenance and Repair
DP World Crane Services 100% Delaware, USA Holding CompanyInternational LLC
DP World China Holdings Ltd 100% Hong Kong Holding Company
Rail Rhine BV 100% The Netherlands Holding Company (Dormant)
DP World LLC 100% Delaware, USA Holding Company
CSX World Crane Services 100% Mauritius Holding CompanyInternational Mauritius Ltd
Dubai Ports International UK Ltd 100% United Kingdom Terminal Management Service Provider
Orange Blossom Investment Co. Ltd. 100% British Virgin Holding CompanyIslands
SL Service, Inc. 100% Delaware, USA Containerized Transportation Company
Container Terminals Australia Ltd. 90.4% Australia Container terminal operations
Mundra International Container 100% India Container Terminal OperationsTerminal Limited
Nhava Sheva International Container 100% India Container Terminal OperationsTerminal Private Ltd.
P&O Australia Potts Pty Ltd. 100% Australia Holding Company
P&O Maritime Services Pty Ltd. 100% Australia Off shore services, ships agency andchartering
P&O Polar Australia Pty Ltd. 100% Australia Antarctic research and resupply services
181
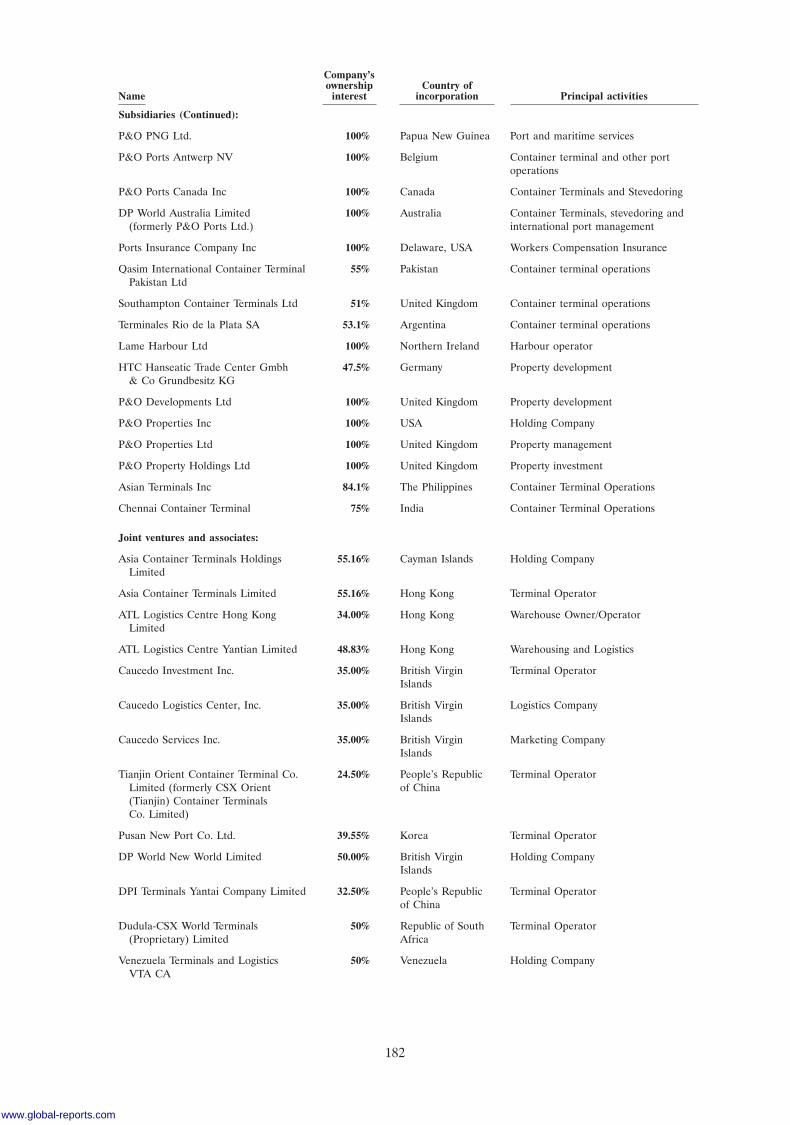
Company’sownership Country of
Name interest incorporation Principal activities
Subsidiaries (Continued):
P&O PNG Ltd. 100% Papua New Guinea Port and maritime services
P&O Ports Antwerp NV 100% Belgium Container terminal and other portoperations
P&O Ports Canada Inc 100% Canada Container Terminals and Stevedoring
DP World Australia Limited 100% Australia Container Terminals, stevedoring and(formerly P&O Ports Ltd.) international port management
Ports Insurance Company Inc 100% Delaware, USA Workers Compensation Insurance
Qasim International Container Terminal 55% Pakistan Container terminal operationsPakistan Ltd
Southampton Container Terminals Ltd 51% United Kingdom Container terminal operations
Terminales Rio de la Plata SA 53.1% Argentina Container terminal operations
Lame Harbour Ltd 100% Northern Ireland Harbour operator
HTC Hanseatic Trade Center Gmbh 47.5% Germany Property development& Co Grundbesitz KG
P&O Developments Ltd 100% United Kingdom Property development
P&O Properties Inc 100% USA Holding Company
P&O Properties Ltd 100% United Kingdom Property management
P&O Property Holdings Ltd 100% United Kingdom Property investment
Asian Terminals Inc 84.1% The Philippines Container Terminal Operations
Chennai Container Terminal 75% India Container Terminal Operations
Joint ventures and associates:
Asia Container Terminals Holdings 55.16% Cayman Islands Holding CompanyLimited
Asia Container Terminals Limited 55.16% Hong Kong Terminal Operator
ATL Logistics Centre Hong Kong 34.00% Hong Kong Warehouse Owner/OperatorLimited
ATL Logistics Centre Yantian Limited 48.83% Hong Kong Warehousing and Logistics
Caucedo Investment Inc. 35.00% British Virgin Terminal OperatorIslands
Caucedo Logistics Center, Inc. 35.00% British Virgin Logistics CompanyIslands
Caucedo Services Inc. 35.00% British Virgin Marketing CompanyIslands
Tianjin Orient Container Terminal Co. 24.50% People’s Republic Terminal OperatorLimited (formerly CSX Orient of China(Tianjin) Container TerminalsCo. Limited)
Pusan New Port Co. Ltd. 39.55% Korea Terminal Operator
DP World New World Limited 50.00% British Virgin Holding CompanyIslands
DPI Terminals Yantai Company Limited 32.50% People’s Republic Terminal Operatorof China
Dudula-CSX World Terminals 50% Republic of South Terminal Operator(Proprietary) Limited Africa
Venezuela Terminals and Logistics 50% Venezuela Holding CompanyVTA CA
182
www.global-reports.com
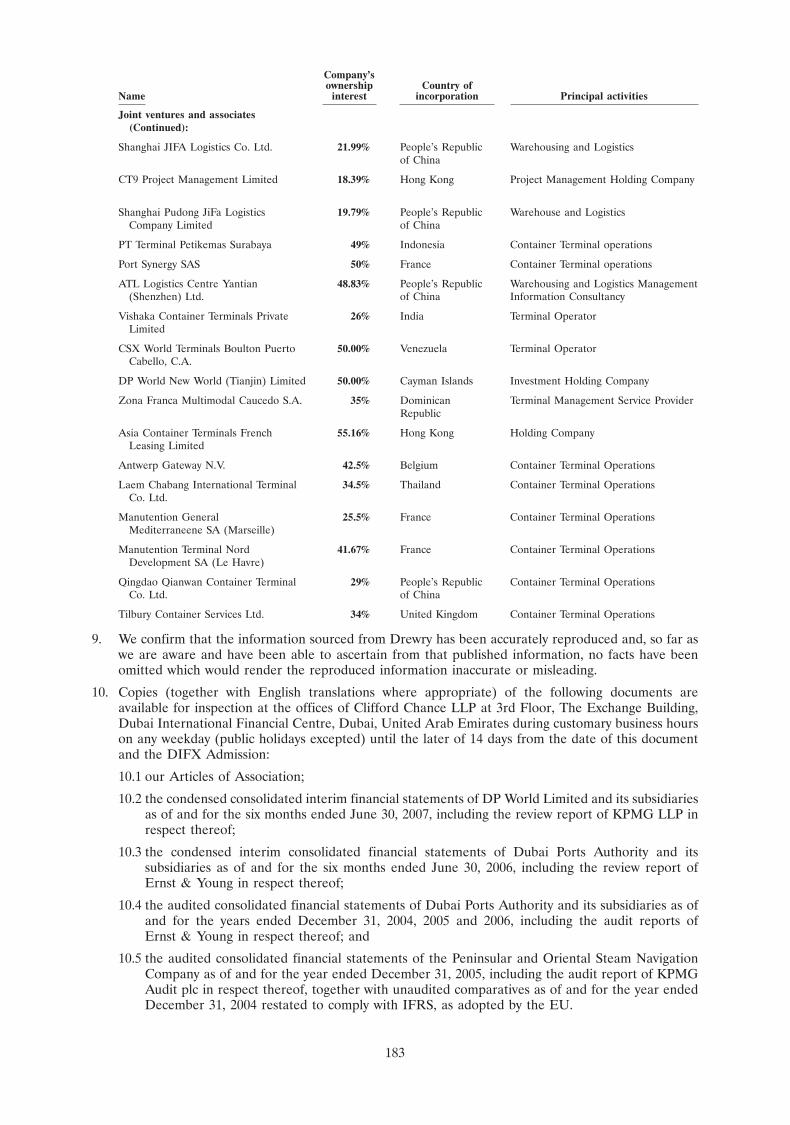
Company’sownership Country of
Name interest incorporation Principal activities
Joint ventures and associates(Continued):
Shanghai JIFA Logistics Co. Ltd. 21.99% People’s Republic Warehousing and Logisticsof China
CT9 Project Management Limited 18.39% Hong Kong Project Management Holding Company
Shanghai Pudong JiFa Logistics 19.79% People’s Republic Warehouse and LogisticsCompany Limited of China
PT Terminal Petikemas Surabaya 49% Indonesia Container Terminal operations
Port Synergy SAS 50% France Container Terminal operations
ATL Logistics Centre Yantian 48.83% People’s Republic Warehousing and Logistics Management(Shenzhen) Ltd. of China Information Consultancy
Vishaka Container Terminals Private 26% India Terminal OperatorLimited
CSX World Terminals Boulton Puerto 50.00% Venezuela Terminal OperatorCabello, C.A.
DP World New World (Tianjin) Limited 50.00% Cayman Islands Investment Holding Company
Zona Franca Multimodal Caucedo S.A. 35% Dominican Terminal Management Service ProviderRepublic
Asia Container Terminals French 55.16% Hong Kong Holding CompanyLeasing Limited
Antwerp Gateway N.V. 42.5% Belgium Container Terminal Operations
Laem Chabang International Terminal 34.5% Thailand Container Terminal OperationsCo. Ltd.
Manutention General 25.5% France Container Terminal OperationsMediterraneene SA (Marseille)
Manutention Terminal Nord 41.67% France Container Terminal OperationsDevelopment SA (Le Havre)
Qingdao Qianwan Container Terminal 29% People’s Republic Container Terminal OperationsCo. Ltd. of China
Tilbury Container Services Ltd. 34% United Kingdom Container Terminal Operations
9. We confirm that the information sourced from Drewry has been accurately reproduced and, so far aswe are aware and have been able to ascertain from that published information, no facts have beenomitted which would render the reproduced information inaccurate or misleading.
10. Copies (together with English translations where appropriate) of the following documents areavailable for inspection at the offices of Clifford Chance LLP at 3rd Floor, The Exchange Building,Dubai International Financial Centre, Dubai, United Arab Emirates during customary business hourson any weekday (public holidays excepted) until the later of 14 days from the date of this documentand the DIFX Admission:
10.1 our Articles of Association;
10.2 the condensed consolidated interim financial statements of DP World Limited and its subsidiariesas of and for the six months ended June 30, 2007, including the review report of KPMG LLP inrespect thereof;
10.3 the condensed interim consolidated financial statements of Dubai Ports Authority and itssubsidiaries as of and for the six months ended June 30, 2006, including the review report ofErnst & Young in respect thereof;
10.4 the audited consolidated financial statements of Dubai Ports Authority and its subsidiaries as ofand for the years ended December 31, 2004, 2005 and 2006, including the audit reports ofErnst & Young in respect thereof; and
10.5 the audited consolidated financial statements of the Peninsular and Oriental Steam NavigationCompany as of and for the year ended December 31, 2005, including the audit report of KPMGAudit plc in respect thereof, together with unaudited comparatives as of and for the year endedDecember 31, 2004 restated to comply with IFRS, as adopted by the EU.
183

(This page has been left blank intentionally.)
www.global-reports.com
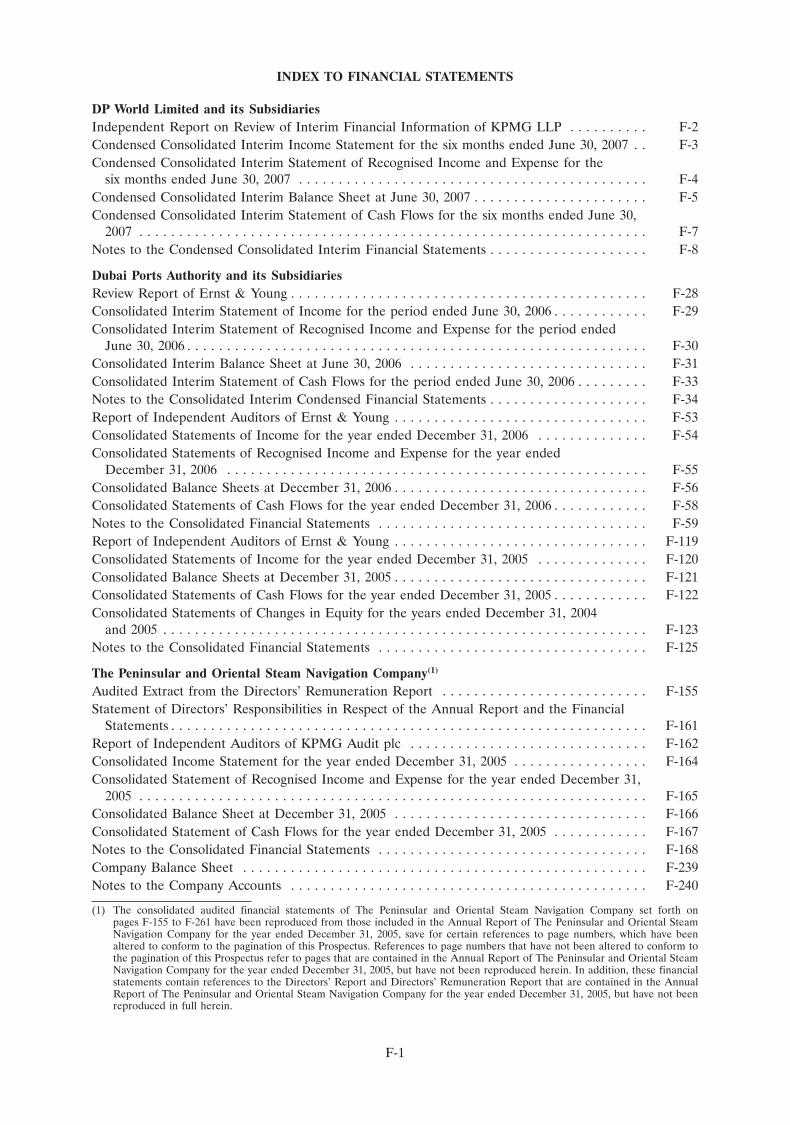
INDEX TO FINANCIAL STATEMENTS
DP World Limited and its SubsidiariesIndependent Report on Review of Interim Financial Information of KPMG LLP . . . . . . . . . . F-2Condensed Consolidated Interim Income Statement for the six months ended June 30, 2007 . . F-3Condensed Consolidated Interim Statement of Recognised Income and Expense for the
six months ended June 30, 2007 . . . . . . . . . . . . . . . . . . . . . . . . . . . . . . . . . . . . . . . . . . . . F-4Condensed Consolidated Interim Balance Sheet at June 30, 2007 . . . . . . . . . . . . . . . . . . . . . . F-5Condensed Consolidated Interim Statement of Cash Flows for the six months ended June 30,
2007 . . . . . . . . . . . . . . . . . . . . . . . . . . . . . . . . . . . . . . . . . . . . . . . . . . . . . . . . . . . . . . . . F-7Notes to the Condensed Consolidated Interim Financial Statements . . . . . . . . . . . . . . . . . . . . F-8
Dubai Ports Authority and its SubsidiariesReview Report of Ernst & Young . . . . . . . . . . . . . . . . . . . . . . . . . . . . . . . . . . . . . . . . . . . . . F-28Consolidated Interim Statement of Income for the period ended June 30, 2006 . . . . . . . . . . . . F-29Consolidated Interim Statement of Recognised Income and Expense for the period ended
June 30, 2006 . . . . . . . . . . . . . . . . . . . . . . . . . . . . . . . . . . . . . . . . . . . . . . . . . . . . . . . . . . F-30Consolidated Interim Balance Sheet at June 30, 2006 . . . . . . . . . . . . . . . . . . . . . . . . . . . . . . F-31Consolidated Interim Statement of Cash Flows for the period ended June 30, 2006 . . . . . . . . . F-33Notes to the Consolidated Interim Condensed Financial Statements . . . . . . . . . . . . . . . . . . . . F-34Report of Independent Auditors of Ernst & Young . . . . . . . . . . . . . . . . . . . . . . . . . . . . . . . . F-53Consolidated Statements of Income for the year ended December 31, 2006 . . . . . . . . . . . . . . F-54Consolidated Statements of Recognised Income and Expense for the year ended
December 31, 2006 . . . . . . . . . . . . . . . . . . . . . . . . . . . . . . . . . . . . . . . . . . . . . . . . . . . . . F-55Consolidated Balance Sheets at December 31, 2006 . . . . . . . . . . . . . . . . . . . . . . . . . . . . . . . . F-56Consolidated Statements of Cash Flows for the year ended December 31, 2006 . . . . . . . . . . . . F-58Notes to the Consolidated Financial Statements . . . . . . . . . . . . . . . . . . . . . . . . . . . . . . . . . . F-59Report of Independent Auditors of Ernst & Young . . . . . . . . . . . . . . . . . . . . . . . . . . . . . . . . F-119Consolidated Statements of Income for the year ended December 31, 2005 . . . . . . . . . . . . . . F-120Consolidated Balance Sheets at December 31, 2005 . . . . . . . . . . . . . . . . . . . . . . . . . . . . . . . . F-121Consolidated Statements of Cash Flows for the year ended December 31, 2005 . . . . . . . . . . . . F-122Consolidated Statements of Changes in Equity for the years ended December 31, 2004
and 2005 . . . . . . . . . . . . . . . . . . . . . . . . . . . . . . . . . . . . . . . . . . . . . . . . . . . . . . . . . . . . . F-123Notes to the Consolidated Financial Statements . . . . . . . . . . . . . . . . . . . . . . . . . . . . . . . . . . F-125
The Peninsular and Oriental Steam Navigation Company(1)
Audited Extract from the Directors’ Remuneration Report . . . . . . . . . . . . . . . . . . . . . . . . . . F-155Statement of Directors’ Responsibilities in Respect of the Annual Report and the Financial
Statements . . . . . . . . . . . . . . . . . . . . . . . . . . . . . . . . . . . . . . . . . . . . . . . . . . . . . . . . . . . . F-161Report of Independent Auditors of KPMG Audit plc . . . . . . . . . . . . . . . . . . . . . . . . . . . . . . F-162Consolidated Income Statement for the year ended December 31, 2005 . . . . . . . . . . . . . . . . . F-164Consolidated Statement of Recognised Income and Expense for the year ended December 31,
2005 . . . . . . . . . . . . . . . . . . . . . . . . . . . . . . . . . . . . . . . . . . . . . . . . . . . . . . . . . . . . . . . . F-165Consolidated Balance Sheet at December 31, 2005 . . . . . . . . . . . . . . . . . . . . . . . . . . . . . . . . F-166Consolidated Statement of Cash Flows for the year ended December 31, 2005 . . . . . . . . . . . . F-167Notes to the Consolidated Financial Statements . . . . . . . . . . . . . . . . . . . . . . . . . . . . . . . . . . F-168Company Balance Sheet . . . . . . . . . . . . . . . . . . . . . . . . . . . . . . . . . . . . . . . . . . . . . . . . . . . F-239Notes to the Company Accounts . . . . . . . . . . . . . . . . . . . . . . . . . . . . . . . . . . . . . . . . . . . . . F-240
(1) The consolidated audited financial statements of The Peninsular and Oriental Steam Navigation Company set forth onpages F-155 to F-261 have been reproduced from those included in the Annual Report of The Peninsular and Oriental SteamNavigation Company for the year ended December 31, 2005, save for certain references to page numbers, which have beenaltered to conform to the pagination of this Prospectus. References to page numbers that have not been altered to conform tothe pagination of this Prospectus refer to pages that are contained in the Annual Report of The Peninsular and Oriental SteamNavigation Company for the year ended December 31, 2005, but have not been reproduced herein. In addition, these financialstatements contain references to the Directors’ Report and Directors’ Remuneration Report that are contained in the AnnualReport of The Peninsular and Oriental Steam Navigation Company for the year ended December 31, 2005, but have not beenreproduced in full herein.
F-1
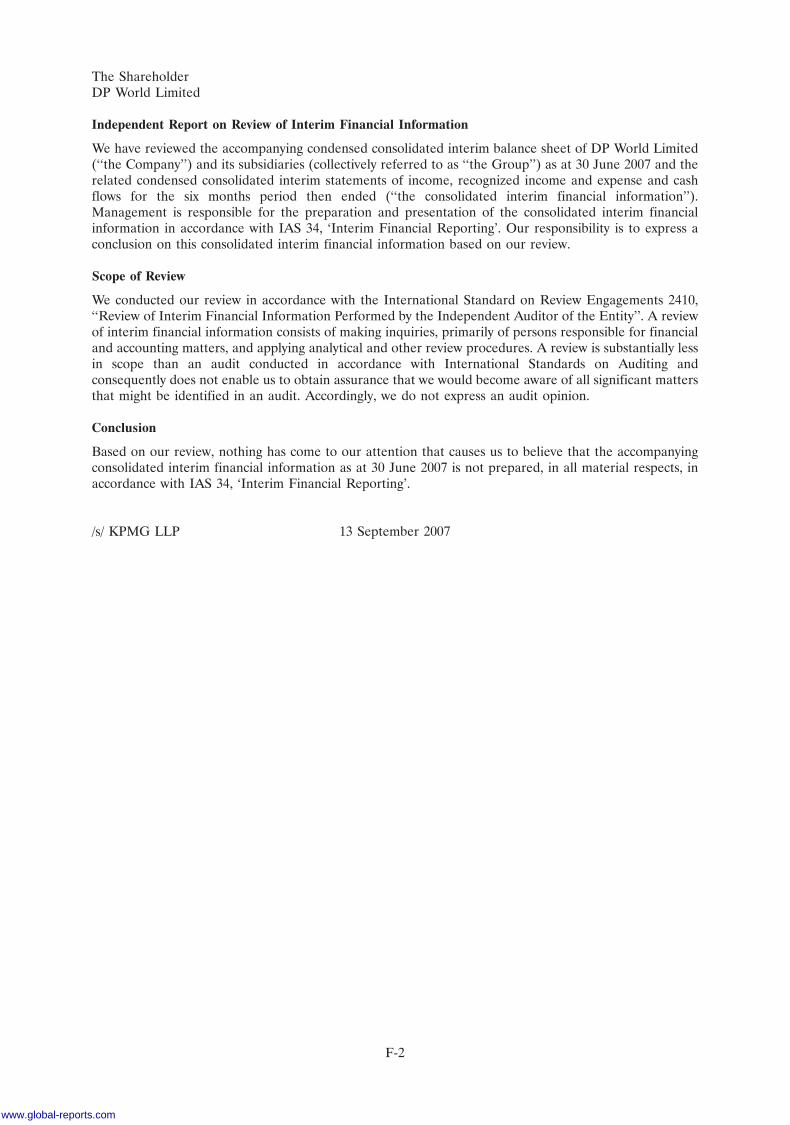
The ShareholderDP World Limited
Independent Report on Review of Interim Financial Information
We have reviewed the accompanying condensed consolidated interim balance sheet of DP World Limited(‘‘the Company’’) and its subsidiaries (collectively referred to as ‘‘the Group’’) as at 30 June 2007 and therelated condensed consolidated interim statements of income, recognized income and expense and cashflows for the six months period then ended (‘‘the consolidated interim financial information’’).Management is responsible for the preparation and presentation of the consolidated interim financialinformation in accordance with IAS 34, ‘Interim Financial Reporting’. Our responsibility is to express aconclusion on this consolidated interim financial information based on our review.
Scope of Review
We conducted our review in accordance with the International Standard on Review Engagements 2410,‘‘Review of Interim Financial Information Performed by the Independent Auditor of the Entity’’. A reviewof interim financial information consists of making inquiries, primarily of persons responsible for financialand accounting matters, and applying analytical and other review procedures. A review is substantially lessin scope than an audit conducted in accordance with International Standards on Auditing andconsequently does not enable us to obtain assurance that we would become aware of all significant mattersthat might be identified in an audit. Accordingly, we do not express an audit opinion.
Conclusion
Based on our review, nothing has come to our attention that causes us to believe that the accompanyingconsolidated interim financial information as at 30 June 2007 is not prepared, in all material respects, inaccordance with IAS 34, ‘Interim Financial Reporting’.
/s/ KPMG LLP 13 September 2007
F-2
www.global-reports.com
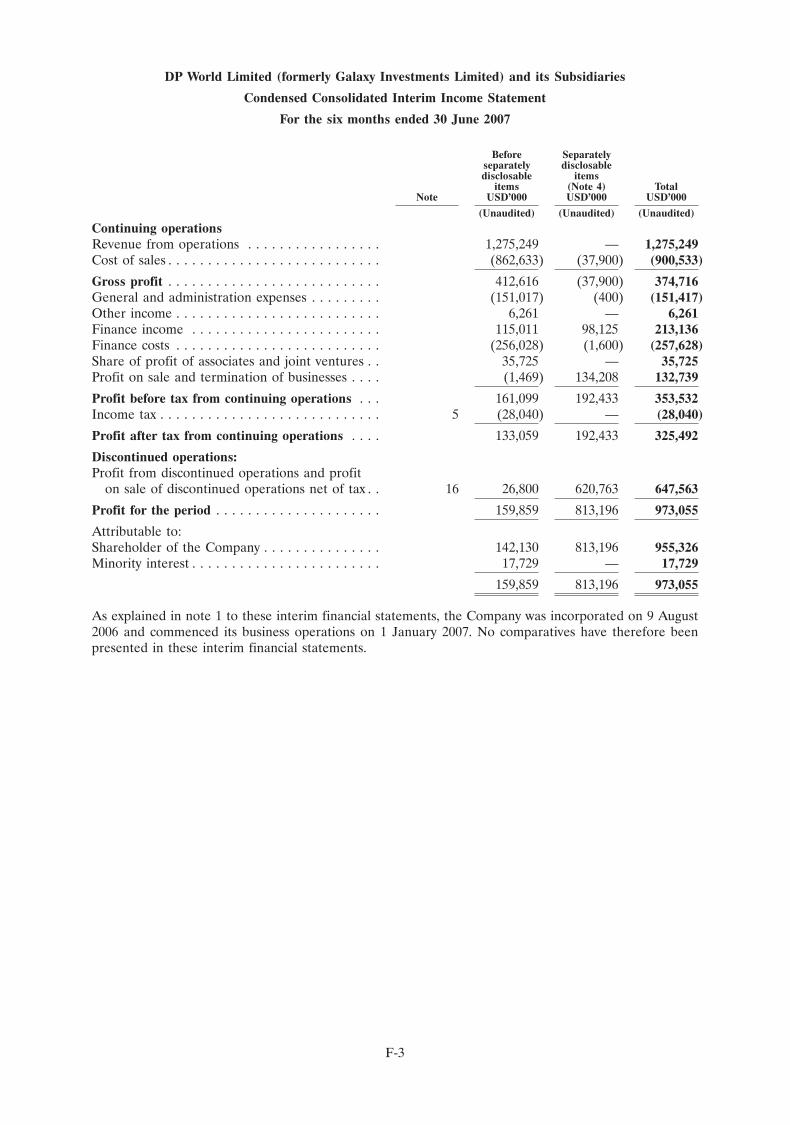
DP World Limited (formerly Galaxy Investments Limited) and its Subsidiaries
Condensed Consolidated Interim Income Statement
For the six months ended 30 June 2007
Before Separatelyseparately disclosabledisclosable items
items (Note 4) TotalNote USD’000 USD’000 USD’000
(Unaudited) (Unaudited) (Unaudited)
Continuing operationsRevenue from operations . . . . . . . . . . . . . . . . . 1,275,249 — 1,275,249Cost of sales . . . . . . . . . . . . . . . . . . . . . . . . . . . (862,633) (37,900) (900,533)
Gross profit . . . . . . . . . . . . . . . . . . . . . . . . . . . 412,616 (37,900) 374,716General and administration expenses . . . . . . . . . (151,017) (400) (151,417)Other income . . . . . . . . . . . . . . . . . . . . . . . . . . 6,261 — 6,261Finance income . . . . . . . . . . . . . . . . . . . . . . . . 115,011 98,125 213,136Finance costs . . . . . . . . . . . . . . . . . . . . . . . . . . (256,028) (1,600) (257,628)Share of profit of associates and joint ventures . . 35,725 — 35,725Profit on sale and termination of businesses . . . . (1,469) 134,208 132,739
Profit before tax from continuing operations . . . 161,099 192,433 353,532Income tax . . . . . . . . . . . . . . . . . . . . . . . . . . . . 5 (28,040) — (28,040)
Profit after tax from continuing operations . . . . 133,059 192,433 325,492
Discontinued operations:Profit from discontinued operations and profit
on sale of discontinued operations net of tax . . 16 26,800 620,763 647,563
Profit for the period . . . . . . . . . . . . . . . . . . . . . 159,859 813,196 973,055
Attributable to:Shareholder of the Company . . . . . . . . . . . . . . . 142,130 813,196 955,326Minority interest . . . . . . . . . . . . . . . . . . . . . . . . 17,729 — 17,729
159,859 813,196 973,055
As explained in note 1 to these interim financial statements, the Company was incorporated on 9 August2006 and commenced its business operations on 1 January 2007. No comparatives have therefore beenpresented in these interim financial statements.
F-3
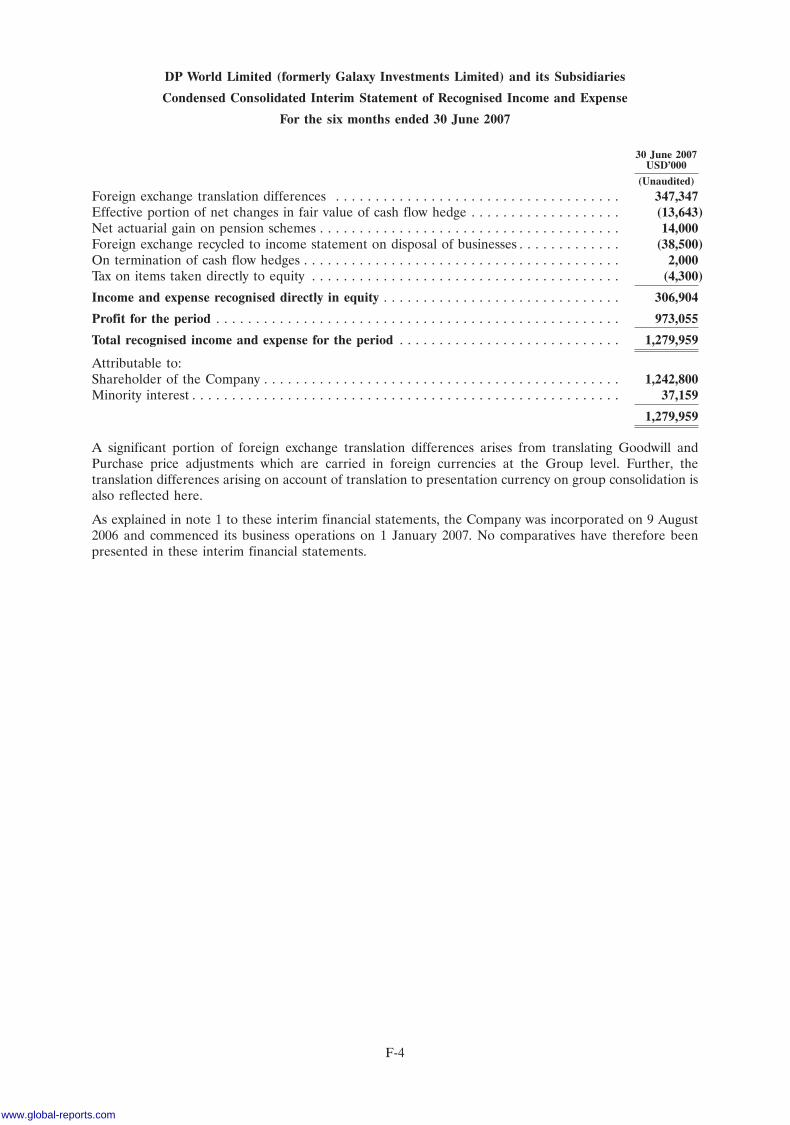
DP World Limited (formerly Galaxy Investments Limited) and its Subsidiaries
Condensed Consolidated Interim Statement of Recognised Income and Expense
For the six months ended 30 June 2007
30 June 2007USD’000
(Unaudited)
Foreign exchange translation differences . . . . . . . . . . . . . . . . . . . . . . . . . . . . . . . . . . . . 347,347Effective portion of net changes in fair value of cash flow hedge . . . . . . . . . . . . . . . . . . . (13,643)Net actuarial gain on pension schemes . . . . . . . . . . . . . . . . . . . . . . . . . . . . . . . . . . . . . . 14,000Foreign exchange recycled to income statement on disposal of businesses . . . . . . . . . . . . . (38,500)On termination of cash flow hedges . . . . . . . . . . . . . . . . . . . . . . . . . . . . . . . . . . . . . . . . 2,000Tax on items taken directly to equity . . . . . . . . . . . . . . . . . . . . . . . . . . . . . . . . . . . . . . . (4,300)
Income and expense recognised directly in equity . . . . . . . . . . . . . . . . . . . . . . . . . . . . . . 306,904
Profit for the period . . . . . . . . . . . . . . . . . . . . . . . . . . . . . . . . . . . . . . . . . . . . . . . . . . . 973,055
Total recognised income and expense for the period . . . . . . . . . . . . . . . . . . . . . . . . . . . . 1,279,959
Attributable to:Shareholder of the Company . . . . . . . . . . . . . . . . . . . . . . . . . . . . . . . . . . . . . . . . . . . . . 1,242,800Minority interest . . . . . . . . . . . . . . . . . . . . . . . . . . . . . . . . . . . . . . . . . . . . . . . . . . . . . . 37,159
1,279,959
A significant portion of foreign exchange translation differences arises from translating Goodwill andPurchase price adjustments which are carried in foreign currencies at the Group level. Further, thetranslation differences arising on account of translation to presentation currency on group consolidation isalso reflected here.
As explained in note 1 to these interim financial statements, the Company was incorporated on 9 August2006 and commenced its business operations on 1 January 2007. No comparatives have therefore beenpresented in these interim financial statements.
F-4
www.global-reports.com
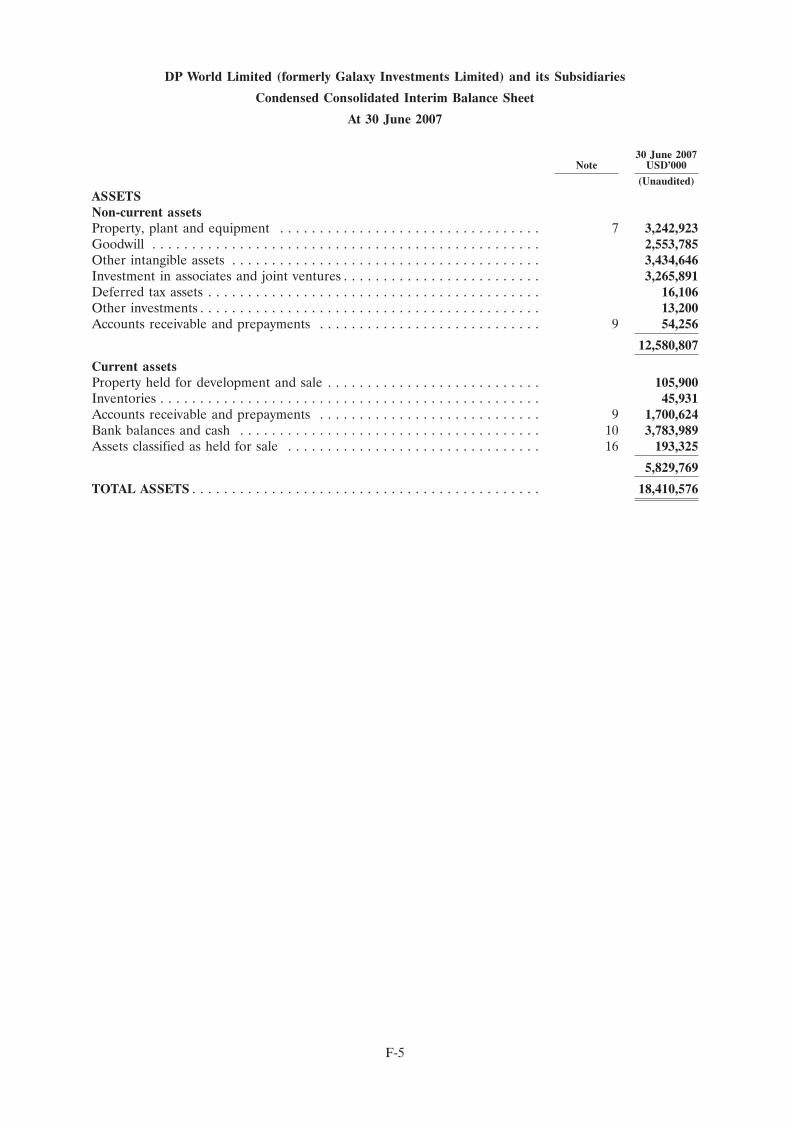
DP World Limited (formerly Galaxy Investments Limited) and its Subsidiaries
Condensed Consolidated Interim Balance Sheet
At 30 June 2007
30 June 2007Note USD’000
(Unaudited)
ASSETSNon-current assetsProperty, plant and equipment . . . . . . . . . . . . . . . . . . . . . . . . . . . . . . . . . 7 3,242,923Goodwill . . . . . . . . . . . . . . . . . . . . . . . . . . . . . . . . . . . . . . . . . . . . . . . . . 2,553,785Other intangible assets . . . . . . . . . . . . . . . . . . . . . . . . . . . . . . . . . . . . . . . 3,434,646Investment in associates and joint ventures . . . . . . . . . . . . . . . . . . . . . . . . . 3,265,891Deferred tax assets . . . . . . . . . . . . . . . . . . . . . . . . . . . . . . . . . . . . . . . . . . 16,106Other investments . . . . . . . . . . . . . . . . . . . . . . . . . . . . . . . . . . . . . . . . . . . 13,200Accounts receivable and prepayments . . . . . . . . . . . . . . . . . . . . . . . . . . . . 9 54,256
12,580,807
Current assetsProperty held for development and sale . . . . . . . . . . . . . . . . . . . . . . . . . . . 105,900Inventories . . . . . . . . . . . . . . . . . . . . . . . . . . . . . . . . . . . . . . . . . . . . . . . . 45,931Accounts receivable and prepayments . . . . . . . . . . . . . . . . . . . . . . . . . . . . 9 1,700,624Bank balances and cash . . . . . . . . . . . . . . . . . . . . . . . . . . . . . . . . . . . . . . 10 3,783,989Assets classified as held for sale . . . . . . . . . . . . . . . . . . . . . . . . . . . . . . . . 16 193,325
5,829,769
TOTAL ASSETS . . . . . . . . . . . . . . . . . . . . . . . . . . . . . . . . . . . . . . . . . . . . 18,410,576
F-5
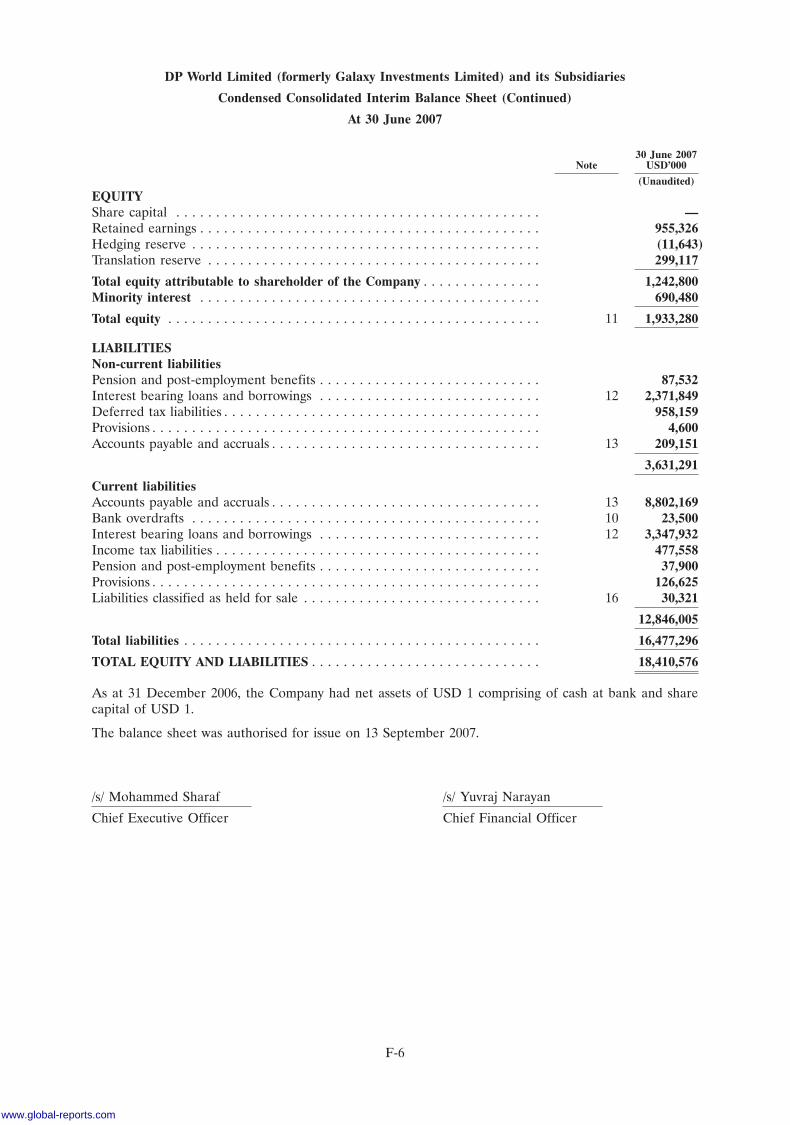
DP World Limited (formerly Galaxy Investments Limited) and its Subsidiaries
Condensed Consolidated Interim Balance Sheet (Continued)
At 30 June 2007
30 June 2007Note USD’000
(Unaudited)
EQUITYShare capital . . . . . . . . . . . . . . . . . . . . . . . . . . . . . . . . . . . . . . . . . . . . . . —Retained earnings . . . . . . . . . . . . . . . . . . . . . . . . . . . . . . . . . . . . . . . . . . . 955,326Hedging reserve . . . . . . . . . . . . . . . . . . . . . . . . . . . . . . . . . . . . . . . . . . . . (11,643)Translation reserve . . . . . . . . . . . . . . . . . . . . . . . . . . . . . . . . . . . . . . . . . . 299,117
Total equity attributable to shareholder of the Company . . . . . . . . . . . . . . . 1,242,800Minority interest . . . . . . . . . . . . . . . . . . . . . . . . . . . . . . . . . . . . . . . . . . . 690,480
Total equity . . . . . . . . . . . . . . . . . . . . . . . . . . . . . . . . . . . . . . . . . . . . . . . 11 1,933,280
LIABILITIESNon-current liabilitiesPension and post-employment benefits . . . . . . . . . . . . . . . . . . . . . . . . . . . . 87,532Interest bearing loans and borrowings . . . . . . . . . . . . . . . . . . . . . . . . . . . . 12 2,371,849Deferred tax liabilities . . . . . . . . . . . . . . . . . . . . . . . . . . . . . . . . . . . . . . . . 958,159Provisions . . . . . . . . . . . . . . . . . . . . . . . . . . . . . . . . . . . . . . . . . . . . . . . . . 4,600Accounts payable and accruals . . . . . . . . . . . . . . . . . . . . . . . . . . . . . . . . . . 13 209,151
3,631,291
Current liabilitiesAccounts payable and accruals . . . . . . . . . . . . . . . . . . . . . . . . . . . . . . . . . . 13 8,802,169Bank overdrafts . . . . . . . . . . . . . . . . . . . . . . . . . . . . . . . . . . . . . . . . . . . . 10 23,500Interest bearing loans and borrowings . . . . . . . . . . . . . . . . . . . . . . . . . . . . 12 3,347,932Income tax liabilities . . . . . . . . . . . . . . . . . . . . . . . . . . . . . . . . . . . . . . . . . 477,558Pension and post-employment benefits . . . . . . . . . . . . . . . . . . . . . . . . . . . . 37,900Provisions . . . . . . . . . . . . . . . . . . . . . . . . . . . . . . . . . . . . . . . . . . . . . . . . . 126,625Liabilities classified as held for sale . . . . . . . . . . . . . . . . . . . . . . . . . . . . . . 16 30,321
12,846,005
Total liabilities . . . . . . . . . . . . . . . . . . . . . . . . . . . . . . . . . . . . . . . . . . . . . 16,477,296
TOTAL EQUITY AND LIABILITIES . . . . . . . . . . . . . . . . . . . . . . . . . . . . . 18,410,576
As at 31 December 2006, the Company had net assets of USD 1 comprising of cash at bank and sharecapital of USD 1.
The balance sheet was authorised for issue on 13 September 2007.
/s/ Mohammed Sharaf /s/ Yuvraj Narayan
Chief Executive Officer Chief Financial Officer
F-6
www.global-reports.com
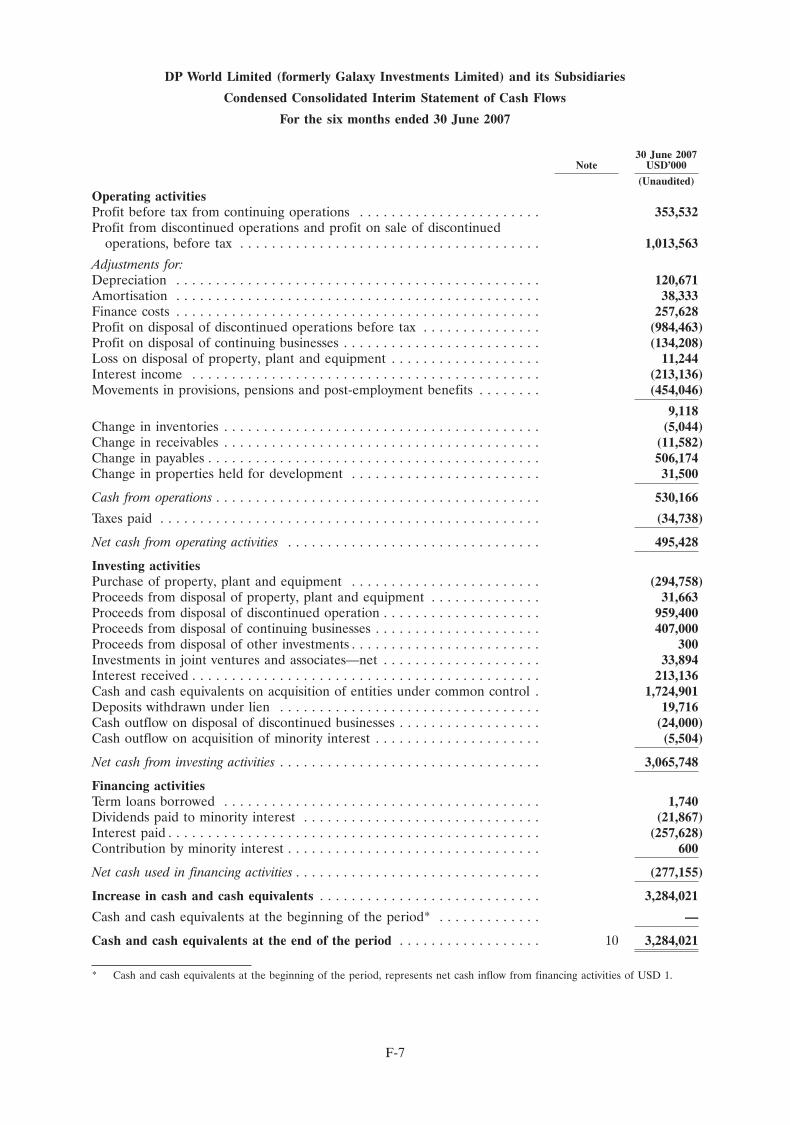
DP World Limited (formerly Galaxy Investments Limited) and its Subsidiaries
Condensed Consolidated Interim Statement of Cash Flows
For the six months ended 30 June 2007
30 June 2007Note USD’000
(Unaudited)
Operating activitiesProfit before tax from continuing operations . . . . . . . . . . . . . . . . . . . . . . . 353,532Profit from discontinued operations and profit on sale of discontinued
operations, before tax . . . . . . . . . . . . . . . . . . . . . . . . . . . . . . . . . . . . . . 1,013,563
Adjustments for:Depreciation . . . . . . . . . . . . . . . . . . . . . . . . . . . . . . . . . . . . . . . . . . . . . . 120,671Amortisation . . . . . . . . . . . . . . . . . . . . . . . . . . . . . . . . . . . . . . . . . . . . . . 38,333Finance costs . . . . . . . . . . . . . . . . . . . . . . . . . . . . . . . . . . . . . . . . . . . . . . 257,628Profit on disposal of discontinued operations before tax . . . . . . . . . . . . . . . (984,463)Profit on disposal of continuing businesses . . . . . . . . . . . . . . . . . . . . . . . . . (134,208)Loss on disposal of property, plant and equipment . . . . . . . . . . . . . . . . . . . 11,244Interest income . . . . . . . . . . . . . . . . . . . . . . . . . . . . . . . . . . . . . . . . . . . . (213,136)Movements in provisions, pensions and post-employment benefits . . . . . . . . (454,046)
9,118Change in inventories . . . . . . . . . . . . . . . . . . . . . . . . . . . . . . . . . . . . . . . . (5,044)Change in receivables . . . . . . . . . . . . . . . . . . . . . . . . . . . . . . . . . . . . . . . . (11,582)Change in payables . . . . . . . . . . . . . . . . . . . . . . . . . . . . . . . . . . . . . . . . . . 506,174Change in properties held for development . . . . . . . . . . . . . . . . . . . . . . . . 31,500
Cash from operations . . . . . . . . . . . . . . . . . . . . . . . . . . . . . . . . . . . . . . . . . 530,166
Taxes paid . . . . . . . . . . . . . . . . . . . . . . . . . . . . . . . . . . . . . . . . . . . . . . . . (34,738)
Net cash from operating activities . . . . . . . . . . . . . . . . . . . . . . . . . . . . . . . . 495,428
Investing activitiesPurchase of property, plant and equipment . . . . . . . . . . . . . . . . . . . . . . . . (294,758)Proceeds from disposal of property, plant and equipment . . . . . . . . . . . . . . 31,663Proceeds from disposal of discontinued operation . . . . . . . . . . . . . . . . . . . . 959,400Proceeds from disposal of continuing businesses . . . . . . . . . . . . . . . . . . . . . 407,000Proceeds from disposal of other investments . . . . . . . . . . . . . . . . . . . . . . . . 300Investments in joint ventures and associates—net . . . . . . . . . . . . . . . . . . . . 33,894Interest received . . . . . . . . . . . . . . . . . . . . . . . . . . . . . . . . . . . . . . . . . . . . 213,136Cash and cash equivalents on acquisition of entities under common control . 1,724,901Deposits withdrawn under lien . . . . . . . . . . . . . . . . . . . . . . . . . . . . . . . . . 19,716Cash outflow on disposal of discontinued businesses . . . . . . . . . . . . . . . . . . (24,000)Cash outflow on acquisition of minority interest . . . . . . . . . . . . . . . . . . . . . (5,504)
Net cash from investing activities . . . . . . . . . . . . . . . . . . . . . . . . . . . . . . . . . 3,065,748
Financing activitiesTerm loans borrowed . . . . . . . . . . . . . . . . . . . . . . . . . . . . . . . . . . . . . . . . 1,740Dividends paid to minority interest . . . . . . . . . . . . . . . . . . . . . . . . . . . . . . (21,867)Interest paid . . . . . . . . . . . . . . . . . . . . . . . . . . . . . . . . . . . . . . . . . . . . . . . (257,628)Contribution by minority interest . . . . . . . . . . . . . . . . . . . . . . . . . . . . . . . . 600
Net cash used in financing activities . . . . . . . . . . . . . . . . . . . . . . . . . . . . . . . (277,155)
Increase in cash and cash equivalents . . . . . . . . . . . . . . . . . . . . . . . . . . . . 3,284,021
Cash and cash equivalents at the beginning of the period* . . . . . . . . . . . . . —
Cash and cash equivalents at the end of the period . . . . . . . . . . . . . . . . . . 10 3,284,021
* Cash and cash equivalents at the beginning of the period, represents net cash inflow from financing activities of USD 1.
F-7
DP World Limited (formerly Galaxy Investments Limited) and its Subsidiaries
Notes
(Forming part of the Financial Statements)
1 Legal status and principal activities
DP World Limited (the ‘‘Company’’) formerly known as Galaxy Investments Limited was incorporated on9 August 2006 as a Company Limited by Shares under the Companies Law, DIFC Law No. 3 of 2006 withthe Registrar of Companies of the Dubai International Financial Centre. The Company is a wholly ownedsubsidiary of Ports and Free Zone World FZE which is ultimately owned by Government of Dubai. Thecondensed consolidated interim financial statements of the Company for the period ended 30 June 2007comprise the Company and its subsidiaries (collectively referred to as ‘‘the Group’’) and the Group’sinterest in associates and jointly controlled entities. The Group is engaged in the business of managementand operation of seaports worldwide.
On January 1, 2007, DP World FZE and Thunder FZE (Limited Liability Companies registered in JebelAli Free Zone in the Emirate of Dubai, United Arab Emirates), were transferred to the Company byDubai Ports Authority, an affiliate of the Company (refer note 8) and as at that date the Company startedits operations.
The Company’s registered office is P.O. Box 17000, Dubai, United Arab Emirates. On 30 May 2007, theCompany’s name was changed to DP World Limited.
2 Basis of Preparation
(a) Statement of compliance
The condensed consolidated interim financial statements have been prepared in accordance with IAS 34,Interim Financial Reporting.
(b) Basis of measurement
The condensed consolidated interim financial statements have been prepared on the historical cost basisexcept for derivative financial instruments which are measured at fair value.
(c) Functional and presentation currency
The functional currency of the Company is UAE Dirhams. Each entity in the Group determines its ownfunctional currency and items included in the financial statements of each entity are measured using thatfunctional currency.
These condensed consolidated interim financial statements are presented in United States Dollars(‘‘USD’’), which in the opinion of management is the most appropriate presentation currency in view ofthe global presence of the Group. All financial information presented in USD are rounded to the nearestthousand.
(d) Use of estimates and judgements
The preparation of interim financial statements requires management to make judgements, estimates andassumptions that affect the application of accounting policies and reported amounts of assets, liabilities,income and expenses. Actual results may differ from these estimates.
Estimates and underlying assumptions are reviewed on an ongoing basis. Revisions to accounting estimatesare recognized in the period in which the estimate is revised and in any future periods affected.
F-8
www.global-reports.com
DP World Limited (formerly Galaxy Investments Limited) and its Subsidiaries
Notes (Continued)
2 Basis of Preparation (Continued)
In particular, information about significant areas of estimation uncertainty and critical judgements inapplying accounting policies that have the most significant effect on the amount recognized in the financialstatements are discussed below:
(i) Impairment of goodwill
The Group determines whether goodwill is impaired at least on an annual basis. This requires anestimation of the value in use of the cash-generating units to which the goodwill is allocated. Estimatingthe value in use requires the Group to make an estimate of the expected future cash flows from thecash-generating unit and also to choose a suitable discount rate in order to calculate the present value ofthose cash flows.
(ii) Pension and other post employment benefits
The cost of defined benefit pension plans and other post employment benefits is determined usingactuarial valuations. The actuarial valuation involves making assumptions about discount rates, expectedrates of return on assets, future salary increases, mortality rates and future pension increases. Due to thelong term nature of these plans, such estimates are subject to significant uncertainty.
(iii) Useful life of property, plant and equipment
The useful life of property, plant and equipment is determined by the Group’s management based on theirestimate of the period over which an asset is expected to be available for use by the Group. This estimate isreviewed and adjusted if appropriate at each financial year end.
(iv) Impairment of accounts receivable
An estimate of the collectible amount of accounts receivable is made when collection of the full amount isno longer probable. For individually significant amounts, this estimation is performed on an individualbasis. Amounts which are not individually significant, but which are past due, are assessed collectively anda provision applied according to the length of time past due, based on historical recovery rates. Anydifference between the amounts actually collected in future periods and the amounts expected will berecognised in the consolidated statement of income.
3 Significant accounting policies
The accounting policies set out below have been applied consistently to all periods presented in thesecondensed consolidated interim financial statements, and have been applied consistently by Group entities.There has been no changes in accounting policies in the current period.
(a) Basis of consolidation
(i) Business combination
Except for transactions involving entities under common control, where the provisions of IFRS 3-BusinessCombinations are not applicable, business combinations are accounted for using the acquisition accountingmethod. This involves recognising identifiable assets (including previously unrecognised intangible assets)and liabilities (including contingent liabilities and excluding future restructuring) of the acquired businessat fair value. For transactions involving entities under common control, the carrying value of assets andliabilities are used to account for these transactions.
(ii) Subsidiaries
Subsidiaries are entities controlled by the Group. Control exists when the Group has the power to governthe financial and operating policies of an entity so as to obtain benefits from its activities. In assessingcontrol, potential voting rights that presently are exercisable are taken into account. The financial
F-9
DP World Limited (formerly Galaxy Investments Limited) and its Subsidiaries
Notes (Continued)
3 Significant accounting policies (Continued)
statements of subsidiaries are included in the financial statements from the date that control commencesuntil the date that control ceases.
(iii) Associates and joint ventures
Associates are those entities in which the Group has significant influence, but not control, over thefinancial and operating policies. Joint ventures are those entities over whose activities the Group has jointcontrol, established by contractual agreement and requiring unanimous consent for strategic financial andoperating decisions. Associates and joint ventures are accounted for using the equity method (‘‘equityaccounted investees’’). The consolidated financial statements include the Group’s share of the income andexpenses of equity accounted investees, after adjustments to align the accounting policies with those of theGroup, from the date that significant influence or joint control commences until the date that significantinfluence or joint control ceases. When the Group’s share of losses exceeds its interest in an equityaccounted investee, the carrying amount of that interest (including any long-term investments) is reducedto nil and the recognition of further losses is discontinued except to the extent that the Group has anobligation or has made payments on behalf of the investee.
(iv) Transactions eliminated on consolidation
Intra-group balances, and any unrealised income and expenses arising from intra-group transactions, areeliminated in preparing the consolidated financial statements. Unrealised gains arising from thetransactions with equity accounted investees are eliminated against the investment to the extent of theGroup’s interest in the investee. Unrealised losses are eliminated in the same way as unrealised gains, butonly to the extent that there is no evidence of impairment.
(b) Foreign currency
(i) Foreign currency transactions
These condensed consolidated interim financial statements are presented in USD, which is the Group’spresentation currency. Transactions in foreign currencies are translated to the respective functionalcurrencies of the Group entities at exchange rates at the date of the transactions. Monetary assets andliabilities denominated in foreign currencies at the reporting date are retranslated to the functionalcurrency at the exchange rate at that date. Non-monetary assets and liabilities denominated in foreigncurrencies that are measured at fair value are retranslated to the functional currency at the exchange rateat the date that the fair value was determined. Foreign currency differences arising on retranslation ofmonetary items are recognised in income statement, except for differences arising on the retranslation of afinancial liability designated as a hedge of the net investment in a foreign operation (see (iii) below).
(ii) Foreign operations
The assets and liabilities of foreign operations, including goodwill and fair value adjustments arising onacquisition, are translated to USD at exchange rates at the reporting date. The revenues and expenses offoreign operations are translated to USD at rates approximating to the foreign exchange rates ruling at thedate of the transactions. Foreign exchange differences arising on translation are recognised directly inequity. Such differences have been recognised in the translation reserve. When a foreign operation isdisposed of, in part or in full, the relevant amount in translation reserve is transferred to income statement.
(iii) Hedge of net investment in foreign operation
Foreign currency differences arising on the retranslation of a financial liability designated as a hedge of anet investment in foreign operation are recognised directly in equity, in the translation reserve, to theextent that the hedge is effective. To the extent that the hedge is ineffective, such differences arerecognised in the income statement. When the hedged net investment is disposed of, the cumulativeamount in equity is transferred to income statement on disposal.
F-10
www.global-reports.com
DP World Limited (formerly Galaxy Investments Limited) and its Subsidiaries
Notes (Continued)
3 Significant accounting policies (Continued)
(c) Financial instruments
(i) Non-derivative financial instruments
Non-derivative financial instruments comprise investments in equity and debt securities, trade and otherreceivables, cash and cash equivalents, loans and borrowings, and trade and other payables.
Non-derivative financial instruments are recognised initially at fair value plus, for instruments not at fairvalue through profit or loss, any directly attributable transaction costs, except as described below.Subsequent to initial recognition non-derivative financial instruments are measured as described below:
The financial instrument is recognised if the Group becomes a party to the contractual provisions of theinstrument. Financial assets are derecognised if the Group’s contractual rights to the cash flows from thefinancial assets expire or if the Group transfers the financial asset to another party without retainingcontrol or substantially all risks and rewards of the assets. Regular way purchases and sales of financialassets are accounted for at trade date, i.e., the date that the Group commits itself to purchase or sell theasset. Financial liabilities are derecognised if the Group’s obligations specified in the contract expire or aredischarged or cancelled.
Cash and cash equivalents comprise cash in hand, bank balances and short-term deposits under lien withan original maturity of three months. Bank overdrafts that are repayable on demand form an integral partof the Group’s cash management are included as a component of cash and cash equivalent for the purposeof the statement of cash flows.
Held-to-maturity investments
If the Group has a positive intent and ability to hold debt securities to maturity, then they are classified asheld-to-maturity. Held-to-maturity investments are measured at amortised cost using the effective interestmethod, less any impairment losses. Gains and losses are recognised in the income statement when theinvestments are derecognised or impaired, as well as through the amortisation process.
Other
Other non-derivative financial instruments are measured at amortised cost using the effective interestmethod, less any impairment losses.
(ii) Derivative financial instruments
The Group holds derivative financial instruments to hedge its foreign currency and interest rate riskexposures. Derivatives are recognized initially at fair value and attributable transaction costs arerecognized in income statement when incurred. Subsequent to initial recognition, derivatives are measuredat fair value, and changes therein are accounted for as described below:
Cash flow hedges
Changes in the fair value of the derivative hedging instrument designated as a cash flow hedge arerecognized directly in equity to the extent that the hedge is effective. To the extent that the hedge isineffective, changes in fair value are recognized in income statement.
If the hedging instrument no longer meets the criteria for hedge accounting, expires or is sold, terminatedor exercised, then hedge accounting is discontinued prospectively. The cumulative gain or loss previouslyrecognized in equity remains there until the forecast transaction occurs. When the hedged item is anon-financial asset, the amount recognized in equity is transferred to the carrying amount of the assetwhen it is recognized. In other cases the amount recognized in equity is transferred to income statement inthe same period that the hedged item affects the income statement.
F-11
DP World Limited (formerly Galaxy Investments Limited) and its Subsidiaries
Notes (Continued)
3 Significant accounting policies (Continued)
Economic hedges
Hedge accounting is not applied to derivative instruments that economically hedge monetary assets andliabilities denominated in foreign currencies. Changes in the fair value of such derivatives are recognized inincome statement as part of foreign currency gains and losses.
(d) Property, plant and equipment
(i) Recognition and measurement
Items of property, plant and equipment are measured at cost less accumulated depreciation andimpairment losses (refer accounting policy on impairment).
Cost includes expenditures that are directly attributable to the acquisition of the asset. The cost ofself-constructed asset includes the cost of materials and direct labour, any other costs directly attributableto bringing the asset to a working condition for its intended use, and the cost of dismantling and removingthe items and restoring the site on which they are located. Purchased software that is integral to thefunctionality of the related equipment is capitalized as part of that equipment.
When parts of an item of property, plant and equipment have different useful lives, they are accounted foras separate items (major components) of property, plant and equipment.
(ii) Subsequent costs
The cost of replacing part of an item of property, plant and equipment is recognized in the carryingamount of the item if it is probable that the future economic benefits embodied within the part will flow tothe Group and its cost can be measured reliably. The costs of the day-to-day servicing of property, plantand equipment are recognized in the income statement as incurred.
(iii) Depreciation
Depreciation is recognized in income statement on a straight-line basis over the estimated useful lives ofeach part of an item of property, plant and equipment. Leased assets are depreciated over the shorter ofthe lease term and their useful lives. Land is not depreciated.
The estimated useful lives for the current period are as follows:
Assets Life (years)
Buildings and infrastructure . . . . . . . . . . . . . . . . . . . . . . . . . . . . . . . . 5 - 50Cranes and marine equipments . . . . . . . . . . . . . . . . . . . . . . . . . . . . . . 5 - 25Plant, equipment, furniture and others . . . . . . . . . . . . . . . . . . . . . . . . 3 - 40Ships . . . . . . . . . . . . . . . . . . . . . . . . . . . . . . . . . . . . . . . . . . . . . . . . . 10 - 35
(iv) Capital work-in-progress
The capital work-in-progress is measured at cost and not depreciated until such time the assets are readyfor intended use and transferred to the respective category under property, plant and equipment.
(e) Properties held for development and sale
Properties held for development and sale are included under current assets at the lower of cost and netrealisable value, with any resultant gain or loss recognised in the income statement. Net realisable value isthe estimated selling price in the ordinary course of business, less the estimated costs of completion andselling expenses. Interest and other outgoings less income receivable are charged to the income statementduring development, except in respect of properties where the development period is extensive, when suchamounts are included in cost.
F-12
www.global-reports.com
DP World Limited (formerly Galaxy Investments Limited) and its Subsidiaries
Notes (Continued)
3 Significant accounting policies (Continued)
(f) Goodwill
Goodwill arises on the acquisition of subsidiaries, associates and joint ventures. Goodwill represents theexcess of the cost of the acquisition over the Group’s interest in the net fair value of the identifiable assets,liabilities and contingent liabilities of the acquiree. When the excess is negative (including negativegoodwill), it is recognized immediately in income statement.
Acquisitions of minority interest
Goodwill arising on the acquisition of a minority interest in a subsidiary represents the excess of the cost ofthe additional investment over the carrying amount of the net assets acquired at the date of exchange.
Subsequent measurement
Goodwill is measured at cost less accumulated impairment losses. In respect of equity accounted investees,the carrying amount of goodwill is included in the carrying amount of the investment.
(g) Intangible assets
Intangible assets acquired separately are measured on initial recognition at cost. The cost of intangibleassets acquired in a business combination is the fair value as at the date of acquisition. Following initialrecognition, intangible assets are carried at cost less any accumulated amortisation and any accumulatedimpairment losses. Internally generated intangible assets, excluding capitalised development costs, are notcapitalised and expenditure is charged against profits in the year in which the expenditure is incurred. Theuseful lives of intangible assets are assessed to be either finite or indefinite. Intangible assets with finitelives are amortised over the useful economic life and assessed for impairment whenever there is anindication that the intangible asset may be impaired. The amortisation period and amortisation method foran intangible asset with a finite useful life is reviewed at least at each financial year-end. Changes in theexpected useful life or the expected pattern of consumption of future economic benefits embodied in theassets are accounted for by changing the amortisation period or method, as appropriate, and treated aschanges in accounting estimates. The amortisation expense on intangible assets with finite useful lives isrecognised in the consolidated statement of income in the expense category consistent with the function ofthe intangible asset.
Intangible assets with indefinite useful lives are tested for impairment annually either individually or at thecash-generating unit level. Such intangibles are not amortised. The useful life of an intangible asset with anindefinite life is reviewed annually to determine whether indefinite life assessment continues to besupportable. If not, the change in the useful life assessment from indefinite to finite is made on aprospective basis.
Gains or losses arising from derecognition of an intangible asset are measured as the difference betweenthe net disposal proceeds and the carrying amount of the asset and are recognised in the income statementwhen the asset is derecognised.
The estimated useful lives for intangible assets are for a period of 9 - 82 years.
(h) Inventories
Inventories are measured at cost and net realisable value. Inventories mainly consist of spare parts andconsumables. The cost of consumables is based on weighted average method and includes expenditureincurred in acquiring inventories and bringing them to their existing location and condition.
(i) Leased assets
Leases in terms of which the Group assumes substantially all the risks and rewards of ownership areclassified as finance leases. Upon initial recognition the leased assets is measured at an amount equal tothe lower of its fair value and the present value of the minimum lease payments. Subsequent to initialrecognition, the asset is accounted for in accordance with the accounting policy applicable to that asset.Capitalised leased assets are depreciated over the shorter of the estimated useful life of the asset and thelease term, if there is no reasonable certainty that the Group will obtain ownership by the end of the leaseterm.
F-13
DP World Limited (formerly Galaxy Investments Limited) and its Subsidiaries
Notes (Continued)
3 Significant accounting policies (Continued)
The Group has adopted IFRIC 4, ‘Determining whether an Arrangement Contains a Lease’. Thedetermination of whether an arrangement is, or contains, a lease is based on the substance of thearrangement at inception date and requires an assessment of whether the fulfilment of the arrangement isdependent on the use of a specific asset or assets or the arrangement conveys a right to use the asset. Areassessment is made after inception of the lease only if one of the following applies:
a) there is a change in contractual terms, other than a renewal or extension of the arrangement;
b) a renewal option is exercised or extension granted, unless the term of the renewal or extensionwas initially included in the lease term;
c) there is a change in the determination of whether fulfilment is dependent on a specified asset; or
d) there is a substantial change to the asset.
Where a reassessment is made, lease accounting commences or ceases from the date when the change incircumstances gave rise to the reassessment for scenarios a), c) or d) and at the date of renewal orextension period for scenario b).
(j) Leases
(i) Group as a lessee
Payments made under operating leases are recognised in the income statement on a straight-line basis overthe term of the lease. Lease incentives received are recognised as an integral part of the total leaseexpense, over the term of the lease.
Minimum lease payment made under finance leases are apportioned between the finance expense and thereduction of the outstanding liability. The finance expense is allocated to each period during the lease termso as to produce a constant periodic rate of interest on the remaining balance of the liability. Contingentpayments are accounted for by revising the minimum lease payments over the remaining term of the leasewhen the lease adjustment is confirmed.
(ii) Group as a lessor
Leases where the Group retains substantially all the risks and benefits of ownership of the asset areclassified as operating leases. Initial direct costs incurred in negotiating an operating lease are added to thecarrying amount of the leased asset and recognised over the lease term on the same basis as rental income.
(iii) Leasing and sub-leasing transactions
A series of leasing and sub-leasing transactions between the Group and third parties, which are closelyinterrelated, negotiated as a single transaction, and take place concurrently or in a continuous sequenceare considered linked and accounted for as one transaction when the overall economic effect cannot beunderstood without reference to the series of transactions as a whole.
These leasing and sub-leasing transactions are designed to achieve certain benefits for the third parties inoverseas locations in return for a cash benefit to the Group. Such cash benefit is accounted in the incomestatement based on its economic substance.
Under these leasing and sub-leasing transactions, current and non-current liabilities have been defeased bythe loan receivable and the placement of deposits. Those liabilities, receivables and deposits (and incomeand charges arising therefrom) are netted off in the consolidated financial statements, in order to reflectthe overall commercial effect of the arrangement.
F-14
www.global-reports.com

DP World Limited (formerly Galaxy Investments Limited) and its Subsidiaries
Notes (Continued)
3 Significant accounting policies (Continued)
(k) Impairment
(i) Financial assets
A financial asset is considered to be impaired if objective evidence indicates that one or more events havehad a negative effect on the estimate future cash flows of that assets.
An impairment loss in respect of a financial asset measured at amortised cost is calculated as thedifference between its carrying amount, and the present value of the estimated future cash flowsdiscounted at the original effective interest rate. An impairment loss in respect of an available-for-salefinancial asset is calculated by reference to its current fair value.
Individually significant financial assets are tested for impairment on an individual basis. The remainingfinancial assets are assessed collectively in groups that share similar credit risk characteristics.
All impairment losses are recognised in the income statement. Any cumulative loss is respect of anavailable-for-sale financial asset recognised previously in equity is transferred to the income statement.
An impairment loss is reversed if the reversal can be related objectively to an event occurring after theimpairment loss was recognised. For financial assets measured at amortised cost, the reversal is recognisedin the income statement.
(ii) Non-financial assets
The carrying amounts of the Group’s non-financial assets, other than inventories and deferred tax assetsare reviewed annually or more frequently if events or changes in circumstances indicate that the carryingvalue may be impaired. If any such indication exists then the asset’s recoverable amount is estimated. Forgoodwill and intangible assets that have indefinite lives or that are not yet available for use, recoverableamount is also estimated annually. An impairment loss is recognised if the carrying amount of an asset orits cash-generating unit exceeds its recoverable amount. A cash-generating unit is the smallest identifiableasset group that generates cash flows that largely are independent from other assets and groups.Impairment losses are recognised in the income statement. Impairment losses recognised in respect ofcash-generating units are allocated first to reduce the carrying amount of any goodwill allocated to theunits and then to reduce the carrying amount of the other assets in the unit (group of units) on a pro ratabasis.
The recoverable amount of an asset or cash-generating unit is the greater of its value in use and its fairvalue less costs to sell. In assessing value in use, the estimated future cash flows are discounted to theirpresent value using a pre-tax discount rate that reflects current market assessments of the time value ofmoney and the risks specific to the asset.
An impairment loss in respect of goodwill is not reversed. In respect of other assets, impairment lossesrecognised in prior periods are assessed at each reporting date for any indications that the loss hasdecreased or no longer exists. An impairment loss is reversed if there has been a change in the estimatesused to determine the recoverable amount. An impairment loss is reversed only to the extent that theasset’s carrying amount does not exceed the carrying amount that would have been determined, net ofdepreciation or amortisation, if no impairment loss had been recognised.
(l) Non-current assets held for sale
Non-current assets (or disposal groups comprising assets and liabilities) that are expected to be recoveredprimarily through sale rather than through continuing use are classified as held for sale. Immediatelybefore classification as held for sale, the assets (or components of a disposal group) are remeasured inaccordance with the Group’s accounting policies. Thereafter generally the assets (or disposal group) aremeasured at the lower of their carrying amount and fair value less cost to sell. Any impairment loss on adisposal group first is allocated to goodwill, and then to remaining assets and liabilities on pro rata basis,except that no loss is allocated to inventories, financial assets, deferred tax assets and employee benefitassets which continue to be measured in accordance with the Group’s accounting policies. Impairment
F-15
DP World Limited (formerly Galaxy Investments Limited) and its Subsidiaries
Notes (Continued)
3 Significant accounting policies (Continued)
losses on initial classification as held for sale and subsequent gains or losses on remeasurement arerecognised in the income statement. Gains are not recognised in excess of any cumulative impairment loss.
(m) Employee benefits
(i) UAE Region
The Group provides end of service benefits to its expatriate employees in the United Arab Emirates. Theentitlement to these benefits is based upon the employees’ basic salary and length of service, subject to thecompletion of a minimum service period. The expected costs of these benefits are accrued over the periodof employment.
With respect to its UAE national employees, the Group makes a provision for contributions to be made tothe UAE Pension Authority calculated as a percentage of the employees’ salaries. The Group’s obligationsare limited to these contributions, which are expensed when due.
(ii) Outside UAE Region
The Group’s net obligation in respect of defined benefit pension plans is calculated separately for eachplan by estimating the amount of future benefit that employees have earned in return for their service inthe current and prior periods. That benefit is discounted to determine the present value, and the fair valueof any plan assets is deducted. The calculation is performed by a qualified actuary using the projected unitcredit method. The discount rate is the yield at the balance sheet date on AA credit rated bonds or localequivalent that have maturity dates approximating to the terms of the Group’s obligations.
When the benefits of a plan are improved, the portion of the increased benefit relating to past service byemployees is recognised as an expense in the income statement on a straight line basis over the averageperiod until the benefits become vested. To the extent that the benefits vest immediately, the expense isrecognised immediately in the income statement.
Actuarial gains and losses that arise in calculating the Group’s obligation in respect of a plan arerecognised in the period in which they arise directly in the statement of recognised income and expenses.The cost of providing benefits under the defined benefit plans is determined separately for each plan usingthe projected unit credit method, which attributes entitlement to benefits to the current period (todetermine current service cost) and to the current and prior periods (to determine the present value ofdefined benefit obligation) and is based on actuarial advice.
Contributions, including lump sum payments, in respect of defined contribution pension schemes andmulti employer defined benefit schemes where it is not possible to identify the Group’s share of thescheme, are charged to the income statement as they fall due.
(iii) Long term service benefits
The Group’s net obligation in respect of long term service benefits, other than pension plans, is theamount of future benefit that employees have earned in return for their service in the current and priorperiods. The obligation is calculated using the projected unit credit method and is discounted to its presentvalue and the fair value of any related assets is deducted. The discount rate is the yield at the balance sheetdate on AA credit rated bonds (or local equivalent) that have maturity dates approximating to the terms ofthe Group’s obligations.
(n) Provisions
A provision is recognised if, as a result of a past event, the Group has a present legal or constructiveobligation that can be estimated reliably, and it is probable that an outflow of economic benefits will berequired to settle the obligation. Provisions are determined by discounting the expected future cash flowsat a pre-tax rate that reflects current market assessments of the time value of money and the risks specificto the liability.
F-16
www.global-reports.com
DP World Limited (formerly Galaxy Investments Limited) and its Subsidiaries
Notes (Continued)
3 Significant accounting policies (Continued)
(o) Revenue
Revenue comprises amounts derived from the provision of goods and services (excluding VAT and similarsales taxes). Revenue from the provision of services is recognised on the delivery of those services; which,for Ports, is once the relevant throughput has taken place; for Ferries, is on provision of carriage; and forcommercial trucking, cold storage and document processing is recognised when the relevant services havebeen rendered.
Revenue from the provision of goods includes income from the sale of properties held for developmentand sale, which is recognised after contract becomes unconditional and risks and rewards are passed.
(p) Finance income and expense
Finance income comprises interest income on funds invested, changes in the fair value of financial assets atfair value through profit or loss, and gains on hedging instruments that are recognised in incomestatement. Interest income is recognized as it accrues, using the effective interest method.
Finance expenses comprise interest expense on borrowing, unwinding of the discount on provisions,changes in the fair value of financial assets at fair value through profit or loss, impairment lossesrecognised on financial assets, and losses on hedging instruments that are recognised in the incomestatement. All borrowing costs are recognised in income statement using the effective interest method.
(q) Income tax expense
Income tax expense comprises current and deferred tax. Income tax expense is recognised in the incomestatement except to the extent that it relates to items recognised directly in equity, in which case it isrecognised in equity.
Current tax is the expected tax payable on the taxable income for the period, using tax rates enacted orsubstantively enacted at the reporting date, and any adjustment to tax payable in respect of previous years.
Deferred tax is recognised using the balance sheet method, providing for temporary differences betweenthe carrying amounts of assets and liabilities for financial reporting purposes and the amounts used fortaxation purposes. Deferred tax is not recognised for the following temporary differences: the initialrecognition of goodwill, the initial recognition of assets or liabilities in a transaction that is not a businesscombination and that affects neither accounting nor taxable profit, and differences relating to investmentsin subsidiaries and jointly controlled entities to the extent that they probably will not reverse in theforeseeable future. Deferred tax is measured at the tax rates that are expected to be applied to thetemporary differences when they reverse, based on the laws that have been enacted or substantivelyenacted by the reporting date.
A deferred tax asset is recognised to the extent that it is probable that future taxable profits will beavailable against which temporary difference can be utilized. Deferred tax assets are reviewed at eachreporting date and are reduced to the extent that it is no longer probable that the related tax benefit will berealized.
Deferred tax assets and deferred tax liabilities are offset, if a legally enforceable right exists to set offcurrent tax assets against current tax liabilities and the deferred taxes relate to the same taxable entity andthe same taxation authority.
(r) Discontinued operations
A discontinued operation is a component of the Group’s business that represents a separate major line ofbusiness or geographical area of operations that has been disposed or is held for sale, or is a subsidiaryacquired exclusively with a view to resale. Classification as a discontinued operation occurs upon disposalor when the operation meets the criteria to be classified as held for sale, if earlier. When an operation isclassified as a discontinued operation, the comparative income statement is restated as if the operation hadbeen discontinued from the start of the comparative period.
F-17
DP World Limited (formerly Galaxy Investments Limited) and its Subsidiaries
Notes (Continued)
3 Significant accounting policies (Continued)
(s) Segment reporting
A segment is a distinguishable component of the Group that is engaged either in providing relatedproducts or services (business segment), or in providing products or services within a particular economicenvironment (geographical segment), which is subject to risks and rewards that are different from those ofother segments. The Group’s primary format for segment reporting is based on geographical segments.
(t) Separately disclosable items
The Group presents, as separately disclosable items on the face of the income statement, those materialitems of income and expense which, because of the nature and expected infrequency of the events givingrise to them, merit separate presentation to allow users to understand better the elements of financialperformance in the period, so as to facilitate a comparison with prior periods and a better assessment oftrends in financial performance.
New standards and interpretations not yet adopted
A number of new standards, amendments to standards and interpretations are not yet effective for theperiod ended 30 June 2007, and have not been applied in preparing these consolidated financialstatements:
IFRS 7 Financial Instruments: Disclosures and the Amendment to IAS 1 Presentation of FinancialStatements: Capital disclosures require extensive disclosures about the significance of financial instrumentsfor an entity’s financial position and performance, and qualitative and quantitative disclosures on thenature and extent of risks. IFRS 7 and amended IAS 1, which becomes mandatory for the Group’s 2007annual financial statements, will require additional disclosures with respect to the Group’s 2007 financialinstruments and share capital.
IFRS 8 Operating Segments, which will be effective for the year ending 31 December 2009, will result inthe disclosure of certain information about the Group’s operating segments, its products and services, thegeographical areas in which it operates, and its major customers.
IFRIC 10 Interim Financial Reporting and Impairment prohibits the reversal of an impairment lossrecognized in a previous interim period in respect of goodwill, an investment in an equity instrument or afinancial asset carried at cost. IFRIC 10 will become mandatory for the Group’s 2007 annual financialstatements, and will apply to goodwill, investments in equity instruments, and financial assets carried atcost prospectively from the date that the Group first applied the measurement criteria of IAS 36 andIAS 39 respectively.
IFRIC 12 Service Concession Arrangements becomes effective for financial years beginning on or after1 January 2008. This interpretation gives guidance on the accounting by operators for public-to-privateservice concession arrangements.
4 Separately disclosable items
Six monthsended
30 June 2007USD’000
Impairment provision . . . . . . . . . . . . . . . . . . . . . . . . . . . . . . . . . . . . . . . . . . . . . . . . . . (37,900)Income on termination of interest rate swaps . . . . . . . . . . . . . . . . . . . . . . . . . . . . . . . . . 98,125Profit on sale and termination of businesses . . . . . . . . . . . . . . . . . . . . . . . . . . . . . . . . . . 134,208Profit from discontinued operations and sale of discontinued operations (net of tax) . . . . . 620,763Others . . . . . . . . . . . . . . . . . . . . . . . . . . . . . . . . . . . . . . . . . . . . . . . . . . . . . . . . . . . . . (2,000)
813,196
F-18
www.global-reports.com
DP World Limited (formerly Galaxy Investments Limited) and its Subsidiaries
Notes (Continued)
4 Separately disclosable items (Continued)
Impairment provision
The Group has recognised an impairment on software costs of USD 37,900 thousands, as the relatedsoftware project is being discontinued.
Income on termination of interest rates swaps
The Group terminated two interest rate swaps that converted the floating rate interest on the syndicateddebt to a fixed rate. The termination yielded a profit of USD 98,125 thousands.
Profit on sale and termination of businesses
During the period the Group divested or transferred to held for sale its investments in Shekou, Colombo,CSX-Qingdao, AGS Australia and Shanghai Jifa.
Profit from discontinued operations and sale of discontinued operations (net of tax)
During the period the Group disposed of P&O Ports North America (‘‘POPNA’’) and the Ferries divisionwas disposed of to an affiliated company (owned by ‘‘Ports and Free Zone World’’).
5 Income tax expense
The Group’s consolidated effective tax rate in respect of continuing operations for the six months ended 30June 2007 was 12.7% derived from profits of continuing operations after excluding profit on sale andtermination of businesses.
6 Segment information
Based on risks and returns the management consider that the primary reporting format is by geographicalsegment and is based on the location of the Group’s assets and liabilities.
The secondary segment reporting format of the Group is business. The management consider that there isonly one business segment being ports. Therefore, the disclosures for the secondary segment have alreadybeen given in these financial statements.
F-19
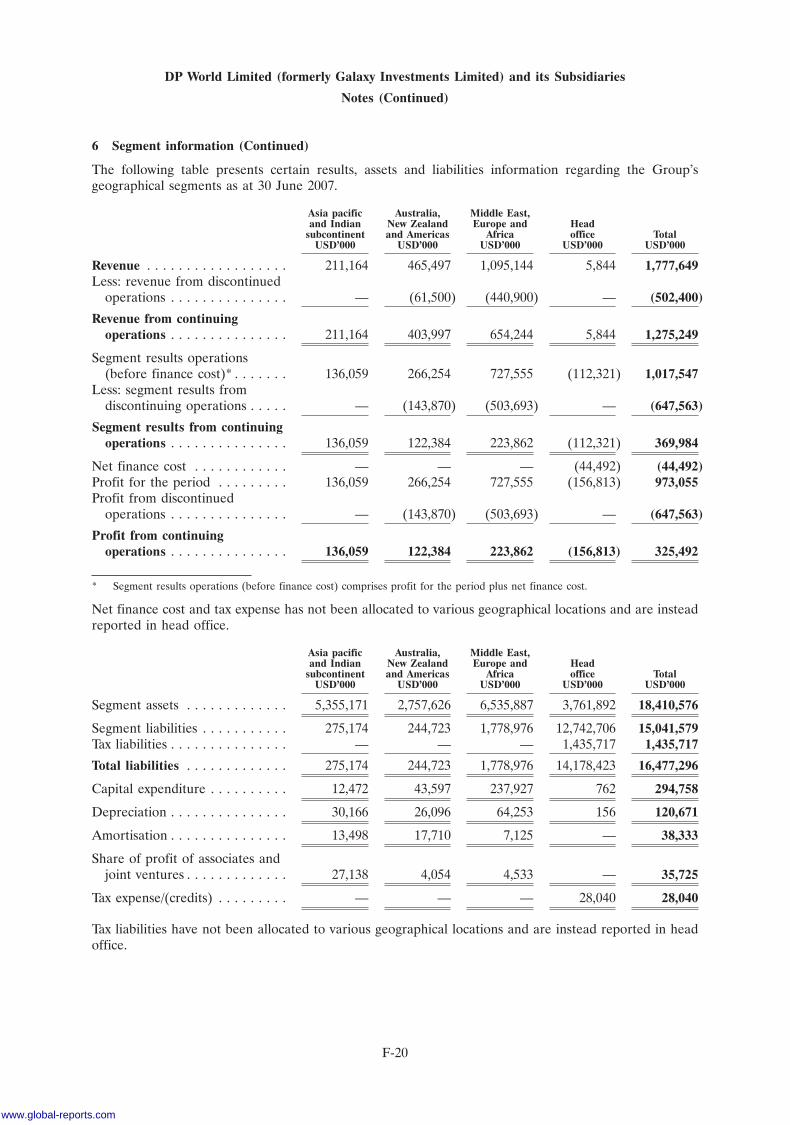
DP World Limited (formerly Galaxy Investments Limited) and its Subsidiaries
Notes (Continued)
6 Segment information (Continued)
The following table presents certain results, assets and liabilities information regarding the Group’sgeographical segments as at 30 June 2007.
Asia pacific Australia, Middle East,and Indian New Zealand Europe and Head
subcontinent and Americas Africa office TotalUSD’000 USD’000 USD’000 USD’000 USD’000
Revenue . . . . . . . . . . . . . . . . . . 211,164 465,497 1,095,144 5,844 1,777,649Less: revenue from discontinued
operations . . . . . . . . . . . . . . . — (61,500) (440,900) — (502,400)
Revenue from continuingoperations . . . . . . . . . . . . . . . 211,164 403,997 654,244 5,844 1,275,249
Segment results operations(before finance cost)* . . . . . . . 136,059 266,254 727,555 (112,321) 1,017,547
Less: segment results fromdiscontinuing operations . . . . . — (143,870) (503,693) — (647,563)
Segment results from continuingoperations . . . . . . . . . . . . . . . 136,059 122,384 223,862 (112,321) 369,984
Net finance cost . . . . . . . . . . . . — — — (44,492) (44,492)Profit for the period . . . . . . . . . 136,059 266,254 727,555 (156,813) 973,055Profit from discontinued
operations . . . . . . . . . . . . . . . — (143,870) (503,693) — (647,563)
Profit from continuingoperations . . . . . . . . . . . . . . . 136,059 122,384 223,862 (156,813) 325,492
* Segment results operations (before finance cost) comprises profit for the period plus net finance cost.
Net finance cost and tax expense has not been allocated to various geographical locations and are insteadreported in head office.
Asia pacific Australia, Middle East,and Indian New Zealand Europe and Head
subcontinent and Americas Africa office TotalUSD’000 USD’000 USD’000 USD’000 USD’000
Segment assets . . . . . . . . . . . . . 5,355,171 2,757,626 6,535,887 3,761,892 18,410,576
Segment liabilities . . . . . . . . . . . 275,174 244,723 1,778,976 12,742,706 15,041,579Tax liabilities . . . . . . . . . . . . . . . — — — 1,435,717 1,435,717
Total liabilities . . . . . . . . . . . . . 275,174 244,723 1,778,976 14,178,423 16,477,296
Capital expenditure . . . . . . . . . . 12,472 43,597 237,927 762 294,758
Depreciation . . . . . . . . . . . . . . . 30,166 26,096 64,253 156 120,671
Amortisation . . . . . . . . . . . . . . . 13,498 17,710 7,125 — 38,333
Share of profit of associates andjoint ventures . . . . . . . . . . . . . 27,138 4,054 4,533 — 35,725
Tax expense/(credits) . . . . . . . . . — — — 28,040 28,040
Tax liabilities have not been allocated to various geographical locations and are instead reported in headoffice.
F-20
www.global-reports.com
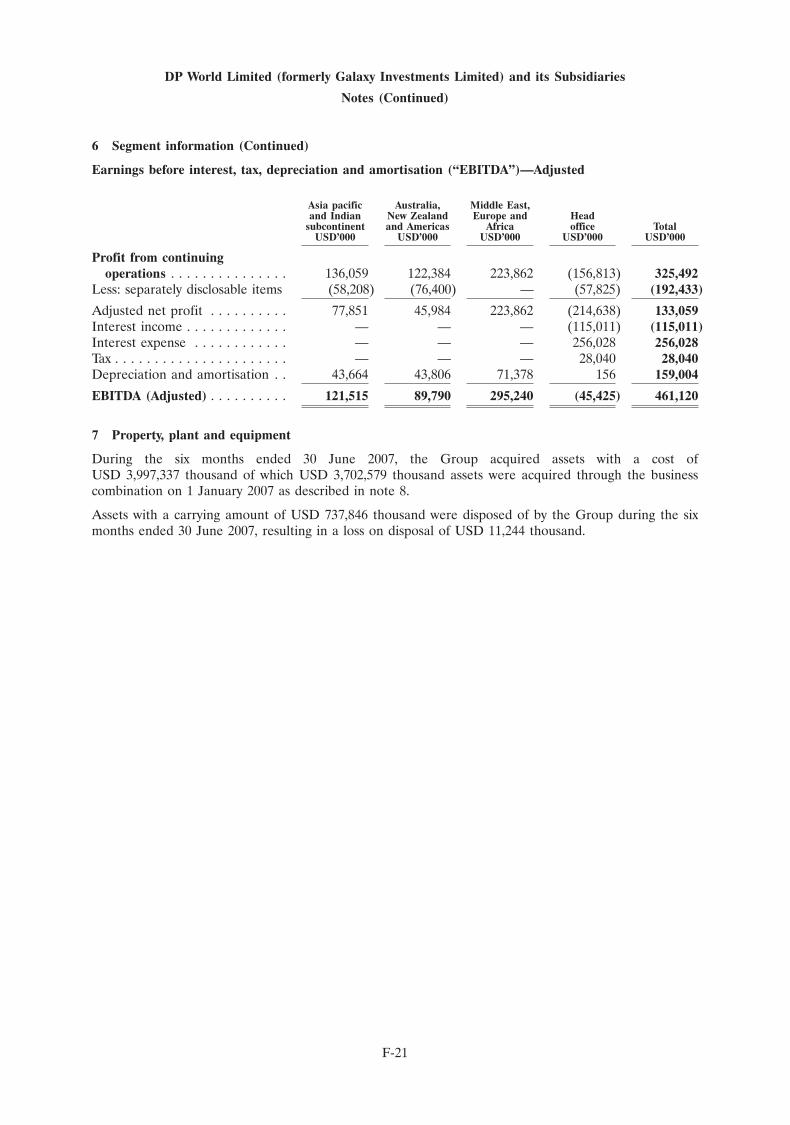
DP World Limited (formerly Galaxy Investments Limited) and its Subsidiaries
Notes (Continued)
6 Segment information (Continued)
Earnings before interest, tax, depreciation and amortisation (‘‘EBITDA’’)—Adjusted
Asia pacific Australia, Middle East,and Indian New Zealand Europe and Head
subcontinent and Americas Africa office TotalUSD’000 USD’000 USD’000 USD’000 USD’000
Profit from continuingoperations . . . . . . . . . . . . . . . 136,059 122,384 223,862 (156,813) 325,492
Less: separately disclosable items (58,208) (76,400) — (57,825) (192,433)
Adjusted net profit . . . . . . . . . . 77,851 45,984 223,862 (214,638) 133,059Interest income . . . . . . . . . . . . . — — — (115,011) (115,011)Interest expense . . . . . . . . . . . . — — — 256,028 256,028Tax . . . . . . . . . . . . . . . . . . . . . . — — — 28,040 28,040Depreciation and amortisation . . 43,664 43,806 71,378 156 159,004
EBITDA (Adjusted) . . . . . . . . . . 121,515 89,790 295,240 (45,425) 461,120
7 Property, plant and equipment
During the six months ended 30 June 2007, the Group acquired assets with a cost ofUSD 3,997,337 thousand of which USD 3,702,579 thousand assets were acquired through the businesscombination on 1 January 2007 as described in note 8.
Assets with a carrying amount of USD 737,846 thousand were disposed of by the Group during the sixmonths ended 30 June 2007, resulting in a loss on disposal of USD 11,244 thousand.
F-21
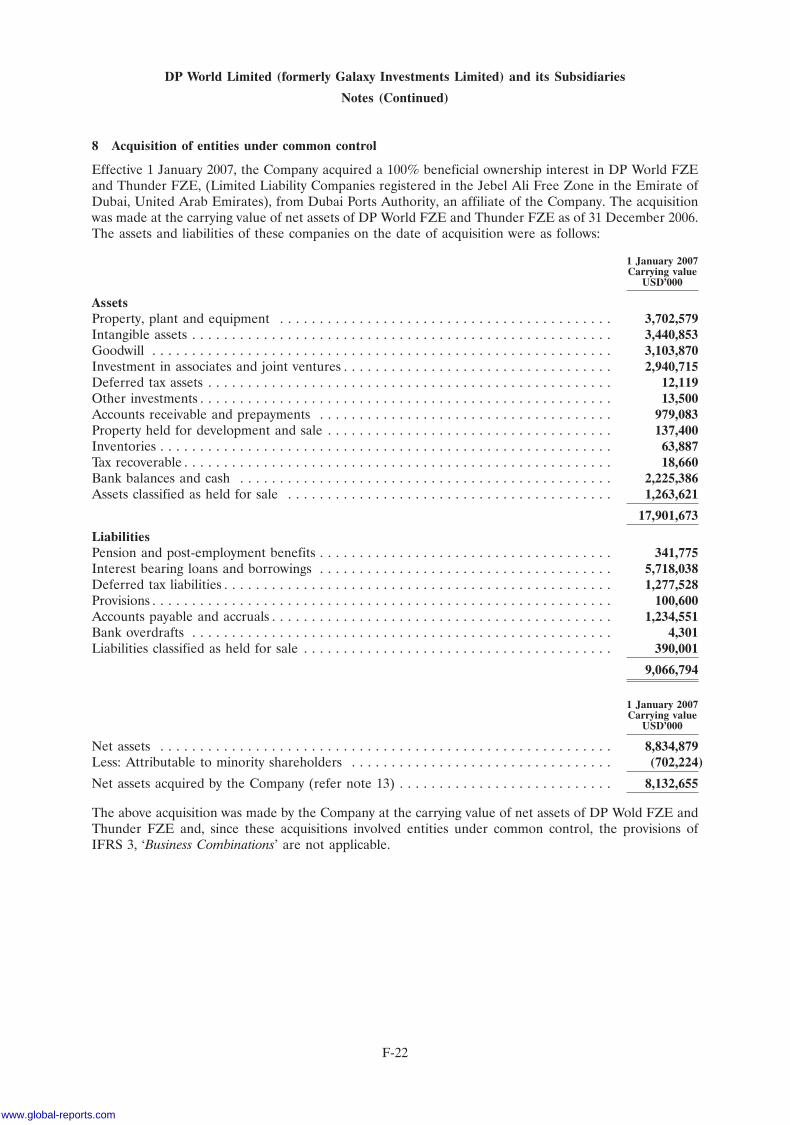
DP World Limited (formerly Galaxy Investments Limited) and its Subsidiaries
Notes (Continued)
8 Acquisition of entities under common control
Effective 1 January 2007, the Company acquired a 100% beneficial ownership interest in DP World FZEand Thunder FZE, (Limited Liability Companies registered in the Jebel Ali Free Zone in the Emirate ofDubai, United Arab Emirates), from Dubai Ports Authority, an affiliate of the Company. The acquisitionwas made at the carrying value of net assets of DP World FZE and Thunder FZE as of 31 December 2006.The assets and liabilities of these companies on the date of acquisition were as follows:
1 January 2007Carrying value
USD’000
AssetsProperty, plant and equipment . . . . . . . . . . . . . . . . . . . . . . . . . . . . . . . . . . . . . . . . . . 3,702,579Intangible assets . . . . . . . . . . . . . . . . . . . . . . . . . . . . . . . . . . . . . . . . . . . . . . . . . . . . . 3,440,853Goodwill . . . . . . . . . . . . . . . . . . . . . . . . . . . . . . . . . . . . . . . . . . . . . . . . . . . . . . . . . . 3,103,870Investment in associates and joint ventures . . . . . . . . . . . . . . . . . . . . . . . . . . . . . . . . . . 2,940,715Deferred tax assets . . . . . . . . . . . . . . . . . . . . . . . . . . . . . . . . . . . . . . . . . . . . . . . . . . . 12,119Other investments . . . . . . . . . . . . . . . . . . . . . . . . . . . . . . . . . . . . . . . . . . . . . . . . . . . . 13,500Accounts receivable and prepayments . . . . . . . . . . . . . . . . . . . . . . . . . . . . . . . . . . . . . 979,083Property held for development and sale . . . . . . . . . . . . . . . . . . . . . . . . . . . . . . . . . . . . 137,400Inventories . . . . . . . . . . . . . . . . . . . . . . . . . . . . . . . . . . . . . . . . . . . . . . . . . . . . . . . . . 63,887Tax recoverable . . . . . . . . . . . . . . . . . . . . . . . . . . . . . . . . . . . . . . . . . . . . . . . . . . . . . . 18,660Bank balances and cash . . . . . . . . . . . . . . . . . . . . . . . . . . . . . . . . . . . . . . . . . . . . . . . 2,225,386Assets classified as held for sale . . . . . . . . . . . . . . . . . . . . . . . . . . . . . . . . . . . . . . . . . 1,263,621
17,901,673
LiabilitiesPension and post-employment benefits . . . . . . . . . . . . . . . . . . . . . . . . . . . . . . . . . . . . . 341,775Interest bearing loans and borrowings . . . . . . . . . . . . . . . . . . . . . . . . . . . . . . . . . . . . . 5,718,038Deferred tax liabilities . . . . . . . . . . . . . . . . . . . . . . . . . . . . . . . . . . . . . . . . . . . . . . . . . 1,277,528Provisions . . . . . . . . . . . . . . . . . . . . . . . . . . . . . . . . . . . . . . . . . . . . . . . . . . . . . . . . . . 100,600Accounts payable and accruals . . . . . . . . . . . . . . . . . . . . . . . . . . . . . . . . . . . . . . . . . . . 1,234,551Bank overdrafts . . . . . . . . . . . . . . . . . . . . . . . . . . . . . . . . . . . . . . . . . . . . . . . . . . . . . 4,301Liabilities classified as held for sale . . . . . . . . . . . . . . . . . . . . . . . . . . . . . . . . . . . . . . . 390,001
9,066,794
1 January 2007Carrying value
USD’000
Net assets . . . . . . . . . . . . . . . . . . . . . . . . . . . . . . . . . . . . . . . . . . . . . . . . . . . . . . . . . 8,834,879Less: Attributable to minority shareholders . . . . . . . . . . . . . . . . . . . . . . . . . . . . . . . . . (702,224)
Net assets acquired by the Company (refer note 13) . . . . . . . . . . . . . . . . . . . . . . . . . . . 8,132,655
The above acquisition was made by the Company at the carrying value of net assets of DP Wold FZE andThunder FZE and, since these acquisitions involved entities under common control, the provisions ofIFRS 3, ‘Business Combinations’ are not applicable.
F-22
www.global-reports.com
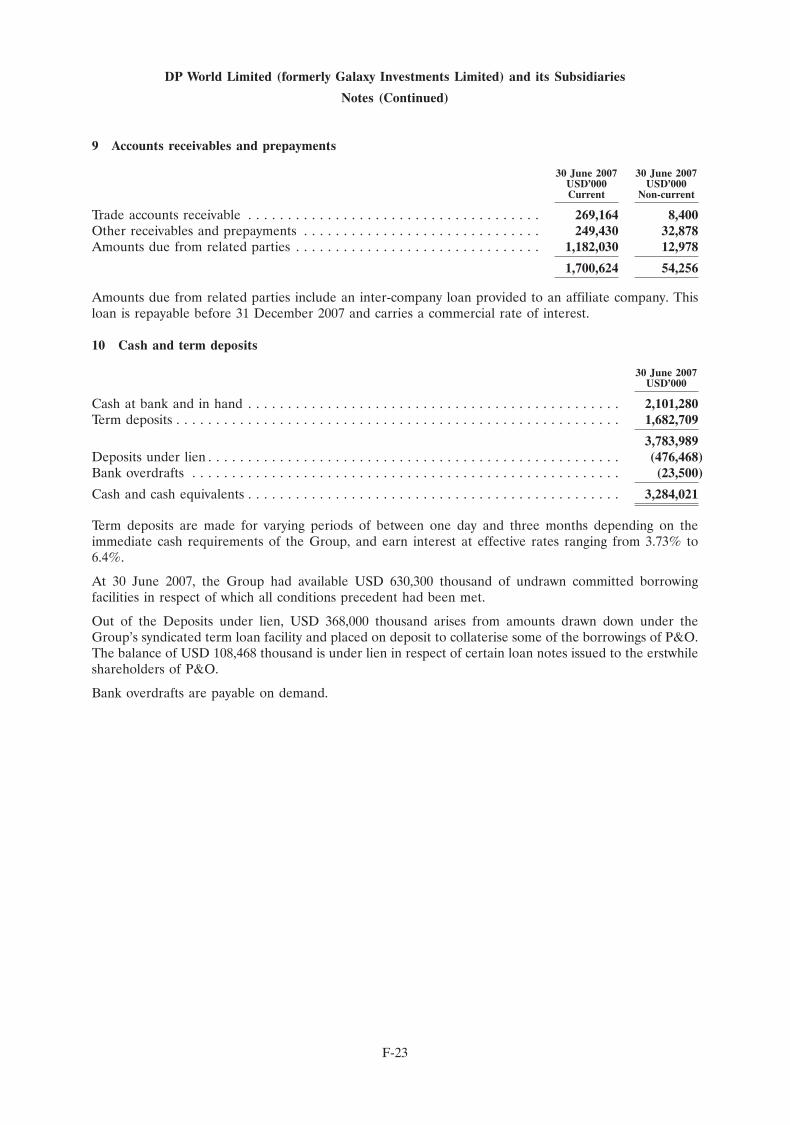
DP World Limited (formerly Galaxy Investments Limited) and its Subsidiaries
Notes (Continued)
9 Accounts receivables and prepayments
30 June 2007 30 June 2007USD’000 USD’000Current Non-current
Trade accounts receivable . . . . . . . . . . . . . . . . . . . . . . . . . . . . . . . . . . . . . 269,164 8,400Other receivables and prepayments . . . . . . . . . . . . . . . . . . . . . . . . . . . . . . 249,430 32,878Amounts due from related parties . . . . . . . . . . . . . . . . . . . . . . . . . . . . . . . 1,182,030 12,978
1,700,624 54,256
Amounts due from related parties include an inter-company loan provided to an affiliate company. Thisloan is repayable before 31 December 2007 and carries a commercial rate of interest.
10 Cash and term deposits
30 June 2007USD’000
Cash at bank and in hand . . . . . . . . . . . . . . . . . . . . . . . . . . . . . . . . . . . . . . . . . . . . . . . 2,101,280Term deposits . . . . . . . . . . . . . . . . . . . . . . . . . . . . . . . . . . . . . . . . . . . . . . . . . . . . . . . . 1,682,709
3,783,989Deposits under lien . . . . . . . . . . . . . . . . . . . . . . . . . . . . . . . . . . . . . . . . . . . . . . . . . . . . (476,468)Bank overdrafts . . . . . . . . . . . . . . . . . . . . . . . . . . . . . . . . . . . . . . . . . . . . . . . . . . . . . . (23,500)
Cash and cash equivalents . . . . . . . . . . . . . . . . . . . . . . . . . . . . . . . . . . . . . . . . . . . . . . . 3,284,021
Term deposits are made for varying periods of between one day and three months depending on theimmediate cash requirements of the Group, and earn interest at effective rates ranging from 3.73% to6.4%.
At 30 June 2007, the Group had available USD 630,300 thousand of undrawn committed borrowingfacilities in respect of which all conditions precedent had been met.
Out of the Deposits under lien, USD 368,000 thousand arises from amounts drawn down under theGroup’s syndicated term loan facility and placed on deposit to collaterise some of the borrowings of P&O.The balance of USD 108,468 thousand is under lien in respect of certain loan notes issued to the erstwhileshareholders of P&O.
Bank overdrafts are payable on demand.
F-23
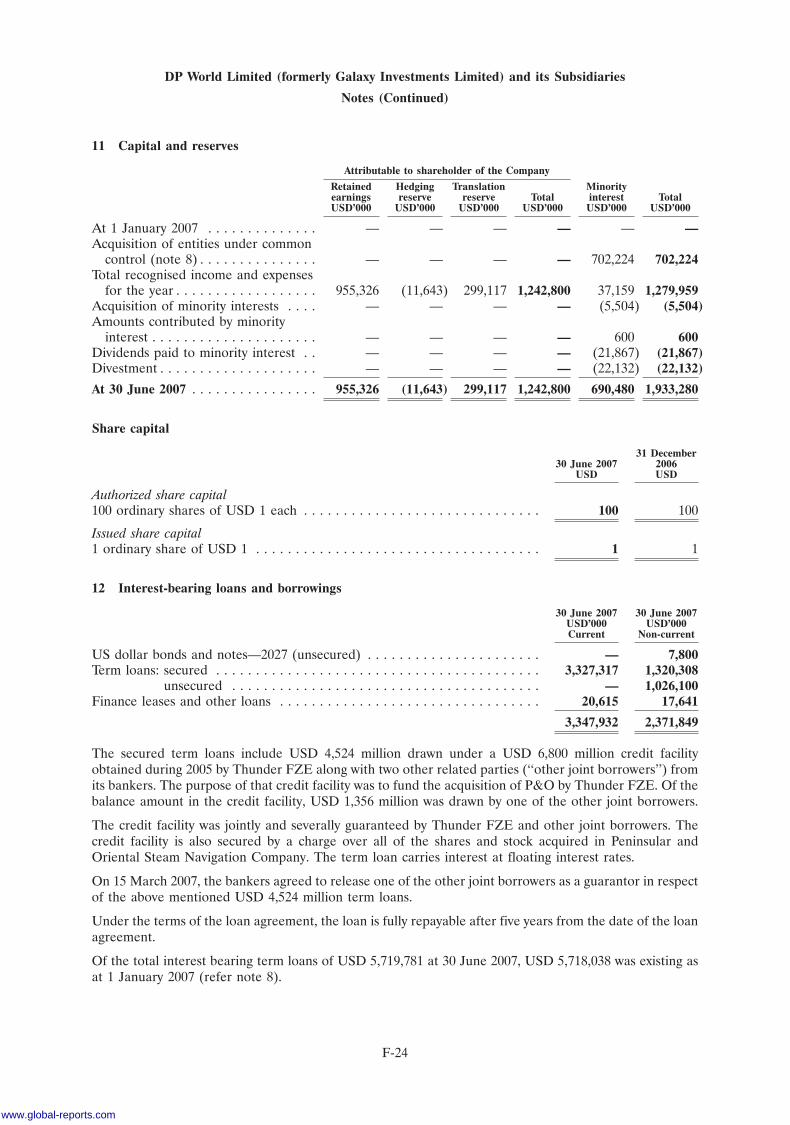
DP World Limited (formerly Galaxy Investments Limited) and its Subsidiaries
Notes (Continued)
11 Capital and reserves
Attributable to shareholder of the Company
Retained Hedging Translation Minorityearnings reserve reserve Total interest TotalUSD’000 USD’000 USD’000 USD’000 USD’000 USD’000
At 1 January 2007 . . . . . . . . . . . . . . — — — — — —Acquisition of entities under common
control (note 8) . . . . . . . . . . . . . . . — — — — 702,224 702,224Total recognised income and expenses
for the year . . . . . . . . . . . . . . . . . . 955,326 (11,643) 299,117 1,242,800 37,159 1,279,959Acquisition of minority interests . . . . — — — — (5,504) (5,504)Amounts contributed by minority
interest . . . . . . . . . . . . . . . . . . . . . — — — — 600 600Dividends paid to minority interest . . — — — — (21,867) (21,867)Divestment . . . . . . . . . . . . . . . . . . . . — — — — (22,132) (22,132)
At 30 June 2007 . . . . . . . . . . . . . . . . 955,326 (11,643) 299,117 1,242,800 690,480 1,933,280
Share capital
31 December30 June 2007 2006
USD USD
Authorized share capital100 ordinary shares of USD 1 each . . . . . . . . . . . . . . . . . . . . . . . . . . . . . . 100 100
Issued share capital1 ordinary share of USD 1 . . . . . . . . . . . . . . . . . . . . . . . . . . . . . . . . . . . . 1 1
12 Interest-bearing loans and borrowings
30 June 2007 30 June 2007USD’000 USD’000Current Non-current
US dollar bonds and notes—2027 (unsecured) . . . . . . . . . . . . . . . . . . . . . . — 7,800Term loans: secured . . . . . . . . . . . . . . . . . . . . . . . . . . . . . . . . . . . . . . . . . 3,327,317 1,320,308
unsecured . . . . . . . . . . . . . . . . . . . . . . . . . . . . . . . . . . . . . . . — 1,026,100Finance leases and other loans . . . . . . . . . . . . . . . . . . . . . . . . . . . . . . . . . 20,615 17,641
3,347,932 2,371,849
The secured term loans include USD 4,524 million drawn under a USD 6,800 million credit facilityobtained during 2005 by Thunder FZE along with two other related parties (‘‘other joint borrowers’’) fromits bankers. The purpose of that credit facility was to fund the acquisition of P&O by Thunder FZE. Of thebalance amount in the credit facility, USD 1,356 million was drawn by one of the other joint borrowers.
The credit facility was jointly and severally guaranteed by Thunder FZE and other joint borrowers. Thecredit facility is also secured by a charge over all of the shares and stock acquired in Peninsular andOriental Steam Navigation Company. The term loan carries interest at floating interest rates.
On 15 March 2007, the bankers agreed to release one of the other joint borrowers as a guarantor in respectof the above mentioned USD 4,524 million term loans.
Under the terms of the loan agreement, the loan is fully repayable after five years from the date of the loanagreement.
Of the total interest bearing term loans of USD 5,719,781 at 30 June 2007, USD 5,718,038 was existing asat 1 January 2007 (refer note 8).
F-24
www.global-reports.com
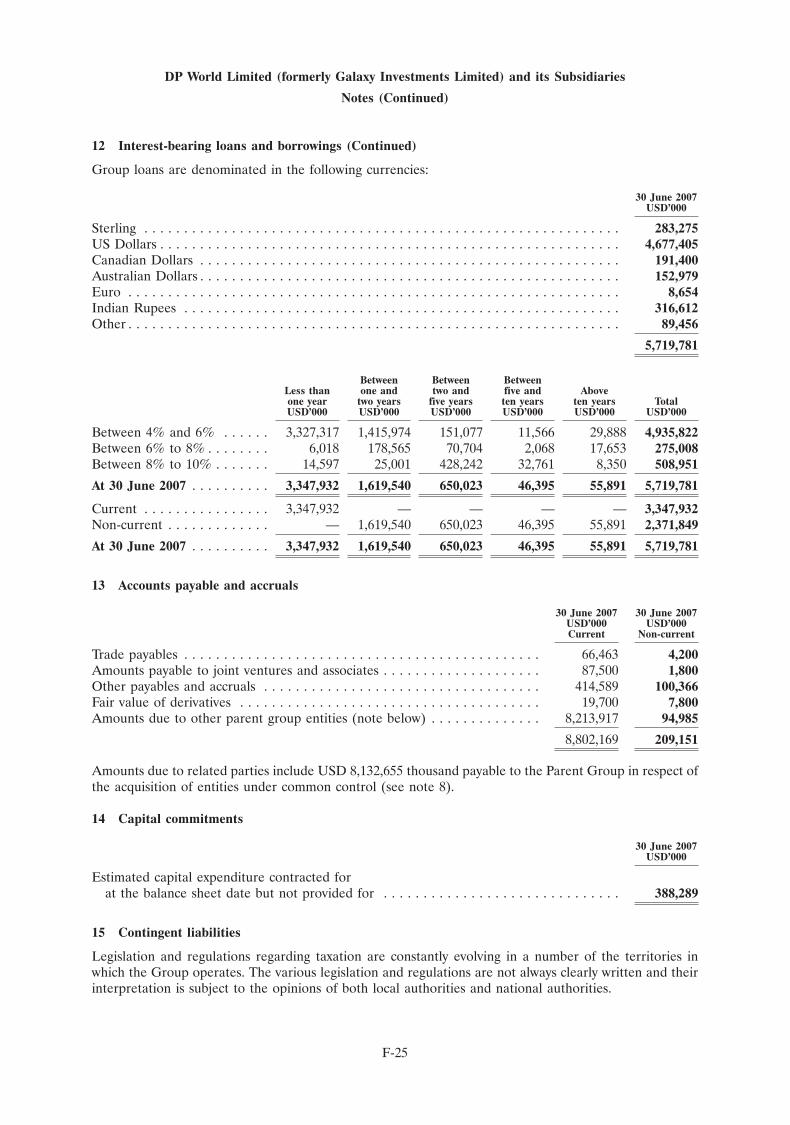
DP World Limited (formerly Galaxy Investments Limited) and its Subsidiaries
Notes (Continued)
12 Interest-bearing loans and borrowings (Continued)
Group loans are denominated in the following currencies:
30 June 2007USD’000
Sterling . . . . . . . . . . . . . . . . . . . . . . . . . . . . . . . . . . . . . . . . . . . . . . . . . . . . . . . . . . . . 283,275US Dollars . . . . . . . . . . . . . . . . . . . . . . . . . . . . . . . . . . . . . . . . . . . . . . . . . . . . . . . . . . 4,677,405Canadian Dollars . . . . . . . . . . . . . . . . . . . . . . . . . . . . . . . . . . . . . . . . . . . . . . . . . . . . . 191,400Australian Dollars . . . . . . . . . . . . . . . . . . . . . . . . . . . . . . . . . . . . . . . . . . . . . . . . . . . . . 152,979Euro . . . . . . . . . . . . . . . . . . . . . . . . . . . . . . . . . . . . . . . . . . . . . . . . . . . . . . . . . . . . . . 8,654Indian Rupees . . . . . . . . . . . . . . . . . . . . . . . . . . . . . . . . . . . . . . . . . . . . . . . . . . . . . . . 316,612Other . . . . . . . . . . . . . . . . . . . . . . . . . . . . . . . . . . . . . . . . . . . . . . . . . . . . . . . . . . . . . . 89,456
5,719,781
Between Between BetweenLess than one and two and five and Aboveone year two years five years ten years ten years TotalUSD’000 USD’000 USD’000 USD’000 USD’000 USD’000
Between 4% and 6% . . . . . . 3,327,317 1,415,974 151,077 11,566 29,888 4,935,822Between 6% to 8% . . . . . . . . 6,018 178,565 70,704 2,068 17,653 275,008Between 8% to 10% . . . . . . . 14,597 25,001 428,242 32,761 8,350 508,951
At 30 June 2007 . . . . . . . . . . 3,347,932 1,619,540 650,023 46,395 55,891 5,719,781
Current . . . . . . . . . . . . . . . . 3,347,932 — — — — 3,347,932Non-current . . . . . . . . . . . . . — 1,619,540 650,023 46,395 55,891 2,371,849
At 30 June 2007 . . . . . . . . . . 3,347,932 1,619,540 650,023 46,395 55,891 5,719,781
13 Accounts payable and accruals
30 June 2007 30 June 2007USD’000 USD’000Current Non-current
Trade payables . . . . . . . . . . . . . . . . . . . . . . . . . . . . . . . . . . . . . . . . . . . . . 66,463 4,200Amounts payable to joint ventures and associates . . . . . . . . . . . . . . . . . . . . 87,500 1,800Other payables and accruals . . . . . . . . . . . . . . . . . . . . . . . . . . . . . . . . . . . 414,589 100,366Fair value of derivatives . . . . . . . . . . . . . . . . . . . . . . . . . . . . . . . . . . . . . . 19,700 7,800Amounts due to other parent group entities (note below) . . . . . . . . . . . . . . 8,213,917 94,985
8,802,169 209,151
Amounts due to related parties include USD 8,132,655 thousand payable to the Parent Group in respect ofthe acquisition of entities under common control (see note 8).
14 Capital commitments
30 June 2007USD’000
Estimated capital expenditure contracted forat the balance sheet date but not provided for . . . . . . . . . . . . . . . . . . . . . . . . . . . . . . 388,289
15 Contingent liabilities
Legislation and regulations regarding taxation are constantly evolving in a number of the territories inwhich the Group operates. The various legislation and regulations are not always clearly written and theirinterpretation is subject to the opinions of both local authorities and national authorities.
F-25
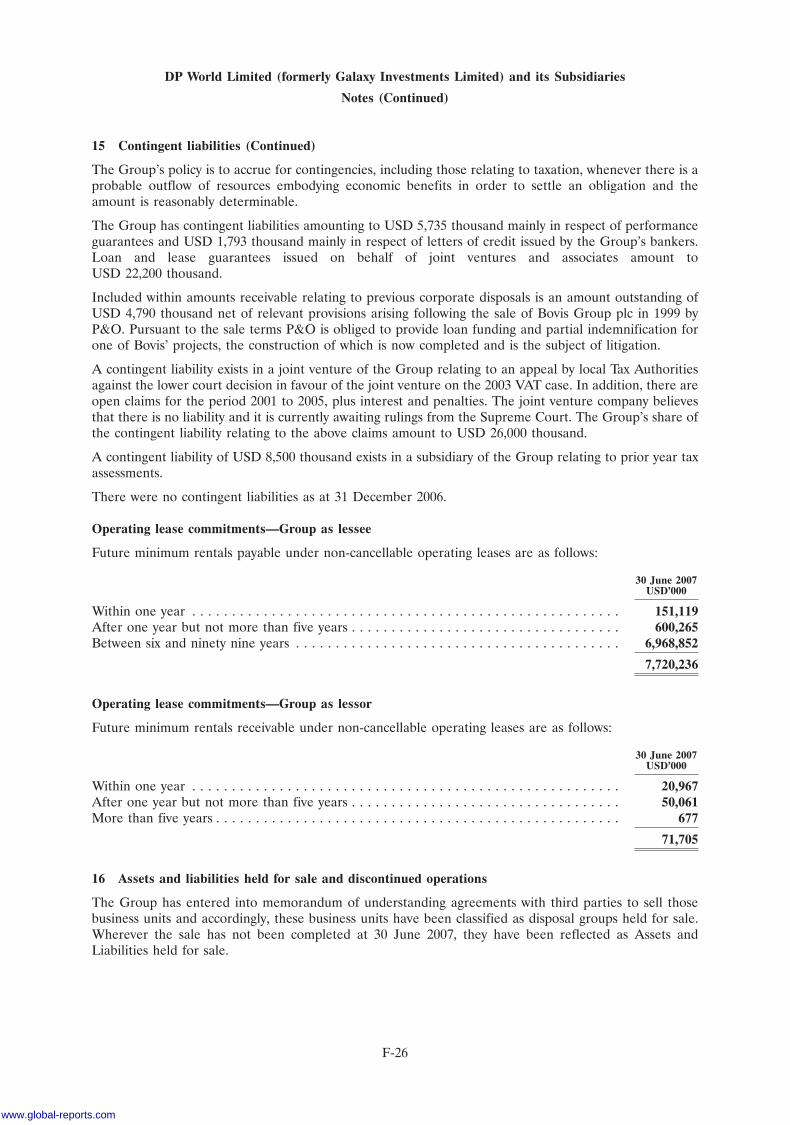
DP World Limited (formerly Galaxy Investments Limited) and its Subsidiaries
Notes (Continued)
15 Contingent liabilities (Continued)
The Group’s policy is to accrue for contingencies, including those relating to taxation, whenever there is aprobable outflow of resources embodying economic benefits in order to settle an obligation and theamount is reasonably determinable.
The Group has contingent liabilities amounting to USD 5,735 thousand mainly in respect of performanceguarantees and USD 1,793 thousand mainly in respect of letters of credit issued by the Group’s bankers.Loan and lease guarantees issued on behalf of joint ventures and associates amount toUSD 22,200 thousand.
Included within amounts receivable relating to previous corporate disposals is an amount outstanding ofUSD 4,790 thousand net of relevant provisions arising following the sale of Bovis Group plc in 1999 byP&O. Pursuant to the sale terms P&O is obliged to provide loan funding and partial indemnification forone of Bovis’ projects, the construction of which is now completed and is the subject of litigation.
A contingent liability exists in a joint venture of the Group relating to an appeal by local Tax Authoritiesagainst the lower court decision in favour of the joint venture on the 2003 VAT case. In addition, there areopen claims for the period 2001 to 2005, plus interest and penalties. The joint venture company believesthat there is no liability and it is currently awaiting rulings from the Supreme Court. The Group’s share ofthe contingent liability relating to the above claims amount to USD 26,000 thousand.
A contingent liability of USD 8,500 thousand exists in a subsidiary of the Group relating to prior year taxassessments.
There were no contingent liabilities as at 31 December 2006.
Operating lease commitments—Group as lessee
Future minimum rentals payable under non-cancellable operating leases are as follows:
30 June 2007USD’000
Within one year . . . . . . . . . . . . . . . . . . . . . . . . . . . . . . . . . . . . . . . . . . . . . . . . . . . . . . 151,119After one year but not more than five years . . . . . . . . . . . . . . . . . . . . . . . . . . . . . . . . . . 600,265Between six and ninety nine years . . . . . . . . . . . . . . . . . . . . . . . . . . . . . . . . . . . . . . . . . 6,968,852
7,720,236
Operating lease commitments—Group as lessor
Future minimum rentals receivable under non-cancellable operating leases are as follows:
30 June 2007USD’000
Within one year . . . . . . . . . . . . . . . . . . . . . . . . . . . . . . . . . . . . . . . . . . . . . . . . . . . . . . 20,967After one year but not more than five years . . . . . . . . . . . . . . . . . . . . . . . . . . . . . . . . . . 50,061More than five years . . . . . . . . . . . . . . . . . . . . . . . . . . . . . . . . . . . . . . . . . . . . . . . . . . . 677
71,705
16 Assets and liabilities held for sale and discontinued operations
The Group has entered into memorandum of understanding agreements with third parties to sell thosebusiness units and accordingly, these business units have been classified as disposal groups held for sale.Wherever the sale has not been completed at 30 June 2007, they have been reflected as Assets andLiabilities held for sale.
F-26
www.global-reports.com
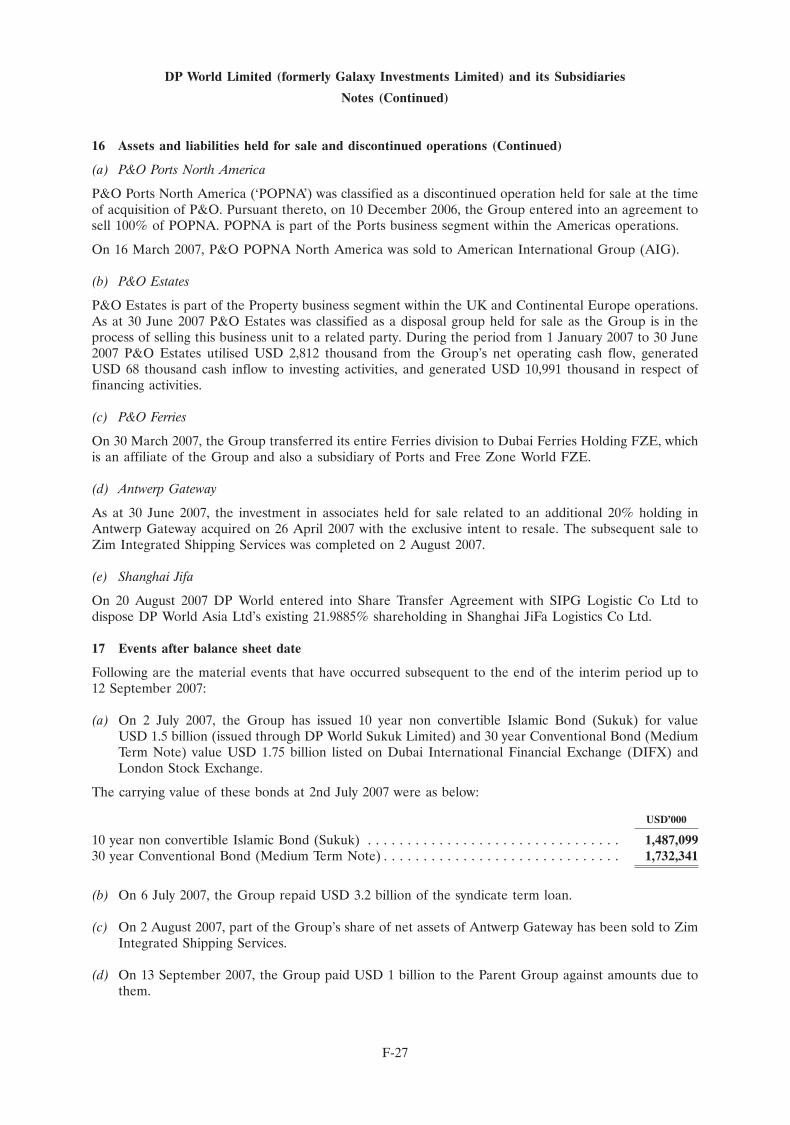
DP World Limited (formerly Galaxy Investments Limited) and its Subsidiaries
Notes (Continued)
16 Assets and liabilities held for sale and discontinued operations (Continued)
(a) P&O Ports North America
P&O Ports North America (‘POPNA’) was classified as a discontinued operation held for sale at the timeof acquisition of P&O. Pursuant thereto, on 10 December 2006, the Group entered into an agreement tosell 100% of POPNA. POPNA is part of the Ports business segment within the Americas operations.
On 16 March 2007, P&O POPNA North America was sold to American International Group (AIG).
(b) P&O Estates
P&O Estates is part of the Property business segment within the UK and Continental Europe operations.As at 30 June 2007 P&O Estates was classified as a disposal group held for sale as the Group is in theprocess of selling this business unit to a related party. During the period from 1 January 2007 to 30 June2007 P&O Estates utilised USD 2,812 thousand from the Group’s net operating cash flow, generatedUSD 68 thousand cash inflow to investing activities, and generated USD 10,991 thousand in respect offinancing activities.
(c) P&O Ferries
On 30 March 2007, the Group transferred its entire Ferries division to Dubai Ferries Holding FZE, whichis an affiliate of the Group and also a subsidiary of Ports and Free Zone World FZE.
(d) Antwerp Gateway
As at 30 June 2007, the investment in associates held for sale related to an additional 20% holding inAntwerp Gateway acquired on 26 April 2007 with the exclusive intent to resale. The subsequent sale toZim Integrated Shipping Services was completed on 2 August 2007.
(e) Shanghai Jifa
On 20 August 2007 DP World entered into Share Transfer Agreement with SIPG Logistic Co Ltd todispose DP World Asia Ltd’s existing 21.9885% shareholding in Shanghai JiFa Logistics Co Ltd.
17 Events after balance sheet date
Following are the material events that have occurred subsequent to the end of the interim period up to12 September 2007:
(a) On 2 July 2007, the Group has issued 10 year non convertible Islamic Bond (Sukuk) for valueUSD 1.5 billion (issued through DP World Sukuk Limited) and 30 year Conventional Bond (MediumTerm Note) value USD 1.75 billion listed on Dubai International Financial Exchange (DIFX) andLondon Stock Exchange.
The carrying value of these bonds at 2nd July 2007 were as below:
USD’000
10 year non convertible Islamic Bond (Sukuk) . . . . . . . . . . . . . . . . . . . . . . . . . . . . . . . . 1,487,09930 year Conventional Bond (Medium Term Note) . . . . . . . . . . . . . . . . . . . . . . . . . . . . . . 1,732,341
(b) On 6 July 2007, the Group repaid USD 3.2 billion of the syndicate term loan.
(c) On 2 August 2007, part of the Group’s share of net assets of Antwerp Gateway has been sold to ZimIntegrated Shipping Services.
(d) On 13 September 2007, the Group paid USD 1 billion to the Parent Group against amounts due tothem.
F-27
REVIEW REPORT TO THE OWNER OFDUBAI PORTS AUTHORITY AND ITS SUBSIDIARIES
We have reviewed the accompanying consolidated balance sheet of Dubai Ports Authority (the‘‘Authority’’) and its subsidiaries (together the ‘‘Group’’) at 30 June 2006, and the related consolidatedstatements of income, recognised income and expense, cash flows for the six month period then ended andexplanatory notes. These consolidated interim condensed financial statements are the responsibility of theGroup’s management. Our responsibility is to issue a report on these consolidated interim condensedfinancial statements based on our review.
We conducted our review in accordance with the International Standard on Review Engagements 2400.This Standard requires that we plan and perform the review to obtain moderate assurance as to whetherthe consolidated interim condensed financial statements are free of material misstatement. A review islimited primarily to inquiries of Group personnel and analytical procedures applied to financial data, andthus provides less assurance than an audit. We have not performed an audit and, accordingly, we do notexpress an audit opinion.
Based on our review, nothing has come to our attention that causes us to believe that the accompanyingconsolidated interim condensed financial statements are not prepared, in all material respects, inaccordance with International Financial Reporting Standard 34.
/s/ Ernst & Young
Signed byEdward B QuinlanPartnerRegistration No. 93
20 August 2007
Dubai
F-28
www.global-reports.com
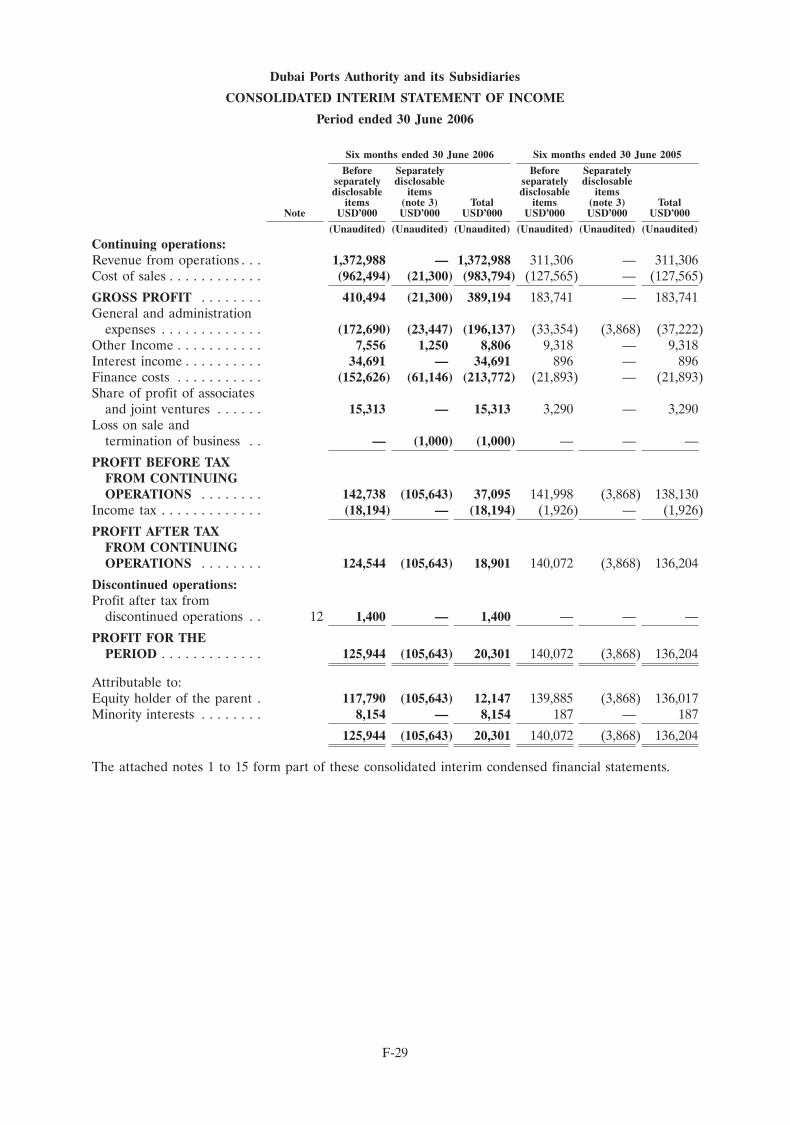
Dubai Ports Authority and its Subsidiaries
CONSOLIDATED INTERIM STATEMENT OF INCOME
Period ended 30 June 2006
Six months ended 30 June 2006 Six months ended 30 June 2005
Before Separately Before Separatelyseparately disclosable separately disclosabledisclosable items disclosable items
items (note 3) Total items (note 3) TotalNote USD’000 USD’000 USD’000 USD’000 USD’000 USD’000
(Unaudited) (Unaudited) (Unaudited) (Unaudited) (Unaudited) (Unaudited)
Continuing operations:Revenue from operations . . . 1,372,988 — 1,372,988 311,306 — 311,306Cost of sales . . . . . . . . . . . . (962,494) (21,300) (983,794) (127,565) — (127,565)
GROSS PROFIT . . . . . . . . 410,494 (21,300) 389,194 183,741 — 183,741General and administration
expenses . . . . . . . . . . . . . (172,690) (23,447) (196,137) (33,354) (3,868) (37,222)Other Income . . . . . . . . . . . 7,556 1,250 8,806 9,318 — 9,318Interest income . . . . . . . . . . 34,691 — 34,691 896 — 896Finance costs . . . . . . . . . . . (152,626) (61,146) (213,772) (21,893) — (21,893)Share of profit of associates
and joint ventures . . . . . . 15,313 — 15,313 3,290 — 3,290Loss on sale and
termination of business . . — (1,000) (1,000) — — —
PROFIT BEFORE TAXFROM CONTINUINGOPERATIONS . . . . . . . . 142,738 (105,643) 37,095 141,998 (3,868) 138,130
Income tax . . . . . . . . . . . . . (18,194) — (18,194) (1,926) — (1,926)
PROFIT AFTER TAXFROM CONTINUINGOPERATIONS . . . . . . . . 124,544 (105,643) 18,901 140,072 (3,868) 136,204
Discontinued operations:Profit after tax from
discontinued operations . . 12 1,400 — 1,400 — — —
PROFIT FOR THEPERIOD . . . . . . . . . . . . . 125,944 (105,643) 20,301 140,072 (3,868) 136,204
Attributable to:Equity holder of the parent . 117,790 (105,643) 12,147 139,885 (3,868) 136,017Minority interests . . . . . . . . 8,154 — 8,154 187 — 187
125,944 (105,643) 20,301 140,072 (3,868) 136,204
The attached notes 1 to 15 form part of these consolidated interim condensed financial statements.
F-29
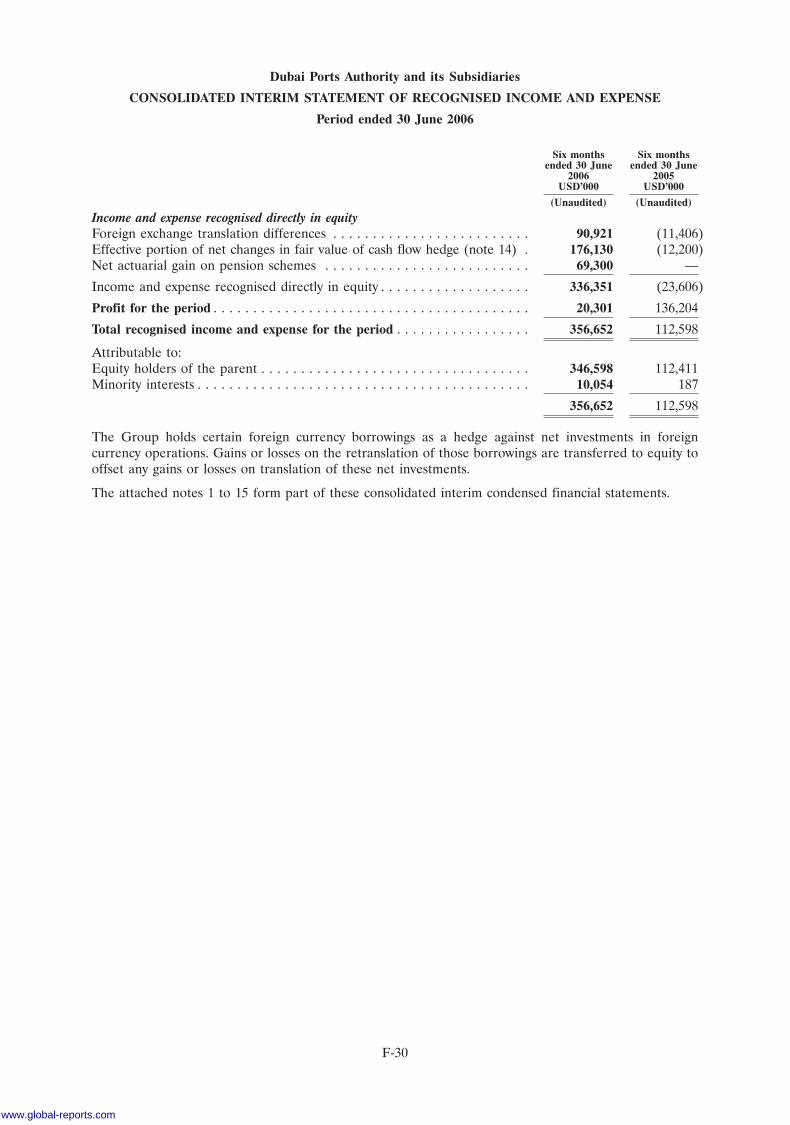
Dubai Ports Authority and its Subsidiaries
CONSOLIDATED INTERIM STATEMENT OF RECOGNISED INCOME AND EXPENSE
Period ended 30 June 2006
Six months Six monthsended 30 June ended 30 June
2006 2005USD’000 USD’000
(Unaudited) (Unaudited)
Income and expense recognised directly in equityForeign exchange translation differences . . . . . . . . . . . . . . . . . . . . . . . . . 90,921 (11,406)Effective portion of net changes in fair value of cash flow hedge (note 14) . 176,130 (12,200)Net actuarial gain on pension schemes . . . . . . . . . . . . . . . . . . . . . . . . . . 69,300 —
Income and expense recognised directly in equity . . . . . . . . . . . . . . . . . . . 336,351 (23,606)
Profit for the period . . . . . . . . . . . . . . . . . . . . . . . . . . . . . . . . . . . . . . . . 20,301 136,204
Total recognised income and expense for the period . . . . . . . . . . . . . . . . . 356,652 112,598
Attributable to:Equity holders of the parent . . . . . . . . . . . . . . . . . . . . . . . . . . . . . . . . . . 346,598 112,411Minority interests . . . . . . . . . . . . . . . . . . . . . . . . . . . . . . . . . . . . . . . . . . 10,054 187
356,652 112,598
The Group holds certain foreign currency borrowings as a hedge against net investments in foreigncurrency operations. Gains or losses on the retranslation of those borrowings are transferred to equity tooffset any gains or losses on translation of these net investments.
The attached notes 1 to 15 form part of these consolidated interim condensed financial statements.
F-30
www.global-reports.com
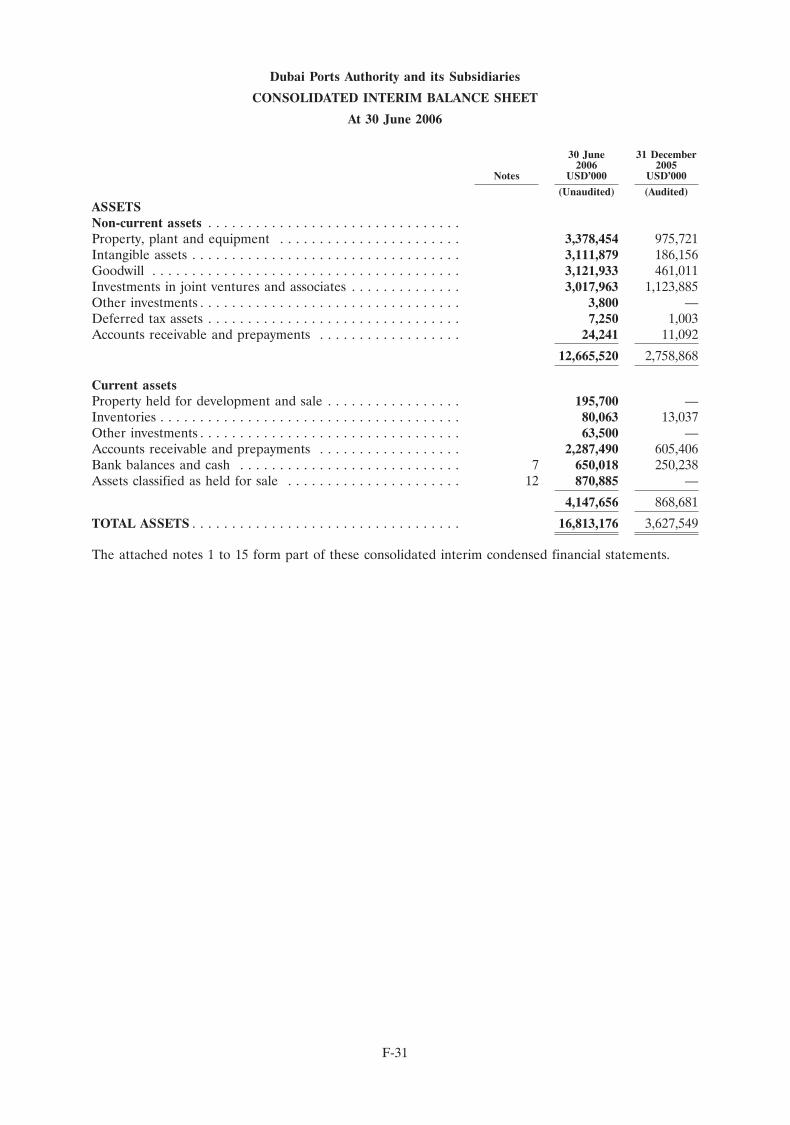
Dubai Ports Authority and its Subsidiaries
CONSOLIDATED INTERIM BALANCE SHEET
At 30 June 2006
30 June 31 December2006 2005
Notes USD’000 USD’000
(Unaudited) (Audited)
ASSETSNon-current assets . . . . . . . . . . . . . . . . . . . . . . . . . . . . . . . .Property, plant and equipment . . . . . . . . . . . . . . . . . . . . . . . 3,378,454 975,721Intangible assets . . . . . . . . . . . . . . . . . . . . . . . . . . . . . . . . . . 3,111,879 186,156Goodwill . . . . . . . . . . . . . . . . . . . . . . . . . . . . . . . . . . . . . . . 3,121,933 461,011Investments in joint ventures and associates . . . . . . . . . . . . . . 3,017,963 1,123,885Other investments . . . . . . . . . . . . . . . . . . . . . . . . . . . . . . . . . 3,800 —Deferred tax assets . . . . . . . . . . . . . . . . . . . . . . . . . . . . . . . . 7,250 1,003Accounts receivable and prepayments . . . . . . . . . . . . . . . . . . 24,241 11,092
12,665,520 2,758,868
Current assetsProperty held for development and sale . . . . . . . . . . . . . . . . . 195,700 —Inventories . . . . . . . . . . . . . . . . . . . . . . . . . . . . . . . . . . . . . . 80,063 13,037Other investments . . . . . . . . . . . . . . . . . . . . . . . . . . . . . . . . . 63,500 —Accounts receivable and prepayments . . . . . . . . . . . . . . . . . . 2,287,490 605,406Bank balances and cash . . . . . . . . . . . . . . . . . . . . . . . . . . . . 7 650,018 250,238Assets classified as held for sale . . . . . . . . . . . . . . . . . . . . . . 12 870,885 —
4,147,656 868,681
TOTAL ASSETS . . . . . . . . . . . . . . . . . . . . . . . . . . . . . . . . . . 16,813,176 3,627,549
The attached notes 1 to 15 form part of these consolidated interim condensed financial statements.
F-31
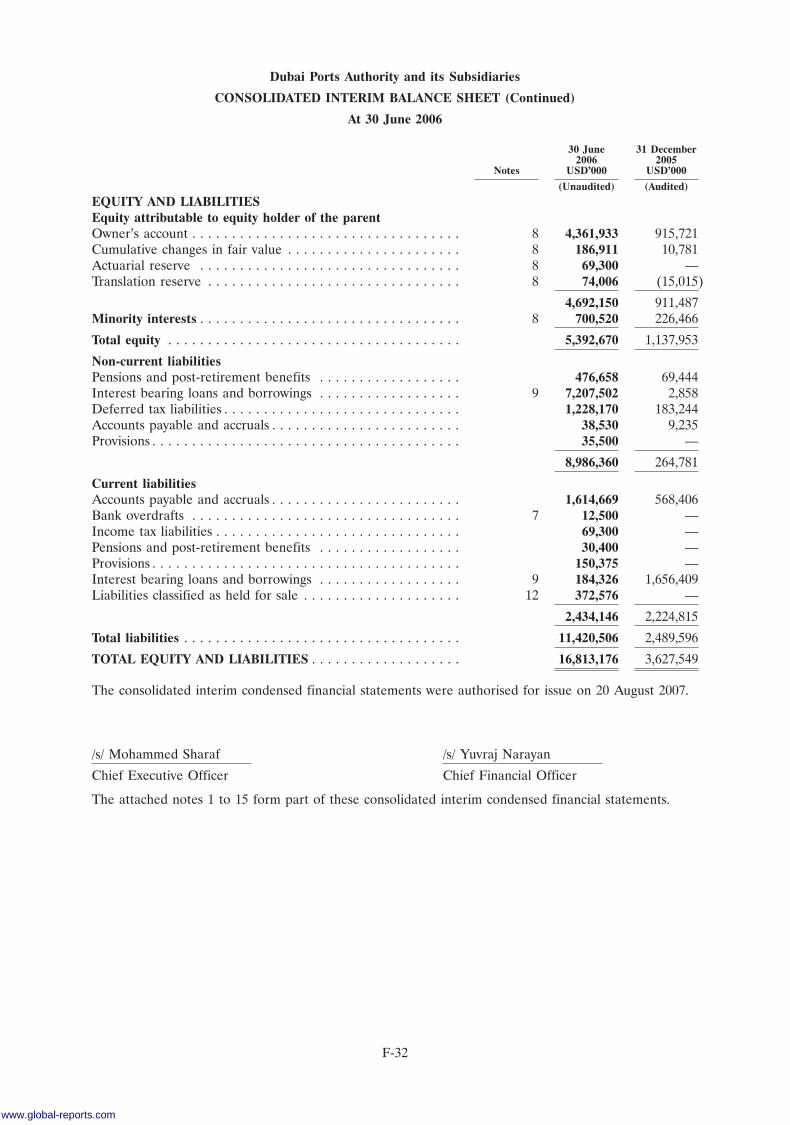
Dubai Ports Authority and its Subsidiaries
CONSOLIDATED INTERIM BALANCE SHEET (Continued)
At 30 June 2006
30 June 31 December2006 2005
Notes USD’000 USD’000
(Unaudited) (Audited)
EQUITY AND LIABILITIESEquity attributable to equity holder of the parentOwner’s account . . . . . . . . . . . . . . . . . . . . . . . . . . . . . . . . . . 8 4,361,933 915,721Cumulative changes in fair value . . . . . . . . . . . . . . . . . . . . . . 8 186,911 10,781Actuarial reserve . . . . . . . . . . . . . . . . . . . . . . . . . . . . . . . . . 8 69,300 —Translation reserve . . . . . . . . . . . . . . . . . . . . . . . . . . . . . . . . 8 74,006 (15,015)
4,692,150 911,487Minority interests . . . . . . . . . . . . . . . . . . . . . . . . . . . . . . . . . 8 700,520 226,466
Total equity . . . . . . . . . . . . . . . . . . . . . . . . . . . . . . . . . . . . . 5,392,670 1,137,953
Non-current liabilitiesPensions and post-retirement benefits . . . . . . . . . . . . . . . . . . 476,658 69,444Interest bearing loans and borrowings . . . . . . . . . . . . . . . . . . 9 7,207,502 2,858Deferred tax liabilities . . . . . . . . . . . . . . . . . . . . . . . . . . . . . . 1,228,170 183,244Accounts payable and accruals . . . . . . . . . . . . . . . . . . . . . . . . 38,530 9,235Provisions . . . . . . . . . . . . . . . . . . . . . . . . . . . . . . . . . . . . . . . 35,500 —
8,986,360 264,781
Current liabilitiesAccounts payable and accruals . . . . . . . . . . . . . . . . . . . . . . . . 1,614,669 568,406Bank overdrafts . . . . . . . . . . . . . . . . . . . . . . . . . . . . . . . . . . 7 12,500 —Income tax liabilities . . . . . . . . . . . . . . . . . . . . . . . . . . . . . . . 69,300 —Pensions and post-retirement benefits . . . . . . . . . . . . . . . . . . 30,400 —Provisions . . . . . . . . . . . . . . . . . . . . . . . . . . . . . . . . . . . . . . . 150,375 —Interest bearing loans and borrowings . . . . . . . . . . . . . . . . . . 9 184,326 1,656,409Liabilities classified as held for sale . . . . . . . . . . . . . . . . . . . . 12 372,576 —
2,434,146 2,224,815
Total liabilities . . . . . . . . . . . . . . . . . . . . . . . . . . . . . . . . . . . 11,420,506 2,489,596
TOTAL EQUITY AND LIABILITIES . . . . . . . . . . . . . . . . . . . 16,813,176 3,627,549
The consolidated interim condensed financial statements were authorised for issue on 20 August 2007.
/s/ Mohammed Sharaf /s/ Yuvraj Narayan
Chief Executive Officer Chief Financial Officer
The attached notes 1 to 15 form part of these consolidated interim condensed financial statements.
F-32
www.global-reports.com
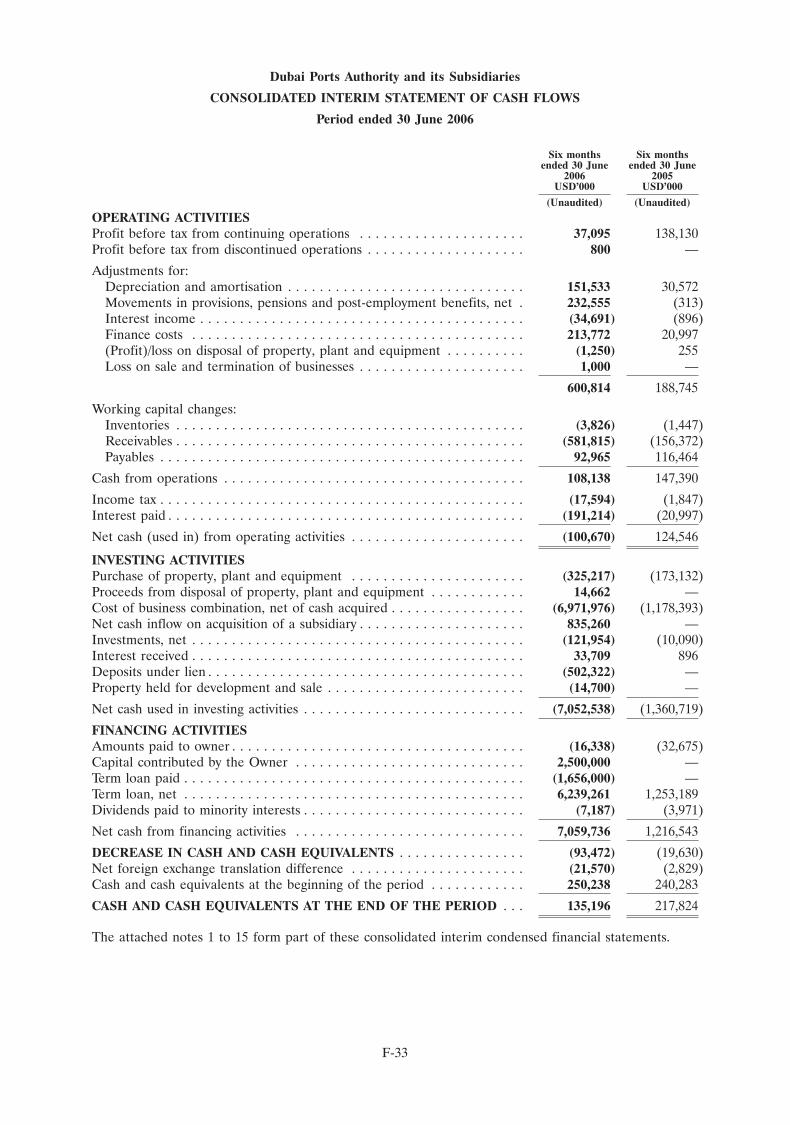
Dubai Ports Authority and its Subsidiaries
CONSOLIDATED INTERIM STATEMENT OF CASH FLOWS
Period ended 30 June 2006
Six months Six monthsended 30 June ended 30 June
2006 2005USD’000 USD’000
(Unaudited) (Unaudited)
OPERATING ACTIVITIESProfit before tax from continuing operations . . . . . . . . . . . . . . . . . . . . . 37,095 138,130Profit before tax from discontinued operations . . . . . . . . . . . . . . . . . . . . 800 —
Adjustments for:Depreciation and amortisation . . . . . . . . . . . . . . . . . . . . . . . . . . . . . . 151,533 30,572Movements in provisions, pensions and post-employment benefits, net . 232,555 (313)Interest income . . . . . . . . . . . . . . . . . . . . . . . . . . . . . . . . . . . . . . . . . (34,691) (896)Finance costs . . . . . . . . . . . . . . . . . . . . . . . . . . . . . . . . . . . . . . . . . . 213,772 20,997(Profit)/loss on disposal of property, plant and equipment . . . . . . . . . . (1,250) 255Loss on sale and termination of businesses . . . . . . . . . . . . . . . . . . . . . 1,000 —
600,814 188,745
Working capital changes:Inventories . . . . . . . . . . . . . . . . . . . . . . . . . . . . . . . . . . . . . . . . . . . . (3,826) (1,447)Receivables . . . . . . . . . . . . . . . . . . . . . . . . . . . . . . . . . . . . . . . . . . . . (581,815) (156,372)Payables . . . . . . . . . . . . . . . . . . . . . . . . . . . . . . . . . . . . . . . . . . . . . . 92,965 116,464
Cash from operations . . . . . . . . . . . . . . . . . . . . . . . . . . . . . . . . . . . . . . 108,138 147,390
Income tax . . . . . . . . . . . . . . . . . . . . . . . . . . . . . . . . . . . . . . . . . . . . . . (17,594) (1,847)Interest paid . . . . . . . . . . . . . . . . . . . . . . . . . . . . . . . . . . . . . . . . . . . . . (191,214) (20,997)
Net cash (used in) from operating activities . . . . . . . . . . . . . . . . . . . . . . (100,670) 124,546
INVESTING ACTIVITIESPurchase of property, plant and equipment . . . . . . . . . . . . . . . . . . . . . . (325,217) (173,132)Proceeds from disposal of property, plant and equipment . . . . . . . . . . . . 14,662 —Cost of business combination, net of cash acquired . . . . . . . . . . . . . . . . . (6,971,976) (1,178,393)Net cash inflow on acquisition of a subsidiary . . . . . . . . . . . . . . . . . . . . . 835,260 —Investments, net . . . . . . . . . . . . . . . . . . . . . . . . . . . . . . . . . . . . . . . . . . (121,954) (10,090)Interest received . . . . . . . . . . . . . . . . . . . . . . . . . . . . . . . . . . . . . . . . . . 33,709 896Deposits under lien . . . . . . . . . . . . . . . . . . . . . . . . . . . . . . . . . . . . . . . . (502,322) —Property held for development and sale . . . . . . . . . . . . . . . . . . . . . . . . . (14,700) —
Net cash used in investing activities . . . . . . . . . . . . . . . . . . . . . . . . . . . . (7,052,538) (1,360,719)
FINANCING ACTIVITIESAmounts paid to owner . . . . . . . . . . . . . . . . . . . . . . . . . . . . . . . . . . . . . (16,338) (32,675)Capital contributed by the Owner . . . . . . . . . . . . . . . . . . . . . . . . . . . . . 2,500,000 —Term loan paid . . . . . . . . . . . . . . . . . . . . . . . . . . . . . . . . . . . . . . . . . . . (1,656,000) —Term loan, net . . . . . . . . . . . . . . . . . . . . . . . . . . . . . . . . . . . . . . . . . . . 6,239,261 1,253,189Dividends paid to minority interests . . . . . . . . . . . . . . . . . . . . . . . . . . . . (7,187) (3,971)
Net cash from financing activities . . . . . . . . . . . . . . . . . . . . . . . . . . . . . 7,059,736 1,216,543
DECREASE IN CASH AND CASH EQUIVALENTS . . . . . . . . . . . . . . . . (93,472) (19,630)Net foreign exchange translation difference . . . . . . . . . . . . . . . . . . . . . . (21,570) (2,829)Cash and cash equivalents at the beginning of the period . . . . . . . . . . . . 250,238 240,283
CASH AND CASH EQUIVALENTS AT THE END OF THE PERIOD . . . 135,196 217,824
The attached notes 1 to 15 form part of these consolidated interim condensed financial statements.
F-33
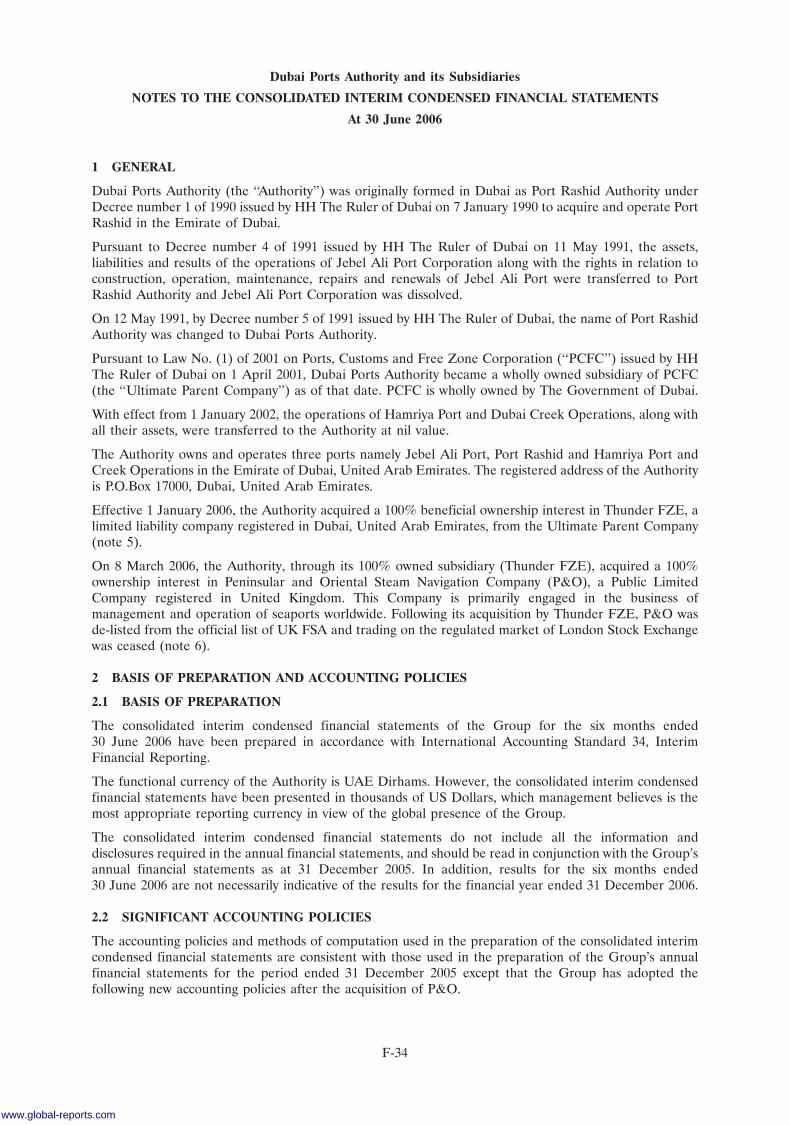
Dubai Ports Authority and its Subsidiaries
NOTES TO THE CONSOLIDATED INTERIM CONDENSED FINANCIAL STATEMENTS
At 30 June 2006
1 GENERAL
Dubai Ports Authority (the ‘‘Authority’’) was originally formed in Dubai as Port Rashid Authority underDecree number 1 of 1990 issued by HH The Ruler of Dubai on 7 January 1990 to acquire and operate PortRashid in the Emirate of Dubai.
Pursuant to Decree number 4 of 1991 issued by HH The Ruler of Dubai on 11 May 1991, the assets,liabilities and results of the operations of Jebel Ali Port Corporation along with the rights in relation toconstruction, operation, maintenance, repairs and renewals of Jebel Ali Port were transferred to PortRashid Authority and Jebel Ali Port Corporation was dissolved.
On 12 May 1991, by Decree number 5 of 1991 issued by HH The Ruler of Dubai, the name of Port RashidAuthority was changed to Dubai Ports Authority.
Pursuant to Law No. (1) of 2001 on Ports, Customs and Free Zone Corporation (‘‘PCFC’’) issued by HHThe Ruler of Dubai on 1 April 2001, Dubai Ports Authority became a wholly owned subsidiary of PCFC(the ‘‘Ultimate Parent Company’’) as of that date. PCFC is wholly owned by The Government of Dubai.
With effect from 1 January 2002, the operations of Hamriya Port and Dubai Creek Operations, along withall their assets, were transferred to the Authority at nil value.
The Authority owns and operates three ports namely Jebel Ali Port, Port Rashid and Hamriya Port andCreek Operations in the Emirate of Dubai, United Arab Emirates. The registered address of the Authorityis P.O.Box 17000, Dubai, United Arab Emirates.
Effective 1 January 2006, the Authority acquired a 100% beneficial ownership interest in Thunder FZE, alimited liability company registered in Dubai, United Arab Emirates, from the Ultimate Parent Company(note 5).
On 8 March 2006, the Authority, through its 100% owned subsidiary (Thunder FZE), acquired a 100%ownership interest in Peninsular and Oriental Steam Navigation Company (P&O), a Public LimitedCompany registered in United Kingdom. This Company is primarily engaged in the business ofmanagement and operation of seaports worldwide. Following its acquisition by Thunder FZE, P&O wasde-listed from the official list of UK FSA and trading on the regulated market of London Stock Exchangewas ceased (note 6).
2 BASIS OF PREPARATION AND ACCOUNTING POLICIES
2.1 BASIS OF PREPARATION
The consolidated interim condensed financial statements of the Group for the six months ended30 June 2006 have been prepared in accordance with International Accounting Standard 34, InterimFinancial Reporting.
The functional currency of the Authority is UAE Dirhams. However, the consolidated interim condensedfinancial statements have been presented in thousands of US Dollars, which management believes is themost appropriate reporting currency in view of the global presence of the Group.
The consolidated interim condensed financial statements do not include all the information anddisclosures required in the annual financial statements, and should be read in conjunction with the Group’sannual financial statements as at 31 December 2005. In addition, results for the six months ended30 June 2006 are not necessarily indicative of the results for the financial year ended 31 December 2006.
2.2 SIGNIFICANT ACCOUNTING POLICIES
The accounting policies and methods of computation used in the preparation of the consolidated interimcondensed financial statements are consistent with those used in the preparation of the Group’s annualfinancial statements for the period ended 31 December 2005 except that the Group has adopted thefollowing new accounting policies after the acquisition of P&O.
F-34
www.global-reports.com
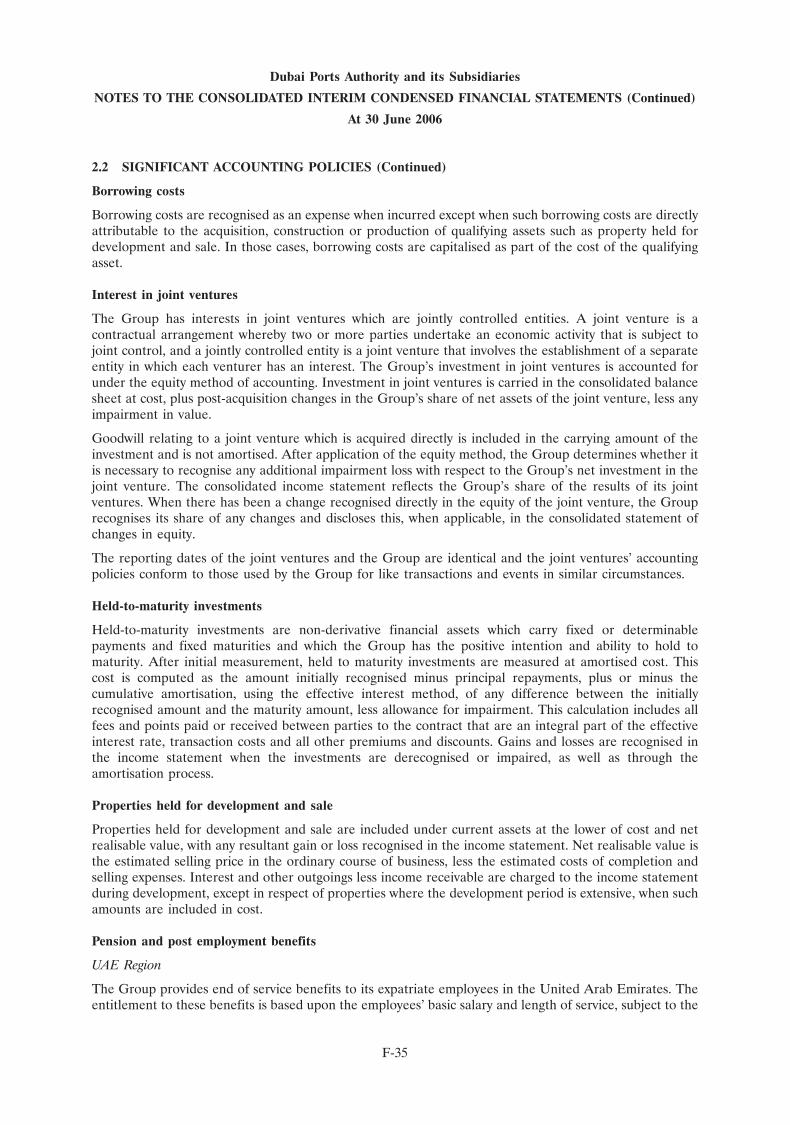
Dubai Ports Authority and its Subsidiaries
NOTES TO THE CONSOLIDATED INTERIM CONDENSED FINANCIAL STATEMENTS (Continued)
At 30 June 2006
2.2 SIGNIFICANT ACCOUNTING POLICIES (Continued)
Borrowing costs
Borrowing costs are recognised as an expense when incurred except when such borrowing costs are directlyattributable to the acquisition, construction or production of qualifying assets such as property held fordevelopment and sale. In those cases, borrowing costs are capitalised as part of the cost of the qualifyingasset.
Interest in joint ventures
The Group has interests in joint ventures which are jointly controlled entities. A joint venture is acontractual arrangement whereby two or more parties undertake an economic activity that is subject tojoint control, and a jointly controlled entity is a joint venture that involves the establishment of a separateentity in which each venturer has an interest. The Group’s investment in joint ventures is accounted forunder the equity method of accounting. Investment in joint ventures is carried in the consolidated balancesheet at cost, plus post-acquisition changes in the Group’s share of net assets of the joint venture, less anyimpairment in value.
Goodwill relating to a joint venture which is acquired directly is included in the carrying amount of theinvestment and is not amortised. After application of the equity method, the Group determines whether itis necessary to recognise any additional impairment loss with respect to the Group’s net investment in thejoint venture. The consolidated income statement reflects the Group’s share of the results of its jointventures. When there has been a change recognised directly in the equity of the joint venture, the Grouprecognises its share of any changes and discloses this, when applicable, in the consolidated statement ofchanges in equity.
The reporting dates of the joint ventures and the Group are identical and the joint ventures’ accountingpolicies conform to those used by the Group for like transactions and events in similar circumstances.
Held-to-maturity investments
Held-to-maturity investments are non-derivative financial assets which carry fixed or determinablepayments and fixed maturities and which the Group has the positive intention and ability to hold tomaturity. After initial measurement, held to maturity investments are measured at amortised cost. Thiscost is computed as the amount initially recognised minus principal repayments, plus or minus thecumulative amortisation, using the effective interest method, of any difference between the initiallyrecognised amount and the maturity amount, less allowance for impairment. This calculation includes allfees and points paid or received between parties to the contract that are an integral part of the effectiveinterest rate, transaction costs and all other premiums and discounts. Gains and losses are recognised inthe income statement when the investments are derecognised or impaired, as well as through theamortisation process.
Properties held for development and sale
Properties held for development and sale are included under current assets at the lower of cost and netrealisable value, with any resultant gain or loss recognised in the income statement. Net realisable value isthe estimated selling price in the ordinary course of business, less the estimated costs of completion andselling expenses. Interest and other outgoings less income receivable are charged to the income statementduring development, except in respect of properties where the development period is extensive, when suchamounts are included in cost.
Pension and post employment benefits
UAE Region
The Group provides end of service benefits to its expatriate employees in the United Arab Emirates. Theentitlement to these benefits is based upon the employees’ basic salary and length of service, subject to the
F-35
Dubai Ports Authority and its Subsidiaries
NOTES TO THE CONSOLIDATED INTERIM CONDENSED FINANCIAL STATEMENTS (Continued)
At 30 June 2006
2.2 SIGNIFICANT ACCOUNTING POLICIES (Continued)
completion of a minimum service period. The expected costs of these benefits are accrued over the periodof employment.
With respect to its UAE national employees, the Group makes a provision for contributions to be made tothe UAE Pension Authority calculated as a percentage of the employees’ salaries. The Group’s obligationsare limited to these contributions, which are expensed when due.
Outside UAE Region
The Group’s net obligation in respect of defined benefit pension plans is calculated separately for eachplan by estimating the amount of future benefit that employees have earned in return for their service inthe current and prior periods. That benefit is discounted to determine the present value, and the fair valueof any plan assets is deducted. The calculation is performed by a qualified actuary using the projected unitcredit method. The discount rate is the yield at the balance sheet date on AA credit rated bonds or localequivalent that have maturity dates approximating to the terms of the Group’s obligations.
When the benefits of a plan are improved, the portion of the increased benefit relating to past service byemployees is recognised as an expense in the income statement on a straight line basis over the averageperiod until the benefits become vested. To the extent that the benefits vest immediately, the expense isrecognised immediately in the income statement.
Actuarial gains and losses that arise in calculating the Group’s obligation in respect of a plan arerecognised in the period in which they arise directly in the statement of recognised income and expenses.The cost of providing benefits under the defined benefit plans is determined separately for each plan usingthe projected unit credit method, which attributes entitlement to benefits to the current period (todetermine current service cost) and to the current and prior periods (to determine the present value ofdefined benefit obligation) and is based on actuarial advice.
Contributions, including lump sum payments, in respect of defined contribution pension schemes andmulti employer defined benefit schemes where it is not possible to identify the Group’s share of thescheme, are charged to the income statement as they fall due.
Long term service benefits
The Group’s net obligation in respect of long term service benefits, other than pension plans, is theamount of future benefit that employees have earned in return for their service in the current and priorperiods. The obligation is calculated using the projected unit credit method and is discounted to its presentvalue and the fair value of any related assets is deducted. The discount rate is the yield at the balance sheetdate on AA credit rated bonds (or local equivalent) that have maturity dates approximating to the terms ofthe Group’s obligations.
Leasing and sub-leasing transactions
A series of leasing and sub-leasing transactions between and the Group and third parties, which are closelyinterrelated, negotiated as a single transaction, and take place concurrently or in a continuous sequenceare considered linked and accounted for as one transaction when the overall economic effect cannot beunderstood without reference to the series of transactions as a whole.
These leasing and sub-leasing transactions are designed to achieve certain benefits for the third parties inoverseas locations in return for a cash benefit to the Group. Such cash benefit is accounted for as upfrontincome in the consolidated statement of income.
Under these leasing and sub-leasing transactions, current and non-current liabilities have been defeased bythe loan receivable and the placement of deposits. Those liabilities, receivable and deposits (and incomeand charges arising therefrom) are netted off in the consolidated financial statements, in order to reflectthe overall commercial effect of the arrangement.
F-36
www.global-reports.com
Dubai Ports Authority and its Subsidiaries
NOTES TO THE CONSOLIDATED INTERIM CONDENSED FINANCIAL STATEMENTS (Continued)
At 30 June 2006
2.2 SIGNIFICANT ACCOUNTING POLICIES (Continued)
Separately disclosable items
The Group presents, as separately disclosable items on the face of the income statement, those materialitems of income and expense which, because of the nature and expected infrequency of the events givingrise to them, merit separate presentation to allow users to understand better the elements of financialperformance in the period, so as to facilitate a comparison with prior periods and a better assessment oftrends in financial performance.
Non-current assets held for sale
The Group classifies a non-current asset (or disposal group) as held for sale if its carrying amount will berecovered through a sale transaction rather than continuing use and the sale transaction is expected tocomplete within one year from the date of classification.
Liabilities directly associated with such non-current assets (or disposal group) are classified as liabilitiesheld for sale.
A non-current asset (disposal group) classified as held for sale is measured at the lower of its net carryingamount and fair value less costs to sell.
A discontinued operation is a component of the Group that is classified as held for sale and whichrepresents a separate major line of business or geographical area of operations; is part of a singlecoordinated plan to dispose of a separate major line of business or geographical area of operation; or is asubsidiary acquired exclusively with a view to resale.
2.3 OTHER CHANGES IN ACCOUNTING POLICIES
The Group has also adopted the following new and amended IFRS and IFRIC interpretations during thesix months ended 30 June 2006. Adoption of these revised standards and interpretations did not have anyeffect on the Group results of operation or financial position.
� IAS 19 Amendment-Employee Benefits
� IAS 39 Amendments-Financial/ instruments: Recognition and Measurement
� IFRIC 4 Determining whether an Arrangement contains a Lease
The principal effects of these changes are as follows:
IAS 19 Employee Benefits
As of 1 January 2006, the Group adopted the amendments to IAS 19. As a result, additional disclosureswill be made in the annual financial statements of the Group providing information about trends in theassets and liabilities in its defined benefit plans and the assumptions underlying the components of thedefined benefit cost. The Group has also adopted the new option offered to recognise actuarial gains andlosses outside of the income statement in a statement of recognised income and expenses. In the opinion ofthe management, this change results in the consolidated financial statements providing reliable and morerelevant information about the effects of transactions, other events or conditions on the Group’s financialposition, financial performance or cash flows. This change has no material recognition or measurementimpact on the previously recognised equity or other comparative amounts. The revised accounting policyof the management in respect of pensions and post retirement benefits is set out under note 2.2.
IAS 39 Financial Instruments: Recognition and Measurement
Amendment for financial guarantee contracts (issued August 2005)—amended the scope of IAS 39 torequire financial guarantee contracts that are not considered to be insurance contracts to be recognisedinitially at fair value and to be remeasured at the higher of the amount determined in accordance withIAS 37 Provisions, Contingent Liabilities and Contingent Assets and the amount initially recognised less,
F-37
Dubai Ports Authority and its Subsidiaries
NOTES TO THE CONSOLIDATED INTERIM CONDENSED FINANCIAL STATEMENTS (Continued)
At 30 June 2006
2.3 OTHER CHANGES IN ACCOUNTING POLICIES (Continued)
when appropriate, cumulative amortisation recognised in accordance with IAS 18 Revenue. Thisamendment did not have an effect on the consolidated interim condensed financial statements.
Amendment for hedges of forecast intragroup transactions (issued April 2005)—amended IAS 39 topermit the foreign currency risk of a highly probable intragroup forecast transaction to qualify as thehedged item in a cash flow hedge, provided that the transaction is denominated in a currency other thanthe functional currency of the entity entering into that transaction and that the foreign currency risk willaffect the consolidated income statement. As the Group currently has no such transactions, theamendment did not have an effect on the consolidated interim condensed financial statements.
Amendment for the fair value option (issued June 2005)—amended IAS 39 to restrict the use of the optionto designate any financial asset or any financial liability to be measured at fair value through the incomestatement. The Group had not previously used this option, hence the amendment did not have an effect onthe consolidated interim condensed financial statements.
IFRIC 4 Determining Whether an Arrangement contains a Lease
The Group adopted IFRIC Interpretation 4 as of 1 January 2006, which provides guidance in determiningwhether arrangements contain a lease to which lease accounting must be applied. This change inaccounting policy has not had a significant impact on the Group as at 30 June 2006.
The management has made the following other voluntary changes in their accounting policies during thesix months ended 30 June 2006. In the view of management those changes result in the consolidatedinterim condensed financial statements providing reliable and more relevant information about the effectsof the transactions, other events or conditions on the Group’s financial position, financial performance orcash flows:
IAS 1 Presentation of financial statements
Due to the significance of certain items of income and expenses occurring during the period, themanagement has decided to present such items on the face of the income statements as separatelydisclosable items. The accounting policy of the management in respect of separately disclosable items is setout under note 2.2. This change has no material recognition or measurement impact on the previouslyrecognised equity or other comparative amounts.
The management has decided to use the option available under IAS 1 Presentation of financial statementsto present the statement of recognised income and expense as a primary statement instead of statement ofchanges in equity, which was used in the previous period. As a result of this change profit and loss for theperiod, each item of income and expense for the period that is required by other standards orinterpretations to be recognised in equity and effects of changes in accounting policies that impacts thecomponents of equity are shown under the statement of recognised income and expense. The movement ofcapital and reserves is shown in the notes to the consolidated interim condensed financial statements.
3 SEPARATELY DISCLOSABLE ITEMS
Six months Six monthsended 30 June ended 30 June
2006 2005USD’000 USD’000
(Unaudited) (Unaudited)
Expenses incurred on integration of acquired business . . . . . . . . . . . . . . (45,747) (3,868)Profit on disposal of property, plant and equipment . . . . . . . . . . . . . . . . 1,250 —Finance cost . . . . . . . . . . . . . . . . . . . . . . . . . . . . . . . . . . . . . . . . . . . . . (61,146) —
(105,643) (3,868)
F-38
www.global-reports.com
Dubai Ports Authority and its Subsidiaries
NOTES TO THE CONSOLIDATED INTERIM CONDENSED FINANCIAL STATEMENTS (Continued)
At 30 June 2006
3 SEPARATELY DISCLOSABLE ITEMS (Continued)
Expenses incurred on integration of acquired business
During the period, the Group has incurred USD 44,547 thousand (2005: USD 3,868 thousand relating tothe acquisition of SL Service Inc. and Orange Blossom Investment Company Limited) in expenses inrespect of relocation, redundancies and reorganisation related costs arising as a result of its acquisition ofP&O. Those costs are not indicative of a trend in financial performance of the Group.
Profit on disposal of property, plant and equipment
The above profits or losses on property, plant and equipment are classified as separately disclosable itemson the basis that they arise from transactions to dispose of assets other than at the end of their usualexpected lives or at values significantly different to their previously assessed residual value. As such, theamounts earned or charged in any given period are not indicative of a trend in financial performance.
Finance cost
During the period, the Group entered into various derivative contracts to hedge against the variability incash flows arising as a result of movements in foreign exchange rates up to the time of acquisition of P&O.Those costs are regarded as separately disclosable items because they were incurred due to the acquisitionof P&O and are not indicative of a trend in financial performance of the Group.
4 PROPERTY, PLANT AND EQUIPMENT
During the six months ended 30 June 2006, the Group acquired assets with a cost ofUSD 325,217 thousand (2005: USD 173,132 thousand), not including property, plant and equipmentacquired through a business combination.
Assets with a net book value of USD 13,412 thousand were disposed of by the Group during the six monthsended 30 June 2006, resulting in a net gain on disposal of USD 1,250 thousand (2005: USD 255 thousand).
5 ACQUISITION OF SUBSIDIARY
Effective 1 January 2006, the Authority acquired a 100% beneficial ownership interest in Thunder FZE, alimited liability company registered in Dubai, United Arab Emirates, from PCFC (note 1). The assets andliabilities of Thunder FZE as on 1 January 2006 were as follows:
USD’000Carrying value
(Unaudited)
Available-for-sale investments . . . . . . . . . . . . . . . . . . . . . . . . . . . . . . . . . . . . . . . . . . . 109,091Other assets . . . . . . . . . . . . . . . . . . . . . . . . . . . . . . . . . . . . . . . . . . . . . . . . . . . . . . . . 60,605Bank balances and cash . . . . . . . . . . . . . . . . . . . . . . . . . . . . . . . . . . . . . . . . . . . . . . . 835,260
1,004,956
Accruals and other payables . . . . . . . . . . . . . . . . . . . . . . . . . . . . . . . . . . . . . . . . . . . . (54,553)
Net assets acquired . . . . . . . . . . . . . . . . . . . . . . . . . . . . . . . . . . . . . . . . . . . . . . . . . . . 950,403
The above acquisition was made at the carrying value of net assets of Thunder FZE and since thisacquisition involved entities under common control, the provisions of IFRS 3 Business Combinations arenot applicable.
F-39
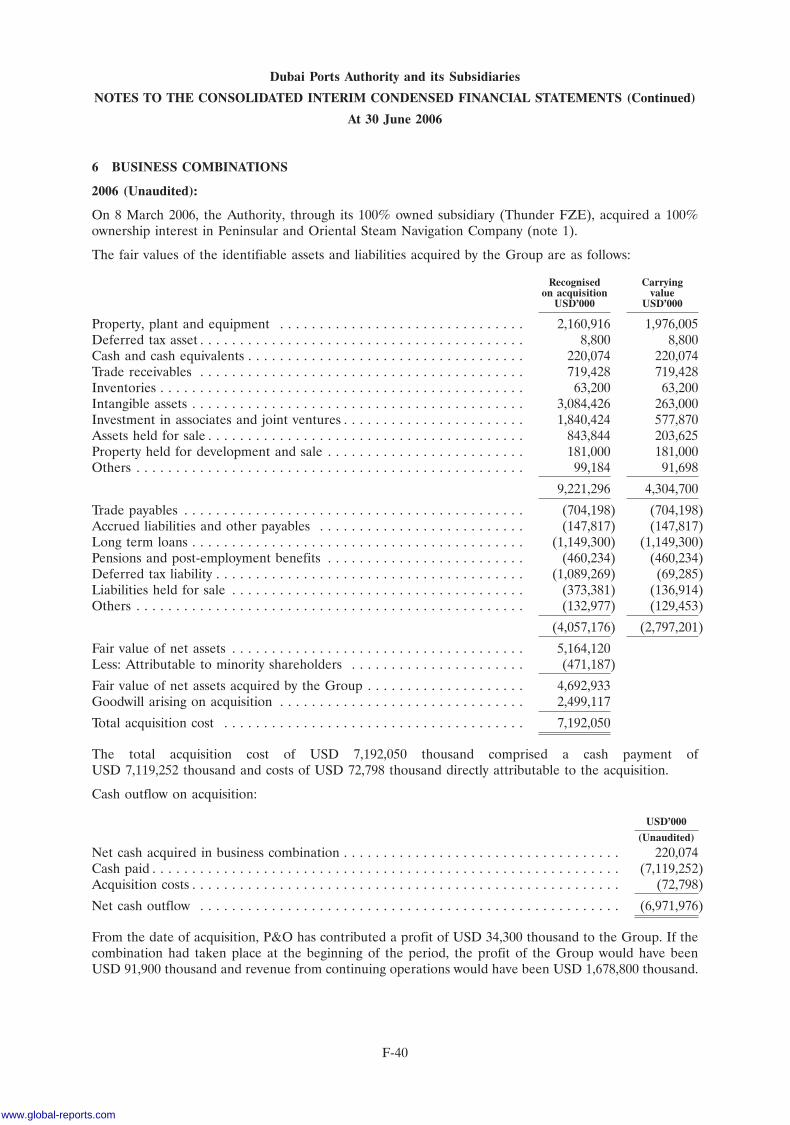
Dubai Ports Authority and its Subsidiaries
NOTES TO THE CONSOLIDATED INTERIM CONDENSED FINANCIAL STATEMENTS (Continued)
At 30 June 2006
6 BUSINESS COMBINATIONS
2006 (Unaudited):
On 8 March 2006, the Authority, through its 100% owned subsidiary (Thunder FZE), acquired a 100%ownership interest in Peninsular and Oriental Steam Navigation Company (note 1).
The fair values of the identifiable assets and liabilities acquired by the Group are as follows:
Recognised Carryingon acquisition value
USD’000 USD’000
Property, plant and equipment . . . . . . . . . . . . . . . . . . . . . . . . . . . . . . . 2,160,916 1,976,005Deferred tax asset . . . . . . . . . . . . . . . . . . . . . . . . . . . . . . . . . . . . . . . . . 8,800 8,800Cash and cash equivalents . . . . . . . . . . . . . . . . . . . . . . . . . . . . . . . . . . . 220,074 220,074Trade receivables . . . . . . . . . . . . . . . . . . . . . . . . . . . . . . . . . . . . . . . . . 719,428 719,428Inventories . . . . . . . . . . . . . . . . . . . . . . . . . . . . . . . . . . . . . . . . . . . . . . 63,200 63,200Intangible assets . . . . . . . . . . . . . . . . . . . . . . . . . . . . . . . . . . . . . . . . . . 3,084,426 263,000Investment in associates and joint ventures . . . . . . . . . . . . . . . . . . . . . . . 1,840,424 577,870Assets held for sale . . . . . . . . . . . . . . . . . . . . . . . . . . . . . . . . . . . . . . . . 843,844 203,625Property held for development and sale . . . . . . . . . . . . . . . . . . . . . . . . . 181,000 181,000Others . . . . . . . . . . . . . . . . . . . . . . . . . . . . . . . . . . . . . . . . . . . . . . . . . 99,184 91,698
9,221,296 4,304,700
Trade payables . . . . . . . . . . . . . . . . . . . . . . . . . . . . . . . . . . . . . . . . . . . (704,198) (704,198)Accrued liabilities and other payables . . . . . . . . . . . . . . . . . . . . . . . . . . (147,817) (147,817)Long term loans . . . . . . . . . . . . . . . . . . . . . . . . . . . . . . . . . . . . . . . . . . (1,149,300) (1,149,300)Pensions and post-employment benefits . . . . . . . . . . . . . . . . . . . . . . . . . (460,234) (460,234)Deferred tax liability . . . . . . . . . . . . . . . . . . . . . . . . . . . . . . . . . . . . . . . (1,089,269) (69,285)Liabilities held for sale . . . . . . . . . . . . . . . . . . . . . . . . . . . . . . . . . . . . . (373,381) (136,914)Others . . . . . . . . . . . . . . . . . . . . . . . . . . . . . . . . . . . . . . . . . . . . . . . . . (132,977) (129,453)
(4,057,176) (2,797,201)
Fair value of net assets . . . . . . . . . . . . . . . . . . . . . . . . . . . . . . . . . . . . . 5,164,120Less: Attributable to minority shareholders . . . . . . . . . . . . . . . . . . . . . . (471,187)
Fair value of net assets acquired by the Group . . . . . . . . . . . . . . . . . . . . 4,692,933Goodwill arising on acquisition . . . . . . . . . . . . . . . . . . . . . . . . . . . . . . . 2,499,117
Total acquisition cost . . . . . . . . . . . . . . . . . . . . . . . . . . . . . . . . . . . . . . 7,192,050
The total acquisition cost of USD 7,192,050 thousand comprised a cash payment ofUSD 7,119,252 thousand and costs of USD 72,798 thousand directly attributable to the acquisition.
Cash outflow on acquisition:
USD’000
(Unaudited)
Net cash acquired in business combination . . . . . . . . . . . . . . . . . . . . . . . . . . . . . . . . . . . 220,074Cash paid . . . . . . . . . . . . . . . . . . . . . . . . . . . . . . . . . . . . . . . . . . . . . . . . . . . . . . . . . . . (7,119,252)Acquisition costs . . . . . . . . . . . . . . . . . . . . . . . . . . . . . . . . . . . . . . . . . . . . . . . . . . . . . . (72,798)
Net cash outflow . . . . . . . . . . . . . . . . . . . . . . . . . . . . . . . . . . . . . . . . . . . . . . . . . . . . . (6,971,976)
From the date of acquisition, P&O has contributed a profit of USD 34,300 thousand to the Group. If thecombination had taken place at the beginning of the period, the profit of the Group would have beenUSD 91,900 thousand and revenue from continuing operations would have been USD 1,678,800 thousand.
F-40
www.global-reports.com
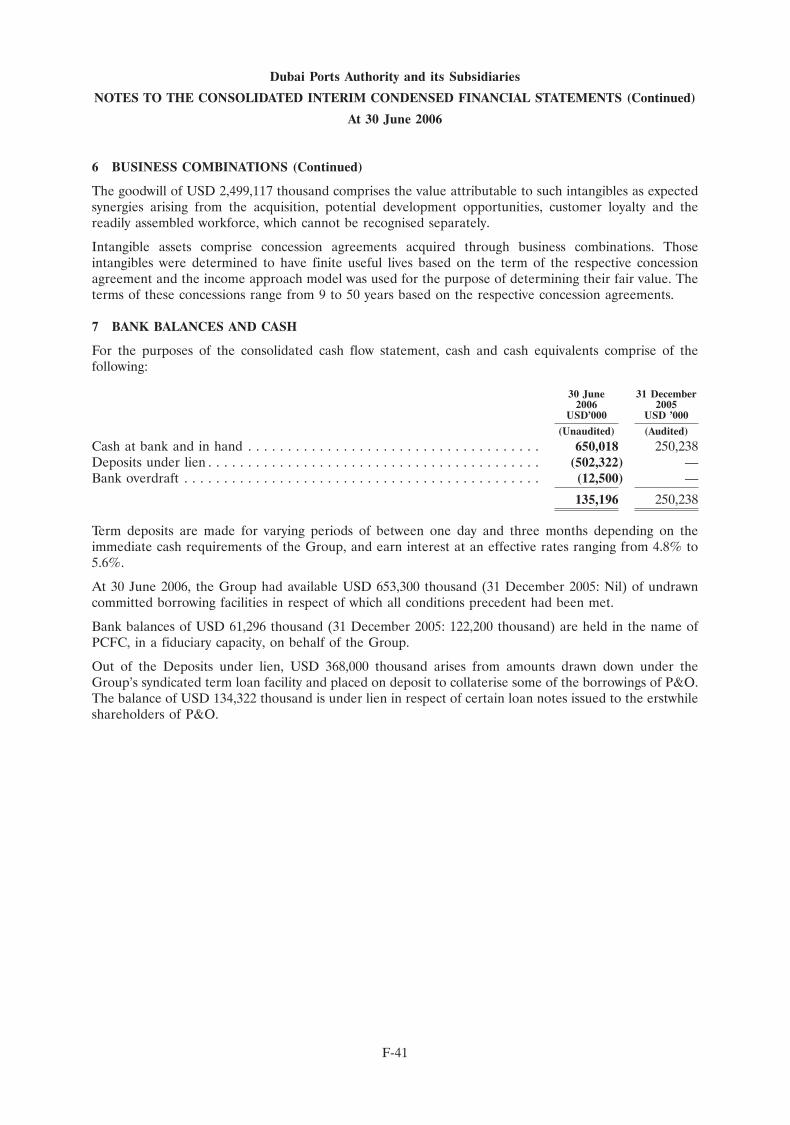
Dubai Ports Authority and its Subsidiaries
NOTES TO THE CONSOLIDATED INTERIM CONDENSED FINANCIAL STATEMENTS (Continued)
At 30 June 2006
6 BUSINESS COMBINATIONS (Continued)
The goodwill of USD 2,499,117 thousand comprises the value attributable to such intangibles as expectedsynergies arising from the acquisition, potential development opportunities, customer loyalty and thereadily assembled workforce, which cannot be recognised separately.
Intangible assets comprise concession agreements acquired through business combinations. Thoseintangibles were determined to have finite useful lives based on the term of the respective concessionagreement and the income approach model was used for the purpose of determining their fair value. Theterms of these concessions range from 9 to 50 years based on the respective concession agreements.
7 BANK BALANCES AND CASH
For the purposes of the consolidated cash flow statement, cash and cash equivalents comprise of thefollowing:
30 June 31 December2006 2005
USD’000 USD ’000
(Unaudited) (Audited)
Cash at bank and in hand . . . . . . . . . . . . . . . . . . . . . . . . . . . . . . . . . . . . . 650,018 250,238Deposits under lien . . . . . . . . . . . . . . . . . . . . . . . . . . . . . . . . . . . . . . . . . . (502,322) —Bank overdraft . . . . . . . . . . . . . . . . . . . . . . . . . . . . . . . . . . . . . . . . . . . . . (12,500) —
135,196 250,238
Term deposits are made for varying periods of between one day and three months depending on theimmediate cash requirements of the Group, and earn interest at an effective rates ranging from 4.8% to5.6%.
At 30 June 2006, the Group had available USD 653,300 thousand (31 December 2005: Nil) of undrawncommitted borrowing facilities in respect of which all conditions precedent had been met.
Bank balances of USD 61,296 thousand (31 December 2005: 122,200 thousand) are held in the name ofPCFC, in a fiduciary capacity, on behalf of the Group.
Out of the Deposits under lien, USD 368,000 thousand arises from amounts drawn down under theGroup’s syndicated term loan facility and placed on deposit to collaterise some of the borrowings of P&O.The balance of USD 134,322 thousand is under lien in respect of certain loan notes issued to the erstwhileshareholders of P&O.
F-41
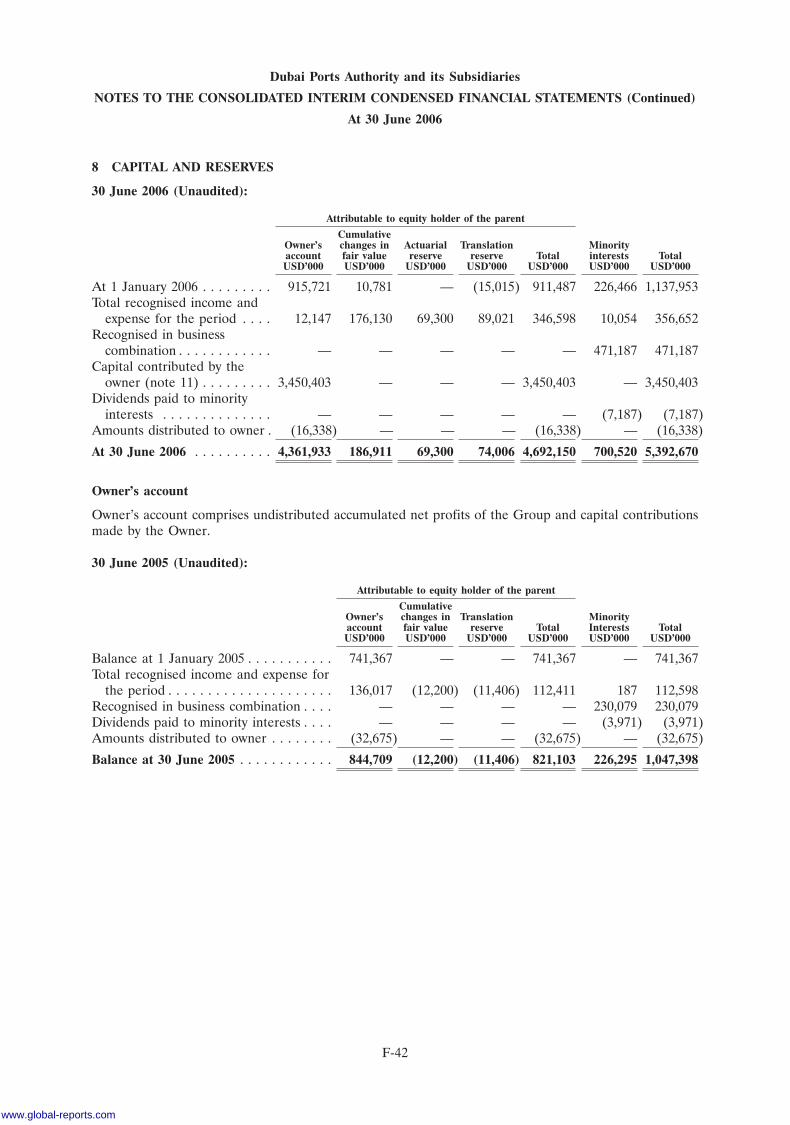
Dubai Ports Authority and its Subsidiaries
NOTES TO THE CONSOLIDATED INTERIM CONDENSED FINANCIAL STATEMENTS (Continued)
At 30 June 2006
8 CAPITAL AND RESERVES
30 June 2006 (Unaudited):
Attributable to equity holder of the parent
CumulativeOwner’s changes in Actuarial Translation Minorityaccount fair value reserve reserve Total interests TotalUSD’000 USD’000 USD’000 USD’000 USD’000 USD’000 USD’000
At 1 January 2006 . . . . . . . . . 915,721 10,781 — (15,015) 911,487 226,466 1,137,953Total recognised income and
expense for the period . . . . 12,147 176,130 69,300 89,021 346,598 10,054 356,652Recognised in business
combination . . . . . . . . . . . . — — — — — 471,187 471,187Capital contributed by the
owner (note 11) . . . . . . . . . 3,450,403 — — — 3,450,403 — 3,450,403Dividends paid to minority
interests . . . . . . . . . . . . . . — — — — — (7,187) (7,187)Amounts distributed to owner . (16,338) — — — (16,338) — (16,338)
At 30 June 2006 . . . . . . . . . . 4,361,933 186,911 69,300 74,006 4,692,150 700,520 5,392,670
Owner’s account
Owner’s account comprises undistributed accumulated net profits of the Group and capital contributionsmade by the Owner.
30 June 2005 (Unaudited):
Attributable to equity holder of the parent
CumulativeOwner’s changes in Translation Minorityaccount fair value reserve Total Interests TotalUSD’000 USD’000 USD’000 USD’000 USD’000 USD’000
Balance at 1 January 2005 . . . . . . . . . . . 741,367 — — 741,367 — 741,367Total recognised income and expense for
the period . . . . . . . . . . . . . . . . . . . . . 136,017 (12,200) (11,406) 112,411 187 112,598Recognised in business combination . . . . — — — — 230,079 230,079Dividends paid to minority interests . . . . — — — — (3,971) (3,971)Amounts distributed to owner . . . . . . . . (32,675) — — (32,675) — (32,675)
Balance at 30 June 2005 . . . . . . . . . . . . 844,709 (12,200) (11,406) 821,103 226,295 1,047,398
F-42
www.global-reports.com
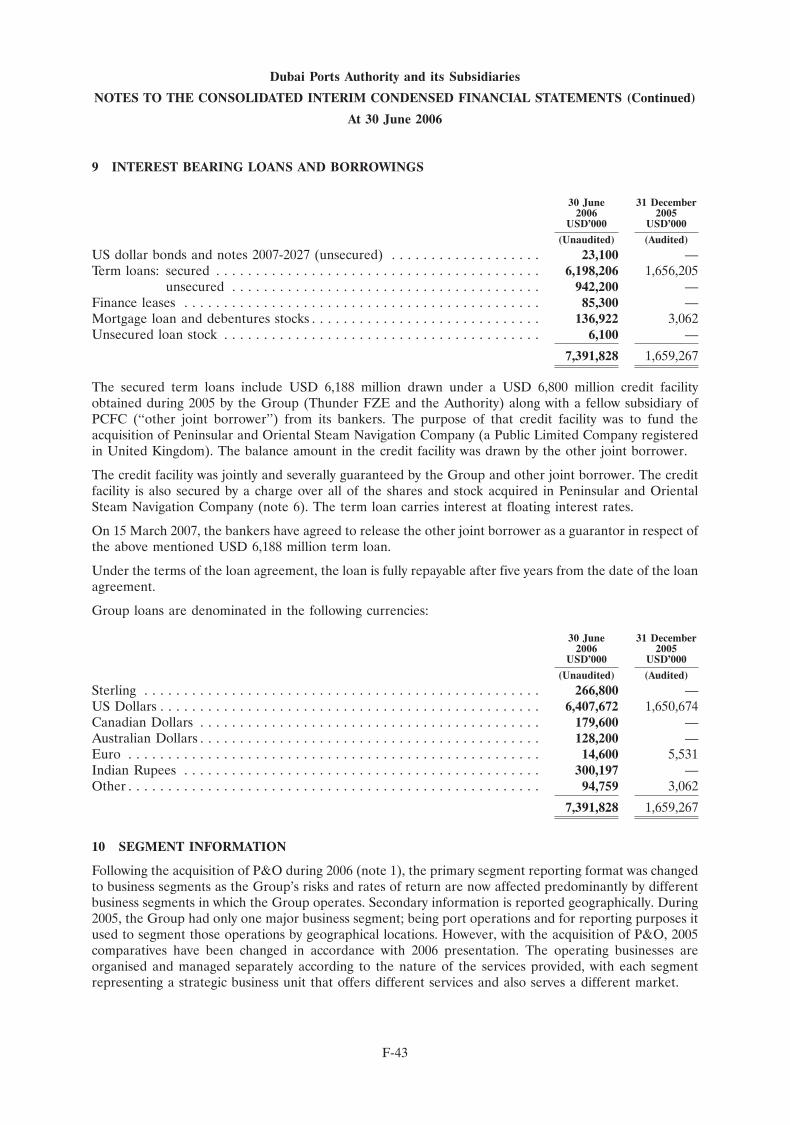
Dubai Ports Authority and its Subsidiaries
NOTES TO THE CONSOLIDATED INTERIM CONDENSED FINANCIAL STATEMENTS (Continued)
At 30 June 2006
9 INTEREST BEARING LOANS AND BORROWINGS
30 June 31 December2006 2005
USD’000 USD’000
(Unaudited) (Audited)
US dollar bonds and notes 2007-2027 (unsecured) . . . . . . . . . . . . . . . . . . . 23,100 —Term loans: secured . . . . . . . . . . . . . . . . . . . . . . . . . . . . . . . . . . . . . . . . . 6,198,206 1,656,205
unsecured . . . . . . . . . . . . . . . . . . . . . . . . . . . . . . . . . . . . . . . 942,200 —Finance leases . . . . . . . . . . . . . . . . . . . . . . . . . . . . . . . . . . . . . . . . . . . . . 85,300 —Mortgage loan and debentures stocks . . . . . . . . . . . . . . . . . . . . . . . . . . . . . 136,922 3,062Unsecured loan stock . . . . . . . . . . . . . . . . . . . . . . . . . . . . . . . . . . . . . . . . 6,100 —
7,391,828 1,659,267
The secured term loans include USD 6,188 million drawn under a USD 6,800 million credit facilityobtained during 2005 by the Group (Thunder FZE and the Authority) along with a fellow subsidiary ofPCFC (‘‘other joint borrower’’) from its bankers. The purpose of that credit facility was to fund theacquisition of Peninsular and Oriental Steam Navigation Company (a Public Limited Company registeredin United Kingdom). The balance amount in the credit facility was drawn by the other joint borrower.
The credit facility was jointly and severally guaranteed by the Group and other joint borrower. The creditfacility is also secured by a charge over all of the shares and stock acquired in Peninsular and OrientalSteam Navigation Company (note 6). The term loan carries interest at floating interest rates.
On 15 March 2007, the bankers have agreed to release the other joint borrower as a guarantor in respect ofthe above mentioned USD 6,188 million term loan.
Under the terms of the loan agreement, the loan is fully repayable after five years from the date of the loanagreement.
Group loans are denominated in the following currencies:
30 June 31 December2006 2005
USD’000 USD’000
(Unaudited) (Audited)
Sterling . . . . . . . . . . . . . . . . . . . . . . . . . . . . . . . . . . . . . . . . . . . . . . . . . . 266,800 —US Dollars . . . . . . . . . . . . . . . . . . . . . . . . . . . . . . . . . . . . . . . . . . . . . . . . 6,407,672 1,650,674Canadian Dollars . . . . . . . . . . . . . . . . . . . . . . . . . . . . . . . . . . . . . . . . . . . 179,600 —Australian Dollars . . . . . . . . . . . . . . . . . . . . . . . . . . . . . . . . . . . . . . . . . . . 128,200 —Euro . . . . . . . . . . . . . . . . . . . . . . . . . . . . . . . . . . . . . . . . . . . . . . . . . . . . 14,600 5,531Indian Rupees . . . . . . . . . . . . . . . . . . . . . . . . . . . . . . . . . . . . . . . . . . . . . 300,197 —Other . . . . . . . . . . . . . . . . . . . . . . . . . . . . . . . . . . . . . . . . . . . . . . . . . . . . 94,759 3,062
7,391,828 1,659,267
10 SEGMENT INFORMATION
Following the acquisition of P&O during 2006 (note 1), the primary segment reporting format was changedto business segments as the Group’s risks and rates of return are now affected predominantly by differentbusiness segments in which the Group operates. Secondary information is reported geographically. During2005, the Group had only one major business segment; being port operations and for reporting purposes itused to segment those operations by geographical locations. However, with the acquisition of P&O, 2005comparatives have been changed in accordance with 2006 presentation. The operating businesses areorganised and managed separately according to the nature of the services provided, with each segmentrepresenting a strategic business unit that offers different services and also serves a different market.
F-43
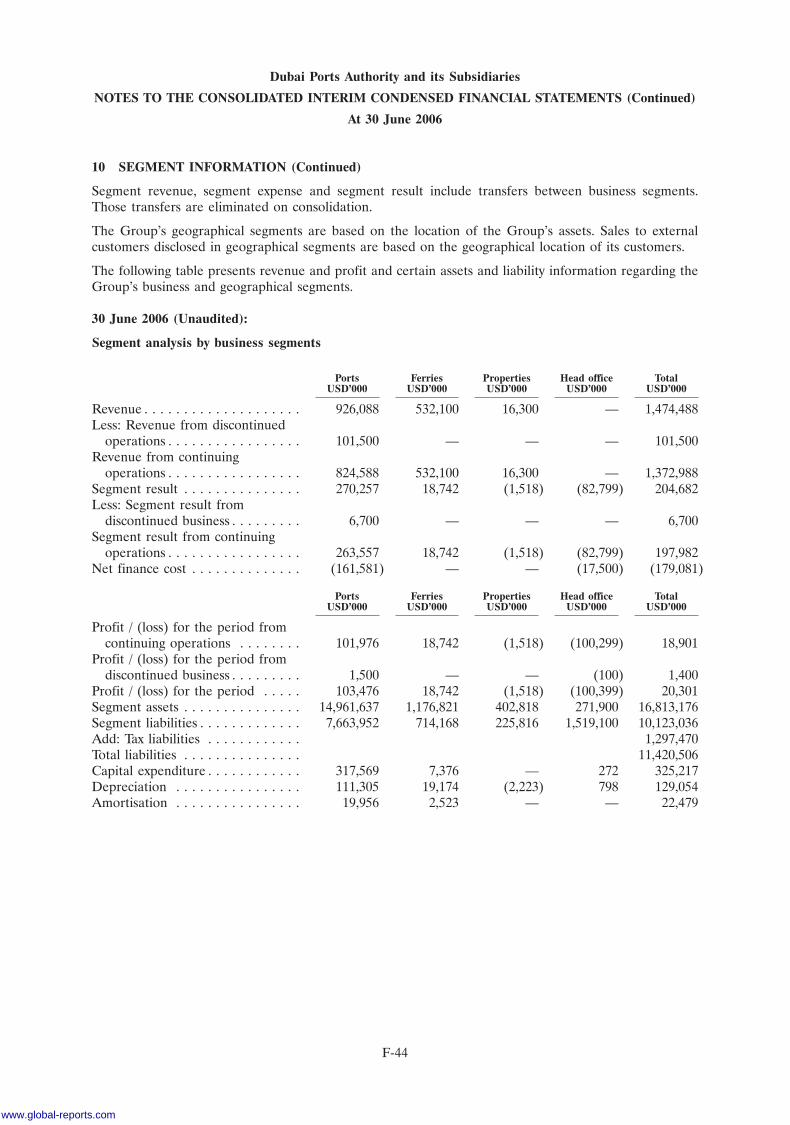
Dubai Ports Authority and its Subsidiaries
NOTES TO THE CONSOLIDATED INTERIM CONDENSED FINANCIAL STATEMENTS (Continued)
At 30 June 2006
10 SEGMENT INFORMATION (Continued)
Segment revenue, segment expense and segment result include transfers between business segments.Those transfers are eliminated on consolidation.
The Group’s geographical segments are based on the location of the Group’s assets. Sales to externalcustomers disclosed in geographical segments are based on the geographical location of its customers.
The following table presents revenue and profit and certain assets and liability information regarding theGroup’s business and geographical segments.
30 June 2006 (Unaudited):
Segment analysis by business segments
Ports Ferries Properties Head office TotalUSD’000 USD’000 USD’000 USD’000 USD’000
Revenue . . . . . . . . . . . . . . . . . . . . 926,088 532,100 16,300 — 1,474,488Less: Revenue from discontinued
operations . . . . . . . . . . . . . . . . . 101,500 — — — 101,500Revenue from continuing
operations . . . . . . . . . . . . . . . . . 824,588 532,100 16,300 — 1,372,988Segment result . . . . . . . . . . . . . . . 270,257 18,742 (1,518) (82,799) 204,682Less: Segment result from
discontinued business . . . . . . . . . 6,700 — — — 6,700Segment result from continuing
operations . . . . . . . . . . . . . . . . . 263,557 18,742 (1,518) (82,799) 197,982Net finance cost . . . . . . . . . . . . . . (161,581) — — (17,500) (179,081)
Ports Ferries Properties Head office TotalUSD’000 USD’000 USD’000 USD’000 USD’000
Profit / (loss) for the period fromcontinuing operations . . . . . . . . 101,976 18,742 (1,518) (100,299) 18,901
Profit / (loss) for the period fromdiscontinued business . . . . . . . . . 1,500 — — (100) 1,400
Profit / (loss) for the period . . . . . 103,476 18,742 (1,518) (100,399) 20,301Segment assets . . . . . . . . . . . . . . . 14,961,637 1,176,821 402,818 271,900 16,813,176Segment liabilities . . . . . . . . . . . . . 7,663,952 714,168 225,816 1,519,100 10,123,036Add: Tax liabilities . . . . . . . . . . . . 1,297,470Total liabilities . . . . . . . . . . . . . . . 11,420,506Capital expenditure . . . . . . . . . . . . 317,569 7,376 — 272 325,217Depreciation . . . . . . . . . . . . . . . . 111,305 19,174 (2,223) 798 129,054Amortisation . . . . . . . . . . . . . . . . 19,956 2,523 — — 22,479
F-44
www.global-reports.com
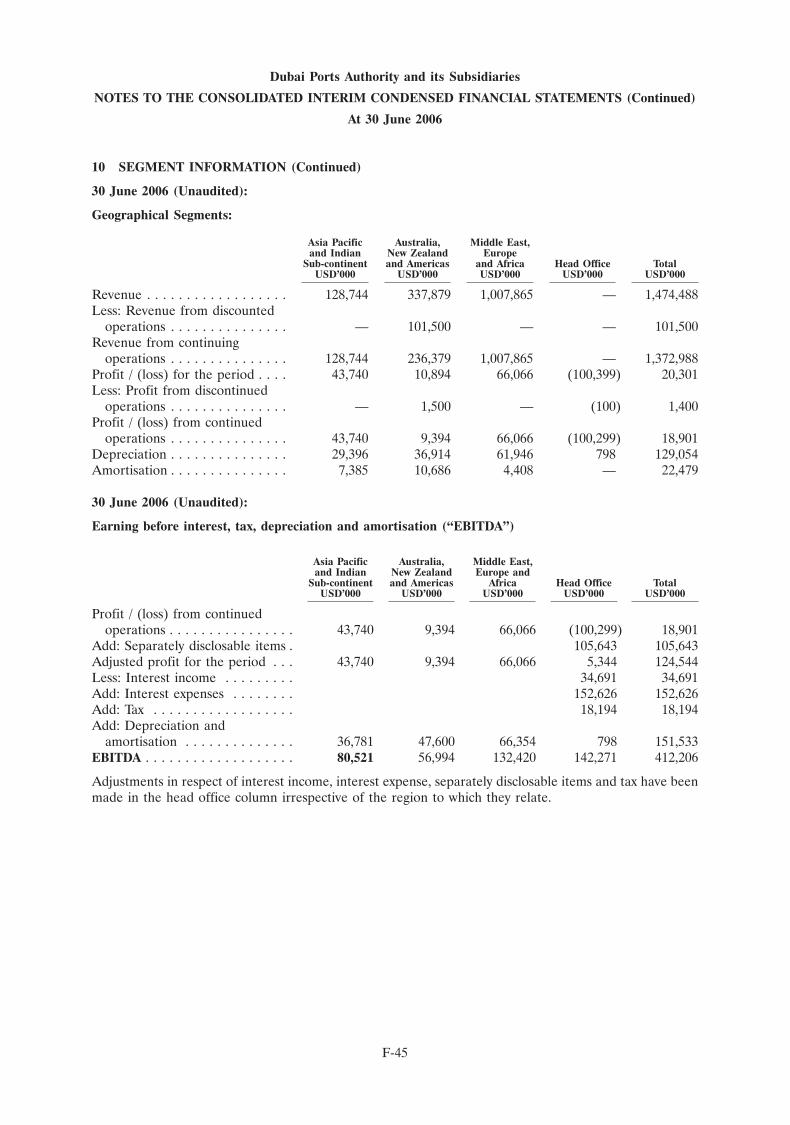
Dubai Ports Authority and its Subsidiaries
NOTES TO THE CONSOLIDATED INTERIM CONDENSED FINANCIAL STATEMENTS (Continued)
At 30 June 2006
10 SEGMENT INFORMATION (Continued)
30 June 2006 (Unaudited):
Geographical Segments:
Asia Pacific Australia, Middle East,and Indian New Zealand Europe
Sub-continent and Americas and Africa Head Office TotalUSD’000 USD’000 USD’000 USD’000 USD’000
Revenue . . . . . . . . . . . . . . . . . . 128,744 337,879 1,007,865 — 1,474,488Less: Revenue from discounted
operations . . . . . . . . . . . . . . . — 101,500 — — 101,500Revenue from continuing
operations . . . . . . . . . . . . . . . 128,744 236,379 1,007,865 — 1,372,988Profit / (loss) for the period . . . . 43,740 10,894 66,066 (100,399) 20,301Less: Profit from discontinued
operations . . . . . . . . . . . . . . . — 1,500 — (100) 1,400Profit / (loss) from continued
operations . . . . . . . . . . . . . . . 43,740 9,394 66,066 (100,299) 18,901Depreciation . . . . . . . . . . . . . . . 29,396 36,914 61,946 798 129,054Amortisation . . . . . . . . . . . . . . . 7,385 10,686 4,408 — 22,479
30 June 2006 (Unaudited):
Earning before interest, tax, depreciation and amortisation (‘‘EBITDA’’)
Asia Pacific Australia, Middle East,and Indian New Zealand Europe and
Sub-continent and Americas Africa Head Office TotalUSD’000 USD’000 USD’000 USD’000 USD’000
Profit / (loss) from continuedoperations . . . . . . . . . . . . . . . . 43,740 9,394 66,066 (100,299) 18,901
Add: Separately disclosable items . 105,643 105,643Adjusted profit for the period . . . 43,740 9,394 66,066 5,344 124,544Less: Interest income . . . . . . . . . 34,691 34,691Add: Interest expenses . . . . . . . . 152,626 152,626Add: Tax . . . . . . . . . . . . . . . . . . 18,194 18,194Add: Depreciation and
amortisation . . . . . . . . . . . . . . 36,781 47,600 66,354 798 151,533EBITDA . . . . . . . . . . . . . . . . . . . 80,521 56,994 132,420 142,271 412,206
Adjustments in respect of interest income, interest expense, separately disclosable items and tax have beenmade in the head office column irrespective of the region to which they relate.
F-45
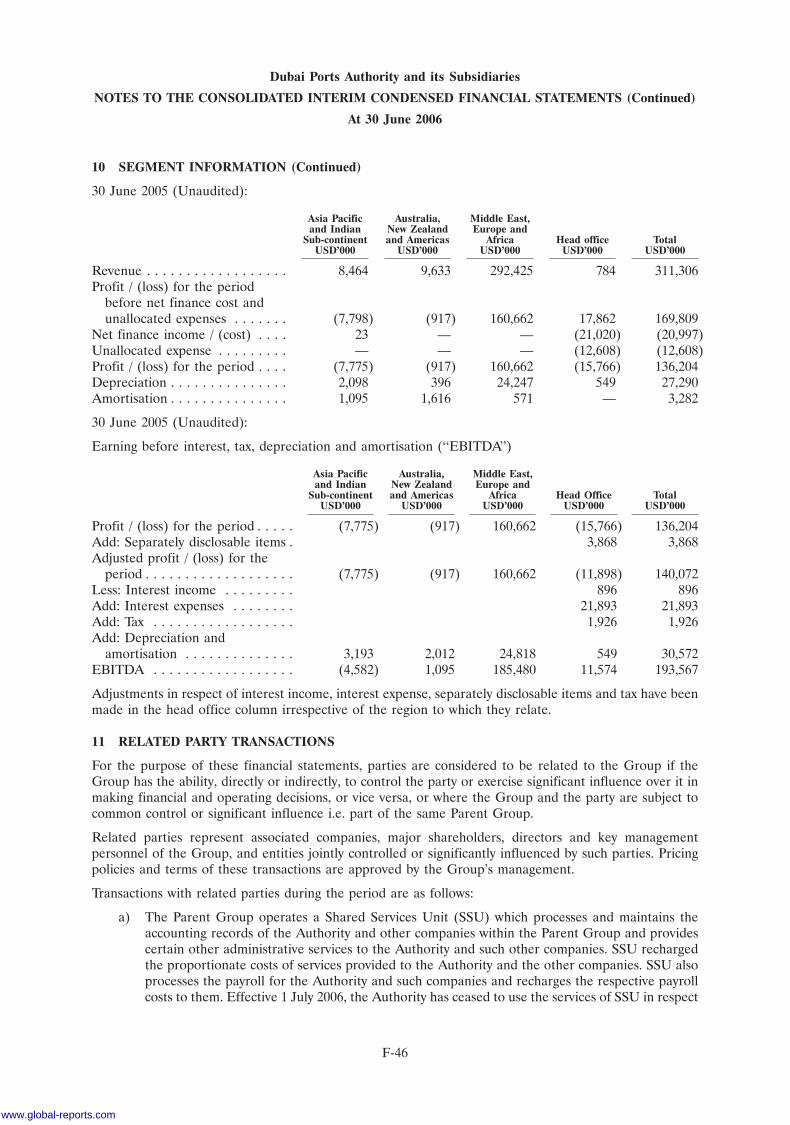
Dubai Ports Authority and its Subsidiaries
NOTES TO THE CONSOLIDATED INTERIM CONDENSED FINANCIAL STATEMENTS (Continued)
At 30 June 2006
10 SEGMENT INFORMATION (Continued)
30 June 2005 (Unaudited):
Asia Pacific Australia, Middle East,and Indian New Zealand Europe and
Sub-continent and Americas Africa Head office TotalUSD’000 USD’000 USD’000 USD’000 USD’000
Revenue . . . . . . . . . . . . . . . . . . 8,464 9,633 292,425 784 311,306Profit / (loss) for the period
before net finance cost andunallocated expenses . . . . . . . (7,798) (917) 160,662 17,862 169,809
Net finance income / (cost) . . . . 23 — — (21,020) (20,997)Unallocated expense . . . . . . . . . — — — (12,608) (12,608)Profit / (loss) for the period . . . . (7,775) (917) 160,662 (15,766) 136,204Depreciation . . . . . . . . . . . . . . . 2,098 396 24,247 549 27,290Amortisation . . . . . . . . . . . . . . . 1,095 1,616 571 — 3,282
30 June 2005 (Unaudited):
Earning before interest, tax, depreciation and amortisation (‘‘EBITDA’’)
Asia Pacific Australia, Middle East,and Indian New Zealand Europe and
Sub-continent and Americas Africa Head Office TotalUSD’000 USD’000 USD’000 USD’000 USD’000
Profit / (loss) for the period . . . . . (7,775) (917) 160,662 (15,766) 136,204Add: Separately disclosable items . 3,868 3,868Adjusted profit / (loss) for the
period . . . . . . . . . . . . . . . . . . . (7,775) (917) 160,662 (11,898) 140,072Less: Interest income . . . . . . . . . 896 896Add: Interest expenses . . . . . . . . 21,893 21,893Add: Tax . . . . . . . . . . . . . . . . . . 1,926 1,926Add: Depreciation and
amortisation . . . . . . . . . . . . . . 3,193 2,012 24,818 549 30,572EBITDA . . . . . . . . . . . . . . . . . . (4,582) 1,095 185,480 11,574 193,567
Adjustments in respect of interest income, interest expense, separately disclosable items and tax have beenmade in the head office column irrespective of the region to which they relate.
11 RELATED PARTY TRANSACTIONS
For the purpose of these financial statements, parties are considered to be related to the Group if theGroup has the ability, directly or indirectly, to control the party or exercise significant influence over it inmaking financial and operating decisions, or vice versa, or where the Group and the party are subject tocommon control or significant influence i.e. part of the same Parent Group.
Related parties represent associated companies, major shareholders, directors and key managementpersonnel of the Group, and entities jointly controlled or significantly influenced by such parties. Pricingpolicies and terms of these transactions are approved by the Group’s management.
Transactions with related parties during the period are as follows:
a) The Parent Group operates a Shared Services Unit (SSU) which processes and maintains theaccounting records of the Authority and other companies within the Parent Group and providescertain other administrative services to the Authority and such other companies. SSU rechargedthe proportionate costs of services provided to the Authority and the other companies. SSU alsoprocesses the payroll for the Authority and such companies and recharges the respective payrollcosts to them. Effective 1 July 2006, the Authority has ceased to use the services of SSU in respect
F-46
www.global-reports.com
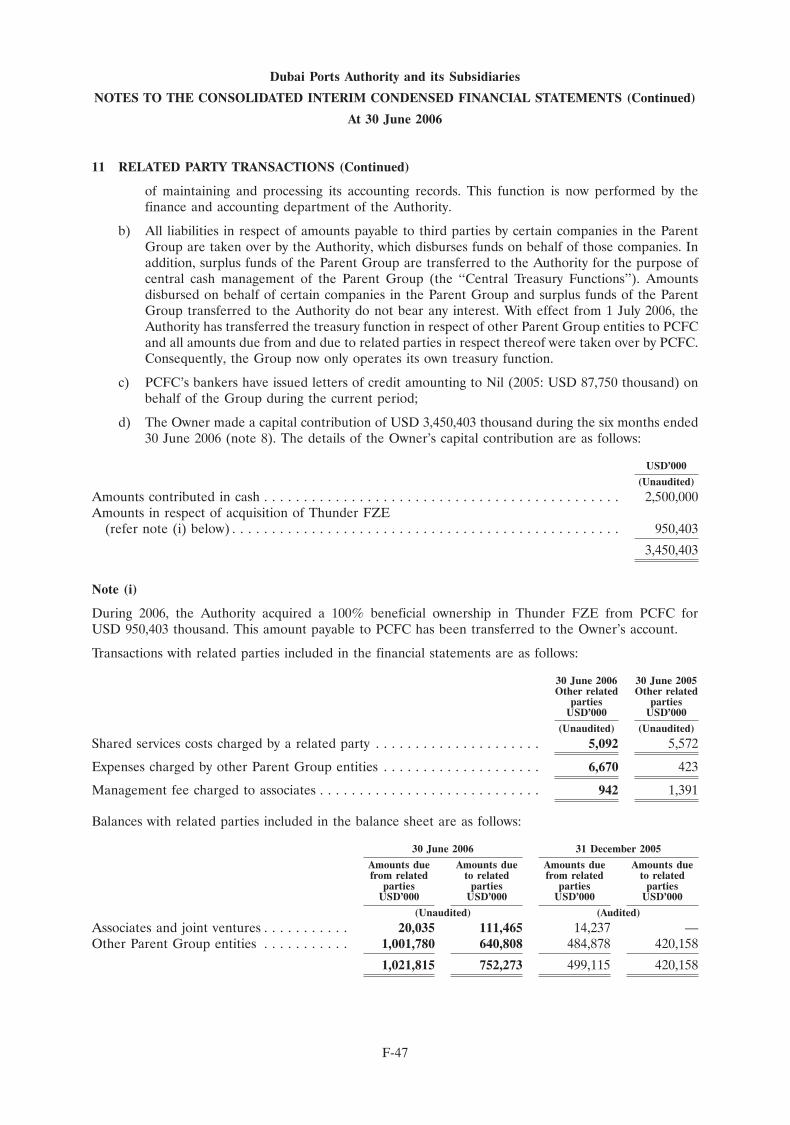
Dubai Ports Authority and its Subsidiaries
NOTES TO THE CONSOLIDATED INTERIM CONDENSED FINANCIAL STATEMENTS (Continued)
At 30 June 2006
11 RELATED PARTY TRANSACTIONS (Continued)
of maintaining and processing its accounting records. This function is now performed by thefinance and accounting department of the Authority.
b) All liabilities in respect of amounts payable to third parties by certain companies in the ParentGroup are taken over by the Authority, which disburses funds on behalf of those companies. Inaddition, surplus funds of the Parent Group are transferred to the Authority for the purpose ofcentral cash management of the Parent Group (the ‘‘Central Treasury Functions’’). Amountsdisbursed on behalf of certain companies in the Parent Group and surplus funds of the ParentGroup transferred to the Authority do not bear any interest. With effect from 1 July 2006, theAuthority has transferred the treasury function in respect of other Parent Group entities to PCFCand all amounts due from and due to related parties in respect thereof were taken over by PCFC.Consequently, the Group now only operates its own treasury function.
c) PCFC’s bankers have issued letters of credit amounting to Nil (2005: USD 87,750 thousand) onbehalf of the Group during the current period;
d) The Owner made a capital contribution of USD 3,450,403 thousand during the six months ended30 June 2006 (note 8). The details of the Owner’s capital contribution are as follows:
USD’000
(Unaudited)
Amounts contributed in cash . . . . . . . . . . . . . . . . . . . . . . . . . . . . . . . . . . . . . . . . . . . . . 2,500,000Amounts in respect of acquisition of Thunder FZE
(refer note (i) below) . . . . . . . . . . . . . . . . . . . . . . . . . . . . . . . . . . . . . . . . . . . . . . . . . 950,403
3,450,403
Note (i)
During 2006, the Authority acquired a 100% beneficial ownership in Thunder FZE from PCFC forUSD 950,403 thousand. This amount payable to PCFC has been transferred to the Owner’s account.
Transactions with related parties included in the financial statements are as follows:
30 June 2006 30 June 2005Other related Other related
parties partiesUSD’000 USD’000
(Unaudited) (Unaudited)
Shared services costs charged by a related party . . . . . . . . . . . . . . . . . . . . . 5,092 5,572
Expenses charged by other Parent Group entities . . . . . . . . . . . . . . . . . . . . 6,670 423
Management fee charged to associates . . . . . . . . . . . . . . . . . . . . . . . . . . . . 942 1,391
Balances with related parties included in the balance sheet are as follows:
30 June 2006 31 December 2005
Amounts due Amounts due Amounts due Amounts duefrom related to related from related to related
parties parties parties partiesUSD’000 USD’000 USD’000 USD’000
(Unaudited) (Audited)
Associates and joint ventures . . . . . . . . . . . 20,035 111,465 14,237 —Other Parent Group entities . . . . . . . . . . . 1,001,780 640,808 484,878 420,158
1,021,815 752,273 499,115 420,158
F-47
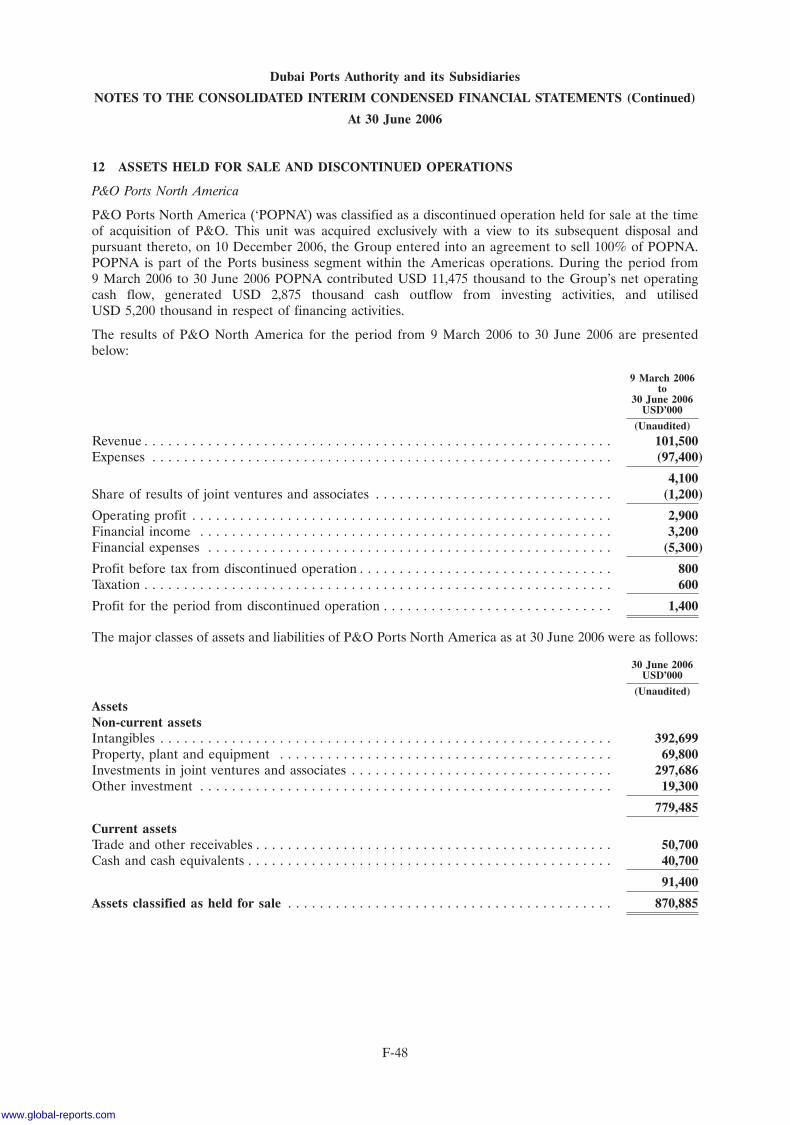
Dubai Ports Authority and its Subsidiaries
NOTES TO THE CONSOLIDATED INTERIM CONDENSED FINANCIAL STATEMENTS (Continued)
At 30 June 2006
12 ASSETS HELD FOR SALE AND DISCONTINUED OPERATIONS
P&O Ports North America
P&O Ports North America (‘POPNA’) was classified as a discontinued operation held for sale at the timeof acquisition of P&O. This unit was acquired exclusively with a view to its subsequent disposal andpursuant thereto, on 10 December 2006, the Group entered into an agreement to sell 100% of POPNA.POPNA is part of the Ports business segment within the Americas operations. During the period from9 March 2006 to 30 June 2006 POPNA contributed USD 11,475 thousand to the Group’s net operatingcash flow, generated USD 2,875 thousand cash outflow from investing activities, and utilisedUSD 5,200 thousand in respect of financing activities.
The results of P&O North America for the period from 9 March 2006 to 30 June 2006 are presentedbelow:
9 March 2006to
30 June 2006USD’000
(Unaudited)
Revenue . . . . . . . . . . . . . . . . . . . . . . . . . . . . . . . . . . . . . . . . . . . . . . . . . . . . . . . . . . . 101,500Expenses . . . . . . . . . . . . . . . . . . . . . . . . . . . . . . . . . . . . . . . . . . . . . . . . . . . . . . . . . . (97,400)
4,100Share of results of joint ventures and associates . . . . . . . . . . . . . . . . . . . . . . . . . . . . . . (1,200)
Operating profit . . . . . . . . . . . . . . . . . . . . . . . . . . . . . . . . . . . . . . . . . . . . . . . . . . . . . 2,900Financial income . . . . . . . . . . . . . . . . . . . . . . . . . . . . . . . . . . . . . . . . . . . . . . . . . . . . 3,200Financial expenses . . . . . . . . . . . . . . . . . . . . . . . . . . . . . . . . . . . . . . . . . . . . . . . . . . . (5,300)
Profit before tax from discontinued operation . . . . . . . . . . . . . . . . . . . . . . . . . . . . . . . . 800Taxation . . . . . . . . . . . . . . . . . . . . . . . . . . . . . . . . . . . . . . . . . . . . . . . . . . . . . . . . . . . 600
Profit for the period from discontinued operation . . . . . . . . . . . . . . . . . . . . . . . . . . . . . 1,400
The major classes of assets and liabilities of P&O Ports North America as at 30 June 2006 were as follows:
30 June 2006USD’000
(Unaudited)
AssetsNon-current assetsIntangibles . . . . . . . . . . . . . . . . . . . . . . . . . . . . . . . . . . . . . . . . . . . . . . . . . . . . . . . . . 392,699Property, plant and equipment . . . . . . . . . . . . . . . . . . . . . . . . . . . . . . . . . . . . . . . . . . 69,800Investments in joint ventures and associates . . . . . . . . . . . . . . . . . . . . . . . . . . . . . . . . . 297,686Other investment . . . . . . . . . . . . . . . . . . . . . . . . . . . . . . . . . . . . . . . . . . . . . . . . . . . . 19,300
779,485
Current assetsTrade and other receivables . . . . . . . . . . . . . . . . . . . . . . . . . . . . . . . . . . . . . . . . . . . . . 50,700Cash and cash equivalents . . . . . . . . . . . . . . . . . . . . . . . . . . . . . . . . . . . . . . . . . . . . . . 40,700
91,400
Assets classified as held for sale . . . . . . . . . . . . . . . . . . . . . . . . . . . . . . . . . . . . . . . . . 870,885
F-48
www.global-reports.com
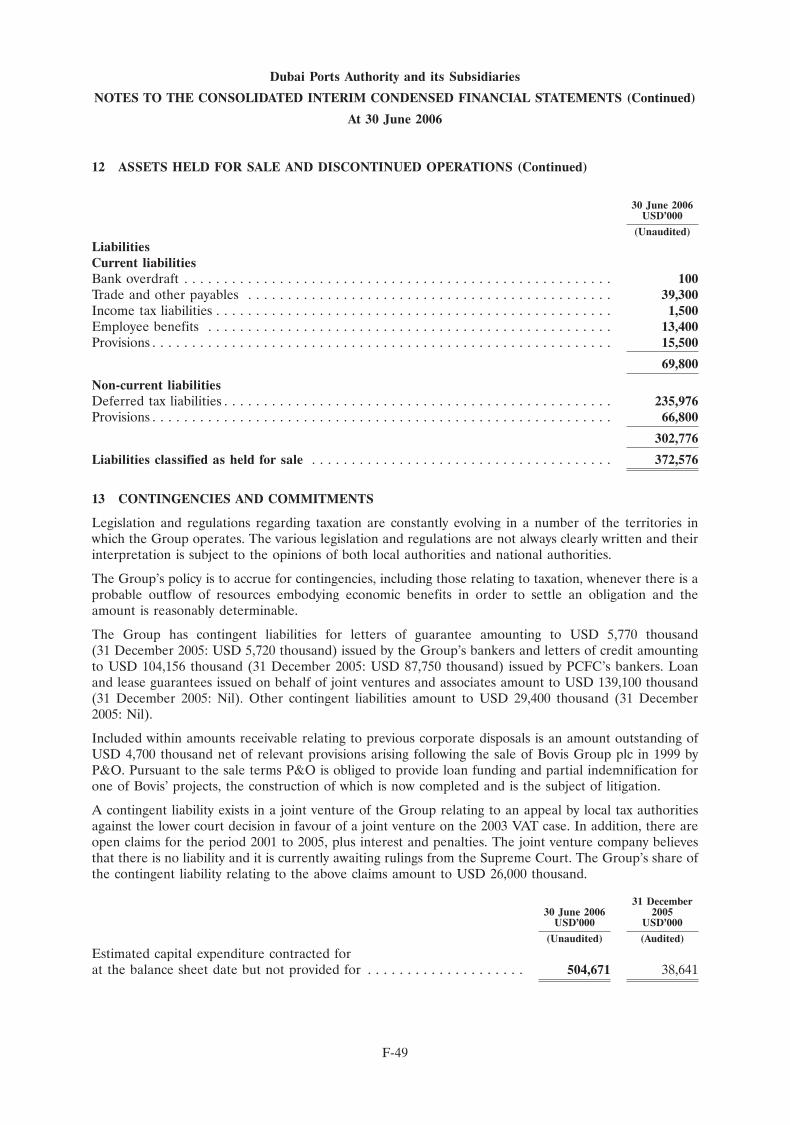
Dubai Ports Authority and its Subsidiaries
NOTES TO THE CONSOLIDATED INTERIM CONDENSED FINANCIAL STATEMENTS (Continued)
At 30 June 2006
12 ASSETS HELD FOR SALE AND DISCONTINUED OPERATIONS (Continued)
30 June 2006USD’000
(Unaudited)
LiabilitiesCurrent liabilitiesBank overdraft . . . . . . . . . . . . . . . . . . . . . . . . . . . . . . . . . . . . . . . . . . . . . . . . . . . . . . 100Trade and other payables . . . . . . . . . . . . . . . . . . . . . . . . . . . . . . . . . . . . . . . . . . . . . . 39,300Income tax liabilities . . . . . . . . . . . . . . . . . . . . . . . . . . . . . . . . . . . . . . . . . . . . . . . . . . 1,500Employee benefits . . . . . . . . . . . . . . . . . . . . . . . . . . . . . . . . . . . . . . . . . . . . . . . . . . . 13,400Provisions . . . . . . . . . . . . . . . . . . . . . . . . . . . . . . . . . . . . . . . . . . . . . . . . . . . . . . . . . . 15,500
69,800
Non-current liabilitiesDeferred tax liabilities . . . . . . . . . . . . . . . . . . . . . . . . . . . . . . . . . . . . . . . . . . . . . . . . . 235,976Provisions . . . . . . . . . . . . . . . . . . . . . . . . . . . . . . . . . . . . . . . . . . . . . . . . . . . . . . . . . . 66,800
302,776
Liabilities classified as held for sale . . . . . . . . . . . . . . . . . . . . . . . . . . . . . . . . . . . . . . 372,576
13 CONTINGENCIES AND COMMITMENTS
Legislation and regulations regarding taxation are constantly evolving in a number of the territories inwhich the Group operates. The various legislation and regulations are not always clearly written and theirinterpretation is subject to the opinions of both local authorities and national authorities.
The Group’s policy is to accrue for contingencies, including those relating to taxation, whenever there is aprobable outflow of resources embodying economic benefits in order to settle an obligation and theamount is reasonably determinable.
The Group has contingent liabilities for letters of guarantee amounting to USD 5,770 thousand(31 December 2005: USD 5,720 thousand) issued by the Group’s bankers and letters of credit amountingto USD 104,156 thousand (31 December 2005: USD 87,750 thousand) issued by PCFC’s bankers. Loanand lease guarantees issued on behalf of joint ventures and associates amount to USD 139,100 thousand(31 December 2005: Nil). Other contingent liabilities amount to USD 29,400 thousand (31 December2005: Nil).
Included within amounts receivable relating to previous corporate disposals is an amount outstanding ofUSD 4,700 thousand net of relevant provisions arising following the sale of Bovis Group plc in 1999 byP&O. Pursuant to the sale terms P&O is obliged to provide loan funding and partial indemnification forone of Bovis’ projects, the construction of which is now completed and is the subject of litigation.
A contingent liability exists in a joint venture of the Group relating to an appeal by local tax authoritiesagainst the lower court decision in favour of a joint venture on the 2003 VAT case. In addition, there areopen claims for the period 2001 to 2005, plus interest and penalties. The joint venture company believesthat there is no liability and it is currently awaiting rulings from the Supreme Court. The Group’s share ofthe contingent liability relating to the above claims amount to USD 26,000 thousand.
31 December30 June 2006 2005
USD’000 USD’000
(Unaudited) (Audited)
Estimated capital expenditure contracted forat the balance sheet date but not provided for . . . . . . . . . . . . . . . . . . . . 504,671 38,641
F-49
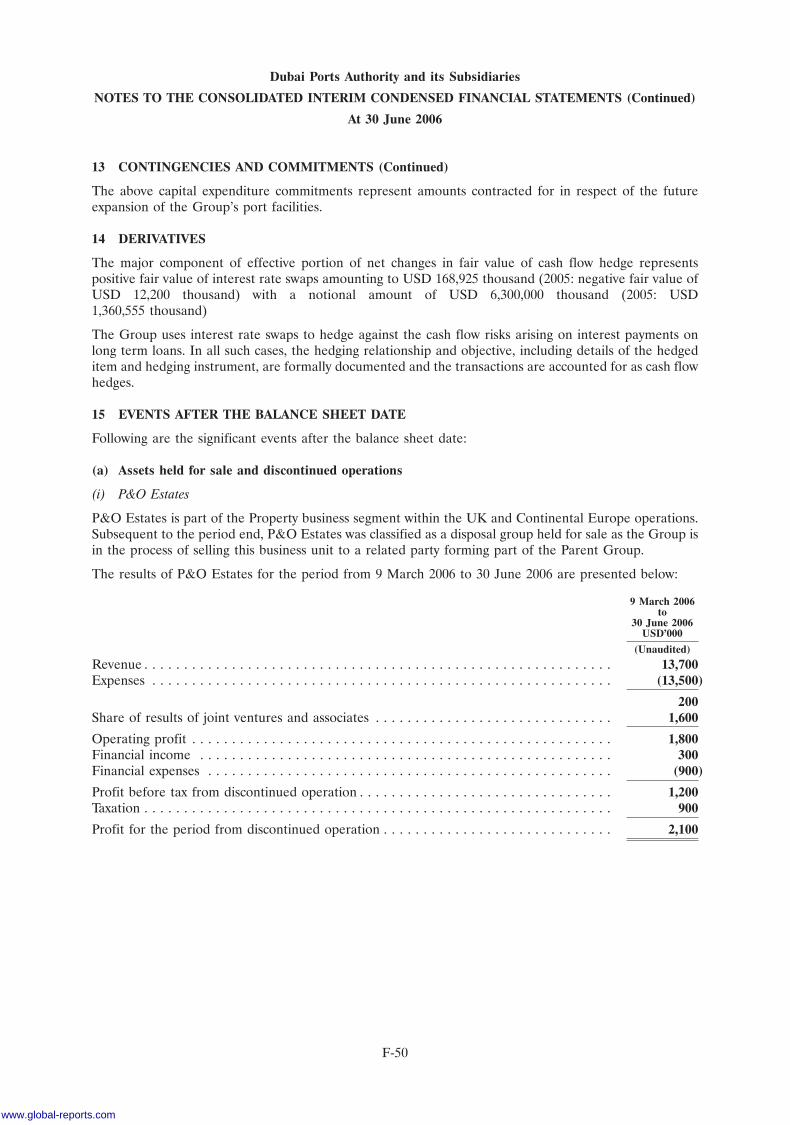
Dubai Ports Authority and its Subsidiaries
NOTES TO THE CONSOLIDATED INTERIM CONDENSED FINANCIAL STATEMENTS (Continued)
At 30 June 2006
13 CONTINGENCIES AND COMMITMENTS (Continued)
The above capital expenditure commitments represent amounts contracted for in respect of the futureexpansion of the Group’s port facilities.
14 DERIVATIVES
The major component of effective portion of net changes in fair value of cash flow hedge representspositive fair value of interest rate swaps amounting to USD 168,925 thousand (2005: negative fair value ofUSD 12,200 thousand) with a notional amount of USD 6,300,000 thousand (2005: USD1,360,555 thousand)
The Group uses interest rate swaps to hedge against the cash flow risks arising on interest payments onlong term loans. In all such cases, the hedging relationship and objective, including details of the hedgeditem and hedging instrument, are formally documented and the transactions are accounted for as cash flowhedges.
15 EVENTS AFTER THE BALANCE SHEET DATE
Following are the significant events after the balance sheet date:
(a) Assets held for sale and discontinued operations
(i) P&O Estates
P&O Estates is part of the Property business segment within the UK and Continental Europe operations.Subsequent to the period end, P&O Estates was classified as a disposal group held for sale as the Group isin the process of selling this business unit to a related party forming part of the Parent Group.
The results of P&O Estates for the period from 9 March 2006 to 30 June 2006 are presented below:
9 March 2006to
30 June 2006USD’000
(Unaudited)
Revenue . . . . . . . . . . . . . . . . . . . . . . . . . . . . . . . . . . . . . . . . . . . . . . . . . . . . . . . . . . . 13,700Expenses . . . . . . . . . . . . . . . . . . . . . . . . . . . . . . . . . . . . . . . . . . . . . . . . . . . . . . . . . . (13,500)
200Share of results of joint ventures and associates . . . . . . . . . . . . . . . . . . . . . . . . . . . . . . 1,600
Operating profit . . . . . . . . . . . . . . . . . . . . . . . . . . . . . . . . . . . . . . . . . . . . . . . . . . . . . 1,800Financial income . . . . . . . . . . . . . . . . . . . . . . . . . . . . . . . . . . . . . . . . . . . . . . . . . . . . 300Financial expenses . . . . . . . . . . . . . . . . . . . . . . . . . . . . . . . . . . . . . . . . . . . . . . . . . . . (900)
Profit before tax from discontinued operation . . . . . . . . . . . . . . . . . . . . . . . . . . . . . . . . 1,200Taxation . . . . . . . . . . . . . . . . . . . . . . . . . . . . . . . . . . . . . . . . . . . . . . . . . . . . . . . . . . . 900
Profit for the period from discontinued operation . . . . . . . . . . . . . . . . . . . . . . . . . . . . . 2,100
F-50
www.global-reports.com
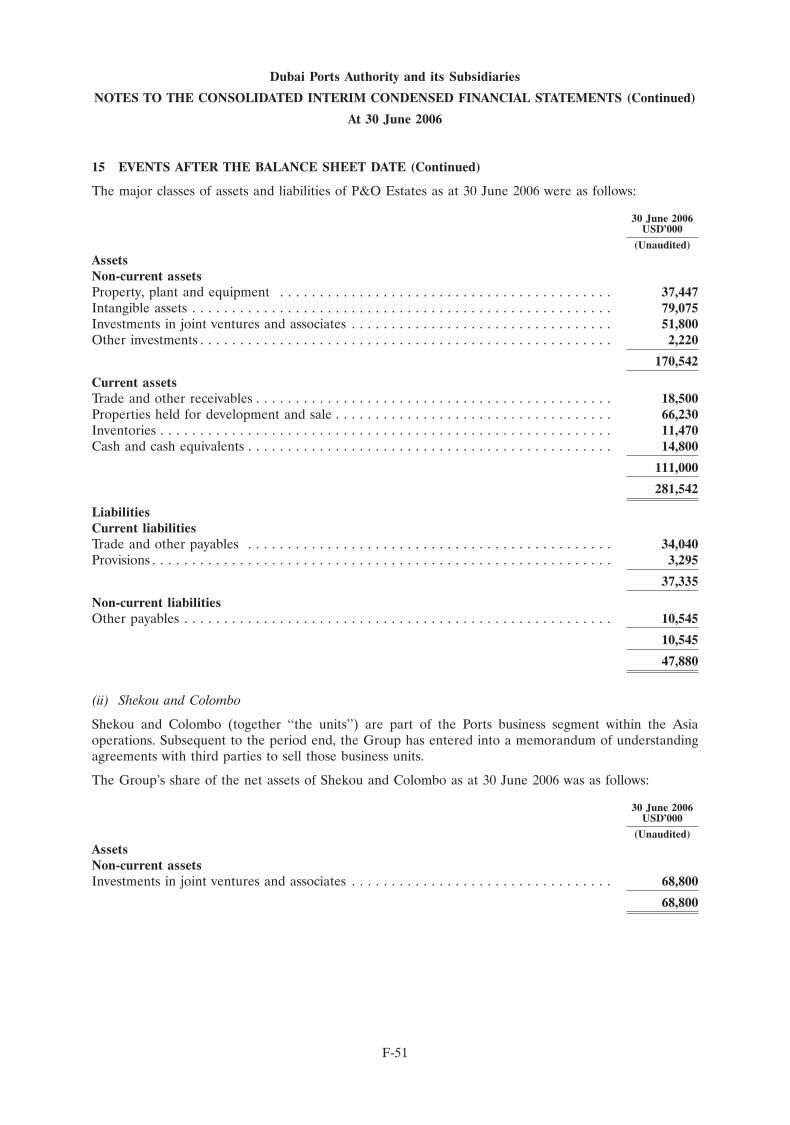
Dubai Ports Authority and its Subsidiaries
NOTES TO THE CONSOLIDATED INTERIM CONDENSED FINANCIAL STATEMENTS (Continued)
At 30 June 2006
15 EVENTS AFTER THE BALANCE SHEET DATE (Continued)
The major classes of assets and liabilities of P&O Estates as at 30 June 2006 were as follows:
30 June 2006USD’000
(Unaudited)
AssetsNon-current assetsProperty, plant and equipment . . . . . . . . . . . . . . . . . . . . . . . . . . . . . . . . . . . . . . . . . . 37,447Intangible assets . . . . . . . . . . . . . . . . . . . . . . . . . . . . . . . . . . . . . . . . . . . . . . . . . . . . . 79,075Investments in joint ventures and associates . . . . . . . . . . . . . . . . . . . . . . . . . . . . . . . . . 51,800Other investments . . . . . . . . . . . . . . . . . . . . . . . . . . . . . . . . . . . . . . . . . . . . . . . . . . . . 2,220
170,542
Current assetsTrade and other receivables . . . . . . . . . . . . . . . . . . . . . . . . . . . . . . . . . . . . . . . . . . . . . 18,500Properties held for development and sale . . . . . . . . . . . . . . . . . . . . . . . . . . . . . . . . . . . 66,230Inventories . . . . . . . . . . . . . . . . . . . . . . . . . . . . . . . . . . . . . . . . . . . . . . . . . . . . . . . . . 11,470Cash and cash equivalents . . . . . . . . . . . . . . . . . . . . . . . . . . . . . . . . . . . . . . . . . . . . . . 14,800
111,000
281,542
LiabilitiesCurrent liabilitiesTrade and other payables . . . . . . . . . . . . . . . . . . . . . . . . . . . . . . . . . . . . . . . . . . . . . . 34,040Provisions . . . . . . . . . . . . . . . . . . . . . . . . . . . . . . . . . . . . . . . . . . . . . . . . . . . . . . . . . . 3,295
37,335
Non-current liabilitiesOther payables . . . . . . . . . . . . . . . . . . . . . . . . . . . . . . . . . . . . . . . . . . . . . . . . . . . . . . 10,545
10,545
47,880
(ii) Shekou and Colombo
Shekou and Colombo (together ‘‘the units’’) are part of the Ports business segment within the Asiaoperations. Subsequent to the period end, the Group has entered into a memorandum of understandingagreements with third parties to sell those business units.
The Group’s share of the net assets of Shekou and Colombo as at 30 June 2006 was as follows:
30 June 2006USD’000
(Unaudited)
AssetsNon-current assetsInvestments in joint ventures and associates . . . . . . . . . . . . . . . . . . . . . . . . . . . . . . . . . 68,800
68,800
F-51
Dubai Ports Authority and its Subsidiaries
NOTES TO THE CONSOLIDATED INTERIM CONDENSED FINANCIAL STATEMENTS (Continued)
At 30 June 2006
15 EVENTS AFTER THE BALANCE SHEET DATE (Continued)
(b) Transfer of companies
On 1 January 2007, DP World FZE and Thunder FZE (Limited Liability Establishments registered in theJebel Ali Free Zone in the Emirate of Dubai, United Arab Emirates and wholly owned subsidiaries of theAuthority), were transferred to an affiliate of the Authority, DP World Limited (the ‘‘Company’’), aLimited Liability Company incorporated in Dubai International Financial Centre, Dubai, United ArabEmirates. The transfer was made at the carrying value of net assets of DP World FZE and Thunder FZEas of 31 December 2006 amounting to USD 8,132,655 thousand. As a result of this transfer, all the portsrelated commercial activities of the Group were transferred to the Company and the activities of theAuthority are now confined to the function of port regulator in respect of ports located in Dubai, UnitedArab Emirates. Consequently, only certain immaterial revenues and expenses now arise in the Authority.
F-52
www.global-reports.com
AUDITORS’ REPORT TO THE OWNER OFDUBAI PORTS AUTHORITY AND ITS SUBSIDIARIES
We have audited the accompanying financial statements of Dubai Ports Authority (the ‘‘Authority’’) and itssubsidiaries (together ‘‘the Group’’), which comprise the consolidated balance sheets as at 31 December2006 and 31 December 2005 and the consolidated income statements, consolidated statements ofrecognised income and expense and consolidated cash flow statements for the years then ended, and asummary of significant accounting policies and other explanatory notes.
Management’s Responsibility for the Financial Statements
Management is responsible for the preparation and fair presentation of these financial statements inaccordance with International Financial Reporting Standards. This responsibility includes: designing,implementing and maintaining internal control relevant to the preparation and fair presentation offinancial statements that are free from material misstatement, whether due to fraud or error; selecting andapplying appropriate accounting policies; and making accounting estimates that are reasonable in thecircumstances.
Auditors’ Responsibility
Our responsibility is to express an opinion on these financial statements based on our audits. Weconducted our audits in accordance with International Standards on Auditing. Those standards requirethat we comply with ethical requirements and plan and perform the audits to obtain reasonable assurancewhether the financial statements are free from material misstatement.
An audit involves performing procedures to obtain audit evidence about the amounts and disclosures inthe financial statements. The procedures selected depend on the auditors’ judgement, including theassessment of the risks of material misstatement of the financial statements, whether due to fraud or error.In making those risk assessments, the auditor considers internal control relevant to the entity’s preparationand fair presentation of the financial statements in order to design audit procedures that are appropriatefor the circumstances, but not for the purpose of expressing an opinion on the effectiveness of the entity’sinternal control. An audit also includes evaluating the appropriateness of accounting policies used and thereasonableness of accounting estimates made by management, as well as evaluating the overallpresentation of the financial statements.
We believe that the audit evidence we have obtained is sufficient and appropriate to provide a basis for ouraudit opinion.
Opinion
In our opinion, the consolidated financial statements give a true and fair view of the financial position ofthe Group as of 31 December 2006 and 31 December 2005, and of its financial performance and its cashflows for the years then ended in accordance with International Financial Reporting Standards.
/s/ Ernst & YoungErnst & Young
Signed by:Edward B QuinlanPartnerRegistration No. 93
15 March 2007
Dubai
F-53
Dubai Ports Authority and its Subsidiaries
Consolidated Statements of Income
Year ended 31 December 2006
Year ended 31 December 2006 Year ended 31 December 2005
Before Separately Before Separatelyseparately disclosable separately disclosabledisclosable items disclosable items
items (note 7) Total items (note 7) TotalUSD’000 USD’000 USD’000 USD’000 USD’000 USD’000
Continuing operations:Revenue from
operations . . . . . . . . 3,486,778 — 3,486,778 674,920 — 674,920Cost of sales . . . . . . . . (2,490,091) (32,400) (2,522,491) (288,299) — (288,299)
GROSS PROFIT . . . . . 996,687 (32,400) 964,287 386,621 — 386,621General and
administrationexpenses . . . . . . . . . 3 (473,470) (51,338) (524,808) (86,704) (7,713) (94,417)
523,217 (83,738) 439,479 299,917 (7,713) 292,204Other income . . . . . . . 4 25,933 17,000 42,933 1,434 — 1,434Interest income . . . . . . 95,113 — 95,113 3,407 — 3,407Finance costs . . . . . . . (341,936) (61,146) (403,082) (58,397) — (58,397)Share of profit of
associates and jointventures . . . . . . . . . 13 35,514 — 35,514 8,022 — 8,022
PROFIT BEFORE TAXFROMCONTINUINGOPERATIONS . . . . . 337,841 (127,884) 209,957 254,383 (7,713) 246,670
Income tax . . . . . . . . . 6 (20,577) 8,300 (12,277) (4,162) — (4,162)
PROFIT AFTER TAXFROMCONTINUINGOPERATIONS . . . . . 317,264 (119,584) 197,680 250,221 (7,713) 242,508
Discontinuedoperations:
Profit after tax fromdiscontinuedoperations . . . . . . . . 30 19,233 — 19,233 — — —
PROFIT FOR THEYEAR . . . . . . . . . . . 5 336,497 (119,584) 216,913 250,221 (7,713) 242,508
Attributable to:Equity holder of the
parent . . . . . . . . . . . 311,364 (119,584) 191,780 247,417 (7,713) 239,704Minority interests . . . . 25,133 — 25,133 2,804 — 2,804
336,497 (119,584) 216,913 250,221 (7,713) 242,508
The attached notes 1 to 33 form part of these financial statements.
F-54
www.global-reports.com
Dubai Ports Authority and its Subsidiaries
Consolidated Statements of Recognised Income and Expense
Year ended 31 December 2006
2006 2005USD’000 USD’000
Income and expense recognised directly in equityFair value movements in available for sale financial assets . . . . . . . . . . . . . . 2,200 —Foreign exchange translation differences . . . . . . . . . . . . . . . . . . . . . . . . . . 677,509 (15,015)Effective portion of net changes in fair value of cash flow hedge . . . . . . . . . 17,628 10,781Net actuarial gain on pension schemes . . . . . . . . . . . . . . . . . . . . . . . . . . . . 197,800 —
Income and expense recognised directly in equity . . . . . . . . . . . . . . . . . . . . 895,137 (4,234)
Transfers to income statementOn disposal of available for sale financial assets . . . . . . . . . . . . . . . . . . . . . (2,200) —On cash flow hedges . . . . . . . . . . . . . . . . . . . . . . . . . . . . . . . . . . . . . . . . . (881) —Tax on items taken directly to equity . . . . . . . . . . . . . . . . . . . . . . . . . . . . . 4,100 —
Profit for the year . . . . . . . . . . . . . . . . . . . . . . . . . . . . . . . . . . . . . . . . . . 216,913 242,508
Total recognised income and expense for the year . . . . . . . . . . . . . . . . . . . . 1,113,069 238,274
Attributable to:Equity holders of the parent . . . . . . . . . . . . . . . . . . . . . . . . . . . . . . . . . . . 1,083,636 235,470Minority interests . . . . . . . . . . . . . . . . . . . . . . . . . . . . . . . . . . . . . . . . . . . 29,433 2,804
1,113,069 238,274
The Group holds certain foreign currency borrowings as a hedge against net investments in foreigncurrency operations. Gains or losses on the retranslation of those borrowings are transferred to equity tooffset any gains or losses on translation of these net investments. Included in foreign exchange translationdifferences is a gain of USD 9,500 thousand (2005: Nil) in respect of foreign currency liability hedges ofnet investments in foreign currency operations.
Tax of USD 4,100 thousand (2005: Nil) has been credited directly to equity in the consolidated statementsof recognised income and expense. This consists of an income tax charge of USD 1,700 thousand arising onforeign exchange translation differences and a net tax credit of USD 3,800 thousand (USD 1,100 thousandincome tax plus USD 3,300 thousand deferred tax, less USD 600 thousand arising in joint ventures andassociates) arising on actuarial gains and losses and a credit of USD 2,000 thousand arising on otherpayments.
The effective portion of net changes in fair value of cash flow hedge mainly represents the increase inpositive fair value of interest rate swaps.
The attached notes 1 to 33 form part of these financial statements.
F-55
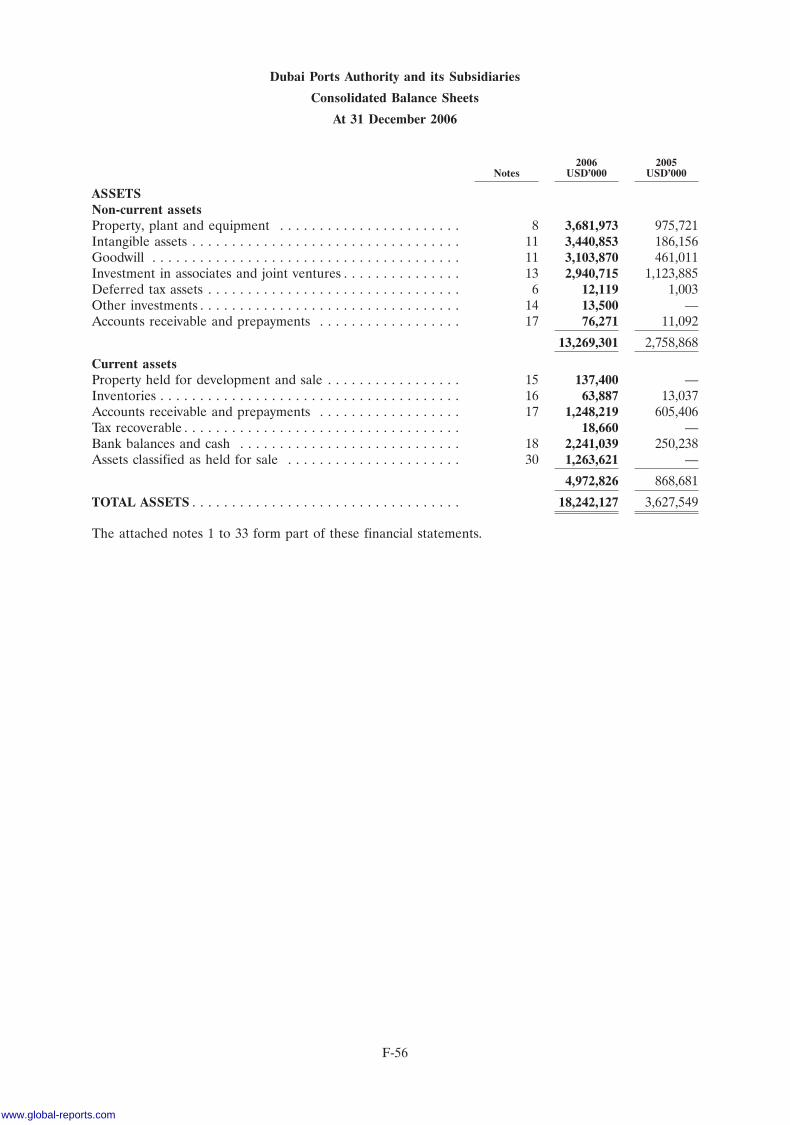
Dubai Ports Authority and its Subsidiaries
Consolidated Balance Sheets
At 31 December 2006
2006 2005Notes USD’000 USD’000
ASSETSNon-current assetsProperty, plant and equipment . . . . . . . . . . . . . . . . . . . . . . . 8 3,681,973 975,721Intangible assets . . . . . . . . . . . . . . . . . . . . . . . . . . . . . . . . . . 11 3,440,853 186,156Goodwill . . . . . . . . . . . . . . . . . . . . . . . . . . . . . . . . . . . . . . . 11 3,103,870 461,011Investment in associates and joint ventures . . . . . . . . . . . . . . . 13 2,940,715 1,123,885Deferred tax assets . . . . . . . . . . . . . . . . . . . . . . . . . . . . . . . . 6 12,119 1,003Other investments . . . . . . . . . . . . . . . . . . . . . . . . . . . . . . . . . 14 13,500 —Accounts receivable and prepayments . . . . . . . . . . . . . . . . . . 17 76,271 11,092
13,269,301 2,758,868
Current assetsProperty held for development and sale . . . . . . . . . . . . . . . . . 15 137,400 —Inventories . . . . . . . . . . . . . . . . . . . . . . . . . . . . . . . . . . . . . . 16 63,887 13,037Accounts receivable and prepayments . . . . . . . . . . . . . . . . . . 17 1,248,219 605,406Tax recoverable . . . . . . . . . . . . . . . . . . . . . . . . . . . . . . . . . . . 18,660 —Bank balances and cash . . . . . . . . . . . . . . . . . . . . . . . . . . . . 18 2,241,039 250,238Assets classified as held for sale . . . . . . . . . . . . . . . . . . . . . . 30 1,263,621 —
4,972,826 868,681
TOTAL ASSETS . . . . . . . . . . . . . . . . . . . . . . . . . . . . . . . . . . 18,242,127 3,627,549
The attached notes 1 to 33 form part of these financial statements.
F-56
www.global-reports.com
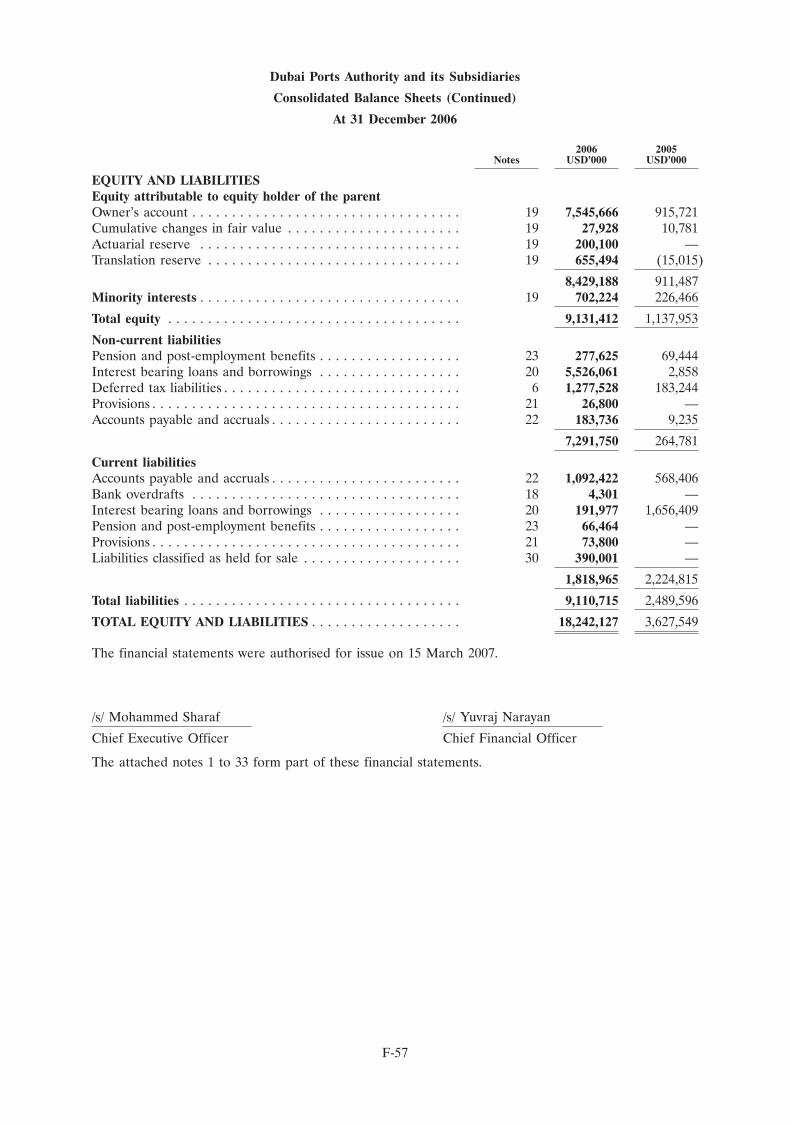
Dubai Ports Authority and its Subsidiaries
Consolidated Balance Sheets (Continued)
At 31 December 2006
2006 2005Notes USD’000 USD’000
EQUITY AND LIABILITIESEquity attributable to equity holder of the parentOwner’s account . . . . . . . . . . . . . . . . . . . . . . . . . . . . . . . . . . 19 7,545,666 915,721Cumulative changes in fair value . . . . . . . . . . . . . . . . . . . . . . 19 27,928 10,781Actuarial reserve . . . . . . . . . . . . . . . . . . . . . . . . . . . . . . . . . 19 200,100 —Translation reserve . . . . . . . . . . . . . . . . . . . . . . . . . . . . . . . . 19 655,494 (15,015)
8,429,188 911,487Minority interests . . . . . . . . . . . . . . . . . . . . . . . . . . . . . . . . . 19 702,224 226,466
Total equity . . . . . . . . . . . . . . . . . . . . . . . . . . . . . . . . . . . . . 9,131,412 1,137,953
Non-current liabilitiesPension and post-employment benefits . . . . . . . . . . . . . . . . . . 23 277,625 69,444Interest bearing loans and borrowings . . . . . . . . . . . . . . . . . . 20 5,526,061 2,858Deferred tax liabilities . . . . . . . . . . . . . . . . . . . . . . . . . . . . . . 6 1,277,528 183,244Provisions . . . . . . . . . . . . . . . . . . . . . . . . . . . . . . . . . . . . . . . 21 26,800 —Accounts payable and accruals . . . . . . . . . . . . . . . . . . . . . . . . 22 183,736 9,235
7,291,750 264,781
Current liabilitiesAccounts payable and accruals . . . . . . . . . . . . . . . . . . . . . . . . 22 1,092,422 568,406Bank overdrafts . . . . . . . . . . . . . . . . . . . . . . . . . . . . . . . . . . 18 4,301 —Interest bearing loans and borrowings . . . . . . . . . . . . . . . . . . 20 191,977 1,656,409Pension and post-employment benefits . . . . . . . . . . . . . . . . . . 23 66,464 —Provisions . . . . . . . . . . . . . . . . . . . . . . . . . . . . . . . . . . . . . . . 21 73,800 —Liabilities classified as held for sale . . . . . . . . . . . . . . . . . . . . 30 390,001 —
1,818,965 2,224,815
Total liabilities . . . . . . . . . . . . . . . . . . . . . . . . . . . . . . . . . . . 9,110,715 2,489,596
TOTAL EQUITY AND LIABILITIES . . . . . . . . . . . . . . . . . . . 18,242,127 3,627,549
The financial statements were authorised for issue on 15 March 2007.
/s/ Mohammed Sharaf /s/ Yuvraj Narayan
Chief Executive Officer Chief Financial Officer
The attached notes 1 to 33 form part of these financial statements.
F-57
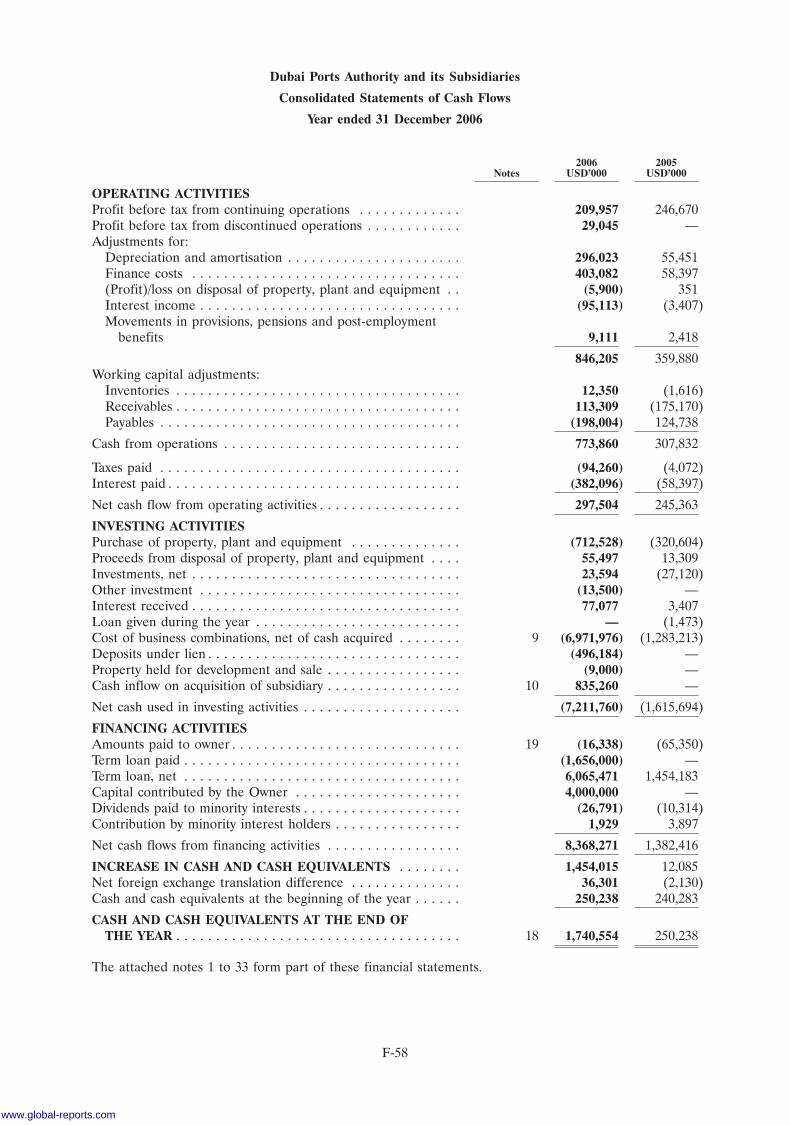
Dubai Ports Authority and its Subsidiaries
Consolidated Statements of Cash Flows
Year ended 31 December 2006
2006 2005Notes USD’000 USD’000
OPERATING ACTIVITIESProfit before tax from continuing operations . . . . . . . . . . . . . 209,957 246,670Profit before tax from discontinued operations . . . . . . . . . . . . 29,045 —Adjustments for:
Depreciation and amortisation . . . . . . . . . . . . . . . . . . . . . . 296,023 55,451Finance costs . . . . . . . . . . . . . . . . . . . . . . . . . . . . . . . . . . 403,082 58,397(Profit)/loss on disposal of property, plant and equipment . . (5,900) 351Interest income . . . . . . . . . . . . . . . . . . . . . . . . . . . . . . . . . (95,113) (3,407)Movements in provisions, pensions and post-employment
benefits 9,111 2,418
846,205 359,880Working capital adjustments:
Inventories . . . . . . . . . . . . . . . . . . . . . . . . . . . . . . . . . . . . 12,350 (1,616)Receivables . . . . . . . . . . . . . . . . . . . . . . . . . . . . . . . . . . . . 113,309 (175,170)Payables . . . . . . . . . . . . . . . . . . . . . . . . . . . . . . . . . . . . . . (198,004) 124,738
Cash from operations . . . . . . . . . . . . . . . . . . . . . . . . . . . . . . 773,860 307,832
Taxes paid . . . . . . . . . . . . . . . . . . . . . . . . . . . . . . . . . . . . . . (94,260) (4,072)Interest paid . . . . . . . . . . . . . . . . . . . . . . . . . . . . . . . . . . . . . (382,096) (58,397)
Net cash flow from operating activities . . . . . . . . . . . . . . . . . . 297,504 245,363
INVESTING ACTIVITIESPurchase of property, plant and equipment . . . . . . . . . . . . . . (712,528) (320,604)Proceeds from disposal of property, plant and equipment . . . . 55,497 13,309Investments, net . . . . . . . . . . . . . . . . . . . . . . . . . . . . . . . . . . 23,594 (27,120)Other investment . . . . . . . . . . . . . . . . . . . . . . . . . . . . . . . . . (13,500) —Interest received . . . . . . . . . . . . . . . . . . . . . . . . . . . . . . . . . . 77,077 3,407Loan given during the year . . . . . . . . . . . . . . . . . . . . . . . . . . — (1,473)Cost of business combinations, net of cash acquired . . . . . . . . 9 (6,971,976) (1,283,213)Deposits under lien . . . . . . . . . . . . . . . . . . . . . . . . . . . . . . . . (496,184) —Property held for development and sale . . . . . . . . . . . . . . . . . (9,000) —Cash inflow on acquisition of subsidiary . . . . . . . . . . . . . . . . . 10 835,260 —
Net cash used in investing activities . . . . . . . . . . . . . . . . . . . . (7,211,760) (1,615,694)
FINANCING ACTIVITIESAmounts paid to owner . . . . . . . . . . . . . . . . . . . . . . . . . . . . . 19 (16,338) (65,350)Term loan paid . . . . . . . . . . . . . . . . . . . . . . . . . . . . . . . . . . . (1,656,000) —Term loan, net . . . . . . . . . . . . . . . . . . . . . . . . . . . . . . . . . . . 6,065,471 1,454,183Capital contributed by the Owner . . . . . . . . . . . . . . . . . . . . . 4,000,000 —Dividends paid to minority interests . . . . . . . . . . . . . . . . . . . . (26,791) (10,314)Contribution by minority interest holders . . . . . . . . . . . . . . . . 1,929 3,897
Net cash flows from financing activities . . . . . . . . . . . . . . . . . 8,368,271 1,382,416
INCREASE IN CASH AND CASH EQUIVALENTS . . . . . . . . 1,454,015 12,085Net foreign exchange translation difference . . . . . . . . . . . . . . 36,301 (2,130)Cash and cash equivalents at the beginning of the year . . . . . . 250,238 240,283
CASH AND CASH EQUIVALENTS AT THE END OFTHE YEAR . . . . . . . . . . . . . . . . . . . . . . . . . . . . . . . . . . . . 18 1,740,554 250,238
The attached notes 1 to 33 form part of these financial statements.
F-58
www.global-reports.com
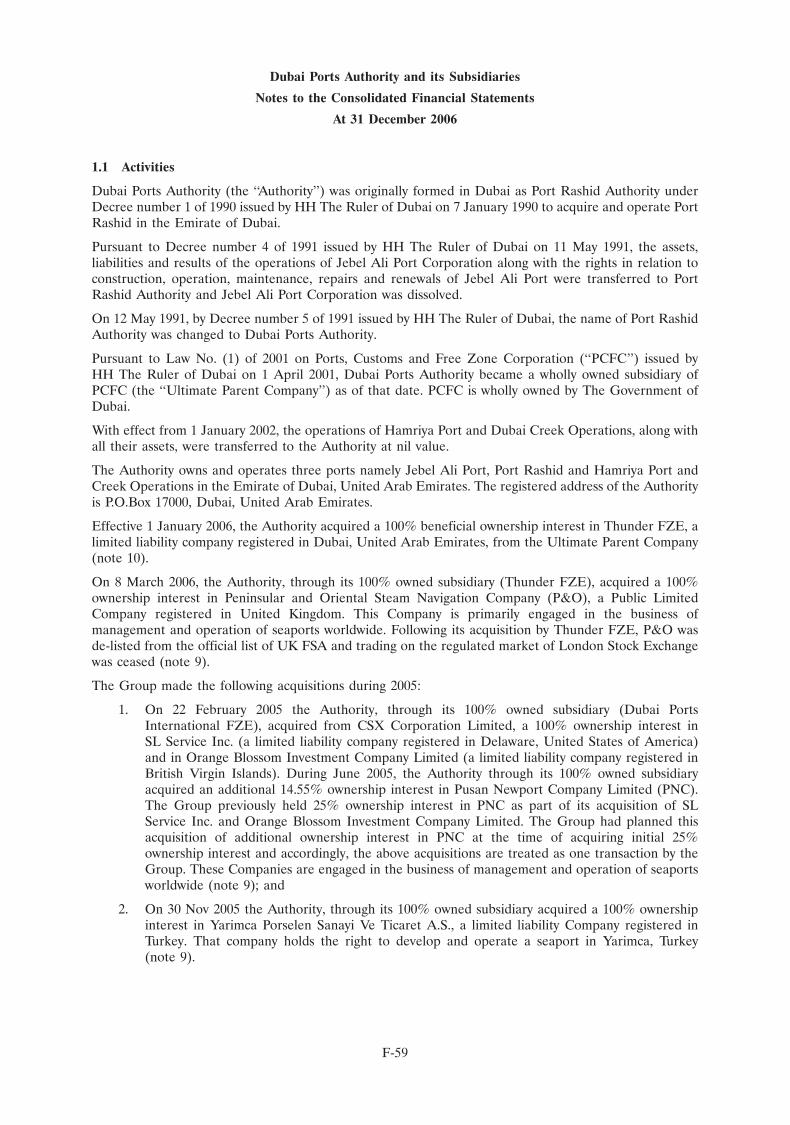
Dubai Ports Authority and its Subsidiaries
Notes to the Consolidated Financial Statements
At 31 December 2006
1.1 Activities
Dubai Ports Authority (the ‘‘Authority’’) was originally formed in Dubai as Port Rashid Authority underDecree number 1 of 1990 issued by HH The Ruler of Dubai on 7 January 1990 to acquire and operate PortRashid in the Emirate of Dubai.
Pursuant to Decree number 4 of 1991 issued by HH The Ruler of Dubai on 11 May 1991, the assets,liabilities and results of the operations of Jebel Ali Port Corporation along with the rights in relation toconstruction, operation, maintenance, repairs and renewals of Jebel Ali Port were transferred to PortRashid Authority and Jebel Ali Port Corporation was dissolved.
On 12 May 1991, by Decree number 5 of 1991 issued by HH The Ruler of Dubai, the name of Port RashidAuthority was changed to Dubai Ports Authority.
Pursuant to Law No. (1) of 2001 on Ports, Customs and Free Zone Corporation (‘‘PCFC’’) issued byHH The Ruler of Dubai on 1 April 2001, Dubai Ports Authority became a wholly owned subsidiary ofPCFC (the ‘‘Ultimate Parent Company’’) as of that date. PCFC is wholly owned by The Government ofDubai.
With effect from 1 January 2002, the operations of Hamriya Port and Dubai Creek Operations, along withall their assets, were transferred to the Authority at nil value.
The Authority owns and operates three ports namely Jebel Ali Port, Port Rashid and Hamriya Port andCreek Operations in the Emirate of Dubai, United Arab Emirates. The registered address of the Authorityis P.O.Box 17000, Dubai, United Arab Emirates.
Effective 1 January 2006, the Authority acquired a 100% beneficial ownership interest in Thunder FZE, alimited liability company registered in Dubai, United Arab Emirates, from the Ultimate Parent Company(note 10).
On 8 March 2006, the Authority, through its 100% owned subsidiary (Thunder FZE), acquired a 100%ownership interest in Peninsular and Oriental Steam Navigation Company (P&O), a Public LimitedCompany registered in United Kingdom. This Company is primarily engaged in the business ofmanagement and operation of seaports worldwide. Following its acquisition by Thunder FZE, P&O wasde-listed from the official list of UK FSA and trading on the regulated market of London Stock Exchangewas ceased (note 9).
The Group made the following acquisitions during 2005:
1. On 22 February 2005 the Authority, through its 100% owned subsidiary (Dubai PortsInternational FZE), acquired from CSX Corporation Limited, a 100% ownership interest inSL Service Inc. (a limited liability company registered in Delaware, United States of America)and in Orange Blossom Investment Company Limited (a limited liability company registered inBritish Virgin Islands). During June 2005, the Authority through its 100% owned subsidiaryacquired an additional 14.55% ownership interest in Pusan Newport Company Limited (PNC).The Group previously held 25% ownership interest in PNC as part of its acquisition of SLService Inc. and Orange Blossom Investment Company Limited. The Group had planned thisacquisition of additional ownership interest in PNC at the time of acquiring initial 25%ownership interest and accordingly, the above acquisitions are treated as one transaction by theGroup. These Companies are engaged in the business of management and operation of seaportsworldwide (note 9); and
2. On 30 Nov 2005 the Authority, through its 100% owned subsidiary acquired a 100% ownershipinterest in Yarimca Porselen Sanayi Ve Ticaret A.S., a limited liability Company registered inTurkey. That company holds the right to develop and operate a seaport in Yarimca, Turkey(note 9).
F-59
Dubai Ports Authority and its Subsidiaries
Notes to the Consolidated Financial Statements (Continued)
At 31 December 2006
1.2 Events after the Balance Sheet Date
On 1 January 2007, DP World FZE and Thunder FZE (Limited Liability Companies registered in theEmirate of Dubai, United Arab Emirates and wholly owned subsidiaries of the Authority), weretransferred to an affiliate of the Authority, Galaxy Investments Limited (the Company), a Limited LiabilityCompany incorporated in Dubai International Financial Centre, Dubai, United Arab Emirates. As a resultof this transfer, all the ports related commercial activities of the Group were transferred to the Companyand the activities of the Authority will be confined to the function of port regulator in respect of portslocated in Dubai, United Arab Emirates. Consequently, only certain immaterial revenues and expenses willarise in the Authority.
2.1 Basis of Preparation
The functional currency of the Authority is UAE Dirhams. However, the consolidated financial statementshave been presented in thousands of US Dollars, which management believes is the most appropriatereporting currency in view of the global presence of the Group.
Statement of compliance
These consolidated financial statements have been prepared in accordance with International FinancialReporting Standards (IFRS) and applicable requirements of UAE Law.
Basis of consolidation
The consolidated financial statements comprise the financial statements of Dubai Ports Authority and itssubsidiaries. The accounting policies used by the subsidiaries are consistent with the policies adopted bythe Group. All inter company balances and transactions are eliminated on consolidation.
Subsidiaries are fully consolidated from the date of acquisition, being the date on which the Group obtainscontrol, and continue to be consolidated until the date that such control ceases.
Non current assets (disposal groups) and discontinued operations that are classified as held for sale inaccordance with IFRS 5-Non-current Assets Held for Sale and Discontinued Operations are shown atlower of the cost and fair value less costs to sell.
Minority interests represent that portion, of profit or loss and net assets in certain subsidiaries, which is notheld by the Group and, as such, is presented separately in the consolidated statement of income and withinequity in the consolidated balance sheet, separately from owner’s equity.
2.2 Changes in Accounting Policies
The accounting policies adopted are consistent with those of the previous financial years’ except as follows:
The Group has adopted the following new and amended IFRS and IFRIC interpretations during 2006.Adoption of these revised standards and interpretations did not have any effect on the financial statementsof the Group. They did however give rise to additional disclosures.
� IAS 19 Amendment-Employee Benefits
� IAS 39 Amendments-Financial/instruments: Recognition and Measurement
� IFRIC 4 Determining whether an Arrangement contains a Lease
The principal effects of these changes are as follows:
IAS 19 Employee Benefits
As of 1 January 2006, the Group adopted the amendments to IAS 19. As a result, additional disclosuresare made providing information about trends in the assets and liabilities in its defined benefit plans and theassumptions underlying the components of the defined benefit cost. This change has resulted in additional
F-60
www.global-reports.com
Dubai Ports Authority and its Subsidiaries
Notes to the Consolidated Financial Statements (Continued)
At 31 December 2006
2.2 Changes in Accounting Policies (Continued)
disclosures being included for the years ending 31 December 2006 and 31 December 2005. The Group hasalso adopted the new option offered to recognise actuarial gains and losses outside of the incomestatement in a statement of recognised income and expenses. In the opinion of the management, thischange results in the consolidated financial statements providing reliable and more relevant informationabout the effects of transactions, other events or conditions on the Group’s financial position, financialperformance or cash flows. This change has no material recognition or measurement impact on thepreviously recognised equity or other comparative amounts.
IAS 39 Financial Instruments: Recognition and Measurement
Amendment for financial guarantee contracts (issued August 2005)—amended the scope of IAS 39 torequire financial guarantee contracts that are not considered to be insurance contracts to be recognisedinitially at fair value and to be remeasured at the higher of the amount determined in accordance withIAS 37 Provisions, Contingent Liabilities and Contingent Assets and the amount initially recognised less,when appropriate, cumulative amortisation recognised in accordance with IAS 18 Revenue. Thisamendment did not have an effect on the financial statements.
Amendment for hedges of forecast intragroup transactions (issued April 2005)—amended IAS 39 topermit the foreign currency risk of a highly probable intragroup forecast transaction to qualify as thehedged item in a cash flow hedge, provided that the transaction is denominated in a currency other thanthe functional currency of the entity entering into that transaction and that the foreign currency risk willaffect the consolidated income statement. As the Group currently has no such transactions, theamendment did not have an effect on the financial statements.
Amendment for the fair value option (issued June 2005)—amended IAS 39 to restrict the use of the optionto designate any financial asset or any financial liability to be measured at fair value through the incomestatement. The Group had not previously used this option, hence the amendment did not have an effect onthe financial statements.
IFRIC 4 Determining Whether an Arrangement contains a Lease
The Group adopted IFRIC Interpretation 4 as of 1 January 2006, which provides guidance in determiningwhether arrangements contain a lease to which lease accounting must be applied. This change inaccounting policy has not had a significant impact on the Group as at 31 December 2006 or 31 December2005.
The management has made the following other voluntary changes in their accounting policies during 2006.In the view of management those changes results in the financial statements providing reliable and morerelevant information about the effects of the transactions, other events or conditions on the Group’sfinancial position, financial performance or cash flows:
IAS 1 Presentation of financial statements
Due to the significance of certain item of income and expenses occurring during the year, the managementhas decided to present such items on the face of the income statements as separately disclosable items. Theaccounting policy of the management in respect of separately disclosable items is set out under note 2.3.This change has no material recognition or measurement impact on the previously recognised equity orother comparative amounts.
The management has decided to use the option available under IAS 1 Presentation of financial statementsto present the statement of recognised income and expense as a primary statement instead of statement ofchanges in equity, which was used in the previous years’. As a result of this change profit and loss for theyears, each item of income and expense for the years that is required by other standards or interpretationsto be recognised in equity and effects of changes in accounting policies that impacts the components ofequity are shown under the statement of recognised income and expense. The movement of capital andreserves is shown in the notes to the financial statements.
F-61
Dubai Ports Authority and its Subsidiaries
Notes to the Consolidated Financial Statements (Continued)
At 31 December 2006
2.3 Summary of Significant Accounting Policies
Revenue recognition
Revenue comprises amounts derived from the provision of goods and services (excluding VAT and similarsales taxes) and includes rent receivable from properties. Revenue from the provision of goods includesincome from the sale of properties held for development and sale, which is recognised when contractsbecome unconditional. Revenue from the provision of services is recognised on the delivery of thoseservices; which, for Ports, is once the relevant throughput has taken place; for Ferries, is on provision ofcarriage; and for commercial trucking, cold storage and document processing is recognised when therelevant services have been rendered.
Interest income is recognised as the interest accrues (using the effective interest method; that is the ratethat exactly discounts estimated future cash receipts through the expected life of the financial instrumentto the net carrying amount of the financial asset).
Income tax
Current tax
Current tax assets and liabilities for the current and prior periods are measured at the amount expected tobe recovered from or paid to the taxation authorities. The tax rates and tax laws used to compute theamount are those that are enacted or substantively enacted by the consolidated balance sheet date.
Deferred tax
Deferred income tax is provided using the liability method on temporary differences at the balance sheetdate between the tax bases of assets and liabilities and their carrying amounts for financial reportingpurposes. Deferred tax liabilities are recognised for all taxable temporary differences, except:
� where the deferred tax liability arises from the initial recognition of goodwill or of an asset orliability in a transaction that is not a business combination and, at the time of the transaction,affects neither the accounting profit nor taxable profit or loss; and
� in respect of taxable temporary differences associated with investments in subsidiaries andassociates, where the timing of the reversal of the temporary differences can be controlled and itis probable that the temporary differences will not reverse in the foreseeable future.
Deferred income tax assets are recognised for all deductible temporary differences, carry-forward ofunused tax credits and unused tax losses, to the extent that it is probable that taxable profit will beavailable against which the deductible temporary differences, and the carry-forward of unused tax creditsand unused tax losses can be utilised except:
� where the deferred income tax asset relating to the deductible temporary difference arises fromthe initial recognition of an asset or liability in a transaction that is not a business combinationand, at the time of the transaction, affects neither the accounting profit nor taxable profit or loss;and
� in respect of deductible temporary differences associated with investments in subsidiaries,associates and interests in joint ventures, deferred tax assets are recognised only to the extent thatit is probable that the temporary differences will reverse in the foreseeable future and taxableprofit will be available against which the temporary differences can be utilised.
The carrying amount of deferred income tax assets is reviewed at each balance sheet date and reduced tothe extent that it is no longer probable that sufficient taxable profit will be available to allow all or part ofthe deferred income tax asset to be utilised. Unrecognised deferred income tax assets are reassessed ateach balance sheet date and are recognised to the extent that it has become probable that future taxableprofit will allow the deferred tax asset to be recovered.
F-62
www.global-reports.com
Dubai Ports Authority and its Subsidiaries
Notes to the Consolidated Financial Statements (Continued)
At 31 December 2006
2.3 Summary of Significant Accounting Policies (Continued)
Deferred income tax assets and liabilities are measured at the tax rates that are expected to apply to theyear when the asset is realised or the liability is settled, based on tax rates (and tax laws) that have beenenacted or substantively enacted at the balance sheet date.
Income tax relating to items recognised directly in equity is recognised in equity and not in theconsolidated statement of income.
Deferred tax assets and deferred tax liabilities are offset, if a legally enforceable right exists to set offcurrent tax assets against current tax liabilities and the deferred taxes relate to the same taxable entity andthe same taxation authority.
Cost of sales
Cost of sales include those costs incurred for the operation, maintenance and security of the Group’sfacilities and other costs directly attributable to the various services provided by the Group.
Borrowing costs
Borrowing costs are recognised as an expense when incurred except when such borrowing costs are directlyattributable to the acquisition, construction or production of qualifying assets such as property held fordevelopment and sale. In those cases, borrowing costs are capitalised as part of the cost of the qualifyingasset.
Property, plant and equipment
Property, plant and equipment are stated at cost less accumulated depreciation and any impairment invalue.
Depreciation is calculated on a straight line basis over the estimated useful lives of property, plant andequipment as follows:
Buildings and infrastructure . . . . . . . . . . . . . . . . . . . . . . . . . . . . . . 5 to 50 yearsCranes and marine equipment . . . . . . . . . . . . . . . . . . . . . . . . . . . . 5 to 25 yearsPlant, equipment, furniture and others . . . . . . . . . . . . . . . . . . . . . . 3 to 40 yearsShips . . . . . . . . . . . . . . . . . . . . . . . . . . . . . . . . . . . . . . . . . . . . . . 10 to 35 years
Land and capital work in progress are not depreciated.
The carrying values of property, plant and equipment are reviewed for impairment when events or changesin circumstances indicate the carrying value may not be recoverable. If any such indication exists and wherethe carrying values exceed the estimated recoverable amount, the assets are written down to theirrecoverable amount.
Expenditure incurred to replace a component of an item of property, plant and equipment that isaccounted for separately is capitalised and the carrying amount of the component that is replaced iswritten off. An item of property, plant and equipment is derecognised upon disposal or when no futureeconomic benefits are expected from its use or disposal. Any gain or loss arising on derecognition of theasset (calculated as the difference between the net disposable proceeds and the carrying amount of theasset) is included in the income statement in the year the asset is derecognised.
The asset’s residual values, useful lives and methods of depreciation, are reviewed and adjusted ifappropriate at each financial year end.
Business combination and goodwill
Except for transactions involving entities under common control, where the provisions of IFRS 3-BusinessCombinations are not applicable, business combinations are accounted for using the acquisition accounting
F-63
Dubai Ports Authority and its Subsidiaries
Notes to the Consolidated Financial Statements (Continued)
At 31 December 2006
2.3 Summary of Significant Accounting Policies (Continued)
method. This involves recognising identifiable assets (including previously unrecognised intangible assets)and liabilities (including contingent liabilities and excluding future restructuring) of the acquired businessat fair value. Transactions with entities under common control are accounted using the merger accountingmethod.
Goodwill acquired in a business combination is initially measured at cost being the excess of the cost of thebusiness combination over the Group’s interest in the net fair value of the acquiree’s identifiable assets,liabilities and contingent liabilities. Following initial recognition, goodwill is measured at cost less anyaccumulated impairment losses. For the purpose of impairment testing, goodwill acquired in a businesscombination is, from the acquisition date, allocated to each of the Group’s cash generating units, or groupsof cash generating units, that are expected to benefit from the synergies of the combination, irrespective ofwhether other assets or liabilities of the Group are assigned to those units or groups of units.
Each unit or group of units to which the goodwill is allocated represents the lowest level within the Groupat which the goodwill is monitored for internal management purposes; and is not larger than a segmentbased on either the Group’s primary or the Group’s secondary reporting format determined in accordancewith IAS 14 Segment Reporting.
Where goodwill forms part of a cash-generating unit (group of cash generating units) and part of theoperation within that unit is disposed of, the goodwill associated with the operation disposed of is includedin the carrying amount of the operation when determining the gain or loss on disposal of the operation.Goodwill disposed of in this circumstance is measured based on the relative values of the operationdisposed of and the portion of the cash-generating unit retained.
When subsidiaries are sold, the difference between the selling price and the net assets plus cumulativetranslation differences and unamortised goodwill is recognised in the income statement.
Intangible assets
Intangible assets acquired separately are measured on initial recognition at cost. The cost of intangibleassets acquired in a business combination is the fair value as at the date of acquisition. Following initialrecognition, intangible assets are carried at cost less any accumulated amortisation and any accumulatedimpairment losses. Internally generated intangible assets, excluding capitalised development costs, are notcapitalised and expenditure is charged against profits in the year in which the expenditure is incurred. Theuseful lives of intangible assets are assessed to be either finite or indefinite. Intangible assets with finitelives are amortised over the useful economic life and assessed for impairment whenever there is anindication that the intangible asset may be impaired. The amortisation period and amortisation method foran intangible asset with a finite useful life is reviewed at least at each financial year-end. Changes in theexpected useful life or the expected pattern of consumption of future economic benefits embodied in theassets are accounted for by changing the amortisation period or method, as appropriate, and treated aschanges in accounting estimates. The amortisation expense on intangible assets with finite useful lives isrecognised in the consolidated statement of income in the expense category consistent with the function ofthe intangible asset.
Intangible assets with indefinite useful lives are tested for impairment annually either individually or at thecash-generating unit level. Such intangibles are not amortised. The useful life of an intangible asset with anindefinite life is reviewed annually to determine whether indefinite life assessment continues to besupportable. If not, the change in the useful life assessment from indefinite to finite is made on aprospective basis.
Gains or losses arising from derecognition of an intangible asset are measured as the difference betweenthe net disposal proceeds and the carrying amount of the asset and are recognised in the income statementwhen the asset is derecognised.
F-64
www.global-reports.com
Dubai Ports Authority and its Subsidiaries
Notes to the Consolidated Financial Statements (Continued)
At 31 December 2006
2.3 Summary of Significant Accounting Policies (Continued)
Investment in associates
The Group’s investment in associates is accounted for under the equity method of accounting. Anassociate is an entity in which the Group exerts significant influence, and is neither a subsidiary nor a jointventure, usually where the group has between 20% to 50% of the voting power. Investment in associates iscarried in the consolidated balance sheet at cost, plus post-acquisition changes in the Group’s share of netassets of the associate, less any impairment in value. Goodwill relating to an associate which is acquireddirectly is included in the carrying amount of the investment and is not amortised. After application of theequity method, the Group determines whether it is necessary to recognise any additional impairment losswith respect to the Group’s net investment in the associate. The consolidated income statement reflects theGroup’s share of the results of its associates. When there has been a change recognised directly in theequity of the associate, the Group recognise its share of any changes and discloses this, when applicable, inthe consolidated statement of changes in equity.
The reporting dates of the associates and the Group are identical and the associates’ accounting policiesconform to those used by the Group for like transactions and events in similar circumstances.
Interest in joint ventures
The Group has interests in joint ventures which are jointly controlled entities. A joint venture is acontractual arrangement whereby two or more parties undertake an economic activity that is subject tojoint control, and a jointly controlled entity is a joint venture that involves the establishment of a separateentity in which each venturer has an interest. The Group’s investment in joint ventures is accounted forunder the equity method of accounting. Investment in joint ventures is carried in the consolidated balancesheet at cost, plus post-acquisition changes in the Group’s share of net assets of the joint venture, less anyimpairment in value.
Goodwill relating to a joint venture which is acquired directly is included in the carrying amount of theinvestment and is not amortised. After application of the equity method, the Group determines whether itis necessary to recognise any additional impairment loss with respect to the Group’s net investment in thejoint venture. The consolidated income statement reflects the Group’s share of the results of its jointventures. When there has been a change recognised directly in the equity of the joint venture, the Grouprecognises its share of any changes and discloses this, when applicable, in the consolidated statement ofchanges in equity.
The reporting dates of the joint ventures and the Group are identical and the joint ventures’ accountingpolicies conform to those used by the Group for like transactions and events in similar circumstances.
Held-to-maturity investments
Held-to-maturity investments are non-derivative financial assets which carry fixed or determinablepayments and fixed maturities and which the Group has the positive intention and ability to hold tomaturity. After initial measurement, held to maturity investments are measured at amortised cost. Thiscost is computed as the amount initially recognised minus principal repayments, plus or minus thecumulative amortisation, using the effective interest method, of any difference between the initiallyrecognised amount and the maturity amount, less allowance for impairment. This calculation includes allfees and points paid or received between parties to the contract that are an integral part of the effectiveinterest rate, transaction costs and all other premiums and discounts. Gains and losses are recognised inthe income statement when the investments are derecognised or impaired, as well as through theamortisation process.
F-65
Dubai Ports Authority and its Subsidiaries
Notes to the Consolidated Financial Statements (Continued)
At 31 December 2006
2.3 Summary of Significant Accounting Policies (Continued)
Impairment of assets
The Group assesses, at each reporting date, whether there is an indication that an asset may be impaired.If any such indication exists, or when annual impairment testing for an asset is required, the Group makesan estimate of the asset’s recoverable amount. An asset’s recoverable amount is the higher of an asset’s orcash generating unit’s fair value, less costs to sell, and its value in use and is determined for an individualasset, unless the asset does not generate cash inflows that are largely independent of those from otherassets or groups of assets. Where the carrying amount of an asset exceeds its recoverable amount, the assetis considered impaired and is written down to its recoverable amount. In assessing value in use, theestimated future cash flows are discounted to their present value using a pre-tax discount rate that reflectscurrent market assessments of the time value of money and the risks specific to the asset. Impairmentlosses of continuing operations are recognised in the consolidated statement of income in those expensecategories consistent with the function of the impaired asset.
For assets excluding goodwill, an assessment is made at each reporting date as to whether there is anyindication that previously recognised impairment losses may no longer exist or may have decreased. If suchindication exists, the recoverable amount is estimated. A previously recognised impairment loss is reversedonly if there has been a change in the estimates used to determine the asset’s recoverable amount since thelast impairment loss was recognised. If that is the case, the carrying amount of the asset is increased to itsrecoverable amount. That increased amount cannot exceed the carrying amount that would have beendetermined, net of depreciation, had no impairment loss been recognised for the asset in prior years. Suchreversal is recognised in profit or loss unless the asset is carried at revalued amount, in which case thereversal is treated as a revaluation increase. After such a reversal the depreciation charge is adjusted infuture periods to allocate the asset’s revised carrying amount, less any residual value, on a systematic basisover its remaining useful life. Impairment losses recognised in relation to goodwill are not reversed forsubsequent increase in its recoverable amount.
The following criteria are also applied in assessing impairment of specific assets:
Goodwill
Goodwill is reviewed for impairment, annually or more frequently if events or changes in circumstancesindicate that the carrying value may be impaired.
Impairment is determined for goodwill by assessing the recoverable amount of the cash-generating unit (orgroup of cash-generating units), to which the goodwill relates. Where the recoverable amount of thecash-generating unit (or group of cash-generating units) is less than the carrying amount of thecash-generating unit (group of cash-generating units) to which goodwill has been allocated, an impairmentloss is recognised. Impairment losses relating to Goodwill cannot be reversed in future periods. The Groupperforms its annual impairment test of goodwill as at 31 December.
Intangible assets
Intangible assets with indefinite useful lives are tested for impairment annually as of 31 December eitherindividually or at the cash generating unit level, as appropriate.
Inventories
Inventories mainly consist of spare parts and consumables. Inventories are stated at cost less provision forobsolete and slow moving items. Cost represents those expenses incurred in bringing each product to itspresent location and condition, as determined on a weighted average basis.
F-66
www.global-reports.com
Dubai Ports Authority and its Subsidiaries
Notes to the Consolidated Financial Statements (Continued)
At 31 December 2006
2.3 Summary of Significant Accounting Policies (Continued)
Accounts receivable
Accounts receivable are stated at original invoice amount less a provision for any uncollectible amounts.An estimate for doubtful debts is made when collection of the full amount is no longer probable. Bad debtsare written off as incurred.
Bank balances and cash
Bank balances and cash comprise cash at hand, bank balances and short-term deposits with an originalmaturity of three months or less.
For the purpose of the consolidated cash flow statements, cash and cash equivalents consists of bankbalances and cash as defined above, net of outstanding bank overdrafts and deposits under lien.
Accounts payable and accruals
Liabilities are recognised for amounts to be paid in the future for goods or services received, whetherbilled by the supplier or not.
Retentions payable are presented as current liabilities although they may not be payable within twelvemonths of the balance sheet date.
Provisions
Provisions are recognised when the Group has a present obligation (legal or constructive) as a result of apast event, it is probable that an outflow of resources embodying economic benefits will be required tosettle the obligation and a reliable estimate can be made of the amount of the obligation. Where theGroup expects some or all of a provision to be reimbursed, for example under an insurance contract, thereimbursement is recognised as a separate asset but only when the reimbursement is virtually certain. Theexpense relating to any provision is presented in the income statement net of any reimbursement. If theeffect of the time value of money is material, provisions are discounted using a current pre tax rate thatreflects, where appropriate, the risks specific to the liability. Where discounting is used, the increase in theprovision due to the passage of time is recognised as a finance cost.
Properties held for development and sale
Properties held for development and sale are included under current assets at the lower of cost and netrealisable value, with any resultant gain or loss recognised in the income statement. Net realisable value isthe estimated selling price in the ordinary course of business, less the estimated costs of completion andselling expenses. Interest and other outgoings less income receivable are charged to the income statementduring development, except in respect of properties where the development period is extensive, when suchamounts are included in cost.
Pension and post employment benefits
UAE Region
The Group provides end of service benefits to its expatriate employees in the United Arab Emirates. Theentitlement to these benefits is based upon the employees’ basic salary and length of service, subject to thecompletion of a minimum service period. The expected costs of these benefits are accrued over the periodof employment.
With respect to its UAE national employees, the Group makes a provision for contributions to be made tothe UAE Pension Authority calculated as a percentage of the employees’ salaries. The Group’s obligationsare limited to these contributions, which are expensed when due.
F-67
Dubai Ports Authority and its Subsidiaries
Notes to the Consolidated Financial Statements (Continued)
At 31 December 2006
2.3 Summary of Significant Accounting Policies (Continued)
Outside UAE Region
The Group’s net obligation in respect of defined benefit pension plans is calculated separately for eachplan by estimating the amount of future benefit that employees have earned in return for their service inthe current and prior periods. That benefit is discounted to determine the present value, and the fair valueof any plan assets is deducted. The calculation is performed by a qualified actuary using the projected unitcredit method. The discount rate is the yield at the balance sheet date on AA credit rated bonds or localequivalent that have maturity dates approximating to the terms of the Group’s obligations.
When the benefits of a plan are improved, the portion of the increased benefit relating to past service byemployees is recognised as an expense in the income statement on a straight line basis over the averageperiod until the benefits become vested. To the extent that the benefits vest immediately, the expense isrecognised immediately in the income statement.
Actuarial gains and losses that arise in calculating the Group’s obligation in respect of a plan arerecognised in the period in which they arise directly in the statement of recognised income and expenses.The cost of providing benefits under the defined benefit plans is determined separately for each plan usingthe projected unit credit method, which attributes entitlement to benefits to the current period (todetermine current service cost) and to the current and prior periods (to determine the present value ofdefined benefit obligation) and is based on actuarial advice.
Contributions, including lump sum payments, in respect of defined contribution pension schemes andmulti employer defined benefit schemes where it is not possible to identify the Group’s share of thescheme, are charged to the income statement as they fall due.
Long term service benefits
The Group’s net obligation in respect of long term service benefits, other than pension plans, is theamount of future benefit that employees have earned in return for their service in the current and priorperiods. The obligation is calculated using the projected unit credit method and is discounted to its presentvalue and the fair value of any related assets is deducted. The discount rate is the yield at the balance sheetdate on AA credit rated bonds (or local equivalent) that have maturity dates approximating to the terms ofthe Group’s obligations.
Interest bearing loans and borrowings
All loans and borrowings are initially recognised at the fair value of the consideration received less directlyattributable transaction costs.
After initial recognition, interest-bearing loans and borrowings are subsequently measured at amortisedcost using the effective interest method.
Gains and losses are recognised in net profit or loss when the liabilities are derecognised as well as throughthe amortisation process.
Foreign currency translation
The consolidated financial statements are presented in United States Dollars, which is the Authority’spresentation currency. All the assets and liabilities are translated at the closing rate at the date of balancesheet; income and expenses are translated at the average exchange rate for the year. The UAE Dirham,which is the Authority’s functional currency is effectively pegged to the United States Dollar and theexchange rate used for translation is 1 United States Dollar = 3.6725 UAE Dirhams, which remainedconstant during the year. Each entity in the Group determines its own functional currency and itemsincluded in the financial statements of each entity are measured using that functional currency.Transactions in foreign currencies are initially recorded in the functional currency rate ruling at the date ofthe transaction. Monetary assets and liabilities denominated in foreign currencies are retranslated at the
F-68
www.global-reports.com
Dubai Ports Authority and its Subsidiaries
Notes to the Consolidated Financial Statements (Continued)
At 31 December 2006
2.3 Summary of Significant Accounting Policies (Continued)
functional currency rate of exchange ruling at the balance sheet date. All differences are taken to profit orloss with the exception of differences on foreign currency borrowings that provide an effective hedgeagainst a net investment in a foreign entity. These are taken directly to equity until the disposal of the netinvestment, at which time they are recognised in profit or loss. Tax charges and credits attributable toexchange differences on those borrowings are also dealt with in equity. Non-monetary items that aremeasured in terms of historical cost in a foreign currency are translated using the exchange rates as at thedates of the initial transactions. Non-monetary items measured at fair value in a foreign currency aretranslated using the exchange rates at the date when the fair value was determined.
All the assets and liabilities of the foreign subsidiaries are translated into the presentation currency of theGroup at the rate of exchange ruling at the balance sheet date and their income statements are translatedat the weighted average exchange rates for the year. The exchange differences arising on the translationare taken directly to a separate component of equity. On disposal of a foreign entity, the deferredcumulative amount recognised in equity relating to that particular foreign operation is recognised in theincome statement.
Any goodwill arising on the acquisition of a foreign operation and any fair value adjustments to thecarrying amounts of assets and liabilities arising on the acquisition of that foreign operation are treated asassets and liabilities of the foreign operations. Those assets and liabilities are translated into thepresentation currency of the Group at the rate of exchange ruling at the balance sheet date. The exchangedifferences arising on the translation are taken directly to a separate component of equity. On disposal of aforeign entity, the deferred cumulative amount recognised in equity relating to that particular foreignoperation is recognised in the income statement.
Derivatives
Derivative financial instruments and hedging
The Group uses derivative financial instruments such as forward currency contracts and interest rate swapsto hedge its risks associated with interest rate and foreign currency fluctuations. Such derivative financialinstruments are initially recognised at fair value on the date on which a derivative contract is entered intoand are subsequently remeasured at fair value. Derivatives are carried as assets when the fair value ispositive and as liabilities when the fair value is negative.
Any gains or losses arising from changes in fair value on derivatives during the year that do not qualify forhedge accounting are taken directly to the income statement.
The fair value of forward currency contracts is calculated by reference to current forward exchange ratesfor contracts with similar maturity profiles. The fair value of interest rate swap contracts is determined byreference to market values for similar instruments.
For the purpose of hedge accounting, hedges are classified as:
� cash flow hedges when hedging exposure to variability in cash flows that is either attributable to aparticular risk associated with a recognised asset or liability or a highly probable forecasttransaction or the foreign currency risk in an unrecognised firm commitment; or
� hedge of a net investment in a foreign operation.
At the inception of a hedge relationship, the Group formally designates and documents the hedgerelationship to which the Group wishes to apply hedge accounting and the risk management objective andstrategy for undertaking the hedge. The documentation includes identification of the hedging instrument,the hedged item or transaction, the nature of the risk being hedged and how the entity will assess thehedging instrument’s effectiveness in offsetting the exposure to changes in the hedged item’s fair value orcash flows attributable to the hedged risk. Such hedges are expected to be highly effective in achievingoffsetting changes in fair value or cash flows and are assessed on an ongoing basis to determine that they
F-69
Dubai Ports Authority and its Subsidiaries
Notes to the Consolidated Financial Statements (Continued)
At 31 December 2006
2.3 Summary of Significant Accounting Policies (Continued)
actually have been highly effective throughout the financial reporting periods for which they weredesignated.
Hedges which meet the strict criteria for hedge accounting are accounted for as follows:
Cash flow hedges
The effective portion of the gain or loss on the hedging instrument is recognised directly in equity, whileany ineffective portion is recognised immediately in the income statement.
Amounts taken to equity are transferred to the income statement when the hedged transaction affects theincome statement, such as when the hedged financial income or financial expense is recognised or when aforecast sale occurs. Where the hedged item is the cost of a non-financial asset or non-financial liability,the amounts taken to equity are transferred to the initial carrying amount of the non-financial asset orliability.
If the forecast transaction or firm commitment is no longer expected to occur, amounts previouslyrecognised in equity are transferred to the income statement. If the hedging instrument expires or is sold,terminated or exercised without replacement or rollover, or if its designation as a hedge is revoked,amounts previously recognised in equity remain in equity until the forecast transaction or firmcommitment occurs.
Hedges of a net investment
Hedges of a net investment in a foreign operation, including a hedge of a monetary item that is accountedfor as part of the net investment, are accounted for in a way similar to cash flow hedges. Gains or losses onthe hedging instrument relating to the effective portion of the hedge are recognised directly in equity whileany gains or losses relating to the ineffective portion are recognised in the income statement. On disposalof the foreign operation, the cumulative value of any such gains or losses recognised directly in equity istransferred to the income statement.
Fair values
For derivatives quoted in an active market, fair value is determined by reference to quoted market prices.Bid prices are used for assets and offer prices are used for liabilities.
The fair value of unquoted derivatives is determined either by discounted cash flows, (internal) pricingmodels, or by reference to broker’s quotes.
Leases
The determination of whether an arrangement is, or contains, a lease is based on the substance of thearrangement at inception date and requires an assessment of whether the fulfilment of the arrangement isdependent on the use of a specific asset or assets or the arrangement conveys a right to use the asset. Areassessment is made after inception of the lease only if one of the following applies:
(a) there is a change in contractual terms, other than a renewal or extension of the arrangement;
(b) a renewal option is exercised or extension granted, unless the term of the renewal or extensionwas initially included in the lease term;
(c) there is a change in the determination of whether fulfilment is dependent on a specified asset; or
(d) there is a substantial change to the asset.
Where a reassessment is made, lease accounting commences or ceases from the date when the change incircumstances gave rise to the reassessment for scenarios a), c) or d) and at the date of renewal orextension period for scenario b).
F-70
www.global-reports.com
Dubai Ports Authority and its Subsidiaries
Notes to the Consolidated Financial Statements (Continued)
At 31 December 2006
2.3 Summary of Significant Accounting Policies (Continued)
For arrangements entered into prior to 1 January 2005, the date of inception is deemed to be 1 January2005 in accordance with the transitional requirements of IFRIC 4.
Group as a lessee
Finance leases, which transfer to the Group substantially all the risks and benefits incidental to ownershipof the leased item, are capitalised at the inception of the lease at the fair value of the leased property or, iflower, at the present value of the minimum lease payments. Lease payments are apportioned between thefinance charges and reduction of the lease liability so as to achieve a constant rate of interest on theremaining balance of the liability. Finance charges are charged directly against income.
Capitalised leased assets are depreciated over the shorter of the estimated useful life of the asset and thelease term, if there is no reasonable certainty that the Group will obtain ownership by the end of the leaseterm. Operating lease payments are recognised as an expense in the income statement on a straight-linebasis over the lease term.
Group as a lessor
Leases where the Group retains substantially all the risks and benefits of ownership of the asset areclassified as operating leases. Initial direct costs incurred in negotiating an operating lease are added to thecarrying amount of the leased asset and recognised over the lease term on the same basis as rental income.
Leasing and sub-leasing transactions
A series of leasing and sub-leasing transactions between and the Group and third parties, which are closelyinterrelated, negotiated as a single transaction, and take place concurrently or in a continuous sequenceare considered linked and accounted for as one transaction when the overall economic effect cannot beunderstood without reference to the series of transactions as a whole.
These leasing and sub-leasing transactions are designed to achieve certain benefits for the third parties inoverseas locations in return for a cash benefit to the Group. Such cash benefit is accounted for as upfrontincome in the consolidated statements of income.
Under these leasing and sub-leasing transactions, current and non-current liabilities have been defeased bythe loan receivable and the placement of deposits. Those liabilities, receivable and deposits (and incomeand charges arising therefrom) are netted off in the consolidated financial statements, in order to reflectthe overall commercial effect of the arrangement.
Separately disclosable items
The Group presents, as separately disclosable items on the face of the income statement, those materialitems of income and expense which, because of the nature and expected infrequency of the events givingrise to them, merit separate presentation to allow users to understand better the elements of financialperformance in the period, so as to facilitate a comparison with prior periods and a better assessment oftrends in financial performance.
Non-current assets held for sale
The Group classifies a non-current asset (or disposal group) as held for sale if its carrying amount will berecovered through a sale transaction rather than continuing use and the sale transaction is expected tocomplete within one year from the date of classification.
Liabilities directly associated with such non-current assets (or disposal group) are classified as liabilitiesheld for sale.
A non-current asset (disposal group) classified as held for sale is measured at the lower of its net carryingamount and fair value less costs to sell.
F-71
Dubai Ports Authority and its Subsidiaries
Notes to the Consolidated Financial Statements (Continued)
At 31 December 2006
2.3 Summary of Significant Accounting Policies (Continued)
A discontinued operation is a component of the Group that is classified as held for sale and whichrepresents a separate major line of business or geographical area of operations; is part of a singleco-ordinated plan to dispose of a separate major line of business or geographical area of operation; or is asubsidiary acquired exclusively with a view to resale.
2.4 Future Changes in Accounting Policies
IFRIC Interpretations not yet effective
IFRIC 9 was issued in March 2006, and becomes effective for financial years beginning on or after 1 June2006. This interpretation establishes that the date to assess the existence of an embedded derivative is thedate an entity first becomes a party to the contract, with reassessment only if there is a change to thecontract that significantly modifies the cash flows. The Group is still evaluating the effect of thisinterpretation and expects that adoption of this interpretation will have no impact on the Group’s financialstatements when implemented in 2007.
IFRIC 12 becomes effective for financial years beginning on or after 1 January 2008. This interpretationgives guidance on the accounting by operators for public-to-private service concession arrangements. TheGroup is currently evaluating the effect of this interpretation and expects that its adoption will have nomaterial impact on the Group’s financial statements when implemented in 2008.
IFRS not yet effective
IFRS 7 Financial Instruments: Disclosures
The application of IFRS 7, which will be effective for the year ending 31 December 2007 will result inamended and additional disclosures relating to financial instruments and associated risks. This IFRS is notexpected to have any material impact on the Group’s financial statements in the period of initialapplication.
IAS 1 Presentation of financial statements (amended)
The application of IAS 1 (amended), which will be effective for the year ending 31 December 2007 willresult in amended and additional disclosures relating to the Group’s objectives, policies and procedures formanaging capital. This IFRS is not expected to have any material impact on the Group’s financialstatements in the period of initial application.
IFRS 8 Operating Segments
The application of IFRS 8, which will be effective for the year ending 31 December 2009 will result in thedisclosure of certain information about the Group’s operating segments, its products and services, thegeographical areas in which it operates, and its major customers. This IFRS is not expected to have anymaterial impact on the Group’s financial statements in the period of initial application.
Other IFRS and IFRIC interpretations have been issued but are not yet effective and are not relevant tothe activities of the Group
3 General and Administration Expenses
General and administration expenses include certain staff costs, depreciation, repair and maintenancecosts and other sundry expenses.
F-72
www.global-reports.com
Dubai Ports Authority and its Subsidiaries
Notes to the Consolidated Financial Statements (Continued)
At 31 December 2006
4 Other Income
2006 2005USD’000 USD’000
Gain on sale of property, plant and equipment . . . . . . . . . . . . . . . . . . . . . . 5,900 —Duty free rental income . . . . . . . . . . . . . . . . . . . . . . . . . . . . . . . . . . . . . . 545 545Gain on termination of interest rate swap previously designated as a cash
flow hedge . . . . . . . . . . . . . . . . . . . . . . . . . . . . . . . . . . . . . . . . . . . . . . 11,100 —Miscellaneous income . . . . . . . . . . . . . . . . . . . . . . . . . . . . . . . . . . . . . . . . 25,388 889
42,933 1,434
5 Profits for the year
2006 2005USD’000 USD’000
The profit for the year is stated after charging the following costs:Staff costs . . . . . . . . . . . . . . . . . . . . . . . . . . . . . . . . . . . . . . . . . . . . . . . . 792,065 148,586
Operating leases . . . . . . . . . . . . . . . . . . . . . . . . . . . . . . . . . . . . . . . . . . . . 307,298 8,253
Depreciation and amortisation . . . . . . . . . . . . . . . . . . . . . . . . . . . . . . . . . . 296,023 55,451
6 Income Tax
The major components of income tax expense for the years ended 31 December 2006 and 2005 are:
Consolidated income statements
2006 2005USD’000 USD’000
Current income taxCurrent income tax charge . . . . . . . . . . . . . . . . . . . . . . . . . . . . . . . . . . . . (56,986) (2,438)
Deferred income taxRelating to origination and reversal of temporary differences . . . . . . . . . . . 44,709 (1,724)
Income tax reported in the consolidated statements of income . . . . . . . . . . (12,277) (4,162)Income tax attributable to discontinued operations . . . . . . . . . . . . . . . . . . . (9,812) —
(22,089) (4,162)
F-73
Dubai Ports Authority and its Subsidiaries
Notes to the Consolidated Financial Statements (Continued)
At 31 December 2006
6 Income Tax (Continued)
The Group is not subject to income tax on its domestic operations. A reconciliation between the taxexpense and the product of accounting profit multiplied by the tax rate applicable to foreign subsidiaries ofthe Group for the years ended 31 December 2006 and 2005 is as follows:
2006 2005USD’000 USD’000
Accounting profit before income tax . . . . . . . . . . . . . . . . . . . . . . . . . . . . . 209,957 246,670Profit before tax from discontinued operations . . . . . . . . . . . . . . . . . . . . . . 29,045 —
Accounting profit before income tax . . . . . . . . . . . . . . . . . . . . . . . . . . . . . 239,002 246,670
At the Group’s domestic income tax rate of 0% (2005: 0%) . . . . . . . . . . . . — —Expenses not deductible and other permanent difference . . . . . . . . . . . . . . (12,400) —Profit and losses not subject to taxation . . . . . . . . . . . . . . . . . . . . . . . . . . . 20,300 —Unutilised tax losses arising in the year . . . . . . . . . . . . . . . . . . . . . . . . . . . (2,200) —Effect of joint ventures and associates . . . . . . . . . . . . . . . . . . . . . . . . . . . . 20,700 —Higher Income tax on foreign earnings . . . . . . . . . . . . . . . . . . . . . . . . . . . (66,903) (5,855)Deferred tax in respect of fair value adjustments . . . . . . . . . . . . . . . . . . . . 24,124 —Deferred tax benefits on temporary differences . . . . . . . . . . . . . . . . . . . . . . (1,898) 327Adjustments in respect of income tax of previous years . . . . . . . . . . . . . . . . 5,600 (14)Deferred tax benefits on tax losses carried forward . . . . . . . . . . . . . . . . . . . — 1,380Others . . . . . . . . . . . . . . . . . . . . . . . . . . . . . . . . . . . . . . . . . . . . . . . . . . . 400 —
Income tax reported in the consolidated statements of income . . . . . . . . . . (12,277) (4,162)Income tax attributable to discontinued operations . . . . . . . . . . . . . . . . . . . (9,812) —
(22,089) (4,162)
F-74
www.global-reports.com
Dubai Ports Authority and its Subsidiaries
Notes to the Consolidated Financial Statements (Continued)
At 31 December 2006
6 Income Tax (Continued)
Deferred income tax
Deferred income tax at 31 December relates to the following:
Consolidated ConsolidatedBalance sheets Income Statements
2006 2005 2006 2005USD’000 USD’000 USD’000 USD’000
Deferred tax liabilityAccelerated depreciation for tax purposes . . . . . (108,924) 5,425 25,868 404Investments in joint ventures . . . . . . . . . . . . . . . (13,300) — 3,500 —Employees’ end of service benefits . . . . . . . . . . . (200) 801 — (4)Unrepatriated foreign earnings of subsidiaries . . — 13,903 — (3,432)Fair value adjustment on acquisitions . . . . . . . . . 1,342,072 165,192 (12,259) —Tax losses carry forward . . . . . . . . . . . . . . . . . . — (1,380) (8,800) 1,380Others . . . . . . . . . . . . . . . . . . . . . . . . . . . . . . . (5,920) (697) (7,400) (77)Utilised tax losses carry forward . . . . . . . . . . . . 63,800 — — —
1,277,528 183,244
Deferred income tax assetsDecelerated depreciation for tax purposes . . . . . 1,319 1,003 (2,600) 5Equity losses . . . . . . . . . . . . . . . . . . . . . . . . . . 2,200 — — —Prepaid inventories . . . . . . . . . . . . . . . . . . . . . . (200) — — —Employees’ end of service benefits . . . . . . . . . . . 30,700 — 23,600 —Provisions . . . . . . . . . . . . . . . . . . . . . . . . . . . . . 17,400 — 23,800 —Tax value of loss carry-forwards recognised . . . . . (50,300) — — —Others . . . . . . . . . . . . . . . . . . . . . . . . . . . . . . . 11,000 — (1,000) —
12,119 1,003
Deferred income tax . . . . . . . . . . . . . . . . . . . . . . 44,709 (1,724)
The Group has tax losses of USD 278,945 thousand (2005: USD 11,021 thousand) in certain foreignoperations that are available for offset against future taxable profits of the companies in which the lossesarose. Deferred tax benefit of USD 12,281 thousand (2005: USD 1,380 thousand) has been recognisedduring the year in respect of such tax losses.
At 31 December 2006, the Group has recorded USD 1,629 thousand (2005: USD 3,431 thousand) of U.S.deferred income tax related to USD 4,654 thousand (2005: USD 16,070 thousand) of undistributedearnings of foreign subsidiaries owned through SL Service Inc, a U.S. intermediary holding company of theGroup. The Group has not recognised deferred tax liability for taxes that would be payable on unremittedearnings of certain of the Group’s other subsidiaries and associates as the Group has determined that theundistributed profits in those entities will not be distributed in the foreseeable future.
The temporary differences associated with investments in subsidiaries and associates, for which deferredtax liability has not been recognised aggregate to USD 56,667 thousand (2005: USD 13,039 thousand).
F-75
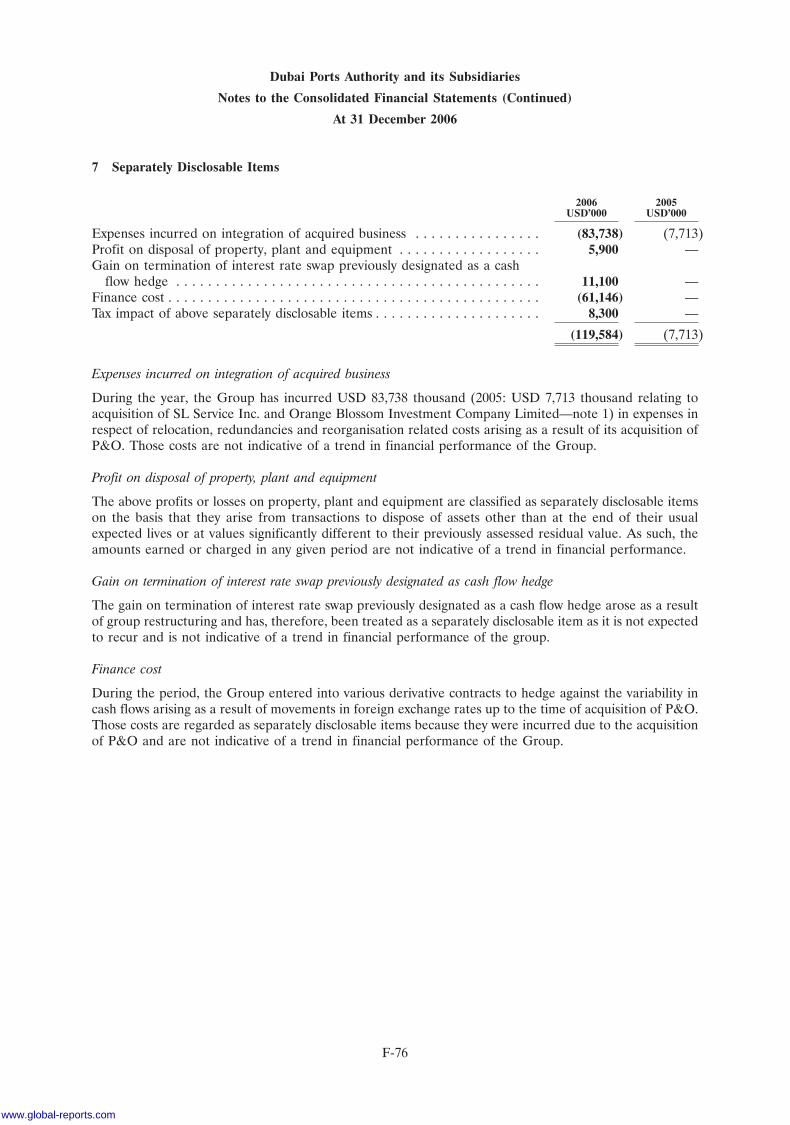
Dubai Ports Authority and its Subsidiaries
Notes to the Consolidated Financial Statements (Continued)
At 31 December 2006
7 Separately Disclosable Items
2006 2005USD’000 USD’000
Expenses incurred on integration of acquired business . . . . . . . . . . . . . . . . (83,738) (7,713)Profit on disposal of property, plant and equipment . . . . . . . . . . . . . . . . . . 5,900 —Gain on termination of interest rate swap previously designated as a cash
flow hedge . . . . . . . . . . . . . . . . . . . . . . . . . . . . . . . . . . . . . . . . . . . . . . 11,100 —Finance cost . . . . . . . . . . . . . . . . . . . . . . . . . . . . . . . . . . . . . . . . . . . . . . . (61,146) —Tax impact of above separately disclosable items . . . . . . . . . . . . . . . . . . . . . 8,300 —
(119,584) (7,713)
Expenses incurred on integration of acquired business
During the year, the Group has incurred USD 83,738 thousand (2005: USD 7,713 thousand relating toacquisition of SL Service Inc. and Orange Blossom Investment Company Limited—note 1) in expenses inrespect of relocation, redundancies and reorganisation related costs arising as a result of its acquisition ofP&O. Those costs are not indicative of a trend in financial performance of the Group.
Profit on disposal of property, plant and equipment
The above profits or losses on property, plant and equipment are classified as separately disclosable itemson the basis that they arise from transactions to dispose of assets other than at the end of their usualexpected lives or at values significantly different to their previously assessed residual value. As such, theamounts earned or charged in any given period are not indicative of a trend in financial performance.
Gain on termination of interest rate swap previously designated as cash flow hedge
The gain on termination of interest rate swap previously designated as a cash flow hedge arose as a resultof group restructuring and has, therefore, been treated as a separately disclosable item as it is not expectedto recur and is not indicative of a trend in financial performance of the group.
Finance cost
During the period, the Group entered into various derivative contracts to hedge against the variability incash flows arising as a result of movements in foreign exchange rates up to the time of acquisition of P&O.Those costs are regarded as separately disclosable items because they were incurred due to the acquisitionof P&O and are not indicative of a trend in financial performance of the Group.
F-76
www.global-reports.com
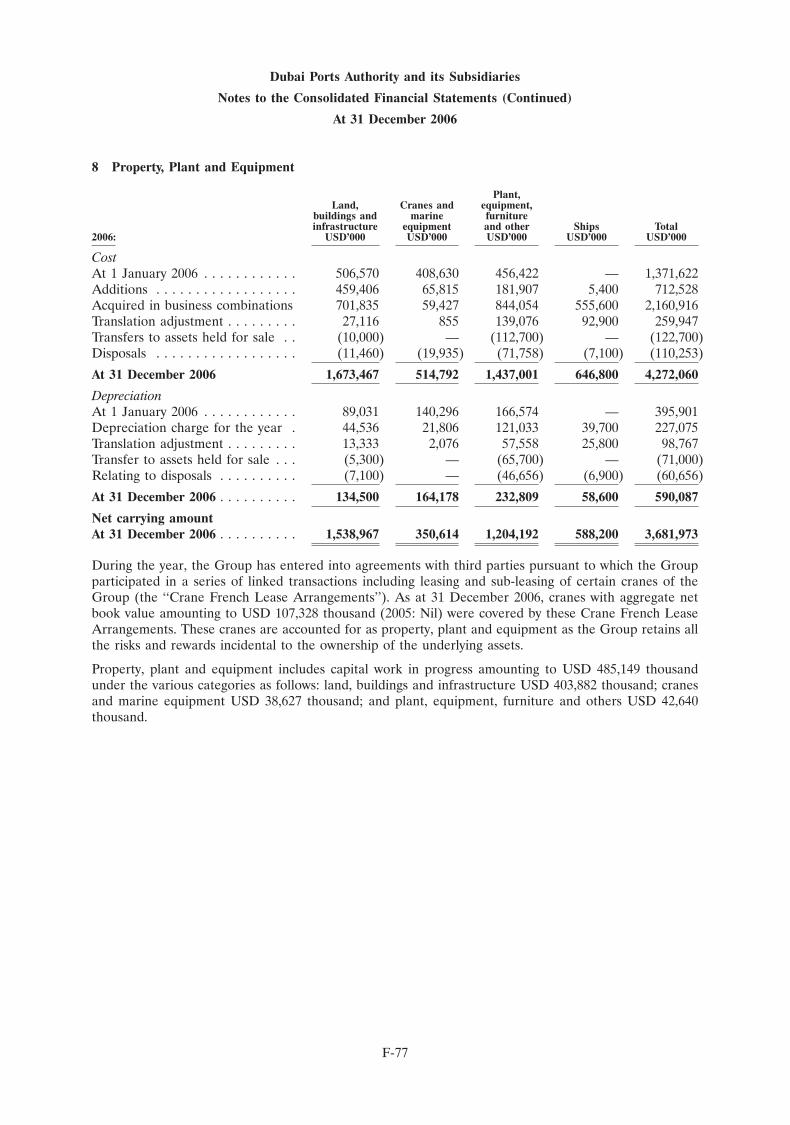
Dubai Ports Authority and its Subsidiaries
Notes to the Consolidated Financial Statements (Continued)
At 31 December 2006
8 Property, Plant and Equipment
Plant,Land, Cranes and equipment,
buildings and marine furnitureinfrastructure equipment and other Ships Total
2006: USD’000 USD’000 USD’000 USD’000 USD’000
CostAt 1 January 2006 . . . . . . . . . . . . 506,570 408,630 456,422 — 1,371,622Additions . . . . . . . . . . . . . . . . . . 459,406 65,815 181,907 5,400 712,528Acquired in business combinations 701,835 59,427 844,054 555,600 2,160,916Translation adjustment . . . . . . . . . 27,116 855 139,076 92,900 259,947Transfers to assets held for sale . . (10,000) — (112,700) — (122,700)Disposals . . . . . . . . . . . . . . . . . . (11,460) (19,935) (71,758) (7,100) (110,253)
At 31 December 2006 1,673,467 514,792 1,437,001 646,800 4,272,060
DepreciationAt 1 January 2006 . . . . . . . . . . . . 89,031 140,296 166,574 — 395,901Depreciation charge for the year . 44,536 21,806 121,033 39,700 227,075Translation adjustment . . . . . . . . . 13,333 2,076 57,558 25,800 98,767Transfer to assets held for sale . . . (5,300) — (65,700) — (71,000)Relating to disposals . . . . . . . . . . (7,100) — (46,656) (6,900) (60,656)
At 31 December 2006 . . . . . . . . . . 134,500 164,178 232,809 58,600 590,087
Net carrying amountAt 31 December 2006 . . . . . . . . . . 1,538,967 350,614 1,204,192 588,200 3,681,973
During the year, the Group has entered into agreements with third parties pursuant to which the Groupparticipated in a series of linked transactions including leasing and sub-leasing of certain cranes of theGroup (the ‘‘Crane French Lease Arrangements’’). As at 31 December 2006, cranes with aggregate netbook value amounting to USD 107,328 thousand (2005: Nil) were covered by these Crane French LeaseArrangements. These cranes are accounted for as property, plant and equipment as the Group retains allthe risks and rewards incidental to the ownership of the underlying assets.
Property, plant and equipment includes capital work in progress amounting to USD 485,149 thousandunder the various categories as follows: land, buildings and infrastructure USD 403,882 thousand; cranesand marine equipment USD 38,627 thousand; and plant, equipment, furniture and others USD 42,640thousand.
F-77
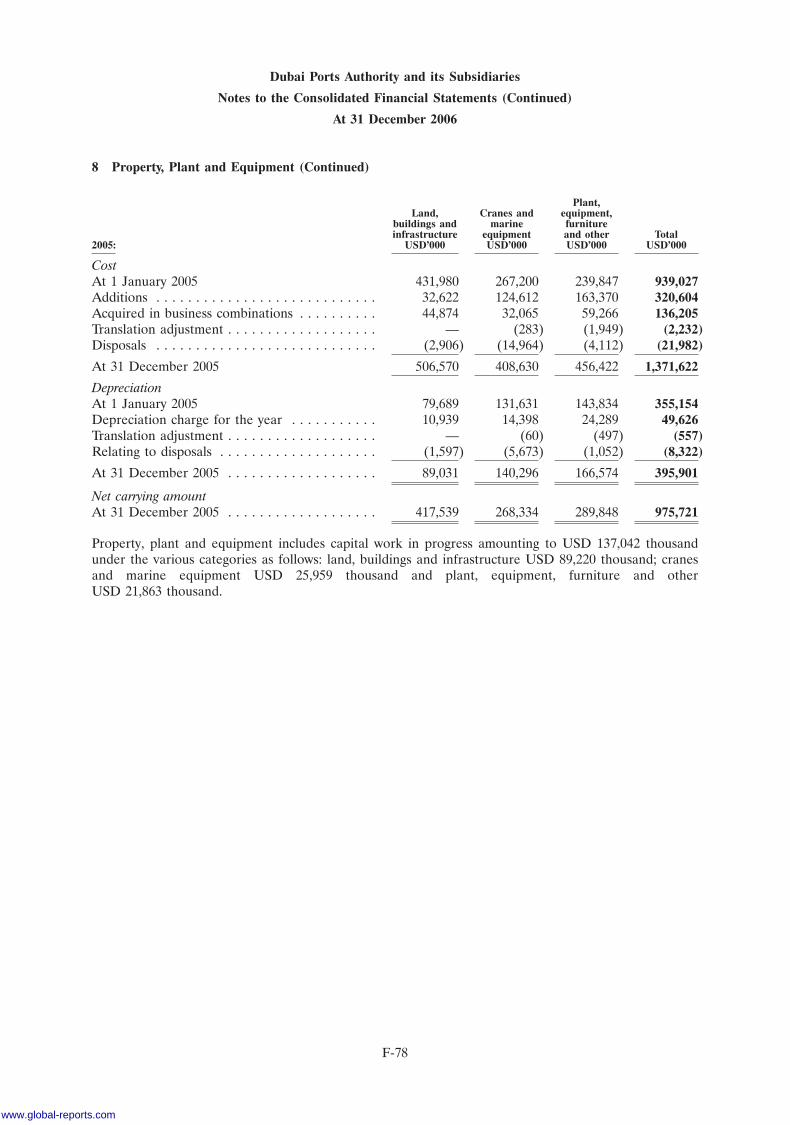
Dubai Ports Authority and its Subsidiaries
Notes to the Consolidated Financial Statements (Continued)
At 31 December 2006
8 Property, Plant and Equipment (Continued)
Plant,Land, Cranes and equipment,
buildings and marine furnitureinfrastructure equipment and other Total
2005: USD’000 USD’000 USD’000 USD’000
CostAt 1 January 2005 431,980 267,200 239,847 939,027Additions . . . . . . . . . . . . . . . . . . . . . . . . . . . . 32,622 124,612 163,370 320,604Acquired in business combinations . . . . . . . . . . 44,874 32,065 59,266 136,205Translation adjustment . . . . . . . . . . . . . . . . . . . — (283) (1,949) (2,232)Disposals . . . . . . . . . . . . . . . . . . . . . . . . . . . . (2,906) (14,964) (4,112) (21,982)
At 31 December 2005 506,570 408,630 456,422 1,371,622
DepreciationAt 1 January 2005 79,689 131,631 143,834 355,154Depreciation charge for the year . . . . . . . . . . . 10,939 14,398 24,289 49,626Translation adjustment . . . . . . . . . . . . . . . . . . . — (60) (497) (557)Relating to disposals . . . . . . . . . . . . . . . . . . . . (1,597) (5,673) (1,052) (8,322)
At 31 December 2005 . . . . . . . . . . . . . . . . . . . 89,031 140,296 166,574 395,901
Net carrying amountAt 31 December 2005 . . . . . . . . . . . . . . . . . . . 417,539 268,334 289,848 975,721
Property, plant and equipment includes capital work in progress amounting to USD 137,042 thousandunder the various categories as follows: land, buildings and infrastructure USD 89,220 thousand; cranesand marine equipment USD 25,959 thousand and plant, equipment, furniture and otherUSD 21,863 thousand.
F-78
www.global-reports.com
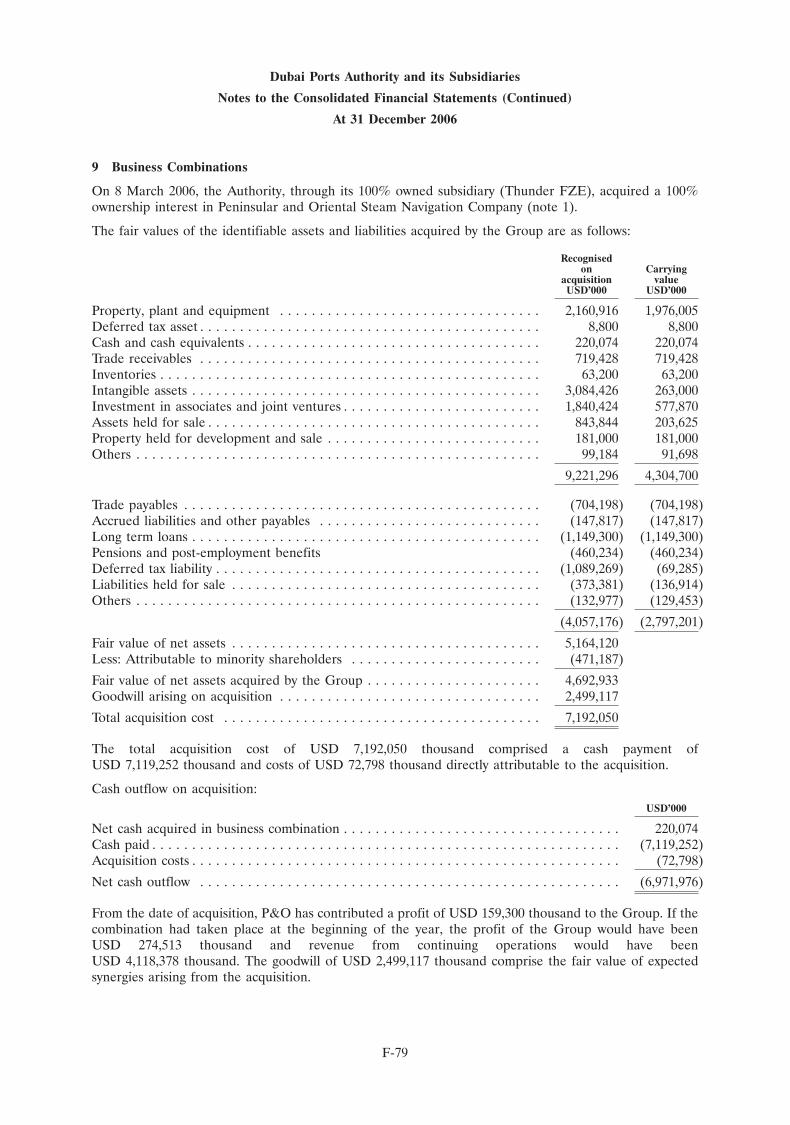
Dubai Ports Authority and its Subsidiaries
Notes to the Consolidated Financial Statements (Continued)
At 31 December 2006
9 Business Combinations
On 8 March 2006, the Authority, through its 100% owned subsidiary (Thunder FZE), acquired a 100%ownership interest in Peninsular and Oriental Steam Navigation Company (note 1).
The fair values of the identifiable assets and liabilities acquired by the Group are as follows:
Recognisedon Carrying
acquisition valueUSD’000 USD’000
Property, plant and equipment . . . . . . . . . . . . . . . . . . . . . . . . . . . . . . . . . 2,160,916 1,976,005Deferred tax asset . . . . . . . . . . . . . . . . . . . . . . . . . . . . . . . . . . . . . . . . . . . 8,800 8,800Cash and cash equivalents . . . . . . . . . . . . . . . . . . . . . . . . . . . . . . . . . . . . . 220,074 220,074Trade receivables . . . . . . . . . . . . . . . . . . . . . . . . . . . . . . . . . . . . . . . . . . . 719,428 719,428Inventories . . . . . . . . . . . . . . . . . . . . . . . . . . . . . . . . . . . . . . . . . . . . . . . . 63,200 63,200Intangible assets . . . . . . . . . . . . . . . . . . . . . . . . . . . . . . . . . . . . . . . . . . . . 3,084,426 263,000Investment in associates and joint ventures . . . . . . . . . . . . . . . . . . . . . . . . . 1,840,424 577,870Assets held for sale . . . . . . . . . . . . . . . . . . . . . . . . . . . . . . . . . . . . . . . . . . 843,844 203,625Property held for development and sale . . . . . . . . . . . . . . . . . . . . . . . . . . . 181,000 181,000Others . . . . . . . . . . . . . . . . . . . . . . . . . . . . . . . . . . . . . . . . . . . . . . . . . . . 99,184 91,698
9,221,296 4,304,700
Trade payables . . . . . . . . . . . . . . . . . . . . . . . . . . . . . . . . . . . . . . . . . . . . . (704,198) (704,198)Accrued liabilities and other payables . . . . . . . . . . . . . . . . . . . . . . . . . . . . (147,817) (147,817)Long term loans . . . . . . . . . . . . . . . . . . . . . . . . . . . . . . . . . . . . . . . . . . . . (1,149,300) (1,149,300)Pensions and post-employment benefits (460,234) (460,234)Deferred tax liability . . . . . . . . . . . . . . . . . . . . . . . . . . . . . . . . . . . . . . . . . (1,089,269) (69,285)Liabilities held for sale . . . . . . . . . . . . . . . . . . . . . . . . . . . . . . . . . . . . . . . (373,381) (136,914)Others . . . . . . . . . . . . . . . . . . . . . . . . . . . . . . . . . . . . . . . . . . . . . . . . . . . (132,977) (129,453)
(4,057,176) (2,797,201)
Fair value of net assets . . . . . . . . . . . . . . . . . . . . . . . . . . . . . . . . . . . . . . . 5,164,120Less: Attributable to minority shareholders . . . . . . . . . . . . . . . . . . . . . . . . (471,187)
Fair value of net assets acquired by the Group . . . . . . . . . . . . . . . . . . . . . . 4,692,933Goodwill arising on acquisition . . . . . . . . . . . . . . . . . . . . . . . . . . . . . . . . . 2,499,117
Total acquisition cost . . . . . . . . . . . . . . . . . . . . . . . . . . . . . . . . . . . . . . . . 7,192,050
The total acquisition cost of USD 7,192,050 thousand comprised a cash payment ofUSD 7,119,252 thousand and costs of USD 72,798 thousand directly attributable to the acquisition.
Cash outflow on acquisition:USD’000
Net cash acquired in business combination . . . . . . . . . . . . . . . . . . . . . . . . . . . . . . . . . . . 220,074Cash paid . . . . . . . . . . . . . . . . . . . . . . . . . . . . . . . . . . . . . . . . . . . . . . . . . . . . . . . . . . . (7,119,252)Acquisition costs . . . . . . . . . . . . . . . . . . . . . . . . . . . . . . . . . . . . . . . . . . . . . . . . . . . . . . (72,798)
Net cash outflow . . . . . . . . . . . . . . . . . . . . . . . . . . . . . . . . . . . . . . . . . . . . . . . . . . . . . (6,971,976)
From the date of acquisition, P&O has contributed a profit of USD 159,300 thousand to the Group. If thecombination had taken place at the beginning of the year, the profit of the Group would have beenUSD 274,513 thousand and revenue from continuing operations would have beenUSD 4,118,378 thousand. The goodwill of USD 2,499,117 thousand comprise the fair value of expectedsynergies arising from the acquisition.
F-79
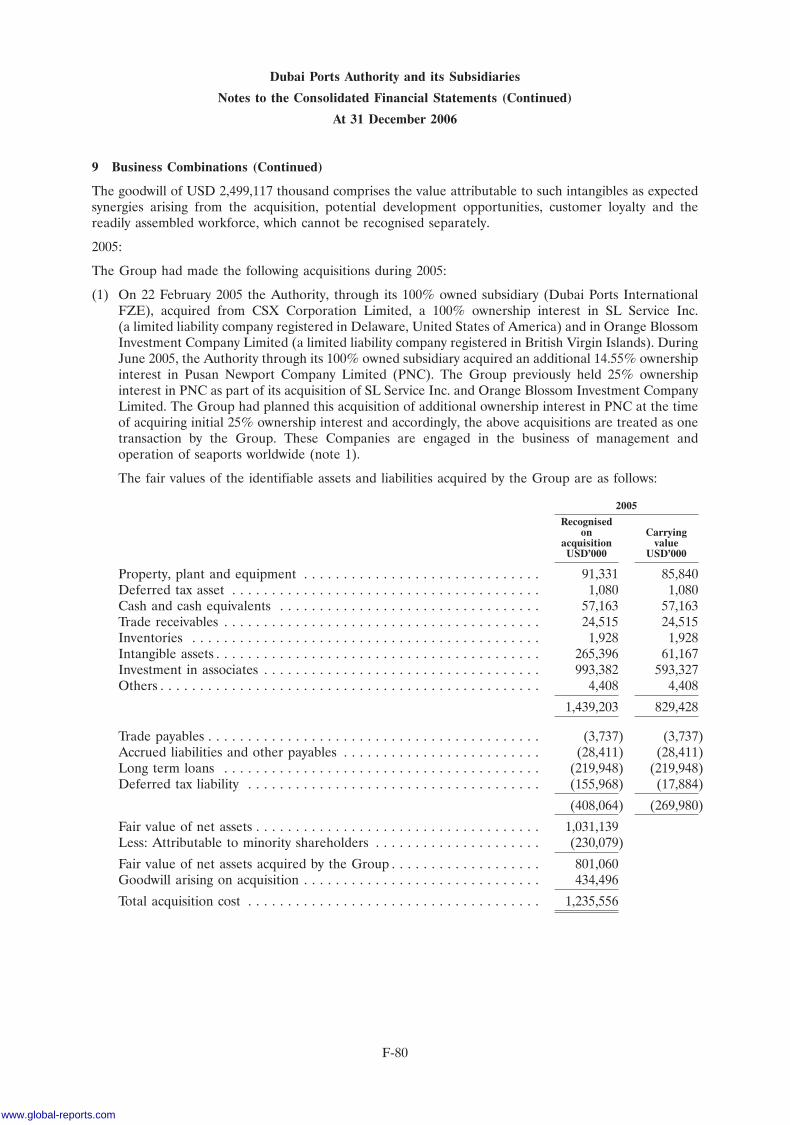
Dubai Ports Authority and its Subsidiaries
Notes to the Consolidated Financial Statements (Continued)
At 31 December 2006
9 Business Combinations (Continued)
The goodwill of USD 2,499,117 thousand comprises the value attributable to such intangibles as expectedsynergies arising from the acquisition, potential development opportunities, customer loyalty and thereadily assembled workforce, which cannot be recognised separately.
2005:
The Group had made the following acquisitions during 2005:
(1) On 22 February 2005 the Authority, through its 100% owned subsidiary (Dubai Ports InternationalFZE), acquired from CSX Corporation Limited, a 100% ownership interest in SL Service Inc.(a limited liability company registered in Delaware, United States of America) and in Orange BlossomInvestment Company Limited (a limited liability company registered in British Virgin Islands). DuringJune 2005, the Authority through its 100% owned subsidiary acquired an additional 14.55% ownershipinterest in Pusan Newport Company Limited (PNC). The Group previously held 25% ownershipinterest in PNC as part of its acquisition of SL Service Inc. and Orange Blossom Investment CompanyLimited. The Group had planned this acquisition of additional ownership interest in PNC at the timeof acquiring initial 25% ownership interest and accordingly, the above acquisitions are treated as onetransaction by the Group. These Companies are engaged in the business of management andoperation of seaports worldwide (note 1).
The fair values of the identifiable assets and liabilities acquired by the Group are as follows:
2005
Recognisedon Carrying
acquisition valueUSD’000 USD’000
Property, plant and equipment . . . . . . . . . . . . . . . . . . . . . . . . . . . . . . 91,331 85,840Deferred tax asset . . . . . . . . . . . . . . . . . . . . . . . . . . . . . . . . . . . . . . . 1,080 1,080Cash and cash equivalents . . . . . . . . . . . . . . . . . . . . . . . . . . . . . . . . . 57,163 57,163Trade receivables . . . . . . . . . . . . . . . . . . . . . . . . . . . . . . . . . . . . . . . . 24,515 24,515Inventories . . . . . . . . . . . . . . . . . . . . . . . . . . . . . . . . . . . . . . . . . . . . 1,928 1,928Intangible assets . . . . . . . . . . . . . . . . . . . . . . . . . . . . . . . . . . . . . . . . . 265,396 61,167Investment in associates . . . . . . . . . . . . . . . . . . . . . . . . . . . . . . . . . . . 993,382 593,327Others . . . . . . . . . . . . . . . . . . . . . . . . . . . . . . . . . . . . . . . . . . . . . . . . 4,408 4,408
1,439,203 829,428
Trade payables . . . . . . . . . . . . . . . . . . . . . . . . . . . . . . . . . . . . . . . . . . (3,737) (3,737)Accrued liabilities and other payables . . . . . . . . . . . . . . . . . . . . . . . . . (28,411) (28,411)Long term loans . . . . . . . . . . . . . . . . . . . . . . . . . . . . . . . . . . . . . . . . (219,948) (219,948)Deferred tax liability . . . . . . . . . . . . . . . . . . . . . . . . . . . . . . . . . . . . . (155,968) (17,884)
(408,064) (269,980)
Fair value of net assets . . . . . . . . . . . . . . . . . . . . . . . . . . . . . . . . . . . . 1,031,139Less: Attributable to minority shareholders . . . . . . . . . . . . . . . . . . . . . (230,079)
Fair value of net assets acquired by the Group . . . . . . . . . . . . . . . . . . . 801,060Goodwill arising on acquisition . . . . . . . . . . . . . . . . . . . . . . . . . . . . . . 434,496
Total acquisition cost . . . . . . . . . . . . . . . . . . . . . . . . . . . . . . . . . . . . . 1,235,556
F-80
www.global-reports.com
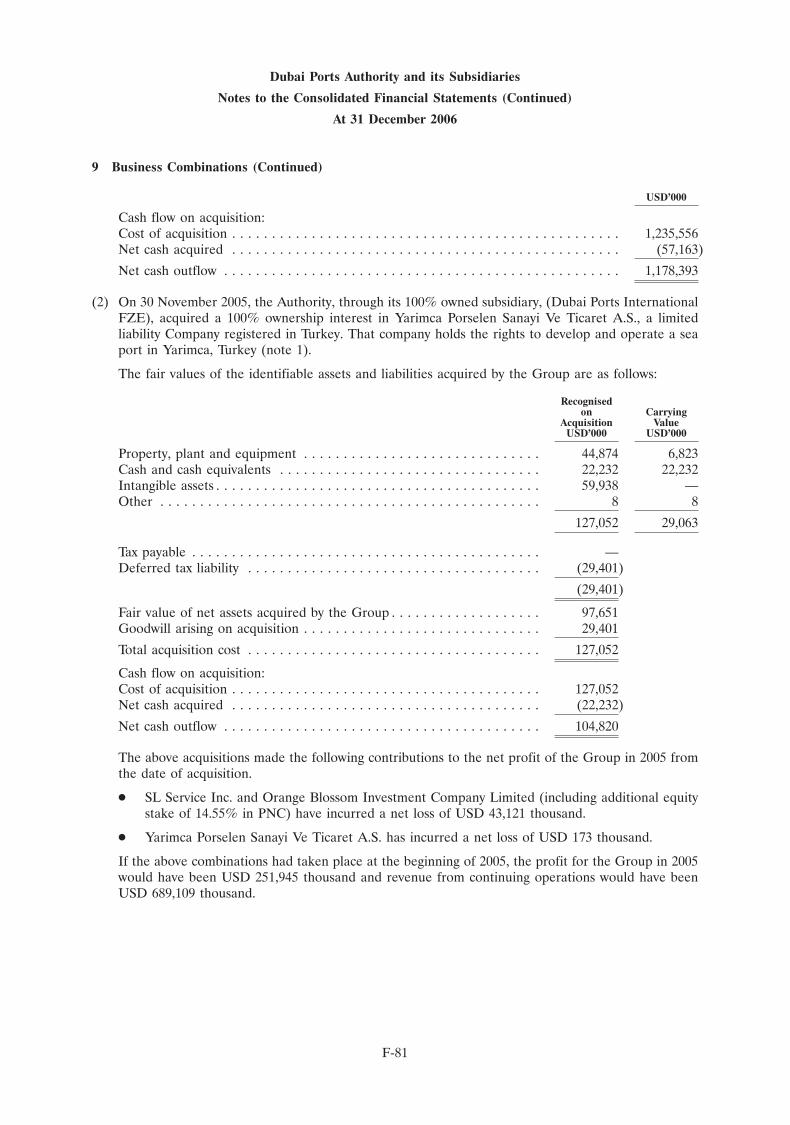
Dubai Ports Authority and its Subsidiaries
Notes to the Consolidated Financial Statements (Continued)
At 31 December 2006
9 Business Combinations (Continued)
USD’000
Cash flow on acquisition:Cost of acquisition . . . . . . . . . . . . . . . . . . . . . . . . . . . . . . . . . . . . . . . . . . . . . . . . . 1,235,556Net cash acquired . . . . . . . . . . . . . . . . . . . . . . . . . . . . . . . . . . . . . . . . . . . . . . . . . (57,163)
Net cash outflow . . . . . . . . . . . . . . . . . . . . . . . . . . . . . . . . . . . . . . . . . . . . . . . . . . 1,178,393
(2) On 30 November 2005, the Authority, through its 100% owned subsidiary, (Dubai Ports InternationalFZE), acquired a 100% ownership interest in Yarimca Porselen Sanayi Ve Ticaret A.S., a limitedliability Company registered in Turkey. That company holds the rights to develop and operate a seaport in Yarimca, Turkey (note 1).
The fair values of the identifiable assets and liabilities acquired by the Group are as follows:
Recognisedon Carrying
Acquisition ValueUSD’000 USD’000
Property, plant and equipment . . . . . . . . . . . . . . . . . . . . . . . . . . . . . . 44,874 6,823Cash and cash equivalents . . . . . . . . . . . . . . . . . . . . . . . . . . . . . . . . . 22,232 22,232Intangible assets . . . . . . . . . . . . . . . . . . . . . . . . . . . . . . . . . . . . . . . . . 59,938 —Other . . . . . . . . . . . . . . . . . . . . . . . . . . . . . . . . . . . . . . . . . . . . . . . . 8 8
127,052 29,063
Tax payable . . . . . . . . . . . . . . . . . . . . . . . . . . . . . . . . . . . . . . . . . . . . —Deferred tax liability . . . . . . . . . . . . . . . . . . . . . . . . . . . . . . . . . . . . . (29,401)
(29,401)
Fair value of net assets acquired by the Group . . . . . . . . . . . . . . . . . . . 97,651Goodwill arising on acquisition . . . . . . . . . . . . . . . . . . . . . . . . . . . . . . 29,401
Total acquisition cost . . . . . . . . . . . . . . . . . . . . . . . . . . . . . . . . . . . . . 127,052
Cash flow on acquisition:Cost of acquisition . . . . . . . . . . . . . . . . . . . . . . . . . . . . . . . . . . . . . . . 127,052Net cash acquired . . . . . . . . . . . . . . . . . . . . . . . . . . . . . . . . . . . . . . . (22,232)
Net cash outflow . . . . . . . . . . . . . . . . . . . . . . . . . . . . . . . . . . . . . . . . 104,820
The above acquisitions made the following contributions to the net profit of the Group in 2005 fromthe date of acquisition.
� SL Service Inc. and Orange Blossom Investment Company Limited (including additional equitystake of 14.55% in PNC) have incurred a net loss of USD 43,121 thousand.
� Yarimca Porselen Sanayi Ve Ticaret A.S. has incurred a net loss of USD 173 thousand.
If the above combinations had taken place at the beginning of 2005, the profit for the Group in 2005would have been USD 251,945 thousand and revenue from continuing operations would have beenUSD 689,109 thousand.
F-81
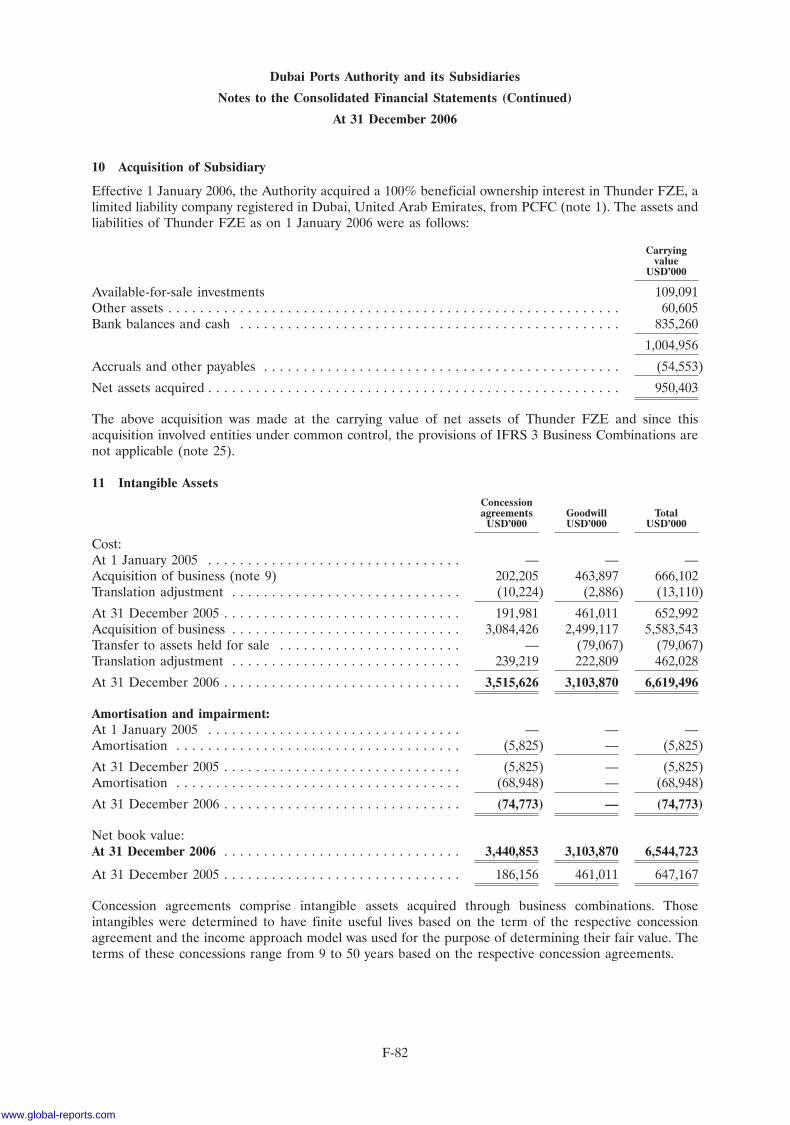
Dubai Ports Authority and its Subsidiaries
Notes to the Consolidated Financial Statements (Continued)
At 31 December 2006
10 Acquisition of Subsidiary
Effective 1 January 2006, the Authority acquired a 100% beneficial ownership interest in Thunder FZE, alimited liability company registered in Dubai, United Arab Emirates, from PCFC (note 1). The assets andliabilities of Thunder FZE as on 1 January 2006 were as follows:
Carryingvalue
USD’000
Available-for-sale investments 109,091Other assets . . . . . . . . . . . . . . . . . . . . . . . . . . . . . . . . . . . . . . . . . . . . . . . . . . . . . . . . . 60,605Bank balances and cash . . . . . . . . . . . . . . . . . . . . . . . . . . . . . . . . . . . . . . . . . . . . . . . . 835,260
1,004,956
Accruals and other payables . . . . . . . . . . . . . . . . . . . . . . . . . . . . . . . . . . . . . . . . . . . . . (54,553)
Net assets acquired . . . . . . . . . . . . . . . . . . . . . . . . . . . . . . . . . . . . . . . . . . . . . . . . . . . . 950,403
The above acquisition was made at the carrying value of net assets of Thunder FZE and since thisacquisition involved entities under common control, the provisions of IFRS 3 Business Combinations arenot applicable (note 25).
11 Intangible AssetsConcessionagreements Goodwill Total
USD’000 USD’000 USD’000
Cost:At 1 January 2005 . . . . . . . . . . . . . . . . . . . . . . . . . . . . . . . . — — —Acquisition of business (note 9) 202,205 463,897 666,102Translation adjustment . . . . . . . . . . . . . . . . . . . . . . . . . . . . . (10,224) (2,886) (13,110)
At 31 December 2005 . . . . . . . . . . . . . . . . . . . . . . . . . . . . . . 191,981 461,011 652,992Acquisition of business . . . . . . . . . . . . . . . . . . . . . . . . . . . . . 3,084,426 2,499,117 5,583,543Transfer to assets held for sale . . . . . . . . . . . . . . . . . . . . . . . — (79,067) (79,067)Translation adjustment . . . . . . . . . . . . . . . . . . . . . . . . . . . . . 239,219 222,809 462,028
At 31 December 2006 . . . . . . . . . . . . . . . . . . . . . . . . . . . . . . 3,515,626 3,103,870 6,619,496
Amortisation and impairment:At 1 January 2005 . . . . . . . . . . . . . . . . . . . . . . . . . . . . . . . . — — —Amortisation . . . . . . . . . . . . . . . . . . . . . . . . . . . . . . . . . . . . (5,825) — (5,825)
At 31 December 2005 . . . . . . . . . . . . . . . . . . . . . . . . . . . . . . (5,825) — (5,825)Amortisation . . . . . . . . . . . . . . . . . . . . . . . . . . . . . . . . . . . . (68,948) — (68,948)
At 31 December 2006 . . . . . . . . . . . . . . . . . . . . . . . . . . . . . . (74,773) — (74,773)
Net book value:At 31 December 2006 . . . . . . . . . . . . . . . . . . . . . . . . . . . . . . 3,440,853 3,103,870 6,544,723
At 31 December 2005 . . . . . . . . . . . . . . . . . . . . . . . . . . . . . . 186,156 461,011 647,167
Concession agreements comprise intangible assets acquired through business combinations. Thoseintangibles were determined to have finite useful lives based on the term of the respective concessionagreement and the income approach model was used for the purpose of determining their fair value. Theterms of these concessions range from 9 to 50 years based on the respective concession agreements.
F-82
www.global-reports.com
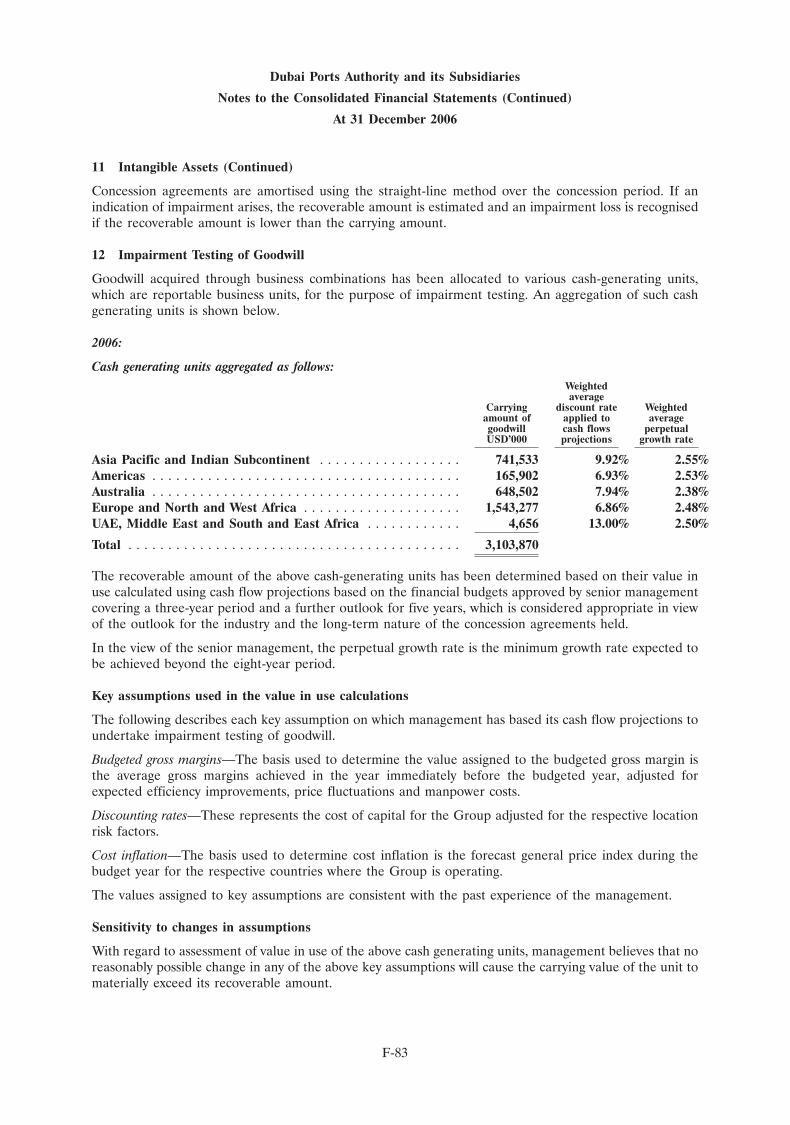
Dubai Ports Authority and its Subsidiaries
Notes to the Consolidated Financial Statements (Continued)
At 31 December 2006
11 Intangible Assets (Continued)
Concession agreements are amortised using the straight-line method over the concession period. If anindication of impairment arises, the recoverable amount is estimated and an impairment loss is recognisedif the recoverable amount is lower than the carrying amount.
12 Impairment Testing of Goodwill
Goodwill acquired through business combinations has been allocated to various cash-generating units,which are reportable business units, for the purpose of impairment testing. An aggregation of such cashgenerating units is shown below.
2006:
Cash generating units aggregated as follows:Weightedaverage
Carrying discount rate Weightedamount of applied to averagegoodwill cash flows perpetualUSD’000 projections growth rate
Asia Pacific and Indian Subcontinent . . . . . . . . . . . . . . . . . . 741,533 9.92% 2.55%Americas . . . . . . . . . . . . . . . . . . . . . . . . . . . . . . . . . . . . . . . 165,902 6.93% 2.53%Australia . . . . . . . . . . . . . . . . . . . . . . . . . . . . . . . . . . . . . . . 648,502 7.94% 2.38%Europe and North and West Africa . . . . . . . . . . . . . . . . . . . . 1,543,277 6.86% 2.48%UAE, Middle East and South and East Africa . . . . . . . . . . . . 4,656 13.00% 2.50%
Total . . . . . . . . . . . . . . . . . . . . . . . . . . . . . . . . . . . . . . . . . . 3,103,870
The recoverable amount of the above cash-generating units has been determined based on their value inuse calculated using cash flow projections based on the financial budgets approved by senior managementcovering a three-year period and a further outlook for five years, which is considered appropriate in viewof the outlook for the industry and the long-term nature of the concession agreements held.
In the view of the senior management, the perpetual growth rate is the minimum growth rate expected tobe achieved beyond the eight-year period.
Key assumptions used in the value in use calculations
The following describes each key assumption on which management has based its cash flow projections toundertake impairment testing of goodwill.
Budgeted gross margins—The basis used to determine the value assigned to the budgeted gross margin isthe average gross margins achieved in the year immediately before the budgeted year, adjusted forexpected efficiency improvements, price fluctuations and manpower costs.
Discounting rates—These represents the cost of capital for the Group adjusted for the respective locationrisk factors.
Cost inflation—The basis used to determine cost inflation is the forecast general price index during thebudget year for the respective countries where the Group is operating.
The values assigned to key assumptions are consistent with the past experience of the management.
Sensitivity to changes in assumptions
With regard to assessment of value in use of the above cash generating units, management believes that noreasonably possible change in any of the above key assumptions will cause the carrying value of the unit tomaterially exceed its recoverable amount.
F-83
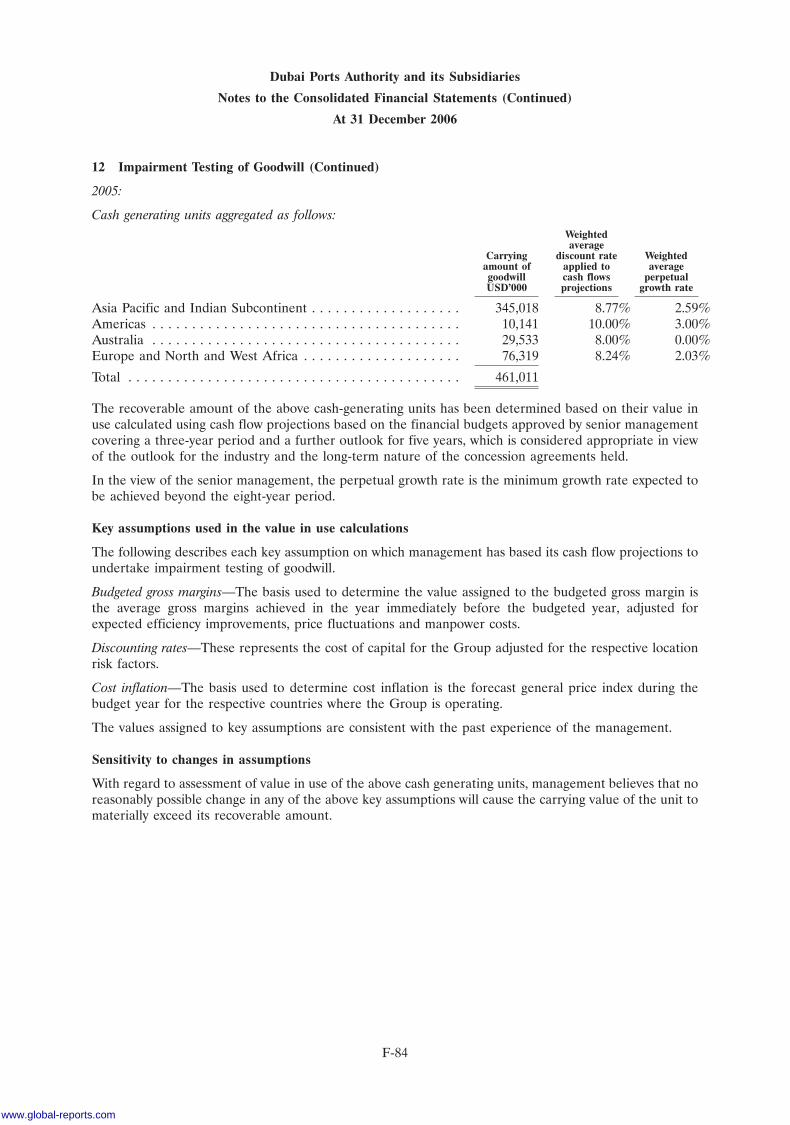
Dubai Ports Authority and its Subsidiaries
Notes to the Consolidated Financial Statements (Continued)
At 31 December 2006
12 Impairment Testing of Goodwill (Continued)
2005:
Cash generating units aggregated as follows:Weightedaverage
Carrying discount rate Weightedamount of applied to averagegoodwill cash flows perpetualUSD’000 projections growth rate
Asia Pacific and Indian Subcontinent . . . . . . . . . . . . . . . . . . . 345,018 8.77% 2.59%Americas . . . . . . . . . . . . . . . . . . . . . . . . . . . . . . . . . . . . . . . 10,141 10.00% 3.00%Australia . . . . . . . . . . . . . . . . . . . . . . . . . . . . . . . . . . . . . . . 29,533 8.00% 0.00%Europe and North and West Africa . . . . . . . . . . . . . . . . . . . . 76,319 8.24% 2.03%
Total . . . . . . . . . . . . . . . . . . . . . . . . . . . . . . . . . . . . . . . . . . 461,011
The recoverable amount of the above cash-generating units has been determined based on their value inuse calculated using cash flow projections based on the financial budgets approved by senior managementcovering a three-year period and a further outlook for five years, which is considered appropriate in viewof the outlook for the industry and the long-term nature of the concession agreements held.
In the view of the senior management, the perpetual growth rate is the minimum growth rate expected tobe achieved beyond the eight-year period.
Key assumptions used in the value in use calculations
The following describes each key assumption on which management has based its cash flow projections toundertake impairment testing of goodwill.
Budgeted gross margins—The basis used to determine the value assigned to the budgeted gross margin isthe average gross margins achieved in the year immediately before the budgeted year, adjusted forexpected efficiency improvements, price fluctuations and manpower costs.
Discounting rates—These represents the cost of capital for the Group adjusted for the respective locationrisk factors.
Cost inflation—The basis used to determine cost inflation is the forecast general price index during thebudget year for the respective countries where the Group is operating.
The values assigned to key assumptions are consistent with the past experience of the management.
Sensitivity to changes in assumptions
With regard to assessment of value in use of the above cash generating units, management believes that noreasonably possible change in any of the above key assumptions will cause the carrying value of the unit tomaterially exceed its recoverable amount.
F-84
www.global-reports.com
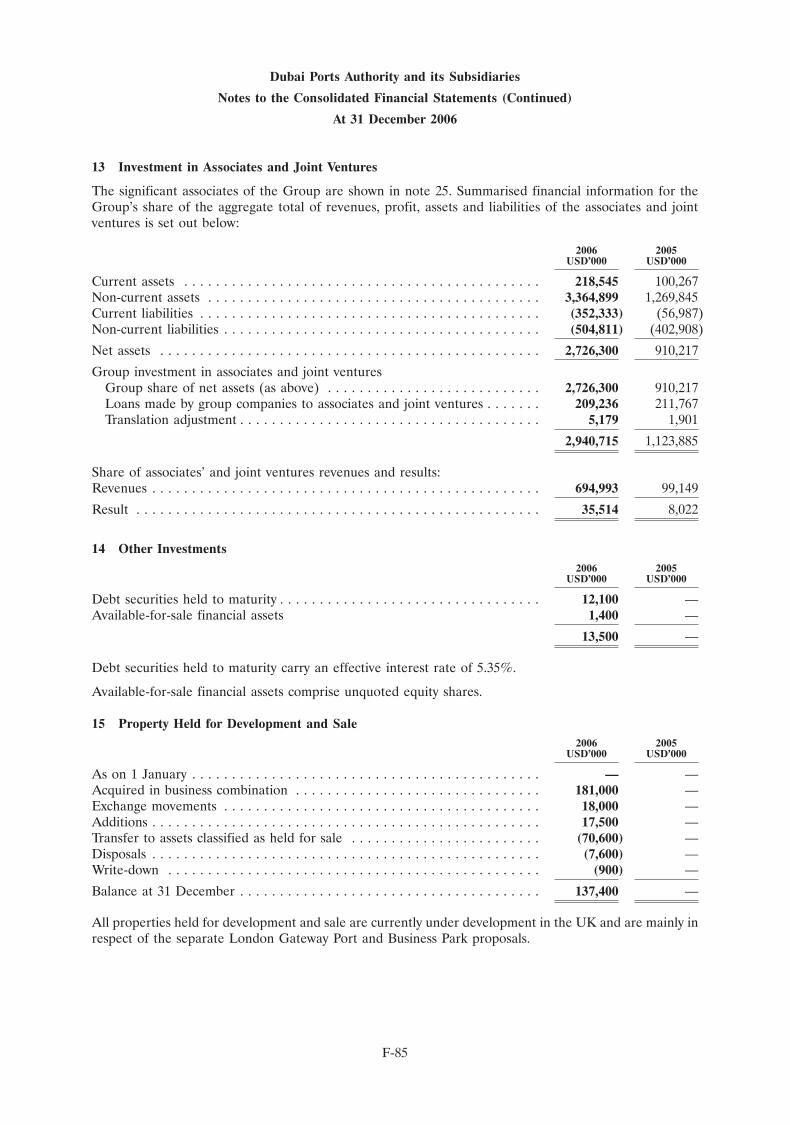
Dubai Ports Authority and its Subsidiaries
Notes to the Consolidated Financial Statements (Continued)
At 31 December 2006
13 Investment in Associates and Joint Ventures
The significant associates of the Group are shown in note 25. Summarised financial information for theGroup’s share of the aggregate total of revenues, profit, assets and liabilities of the associates and jointventures is set out below:
2006 2005USD’000 USD’000
Current assets . . . . . . . . . . . . . . . . . . . . . . . . . . . . . . . . . . . . . . . . . . . . . 218,545 100,267Non-current assets . . . . . . . . . . . . . . . . . . . . . . . . . . . . . . . . . . . . . . . . . . 3,364,899 1,269,845Current liabilities . . . . . . . . . . . . . . . . . . . . . . . . . . . . . . . . . . . . . . . . . . . (352,333) (56,987)Non-current liabilities . . . . . . . . . . . . . . . . . . . . . . . . . . . . . . . . . . . . . . . . (504,811) (402,908)
Net assets . . . . . . . . . . . . . . . . . . . . . . . . . . . . . . . . . . . . . . . . . . . . . . . . 2,726,300 910,217
Group investment in associates and joint venturesGroup share of net assets (as above) . . . . . . . . . . . . . . . . . . . . . . . . . . . 2,726,300 910,217Loans made by group companies to associates and joint ventures . . . . . . . 209,236 211,767Translation adjustment . . . . . . . . . . . . . . . . . . . . . . . . . . . . . . . . . . . . . . 5,179 1,901
2,940,715 1,123,885
Share of associates’ and joint ventures revenues and results:Revenues . . . . . . . . . . . . . . . . . . . . . . . . . . . . . . . . . . . . . . . . . . . . . . . . . 694,993 99,149
Result . . . . . . . . . . . . . . . . . . . . . . . . . . . . . . . . . . . . . . . . . . . . . . . . . . . 35,514 8,022
14 Other Investments2006 2005
USD’000 USD’000
Debt securities held to maturity . . . . . . . . . . . . . . . . . . . . . . . . . . . . . . . . . 12,100 —Available-for-sale financial assets 1,400 —
13,500 —
Debt securities held to maturity carry an effective interest rate of 5.35%.
Available-for-sale financial assets comprise unquoted equity shares.
15 Property Held for Development and Sale2006 2005
USD’000 USD’000
As on 1 January . . . . . . . . . . . . . . . . . . . . . . . . . . . . . . . . . . . . . . . . . . . . — —Acquired in business combination . . . . . . . . . . . . . . . . . . . . . . . . . . . . . . . 181,000 —Exchange movements . . . . . . . . . . . . . . . . . . . . . . . . . . . . . . . . . . . . . . . . 18,000 —Additions . . . . . . . . . . . . . . . . . . . . . . . . . . . . . . . . . . . . . . . . . . . . . . . . . 17,500 —Transfer to assets classified as held for sale . . . . . . . . . . . . . . . . . . . . . . . . (70,600) —Disposals . . . . . . . . . . . . . . . . . . . . . . . . . . . . . . . . . . . . . . . . . . . . . . . . . (7,600) —Write-down . . . . . . . . . . . . . . . . . . . . . . . . . . . . . . . . . . . . . . . . . . . . . . . (900) —
Balance at 31 December . . . . . . . . . . . . . . . . . . . . . . . . . . . . . . . . . . . . . . 137,400 —
All properties held for development and sale are currently under development in the UK and are mainly inrespect of the separate London Gateway Port and Business Park proposals.
F-85
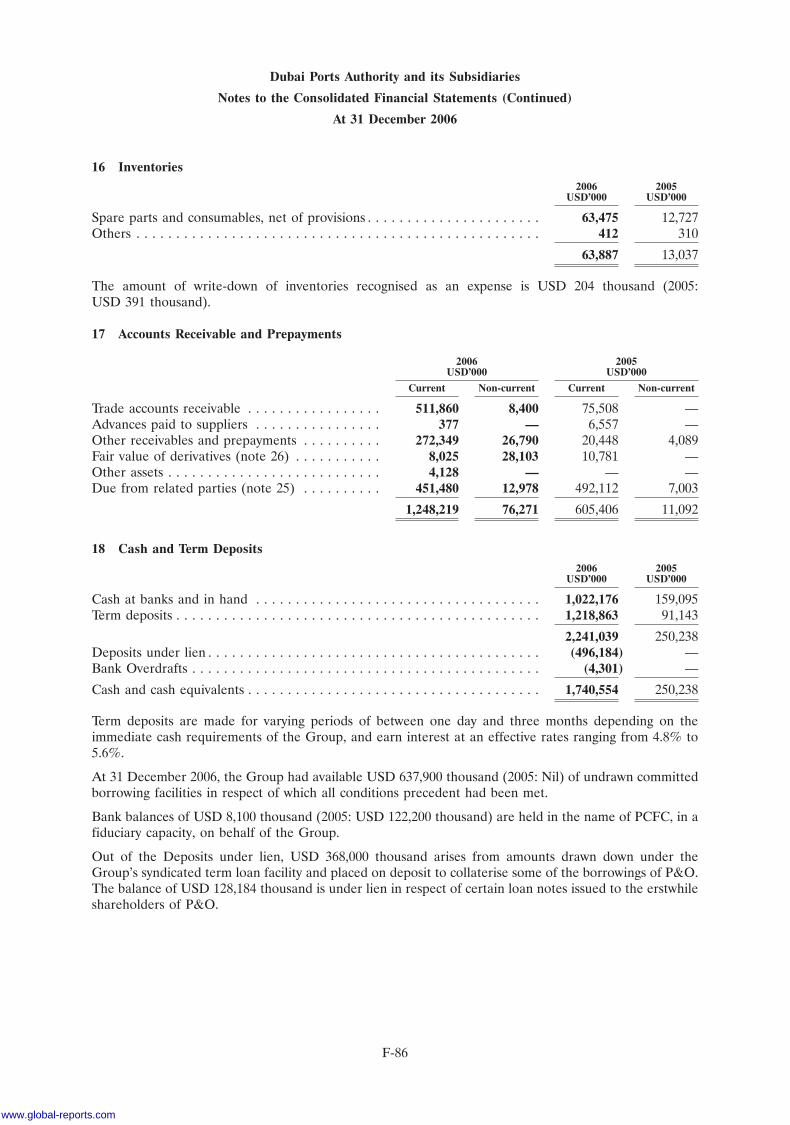
Dubai Ports Authority and its Subsidiaries
Notes to the Consolidated Financial Statements (Continued)
At 31 December 2006
16 Inventories2006 2005
USD’000 USD’000
Spare parts and consumables, net of provisions . . . . . . . . . . . . . . . . . . . . . . 63,475 12,727Others . . . . . . . . . . . . . . . . . . . . . . . . . . . . . . . . . . . . . . . . . . . . . . . . . . . 412 310
63,887 13,037
The amount of write-down of inventories recognised as an expense is USD 204 thousand (2005:USD 391 thousand).
17 Accounts Receivable and Prepayments
2006 2005USD’000 USD’000
Current Non-current Current Non-current
Trade accounts receivable . . . . . . . . . . . . . . . . . 511,860 8,400 75,508 —Advances paid to suppliers . . . . . . . . . . . . . . . . 377 — 6,557 —Other receivables and prepayments . . . . . . . . . . 272,349 26,790 20,448 4,089Fair value of derivatives (note 26) . . . . . . . . . . . 8,025 28,103 10,781 —Other assets . . . . . . . . . . . . . . . . . . . . . . . . . . . 4,128 — — —Due from related parties (note 25) . . . . . . . . . . 451,480 12,978 492,112 7,003
1,248,219 76,271 605,406 11,092
18 Cash and Term Deposits2006 2005
USD’000 USD’000
Cash at banks and in hand . . . . . . . . . . . . . . . . . . . . . . . . . . . . . . . . . . . . 1,022,176 159,095Term deposits . . . . . . . . . . . . . . . . . . . . . . . . . . . . . . . . . . . . . . . . . . . . . . 1,218,863 91,143
2,241,039 250,238Deposits under lien . . . . . . . . . . . . . . . . . . . . . . . . . . . . . . . . . . . . . . . . . . (496,184) —Bank Overdrafts . . . . . . . . . . . . . . . . . . . . . . . . . . . . . . . . . . . . . . . . . . . . (4,301) —
Cash and cash equivalents . . . . . . . . . . . . . . . . . . . . . . . . . . . . . . . . . . . . . 1,740,554 250,238
Term deposits are made for varying periods of between one day and three months depending on theimmediate cash requirements of the Group, and earn interest at an effective rates ranging from 4.8% to5.6%.
At 31 December 2006, the Group had available USD 637,900 thousand (2005: Nil) of undrawn committedborrowing facilities in respect of which all conditions precedent had been met.
Bank balances of USD 8,100 thousand (2005: USD 122,200 thousand) are held in the name of PCFC, in afiduciary capacity, on behalf of the Group.
Out of the Deposits under lien, USD 368,000 thousand arises from amounts drawn down under theGroup’s syndicated term loan facility and placed on deposit to collaterise some of the borrowings of P&O.The balance of USD 128,184 thousand is under lien in respect of certain loan notes issued to the erstwhileshareholders of P&O.
F-86
www.global-reports.com
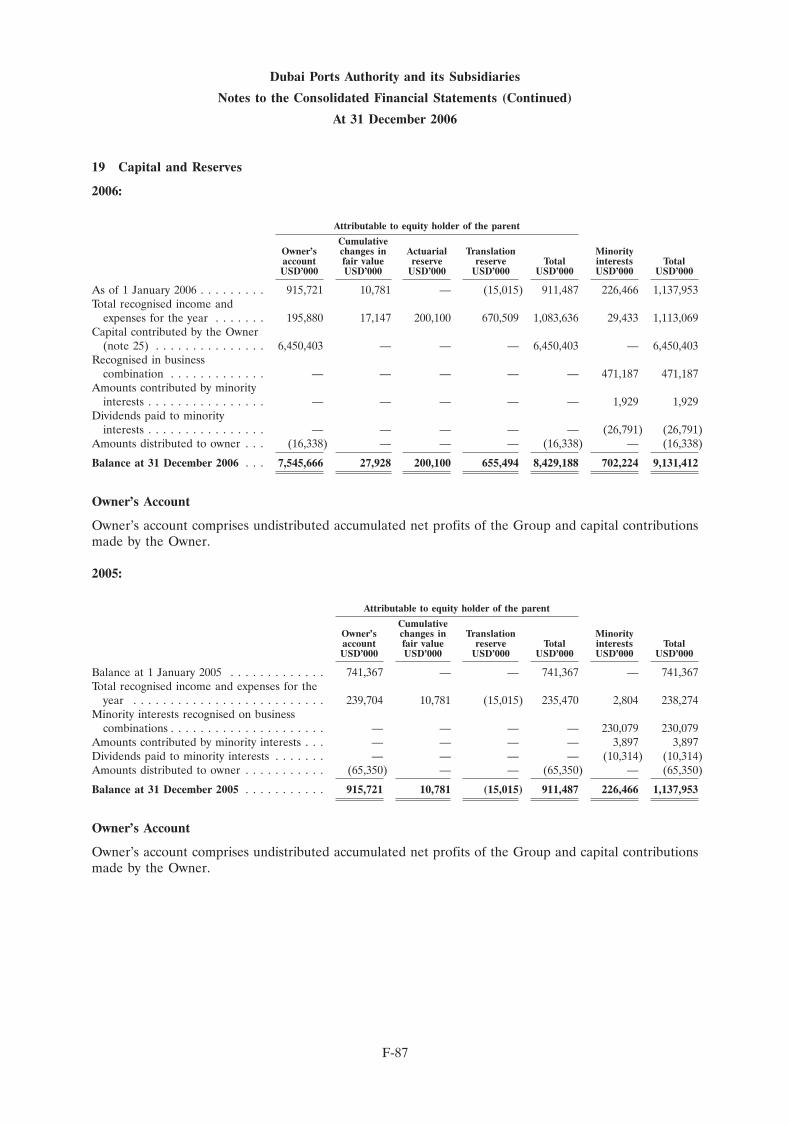
Dubai Ports Authority and its Subsidiaries
Notes to the Consolidated Financial Statements (Continued)
At 31 December 2006
19 Capital and Reserves
2006:
Attributable to equity holder of the parent
CumulativeOwner’s changes in Actuarial Translation Minorityaccount fair value reserve reserve Total interests TotalUSD’000 USD’000 USD’000 USD’000 USD’000 USD’000 USD’000
As of 1 January 2006 . . . . . . . . . 915,721 10,781 — (15,015) 911,487 226,466 1,137,953Total recognised income and
expenses for the year . . . . . . . 195,880 17,147 200,100 670,509 1,083,636 29,433 1,113,069Capital contributed by the Owner
(note 25) . . . . . . . . . . . . . . . 6,450,403 — — — 6,450,403 — 6,450,403Recognised in business
combination . . . . . . . . . . . . . — — — — — 471,187 471,187Amounts contributed by minority
interests . . . . . . . . . . . . . . . . — — — — — 1,929 1,929Dividends paid to minority
interests . . . . . . . . . . . . . . . . — — — — — (26,791) (26,791)Amounts distributed to owner . . . (16,338) — — — (16,338) — (16,338)
Balance at 31 December 2006 . . . 7,545,666 27,928 200,100 655,494 8,429,188 702,224 9,131,412
Owner’s Account
Owner’s account comprises undistributed accumulated net profits of the Group and capital contributionsmade by the Owner.
2005:
Attributable to equity holder of the parent
CumulativeOwner’s changes in Translation Minorityaccount fair value reserve Total interests TotalUSD’000 USD’000 USD’000 USD’000 USD’000 USD’000
Balance at 1 January 2005 . . . . . . . . . . . . . 741,367 — — 741,367 — 741,367Total recognised income and expenses for the
year . . . . . . . . . . . . . . . . . . . . . . . . . . 239,704 10,781 (15,015) 235,470 2,804 238,274Minority interests recognised on business
combinations . . . . . . . . . . . . . . . . . . . . . — — — — 230,079 230,079Amounts contributed by minority interests . . . — — — — 3,897 3,897Dividends paid to minority interests . . . . . . . — — — — (10,314) (10,314)Amounts distributed to owner . . . . . . . . . . . (65,350) — — (65,350) — (65,350)
Balance at 31 December 2005 . . . . . . . . . . . 915,721 10,781 (15,015) 911,487 226,466 1,137,953
Owner’s Account
Owner’s account comprises undistributed accumulated net profits of the Group and capital contributionsmade by the Owner.
F-87
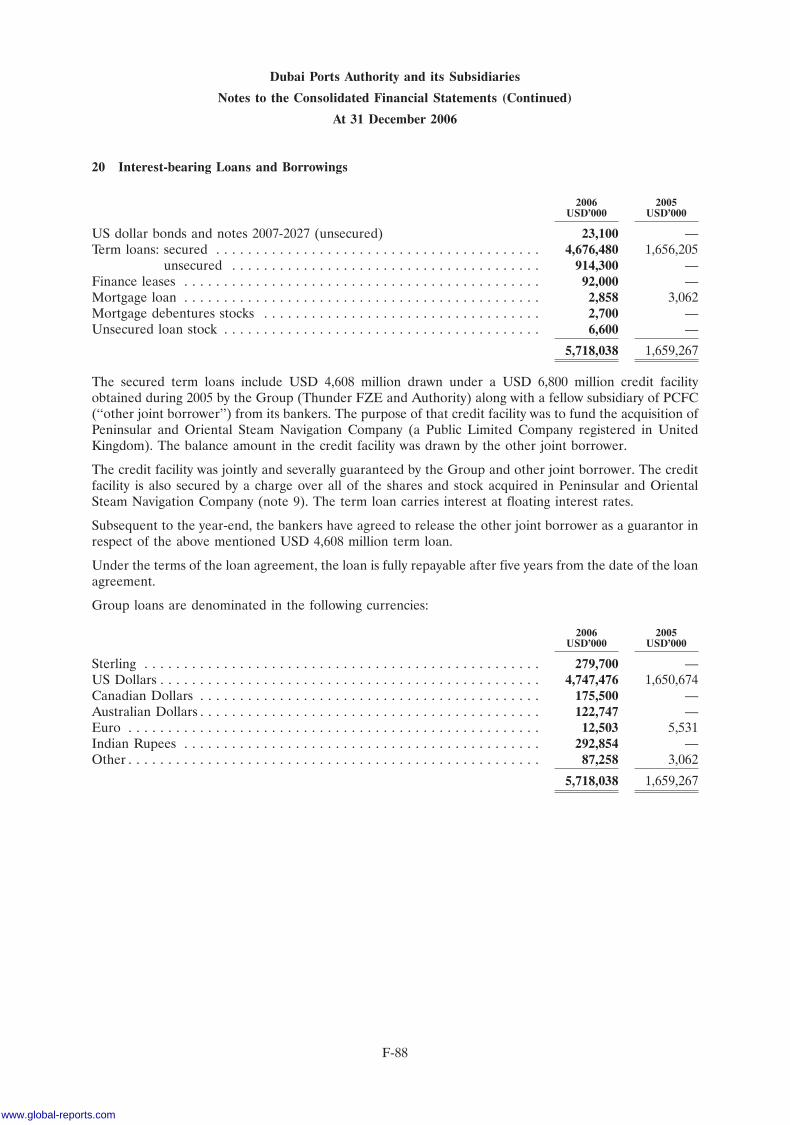
Dubai Ports Authority and its Subsidiaries
Notes to the Consolidated Financial Statements (Continued)
At 31 December 2006
20 Interest-bearing Loans and Borrowings
2006 2005USD’000 USD’000
US dollar bonds and notes 2007-2027 (unsecured) 23,100 —Term loans: secured . . . . . . . . . . . . . . . . . . . . . . . . . . . . . . . . . . . . . . . . . 4,676,480 1,656,205
unsecured . . . . . . . . . . . . . . . . . . . . . . . . . . . . . . . . . . . . . . . 914,300 —Finance leases . . . . . . . . . . . . . . . . . . . . . . . . . . . . . . . . . . . . . . . . . . . . . 92,000 —Mortgage loan . . . . . . . . . . . . . . . . . . . . . . . . . . . . . . . . . . . . . . . . . . . . . 2,858 3,062Mortgage debentures stocks . . . . . . . . . . . . . . . . . . . . . . . . . . . . . . . . . . . 2,700 —Unsecured loan stock . . . . . . . . . . . . . . . . . . . . . . . . . . . . . . . . . . . . . . . . 6,600 —
5,718,038 1,659,267
The secured term loans include USD 4,608 million drawn under a USD 6,800 million credit facilityobtained during 2005 by the Group (Thunder FZE and Authority) along with a fellow subsidiary of PCFC(‘‘other joint borrower’’) from its bankers. The purpose of that credit facility was to fund the acquisition ofPeninsular and Oriental Steam Navigation Company (a Public Limited Company registered in UnitedKingdom). The balance amount in the credit facility was drawn by the other joint borrower.
The credit facility was jointly and severally guaranteed by the Group and other joint borrower. The creditfacility is also secured by a charge over all of the shares and stock acquired in Peninsular and OrientalSteam Navigation Company (note 9). The term loan carries interest at floating interest rates.
Subsequent to the year-end, the bankers have agreed to release the other joint borrower as a guarantor inrespect of the above mentioned USD 4,608 million term loan.
Under the terms of the loan agreement, the loan is fully repayable after five years from the date of the loanagreement.
Group loans are denominated in the following currencies:
2006 2005USD’000 USD’000
Sterling . . . . . . . . . . . . . . . . . . . . . . . . . . . . . . . . . . . . . . . . . . . . . . . . . . 279,700 —US Dollars . . . . . . . . . . . . . . . . . . . . . . . . . . . . . . . . . . . . . . . . . . . . . . . . 4,747,476 1,650,674Canadian Dollars . . . . . . . . . . . . . . . . . . . . . . . . . . . . . . . . . . . . . . . . . . . 175,500 —Australian Dollars . . . . . . . . . . . . . . . . . . . . . . . . . . . . . . . . . . . . . . . . . . . 122,747 —Euro . . . . . . . . . . . . . . . . . . . . . . . . . . . . . . . . . . . . . . . . . . . . . . . . . . . . 12,503 5,531Indian Rupees . . . . . . . . . . . . . . . . . . . . . . . . . . . . . . . . . . . . . . . . . . . . . 292,854 —Other . . . . . . . . . . . . . . . . . . . . . . . . . . . . . . . . . . . . . . . . . . . . . . . . . . . . 87,258 3,062
5,718,038 1,659,267
F-88
www.global-reports.com
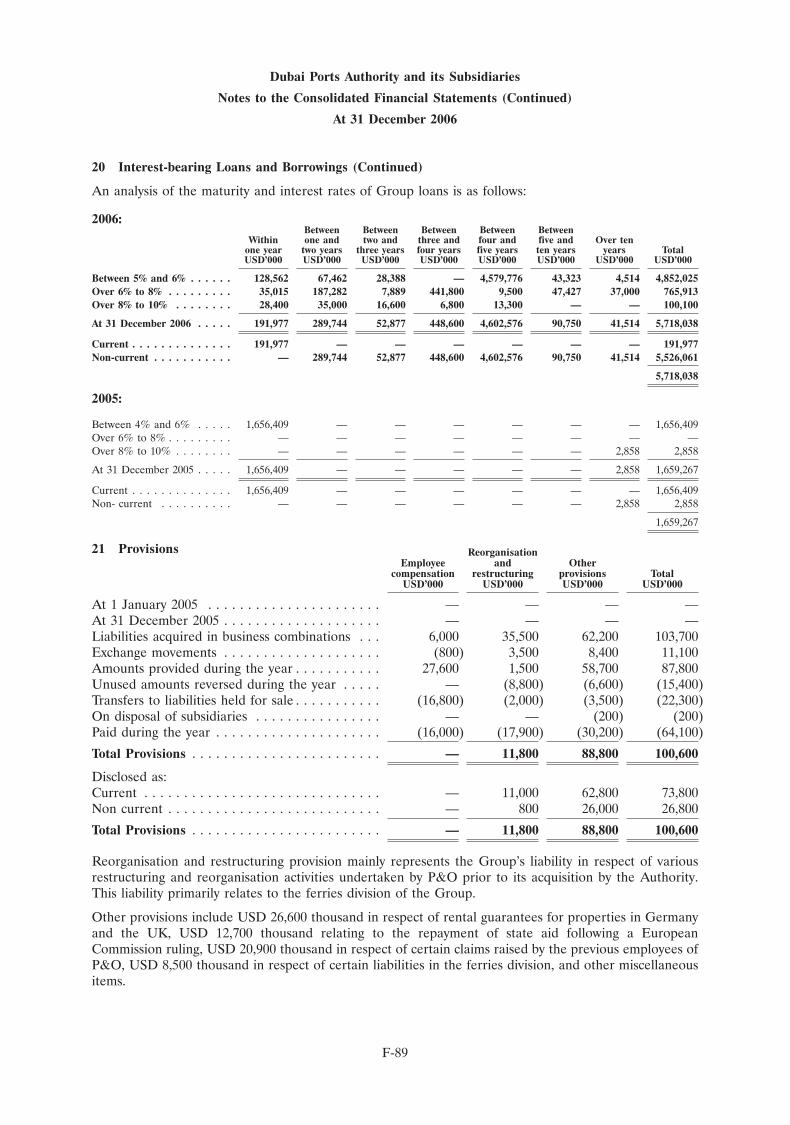
Dubai Ports Authority and its Subsidiaries
Notes to the Consolidated Financial Statements (Continued)
At 31 December 2006
20 Interest-bearing Loans and Borrowings (Continued)
An analysis of the maturity and interest rates of Group loans is as follows:
2006:Between Between Between Between Between
Within one and two and three and four and five and Over tenone year two years three years four years five years ten years years TotalUSD’000 USD’000 USD’000 USD’000 USD’000 USD’000 USD’000 USD’000
Between 5% and 6% . . . . . . 128,562 67,462 28,388 — 4,579,776 43,323 4,514 4,852,025Over 6% to 8% . . . . . . . . . 35,015 187,282 7,889 441,800 9,500 47,427 37,000 765,913Over 8% to 10% . . . . . . . . 28,400 35,000 16,600 6,800 13,300 — — 100,100
At 31 December 2006 . . . . . 191,977 289,744 52,877 448,600 4,602,576 90,750 41,514 5,718,038
Current . . . . . . . . . . . . . . 191,977 — — — — — — 191,977Non-current . . . . . . . . . . . — 289,744 52,877 448,600 4,602,576 90,750 41,514 5,526,061
5,718,038
2005:
Between 4% and 6% . . . . . 1,656,409 — — — — — — 1,656,409Over 6% to 8% . . . . . . . . . — — — — — — — —Over 8% to 10% . . . . . . . . — — — — — — 2,858 2,858
At 31 December 2005 . . . . . 1,656,409 — — — — — 2,858 1,659,267
Current . . . . . . . . . . . . . . 1,656,409 — — — — — — 1,656,409Non- current . . . . . . . . . . — — — — — — 2,858 2,858
1,659,267
21 Provisions ReorganisationEmployee and Other
compensation restructuring provisions TotalUSD’000 USD’000 USD’000 USD’000
At 1 January 2005 . . . . . . . . . . . . . . . . . . . . . . — — — —At 31 December 2005 . . . . . . . . . . . . . . . . . . . . — — — —Liabilities acquired in business combinations . . . 6,000 35,500 62,200 103,700Exchange movements . . . . . . . . . . . . . . . . . . . . (800) 3,500 8,400 11,100Amounts provided during the year . . . . . . . . . . . 27,600 1,500 58,700 87,800Unused amounts reversed during the year . . . . . — (8,800) (6,600) (15,400)Transfers to liabilities held for sale . . . . . . . . . . . (16,800) (2,000) (3,500) (22,300)On disposal of subsidiaries . . . . . . . . . . . . . . . . — — (200) (200)Paid during the year . . . . . . . . . . . . . . . . . . . . . (16,000) (17,900) (30,200) (64,100)
Total Provisions . . . . . . . . . . . . . . . . . . . . . . . . — 11,800 88,800 100,600
Disclosed as:Current . . . . . . . . . . . . . . . . . . . . . . . . . . . . . . — 11,000 62,800 73,800Non current . . . . . . . . . . . . . . . . . . . . . . . . . . . — 800 26,000 26,800
Total Provisions . . . . . . . . . . . . . . . . . . . . . . . . — 11,800 88,800 100,600
Reorganisation and restructuring provision mainly represents the Group’s liability in respect of variousrestructuring and reorganisation activities undertaken by P&O prior to its acquisition by the Authority.This liability primarily relates to the ferries division of the Group.
Other provisions include USD 26,600 thousand in respect of rental guarantees for properties in Germanyand the UK, USD 12,700 thousand relating to the repayment of state aid following a EuropeanCommission ruling, USD 20,900 thousand in respect of certain claims raised by the previous employees ofP&O, USD 8,500 thousand in respect of certain liabilities in the ferries division, and other miscellaneousitems.
F-89
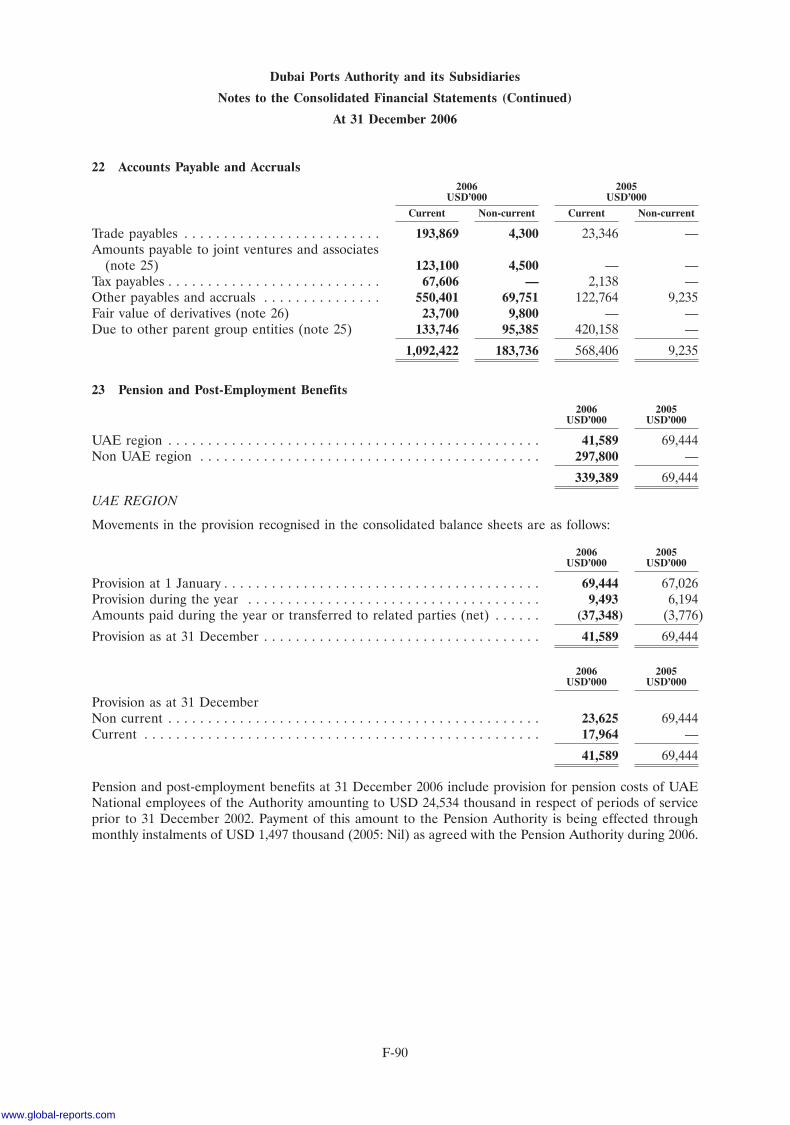
Dubai Ports Authority and its Subsidiaries
Notes to the Consolidated Financial Statements (Continued)
At 31 December 2006
22 Accounts Payable and Accruals2006 2005
USD’000 USD’000
Current Non-current Current Non-current
Trade payables . . . . . . . . . . . . . . . . . . . . . . . . . 193,869 4,300 23,346 —Amounts payable to joint ventures and associates
(note 25) 123,100 4,500 — —Tax payables . . . . . . . . . . . . . . . . . . . . . . . . . . . 67,606 — 2,138 —Other payables and accruals . . . . . . . . . . . . . . . 550,401 69,751 122,764 9,235Fair value of derivatives (note 26) 23,700 9,800 — —Due to other parent group entities (note 25) 133,746 95,385 420,158 —
1,092,422 183,736 568,406 9,235
23 Pension and Post-Employment Benefits2006 2005
USD’000 USD’000
UAE region . . . . . . . . . . . . . . . . . . . . . . . . . . . . . . . . . . . . . . . . . . . . . . . 41,589 69,444Non UAE region . . . . . . . . . . . . . . . . . . . . . . . . . . . . . . . . . . . . . . . . . . . 297,800 —
339,389 69,444
UAE REGION
Movements in the provision recognised in the consolidated balance sheets are as follows:
2006 2005USD’000 USD’000
Provision at 1 January . . . . . . . . . . . . . . . . . . . . . . . . . . . . . . . . . . . . . . . . 69,444 67,026Provision during the year . . . . . . . . . . . . . . . . . . . . . . . . . . . . . . . . . . . . . 9,493 6,194Amounts paid during the year or transferred to related parties (net) . . . . . . (37,348) (3,776)
Provision as at 31 December . . . . . . . . . . . . . . . . . . . . . . . . . . . . . . . . . . . 41,589 69,444
2006 2005USD’000 USD’000
Provision as at 31 DecemberNon current . . . . . . . . . . . . . . . . . . . . . . . . . . . . . . . . . . . . . . . . . . . . . . . 23,625 69,444Current . . . . . . . . . . . . . . . . . . . . . . . . . . . . . . . . . . . . . . . . . . . . . . . . . . 17,964 —
41,589 69,444
Pension and post-employment benefits at 31 December 2006 include provision for pension costs of UAENational employees of the Authority amounting to USD 24,534 thousand in respect of periods of serviceprior to 31 December 2002. Payment of this amount to the Pension Authority is being effected throughmonthly instalments of USD 1,497 thousand (2005: Nil) as agreed with the Pension Authority during 2006.
F-90
www.global-reports.com
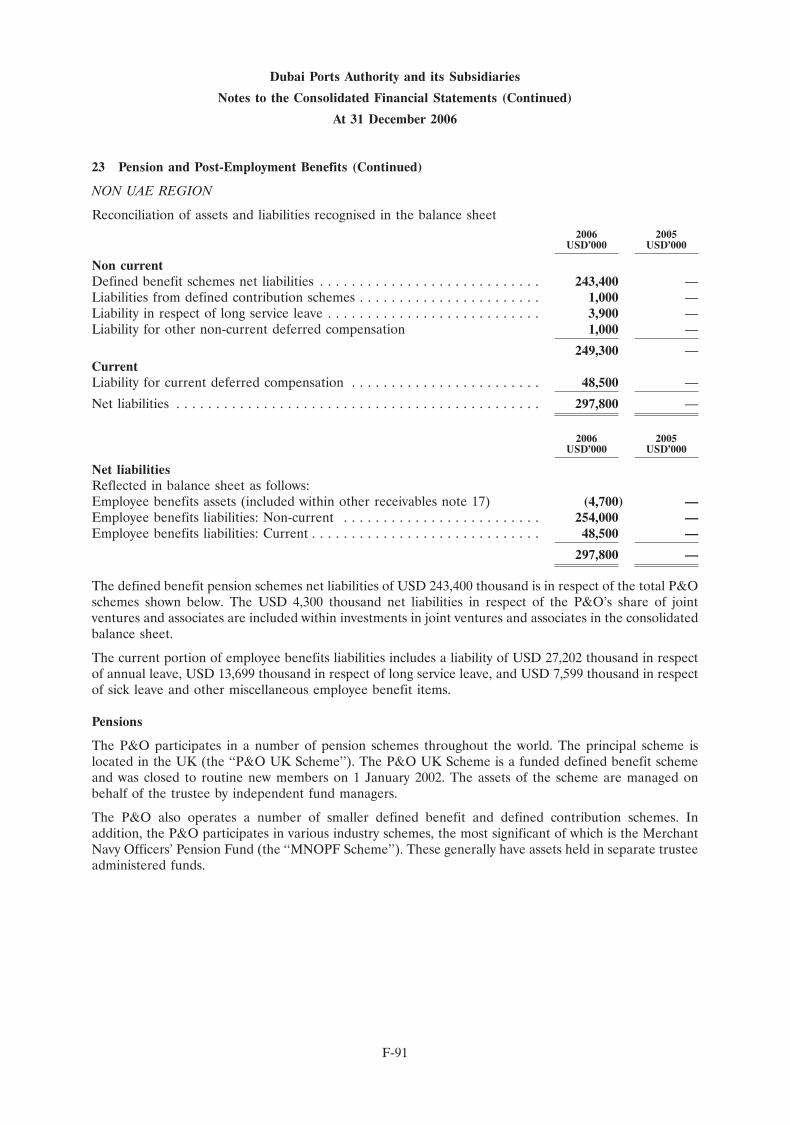
Dubai Ports Authority and its Subsidiaries
Notes to the Consolidated Financial Statements (Continued)
At 31 December 2006
23 Pension and Post-Employment Benefits (Continued)
NON UAE REGION
Reconciliation of assets and liabilities recognised in the balance sheet2006 2005
USD’000 USD’000
Non currentDefined benefit schemes net liabilities . . . . . . . . . . . . . . . . . . . . . . . . . . . . 243,400 —Liabilities from defined contribution schemes . . . . . . . . . . . . . . . . . . . . . . . 1,000 —Liability in respect of long service leave . . . . . . . . . . . . . . . . . . . . . . . . . . . 3,900 —Liability for other non-current deferred compensation 1,000 —
249,300 —CurrentLiability for current deferred compensation . . . . . . . . . . . . . . . . . . . . . . . . 48,500 —
Net liabilities . . . . . . . . . . . . . . . . . . . . . . . . . . . . . . . . . . . . . . . . . . . . . . 297,800 —
2006 2005USD’000 USD’000
Net liabilitiesReflected in balance sheet as follows:Employee benefits assets (included within other receivables note 17) (4,700) —Employee benefits liabilities: Non-current . . . . . . . . . . . . . . . . . . . . . . . . . 254,000 —Employee benefits liabilities: Current . . . . . . . . . . . . . . . . . . . . . . . . . . . . . 48,500 —
297,800 —
The defined benefit pension schemes net liabilities of USD 243,400 thousand is in respect of the total P&Oschemes shown below. The USD 4,300 thousand net liabilities in respect of the P&O’s share of jointventures and associates are included within investments in joint ventures and associates in the consolidatedbalance sheet.
The current portion of employee benefits liabilities includes a liability of USD 27,202 thousand in respectof annual leave, USD 13,699 thousand in respect of long service leave, and USD 7,599 thousand in respectof sick leave and other miscellaneous employee benefit items.
Pensions
The P&O participates in a number of pension schemes throughout the world. The principal scheme islocated in the UK (the ‘‘P&O UK Scheme’’). The P&O UK Scheme is a funded defined benefit schemeand was closed to routine new members on 1 January 2002. The assets of the scheme are managed onbehalf of the trustee by independent fund managers.
The P&O also operates a number of smaller defined benefit and defined contribution schemes. Inaddition, the P&O participates in various industry schemes, the most significant of which is the MerchantNavy Officers’ Pension Fund (the ‘‘MNOPF Scheme’’). These generally have assets held in separate trusteeadministered funds.
F-91
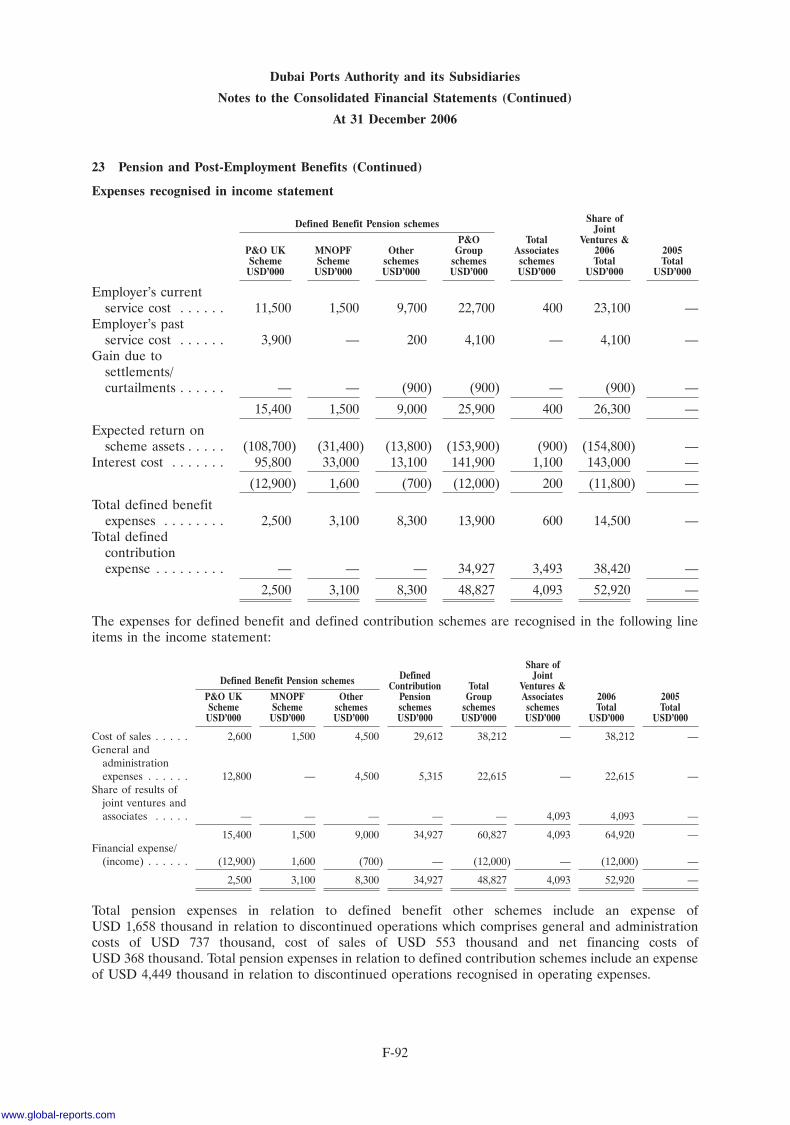
Dubai Ports Authority and its Subsidiaries
Notes to the Consolidated Financial Statements (Continued)
At 31 December 2006
23 Pension and Post-Employment Benefits (Continued)
Expenses recognised in income statement
Share ofDefined Benefit Pension schemes JointP&O Total Ventures &
P&O UK MNOPF Other Group Associates 2006 2005Scheme Scheme schemes schemes schemes Total TotalUSD’000 USD’000 USD’000 USD’000 USD’000 USD’000 USD’000
Employer’s currentservice cost . . . . . . 11,500 1,500 9,700 22,700 400 23,100 —
Employer’s pastservice cost . . . . . . 3,900 — 200 4,100 — 4,100 —
Gain due tosettlements/curtailments . . . . . . — — (900) (900) — (900) —
15,400 1,500 9,000 25,900 400 26,300 —
Expected return onscheme assets . . . . . (108,700) (31,400) (13,800) (153,900) (900) (154,800) —
Interest cost . . . . . . . 95,800 33,000 13,100 141,900 1,100 143,000 —
(12,900) 1,600 (700) (12,000) 200 (11,800) —
Total defined benefitexpenses . . . . . . . . 2,500 3,100 8,300 13,900 600 14,500 —
Total definedcontributionexpense . . . . . . . . . — — — 34,927 3,493 38,420 —
2,500 3,100 8,300 48,827 4,093 52,920 —
The expenses for defined benefit and defined contribution schemes are recognised in the following lineitems in the income statement:
Share ofDefined JointDefined Benefit Pension schemes Contribution Total Ventures &
P&O UK MNOPF Other Pension Group Associates 2006 2005Scheme Scheme schemes schemes schemes schemes Total TotalUSD’000 USD’000 USD’000 USD’000 USD’000 USD’000 USD’000 USD’000
Cost of sales . . . . . 2,600 1,500 4,500 29,612 38,212 — 38,212 —General and
administrationexpenses . . . . . . 12,800 — 4,500 5,315 22,615 — 22,615 —
Share of results ofjoint ventures andassociates . . . . . — — — — — 4,093 4,093 —
15,400 1,500 9,000 34,927 60,827 4,093 64,920 —Financial expense/
(income) . . . . . . (12,900) 1,600 (700) — (12,000) — (12,000) —
2,500 3,100 8,300 34,927 48,827 4,093 52,920 —
Total pension expenses in relation to defined benefit other schemes include an expense ofUSD 1,658 thousand in relation to discontinued operations which comprises general and administrationcosts of USD 737 thousand, cost of sales of USD 553 thousand and net financing costs ofUSD 368 thousand. Total pension expenses in relation to defined contribution schemes include an expenseof USD 4,449 thousand in relation to discontinued operations recognised in operating expenses.
F-92
www.global-reports.com
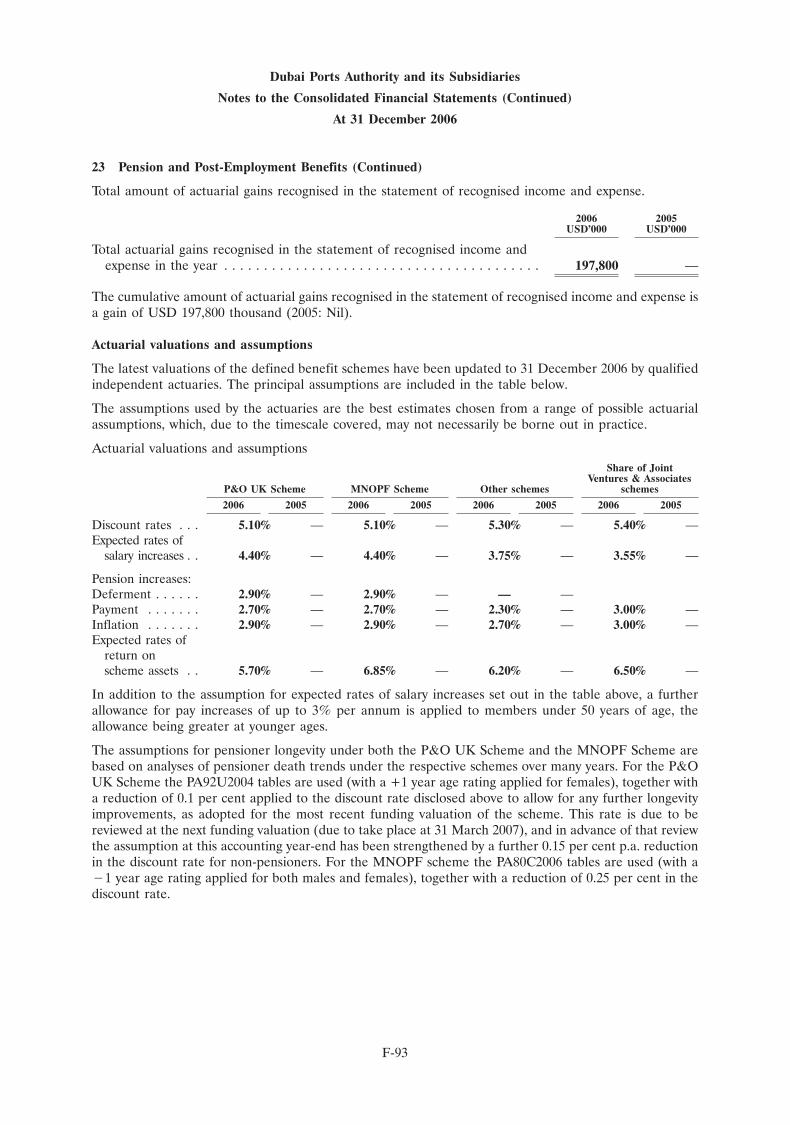
Dubai Ports Authority and its Subsidiaries
Notes to the Consolidated Financial Statements (Continued)
At 31 December 2006
23 Pension and Post-Employment Benefits (Continued)
Total amount of actuarial gains recognised in the statement of recognised income and expense.
2006 2005USD’000 USD’000
Total actuarial gains recognised in the statement of recognised income andexpense in the year . . . . . . . . . . . . . . . . . . . . . . . . . . . . . . . . . . . . . . . . 197,800 —
The cumulative amount of actuarial gains recognised in the statement of recognised income and expense isa gain of USD 197,800 thousand (2005: Nil).
Actuarial valuations and assumptions
The latest valuations of the defined benefit schemes have been updated to 31 December 2006 by qualifiedindependent actuaries. The principal assumptions are included in the table below.
The assumptions used by the actuaries are the best estimates chosen from a range of possible actuarialassumptions, which, due to the timescale covered, may not necessarily be borne out in practice.
Actuarial valuations and assumptionsShare of Joint
Ventures & AssociatesP&O UK Scheme MNOPF Scheme Other schemes schemes
2006 2005 2006 2005 2006 2005 2006 2005
Discount rates . . . 5.10% — 5.10% — 5.30% — 5.40% —Expected rates of
salary increases . . 4.40% — 4.40% — 3.75% — 3.55% —
Pension increases:Deferment . . . . . . 2.90% — 2.90% — — —Payment . . . . . . . 2.70% — 2.70% — 2.30% — 3.00% —Inflation . . . . . . . 2.90% — 2.90% — 2.70% — 3.00% —Expected rates of
return onscheme assets . . 5.70% — 6.85% — 6.20% — 6.50% —
In addition to the assumption for expected rates of salary increases set out in the table above, a furtherallowance for pay increases of up to 3% per annum is applied to members under 50 years of age, theallowance being greater at younger ages.
The assumptions for pensioner longevity under both the P&O UK Scheme and the MNOPF Scheme arebased on analyses of pensioner death trends under the respective schemes over many years. For the P&OUK Scheme the PA92U2004 tables are used (with a +1 year age rating applied for females), together witha reduction of 0.1 per cent applied to the discount rate disclosed above to allow for any further longevityimprovements, as adopted for the most recent funding valuation of the scheme. This rate is due to bereviewed at the next funding valuation (due to take place at 31 March 2007), and in advance of that reviewthe assumption at this accounting year-end has been strengthened by a further 0.15 per cent p.a. reductionin the discount rate for non-pensioners. For the MNOPF scheme the PA80C2006 tables are used (with a�1 year age rating applied for both males and females), together with a reduction of 0.25 per cent in thediscount rate.
F-93
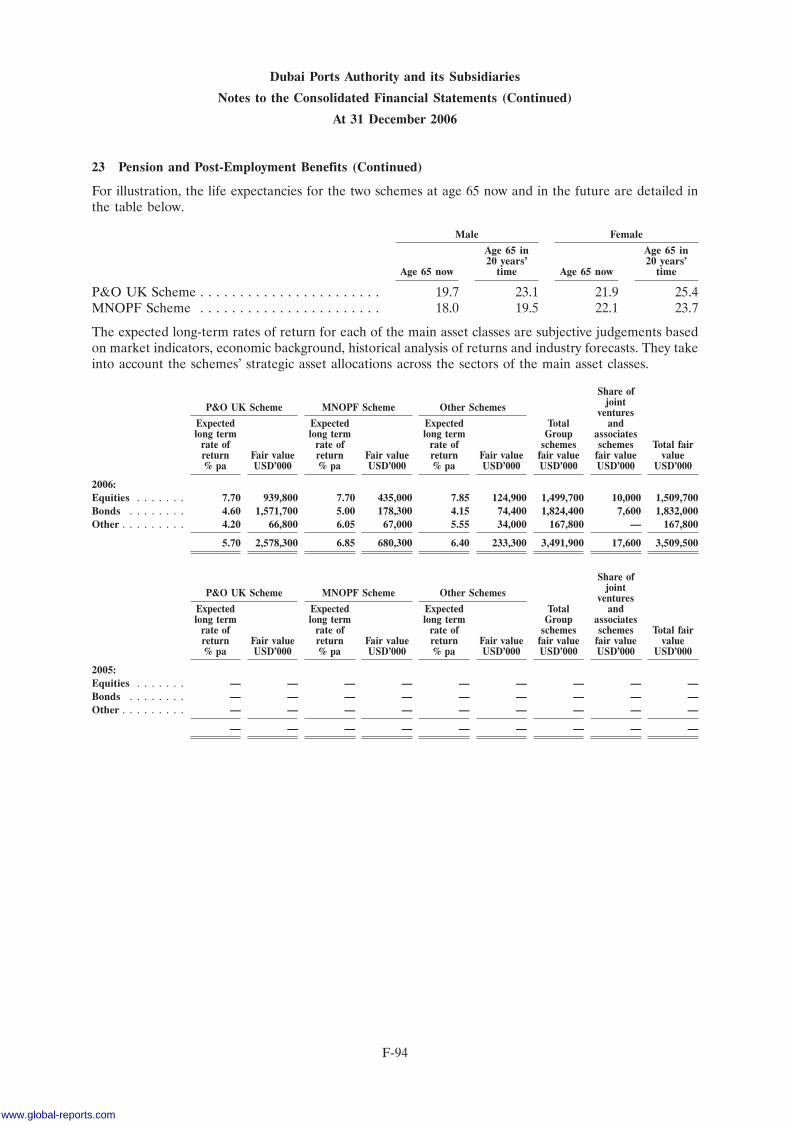
Dubai Ports Authority and its Subsidiaries
Notes to the Consolidated Financial Statements (Continued)
At 31 December 2006
23 Pension and Post-Employment Benefits (Continued)
For illustration, the life expectancies for the two schemes at age 65 now and in the future are detailed inthe table below.
Male Female
Age 65 in Age 65 in20 years’ 20 years’
Age 65 now time Age 65 now time
P&O UK Scheme . . . . . . . . . . . . . . . . . . . . . . . 19.7 23.1 21.9 25.4MNOPF Scheme . . . . . . . . . . . . . . . . . . . . . . . 18.0 19.5 22.1 23.7
The expected long-term rates of return for each of the main asset classes are subjective judgements basedon market indicators, economic background, historical analysis of returns and industry forecasts. They takeinto account the schemes’ strategic asset allocations across the sectors of the main asset classes.
Share ofjointP&O UK Scheme MNOPF Scheme Other Schemes ventures
Expected Expected Expected Total andlong term long term long term Group associates
rate of rate of rate of schemes schemes Total fairreturn Fair value return Fair value return Fair value fair value fair value value% pa USD’000 % pa USD’000 % pa USD’000 USD’000 USD’000 USD’000
2006:Equities . . . . . . . 7.70 939,800 7.70 435,000 7.85 124,900 1,499,700 10,000 1,509,700Bonds . . . . . . . . 4.60 1,571,700 5.00 178,300 4.15 74,400 1,824,400 7,600 1,832,000Other . . . . . . . . . 4.20 66,800 6.05 67,000 5.55 34,000 167,800 — 167,800
5.70 2,578,300 6.85 680,300 6.40 233,300 3,491,900 17,600 3,509,500
Share ofjointP&O UK Scheme MNOPF Scheme Other Schemes ventures
Expected Expected Expected Total andlong term long term long term Group associates
rate of rate of rate of schemes schemes Total fairreturn Fair value return Fair value return Fair value fair value fair value value% pa USD’000 % pa USD’000 % pa USD’000 USD’000 USD’000 USD’000
2005:Equities . . . . . . . — — — — — — — — —Bonds . . . . . . . . — — — — — — — — —Other . . . . . . . . . — — — — — — — — —
— — — — — — — — —
F-94
www.global-reports.com
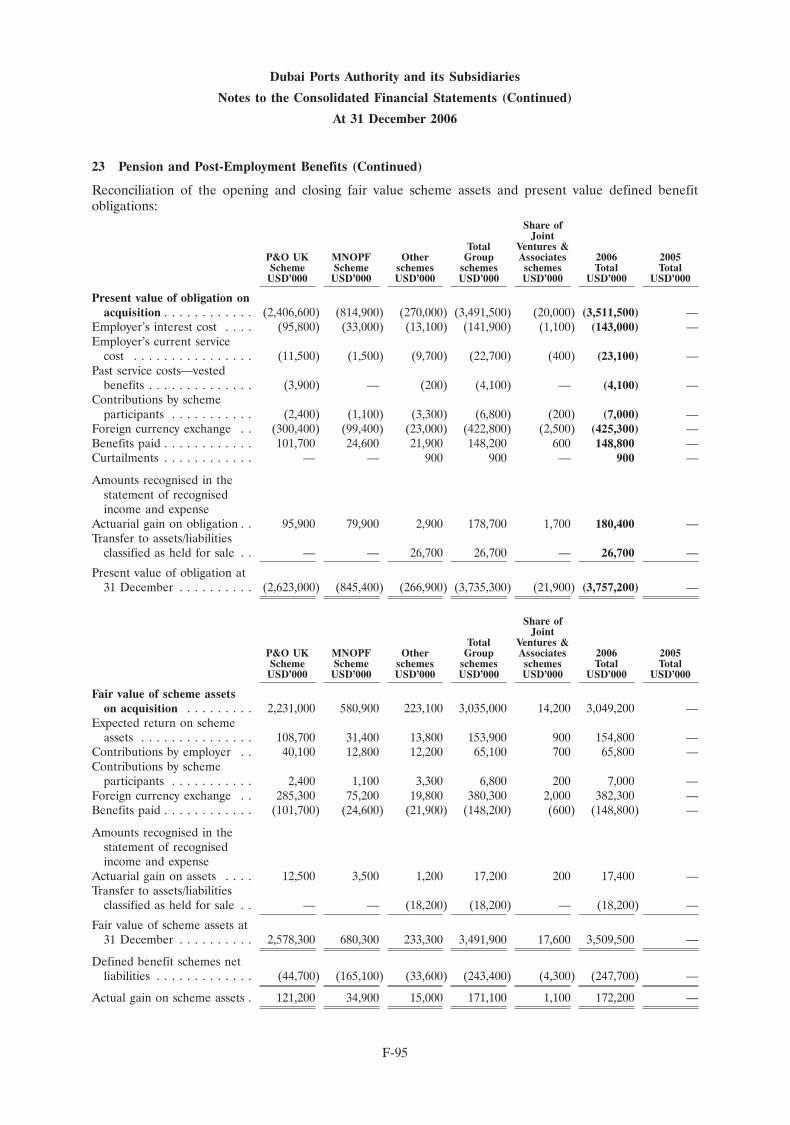
Dubai Ports Authority and its Subsidiaries
Notes to the Consolidated Financial Statements (Continued)
At 31 December 2006
23 Pension and Post-Employment Benefits (Continued)
Reconciliation of the opening and closing fair value scheme assets and present value defined benefitobligations:
Share ofJoint
Total Ventures &P&O UK MNOPF Other Group Associates 2006 2005Scheme Scheme schemes schemes schemes Total TotalUSD’000 USD’000 USD’000 USD’000 USD’000 USD’000 USD’000
Present value of obligation onacquisition . . . . . . . . . . . . (2,406,600) (814,900) (270,000) (3,491,500) (20,000) (3,511,500) —
Employer’s interest cost . . . . (95,800) (33,000) (13,100) (141,900) (1,100) (143,000) —Employer’s current service
cost . . . . . . . . . . . . . . . . (11,500) (1,500) (9,700) (22,700) (400) (23,100) —Past service costs—vested
benefits . . . . . . . . . . . . . . (3,900) — (200) (4,100) — (4,100) —Contributions by scheme
participants . . . . . . . . . . . (2,400) (1,100) (3,300) (6,800) (200) (7,000) —Foreign currency exchange . . (300,400) (99,400) (23,000) (422,800) (2,500) (425,300) —Benefits paid . . . . . . . . . . . . 101,700 24,600 21,900 148,200 600 148,800 —Curtailments . . . . . . . . . . . . — — 900 900 — 900 —
Amounts recognised in thestatement of recognisedincome and expense
Actuarial gain on obligation . . 95,900 79,900 2,900 178,700 1,700 180,400 —Transfer to assets/liabilities
classified as held for sale . . — — 26,700 26,700 — 26,700 —
Present value of obligation at31 December . . . . . . . . . . (2,623,000) (845,400) (266,900) (3,735,300) (21,900) (3,757,200) —
Share ofJoint
Total Ventures &P&O UK MNOPF Other Group Associates 2006 2005Scheme Scheme schemes schemes schemes Total TotalUSD’000 USD’000 USD’000 USD’000 USD’000 USD’000 USD’000
Fair value of scheme assetson acquisition . . . . . . . . . 2,231,000 580,900 223,100 3,035,000 14,200 3,049,200 —
Expected return on schemeassets . . . . . . . . . . . . . . . 108,700 31,400 13,800 153,900 900 154,800 —
Contributions by employer . . 40,100 12,800 12,200 65,100 700 65,800 —Contributions by scheme
participants . . . . . . . . . . . 2,400 1,100 3,300 6,800 200 7,000 —Foreign currency exchange . . 285,300 75,200 19,800 380,300 2,000 382,300 —Benefits paid . . . . . . . . . . . . (101,700) (24,600) (21,900) (148,200) (600) (148,800) —
Amounts recognised in thestatement of recognisedincome and expense
Actuarial gain on assets . . . . 12,500 3,500 1,200 17,200 200 17,400 —Transfer to assets/liabilities
classified as held for sale . . — — (18,200) (18,200) — (18,200) —
Fair value of scheme assets at31 December . . . . . . . . . . 2,578,300 680,300 233,300 3,491,900 17,600 3,509,500 —
Defined benefit schemes netliabilities . . . . . . . . . . . . . (44,700) (165,100) (33,600) (243,400) (4,300) (247,700) —
Actual gain on scheme assets . 121,200 34,900 15,000 171,100 1,100 172,200 —
F-95
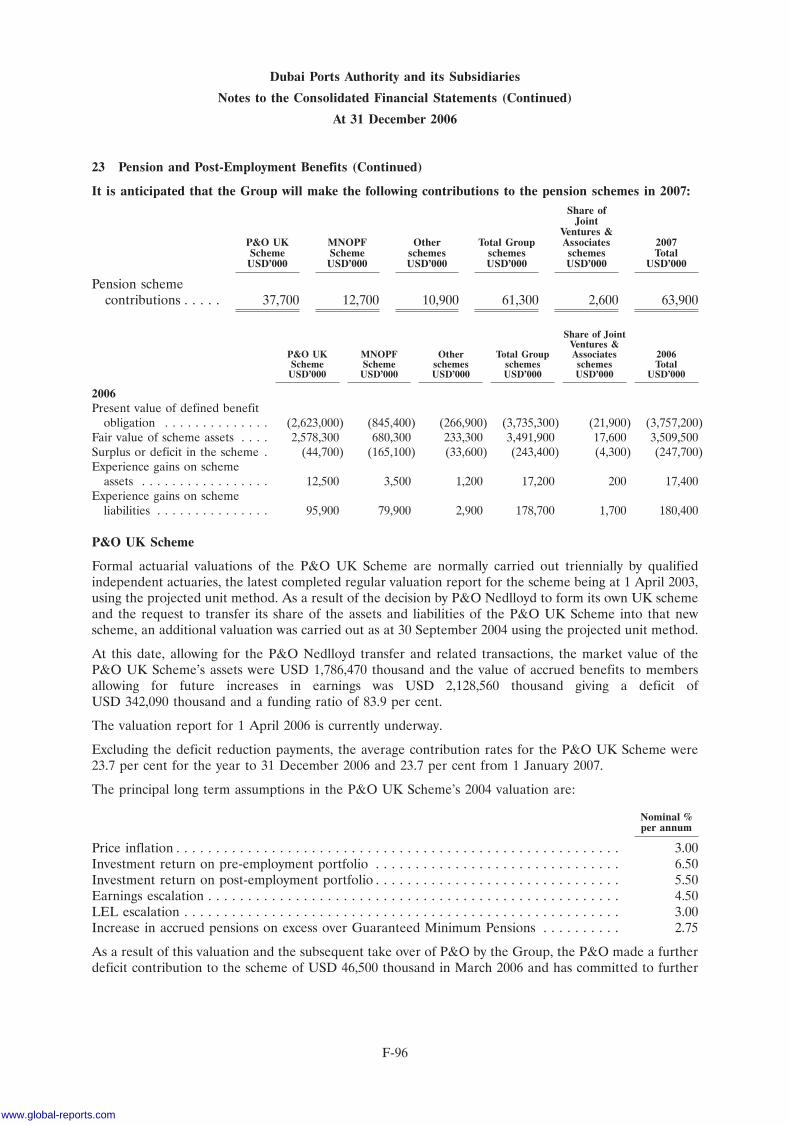
Dubai Ports Authority and its Subsidiaries
Notes to the Consolidated Financial Statements (Continued)
At 31 December 2006
23 Pension and Post-Employment Benefits (Continued)
It is anticipated that the Group will make the following contributions to the pension schemes in 2007:Share of
JointVentures &
P&O UK MNOPF Other Total Group Associates 2007Scheme Scheme schemes schemes schemes TotalUSD’000 USD’000 USD’000 USD’000 USD’000 USD’000
Pension schemecontributions . . . . . 37,700 12,700 10,900 61,300 2,600 63,900
Share of JointVentures &
P&O UK MNOPF Other Total Group Associates 2006Scheme Scheme schemes schemes schemes TotalUSD’000 USD’000 USD’000 USD’000 USD’000 USD’000
2006Present value of defined benefit
obligation . . . . . . . . . . . . . . (2,623,000) (845,400) (266,900) (3,735,300) (21,900) (3,757,200)Fair value of scheme assets . . . . 2,578,300 680,300 233,300 3,491,900 17,600 3,509,500Surplus or deficit in the scheme . (44,700) (165,100) (33,600) (243,400) (4,300) (247,700)Experience gains on scheme
assets . . . . . . . . . . . . . . . . . 12,500 3,500 1,200 17,200 200 17,400Experience gains on scheme
liabilities . . . . . . . . . . . . . . . 95,900 79,900 2,900 178,700 1,700 180,400
P&O UK Scheme
Formal actuarial valuations of the P&O UK Scheme are normally carried out triennially by qualifiedindependent actuaries, the latest completed regular valuation report for the scheme being at 1 April 2003,using the projected unit method. As a result of the decision by P&O Nedlloyd to form its own UK schemeand the request to transfer its share of the assets and liabilities of the P&O UK Scheme into that newscheme, an additional valuation was carried out as at 30 September 2004 using the projected unit method.
At this date, allowing for the P&O Nedlloyd transfer and related transactions, the market value of theP&O UK Scheme’s assets were USD 1,786,470 thousand and the value of accrued benefits to membersallowing for future increases in earnings was USD 2,128,560 thousand giving a deficit ofUSD 342,090 thousand and a funding ratio of 83.9 per cent.
The valuation report for 1 April 2006 is currently underway.
Excluding the deficit reduction payments, the average contribution rates for the P&O UK Scheme were23.7 per cent for the year to 31 December 2006 and 23.7 per cent from 1 January 2007.
The principal long term assumptions in the P&O UK Scheme’s 2004 valuation are:
Nominal %per annum
Price inflation . . . . . . . . . . . . . . . . . . . . . . . . . . . . . . . . . . . . . . . . . . . . . . . . . . . . . . . . 3.00Investment return on pre-employment portfolio . . . . . . . . . . . . . . . . . . . . . . . . . . . . . . . 6.50Investment return on post-employment portfolio . . . . . . . . . . . . . . . . . . . . . . . . . . . . . . . 5.50Earnings escalation . . . . . . . . . . . . . . . . . . . . . . . . . . . . . . . . . . . . . . . . . . . . . . . . . . . . 4.50LEL escalation . . . . . . . . . . . . . . . . . . . . . . . . . . . . . . . . . . . . . . . . . . . . . . . . . . . . . . . 3.00Increase in accrued pensions on excess over Guaranteed Minimum Pensions . . . . . . . . . . 2.75
As a result of this valuation and the subsequent take over of P&O by the Group, the P&O made a furtherdeficit contribution to the scheme of USD 46,500 thousand in March 2006 and has committed to further
F-96
www.global-reports.com
Dubai Ports Authority and its Subsidiaries
Notes to the Consolidated Financial Statements (Continued)
At 31 December 2006
23 Pension and Post-Employment Benefits (Continued)
regular monthly deficit payments totalling USD 139,500 thousand over the next five years. These monthlypayments are supported by bank guarantees.
Merchant Navy Officers’ Pension Fund
The MNOPF Scheme is a defined benefit multi-employer scheme in which officers employed by companieswithin the Group have participated and continue to participate.
The scheme is divided into two sections, the Old Section and the New Section, both of which are closed tonew members and the latest valuation was carried out at 31 March 2003.
The Old Section has been closed to benefit accrual since 1978. The scheme’s independent actuary advisedthat at 31 March 2003 the market value of the scheme’s assets for the Old Section wasUSD 2,080,596 thousand representing approximately 115 per cent of the value of the benefits accrued tomembers. The assets of the Old Section were substantially invested in bonds.
As at 31 March 2003, the date of the most recent formal actuarial valuation, the New Section had assetswith a market value of USD 1,846,608 thousand, representing approximately 86 per cent of the benefitsaccrued to members. The valuation assumptions were as follows:
Nominal %per annum
Discount rate . . . . . . . . . . . . . . . . . . . . . . . . . . . . . . . . . . . . . . . . . . . . . . . . . . . . . . . . 7.80Rate of national average earnings increase . . . . . . . . . . . . . . . . . . . . . . . . . . . . . . . . . . . 4.00Rate of pension increases (where increases apply) . . . . . . . . . . . . . . . . . . . . . . . . . . . . . 2.50
At the date of the valuation, approximately 59 per cent of the New Section’s assets were invested inequities, 28 per cent in bonds and 13 per cent in property and cash.
Following a court decision in 2005, the trustee advised the P&O that its share of the net deficit of the NewSection was 18.319 per cent and issued a schedule of regular deficit payments from P&O companiestotalling USD 10,010 thousand per annum commencing on 30 September 2005 and payable annually on31 March thereafter until 31 March 2014. In addition part of the deficit payments being made byCarnival plc are attributable to the P&O under the terms of the demerger agreement relating to thedemerger of P&O Princes Cruises in 2000, these payments equate to a further 1.096 per cent of the netdeficit. The proportion of the deficit attributable to the P&O will change following the next actuarialvaluation, to be prepared as at 31 March 2006, as not all employers have made their deficit payments, withshortfalls to be reallocated to other employers. The valuation report for the scheme at 31 March 2006 iscurrently underway.
Merchant Navy Ratings’ Pension Fund
The Merchant Navy Ratings’ Pension Fund (the ‘‘MNRPF Scheme’’) is an industry wide multi-employerdefined benefit pension scheme in which sea staff employed by companies within the P&O haveparticipated. The scheme has a significant funding deficit and has been closed to further benefit accrual.
As at 31 March 2005, the date of the most recent full triennial actuarial valuation carried out by anindependent actuary, the scheme had assets with a market value of USD 1,115,100 thousand, representing86 per cent of the benefits accrued to members allowing for future increases. Approximately 68 per cent of
F-97
Dubai Ports Authority and its Subsidiaries
Notes to the Consolidated Financial Statements (Continued)
At 31 December 2006
23 Pension and Post-Employment Benefits (Continued)
the scheme’s assets were invested in bonds, 25 per cent in equities and 7 per cent in property and cash. Thevaluation assumptions were as follows:
Nominal %per annum
Investment return on pre-employment portfolio . . . . . . . . . . . . . . . . . . . . . . . . . . . . . . . 6.50Investment return on post-employment portfolio . . . . . . . . . . . . . . . . . . . . . . . . . . . . . . . 5.00Rate of national average earnings increase . . . . . . . . . . . . . . . . . . . . . . . . . . . . . . . . . . . 4.20Rate of pension increases (where increases apply) . . . . . . . . . . . . . . . . . . . . . . . . . . . . . 2.70
Following this valuation the P&O is yet to receive any adjustments to the previous schedule of payments.The P&O is making current contributions in respect of subsidiaries that are current employers in thescheme and voluntary payments in respect of subsidiaries that have settled the relevant statutory debtobligations and are no longer current employers within the scheme. Current contributions and voluntarypayments by the P&O to the scheme in 2006 totalled USD 10,868 thousand, which included amountspreviously provided for. These payments are included within total defined contribution expense for theP&O.
P&O has appointed an independent actuary to estimate the deficit of the MNRPF Scheme at31 December 2006 using the same assumptions as applied for the IAS 19 valuation of the P&O UKScheme as set out above. Based on the share of current contributions to the scheme by P&O companies,the Group’s share of the estimated deficit could be between USD 11,742 thousand andUSD 15,656 thousand.
The Group cannot identify its share of the underlying assets and liabilities of the MNRPF Scheme on aconsistent and reasonable basis and is therefore accounting for contributions and payments to the MNRPFScheme under IAS 19 as if it were a defined contribution scheme.
Other schemes
Other defined benefit schemes include schemes in Australia, Ireland, Canada, Indonesia, South Africa,Pakistan, North America, Hong Kong and the Philippines.
Other industry schemes are mainly overseas multi-employer schemes, in which the Group is unable toidentify its share of the underlying assets and liabilities on a consistent and reasonable basis. The Group istherefore accounting for contributions to these schemes as if they were defined contribution schemes forIAS 19 purposes.
The Group operates a defined contribution Mandatory Provident Fund retirement benefits scheme (the‘‘MPF Scheme’’) in Hong Kong, under the Mandatory Provident Fund Schemes Ordinance, for thoseemployees who are eligible to participate in the MPF Scheme. Contributions are made based on apercentage of the employees’ basic salaries and are charged to the consolidated statement income as theybecome payable in accordance with the rules of the MPF Scheme. The assets of the MPF Scheme are heldseparately from those of the Group in an independently administered fund. The Group’s employercontributions vest fully with the employees when contributed into the MPF Scheme.
The Group also operates a defined contribution retirement benefits scheme (the ‘‘ORSO Scheme’’) inHong Kong for those employees who are eligible to participate in this scheme. The ORSO Schemeoperates in a similar way to the MPF Scheme, except that when an employee leaves the ORSO Schemebefore his/her interest in the Group’s employer contributions vesting fully, the ongoing contributionspayable by the Group are reduced by the relevant amount of the forfeited employer contributions.
The Group operates one defined benefit pension plan in Australia through the Stevedoring Employees’Retirement Fund (SERF), which requires contributions to be made to a separately administered fund. Thisfund is a multi-employer superannuation plan, and as such, there is no reliable basis for allocating benefits,assets and costs between employers. The Group has therefore adopted multi employer provisions when
F-98
www.global-reports.com
Dubai Ports Authority and its Subsidiaries
Notes to the Consolidated Financial Statements (Continued)
At 31 December 2006
23 Pension and Post-Employment Benefits (Continued)
reporting under IFRS. Those provisions allow the employers to report as if the fund was a definedcontribution fund.
SERF is a superannuation fund which, in addition to providing defined contribution benefits to somecategories of members, provides other members with defined benefits. There is no basis that could be usedto definitively apportion the benefits, assets and costs associated with the fund, between the various fullparticipating employers.
A total surplus of Australian Dollars 126.4 million was determined in SERF as at 30 June 2004, using a netof tax discount rate of 5.04% p.a. and an assumed future salary escalation rate of 3.5% p.a. Otherassumptions relating to decrements are as set out in the report on the most recent actuarial valuation ofSERF.
From time to time, surpluses arise in SERF, which allow a reduction in the rate of contributions theemployers pay. Typically, any surplus is shared between members and employees, on a basis agreed by thetrustee, from time to time. The trust deed and rules of SERF limit the amount of contributions payable byan employer in respect of defined benefits. Hence, if there were a deficit, it is expected that the employerswould not be required to pay any more contributions at 12.6%.
A contractual agreement exists between the Group and SERF as to how part of surplus in the employers’fund can be used and, accordingly, the Group has recognised the asset attributable to them.
24 Segment Information
Following the acquisition of P&O during 2006 (note 1), the primary segment reporting format was changedto business segments as the Group’s risks and rates of return are now affected predominantly by differentbusiness segments in which the Group operates. Secondary information is reported geographically. During2005, the Group had only one major business segment; being port operations and for reporting purposes itused to segment those operations by geographical locations. However, with the acquisition of P&O, 2005comparatives have been changed in accordance with 2006 presentation. The operating businesses areorganised and managed separately according to the nature of the services provided, with each segmentrepresenting a strategic business unit that offers different services and also serves a different market.
Segment revenue, segment expense and segment result include transfers between business segments.Those transfers are eliminated in consolidation.
The Group’s geographical segments are based on the location of the Group’s assets. Sales to externalcustomers disclosed in geographical segments are based on the geographical location of its customers.
F-99
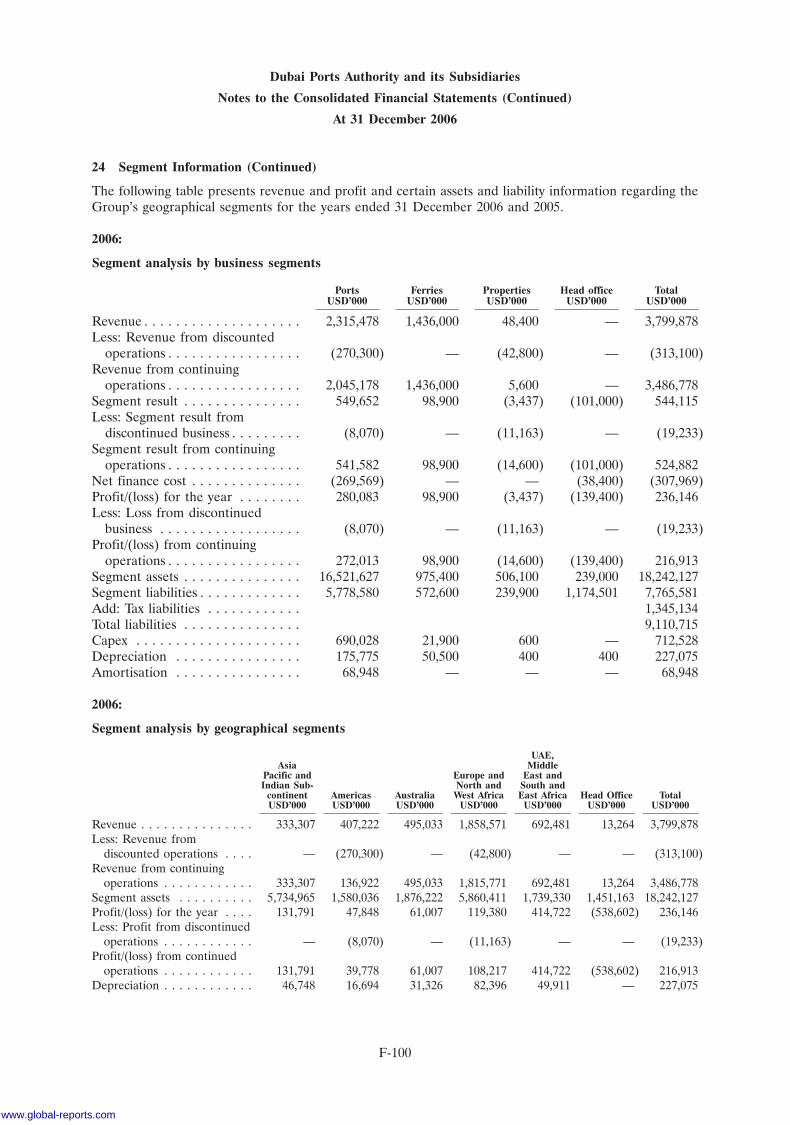
Dubai Ports Authority and its Subsidiaries
Notes to the Consolidated Financial Statements (Continued)
At 31 December 2006
24 Segment Information (Continued)
The following table presents revenue and profit and certain assets and liability information regarding theGroup’s geographical segments for the years ended 31 December 2006 and 2005.
2006:
Segment analysis by business segments
Ports Ferries Properties Head office TotalUSD’000 USD’000 USD’000 USD’000 USD’000
Revenue . . . . . . . . . . . . . . . . . . . . 2,315,478 1,436,000 48,400 — 3,799,878Less: Revenue from discounted
operations . . . . . . . . . . . . . . . . . (270,300) — (42,800) — (313,100)Revenue from continuing
operations . . . . . . . . . . . . . . . . . 2,045,178 1,436,000 5,600 — 3,486,778Segment result . . . . . . . . . . . . . . . 549,652 98,900 (3,437) (101,000) 544,115Less: Segment result from
discontinued business . . . . . . . . . (8,070) — (11,163) — (19,233)Segment result from continuing
operations . . . . . . . . . . . . . . . . . 541,582 98,900 (14,600) (101,000) 524,882Net finance cost . . . . . . . . . . . . . . (269,569) — — (38,400) (307,969)Profit/(loss) for the year . . . . . . . . 280,083 98,900 (3,437) (139,400) 236,146Less: Loss from discontinued
business . . . . . . . . . . . . . . . . . . (8,070) — (11,163) — (19,233)Profit/(loss) from continuing
operations . . . . . . . . . . . . . . . . . 272,013 98,900 (14,600) (139,400) 216,913Segment assets . . . . . . . . . . . . . . . 16,521,627 975,400 506,100 239,000 18,242,127Segment liabilities . . . . . . . . . . . . . 5,778,580 572,600 239,900 1,174,501 7,765,581Add: Tax liabilities . . . . . . . . . . . . 1,345,134Total liabilities . . . . . . . . . . . . . . . 9,110,715Capex . . . . . . . . . . . . . . . . . . . . . 690,028 21,900 600 — 712,528Depreciation . . . . . . . . . . . . . . . . 175,775 50,500 400 400 227,075Amortisation . . . . . . . . . . . . . . . . 68,948 — — — 68,948
2006:
Segment analysis by geographical segments
UAE,Asia Middle
Pacific and Europe and East andIndian Sub- North and South and
continent Americas Australia West Africa East Africa Head Office TotalUSD’000 USD’000 USD’000 USD’000 USD’000 USD’000 USD’000
Revenue . . . . . . . . . . . . . . . 333,307 407,222 495,033 1,858,571 692,481 13,264 3,799,878Less: Revenue from
discounted operations . . . . — (270,300) — (42,800) — — (313,100)Revenue from continuing
operations . . . . . . . . . . . . 333,307 136,922 495,033 1,815,771 692,481 13,264 3,486,778Segment assets . . . . . . . . . . 5,734,965 1,580,036 1,876,222 5,860,411 1,739,330 1,451,163 18,242,127Profit/(loss) for the year . . . . 131,791 47,848 61,007 119,380 414,722 (538,602) 236,146Less: Profit from discontinued
operations . . . . . . . . . . . . — (8,070) — (11,163) — — (19,233)Profit/(loss) from continued
operations . . . . . . . . . . . . 131,791 39,778 61,007 108,217 414,722 (538,602) 216,913Depreciation . . . . . . . . . . . . 46,748 16,694 31,326 82,396 49,911 — 227,075
F-100
www.global-reports.com
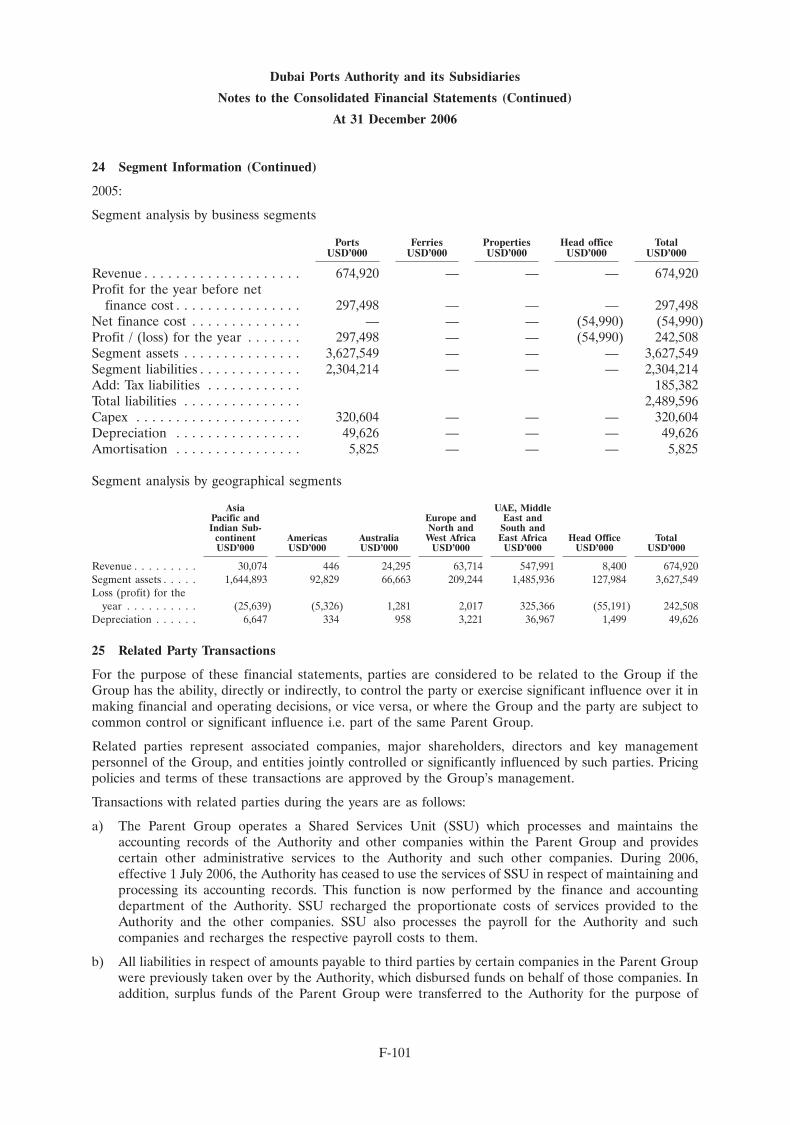
Dubai Ports Authority and its Subsidiaries
Notes to the Consolidated Financial Statements (Continued)
At 31 December 2006
24 Segment Information (Continued)
2005:
Segment analysis by business segments
Ports Ferries Properties Head office TotalUSD’000 USD’000 USD’000 USD’000 USD’000
Revenue . . . . . . . . . . . . . . . . . . . . 674,920 — — — 674,920Profit for the year before net
finance cost . . . . . . . . . . . . . . . . 297,498 — — — 297,498Net finance cost . . . . . . . . . . . . . . — — — (54,990) (54,990)Profit / (loss) for the year . . . . . . . 297,498 — — (54,990) 242,508Segment assets . . . . . . . . . . . . . . . 3,627,549 — — — 3,627,549Segment liabilities . . . . . . . . . . . . . 2,304,214 — — — 2,304,214Add: Tax liabilities . . . . . . . . . . . . 185,382Total liabilities . . . . . . . . . . . . . . . 2,489,596Capex . . . . . . . . . . . . . . . . . . . . . 320,604 — — — 320,604Depreciation . . . . . . . . . . . . . . . . 49,626 — — — 49,626Amortisation . . . . . . . . . . . . . . . . 5,825 — — — 5,825
Segment analysis by geographical segments
Asia UAE, MiddlePacific and Europe and East andIndian Sub- North and South and
continent Americas Australia West Africa East Africa Head Office TotalUSD’000 USD’000 USD’000 USD’000 USD’000 USD’000 USD’000
Revenue . . . . . . . . . 30,074 446 24,295 63,714 547,991 8,400 674,920Segment assets . . . . . 1,644,893 92,829 66,663 209,244 1,485,936 127,984 3,627,549Loss (profit) for the
year . . . . . . . . . . (25,639) (5,326) 1,281 2,017 325,366 (55,191) 242,508Depreciation . . . . . . 6,647 334 958 3,221 36,967 1,499 49,626
25 Related Party Transactions
For the purpose of these financial statements, parties are considered to be related to the Group if theGroup has the ability, directly or indirectly, to control the party or exercise significant influence over it inmaking financial and operating decisions, or vice versa, or where the Group and the party are subject tocommon control or significant influence i.e. part of the same Parent Group.
Related parties represent associated companies, major shareholders, directors and key managementpersonnel of the Group, and entities jointly controlled or significantly influenced by such parties. Pricingpolicies and terms of these transactions are approved by the Group’s management.
Transactions with related parties during the years are as follows:
a) The Parent Group operates a Shared Services Unit (SSU) which processes and maintains theaccounting records of the Authority and other companies within the Parent Group and providescertain other administrative services to the Authority and such other companies. During 2006,effective 1 July 2006, the Authority has ceased to use the services of SSU in respect of maintaining andprocessing its accounting records. This function is now performed by the finance and accountingdepartment of the Authority. SSU recharged the proportionate costs of services provided to theAuthority and the other companies. SSU also processes the payroll for the Authority and suchcompanies and recharges the respective payroll costs to them.
b) All liabilities in respect of amounts payable to third parties by certain companies in the Parent Groupwere previously taken over by the Authority, which disbursed funds on behalf of those companies. Inaddition, surplus funds of the Parent Group were transferred to the Authority for the purpose of
F-101
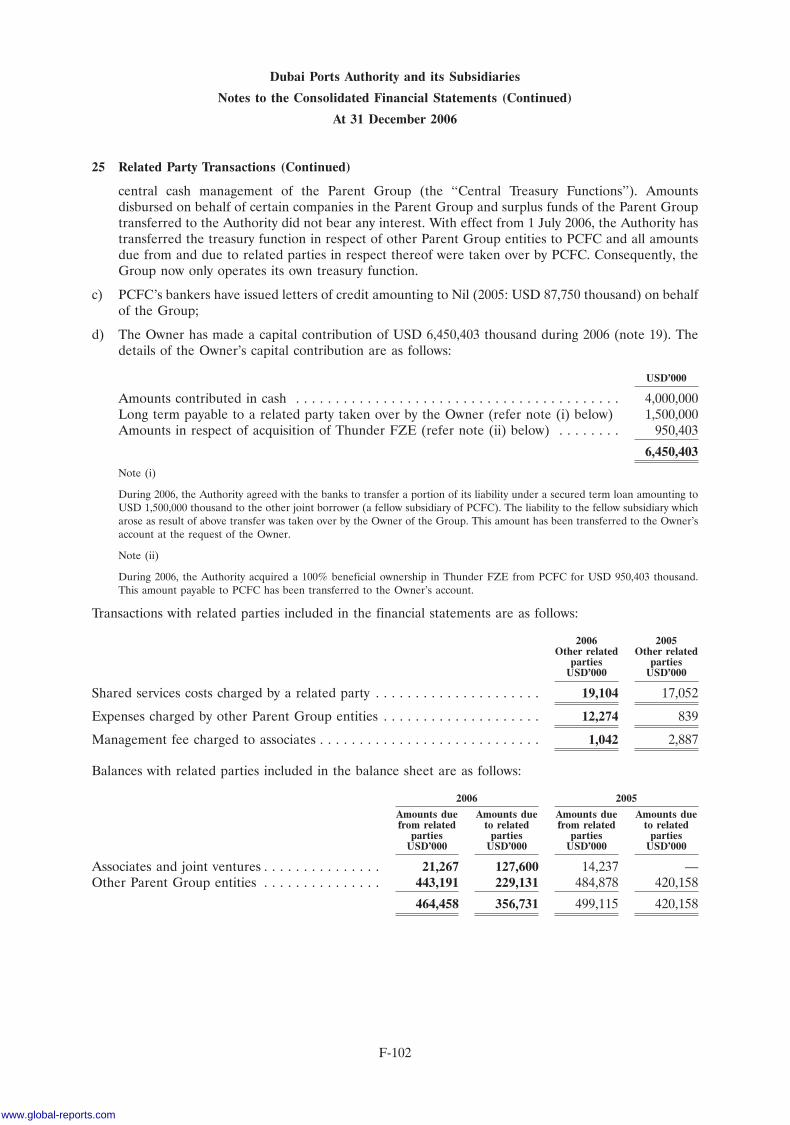
Dubai Ports Authority and its Subsidiaries
Notes to the Consolidated Financial Statements (Continued)
At 31 December 2006
25 Related Party Transactions (Continued)
central cash management of the Parent Group (the ‘‘Central Treasury Functions’’). Amountsdisbursed on behalf of certain companies in the Parent Group and surplus funds of the Parent Grouptransferred to the Authority did not bear any interest. With effect from 1 July 2006, the Authority hastransferred the treasury function in respect of other Parent Group entities to PCFC and all amountsdue from and due to related parties in respect thereof were taken over by PCFC. Consequently, theGroup now only operates its own treasury function.
c) PCFC’s bankers have issued letters of credit amounting to Nil (2005: USD 87,750 thousand) on behalfof the Group;
d) The Owner has made a capital contribution of USD 6,450,403 thousand during 2006 (note 19). Thedetails of the Owner’s capital contribution are as follows:
USD’000
Amounts contributed in cash . . . . . . . . . . . . . . . . . . . . . . . . . . . . . . . . . . . . . . . . . 4,000,000Long term payable to a related party taken over by the Owner (refer note (i) below) 1,500,000Amounts in respect of acquisition of Thunder FZE (refer note (ii) below) . . . . . . . . 950,403
6,450,403
Note (i)
During 2006, the Authority agreed with the banks to transfer a portion of its liability under a secured term loan amounting toUSD 1,500,000 thousand to the other joint borrower (a fellow subsidiary of PCFC). The liability to the fellow subsidiary whicharose as result of above transfer was taken over by the Owner of the Group. This amount has been transferred to the Owner’saccount at the request of the Owner.
Note (ii)
During 2006, the Authority acquired a 100% beneficial ownership in Thunder FZE from PCFC for USD 950,403 thousand.This amount payable to PCFC has been transferred to the Owner’s account.
Transactions with related parties included in the financial statements are as follows:
2006 2005Other related Other related
parties partiesUSD’000 USD’000
Shared services costs charged by a related party . . . . . . . . . . . . . . . . . . . . . 19,104 17,052
Expenses charged by other Parent Group entities . . . . . . . . . . . . . . . . . . . . 12,274 839
Management fee charged to associates . . . . . . . . . . . . . . . . . . . . . . . . . . . . 1,042 2,887
Balances with related parties included in the balance sheet are as follows:
2006 2005
Amounts due Amounts due Amounts due Amounts duefrom related to related from related to related
parties parties parties partiesUSD’000 USD’000 USD’000 USD’000
Associates and joint ventures . . . . . . . . . . . . . . . 21,267 127,600 14,237 —Other Parent Group entities . . . . . . . . . . . . . . . 443,191 229,131 484,878 420,158
464,458 356,731 499,115 420,158
F-102
www.global-reports.com
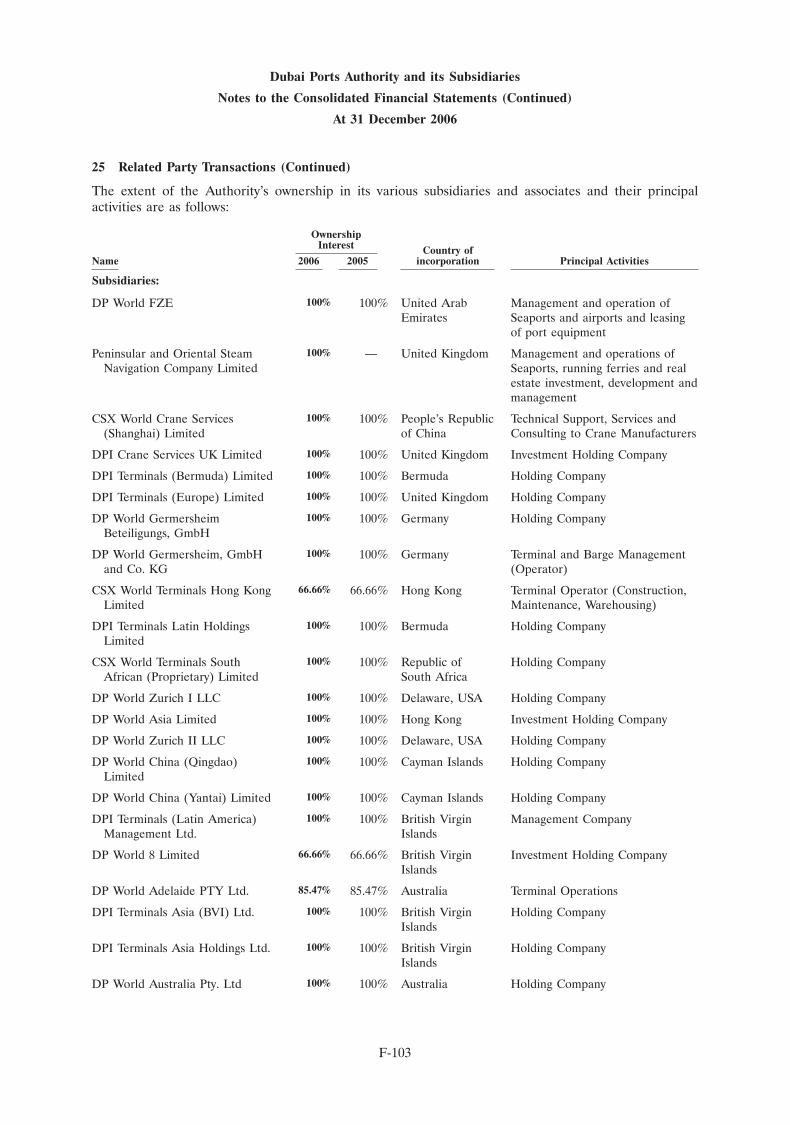
Dubai Ports Authority and its Subsidiaries
Notes to the Consolidated Financial Statements (Continued)
At 31 December 2006
25 Related Party Transactions (Continued)
The extent of the Authority’s ownership in its various subsidiaries and associates and their principalactivities are as follows:
OwnershipInterest Country of
Name 2006 2005 incorporation Principal Activities
Subsidiaries:
100%DP World FZE 100% United Arab Management and operation ofEmirates Seaports and airports and leasing
of port equipment
100%Peninsular and Oriental Steam — United Kingdom Management and operations ofNavigation Company Limited Seaports, running ferries and real
estate investment, development andmanagement
100%CSX World Crane Services 100% People’s Republic Technical Support, Services and(Shanghai) Limited of China Consulting to Crane Manufacturers
100%DPI Crane Services UK Limited 100% United Kingdom Investment Holding Company
100%DPI Terminals (Bermuda) Limited 100% Bermuda Holding Company
100%DPI Terminals (Europe) Limited 100% United Kingdom Holding Company
100%DP World Germersheim 100% Germany Holding CompanyBeteiligungs, GmbH
100%DP World Germersheim, GmbH 100% Germany Terminal and Barge Managementand Co. KG (Operator)
66.66%CSX World Terminals Hong Kong 66.66% Hong Kong Terminal Operator (Construction,Limited Maintenance, Warehousing)
100%DPI Terminals Latin Holdings 100% Bermuda Holding CompanyLimited
100%CSX World Terminals South 100% Republic of Holding CompanyAfrican (Proprietary) Limited South Africa
100%DP World Zurich I LLC 100% Delaware, USA Holding Company
100%DP World Asia Limited 100% Hong Kong Investment Holding Company
100%DP World Zurich II LLC 100% Delaware, USA Holding Company
100%DP World China (Qingdao) 100% Cayman Islands Holding CompanyLimited
100%DP World China (Yantai) Limited 100% Cayman Islands Holding Company
100%DPI Terminals (Latin America) 100% British Virgin Management CompanyManagement Ltd. Islands
66.66%DP World 8 Limited 66.66% British Virgin Investment Holding CompanyIslands
85.47%DP World Adelaide PTY Ltd. 85.47% Australia Terminal Operations
100%DPI Terminals Asia (BVI) Ltd. 100% British Virgin Holding CompanyIslands
100%DPI Terminals Asia Holdings Ltd. 100% British Virgin Holding CompanyIslands
100%DP World Australia Pty. Ltd 100% Australia Holding Company
F-103
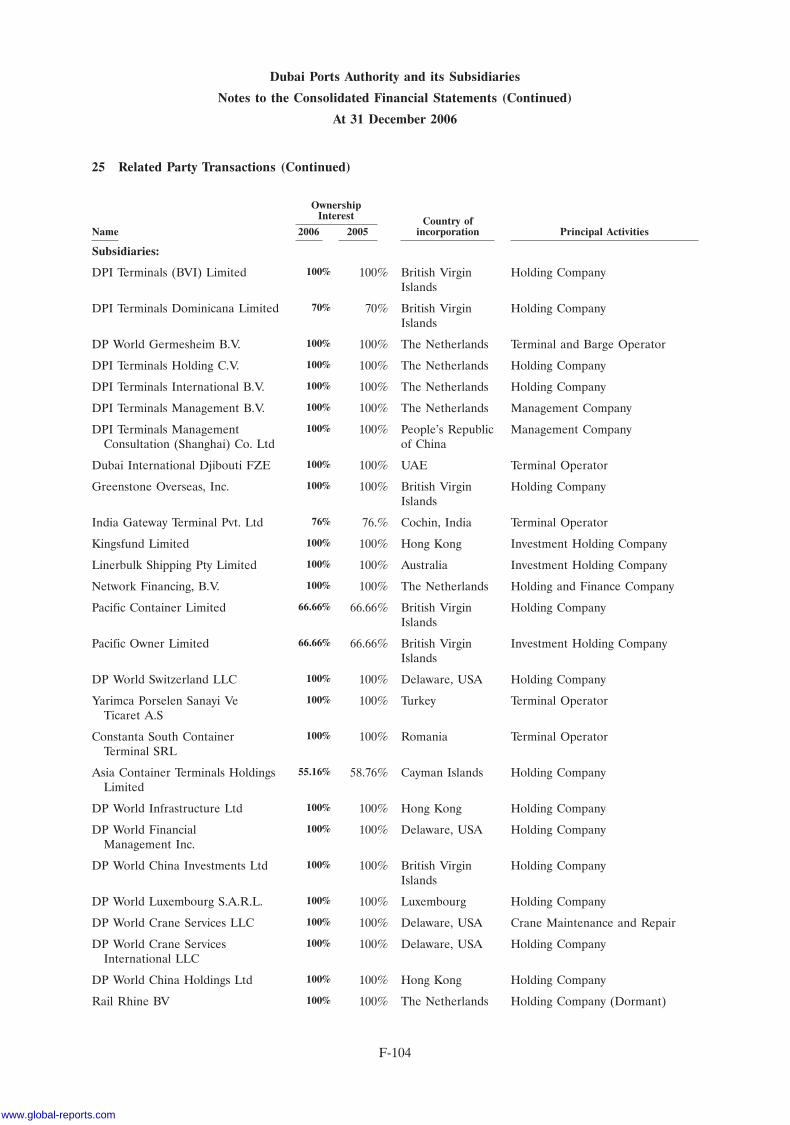
Dubai Ports Authority and its Subsidiaries
Notes to the Consolidated Financial Statements (Continued)
At 31 December 2006
25 Related Party Transactions (Continued)
OwnershipInterest Country of
Name 2006 2005 incorporation Principal Activities
Subsidiaries:
100%DPI Terminals (BVI) Limited 100% British Virgin Holding CompanyIslands
70%DPI Terminals Dominicana Limited 70% British Virgin Holding CompanyIslands
100%DP World Germesheim B.V. 100% The Netherlands Terminal and Barge Operator
100%DPI Terminals Holding C.V. 100% The Netherlands Holding Company
100%DPI Terminals International B.V. 100% The Netherlands Holding Company
100%DPI Terminals Management B.V. 100% The Netherlands Management Company
100%DPI Terminals Management 100% People’s Republic Management CompanyConsultation (Shanghai) Co. Ltd of China
100%Dubai International Djibouti FZE 100% UAE Terminal Operator
100%Greenstone Overseas, Inc. 100% British Virgin Holding CompanyIslands
76%India Gateway Terminal Pvt. Ltd 76.% Cochin, India Terminal Operator
100%Kingsfund Limited 100% Hong Kong Investment Holding Company
100%Linerbulk Shipping Pty Limited 100% Australia Investment Holding Company
100%Network Financing, B.V. 100% The Netherlands Holding and Finance Company
66.66%Pacific Container Limited 66.66% British Virgin Holding CompanyIslands
66.66%Pacific Owner Limited 66.66% British Virgin Investment Holding CompanyIslands
100%DP World Switzerland LLC 100% Delaware, USA Holding Company
100%Yarimca Porselen Sanayi Ve 100% Turkey Terminal OperatorTicaret A.S
100%Constanta South Container 100% Romania Terminal OperatorTerminal SRL
55.16%Asia Container Terminals Holdings 58.76% Cayman Islands Holding CompanyLimited
100%DP World Infrastructure Ltd 100% Hong Kong Holding Company
100%DP World Financial 100% Delaware, USA Holding CompanyManagement Inc.
100%DP World China Investments Ltd 100% British Virgin Holding CompanyIslands
100%DP World Luxembourg S.A.R.L. 100% Luxembourg Holding Company
100%DP World Crane Services LLC 100% Delaware, USA Crane Maintenance and Repair
100%DP World Crane Services 100% Delaware, USA Holding CompanyInternational LLC
100%DP World China Holdings Ltd 100% Hong Kong Holding Company
100%Rail Rhine BV 100% The Netherlands Holding Company (Dormant)
F-104
www.global-reports.com
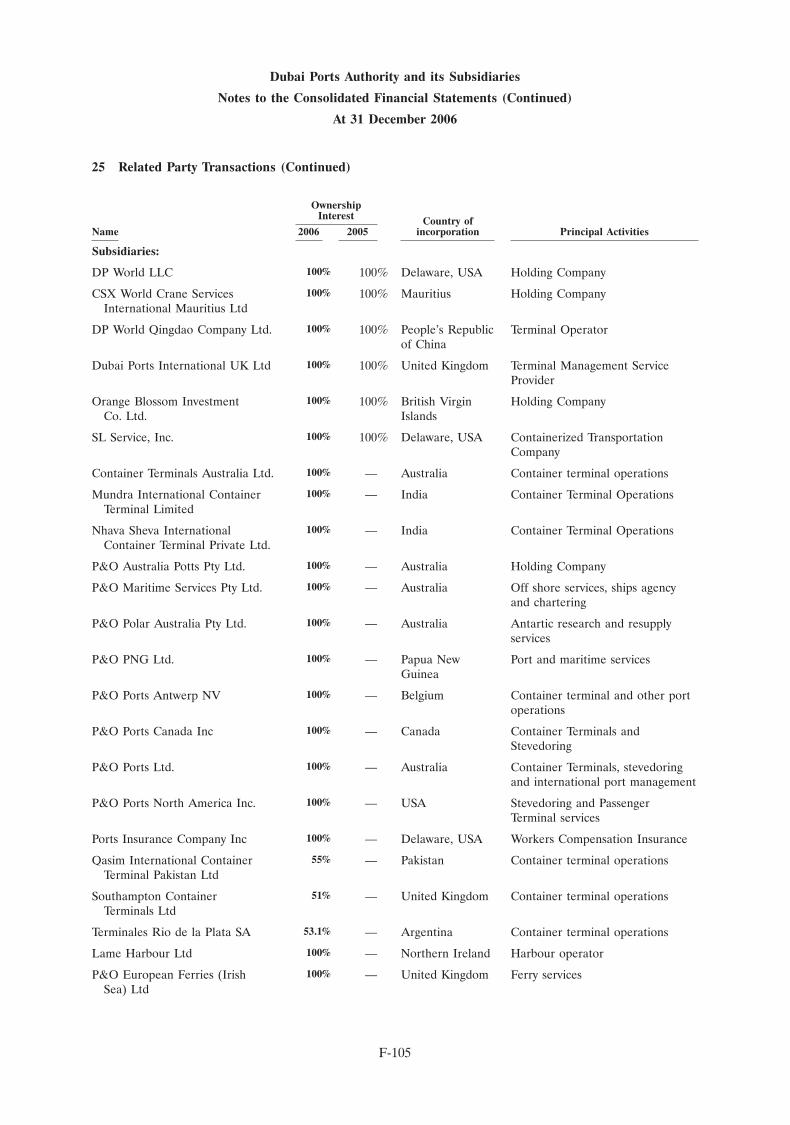
Dubai Ports Authority and its Subsidiaries
Notes to the Consolidated Financial Statements (Continued)
At 31 December 2006
25 Related Party Transactions (Continued)
OwnershipInterest Country of
Name 2006 2005 incorporation Principal Activities
Subsidiaries:
100%DP World LLC 100% Delaware, USA Holding Company
100%CSX World Crane Services 100% Mauritius Holding CompanyInternational Mauritius Ltd
100%DP World Qingdao Company Ltd. 100% People’s Republic Terminal Operatorof China
100%Dubai Ports International UK Ltd 100% United Kingdom Terminal Management ServiceProvider
100%Orange Blossom Investment 100% British Virgin Holding CompanyCo. Ltd. Islands
100%SL Service, Inc. 100% Delaware, USA Containerized TransportationCompany
100%Container Terminals Australia Ltd. — Australia Container terminal operations
100%Mundra International Container — India Container Terminal OperationsTerminal Limited
100%Nhava Sheva International — India Container Terminal OperationsContainer Terminal Private Ltd.
100%P&O Australia Potts Pty Ltd. — Australia Holding Company
100%P&O Maritime Services Pty Ltd. — Australia Off shore services, ships agencyand chartering
100%P&O Polar Australia Pty Ltd. — Australia Antartic research and resupplyservices
100%P&O PNG Ltd. — Papua New Port and maritime servicesGuinea
100%P&O Ports Antwerp NV — Belgium Container terminal and other portoperations
100%P&O Ports Canada Inc — Canada Container Terminals andStevedoring
100%P&O Ports Ltd. — Australia Container Terminals, stevedoringand international port management
100%P&O Ports North America Inc. — USA Stevedoring and PassengerTerminal services
100%Ports Insurance Company Inc — Delaware, USA Workers Compensation Insurance
55%Qasim International Container — Pakistan Container terminal operationsTerminal Pakistan Ltd
51%Southampton Container — United Kingdom Container terminal operationsTerminals Ltd
53.1%Terminales Rio de la Plata SA — Argentina Container terminal operations
100%Lame Harbour Ltd — Northern Ireland Harbour operator
100%P&O European Ferries (Irish — United Kingdom Ferry servicesSea) Ltd
F-105
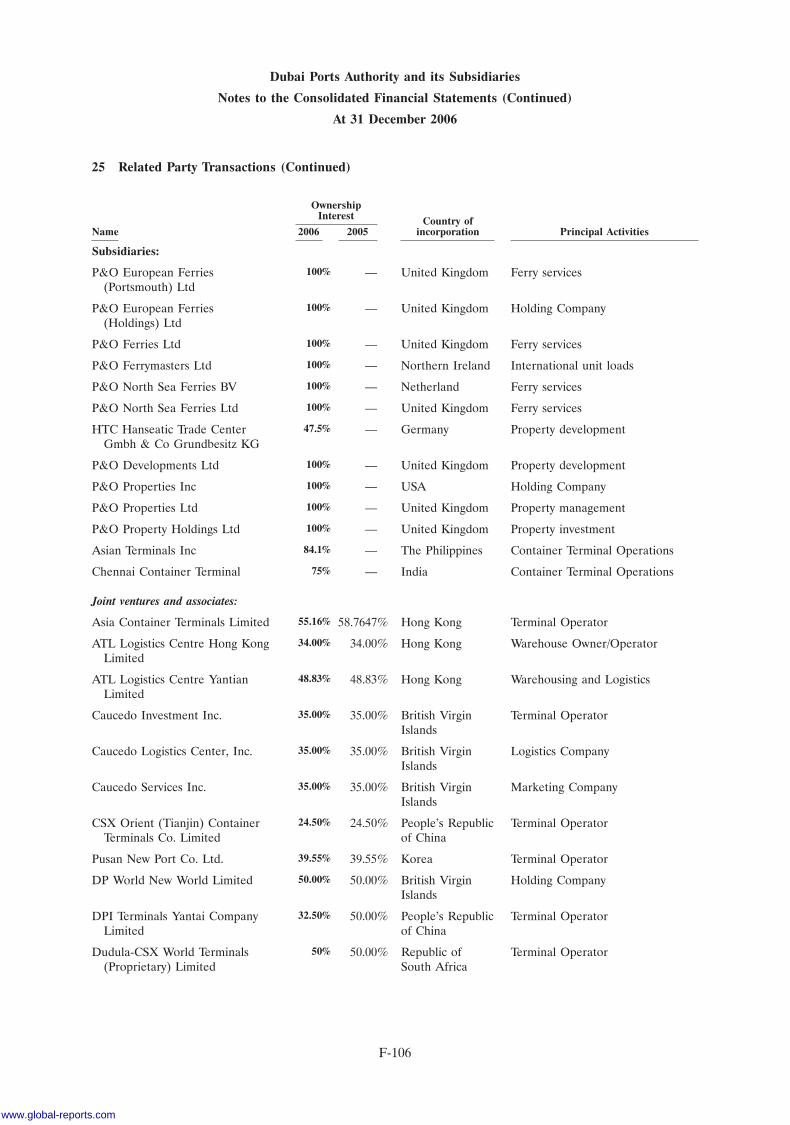
Dubai Ports Authority and its Subsidiaries
Notes to the Consolidated Financial Statements (Continued)
At 31 December 2006
25 Related Party Transactions (Continued)
OwnershipInterest Country of
Name 2006 2005 incorporation Principal Activities
Subsidiaries:
100%P&O European Ferries — United Kingdom Ferry services(Portsmouth) Ltd
100%P&O European Ferries — United Kingdom Holding Company(Holdings) Ltd
100%P&O Ferries Ltd — United Kingdom Ferry services
100%P&O Ferrymasters Ltd — Northern Ireland International unit loads
100%P&O North Sea Ferries BV — Netherland Ferry services
100%P&O North Sea Ferries Ltd — United Kingdom Ferry services
47.5%HTC Hanseatic Trade Center — Germany Property developmentGmbh & Co Grundbesitz KG
100%P&O Developments Ltd — United Kingdom Property development
100%P&O Properties Inc — USA Holding Company
100%P&O Properties Ltd — United Kingdom Property management
100%P&O Property Holdings Ltd — United Kingdom Property investment
84.1%Asian Terminals Inc — The Philippines Container Terminal Operations
75%Chennai Container Terminal — India Container Terminal Operations
Joint ventures and associates:
55.16%Asia Container Terminals Limited 58.7647% Hong Kong Terminal Operator
34.00%ATL Logistics Centre Hong Kong 34.00% Hong Kong Warehouse Owner/OperatorLimited
48.83%ATL Logistics Centre Yantian 48.83% Hong Kong Warehousing and LogisticsLimited
35.00%Caucedo Investment Inc. 35.00% British Virgin Terminal OperatorIslands
35.00%Caucedo Logistics Center, Inc. 35.00% British Virgin Logistics CompanyIslands
35.00%Caucedo Services Inc. 35.00% British Virgin Marketing CompanyIslands
24.50%CSX Orient (Tianjin) Container 24.50% People’s Republic Terminal OperatorTerminals Co. Limited of China
39.55%Pusan New Port Co. Ltd. 39.55% Korea Terminal Operator
50.00%DP World New World Limited 50.00% British Virgin Holding CompanyIslands
32.50%DPI Terminals Yantai Company 50.00% People’s Republic Terminal OperatorLimited of China
50%Dudula-CSX World Terminals 50.00% Republic of Terminal Operator(Proprietary) Limited South Africa
F-106
www.global-reports.com
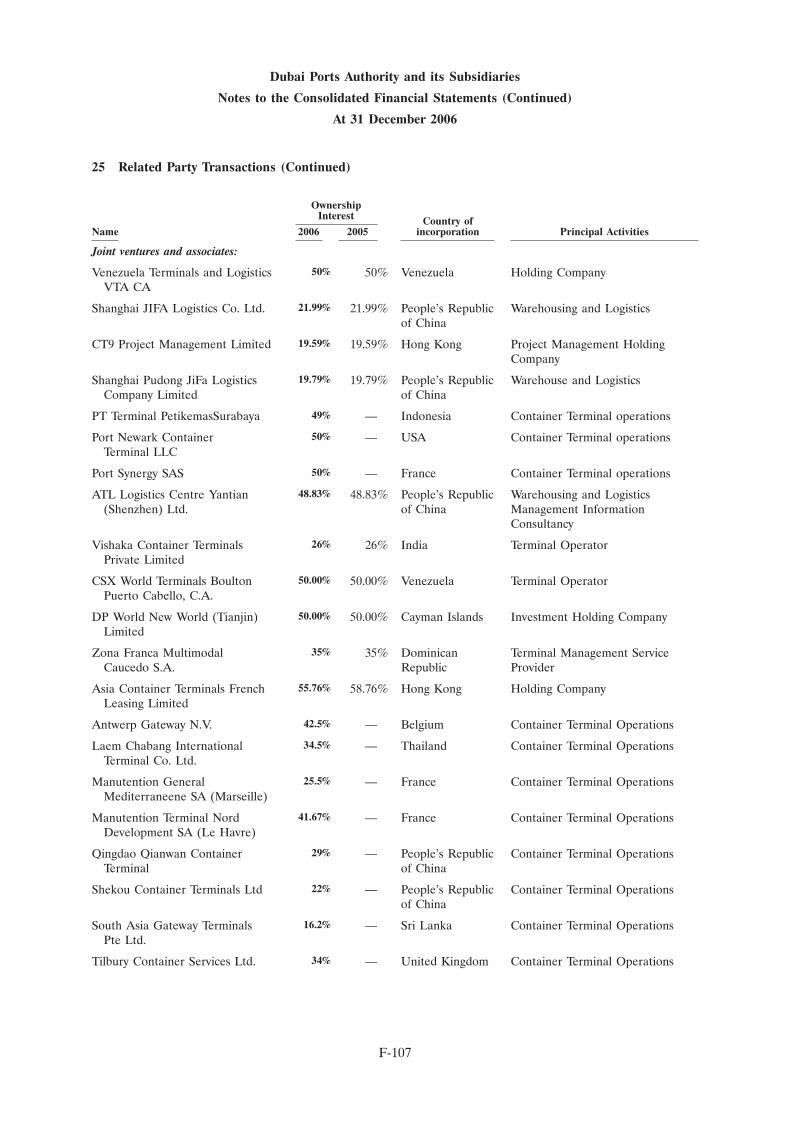
Dubai Ports Authority and its Subsidiaries
Notes to the Consolidated Financial Statements (Continued)
At 31 December 2006
25 Related Party Transactions (Continued)
OwnershipInterest Country of
Name 2006 2005 incorporation Principal Activities
Joint ventures and associates:
50%Venezuela Terminals and Logistics 50% Venezuela Holding CompanyVTA CA
21.99%Shanghai JIFA Logistics Co. Ltd. 21.99% People’s Republic Warehousing and Logisticsof China
19.59%CT9 Project Management Limited 19.59% Hong Kong Project Management HoldingCompany
19.79%Shanghai Pudong JiFa Logistics 19.79% People’s Republic Warehouse and LogisticsCompany Limited of China
49%PT Terminal PetikemasSurabaya — Indonesia Container Terminal operations
50%Port Newark Container — USA Container Terminal operationsTerminal LLC
50%Port Synergy SAS — France Container Terminal operations
48.83%ATL Logistics Centre Yantian 48.83% People’s Republic Warehousing and Logistics(Shenzhen) Ltd. of China Management Information
Consultancy
26%Vishaka Container Terminals 26% India Terminal OperatorPrivate Limited
50.00%CSX World Terminals Boulton 50.00% Venezuela Terminal OperatorPuerto Cabello, C.A.
50.00%DP World New World (Tianjin) 50.00% Cayman Islands Investment Holding CompanyLimited
35%Zona Franca Multimodal 35% Dominican Terminal Management ServiceCaucedo S.A. Republic Provider
55.76%Asia Container Terminals French 58.76% Hong Kong Holding CompanyLeasing Limited
42.5%Antwerp Gateway N.V. — Belgium Container Terminal Operations
34.5%Laem Chabang International — Thailand Container Terminal OperationsTerminal Co. Ltd.
25.5%Manutention General — France Container Terminal OperationsMediterraneene SA (Marseille)
41.67%Manutention Terminal Nord — France Container Terminal OperationsDevelopment SA (Le Havre)
29%Qingdao Qianwan Container — People’s Republic Container Terminal OperationsTerminal of China
22%Shekou Container Terminals Ltd — People’s Republic Container Terminal Operationsof China
16.2%South Asia Gateway Terminals — Sri Lanka Container Terminal OperationsPte Ltd.
34%Tilbury Container Services Ltd. — United Kingdom Container Terminal Operations
F-107
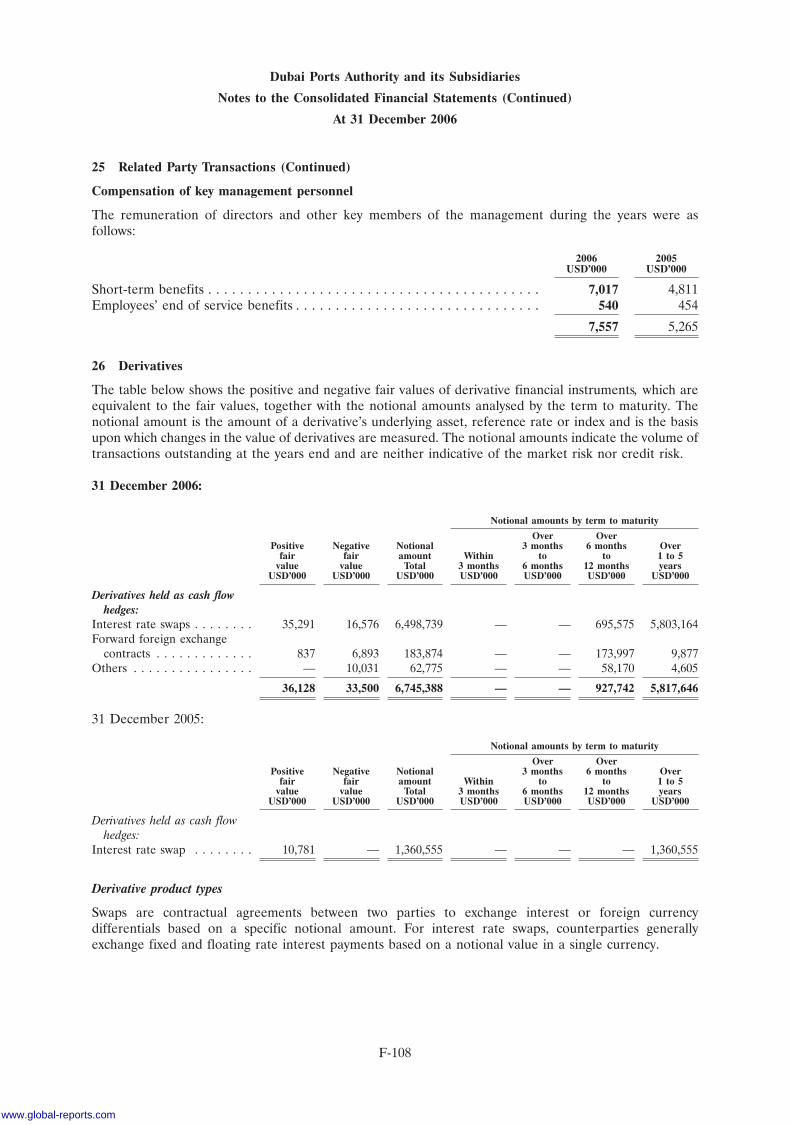
Dubai Ports Authority and its Subsidiaries
Notes to the Consolidated Financial Statements (Continued)
At 31 December 2006
25 Related Party Transactions (Continued)
Compensation of key management personnel
The remuneration of directors and other key members of the management during the years were asfollows:
2006 2005USD’000 USD’000
Short-term benefits . . . . . . . . . . . . . . . . . . . . . . . . . . . . . . . . . . . . . . . . . . 7,017 4,811Employees’ end of service benefits . . . . . . . . . . . . . . . . . . . . . . . . . . . . . . . 540 454
7,557 5,265
26 Derivatives
The table below shows the positive and negative fair values of derivative financial instruments, which areequivalent to the fair values, together with the notional amounts analysed by the term to maturity. Thenotional amount is the amount of a derivative’s underlying asset, reference rate or index and is the basisupon which changes in the value of derivatives are measured. The notional amounts indicate the volume oftransactions outstanding at the years end and are neither indicative of the market risk nor credit risk.
31 December 2006:
Notional amounts by term to maturity
Over OverPositive Negative Notional 3 months 6 months Over
fair fair amount Within to to 1 to 5value value Total 3 months 6 months 12 months years
USD’000 USD’000 USD’000 USD’000 USD’000 USD’000 USD’000
Derivatives held as cash flowhedges:
Interest rate swaps . . . . . . . . 35,291 16,576 6,498,739 — — 695,575 5,803,164Forward foreign exchange
contracts . . . . . . . . . . . . . 837 6,893 183,874 — — 173,997 9,877Others . . . . . . . . . . . . . . . . — 10,031 62,775 — — 58,170 4,605
36,128 33,500 6,745,388 — — 927,742 5,817,646
31 December 2005:
Notional amounts by term to maturity
Over OverPositive Negative Notional 3 months 6 months Over
fair fair amount Within to to 1 to 5value value Total 3 months 6 months 12 months years
USD’000 USD’000 USD’000 USD’000 USD’000 USD’000 USD’000
Derivatives held as cash flowhedges:
Interest rate swap . . . . . . . . 10,781 — 1,360,555 — — — 1,360,555
Derivative product types
Swaps are contractual agreements between two parties to exchange interest or foreign currencydifferentials based on a specific notional amount. For interest rate swaps, counterparties generallyexchange fixed and floating rate interest payments based on a notional value in a single currency.
F-108
www.global-reports.com
Dubai Ports Authority and its Subsidiaries
Notes to the Consolidated Financial Statements (Continued)
At 31 December 2006
26 Derivatives (Continued)
Forwards are contractual agreements to either buy or sell a specified currency, commodity or financialinstrument at a specific price and date in future. Forwards are customised contracts transacted in theover-the-counter market.
Others mainly includes commodity futures contracts which are standardised, transferable, exchange-tradedcontracts that require delivery of a commodity, bond, currency, or stock index, at a specified price, on aspecified future date.
Derivative related credit risk
Credit risk in respect of derivative financial instruments arises from the potential for a counterparty todefault on its contractual obligations and is limited to the positive fair value of instruments that arefavourable to the Group. All the derivative contracts of the Group are entered into with reputablefinancial institutions.
Derivatives held or issued for hedging purposes
The Group uses interest rate swaps to hedge against the cash flow risks arising on interest payments onlong term loans. Forward foreign exchange contracts are used to hedge against the variability in cash flowsarising as a result of movements in foreign exchange rates that are either associated with a recognised assetor liability or a highly probable firm commitment. In all such cases, the hedging relationship and objective,including details of the hedged item and hedging instrument, are formally documented and thetransactions are accounted for as cash flow hedges.
27 Capital Commitments
2006 2005USD’000 USD’000
Estimated capital expenditure contracted for at the balance sheet date butnot provided for . . . . . . . . . . . . . . . . . . . . . . . . . . . . . . . . . . . . . . . . . . 123,490 38,641
28 Contingencies
Legislation and regulations regarding taxation are constantly evolving in a number of the territories inwhich the Group operates. The various legislation and regulations are not always clearly written and theirinterpretation is subject to the opinions of both local authorities and national authorities.
The Group’s policy is to accrue for contingencies, including those relating to taxation, whenever there is aprobable outflow of resources embodying economic benefits in order to settle an obligation and theamount is reasonably determinable.
The Group has contingent liabilities amounting to USD 5,720 thousand mainly in respect of performanceguarantees (2005: USD 5,720 thousand) issued by the Group’s bankers and letters of credit amounting toNil (2005: USD 87,750 thousand) issued by PCFC’s bankers. Loan and lease guarantees issued on behalfof joint ventures and associates amount to USD 221,600 thousand (2005: nil). Other contingent liabilitiesamount to USD 282,000 thousand (2005: nil).
Included within amounts receivable relating to previous corporate disposals is an amount outstanding ofUSD 4,700 thousand net of relevant provisions arising following the sale of Bovis Group plc in 1999 byP&O. Pursuant to the sale terms P&O is obliged to provide loan funding and partial indemnification forone of Bovis’ projects, the construction of which is now completed and is the subject of litigation.
A contingent liability exists in a joint venture of the Group relating to a value added tax assessmentresulting from a tax audit for the year 2003. The joint venture company believes that there is no liability.Accordingly, it has objected to the assessment and is currently awaiting rulings from the tax authority. The
F-109
Dubai Ports Authority and its Subsidiaries
Notes to the Consolidated Financial Statements (Continued)
At 31 December 2006
28 Contingencies (Continued)
Group’s share of the contingent liability relating to the 2003 assessment is USD 4.3 million. If theassessment for 2003 is upheld, there may be liabilities relating to other years but these cannot be reliablyestimated until tax rulings following the objection have been published.
Operating lease commitments—Group as lessee
Future minimum rentals payable under non-cancellable operating leases as at 31 December are as follows:
2006 2005USD’000 USD’000
Within one year . . . . . . . . . . . . . . . . . . . . . . . . . . . . . . . . . . . . . . . . . . . . 280,369 7,408After one year but not more than five years . . . . . . . . . . . . . . . . . . . . . . . . 927,652 16,377More than five years . . . . . . . . . . . . . . . . . . . . . . . . . . . . . . . . . . . . . . . . . 2,636,568 97,879
3,844,589 121,664
Operating lease commitments—Group as lessor
Future minimum rentals receivable under non-cancellable operating leases as at 31 December are asfollows:
2006 2005USD’000 USD’000
Within one year . . . . . . . . . . . . . . . . . . . . . . . . . . . . . . . . . . . . . . . . . . . . 10,979 1,000After one year but not more than five years . . . . . . . . . . . . . . . . . . . . . . . . 3,245 7,795More than five years . . . . . . . . . . . . . . . . . . . . . . . . . . . . . . . . . . . . . . . . . 1,469 7,838
15,693 16,633
Finance lease commitments
Finance lease liabilities are payable as follows:
2006 2005
Minimum Minimumlease lease
payments Interest Principal payments Interest PrincipalUSD’000 USD’000 USD’000 USD’000 USD’000 USD’000
Less than one year . . . . . . . . . . 14,894 4,697 10,197 — — —Between one and five years . . . . 45,990 13,895 32,095 — — —More than five years . . . . . . . . . 67,908 18,200 49,708 — — —
128,792 36,792 92,000 — — —
29 Risk Management
The Group’s principal financial instruments, other than derivatives, comprise bank loans and cash andshort-term deposits. The main purpose of these financial instruments is to raise finance for the Group’soperations. The Group has various other financial assets and liabilities such as trade receivables and tradepayables, which arise directly from its operations.
The Group also enters into derivative transaction including, principally, interest rate swaps. The purpose isto manage the interest rate risk arising from the Group’s sources of finance.
It is, and has been throughout the years under review, the Group’s policy that no trading in financialinstruments shall be undertaken.
F-110
www.global-reports.com
Dubai Ports Authority and its Subsidiaries
Notes to the Consolidated Financial Statements (Continued)
At 31 December 2006
29 Risk Management (Continued)
The main risks arising from the Group’s financial instruments are cash flow interest rate risk, liquidity risk,foreign currency risk and credit risk. The senior management reviews and agrees policies for managingeach of these risks and they are summarised below. The Group’s accounting policies in relation toderivatives are set out in note 2.3.
Cash flow interest rate risk
The Group’s exposure to the risk of changes in market interest rates relates primarily to the Group’slong-term debt obligations with a floating interest rate and bank deposits.
The Group’s policy is to manage its interest cost by entering into interest rate swap agreements, in whichthe Group agrees to exchange, at specified intervals, the difference between fixed and variable rate interestamounts calculated by reference to an agreed-upon notional principal amount. These swaps are designatedto hedge underlying debt obligations.
At 31 December 2006, after taking into account the effect of interest rate swaps, approximately 99% of theGroup’s borrowings are at a fixed rate of interest.
Foreign currency risk
As a result of significant investment operations in Hong Kong, China, India, Australia, Korea and theDominican Republic, the Group’s balance sheet can be affected significantly by movements in exchangerates of the Hong Kong Dollar, Indian Rupee, Chinese Yuan, Australian Dollar, Korean Won andDominican Republic Pesos with the US Dollar exchange rates. The Group did not seek to hedge thesecurrency exposures.
Translational currency risk
The proportion of the Group’s net operating assets denominated in foreign currencies is 82 per cent withthe result that the Group’s US Dollar consolidated balance sheet, and in particular owner’s equity, can besignificantly affected by currency movements when it is retranslated at each period end rate. The Groupmitigates the effect of such movements by borrowing in the same currencies as those in which the assetsare denominated and using cross currency swaps. In addition the majority of the Group’s operating profitin 2006 was generated by businesses with functional currencies other than US Dollar. The results of thesebusinesses are translated into US Dollar at average exchange rates for the purposes of consolidation. Theimpact of currency movements on operating profit is mitigated partially by interest costs being incurred inforeign currencies.
Exchange differences arising on foreign currency investments are taken directly to equity. Most foreigncurrency loans are accounted for as hedges and the exchange difference arising from retranslating theseloans at each balance sheet date is taken to equity to the extent that this hedge is deemed to be effective.Where cross currency swaps are used to hedge overseas equity investments, the movement in the fair valueof the instrument is also taken to equity.
Transactional currency risk
A portion of the Group’s businesses generate part of their revenue and incur some costs outside their mainfunctional currency. Due to the diverse number of locations in which the Group operates there is somenatural hedging that occurs within the Group. When it is considered that currency volatility could have amaterial impact on the results of an operation, hedging, generally up to 12 months using forward contracts,is undertaken to reduce the short term effect of currency movements.
When the Group’s businesses enter into capital expenditure or lease commitments in currencies other thantheir main functional currency, these commitments are hedged in most instances using forward contractsand currency swaps in order to fix the cost when converted to the functional currency. The main exposure
F-111
Dubai Ports Authority and its Subsidiaries
Notes to the Consolidated Financial Statements (Continued)
At 31 December 2006
29 Risk Management (Continued)
of the Group’s foreign currency commitments of this nature is in respect of ferry operating leasecommitments. Forward contracts match the expected cash flows of capital and lease commitments.
The Group classifies its forward exchange contracts hedging forecasted transactions as cash flow hedgesand in accordance with IAS 39 states them at fair value. The fair values of hedges of forecastedtransactions at 31 December 2006 are shown in the fair value table below.
As well as the direct effect on cash flows, exchange rates also affect the Group’s businesses because of theiroverall economic influence. In particular, exchange rates affect international trade flows which impact onthe activities of the Group.
Commodity price risk
The Group has no significant commodity price risk.
Credit risk
The Group trades only with recognised, creditworthy third parties. It is the Group’s policy that allcustomers who wish to trade on credit terms are subject to credit verification procedures and required tosubmit financial guarantees based on their creditworthiness. In addition, receivable balances aremonitored on an ongoing basis with the result that the Group’s exposure to bad debts is not significant.
With respect to credit risk arising from the other financial assets of the Group, which comprise cash andcash equivalents and certain derivative instruments, the Group’s exposure to credit risk arises from defaultof the counterparty, with a maximum exposure equal to the carrying amount of these instruments.
The Group limits its credit risk with regard to bank deposits by only dealing with reputable banks.
Liquidity risk
The Group’s objective is to maintain a balance between continuity of funding and flexibility through theuse of bank facilities and by ensuring adequate internally generated funds and funds from the ParentGroup are available when required. The Group’s terms of business require amounts to be paid within60 days of the date of provision of the service. Trade payables are normally settled within 45 days of thedate of purchase.
30 Assets held for sale and discontinued operations
(a) P&O Ports North America
P&O Ports North America (‘POPNA’) was classified as a discontinued operation held for sale at the timeof acquisition of P&O. Pursuant thereto, on 10 December 2006, the Group entered into an agreement tosell 100% of POPNA. POPNA is part of the Ports business segment within the Americas operations.During the period from 9 March 2006 to 31 December 2006 POPNA contributed USD 34,500 thousand tothe Group’s net operating cash flow, generated USD 17,300 thousand cash outflow from investingactivities, and utilised USD 2,700 thousand in respect of financing activities.
F-112
www.global-reports.com
Dubai Ports Authority and its Subsidiaries
Notes to the Consolidated Financial Statements (Continued)
At 31 December 2006
30 Assets held for sale and discontinued operations (Continued)
The results of P&O North America for 2006 are presented below:
9 March2006 to
31 December2006
USD’000
Revenue . . . . . . . . . . . . . . . . . . . . . . . . . . . . . . . . . . . . . . . . . . . . . . . . . . . . . . . . . . . . 270,300Expenses . . . . . . . . . . . . . . . . . . . . . . . . . . . . . . . . . . . . . . . . . . . . . . . . . . . . . . . . . . . (251,955)
18,345Share of results of joint ventures and associates . . . . . . . . . . . . . . . . . . . . . . . . . . . . . . . 3,638
Operating profit . . . . . . . . . . . . . . . . . . . . . . . . . . . . . . . . . . . . . . . . . . . . . . . . . . . . . . 21,983Financial income . . . . . . . . . . . . . . . . . . . . . . . . . . . . . . . . . . . . . . . . . . . . . . . . . . . . . 3,300Financial expenses . . . . . . . . . . . . . . . . . . . . . . . . . . . . . . . . . . . . . . . . . . . . . . . . . . . . (10,900)
Profit before tax from discontinued operation . . . . . . . . . . . . . . . . . . . . . . . . . . . . . . . . . 14,383Taxation . . . . . . . . . . . . . . . . . . . . . . . . . . . . . . . . . . . . . . . . . . . . . . . . . . . . . . . . . . . . (6,313)
Profit for the period from discontinued operation . . . . . . . . . . . . . . . . . . . . . . . . . . . . . . 8,070
The major classes of assets and liabilities of P&O Ports North America as at 31 December 2006 were asfollows:
2006USD’000
AssetsNon-current assetsIntangibles . . . . . . . . . . . . . . . . . . . . . . . . . . . . . . . . . . . . . . . . . . . . . . . . . . . . . . . . . . 392,699Property, plant and equipment . . . . . . . . . . . . . . . . . . . . . . . . . . . . . . . . . . . . . . . . . . . 77,800Investments in joint ventures and associates . . . . . . . . . . . . . . . . . . . . . . . . . . . . . . . . . . 295,586
766,085
Current assetsTrade and other receivables . . . . . . . . . . . . . . . . . . . . . . . . . . . . . . . . . . . . . . . . . . . . . . 52,500Tax recoverable . . . . . . . . . . . . . . . . . . . . . . . . . . . . . . . . . . . . . . . . . . . . . . . . . . . . . . . (5,700)Cash and cash equivalents . . . . . . . . . . . . . . . . . . . . . . . . . . . . . . . . . . . . . . . . . . . . . . . 77,500
124,300
Assets classified as held for sale . . . . . . . . . . . . . . . . . . . . . . . . . . . . . . . . . . . . . . . . . . 890,385
2006USD’000
LiabilitiesCurrent liabilitiesTrade and other payables . . . . . . . . . . . . . . . . . . . . . . . . . . . . . . . . . . . . . . . . . . . . . . . 49,900Provisions . . . . . . . . . . . . . . . . . . . . . . . . . . . . . . . . . . . . . . . . . . . . . . . . . . . . . . . . . . . 16,800
66,700
Non-current liabilitiesDeferred tax liabilities . . . . . . . . . . . . . . . . . . . . . . . . . . . . . . . . . . . . . . . . . . . . . . . . . . 197,976Employee benefits . . . . . . . . . . . . . . . . . . . . . . . . . . . . . . . . . . . . . . . . . . . . . . . . . . . . 13,100Provisions . . . . . . . . . . . . . . . . . . . . . . . . . . . . . . . . . . . . . . . . . . . . . . . . . . . . . . . . . . . 72,600
283,676
Liabilities classified as held for sale . . . . . . . . . . . . . . . . . . . . . . . . . . . . . . . . . . . . . . . 350,376
F-113
Dubai Ports Authority and its Subsidiaries
Notes to the Consolidated Financial Statements (Continued)
At 31 December 2006
30 Assets held for sale and discontinued operations (Continued)
(b) P&O Estates
P&O Estates is part of the Property business segment within the UK and Continental Europe operations.As at 31 December 2006 P&O Estates was classified as a disposal group held for sale as Group is in theprocess of selling this business unit to a related party forming part of the Parent Group. During the periodfrom 9 March 2006 to 31 December 2006 P&O Estates contributed USD 71,400 thousand to the Group’snet operating cash flow, generated USD 300 thousand cash outflow from investing activities, and utilisedUSD 900 thousand in respect of financing activities.
The results of P&O Estates for 2006 are presented below:
9 March2006 to
31 Dec 2006USD’000
Revenue . . . . . . . . . . . . . . . . . . . . . . . . . . . . . . . . . . . . . . . . . . . . . . . . . . . . . . . . . . . . 42,800Expenses . . . . . . . . . . . . . . . . . . . . . . . . . . . . . . . . . . . . . . . . . . . . . . . . . . . . . . . . . . . (35,838)
6,962Share of results of joint ventures and associates . . . . . . . . . . . . . . . . . . . . . . . . . . . . . . . 7,500
Operating profit . . . . . . . . . . . . . . . . . . . . . . . . . . . . . . . . . . . . . . . . . . . . . . . . . . . . . . 14,462Financial income . . . . . . . . . . . . . . . . . . . . . . . . . . . . . . . . . . . . . . . . . . . . . . . . . . . . . 700Financial expenses . . . . . . . . . . . . . . . . . . . . . . . . . . . . . . . . . . . . . . . . . . . . . . . . . . . . (500)
Profit before tax from discontinued operation . . . . . . . . . . . . . . . . . . . . . . . . . . . . . . . . . 14,662Taxation . . . . . . . . . . . . . . . . . . . . . . . . . . . . . . . . . . . . . . . . . . . . . . . . . . . . . . . . . . . . (3,499)
Profit for the period from discontinued operation . . . . . . . . . . . . . . . . . . . . . . . . . . . . . . 11,163
F-114
www.global-reports.com
Dubai Ports Authority and its Subsidiaries
Notes to the Consolidated Financial Statements (Continued)
At 31 December 2006
30 Assets held for sale and discontinued operations (Continued)
The major classes of assets and liabilities of P&O Estates as at 31 December 2006 were as follows:
2006USD’000
AssetsNon-current assetsProperty, plant and equipment . . . . . . . . . . . . . . . . . . . . . . . . . . . . . . . . . . . . . . . . . . . 37,669Intangible assets . . . . . . . . . . . . . . . . . . . . . . . . . . . . . . . . . . . . . . . . . . . . . . . . . . . . . . 79,067Investments in joint ventures and associates . . . . . . . . . . . . . . . . . . . . . . . . . . . . . . . . . . 56,000Other investments . . . . . . . . . . . . . . . . . . . . . . . . . . . . . . . . . . . . . . . . . . . . . . . . . . . . . 2,300
175,036
Current assetsTrade and other receivables . . . . . . . . . . . . . . . . . . . . . . . . . . . . . . . . . . . . . . . . . . . . . . 27,300Properties held for development and sale . . . . . . . . . . . . . . . . . . . . . . . . . . . . . . . . . . . . 70,600Inventories . . . . . . . . . . . . . . . . . . . . . . . . . . . . . . . . . . . . . . . . . . . . . . . . . . . . . . . . . . 11,500Cash and cash equivalents . . . . . . . . . . . . . . . . . . . . . . . . . . . . . . . . . . . . . . . . . . . . . . . 16,000
125,400
Assets classified as held for sale . . . . . . . . . . . . . . . . . . . . . . . . . . . . . . . . . . . . . . . . . . 300,436
LiabilitiesCurrent liabilitiesTrade and other payables . . . . . . . . . . . . . . . . . . . . . . . . . . . . . . . . . . . . . . . . . . . . . . . 27,600Provisions . . . . . . . . . . . . . . . . . . . . . . . . . . . . . . . . . . . . . . . . . . . . . . . . . . . . . . . . . . . 1,625
29,225
Non-current liabilitiesOther payables . . . . . . . . . . . . . . . . . . . . . . . . . . . . . . . . . . . . . . . . . . . . . . . . . . . . . . . 9,000Provisions . . . . . . . . . . . . . . . . . . . . . . . . . . . . . . . . . . . . . . . . . . . . . . . . . . . . . . . . . . . 1,400
10,400
Liabilities classified as held for sale . . . . . . . . . . . . . . . . . . . . . . . . . . . . . . . . . . . . . . . 39,625
(c) Shekou and Colombo
Shekou and Colombo (together ‘‘the units’’) are part of the Ports business segment within the Asiaoperations. During 2006 the Group entered into memorandum of understanding agreements with thirdparties to sell those business units and accordingly, these business units have been classified as disposalgroups held for sale.
The Group’s share of the net assets of Shekou and Colombo as at 31 December 2006 was as follows:
2006USD’000
AssetsNon-current assetsInvestments in joint ventures and associates . . . . . . . . . . . . . . . . . . . . . . . . . . . . . . . . . . 72,800
Assets classified as held for sale . . . . . . . . . . . . . . . . . . . . . . . . . . . . . . . . . . . . . . . . . . 72,800
F-115
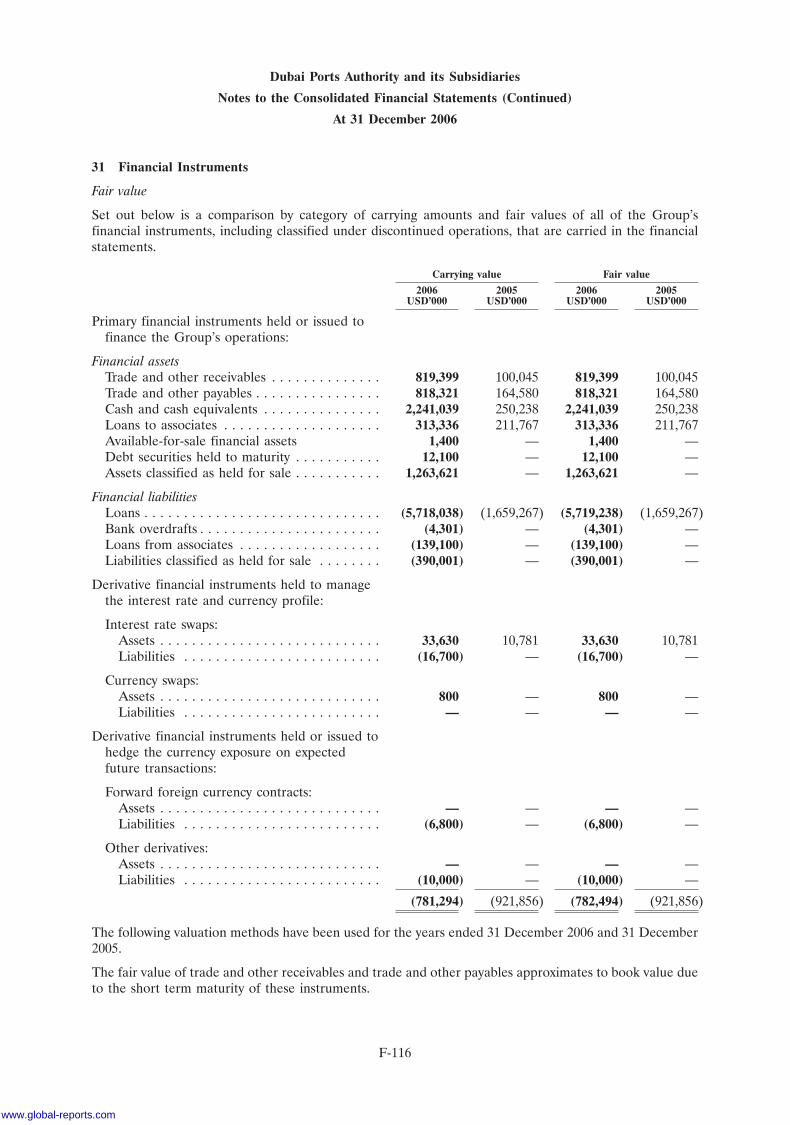
Dubai Ports Authority and its Subsidiaries
Notes to the Consolidated Financial Statements (Continued)
At 31 December 2006
31 Financial Instruments
Fair value
Set out below is a comparison by category of carrying amounts and fair values of all of the Group’sfinancial instruments, including classified under discontinued operations, that are carried in the financialstatements.
Carrying value Fair value
2006 2005 2006 2005USD’000 USD’000 USD’000 USD’000
Primary financial instruments held or issued tofinance the Group’s operations:
Financial assetsTrade and other receivables . . . . . . . . . . . . . . 819,399 100,045 819,399 100,045Trade and other payables . . . . . . . . . . . . . . . . 818,321 164,580 818,321 164,580Cash and cash equivalents . . . . . . . . . . . . . . . 2,241,039 250,238 2,241,039 250,238Loans to associates . . . . . . . . . . . . . . . . . . . . 313,336 211,767 313,336 211,767Available-for-sale financial assets 1,400 — 1,400 —Debt securities held to maturity . . . . . . . . . . . 12,100 — 12,100 —Assets classified as held for sale . . . . . . . . . . . 1,263,621 — 1,263,621 —
Financial liabilitiesLoans . . . . . . . . . . . . . . . . . . . . . . . . . . . . . . (5,718,038) (1,659,267) (5,719,238) (1,659,267)Bank overdrafts . . . . . . . . . . . . . . . . . . . . . . . (4,301) — (4,301) —Loans from associates . . . . . . . . . . . . . . . . . . (139,100) — (139,100) —Liabilities classified as held for sale . . . . . . . . (390,001) — (390,001) —
Derivative financial instruments held to managethe interest rate and currency profile:
Interest rate swaps:Assets . . . . . . . . . . . . . . . . . . . . . . . . . . . . 33,630 10,781 33,630 10,781Liabilities . . . . . . . . . . . . . . . . . . . . . . . . . (16,700) — (16,700) —
Currency swaps:Assets . . . . . . . . . . . . . . . . . . . . . . . . . . . . 800 — 800 —Liabilities . . . . . . . . . . . . . . . . . . . . . . . . . — — — —
Derivative financial instruments held or issued tohedge the currency exposure on expectedfuture transactions:
Forward foreign currency contracts:Assets . . . . . . . . . . . . . . . . . . . . . . . . . . . . — — — —Liabilities . . . . . . . . . . . . . . . . . . . . . . . . . (6,800) — (6,800) —
Other derivatives:Assets . . . . . . . . . . . . . . . . . . . . . . . . . . . . — — — —Liabilities . . . . . . . . . . . . . . . . . . . . . . . . . (10,000) — (10,000) —
(781,294) (921,856) (782,494) (921,856)
The following valuation methods have been used for the years ended 31 December 2006 and 31 December2005.
The fair value of trade and other receivables and trade and other payables approximates to book value dueto the short term maturity of these instruments.
F-116
www.global-reports.com
Dubai Ports Authority and its Subsidiaries
Notes to the Consolidated Financial Statements (Continued)
At 31 December 2006
31 Financial Instruments (Continued)
The fair value of non-convertible bonds and dollar notes included in loans above is based on the quotedmarket price of comparable debt. Other loans include term loans and finance leases. These are largely atvariable interest rates and, therefore, the book value normally equates to the fair value.
The fair values of debt securities held to maturity and available-for-sale financial assets are based on thequoted market value of similar assets.
The fair value of other investments is based on the year end quoted price for listed investments and theestimated recoverable amount for unlisted investments.
The fair value of cash and bank overdrafts approximates to the book value due to the short term maturityof the instruments.
The fair value of derivative financial instruments is discounted to the net present value using prevailingmarket rates and foreign currency rates at the balance sheet date.
32 Significant Accounting Estimates and Assumptions
Estimation uncertainty
The key assumptions concerning the future and other key sources of estimation uncertainty at the balancesheet date, that have a significant risk of causing a material adjustment to the carrying amounts of assetsand liabilities within the next financial year are discussed below.
Impairment of Goodwill
The Group determines whether goodwill is impaired at least on an annual basis. This requires anestimation of the value in use of the cash-generating units to which the goodwill is allocated. Estimatingthe value in use requires the Group to make an estimate of the expected future cash flows from thecash-generating unit and also to choose a suitable discount rate in order to calculate the present value ofthose cash flows. The carrying amount of goodwill at 31 December 2006 was USD 3,103,870 thousand(2005: USD 461,011 thousand). More details are given in note 12.
Pension and Other Post-Employment Benefits
The cost of defined benefit pension plans and other post employment benefits is determined usingactuarial valuations. The actuarial valuation involves making assumptions about discount rates, expectedrates of return on assets, future salary increases, mortality rates and future pension increases. Due to thelong term nature of these plans, such estimates are subject to significant uncertainty. The employee benefitliability at 31 December 2006 is USD 344,089 thousand (2005: 69,444 thousand). Further details are givenin Note 23.
Useful life of property, plant and equipment
The useful life of property, plant and equipment is determined by the Group’s management based on theirestimate of the period over which an asset is expected to be available for use by the Group. This estimate isreviewed and adjusted if appropriate at each financial year end.
Purchase price allocation
The Group allocates the cost of business combinations by recognising the acquiree’s identifiable assets,liabilities, and contingent liabilities that satisfy the recognition criteria, at their fair values on the date ofacquisition. The Group uses third party experts to establish the estimated fair value of the acquiree’sproperty, plant and equipment, and intangibles. The fair values of other assets, liabilities and contingentliabilities are estimated by the management based on the discounted cash flow projections of futureexpected cash inflows arising as a result of realising such assets and cash outflows expected on settlementof liabilities and contingent liabilities.
F-117
Dubai Ports Authority and its Subsidiaries
Notes to the Consolidated Financial Statements (Continued)
At 31 December 2006
32 Significant Accounting Estimates and Assumptions (Continued)
In respect of assets held for sale and liabilities held for sale on the date of acquisition the Group uses thirdparty experts and internal discounted cash flow projections model to establish the estimated fair value.
Impairment of accounts receivable
An estimate of the collectible amount of trade accounts receivable is made when collection of the fullamount is no longer probable. For individually significant amounts, this estimation is performed on anindividual basis. Amounts which are not individually significant, but which are past due, are assessedcollectively and a provision applied according to the length of time past due, based on historical recoveryrates.
At the balance sheet date, gross trade accounts receivable were USD 544,574 thousand(2005: USD 78,331 thousand), and the provision for doubtful debts was USD 24,314 thousand(2005: USD 2,823 thousand). Any difference between the amounts actually collected in future periods andthe amounts expected will be recognised in the consolidated statement of income.
33 Comparative Information
Certain of the corresponding figures in the income statement, balance sheet and notes to financialstatements for 2005 have been reclassified in order to conform to the presentation for the current year andto improve the quality of information presented.
Income statement
Project development expenses amounting to USD 8,408 thousand were shown separately on the face ofincome statement in the previous years’ financial statements. These have now been clubbed under generaland administration expenses.
Balance sheet
Long term receivables amounting to USD 4,089 thousand, due from an associate amounting toUSD 7,003 thousand and other assets amounting to USD 2,368 thousand were shown separately on theface of balance sheet in the previous years’ financial statements. These have now been clubbed underaccounts receivable and prepayments.
The management has used the caption ‘‘pension and post-employment benefits’’ to include employees’ endof service benefits during 2006. Accordingly, previous year comparatives of employees’ end of servicebenefits were clubbed under pension and post-employment benefits in the balance sheets.
Notes to the financial statements
Management has changed the presentation of the property, plant and equipment note to the financialstatements to reduce the number of categories by aggregating land, buildings and infrastructure into onecategory; cranes and marine equipment into one category and plant, equipment, furniture and other intoone category. Capital work in progress has also been allocated to respective categories of property, plantand equipment. The presentation for 2005 has been reclassified in line with that for 2006.
F-118
www.global-reports.com
AUDITORS’ REPORT TO THE OWNER OFDUBAI PORTS AUTHORITY AND ITS SUBSIDIARIES
We have audited the accompanying consolidated balance sheets of Dubai Ports Authority (the ‘‘Authority’’)and its subsidiaries (together ‘‘the Group’’) as of 31 December 2005 and 31 December 2004, and therelated consolidated statements of income, cash flows and changes in equity for the years then ended.These consolidated financial statements are the responsibility of the Group’s management. Ourresponsibility is to express an opinion on these consolidated financial statements based on our audits.
We conducted our audits in accordance with International Standards on Auditing. Those Standards requirethat we plan and perform the audit to obtain reasonable assurance about whether the financial statementsare free of material misstatement. An audit includes examining, on a test basis, evidence supporting theamounts and disclosures in the financial statements. An audit also includes assessing the accountingprinciples used and significant estimates made by management, as well as evaluating the overall financialstatement presentation. We believe that our audits provide a reasonable basis for our opinion.
In our opinion, the consolidated financial statements present fairly, in all material respects, theconsolidated financial position of the Group as of 31 December 2005 and 31 December 2004 and theconsolidated results of its operations and its cash flows for the years then ended in accordance withInternational Financial Reporting Standards.
/s/ Ernst & YoungErnst & Young
Signed by:Edward B QuinlanPartnerRegistration No. 93
28 June 2006
Dubai
F-119
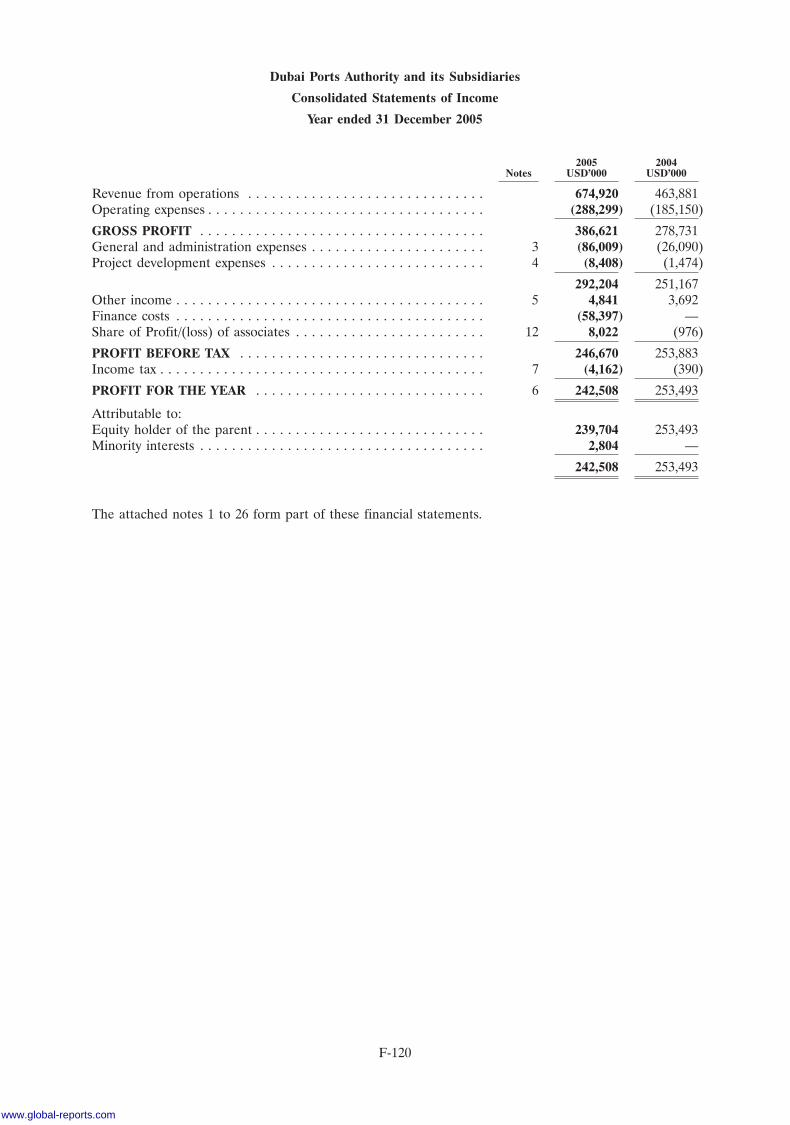
Dubai Ports Authority and its Subsidiaries
Consolidated Statements of Income
Year ended 31 December 2005
2005 2004Notes USD’000 USD’000
Revenue from operations . . . . . . . . . . . . . . . . . . . . . . . . . . . . . . 674,920 463,881Operating expenses . . . . . . . . . . . . . . . . . . . . . . . . . . . . . . . . . . . (288,299) (185,150)
GROSS PROFIT . . . . . . . . . . . . . . . . . . . . . . . . . . . . . . . . . . . . 386,621 278,731General and administration expenses . . . . . . . . . . . . . . . . . . . . . . 3 (86,009) (26,090)Project development expenses . . . . . . . . . . . . . . . . . . . . . . . . . . . 4 (8,408) (1,474)
292,204 251,167Other income . . . . . . . . . . . . . . . . . . . . . . . . . . . . . . . . . . . . . . . 5 4,841 3,692Finance costs . . . . . . . . . . . . . . . . . . . . . . . . . . . . . . . . . . . . . . . (58,397) —Share of Profit/(loss) of associates . . . . . . . . . . . . . . . . . . . . . . . . 12 8,022 (976)
PROFIT BEFORE TAX . . . . . . . . . . . . . . . . . . . . . . . . . . . . . . . 246,670 253,883Income tax . . . . . . . . . . . . . . . . . . . . . . . . . . . . . . . . . . . . . . . . . 7 (4,162) (390)
PROFIT FOR THE YEAR . . . . . . . . . . . . . . . . . . . . . . . . . . . . . 6 242,508 253,493
Attributable to:Equity holder of the parent . . . . . . . . . . . . . . . . . . . . . . . . . . . . . 239,704 253,493Minority interests . . . . . . . . . . . . . . . . . . . . . . . . . . . . . . . . . . . . 2,804 —
242,508 253,493
The attached notes 1 to 26 form part of these financial statements.
F-120
www.global-reports.com
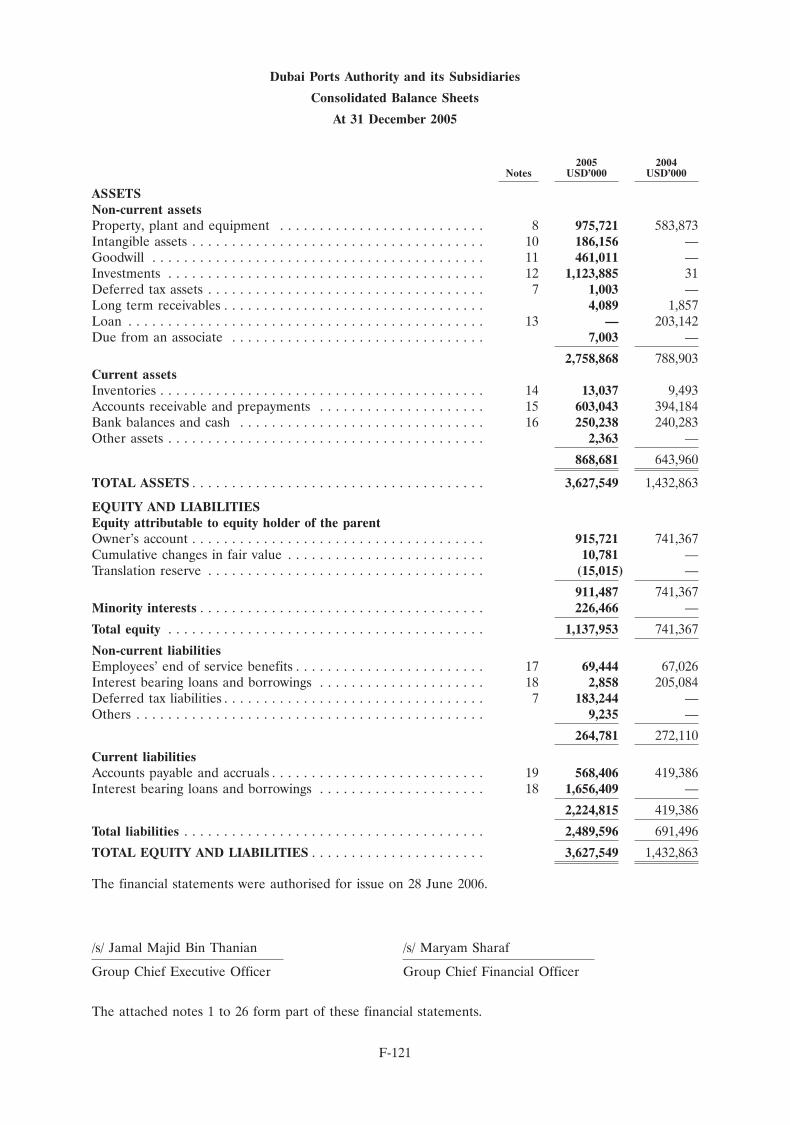
Dubai Ports Authority and its Subsidiaries
Consolidated Balance Sheets
At 31 December 2005
2005 2004Notes USD’000 USD’000
ASSETSNon-current assetsProperty, plant and equipment . . . . . . . . . . . . . . . . . . . . . . . . . . 8 975,721 583,873Intangible assets . . . . . . . . . . . . . . . . . . . . . . . . . . . . . . . . . . . . . 10 186,156 —Goodwill . . . . . . . . . . . . . . . . . . . . . . . . . . . . . . . . . . . . . . . . . . 11 461,011 —Investments . . . . . . . . . . . . . . . . . . . . . . . . . . . . . . . . . . . . . . . . 12 1,123,885 31Deferred tax assets . . . . . . . . . . . . . . . . . . . . . . . . . . . . . . . . . . . 7 1,003 —Long term receivables . . . . . . . . . . . . . . . . . . . . . . . . . . . . . . . . . 4,089 1,857Loan . . . . . . . . . . . . . . . . . . . . . . . . . . . . . . . . . . . . . . . . . . . . . 13 — 203,142Due from an associate . . . . . . . . . . . . . . . . . . . . . . . . . . . . . . . . 7,003 —
2,758,868 788,903Current assetsInventories . . . . . . . . . . . . . . . . . . . . . . . . . . . . . . . . . . . . . . . . . 14 13,037 9,493Accounts receivable and prepayments . . . . . . . . . . . . . . . . . . . . . 15 603,043 394,184Bank balances and cash . . . . . . . . . . . . . . . . . . . . . . . . . . . . . . . 16 250,238 240,283Other assets . . . . . . . . . . . . . . . . . . . . . . . . . . . . . . . . . . . . . . . . 2,363 —
868,681 643,960
TOTAL ASSETS . . . . . . . . . . . . . . . . . . . . . . . . . . . . . . . . . . . . . 3,627,549 1,432,863
EQUITY AND LIABILITIESEquity attributable to equity holder of the parentOwner’s account . . . . . . . . . . . . . . . . . . . . . . . . . . . . . . . . . . . . . 915,721 741,367Cumulative changes in fair value . . . . . . . . . . . . . . . . . . . . . . . . . 10,781 —Translation reserve . . . . . . . . . . . . . . . . . . . . . . . . . . . . . . . . . . . (15,015) —
911,487 741,367Minority interests . . . . . . . . . . . . . . . . . . . . . . . . . . . . . . . . . . . . 226,466 —
Total equity . . . . . . . . . . . . . . . . . . . . . . . . . . . . . . . . . . . . . . . . 1,137,953 741,367
Non-current liabilitiesEmployees’ end of service benefits . . . . . . . . . . . . . . . . . . . . . . . . 17 69,444 67,026Interest bearing loans and borrowings . . . . . . . . . . . . . . . . . . . . . 18 2,858 205,084Deferred tax liabilities . . . . . . . . . . . . . . . . . . . . . . . . . . . . . . . . . 7 183,244 —Others . . . . . . . . . . . . . . . . . . . . . . . . . . . . . . . . . . . . . . . . . . . . 9,235 —
264,781 272,110
Current liabilitiesAccounts payable and accruals . . . . . . . . . . . . . . . . . . . . . . . . . . . 19 568,406 419,386Interest bearing loans and borrowings . . . . . . . . . . . . . . . . . . . . . 18 1,656,409 —
2,224,815 419,386
Total liabilities . . . . . . . . . . . . . . . . . . . . . . . . . . . . . . . . . . . . . . 2,489,596 691,496
TOTAL EQUITY AND LIABILITIES . . . . . . . . . . . . . . . . . . . . . . 3,627,549 1,432,863
The financial statements were authorised for issue on 28 June 2006.
/s/ Jamal Majid Bin Thanian /s/ Maryam Sharaf
Group Chief Executive Officer Group Chief Financial Officer
The attached notes 1 to 26 form part of these financial statements.
F-121
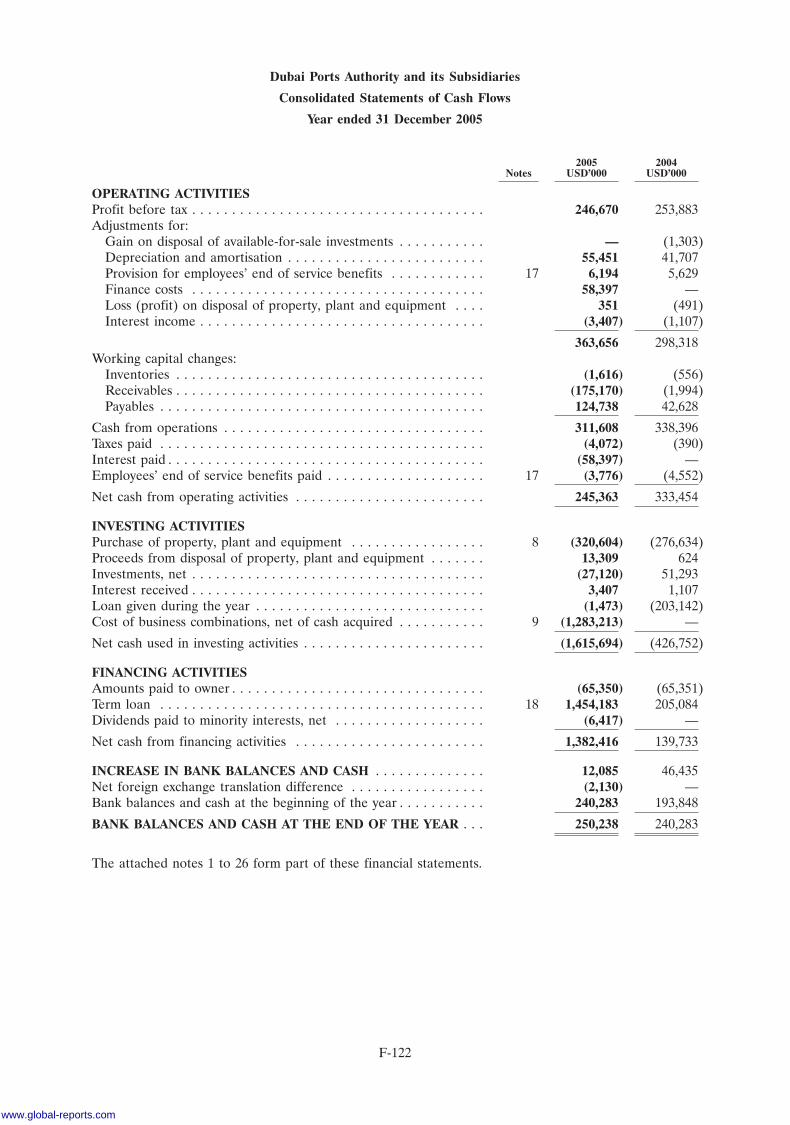
Dubai Ports Authority and its Subsidiaries
Consolidated Statements of Cash Flows
Year ended 31 December 2005
2005 2004Notes USD’000 USD’000
OPERATING ACTIVITIESProfit before tax . . . . . . . . . . . . . . . . . . . . . . . . . . . . . . . . . . . . . 246,670 253,883Adjustments for:
Gain on disposal of available-for-sale investments . . . . . . . . . . . — (1,303)Depreciation and amortisation . . . . . . . . . . . . . . . . . . . . . . . . . 55,451 41,707Provision for employees’ end of service benefits . . . . . . . . . . . . 17 6,194 5,629Finance costs . . . . . . . . . . . . . . . . . . . . . . . . . . . . . . . . . . . . . 58,397 —Loss (profit) on disposal of property, plant and equipment . . . . 351 (491)Interest income . . . . . . . . . . . . . . . . . . . . . . . . . . . . . . . . . . . . (3,407) (1,107)
363,656 298,318Working capital changes:
Inventories . . . . . . . . . . . . . . . . . . . . . . . . . . . . . . . . . . . . . . . (1,616) (556)Receivables . . . . . . . . . . . . . . . . . . . . . . . . . . . . . . . . . . . . . . . (175,170) (1,994)Payables . . . . . . . . . . . . . . . . . . . . . . . . . . . . . . . . . . . . . . . . . 124,738 42,628
Cash from operations . . . . . . . . . . . . . . . . . . . . . . . . . . . . . . . . . 311,608 338,396Taxes paid . . . . . . . . . . . . . . . . . . . . . . . . . . . . . . . . . . . . . . . . . (4,072) (390)Interest paid . . . . . . . . . . . . . . . . . . . . . . . . . . . . . . . . . . . . . . . . (58,397) —Employees’ end of service benefits paid . . . . . . . . . . . . . . . . . . . . 17 (3,776) (4,552)
Net cash from operating activities . . . . . . . . . . . . . . . . . . . . . . . . 245,363 333,454
INVESTING ACTIVITIESPurchase of property, plant and equipment . . . . . . . . . . . . . . . . . 8 (320,604) (276,634)Proceeds from disposal of property, plant and equipment . . . . . . . 13,309 624Investments, net . . . . . . . . . . . . . . . . . . . . . . . . . . . . . . . . . . . . . (27,120) 51,293Interest received . . . . . . . . . . . . . . . . . . . . . . . . . . . . . . . . . . . . . 3,407 1,107Loan given during the year . . . . . . . . . . . . . . . . . . . . . . . . . . . . . (1,473) (203,142)Cost of business combinations, net of cash acquired . . . . . . . . . . . 9 (1,283,213) —
Net cash used in investing activities . . . . . . . . . . . . . . . . . . . . . . . (1,615,694) (426,752)
FINANCING ACTIVITIESAmounts paid to owner . . . . . . . . . . . . . . . . . . . . . . . . . . . . . . . . (65,350) (65,351)Term loan . . . . . . . . . . . . . . . . . . . . . . . . . . . . . . . . . . . . . . . . . 18 1,454,183 205,084Dividends paid to minority interests, net . . . . . . . . . . . . . . . . . . . (6,417) —
Net cash from financing activities . . . . . . . . . . . . . . . . . . . . . . . . 1,382,416 139,733
INCREASE IN BANK BALANCES AND CASH . . . . . . . . . . . . . . 12,085 46,435Net foreign exchange translation difference . . . . . . . . . . . . . . . . . (2,130) —Bank balances and cash at the beginning of the year . . . . . . . . . . . 240,283 193,848
BANK BALANCES AND CASH AT THE END OF THE YEAR . . . 250,238 240,283
The attached notes 1 to 26 form part of these financial statements.
F-122
www.global-reports.com
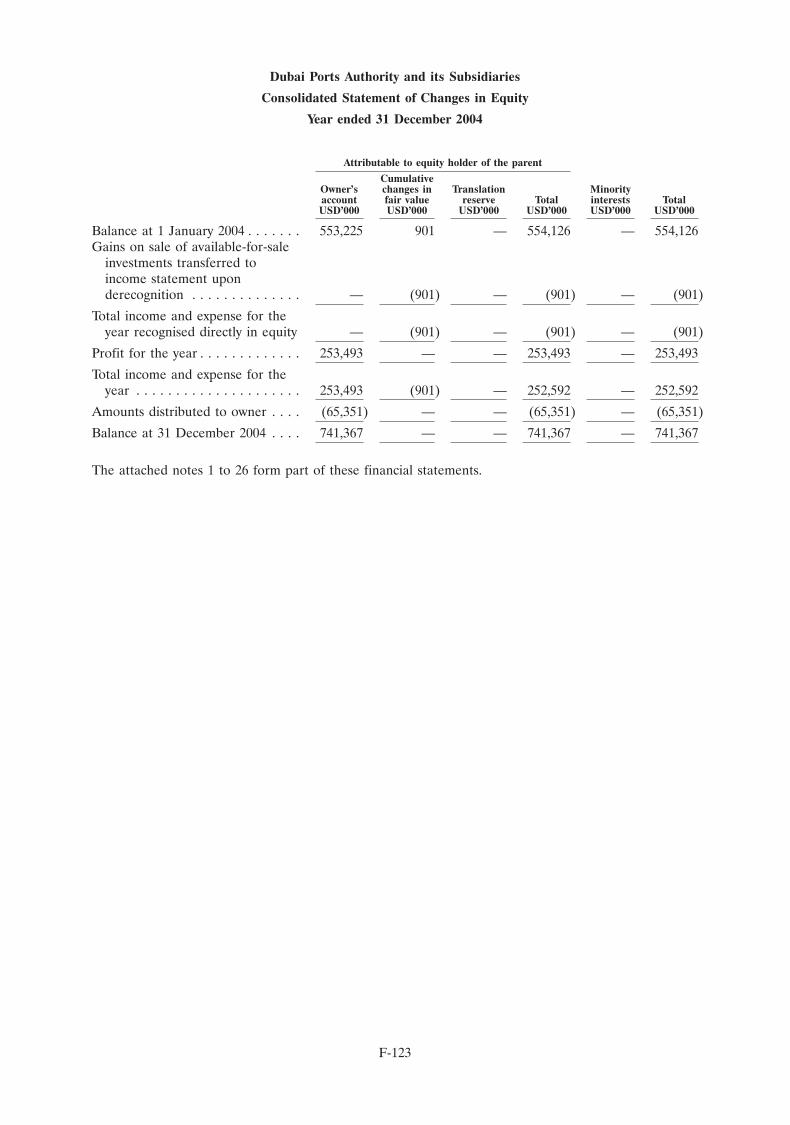
Dubai Ports Authority and its Subsidiaries
Consolidated Statement of Changes in Equity
Year ended 31 December 2004
Attributable to equity holder of the parent
CumulativeOwner’s changes in Translation Minorityaccount fair value reserve Total interests TotalUSD’000 USD’000 USD’000 USD’000 USD’000 USD’000
Balance at 1 January 2004 . . . . . . . 553,225 901 — 554,126 — 554,126Gains on sale of available-for-sale
investments transferred toincome statement uponderecognition . . . . . . . . . . . . . . — (901) — (901) — (901)
Total income and expense for theyear recognised directly in equity — (901) — (901) — (901)
Profit for the year . . . . . . . . . . . . . 253,493 — — 253,493 — 253,493
Total income and expense for theyear . . . . . . . . . . . . . . . . . . . . . 253,493 (901) — 252,592 — 252,592
Amounts distributed to owner . . . . (65,351) — — (65,351) — (65,351)
Balance at 31 December 2004 . . . . 741,367 — — 741,367 — 741,367
The attached notes 1 to 26 form part of these financial statements.
F-123
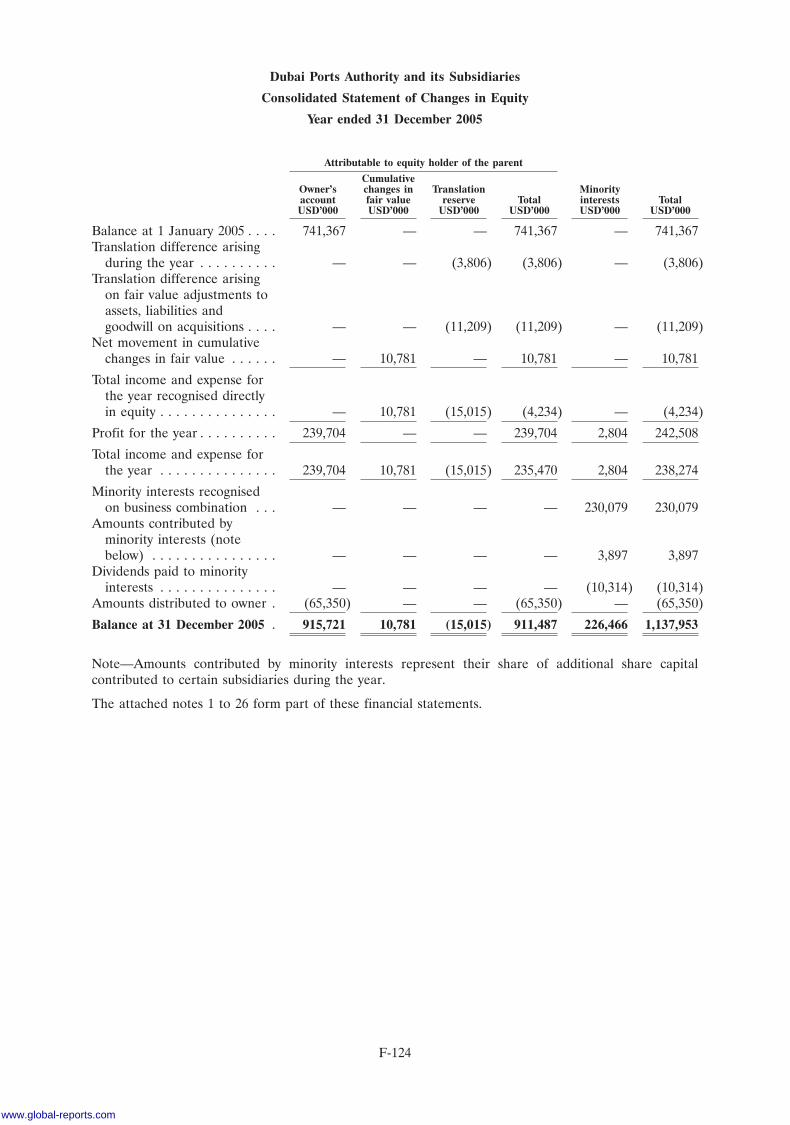
Dubai Ports Authority and its Subsidiaries
Consolidated Statement of Changes in Equity
Year ended 31 December 2005
Attributable to equity holder of the parent
CumulativeOwner’s changes in Translation Minorityaccount fair value reserve Total interests TotalUSD’000 USD’000 USD’000 USD’000 USD’000 USD’000
Balance at 1 January 2005 . . . . 741,367 — — 741,367 — 741,367Translation difference arising
during the year . . . . . . . . . . — — (3,806) (3,806) — (3,806)Translation difference arising
on fair value adjustments toassets, liabilities andgoodwill on acquisitions . . . . — — (11,209) (11,209) — (11,209)
Net movement in cumulativechanges in fair value . . . . . . — 10,781 — 10,781 — 10,781
Total income and expense forthe year recognised directlyin equity . . . . . . . . . . . . . . . — 10,781 (15,015) (4,234) — (4,234)
Profit for the year . . . . . . . . . . 239,704 — — 239,704 2,804 242,508
Total income and expense forthe year . . . . . . . . . . . . . . . 239,704 10,781 (15,015) 235,470 2,804 238,274
Minority interests recognisedon business combination . . . — — — — 230,079 230,079
Amounts contributed byminority interests (notebelow) . . . . . . . . . . . . . . . . — — — — 3,897 3,897
Dividends paid to minorityinterests . . . . . . . . . . . . . . . — — — — (10,314) (10,314)
Amounts distributed to owner . (65,350) — — (65,350) — (65,350)
Balance at 31 December 2005 . 915,721 10,781 (15,015) 911,487 226,466 1,137,953
Note—Amounts contributed by minority interests represent their share of additional share capitalcontributed to certain subsidiaries during the year.
The attached notes 1 to 26 form part of these financial statements.
F-124
www.global-reports.com
Dubai Ports Authority and its Subsidiaries
Notes to the Consolidated Financial Statements
At 31 December 2005
1 Activities
Dubai Ports Authority (the ‘‘Authority’’) was originally formed in Dubai as Port Rashid Authority underDecree number 1 of 1990 issued by HH The Ruler of Dubai on 7 January 1990 to acquire and operatePort Rashid in the Emirate of Dubai.
Pursuant to Decree number 4 of 1991 issued by HH The Ruler of Dubai on 11 May 1991, the assets,liabilities and results of the operations of Jebel Ali Port Corporation along with the rights in relation toconstruction, operation, maintenance, repairs and renewals of Jebel Ali Port were transferred toPort Rashid Authority and Jebel Ali Port Corporation was dissolved.
On 12 May 1991, by Decree number 5 of 1991 issued by HH The Ruler of Dubai, the name of Port RashidAuthority was changed to Dubai Ports Authority.
Pursuant to Law No. (1) of 2001 on Ports, Customs and Free Zone Corporation (‘‘PCFC’’) issued byHH The Ruler of Dubai on 1 April 2001, Dubai Ports Authority became a wholly owned subsidiary ofPCFC (the ‘‘Ultimate Parent Company’’) as of that date. PCFC is wholly owned by The Government ofDubai.
With effect from 1 January 2002, the operations of Hamriya Port and Dubai Creek Operations, along withall their assets, were transferred to the Authority at nil value.
The Authority owns and operates three ports namely Jebel Ali Port, Port Rashid and Hamriya Port andCreek Operations in the Emirate of Dubai, United Arab Emirates and had 4,375 employees at31 December 2005 (2004: 3,784 employees). The registered address of the Authority is P.O.Box 17000,Dubai, United Arab Emirates.
The Group has made the following acquisitions during the current year:
1. On 22 February 2005 the Authority, through its 100% owned subsidiary (Dubai PortsInternational FZE), acquired from CSX Corporation Limited, a 100% ownership interest inSL Service, Inc. (a limited liability company registered in Delaware, United States of America)and in Orange Blossom Investment Company Limited (a limited liability company registered inBritish Virgin Islands). These Companies are engaged in the business of management andoperation of seaports worldwide (note 9);
2. On 30 Nov 2005 the Authority, through its 100% owned subsidiary (Dubai Ports InternationalFZE) acquired a 100% ownership interest in Yarimca Porselen Sanayi Ve Ticaret A.S., a limitedliability Company registered in Turkey. The Company holds the right to develop and operate aseaport in Yarimca, Turkey (note 9); and
3. During June 2005, the Authority through its 100% owned subsidiary, acquired a 14.55%ownership interest in Pusan Newport Company Limited, a limited liability company registered inKorea. The company holds the right to develop and operate a seaport in Pusan, Korea (note 9).
2 Significant Accounting Policies
The significant accounting policies adopted in the preparation of the consolidated financial statements areset out below:
Basis of preparation
These consolidated financial statements have been prepared in accordance with International FinancialReporting Standards (IFRS) and applicable requirements of UAE Law.
The functional currency of the Authority is UAE Dirhams. However, the consolidated financial statementshave been presented in thousands of United States Dollars, which management believes is the mostappropriate reporting currency in view of the global presence of the Group.
F-125
Dubai Ports Authority and its Subsidiaries
Notes to the Consolidated Financial Statements (Continued)
At 31 December 2005
2 Significant Accounting Policies (Continued)
Accounting convention
The accompanying consolidated financial statements are prepared under the historical cost convention asmodified for the measurement at fair value of derivatives.
The accounting policies adopted are consistent with those of the previous financial year except that theGroup has adopted the new standard IFRS 3 Business Combinations which is mandatory for financialyears beginning on or after 1 January 2005.
The Group’s accounting policies in respect of the adoption of IFRS 3 Business Combinations arementioned below.
Basis of consolidation
The consolidated financial statements comprise the financial statements of Dubai Ports Authority and itssubsidiaries. The accounting policies used by the subsidiaries are consistent with the policies adopted bythe Group. All inter company balances and transactions are eliminated on consolidation. Minorityinterests represents that portion, of profit or loss and net assets in certain subsidiaries, which is not held bythe Group and, as such, is presented separately in the consolidated statement of income and within equityin the consolidated balance sheet, separately from owner’s equity.
Revenue recognition
Revenue represents the invoiced value of services rendered by the Group during the year.
Services rendered by the Group include container terminal handling, container freight services, generalcargo handling, marine operations, commercial trucking, cold storage, bulk cargo handling, documentprocessing, management and operation of seaports and airports, leasing of port equipment and otherservices in connection with the use of and privileges granted at the Group’s facilities.
Interest income is recognised as the interest accrues.
Income tax
Current tax
Current tax assets and liabilities for the current and prior periods are measured at the amount expected tobe recovered from or paid to the taxation authorities. The tax rates and tax laws used to compute theamount are those that are enacted or substantively enacted by the consolidated balance sheet date.
Deferred tax
Deferred income tax is provided using the liability method on temporary differences at the balance sheetdate between the tax bases of assets and liabilities and their carrying amounts for financial reportingpurposes. Deferred tax liabilities are recognised for all taxable temporary differences, except:
� where the deferred tax liability arises from the initial recognition of goodwill or of an asset orliability in a transaction that is not a business combination and, at the time of the transaction,affects neither the accounting profit nor taxable profit or loss; and
� in respect of taxable temporary differences associated with investments in subsidiaries andassociates, where the timing of the reversal of the temporary differences can be controlled and itis probable that the temporary differences will not reverse in the foreseeable future.
Deferred income tax assets are recognised for all deductible temporary differences, carry-forward ofunused tax credits and unused tax losses, to the extent that it is probable that taxable profit will be
F-126
www.global-reports.com
Dubai Ports Authority and its Subsidiaries
Notes to the Consolidated Financial Statements (Continued)
At 31 December 2005
2 Significant Accounting Policies (Continued)
available against which the deductible temporary differences, and the carry-forward of unused tax creditsand unused tax losses can be utilised except:
� where the deferred income tax asset relating to the deductible temporary difference arises fromthe initial recognition of an asset or liability in a transaction that is not a business combinationand, at the time of the transaction, affects neither the accounting profit nor taxable profit or loss;and
� in respect of deductible temporary differences associated with investments in subsidiaries,associates and interests in joint ventures, deferred tax assets are recognised only to the extent thatit is probable that the temporary differences will reverse in the foreseeable future and taxableprofit will be available against which the temporary differences can be utilised.
The carrying amount of deferred income tax assets is reviewed at each balance sheet date and reduced tothe extent that it is no longer probable that sufficient taxable profit will be available to allow all or part ofthe deferred income tax asset to be utilised. Unrecognised deferred income tax assets are reassessed ateach balance sheet date and are recognised to the extent that it has become probable that future taxableprofit will allow the deferred tax asset to be recovered.
Deferred income tax assets and liabilities are measured at the tax rates that are expected to apply to theyear when the asset is realised or the liability is settled, based on tax rates (and tax laws) that have beenenacted or substantively enacted at the balance sheet date.
Income tax relating to items recognised directly in equity is recognised in equity and not in theconsolidated statement of income.
Deferred tax assets and deferred tax liabilities are offset, if a legally enforceable right exists to set offcurrent tax assets against current tax liabilities and the deferred taxes relate to the same taxable entity andthe same taxation authority.
Operating expenses
Operating expenses include those costs incurred for the operation, maintenance and security of theGroup’s facilities and other costs directly attributable to the various services provided by the Group.
Borrowing costs
Borrowing costs are recognised as an expense when incurred.
Property, plant and equipment
Property, plant and equipment are stated at cost less accumulated depreciation and any impairment invalue.
Depreciation is calculated on a straight line basis over the estimated useful lives of property, plant andequipment as follows:
Buildings and infrastructure . . . . . . . . . . . . . . . . . . . . . . . . . . . . . . 5 to 30 yearsCranes . . . . . . . . . . . . . . . . . . . . . . . . . . . . . . . . . . . . . . . . . . . . . 5 to 20 yearsMarine equipment . . . . . . . . . . . . . . . . . . . . . . . . . . . . . . . . . . . . . 10 to 15 yearsPlant, equipment, furniture and others . . . . . . . . . . . . . . . . . . . . . . 3 to 20 yearsMotor vehicles . . . . . . . . . . . . . . . . . . . . . . . . . . . . . . . . . . . . . . . . over 4 years
Capital work in progress is not depreciated.
The carrying values of property, plant and equipment are reviewed for impairment when events or changesin circumstances indicate the carrying value may not be recoverable. If any such indication exists and where
F-127
Dubai Ports Authority and its Subsidiaries
Notes to the Consolidated Financial Statements (Continued)
At 31 December 2005
2 Significant Accounting Policies (Continued)
the carrying values exceed the estimated recoverable amount, the assets are written down to theirrecoverable amount.
Expenditure incurred to replace a component of an item of property, plant and equipment that isaccounted for separately is capitalised and the carrying amount of the component that is replaced iswritten off. Other subsequent expenditure is capitalised only when it increases future economic benefits ofthe related item of property, plant and equipment. All other expenditure is recognised in the consolidatedstatement of income as the expense is incurred.
Goodwill
Goodwill acquired in a business combination is initially measured at cost, being the excess of the cost ofthe business combination over the Group’s interest in the net fair value of the identifiable assets, liabilitiesand contingent liabilities. Following initial recognition, goodwill is measured at cost less any accumulatedimpairment losses. Goodwill is reviewed for impairment, annually or more frequently if events or changesin circumstances indicate that the carrying value may be impaired.
For the purpose of impairment testing, goodwill acquired in a business combination is, from the acquisitiondate, allocated to each of the Group’s cash-generating units, or groups of cash-generating units, that areexpected to benefit from the synergies of the combination, irrespective of whether other assets or liabilitiesof the Group are assigned to those units or group of units. Each unit or group of units to which thegoodwill is so allocated represents the lowest level within the Group at which the goodwill is monitored forinternal management purposes.
Impairment is determined by assessing the recoverable amount of the cash-generating unit (group ofcash-generating units), to which the goodwill relates. Where the recoverable amount of thecash-generating unit (group of cash-generating units) is less than the carrying amount, an impairment lossis recognised. Where goodwill forms part of a cash-generating unit (group of cash-generating units) andpart of the operation within that unit is disposed of, the goodwill associated with the operation disposed ofis included in the carrying amount of the operation when determining the gain or loss on disposal of theoperation. Goodwill disposed of in this circumstance is measured based on the relative values of theoperation disposed of and the portion of the cash-generating unit retained.
Intangible assets
Intangible assets acquired separately are measured on initial recognition at cost. The cost of intangibleassets acquired in a business combination is fair value as at the date of acquisition. Following initialrecognition, intangible assets are carried at cost less any accumulated amortisation and any accumulatedimpairment losses. Internally generated intangible assets, excluding capitalised development cost, are notcapitalised and expenditure is charged against profits in the year in which the expenditure is incurred. Theuseful lives of intangible assets are assessed to be either finite or indefinite. Intangible assets with finitelives are amortised over the useful economic life and assessed for impairment whenever there is anindication that the intangible asset may be impaired. The amortisation period and amortisation method foran intangible asset with a finite useful life is reviewed at least at each financial year-end. Changes in theexpected useful life or the expected pattern of consumption of future economic benefits embodied in theasset is accounted for by changing the amortisation period or method, as appropriate, and treated aschanges in accounting estimates. The amortisation expense on intangible assets with finite useful lives isrecognised in the consolidated statement of income in the expense category consistent with the function ofthe intangible asset.
Intangible assets with indefinite useful lives are tested for impairment annually either individually or at thecash-generating unit level. Such intangibles are not amortised. The useful life of an intangible asset with anindefinite life is reviewed annually to determine whether indefinite life assessment continues to besupportable. If not, the change in the useful life assessment from indefinite to finite is made on aprospective basis.
F-128
www.global-reports.com
Dubai Ports Authority and its Subsidiaries
Notes to the Consolidated Financial Statements (Continued)
At 31 December 2005
2 Significant Accounting Policies (Continued)
Investments
Investment in associates
The Group’s investment in associates is accounted for under the equity method of accounting. Anassociate is an entity in which the Group has between 20% to 50% of the voting power or over which itexerts significant influence. Investment in associates is carried in the consolidated balance sheet at cost,plus post-acquisition changes in the Group’s share of net assets of the associate, less any impairment invalue. Goodwill relating to an associate which is acquired directly is included in the carrying amount of theinvestment and is not amortised. After application of the equity method, the Group determines whether itis necessary to recognise any additional impairment loss with respect to the Group’s net investment in theassociate. The consolidated income statement reflects the Group’s share of the results of its associates.When there has been a change recognised directly in the equity of the associate, the Group recognise itsshare of any changes and discloses this, when applicable, in the consolidated statement of changes inequity.
The reporting dates of the associates and the Group are identical and the associates’ accounting policiesconform to those used by the Group for like transactions and events in similar circumstances.
Available-for-sale investments
Available for sale investments are initially recognised at cost, being the fair value of the considerationgiven and including acquisition charges associated with the investment. After initial recognition,investments are remeasured at fair value. Unrealised gains and losses are reported as a separatecomponent of equity until the investment is derecognised or the investment is determined to be impaired.On derecognition or impairment, the cumulative gain or loss previously reported in equity is included inthe consolidated statement of income for the year.
Long term receivables
The Group is entitled to a profit share in certain seaports managed and operated by the Group. The longterm receivables represent that portion of such profit share which is to be received at the expiry of thecurrent management / license agreements with these seaports.
Impairment of assets
The Group assesses, at each reporting date, whether there is an indication that an asset may be impaired.If any such indication exists, or when annual impairment testing for an asset is required, the Group makesan estimate of the asset’s recoverable amount. An asset’s recoverable amount is the higher of an asset’s orcash generating unit’s fair value, less costs to sell, and its value in use and is determined for an individualasset, unless the asset does not generate cash inflows that are largely independent of those from otherassets or groups of assets. Where the carrying amount of an asset exceeds its recoverable amount, the assetis considered impaired and is written down to its recoverable amount. In assessing value in use, theestimated future cash flows are discounted to their present value using a pre-tax discount rate that reflectscurrent market assessments of the time value of money and the risks specific to the asset. Impairmentlosses of continuing operations are recognised in the consolidated statement of income in those expensecategories consistent with the function of the impaired asset.
An assessment is made at each reporting date as to whether there is any indication that previouslyrecognised impairment losses may no longer exist or may have decreased. If such indication exists, therecoverable amount is estimated. A previously recognised impairment loss is reversed only if there hasbeen a change in the estimates used to determine the asset’s recoverable amount since the last impairmentloss was recognised. If that is the case, the carrying amount of the asset is increased to its recoverableamount. That increased amount cannot exceed the carrying amount that would have been determined, netof depreciation, had no impairment loss been recognised for the asset in prior years. Such reversal is
F-129
Dubai Ports Authority and its Subsidiaries
Notes to the Consolidated Financial Statements (Continued)
At 31 December 2005
2 Significant Accounting Policies (Continued)
recognised in profit or loss unless the asset is carried at revalued amount, in which case the reversal istreated as a revaluation increase. After such a reversal the depreciation charge is adjusted in future periodsto allocate the asset’s revised carrying amount, less any residual value, on a systematic basis over itsremaining useful life.
Inventories
Inventories mainly consist of spare parts and consumables. Inventories are stated at cost less provision forobsolete and slow moving items. Cost represents those expenses incurred in bringing each product to itspresent location and condition, as determined on a weighted average basis.
Accounts receivable
Accounts receivable are stated at original invoice amount less a provision for any uncollectible amounts.An estimate for doubtful debts is made when collection of the full amount is no longer probable. Bad debtsare written off as incurred.
Bank balances and cash
Bank balances and cash comprise cash at hand, bank balances and short-term deposits with an originalmaturity of three months or less.
Accounts payable and accruals
Liabilities are recognised for amounts to be paid in the future for goods or services received, whetherbilled by the supplier or not.
Retentions payable are presented as current liabilities although they may not be payable within twelvemonths of the balance sheet date.
Provisions
Provisions are recognised when the Group has an obligation (legal or constructive) arising from a pastevent, and the costs to settle the obligation are both probable and able to be reliably measured.
Employees’ end of service benefits
The Group provides end of service benefits to its expatriate employees in the United Arab Emirates. Theentitlement to these benefits is based upon the employees’ basic salary and length of service, subject to thecompletion of a minimum service period. The expected costs of these benefits are accrued over the periodof employment.
With respect to its UAE national employees, the Group makes a provision for contributions to be made tothe UAE Pension Authority calculated as a percentage of the employees’ salaries. The Group’s obligationsare limited to these contributions, which are expensed when due.
The Group operates a defined contribution Mandatory Provident Fund retirement benefits scheme (the‘‘MPF Scheme’’) in Hong Kong, under the Mandatory Provident Fund Schemes Ordinance, for thoseemployees who are eligible to participate in the MPF Scheme. Contributions are made based on apercentage of the employees’ basic salaries and are charged to the consolidated statement income as theybecome payable in accordance with the rules of the MPF Scheme. The assets of the MPF Scheme are heldseparately from those of the Group in an independently administered fund. The Group’s employercontributions vest fully with the employees when contributed into the MPF Scheme.
The Group also operates a defined contribution retirement benefits scheme (the ‘‘ORSO Scheme’’) inHong Kong for those employees who are eligible to participate in this scheme. The ORSO Schemeoperates in a similar way to the MPF Scheme, except that when an employee leaves the ORSO Scheme
F-130
www.global-reports.com
Dubai Ports Authority and its Subsidiaries
Notes to the Consolidated Financial Statements (Continued)
At 31 December 2005
2 Significant Accounting Policies (Continued)
before his/her interest in the Group’s employer contributions vesting fully, the ongoing contributionspayable by the Group are reduced by the relevant amount of the forfeited employer contributions.
The Group operates one defined benefit pension plan in Australia through the Stevedoring Employees’Retirement Fund (SERF), which requires contributions to be made to a separately administered fund. Thisfund is a multi-employer superannuation plan, and as such, there is no reliable basis for allocating benefits,assets and costs between employers. The Group has therefore adopted multi employer provisions whenreporting under IFRS. Those provisions allow the employers to report as if the fund was a definedcontribution fund.
SERF is a superannuation fund which, in addition to providing defined contribution benefits to somecategories of members, provides other members with defined benefits. There is no basis that could be usedto definitively apportion the benefits, assets and costs associated with the fund, between the various fullparticipating employers.
A total surplus of Australian Dollars 126.4 million was determined in SERF as at 30 June 2004, using a netof tax discount rate of 5.04% p.a. and an assumed future salary escalation rate of 3.5% p.a. Otherassumptions relating to decrements are as set out in the report on the most recent actuarial valuation ofSERF.
From time to time, surpluses arise in SERF, which allow a reduction in the rate of contributions theemployers pay. Typically, any surplus is shared between members and employees, on a basis agreed by thetrustee, from time to time. The trust deed and rules of SERF limit the amount of contributions payable byan employer in respect of defined benefits. Hence, if there were a deficit, it is expected that the employerswould not be required to pay any more contributions at 12.6%.
A contractual agreement exists between the Group and SERF as to how part of surplus in the employers’fund can be used and, accordingly, the Group has recognised the asset attributable to them.
All actuarial gains (losses) are recognised in the income statement.
Interest bearing loans and borrowings
All loans and borrowings are initially recognised at the fair value of the consideration received less directlyattributable transaction costs.
After initial recognition, interest-bearing loans and borrowings are subsequently measured at amortizedcost using the effective interest method.
Gains and losses are recognised in net profit or loss when the liabilities are derecognized as well as throughthe amortisation process.
Foreign currency translation
The consolidated financial statements are presented in United States Dollars, which is the Authority’spresentation currency. All the assets and liabilities are translated at the closing rate at the date of balancesheet; income and expenses are translated at the average exchange rate for the year. The UAE Dirham,which is the Authority’s functional currency, is effectively pegged to the United States Dollar and theexchange rate used for translation is 1 United States Dollar = 3.6725 UAE Dirhams. Each entity in theGroup determines its own functional currency and items included in the financial statements of each entityare measured using that functional currency. Transactions in foreign currencies are initially recorded in thefunctional currency rate ruling at the date of the transaction. Monetary assets and liabilities denominatedin foreign currencies are retranslated at the functional currency rate of exchange ruling at the balancesheet date. All differences are taken to profit or loss with the exception of differences on foreign currencyborrowings that provide a hedge against a net investment in a foreign entity. These are taken directly toequity until the disposal of the net investment, at which time they are recognised in profit or loss. Taxcharges and credits attributable to exchange differences on those borrowings are also dealt with in equity.
F-131
Dubai Ports Authority and its Subsidiaries
Notes to the Consolidated Financial Statements (Continued)
At 31 December 2005
2 Significant Accounting Policies (Continued)
Non-monetary items that are measured in terms of historical cost in a foreign currency are translated usingthe exchange rates as at the dates of the initial transactions. Non-monetary items measured at fair value ina foreign currency are translated using the exchange rates at the date when the fair value was determined.
All the assets and liabilities of the foreign subsidiaries are translated into the presentation currency of theGroup at the rate of exchange ruling at the balance sheet date and, their income statements are translatedat the weighted average exchange rates for the year. The exchange differences arising on the translationare taken directly to a separate component of equity. On disposal of a foreign entity, the deferredcumulative amount recognised in equity relating to that particular foreign operation is recognised in theincome statement.
Any goodwill arising on the acquisition of a foreign operation and any fair value adjustments to thecarrying amounts of assets and liabilities arising on the acquisition of that foreign operation are treated asassets and liabilities of the foreign operations. Those assets and liabilities are translated into thepresentation currency of the Group at the rate of exchange ruling at the balance sheet date. The exchangedifferences arising on the translation are taken directly to a separate component of equity. On disposal of aforeign entity, the deferred cumulative amount recognised in equity relating to that particular foreignoperation is recognised in the income statement.
Derivatives
Derivatives are stated at fair value.
For the purposes of hedge accounting, hedges are classified into two categories: (a) fair value hedges whichhedge the exposure to changes in the fair value of a recognised asset or liability; and (b) cash flow hedgeswhich hedge exposure to variability in cash flows of a recognised asset or liability or a forecastedtransaction.
In relation to effective fair value hedges, any gain or loss from remeasuring the hedging instrument to fairvalue as well as related changes in fair value of the item being hedged are recognised immediately in theconsolidated statement of income.
In relation to effective cash flow hedges, the gain or loss on the hedging instrument is recognised initially inequity and either transferred to the consolidated statement of income in the period in which the hedgedtransaction impacts the consolidated statement of income, or included in the initial measurement of thecost of the related asset or liability.
For hedges which do not qualify for hedge accounting, any gains or losses arising from changes in the fairvalue of the hedging instrument are taken directly to the consolidated statement of income for the period.
Hedge accounting is discontinued when the hedging instrument expires or is sold, terminated or exercised,or no longer qualifies for hedge accounting. At that point in time:
(a) for fair value hedges of financial instruments with fixed maturities, any adjustment arising fromhedge accounting is amortised over the remaining term to maturity.
(b) for cash flow hedges, any cumulative gain or loss on the hedging instrument recognised in equityremains in equity until the hedged transaction occurs. If the hedged transaction is no longerexpected to occur, the net cumulative gain or loss recognised in equity is transferred to theconsolidated statement of income.
Fair values
For derivatives quoted in an active market, fair value is determined by reference to quoted market prices.Bid prices are used for assets and offer prices are used for liabilities.
The fair value of unquoted derivatives is determined either by discounted cash flows, (internal) pricingmodels or by reference to broker’s quotes.
F-132
www.global-reports.com
Dubai Ports Authority and its Subsidiaries
Notes to the Consolidated Financial Statements (Continued)
At 31 December 2005
2 Significant Accounting Policies (Continued)
Leases
The determination of whether an arrangement is, or contains a lease, is based on the substance of thearrangement and requires an assessment of whether the fulfilment of the arrangement is dependent on theuse of a specific asset or assets and the arrangement conveys a right to use the asset.
Group as a lessee
Finance leases, which transfer to the Group substantially all the risks and benefits incidental to ownershipof the leased item, are capitalised at the inception of the lease at the fair value of the leased property or, iflower, at the present value of the minimum lease payments. Lease payments are apportioned between thefinance charges and reduction of the lease liability so as to achieve a constant rate of interest on theremaining balance of the liability. Finance charges are charged directly against income.
Capitalised leased assets are depreciated over the shorter of the estimated useful life of the asset and thelease term, if there is no reasonable certainty that the Group will obtain ownership by the end of the leaseterm. Operating lease payments are recognised as an expense in the income statement on a straight-linebasis over the lease term.
Group as a lessor
Leases where the Group retains substantially all the risks and benefits of ownership of the asset areclassified as operating leases. Initial direct costs incurred in negotiating an operating lease are added to thecarrying amount of the leased asset and recognised over the lease term on the same basis as rental income.
2a. Adoption of IFRSs During the Year
The Group has adopted the following revised standards during the year. The adoption of these revisedstandards does not have any effect on equity as at 1 January 2004 or 1 January 2005.
� IAS 1 Presentation of Financial Statements;
� IAS 2 Inventories;
� IAS 8 Accounting Policies, Changes in Accounting Estimates and Errors;
� IAS 10 Events after the Balance Sheet Date;
� IAS 16 Property, Plant and Equipment;
� IAS 17 Leases;
� IAS 19 Employee Benefits;
� IAS 21 The Effects of Changes in Foreign Exchange Rates;
� IAS 24 Related Party Disclosures;
� IAS 27 Consolidated and Separate Financial Statements;
� IAS 28 Investments in Associates;
� IAS 31 Interests in Joint Ventures;
� IAS 32 Financial Instruments: Disclosure and Presentation;
� IAS 36 Impairment of Assets;
� IAS 38 Intangible Assets; and
� IAS 39 Financial Instruments: Recognition and Measurement
F-133
Dubai Ports Authority and its Subsidiaries
Notes to the Consolidated Financial Statements (Continued)
At 31 December 2005
2a. Adoption of IFRSs During the Year (Continued)
Standards and Interpretations issued but not yet effective
The Group has not applied IFRS 7 Financial Instruments Disclosures which has been issued but is not yeteffective: This IFRS is required to be applied for annual periods beginning on or after 1 January 2006, butis not expected to be have any material impact on the Group’s financial statements in the period of initialapplication.
Other IFRS and IFRIC interpretations have been issued but are not yet effective and are not relevant tothe activities of the Group.
2b. Siginificant Accounting Estimates
Estimation uncertainty
The key assumptions concerning the future and other key sources of estimation uncertainty at the balancesheet date, that have a significant risk of causing a material adjustment to the carrying amounts of assetsand liabilities within the next financial year are discussed below.
Impairment of Goodwill
The Group determines whether goodwill is impaired at least on an annual basis. This requires anestimation of the value in use of the cash-generating units to which the goodwill is allocated. Estimatingthe value in use requires the Group to make an estimate of the expected future cash flows from thecash-generating unit and also to choose a suitable discount rate in order to calculate the present value ofthose cash flows. The carrying amount of goodwill at 31 December 2005 was USD 461,011 thousand(2004: NIL). More details are given in note 11.
Impairment of accounts receivable
An estimate of the collectible amount of trade accounts receivable is made when collection of the fullamount is no longer probable. For individually significant amounts, this estimation is performed on anindividual basis. Amounts which are not individually significant, but which are past due, are assessedcollectively and a provision applied according to the length of time past due, based on historical recoveryrates.
At the balance sheet date, gross trade accounts receivable were USD 78,331 thousand, and the provisionfor doubtful debts was USD 2,823 thousand. Any difference between the amounts actually collected infuture periods and the amounts expected will be recognised in the consolidated statement of income.
Impairment of inventories
Inventories are held at the lower of cost and net realisable value. When inventories become old orobsolete, an estimate is made of their net realisable value. For individually significant amounts thisestimation is performed on an individual basis. Amounts which are not individually significant, but whichare old or obsolete, are assessed collectively and a provision applied according to the inventory type andthe degree of ageing or obsolescence, based on historical selling prices.
At the balance sheet date, gross inventories were USD 16,029 thousand, with provisions for old andobsolete inventories of USD 2,992 thousand. Any difference between the amounts actually realised infuture periods and the amounts expected will be recognised in the consolidated statement of income.
3 General and Administration Expenses
General and administration expenses include staff costs, depreciation, repair and maintenance costs andother sundry expenses.
F-134
www.global-reports.com
Dubai Ports Authority and its Subsidiaries
Notes to the Consolidated Financial Statements (Continued)
At 31 December 2005
4 Project Development Expenses
Project development expenses include expenses incurred on unsuccessful projects and certain one timeconsultancy expenses incurred by the Group.
5 Other Income
2005 2004USD’000 USD’000
Gain from disposal of available-for-sale investments . . . . . . . . . . . . . . . . . . — 1,303Interest income . . . . . . . . . . . . . . . . . . . . . . . . . . . . . . . . . . . . . . . . . . . . 3,407 1,107Gain on sale of property, plant and equipment . . . . . . . . . . . . . . . . . . . . . . — 491Duty free rental income . . . . . . . . . . . . . . . . . . . . . . . . . . . . . . . . . . . . . . 545 545Miscellaneous income . . . . . . . . . . . . . . . . . . . . . . . . . . . . . . . . . . . . . . . . 889 246
4,841 3,692
6 Profit for the Year
2005 2004USD’000 USD’000
The profit for the year is stated after charging the following costs:Staff costs . . . . . . . . . . . . . . . . . . . . . . . . . . . . . . . . . . . . . . . . . . . . . . . . 148,586 95,044
Operating leases . . . . . . . . . . . . . . . . . . . . . . . . . . . . . . . . . . . . . . . . . . . . 8,253 1,281
Depreciation and amortisation . . . . . . . . . . . . . . . . . . . . . . . . . . . . . . . . . . 55,451 41,707
7 Income Tax
The major components of income tax expense for the years ended 31 December 2005 and 2004 are:
Consolidated income statement
2005 2004USD’000 USD’000
Current income taxCurrent income tax charge . . . . . . . . . . . . . . . . . . . . . . . . . . . . . . . . . . . . 2,438 390Deferred income taxRelating to origination and reversal of temporary differences . . . . . . . . . . . 1,724 —
Income tax expense reported in the consolidated statement of income . . . . . 4,162 390
F-135
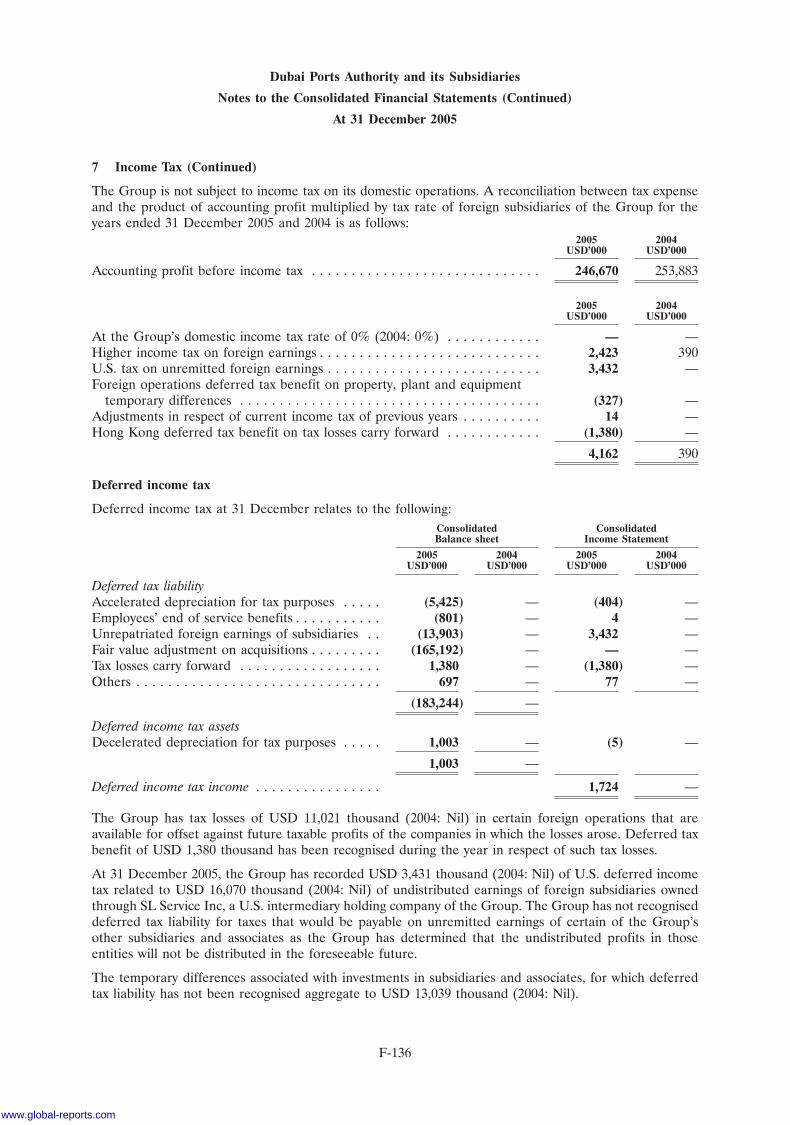
Dubai Ports Authority and its Subsidiaries
Notes to the Consolidated Financial Statements (Continued)
At 31 December 2005
7 Income Tax (Continued)
The Group is not subject to income tax on its domestic operations. A reconciliation between tax expenseand the product of accounting profit multiplied by tax rate of foreign subsidiaries of the Group for theyears ended 31 December 2005 and 2004 is as follows:
2005 2004USD’000 USD’000
Accounting profit before income tax . . . . . . . . . . . . . . . . . . . . . . . . . . . . . 246,670 253,883
2005 2004USD’000 USD’000
At the Group’s domestic income tax rate of 0% (2004: 0%) . . . . . . . . . . . . — —Higher income tax on foreign earnings . . . . . . . . . . . . . . . . . . . . . . . . . . . . 2,423 390U.S. tax on unremitted foreign earnings . . . . . . . . . . . . . . . . . . . . . . . . . . . 3,432 —Foreign operations deferred tax benefit on property, plant and equipment
temporary differences . . . . . . . . . . . . . . . . . . . . . . . . . . . . . . . . . . . . . . (327) —Adjustments in respect of current income tax of previous years . . . . . . . . . . 14 —Hong Kong deferred tax benefit on tax losses carry forward . . . . . . . . . . . . (1,380) —
4,162 390
Deferred income tax
Deferred income tax at 31 December relates to the following:Consolidated ConsolidatedBalance sheet Income Statement
2005 2004 2005 2004USD’000 USD’000 USD’000 USD’000
Deferred tax liabilityAccelerated depreciation for tax purposes . . . . . (5,425) — (404) —Employees’ end of service benefits . . . . . . . . . . . (801) — 4 —Unrepatriated foreign earnings of subsidiaries . . (13,903) — 3,432 —Fair value adjustment on acquisitions . . . . . . . . . (165,192) — — —Tax losses carry forward . . . . . . . . . . . . . . . . . . 1,380 — (1,380) —Others . . . . . . . . . . . . . . . . . . . . . . . . . . . . . . . 697 — 77 —
(183,244) —
Deferred income tax assetsDecelerated depreciation for tax purposes . . . . . 1,003 — (5) —
1,003 —
Deferred income tax income . . . . . . . . . . . . . . . . 1,724 —
The Group has tax losses of USD 11,021 thousand (2004: Nil) in certain foreign operations that areavailable for offset against future taxable profits of the companies in which the losses arose. Deferred taxbenefit of USD 1,380 thousand has been recognised during the year in respect of such tax losses.
At 31 December 2005, the Group has recorded USD 3,431 thousand (2004: Nil) of U.S. deferred incometax related to USD 16,070 thousand (2004: Nil) of undistributed earnings of foreign subsidiaries ownedthrough SL Service Inc, a U.S. intermediary holding company of the Group. The Group has not recogniseddeferred tax liability for taxes that would be payable on unremitted earnings of certain of the Group’sother subsidiaries and associates as the Group has determined that the undistributed profits in thoseentities will not be distributed in the foreseeable future.
The temporary differences associated with investments in subsidiaries and associates, for which deferredtax liability has not been recognised aggregate to USD 13,039 thousand (2004: Nil).
F-136
www.global-reports.com
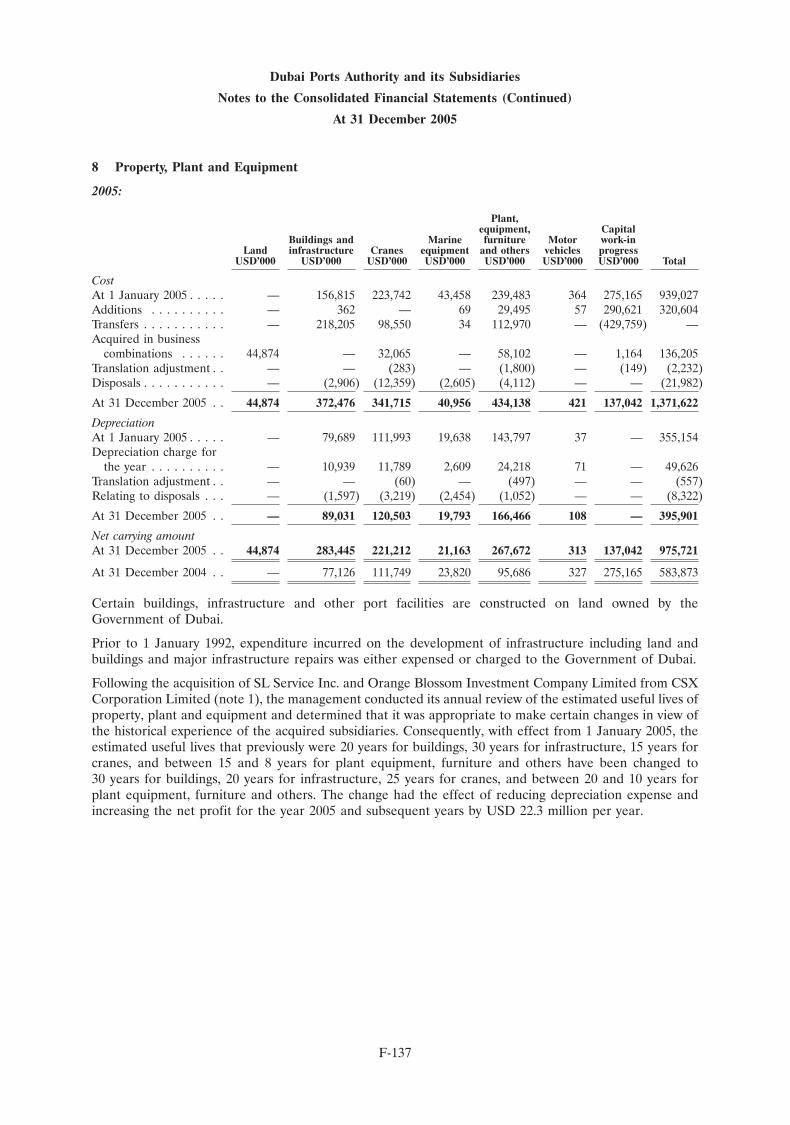
Dubai Ports Authority and its Subsidiaries
Notes to the Consolidated Financial Statements (Continued)
At 31 December 2005
8 Property, Plant and Equipment
2005:
Plant,equipment, Capital
Buildings and Marine furniture Motor work-inLand infrastructure Cranes equipment and others vehicles progress
USD’000 USD’000 USD’000 USD’000 USD’000 USD’000 USD’000 Total
CostAt 1 January 2005 . . . . . — 156,815 223,742 43,458 239,483 364 275,165 939,027Additions . . . . . . . . . . — 362 — 69 29,495 57 290,621 320,604Transfers . . . . . . . . . . . — 218,205 98,550 34 112,970 — (429,759) —Acquired in business
combinations . . . . . . 44,874 — 32,065 — 58,102 — 1,164 136,205Translation adjustment . . — — (283) — (1,800) — (149) (2,232)Disposals . . . . . . . . . . . — (2,906) (12,359) (2,605) (4,112) — — (21,982)
At 31 December 2005 . . 44,874 372,476 341,715 40,956 434,138 421 137,042 1,371,622
DepreciationAt 1 January 2005 . . . . . — 79,689 111,993 19,638 143,797 37 — 355,154Depreciation charge for
the year . . . . . . . . . . — 10,939 11,789 2,609 24,218 71 — 49,626Translation adjustment . . — — (60) — (497) — — (557)Relating to disposals . . . — (1,597) (3,219) (2,454) (1,052) — — (8,322)
At 31 December 2005 . . — 89,031 120,503 19,793 166,466 108 — 395,901
Net carrying amountAt 31 December 2005 . . 44,874 283,445 221,212 21,163 267,672 313 137,042 975,721
At 31 December 2004 . . — 77,126 111,749 23,820 95,686 327 275,165 583,873
Certain buildings, infrastructure and other port facilities are constructed on land owned by theGovernment of Dubai.
Prior to 1 January 1992, expenditure incurred on the development of infrastructure including land andbuildings and major infrastructure repairs was either expensed or charged to the Government of Dubai.
Following the acquisition of SL Service Inc. and Orange Blossom Investment Company Limited from CSXCorporation Limited (note 1), the management conducted its annual review of the estimated useful lives ofproperty, plant and equipment and determined that it was appropriate to make certain changes in view ofthe historical experience of the acquired subsidiaries. Consequently, with effect from 1 January 2005, theestimated useful lives that previously were 20 years for buildings, 30 years for infrastructure, 15 years forcranes, and between 15 and 8 years for plant equipment, furniture and others have been changed to30 years for buildings, 20 years for infrastructure, 25 years for cranes, and between 20 and 10 years forplant equipment, furniture and others. The change had the effect of reducing depreciation expense andincreasing the net profit for the year 2005 and subsequent years by USD 22.3 million per year.
F-137
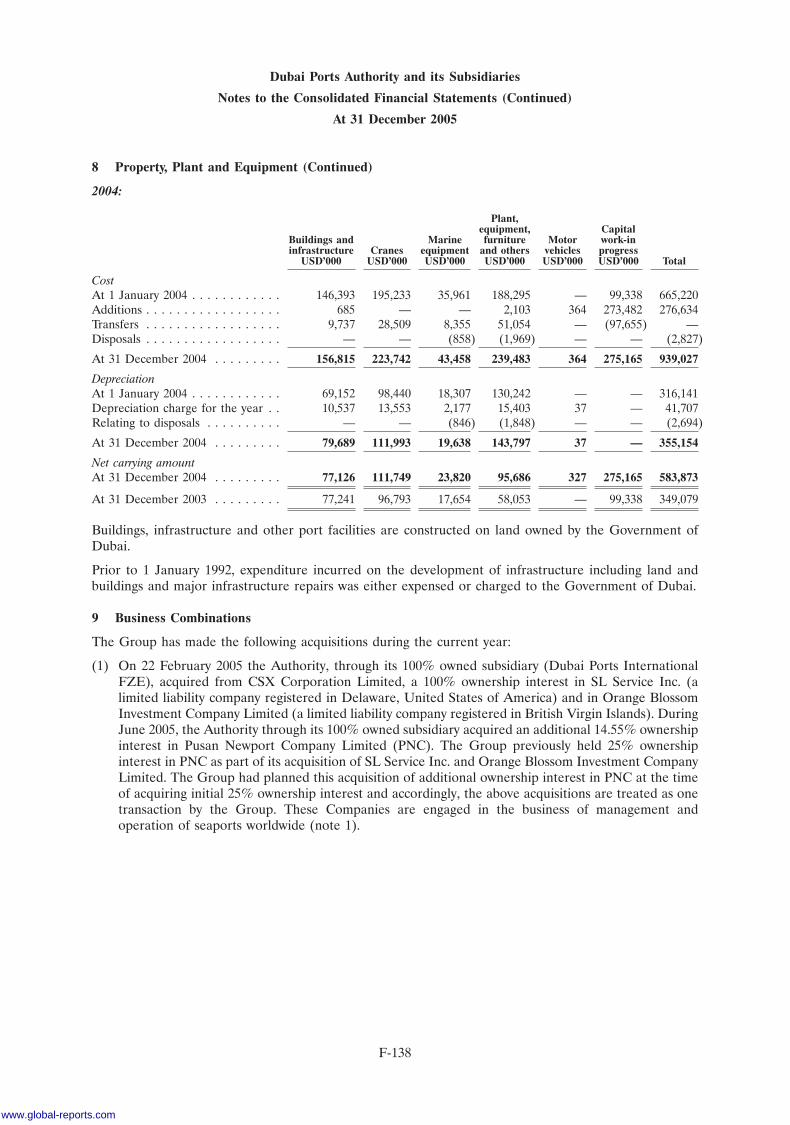
Dubai Ports Authority and its Subsidiaries
Notes to the Consolidated Financial Statements (Continued)
At 31 December 2005
8 Property, Plant and Equipment (Continued)
2004:
Plant,equipment, Capital
Buildings and Marine furniture Motor work-ininfrastructure Cranes equipment and others vehicles progress
USD’000 USD’000 USD’000 USD’000 USD’000 USD’000 Total
CostAt 1 January 2004 . . . . . . . . . . . . 146,393 195,233 35,961 188,295 — 99,338 665,220Additions . . . . . . . . . . . . . . . . . . 685 — — 2,103 364 273,482 276,634Transfers . . . . . . . . . . . . . . . . . . 9,737 28,509 8,355 51,054 — (97,655) —Disposals . . . . . . . . . . . . . . . . . . — — (858) (1,969) — — (2,827)
At 31 December 2004 . . . . . . . . . 156,815 223,742 43,458 239,483 364 275,165 939,027
DepreciationAt 1 January 2004 . . . . . . . . . . . . 69,152 98,440 18,307 130,242 — — 316,141Depreciation charge for the year . . 10,537 13,553 2,177 15,403 37 — 41,707Relating to disposals . . . . . . . . . . — — (846) (1,848) — — (2,694)
At 31 December 2004 . . . . . . . . . 79,689 111,993 19,638 143,797 37 — 355,154
Net carrying amountAt 31 December 2004 . . . . . . . . . 77,126 111,749 23,820 95,686 327 275,165 583,873
At 31 December 2003 . . . . . . . . . 77,241 96,793 17,654 58,053 — 99,338 349,079
Buildings, infrastructure and other port facilities are constructed on land owned by the Government ofDubai.
Prior to 1 January 1992, expenditure incurred on the development of infrastructure including land andbuildings and major infrastructure repairs was either expensed or charged to the Government of Dubai.
9 Business Combinations
The Group has made the following acquisitions during the current year:
(1) On 22 February 2005 the Authority, through its 100% owned subsidiary (Dubai Ports InternationalFZE), acquired from CSX Corporation Limited, a 100% ownership interest in SL Service Inc. (alimited liability company registered in Delaware, United States of America) and in Orange BlossomInvestment Company Limited (a limited liability company registered in British Virgin Islands). DuringJune 2005, the Authority through its 100% owned subsidiary acquired an additional 14.55% ownershipinterest in Pusan Newport Company Limited (PNC). The Group previously held 25% ownershipinterest in PNC as part of its acquisition of SL Service Inc. and Orange Blossom Investment CompanyLimited. The Group had planned this acquisition of additional ownership interest in PNC at the timeof acquiring initial 25% ownership interest and accordingly, the above acquisitions are treated as onetransaction by the Group. These Companies are engaged in the business of management andoperation of seaports worldwide (note 1).
F-138
www.global-reports.com
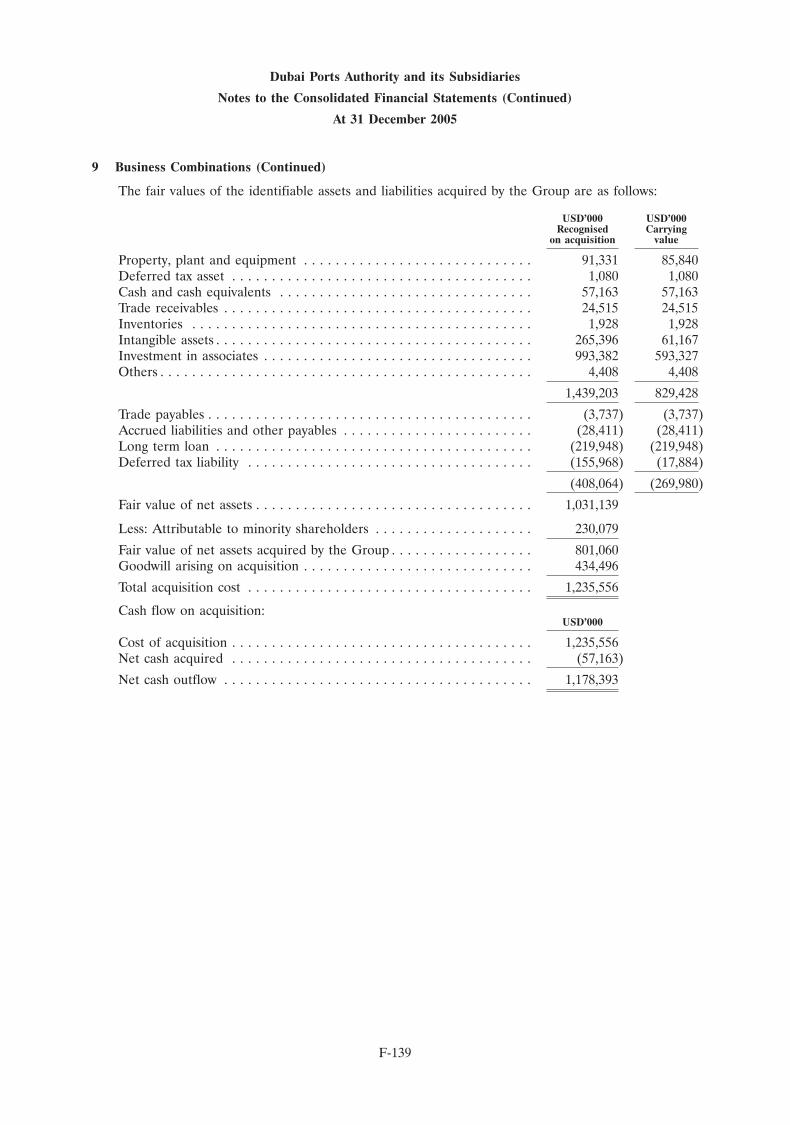
Dubai Ports Authority and its Subsidiaries
Notes to the Consolidated Financial Statements (Continued)
At 31 December 2005
9 Business Combinations (Continued)
The fair values of the identifiable assets and liabilities acquired by the Group are as follows:
USD’000 USD’000Recognised Carrying
on acquisition value
Property, plant and equipment . . . . . . . . . . . . . . . . . . . . . . . . . . . . . 91,331 85,840Deferred tax asset . . . . . . . . . . . . . . . . . . . . . . . . . . . . . . . . . . . . . . 1,080 1,080Cash and cash equivalents . . . . . . . . . . . . . . . . . . . . . . . . . . . . . . . . 57,163 57,163Trade receivables . . . . . . . . . . . . . . . . . . . . . . . . . . . . . . . . . . . . . . . 24,515 24,515Inventories . . . . . . . . . . . . . . . . . . . . . . . . . . . . . . . . . . . . . . . . . . . 1,928 1,928Intangible assets . . . . . . . . . . . . . . . . . . . . . . . . . . . . . . . . . . . . . . . . 265,396 61,167Investment in associates . . . . . . . . . . . . . . . . . . . . . . . . . . . . . . . . . . 993,382 593,327Others . . . . . . . . . . . . . . . . . . . . . . . . . . . . . . . . . . . . . . . . . . . . . . . 4,408 4,408
1,439,203 829,428
Trade payables . . . . . . . . . . . . . . . . . . . . . . . . . . . . . . . . . . . . . . . . . (3,737) (3,737)Accrued liabilities and other payables . . . . . . . . . . . . . . . . . . . . . . . . (28,411) (28,411)Long term loan . . . . . . . . . . . . . . . . . . . . . . . . . . . . . . . . . . . . . . . . (219,948) (219,948)Deferred tax liability . . . . . . . . . . . . . . . . . . . . . . . . . . . . . . . . . . . . (155,968) (17,884)
(408,064) (269,980)
Fair value of net assets . . . . . . . . . . . . . . . . . . . . . . . . . . . . . . . . . . . 1,031,139
Less: Attributable to minority shareholders . . . . . . . . . . . . . . . . . . . . 230,079
Fair value of net assets acquired by the Group . . . . . . . . . . . . . . . . . . 801,060Goodwill arising on acquisition . . . . . . . . . . . . . . . . . . . . . . . . . . . . . 434,496
Total acquisition cost . . . . . . . . . . . . . . . . . . . . . . . . . . . . . . . . . . . . 1,235,556
Cash flow on acquisition:USD’000
Cost of acquisition . . . . . . . . . . . . . . . . . . . . . . . . . . . . . . . . . . . . . . 1,235,556Net cash acquired . . . . . . . . . . . . . . . . . . . . . . . . . . . . . . . . . . . . . . (57,163)
Net cash outflow . . . . . . . . . . . . . . . . . . . . . . . . . . . . . . . . . . . . . . . 1,178,393
F-139
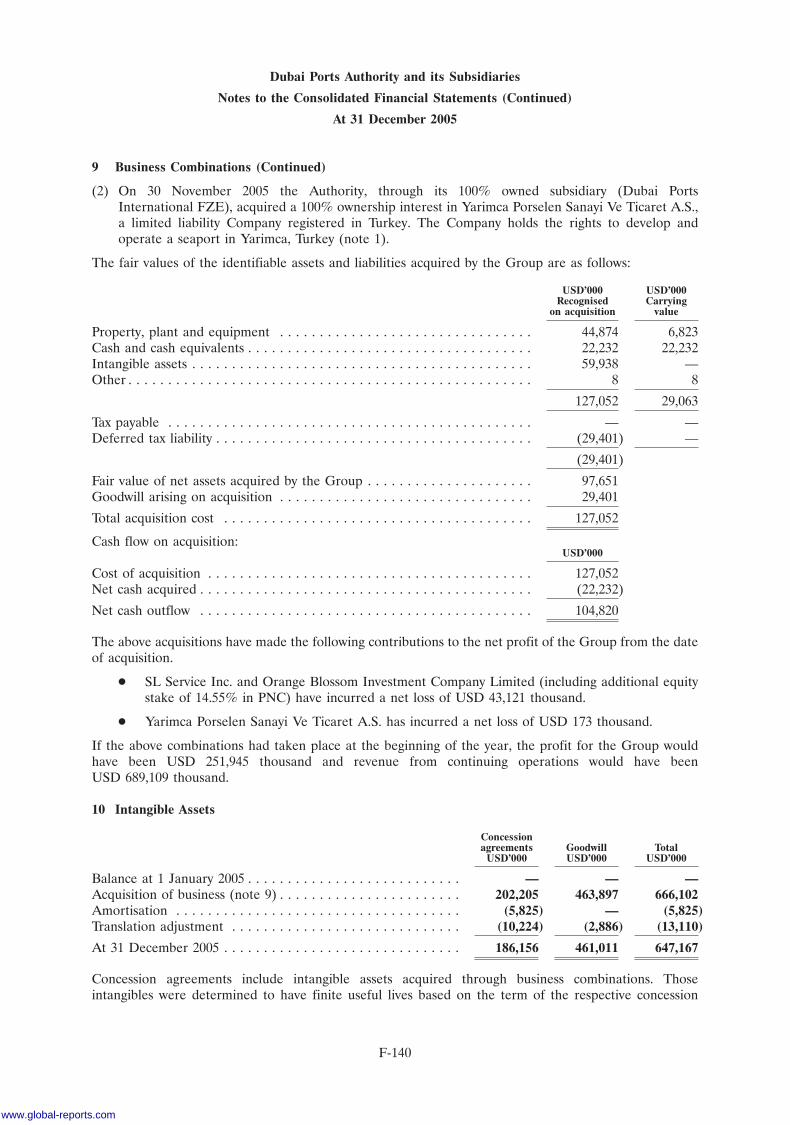
Dubai Ports Authority and its Subsidiaries
Notes to the Consolidated Financial Statements (Continued)
At 31 December 2005
9 Business Combinations (Continued)
(2) On 30 November 2005 the Authority, through its 100% owned subsidiary (Dubai PortsInternational FZE), acquired a 100% ownership interest in Yarimca Porselen Sanayi Ve Ticaret A.S.,a limited liability Company registered in Turkey. The Company holds the rights to develop andoperate a seaport in Yarimca, Turkey (note 1).
The fair values of the identifiable assets and liabilities acquired by the Group are as follows:
USD’000 USD’000Recognised Carrying
on acquisition value
Property, plant and equipment . . . . . . . . . . . . . . . . . . . . . . . . . . . . . . . . 44,874 6,823Cash and cash equivalents . . . . . . . . . . . . . . . . . . . . . . . . . . . . . . . . . . . . 22,232 22,232Intangible assets . . . . . . . . . . . . . . . . . . . . . . . . . . . . . . . . . . . . . . . . . . . 59,938 —Other . . . . . . . . . . . . . . . . . . . . . . . . . . . . . . . . . . . . . . . . . . . . . . . . . . . 8 8
127,052 29,063
Tax payable . . . . . . . . . . . . . . . . . . . . . . . . . . . . . . . . . . . . . . . . . . . . . . — —Deferred tax liability . . . . . . . . . . . . . . . . . . . . . . . . . . . . . . . . . . . . . . . . (29,401) —
(29,401)
Fair value of net assets acquired by the Group . . . . . . . . . . . . . . . . . . . . . 97,651Goodwill arising on acquisition . . . . . . . . . . . . . . . . . . . . . . . . . . . . . . . . 29,401
Total acquisition cost . . . . . . . . . . . . . . . . . . . . . . . . . . . . . . . . . . . . . . . 127,052
Cash flow on acquisition:USD’000
Cost of acquisition . . . . . . . . . . . . . . . . . . . . . . . . . . . . . . . . . . . . . . . . . 127,052Net cash acquired . . . . . . . . . . . . . . . . . . . . . . . . . . . . . . . . . . . . . . . . . . (22,232)
Net cash outflow . . . . . . . . . . . . . . . . . . . . . . . . . . . . . . . . . . . . . . . . . . 104,820
The above acquisitions have made the following contributions to the net profit of the Group from the dateof acquisition.
� SL Service Inc. and Orange Blossom Investment Company Limited (including additional equitystake of 14.55% in PNC) have incurred a net loss of USD 43,121 thousand.
� Yarimca Porselen Sanayi Ve Ticaret A.S. has incurred a net loss of USD 173 thousand.
If the above combinations had taken place at the beginning of the year, the profit for the Group wouldhave been USD 251,945 thousand and revenue from continuing operations would have beenUSD 689,109 thousand.
10 Intangible Assets
Concessionagreements Goodwill Total
USD’000 USD’000 USD’000
Balance at 1 January 2005 . . . . . . . . . . . . . . . . . . . . . . . . . . . — — —Acquisition of business (note 9) . . . . . . . . . . . . . . . . . . . . . . . 202,205 463,897 666,102Amortisation . . . . . . . . . . . . . . . . . . . . . . . . . . . . . . . . . . . . (5,825) — (5,825)Translation adjustment . . . . . . . . . . . . . . . . . . . . . . . . . . . . . (10,224) (2,886) (13,110)
At 31 December 2005 . . . . . . . . . . . . . . . . . . . . . . . . . . . . . . 186,156 461,011 647,167
Concession agreements include intangible assets acquired through business combinations. Thoseintangibles were determined to have finite useful lives based on the term of the respective concession
F-140
www.global-reports.com
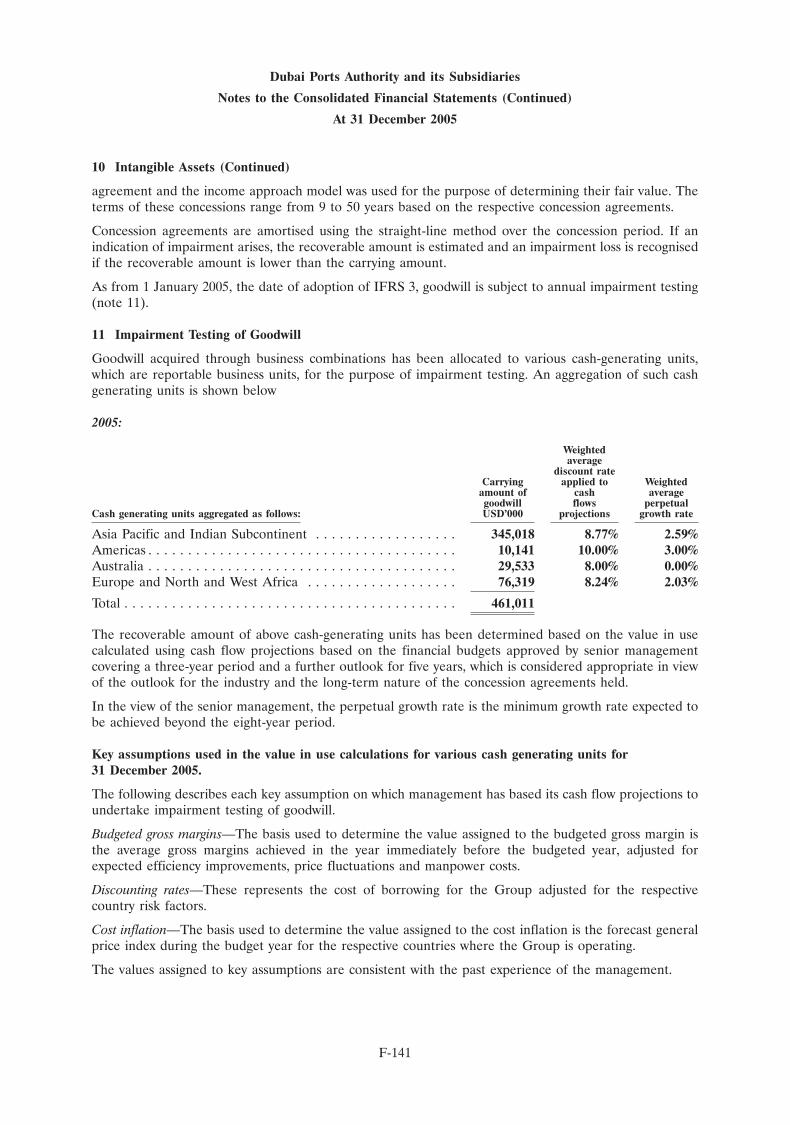
Dubai Ports Authority and its Subsidiaries
Notes to the Consolidated Financial Statements (Continued)
At 31 December 2005
10 Intangible Assets (Continued)
agreement and the income approach model was used for the purpose of determining their fair value. Theterms of these concessions range from 9 to 50 years based on the respective concession agreements.
Concession agreements are amortised using the straight-line method over the concession period. If anindication of impairment arises, the recoverable amount is estimated and an impairment loss is recognisedif the recoverable amount is lower than the carrying amount.
As from 1 January 2005, the date of adoption of IFRS 3, goodwill is subject to annual impairment testing(note 11).
11 Impairment Testing of Goodwill
Goodwill acquired through business combinations has been allocated to various cash-generating units,which are reportable business units, for the purpose of impairment testing. An aggregation of such cashgenerating units is shown below
2005:
Weightedaverage
discount rateCarrying applied to Weighted
amount of cash averagegoodwill flows perpetual
Cash generating units aggregated as follows: USD’000 projections growth rate
Asia Pacific and Indian Subcontinent . . . . . . . . . . . . . . . . . . 345,018 8.77% 2.59%Americas . . . . . . . . . . . . . . . . . . . . . . . . . . . . . . . . . . . . . . . 10,141 10.00% 3.00%Australia . . . . . . . . . . . . . . . . . . . . . . . . . . . . . . . . . . . . . . . 29,533 8.00% 0.00%Europe and North and West Africa . . . . . . . . . . . . . . . . . . . 76,319 8.24% 2.03%
Total . . . . . . . . . . . . . . . . . . . . . . . . . . . . . . . . . . . . . . . . . . 461,011
The recoverable amount of above cash-generating units has been determined based on the value in usecalculated using cash flow projections based on the financial budgets approved by senior managementcovering a three-year period and a further outlook for five years, which is considered appropriate in viewof the outlook for the industry and the long-term nature of the concession agreements held.
In the view of the senior management, the perpetual growth rate is the minimum growth rate expected tobe achieved beyond the eight-year period.
Key assumptions used in the value in use calculations for various cash generating units for31 December 2005.
The following describes each key assumption on which management has based its cash flow projections toundertake impairment testing of goodwill.
Budgeted gross margins—The basis used to determine the value assigned to the budgeted gross margin isthe average gross margins achieved in the year immediately before the budgeted year, adjusted forexpected efficiency improvements, price fluctuations and manpower costs.
Discounting rates—These represents the cost of borrowing for the Group adjusted for the respectivecountry risk factors.
Cost inflation—The basis used to determine the value assigned to the cost inflation is the forecast generalprice index during the budget year for the respective countries where the Group is operating.
The values assigned to key assumptions are consistent with the past experience of the management.
F-141
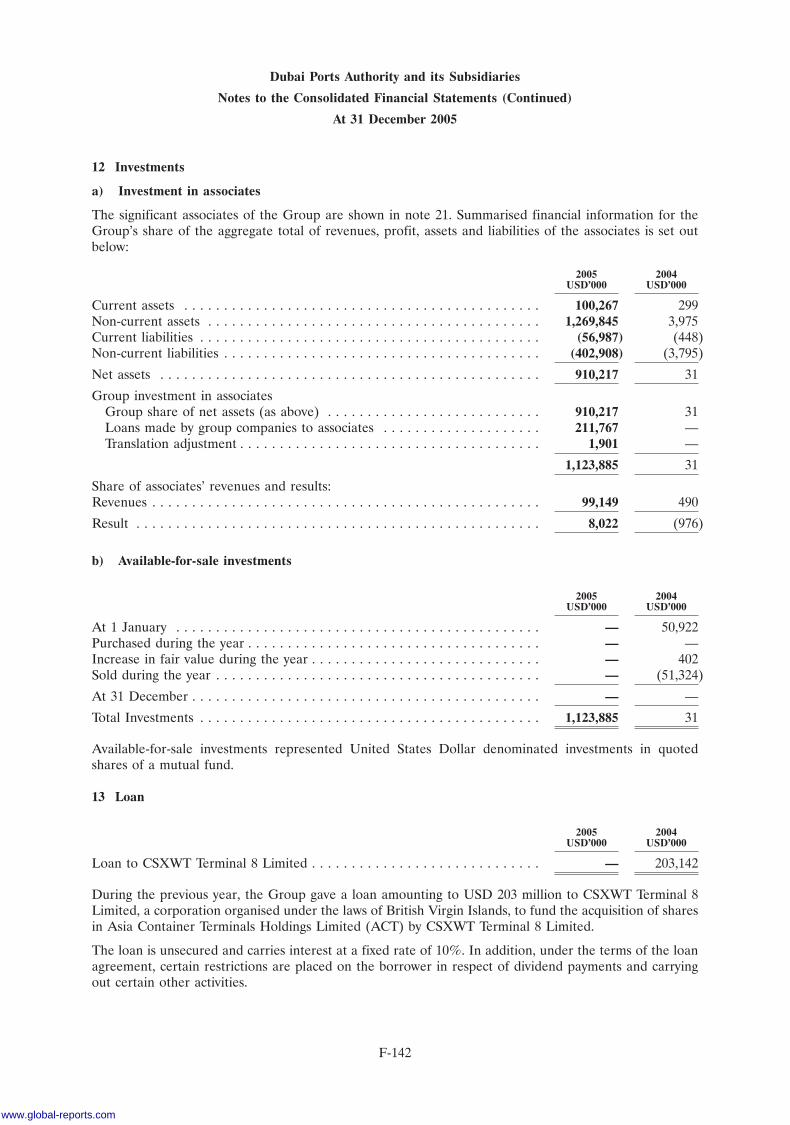
Dubai Ports Authority and its Subsidiaries
Notes to the Consolidated Financial Statements (Continued)
At 31 December 2005
12 Investments
a) Investment in associates
The significant associates of the Group are shown in note 21. Summarised financial information for theGroup’s share of the aggregate total of revenues, profit, assets and liabilities of the associates is set outbelow:
2005 2004USD’000 USD’000
Current assets . . . . . . . . . . . . . . . . . . . . . . . . . . . . . . . . . . . . . . . . . . . . . 100,267 299Non-current assets . . . . . . . . . . . . . . . . . . . . . . . . . . . . . . . . . . . . . . . . . . 1,269,845 3,975Current liabilities . . . . . . . . . . . . . . . . . . . . . . . . . . . . . . . . . . . . . . . . . . . (56,987) (448)Non-current liabilities . . . . . . . . . . . . . . . . . . . . . . . . . . . . . . . . . . . . . . . . (402,908) (3,795)
Net assets . . . . . . . . . . . . . . . . . . . . . . . . . . . . . . . . . . . . . . . . . . . . . . . . 910,217 31
Group investment in associatesGroup share of net assets (as above) . . . . . . . . . . . . . . . . . . . . . . . . . . . 910,217 31Loans made by group companies to associates . . . . . . . . . . . . . . . . . . . . 211,767 —Translation adjustment . . . . . . . . . . . . . . . . . . . . . . . . . . . . . . . . . . . . . . 1,901 —
1,123,885 31
Share of associates’ revenues and results:Revenues . . . . . . . . . . . . . . . . . . . . . . . . . . . . . . . . . . . . . . . . . . . . . . . . . 99,149 490
Result . . . . . . . . . . . . . . . . . . . . . . . . . . . . . . . . . . . . . . . . . . . . . . . . . . . 8,022 (976)
b) Available-for-sale investments
2005 2004USD’000 USD’000
At 1 January . . . . . . . . . . . . . . . . . . . . . . . . . . . . . . . . . . . . . . . . . . . . . . — 50,922Purchased during the year . . . . . . . . . . . . . . . . . . . . . . . . . . . . . . . . . . . . . — —Increase in fair value during the year . . . . . . . . . . . . . . . . . . . . . . . . . . . . . — 402Sold during the year . . . . . . . . . . . . . . . . . . . . . . . . . . . . . . . . . . . . . . . . . — (51,324)
At 31 December . . . . . . . . . . . . . . . . . . . . . . . . . . . . . . . . . . . . . . . . . . . . — —
Total Investments . . . . . . . . . . . . . . . . . . . . . . . . . . . . . . . . . . . . . . . . . . . 1,123,885 31
Available-for-sale investments represented United States Dollar denominated investments in quotedshares of a mutual fund.
13 Loan
2005 2004USD’000 USD’000
Loan to CSXWT Terminal 8 Limited . . . . . . . . . . . . . . . . . . . . . . . . . . . . . — 203,142
During the previous year, the Group gave a loan amounting to USD 203 million to CSXWT Terminal 8Limited, a corporation organised under the laws of British Virgin Islands, to fund the acquisition of sharesin Asia Container Terminals Holdings Limited (ACT) by CSXWT Terminal 8 Limited.
The loan is unsecured and carries interest at a fixed rate of 10%. In addition, under the terms of the loanagreement, certain restrictions are placed on the borrower in respect of dividend payments and carryingout certain other activities.
F-142
www.global-reports.com
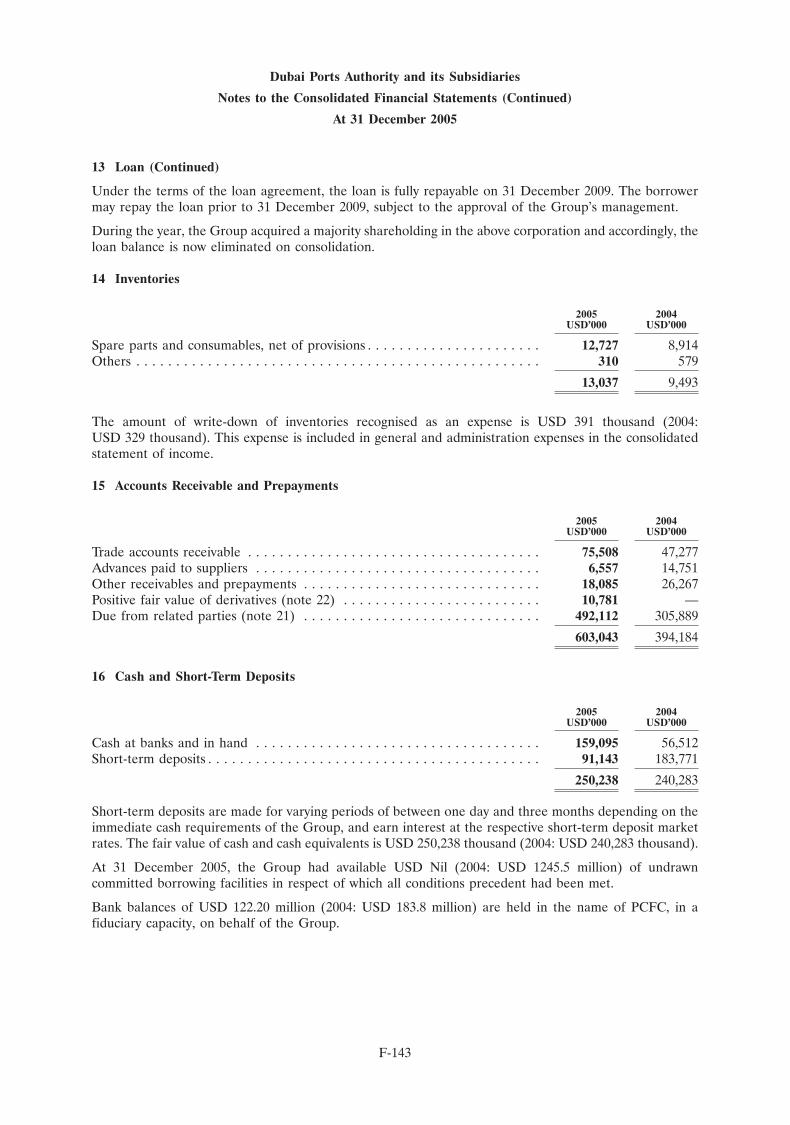
Dubai Ports Authority and its Subsidiaries
Notes to the Consolidated Financial Statements (Continued)
At 31 December 2005
13 Loan (Continued)
Under the terms of the loan agreement, the loan is fully repayable on 31 December 2009. The borrowermay repay the loan prior to 31 December 2009, subject to the approval of the Group’s management.
During the year, the Group acquired a majority shareholding in the above corporation and accordingly, theloan balance is now eliminated on consolidation.
14 Inventories
2005 2004USD’000 USD’000
Spare parts and consumables, net of provisions . . . . . . . . . . . . . . . . . . . . . . 12,727 8,914Others . . . . . . . . . . . . . . . . . . . . . . . . . . . . . . . . . . . . . . . . . . . . . . . . . . . 310 579
13,037 9,493
The amount of write-down of inventories recognised as an expense is USD 391 thousand (2004:USD 329 thousand). This expense is included in general and administration expenses in the consolidatedstatement of income.
15 Accounts Receivable and Prepayments
2005 2004USD’000 USD’000
Trade accounts receivable . . . . . . . . . . . . . . . . . . . . . . . . . . . . . . . . . . . . . 75,508 47,277Advances paid to suppliers . . . . . . . . . . . . . . . . . . . . . . . . . . . . . . . . . . . . 6,557 14,751Other receivables and prepayments . . . . . . . . . . . . . . . . . . . . . . . . . . . . . . 18,085 26,267Positive fair value of derivatives (note 22) . . . . . . . . . . . . . . . . . . . . . . . . . 10,781 —Due from related parties (note 21) . . . . . . . . . . . . . . . . . . . . . . . . . . . . . . 492,112 305,889
603,043 394,184
16 Cash and Short-Term Deposits
2005 2004USD’000 USD’000
Cash at banks and in hand . . . . . . . . . . . . . . . . . . . . . . . . . . . . . . . . . . . . 159,095 56,512Short-term deposits . . . . . . . . . . . . . . . . . . . . . . . . . . . . . . . . . . . . . . . . . . 91,143 183,771
250,238 240,283
Short-term deposits are made for varying periods of between one day and three months depending on theimmediate cash requirements of the Group, and earn interest at the respective short-term deposit marketrates. The fair value of cash and cash equivalents is USD 250,238 thousand (2004: USD 240,283 thousand).
At 31 December 2005, the Group had available USD Nil (2004: USD 1245.5 million) of undrawncommitted borrowing facilities in respect of which all conditions precedent had been met.
Bank balances of USD 122.20 million (2004: USD 183.8 million) are held in the name of PCFC, in afiduciary capacity, on behalf of the Group.
F-143
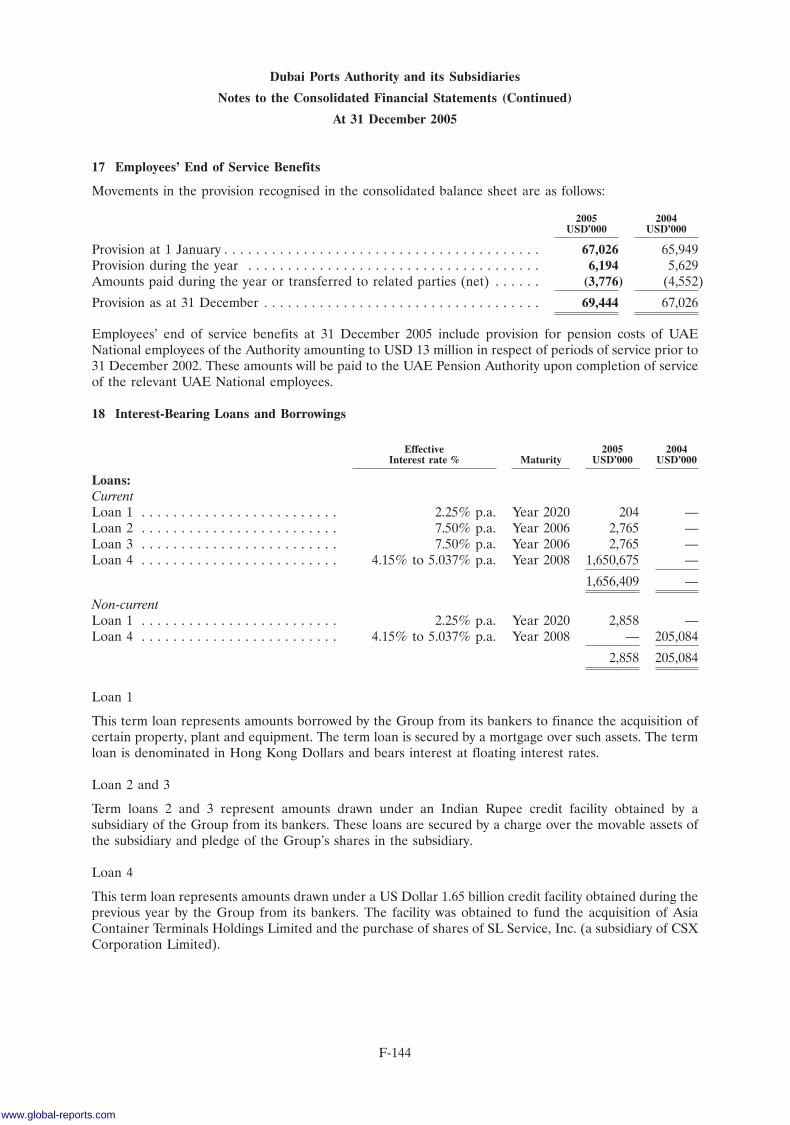
Dubai Ports Authority and its Subsidiaries
Notes to the Consolidated Financial Statements (Continued)
At 31 December 2005
17 Employees’ End of Service Benefits
Movements in the provision recognised in the consolidated balance sheet are as follows:
2005 2004USD’000 USD’000
Provision at 1 January . . . . . . . . . . . . . . . . . . . . . . . . . . . . . . . . . . . . . . . . 67,026 65,949Provision during the year . . . . . . . . . . . . . . . . . . . . . . . . . . . . . . . . . . . . . 6,194 5,629Amounts paid during the year or transferred to related parties (net) . . . . . . (3,776) (4,552)
Provision as at 31 December . . . . . . . . . . . . . . . . . . . . . . . . . . . . . . . . . . . 69,444 67,026
Employees’ end of service benefits at 31 December 2005 include provision for pension costs of UAENational employees of the Authority amounting to USD 13 million in respect of periods of service prior to31 December 2002. These amounts will be paid to the UAE Pension Authority upon completion of serviceof the relevant UAE National employees.
18 Interest-Bearing Loans and Borrowings
Effective 2005 2004Interest rate % Maturity USD’000 USD’000
Loans:CurrentLoan 1 . . . . . . . . . . . . . . . . . . . . . . . . . 2.25% p.a. Year 2020 204 —Loan 2 . . . . . . . . . . . . . . . . . . . . . . . . . 7.50% p.a. Year 2006 2,765 —Loan 3 . . . . . . . . . . . . . . . . . . . . . . . . . 7.50% p.a. Year 2006 2,765 —Loan 4 . . . . . . . . . . . . . . . . . . . . . . . . . 4.15% to 5.037% p.a. Year 2008 1,650,675 —
1,656,409 —
Non-currentLoan 1 . . . . . . . . . . . . . . . . . . . . . . . . . 2.25% p.a. Year 2020 2,858 —Loan 4 . . . . . . . . . . . . . . . . . . . . . . . . . 4.15% to 5.037% p.a. Year 2008 — 205,084
2,858 205,084
Loan 1
This term loan represents amounts borrowed by the Group from its bankers to finance the acquisition ofcertain property, plant and equipment. The term loan is secured by a mortgage over such assets. The termloan is denominated in Hong Kong Dollars and bears interest at floating interest rates.
Loan 2 and 3
Term loans 2 and 3 represent amounts drawn under an Indian Rupee credit facility obtained by asubsidiary of the Group from its bankers. These loans are secured by a charge over the movable assets ofthe subsidiary and pledge of the Group’s shares in the subsidiary.
Loan 4
This term loan represents amounts drawn under a US Dollar 1.65 billion credit facility obtained during theprevious year by the Group from its bankers. The facility was obtained to fund the acquisition of AsiaContainer Terminals Holdings Limited and the purchase of shares of SL Service, Inc. (a subsidiary of CSXCorporation Limited).
F-144
www.global-reports.com
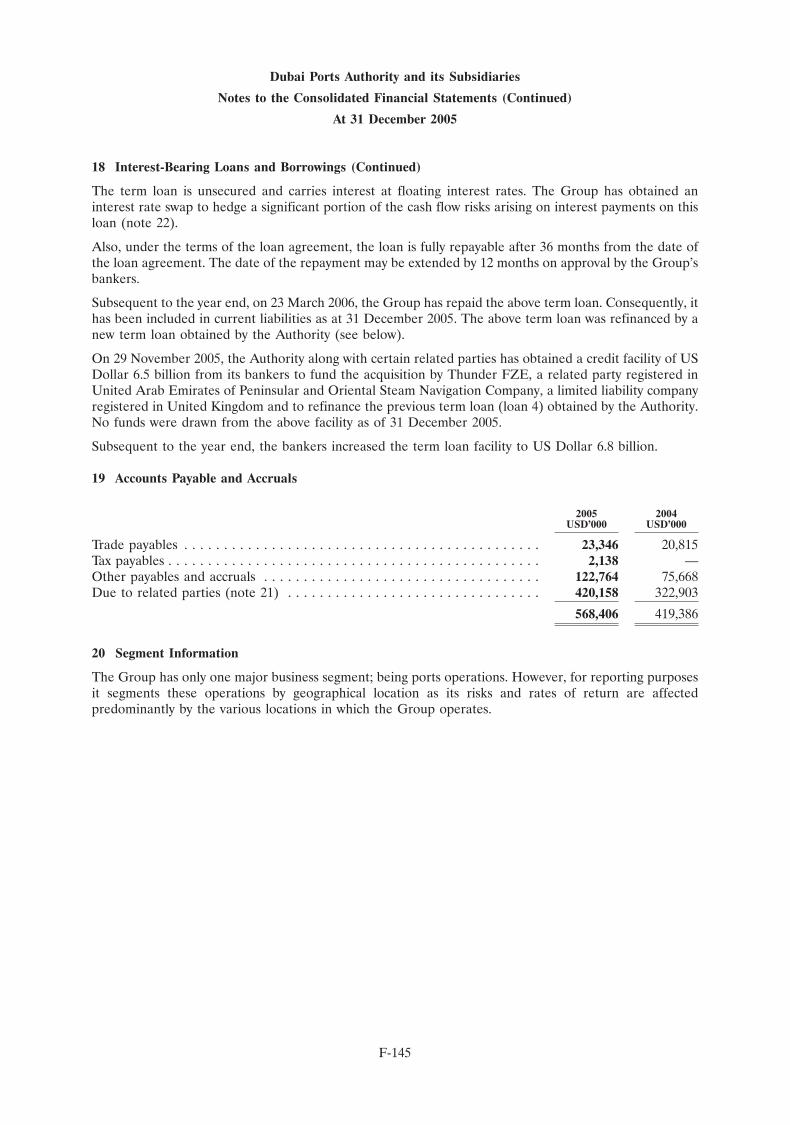
Dubai Ports Authority and its Subsidiaries
Notes to the Consolidated Financial Statements (Continued)
At 31 December 2005
18 Interest-Bearing Loans and Borrowings (Continued)
The term loan is unsecured and carries interest at floating interest rates. The Group has obtained aninterest rate swap to hedge a significant portion of the cash flow risks arising on interest payments on thisloan (note 22).
Also, under the terms of the loan agreement, the loan is fully repayable after 36 months from the date ofthe loan agreement. The date of the repayment may be extended by 12 months on approval by the Group’sbankers.
Subsequent to the year end, on 23 March 2006, the Group has repaid the above term loan. Consequently, ithas been included in current liabilities as at 31 December 2005. The above term loan was refinanced by anew term loan obtained by the Authority (see below).
On 29 November 2005, the Authority along with certain related parties has obtained a credit facility of USDollar 6.5 billion from its bankers to fund the acquisition by Thunder FZE, a related party registered inUnited Arab Emirates of Peninsular and Oriental Steam Navigation Company, a limited liability companyregistered in United Kingdom and to refinance the previous term loan (loan 4) obtained by the Authority.No funds were drawn from the above facility as of 31 December 2005.
Subsequent to the year end, the bankers increased the term loan facility to US Dollar 6.8 billion.
19 Accounts Payable and Accruals
2005 2004USD’000 USD’000
Trade payables . . . . . . . . . . . . . . . . . . . . . . . . . . . . . . . . . . . . . . . . . . . . . 23,346 20,815Tax payables . . . . . . . . . . . . . . . . . . . . . . . . . . . . . . . . . . . . . . . . . . . . . . . 2,138 —Other payables and accruals . . . . . . . . . . . . . . . . . . . . . . . . . . . . . . . . . . . 122,764 75,668Due to related parties (note 21) . . . . . . . . . . . . . . . . . . . . . . . . . . . . . . . . 420,158 322,903
568,406 419,386
20 Segment Information
The Group has only one major business segment; being ports operations. However, for reporting purposesit segments these operations by geographical location as its risks and rates of return are affectedpredominantly by the various locations in which the Group operates.
F-145
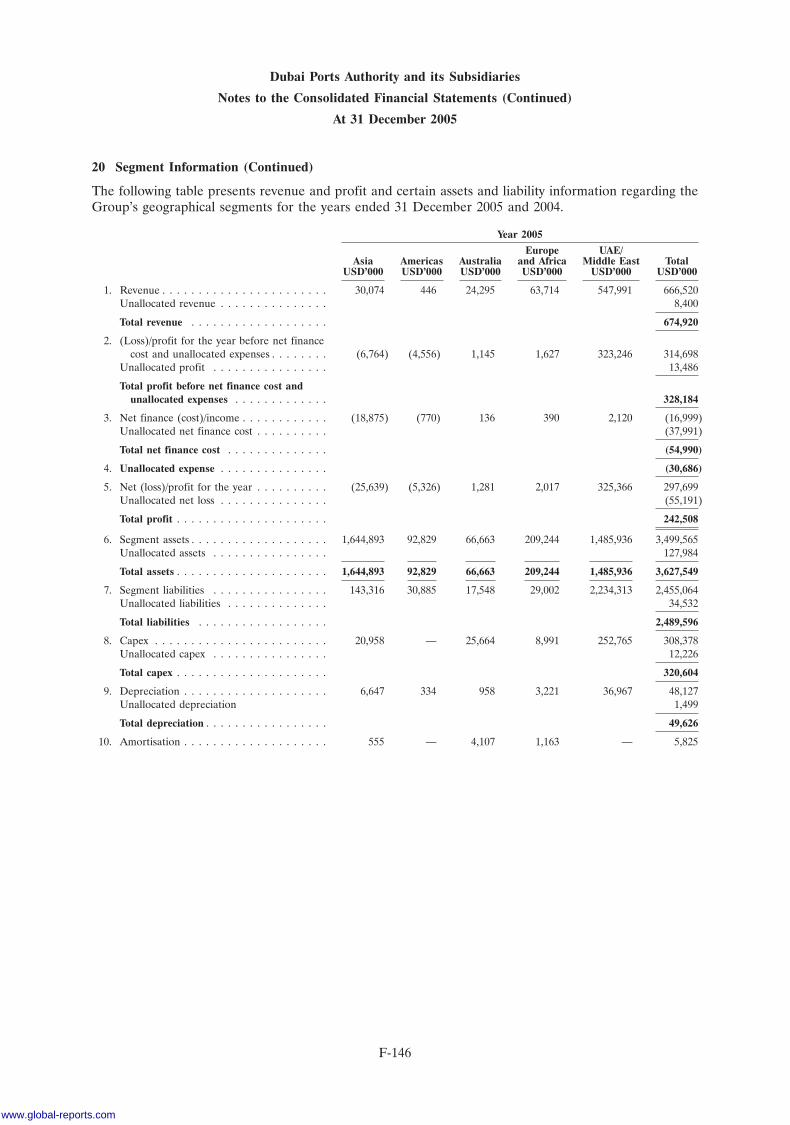
Dubai Ports Authority and its Subsidiaries
Notes to the Consolidated Financial Statements (Continued)
At 31 December 2005
20 Segment Information (Continued)
The following table presents revenue and profit and certain assets and liability information regarding theGroup’s geographical segments for the years ended 31 December 2005 and 2004.
Year 2005
Europe UAE/Asia Americas Australia and Africa Middle East Total
USD’000 USD’000 USD’000 USD’000 USD’000 USD’000
1. Revenue . . . . . . . . . . . . . . . . . . . . . . . 30,074 446 24,295 63,714 547,991 666,520Unallocated revenue . . . . . . . . . . . . . . . 8,400
Total revenue . . . . . . . . . . . . . . . . . . . 674,920
2. (Loss)/profit for the year before net financecost and unallocated expenses . . . . . . . . (6,764) (4,556) 1,145 1,627 323,246 314,698
Unallocated profit . . . . . . . . . . . . . . . . 13,486
Total profit before net finance cost andunallocated expenses . . . . . . . . . . . . . 328,184
3. Net finance (cost)/income . . . . . . . . . . . . (18,875) (770) 136 390 2,120 (16,999)Unallocated net finance cost . . . . . . . . . . (37,991)
Total net finance cost . . . . . . . . . . . . . . (54,990)
4. Unallocated expense . . . . . . . . . . . . . . . (30,686)
5. Net (loss)/profit for the year . . . . . . . . . . (25,639) (5,326) 1,281 2,017 325,366 297,699Unallocated net loss . . . . . . . . . . . . . . . (55,191)
Total profit . . . . . . . . . . . . . . . . . . . . . 242,508
6. Segment assets . . . . . . . . . . . . . . . . . . . 1,644,893 92,829 66,663 209,244 1,485,936 3,499,565Unallocated assets . . . . . . . . . . . . . . . . 127,984
Total assets . . . . . . . . . . . . . . . . . . . . . 1,644,893 92,829 66,663 209,244 1,485,936 3,627,549
7. Segment liabilities . . . . . . . . . . . . . . . . 143,316 30,885 17,548 29,002 2,234,313 2,455,064Unallocated liabilities . . . . . . . . . . . . . . 34,532
Total liabilities . . . . . . . . . . . . . . . . . . 2,489,596
8. Capex . . . . . . . . . . . . . . . . . . . . . . . . 20,958 — 25,664 8,991 252,765 308,378Unallocated capex . . . . . . . . . . . . . . . . 12,226
Total capex . . . . . . . . . . . . . . . . . . . . . 320,604
9. Depreciation . . . . . . . . . . . . . . . . . . . . 6,647 334 958 3,221 36,967 48,127Unallocated depreciation 1,499
Total depreciation . . . . . . . . . . . . . . . . . 49,626
10. Amortisation . . . . . . . . . . . . . . . . . . . . 555 — 4,107 1,163 — 5,825
F-146
www.global-reports.com
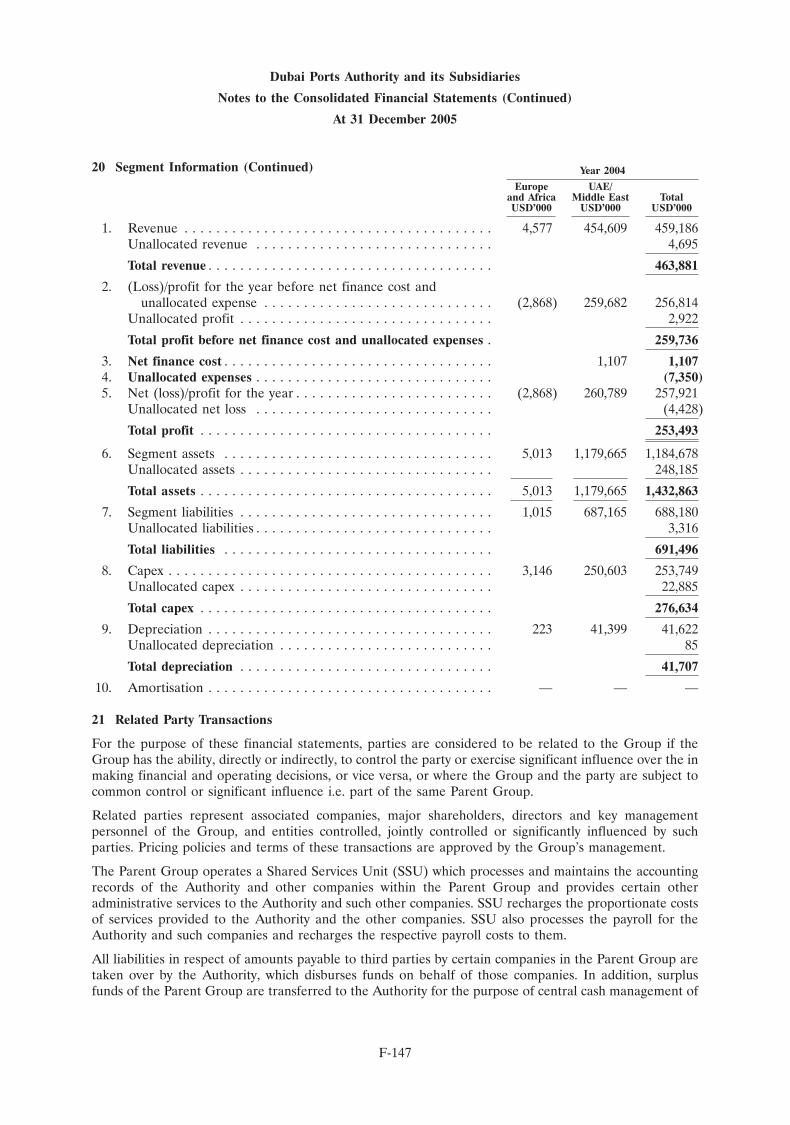
Dubai Ports Authority and its Subsidiaries
Notes to the Consolidated Financial Statements (Continued)
At 31 December 2005
20 Segment Information (Continued) Year 2004
Europe UAE/and Africa Middle East TotalUSD’000 USD’000 USD’000
1. Revenue . . . . . . . . . . . . . . . . . . . . . . . . . . . . . . . . . . . . . . . 4,577 454,609 459,186Unallocated revenue . . . . . . . . . . . . . . . . . . . . . . . . . . . . . . 4,695
Total revenue . . . . . . . . . . . . . . . . . . . . . . . . . . . . . . . . . . . . 463,881
2. (Loss)/profit for the year before net finance cost andunallocated expense . . . . . . . . . . . . . . . . . . . . . . . . . . . . . (2,868) 259,682 256,814
Unallocated profit . . . . . . . . . . . . . . . . . . . . . . . . . . . . . . . . 2,922
Total profit before net finance cost and unallocated expenses . 259,736
3. Net finance cost . . . . . . . . . . . . . . . . . . . . . . . . . . . . . . . . . . 1,107 1,1074. Unallocated expenses . . . . . . . . . . . . . . . . . . . . . . . . . . . . . . (7,350)5. Net (loss)/profit for the year . . . . . . . . . . . . . . . . . . . . . . . . . (2,868) 260,789 257,921
Unallocated net loss . . . . . . . . . . . . . . . . . . . . . . . . . . . . . . (4,428)
Total profit . . . . . . . . . . . . . . . . . . . . . . . . . . . . . . . . . . . . . 253,493
6. Segment assets . . . . . . . . . . . . . . . . . . . . . . . . . . . . . . . . . . 5,013 1,179,665 1,184,678Unallocated assets . . . . . . . . . . . . . . . . . . . . . . . . . . . . . . . . 248,185
Total assets . . . . . . . . . . . . . . . . . . . . . . . . . . . . . . . . . . . . . 5,013 1,179,665 1,432,863
7. Segment liabilities . . . . . . . . . . . . . . . . . . . . . . . . . . . . . . . . 1,015 687,165 688,180Unallocated liabilities . . . . . . . . . . . . . . . . . . . . . . . . . . . . . . 3,316
Total liabilities . . . . . . . . . . . . . . . . . . . . . . . . . . . . . . . . . . 691,496
8. Capex . . . . . . . . . . . . . . . . . . . . . . . . . . . . . . . . . . . . . . . . . 3,146 250,603 253,749Unallocated capex . . . . . . . . . . . . . . . . . . . . . . . . . . . . . . . . 22,885
Total capex . . . . . . . . . . . . . . . . . . . . . . . . . . . . . . . . . . . . . 276,634
9. Depreciation . . . . . . . . . . . . . . . . . . . . . . . . . . . . . . . . . . . . 223 41,399 41,622Unallocated depreciation . . . . . . . . . . . . . . . . . . . . . . . . . . . 85
Total depreciation . . . . . . . . . . . . . . . . . . . . . . . . . . . . . . . . 41,707
10. Amortisation . . . . . . . . . . . . . . . . . . . . . . . . . . . . . . . . . . . . — — —
21 Related Party Transactions
For the purpose of these financial statements, parties are considered to be related to the Group if theGroup has the ability, directly or indirectly, to control the party or exercise significant influence over the inmaking financial and operating decisions, or vice versa, or where the Group and the party are subject tocommon control or significant influence i.e. part of the same Parent Group.
Related parties represent associated companies, major shareholders, directors and key managementpersonnel of the Group, and entities controlled, jointly controlled or significantly influenced by suchparties. Pricing policies and terms of these transactions are approved by the Group’s management.
The Parent Group operates a Shared Services Unit (SSU) which processes and maintains the accountingrecords of the Authority and other companies within the Parent Group and provides certain otheradministrative services to the Authority and such other companies. SSU recharges the proportionate costsof services provided to the Authority and the other companies. SSU also processes the payroll for theAuthority and such companies and recharges the respective payroll costs to them.
All liabilities in respect of amounts payable to third parties by certain companies in the Parent Group aretaken over by the Authority, which disburses funds on behalf of those companies. In addition, surplusfunds of the Parent Group are transferred to the Authority for the purpose of central cash management of
F-147
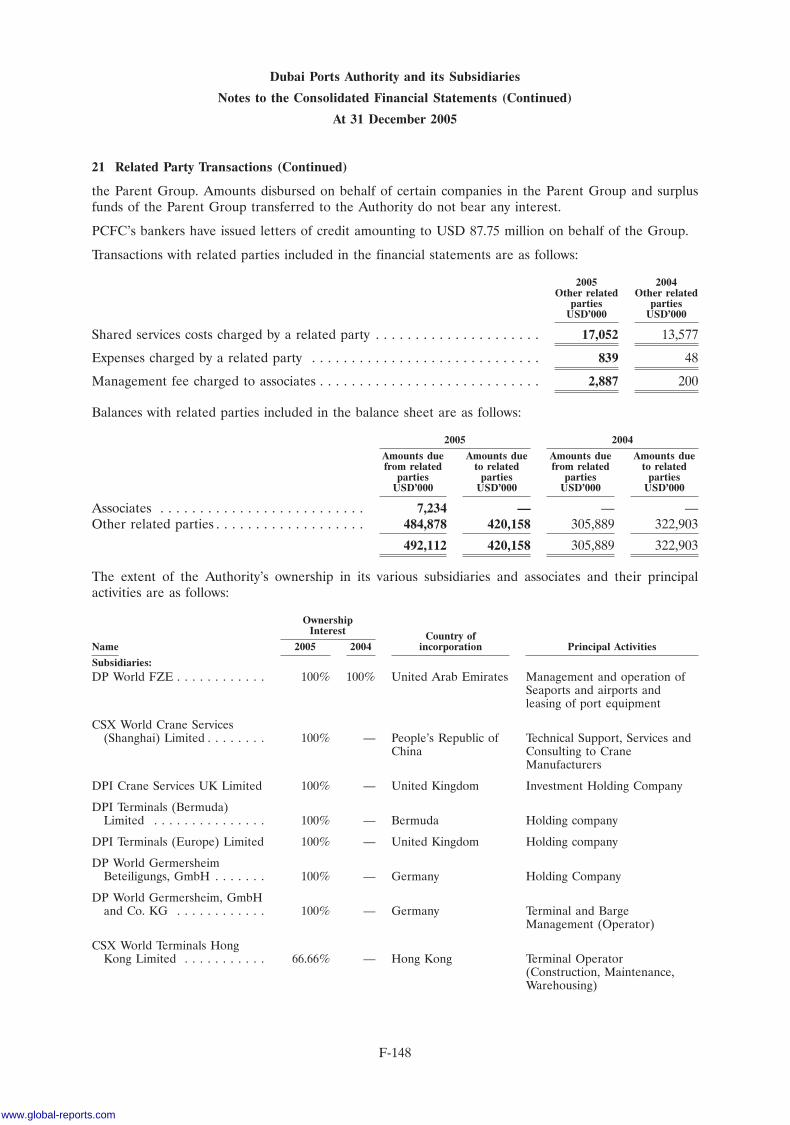
Dubai Ports Authority and its Subsidiaries
Notes to the Consolidated Financial Statements (Continued)
At 31 December 2005
21 Related Party Transactions (Continued)
the Parent Group. Amounts disbursed on behalf of certain companies in the Parent Group and surplusfunds of the Parent Group transferred to the Authority do not bear any interest.
PCFC’s bankers have issued letters of credit amounting to USD 87.75 million on behalf of the Group.
Transactions with related parties included in the financial statements are as follows:
2005 2004Other related Other related
parties partiesUSD’000 USD’000
Shared services costs charged by a related party . . . . . . . . . . . . . . . . . . . . . 17,052 13,577
Expenses charged by a related party . . . . . . . . . . . . . . . . . . . . . . . . . . . . . 839 48
Management fee charged to associates . . . . . . . . . . . . . . . . . . . . . . . . . . . . 2,887 200
Balances with related parties included in the balance sheet are as follows:
2005 2004
Amounts due Amounts due Amounts due Amounts duefrom related to related from related to related
parties parties parties partiesUSD’000 USD’000 USD’000 USD’000
Associates . . . . . . . . . . . . . . . . . . . . . . . . . . 7,234 — — —Other related parties . . . . . . . . . . . . . . . . . . . 484,878 420,158 305,889 322,903
492,112 420,158 305,889 322,903
The extent of the Authority’s ownership in its various subsidiaries and associates and their principalactivities are as follows:
OwnershipInterest Country of
Name 2005 2004 incorporation Principal Activities
Subsidiaries:DP World FZE . . . . . . . . . . . . 100% 100% United Arab Emirates Management and operation of
Seaports and airports andleasing of port equipment
CSX World Crane Services(Shanghai) Limited . . . . . . . . 100% — People’s Republic of Technical Support, Services and
China Consulting to CraneManufacturers
DPI Crane Services UK Limited 100% — United Kingdom Investment Holding Company
DPI Terminals (Bermuda)Limited . . . . . . . . . . . . . . . 100% — Bermuda Holding company
DPI Terminals (Europe) Limited 100% — United Kingdom Holding company
DP World GermersheimBeteiligungs, GmbH . . . . . . . 100% — Germany Holding Company
DP World Germersheim, GmbHand Co. KG . . . . . . . . . . . . 100% — Germany Terminal and Barge
Management (Operator)
CSX World Terminals HongKong Limited . . . . . . . . . . . 66.66% — Hong Kong Terminal Operator
(Construction, Maintenance,Warehousing)
F-148
www.global-reports.com
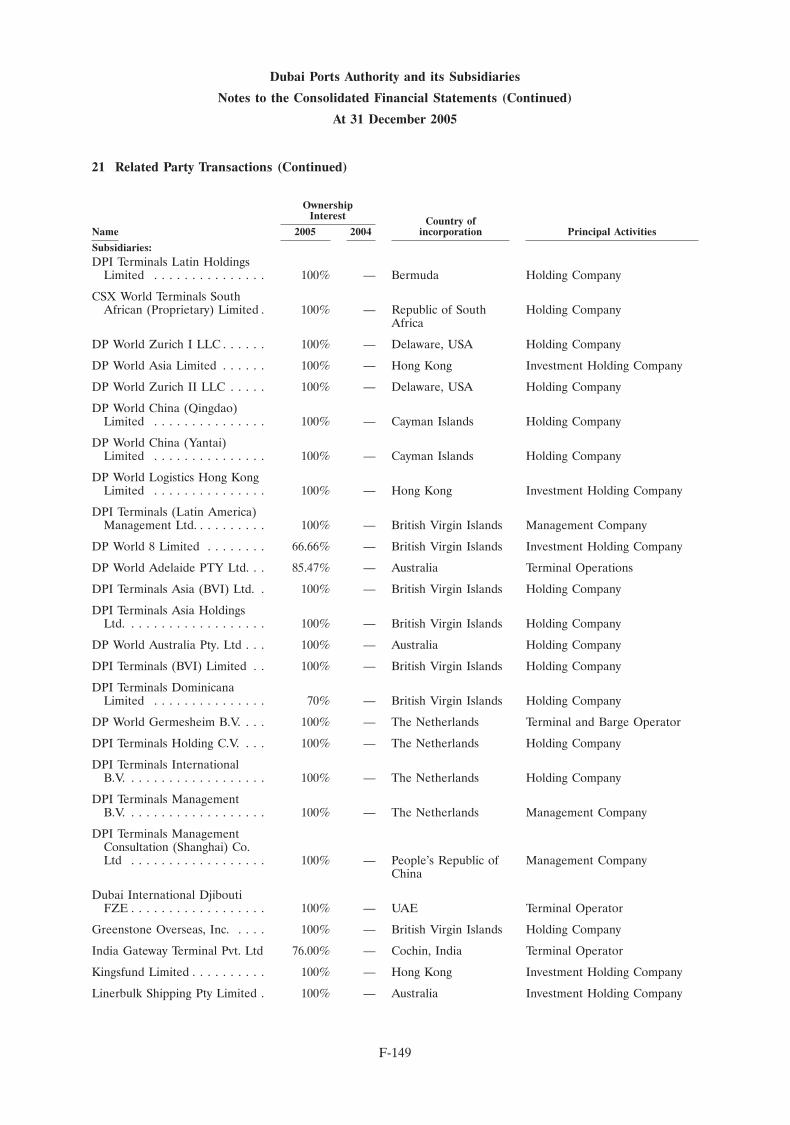
Dubai Ports Authority and its Subsidiaries
Notes to the Consolidated Financial Statements (Continued)
At 31 December 2005
21 Related Party Transactions (Continued)
OwnershipInterest Country of
Name 2005 2004 incorporation Principal Activities
Subsidiaries:DPI Terminals Latin Holdings
Limited . . . . . . . . . . . . . . . 100% — Bermuda Holding Company
CSX World Terminals SouthAfrican (Proprietary) Limited . 100% — Republic of South Holding Company
Africa
DP World Zurich I LLC . . . . . . 100% — Delaware, USA Holding Company
DP World Asia Limited . . . . . . 100% — Hong Kong Investment Holding Company
DP World Zurich II LLC . . . . . 100% — Delaware, USA Holding Company
DP World China (Qingdao)Limited . . . . . . . . . . . . . . . 100% — Cayman Islands Holding Company
DP World China (Yantai)Limited . . . . . . . . . . . . . . . 100% — Cayman Islands Holding Company
DP World Logistics Hong KongLimited . . . . . . . . . . . . . . . 100% — Hong Kong Investment Holding Company
DPI Terminals (Latin America)Management Ltd. . . . . . . . . . 100% — British Virgin Islands Management Company
DP World 8 Limited . . . . . . . . 66.66% — British Virgin Islands Investment Holding Company
DP World Adelaide PTY Ltd. . . 85.47% — Australia Terminal Operations
DPI Terminals Asia (BVI) Ltd. . 100% — British Virgin Islands Holding Company
DPI Terminals Asia HoldingsLtd. . . . . . . . . . . . . . . . . . . 100% — British Virgin Islands Holding Company
DP World Australia Pty. Ltd . . . 100% — Australia Holding Company
DPI Terminals (BVI) Limited . . 100% — British Virgin Islands Holding Company
DPI Terminals DominicanaLimited . . . . . . . . . . . . . . . 70% — British Virgin Islands Holding Company
DP World Germesheim B.V. . . . 100% — The Netherlands Terminal and Barge Operator
DPI Terminals Holding C.V. . . . 100% — The Netherlands Holding Company
DPI Terminals InternationalB.V. . . . . . . . . . . . . . . . . . . 100% — The Netherlands Holding Company
DPI Terminals ManagementB.V. . . . . . . . . . . . . . . . . . . 100% — The Netherlands Management Company
DPI Terminals ManagementConsultation (Shanghai) Co.Ltd . . . . . . . . . . . . . . . . . . 100% — People’s Republic of Management Company
China
Dubai International DjiboutiFZE . . . . . . . . . . . . . . . . . . 100% — UAE Terminal Operator
Greenstone Overseas, Inc. . . . . 100% — British Virgin Islands Holding Company
India Gateway Terminal Pvt. Ltd 76.00% — Cochin, India Terminal Operator
Kingsfund Limited . . . . . . . . . . 100% — Hong Kong Investment Holding Company
Linerbulk Shipping Pty Limited . 100% — Australia Investment Holding Company
F-149
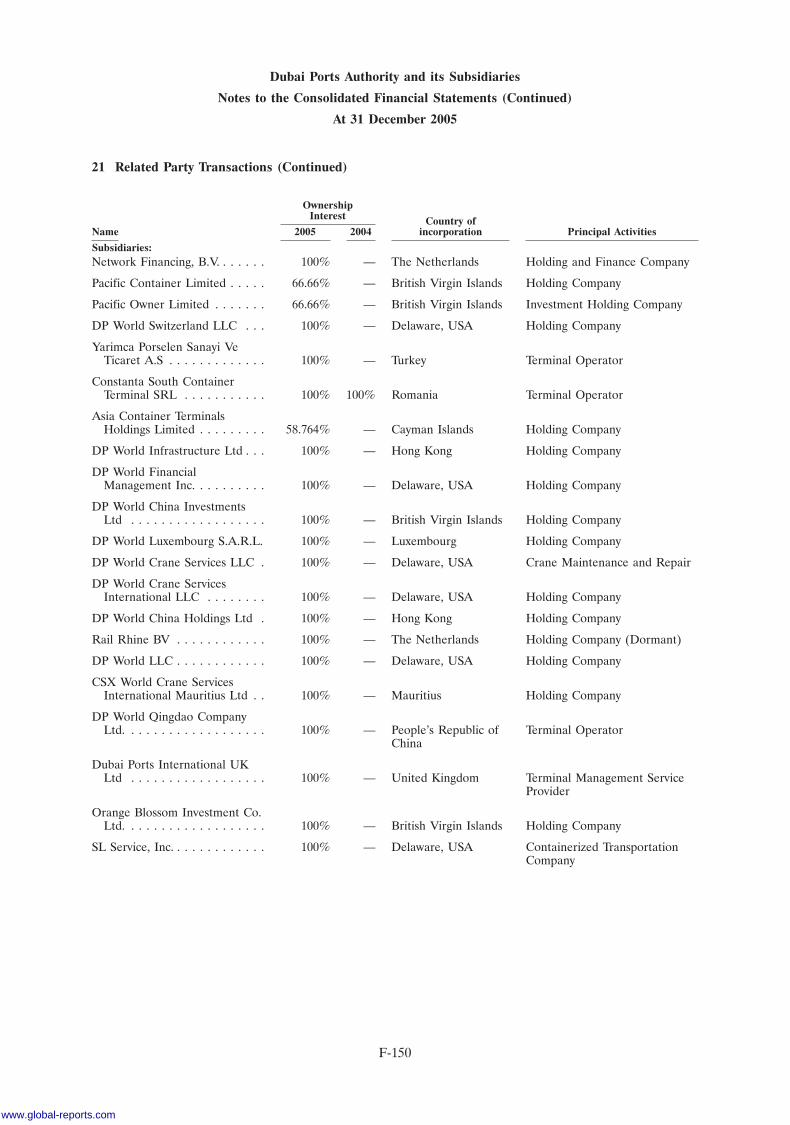
Dubai Ports Authority and its Subsidiaries
Notes to the Consolidated Financial Statements (Continued)
At 31 December 2005
21 Related Party Transactions (Continued)
OwnershipInterest Country of
Name 2005 2004 incorporation Principal Activities
Subsidiaries:Network Financing, B.V. . . . . . . 100% — The Netherlands Holding and Finance Company
Pacific Container Limited . . . . . 66.66% — British Virgin Islands Holding Company
Pacific Owner Limited . . . . . . . 66.66% — British Virgin Islands Investment Holding Company
DP World Switzerland LLC . . . 100% — Delaware, USA Holding Company
Yarimca Porselen Sanayi VeTicaret A.S . . . . . . . . . . . . . 100% — Turkey Terminal Operator
Constanta South ContainerTerminal SRL . . . . . . . . . . . 100% 100% Romania Terminal Operator
Asia Container TerminalsHoldings Limited . . . . . . . . . 58.764% — Cayman Islands Holding Company
DP World Infrastructure Ltd . . . 100% — Hong Kong Holding Company
DP World FinancialManagement Inc. . . . . . . . . . 100% — Delaware, USA Holding Company
DP World China InvestmentsLtd . . . . . . . . . . . . . . . . . . 100% — British Virgin Islands Holding Company
DP World Luxembourg S.A.R.L. 100% — Luxembourg Holding Company
DP World Crane Services LLC . 100% — Delaware, USA Crane Maintenance and Repair
DP World Crane ServicesInternational LLC . . . . . . . . 100% — Delaware, USA Holding Company
DP World China Holdings Ltd . 100% — Hong Kong Holding Company
Rail Rhine BV . . . . . . . . . . . . 100% — The Netherlands Holding Company (Dormant)
DP World LLC . . . . . . . . . . . . 100% — Delaware, USA Holding Company
CSX World Crane ServicesInternational Mauritius Ltd . . 100% — Mauritius Holding Company
DP World Qingdao CompanyLtd. . . . . . . . . . . . . . . . . . . 100% — People’s Republic of Terminal Operator
China
Dubai Ports International UKLtd . . . . . . . . . . . . . . . . . . 100% — United Kingdom Terminal Management Service
Provider
Orange Blossom Investment Co.Ltd. . . . . . . . . . . . . . . . . . . 100% — British Virgin Islands Holding Company
SL Service, Inc. . . . . . . . . . . . . 100% — Delaware, USA Containerized TransportationCompany
F-150
www.global-reports.com
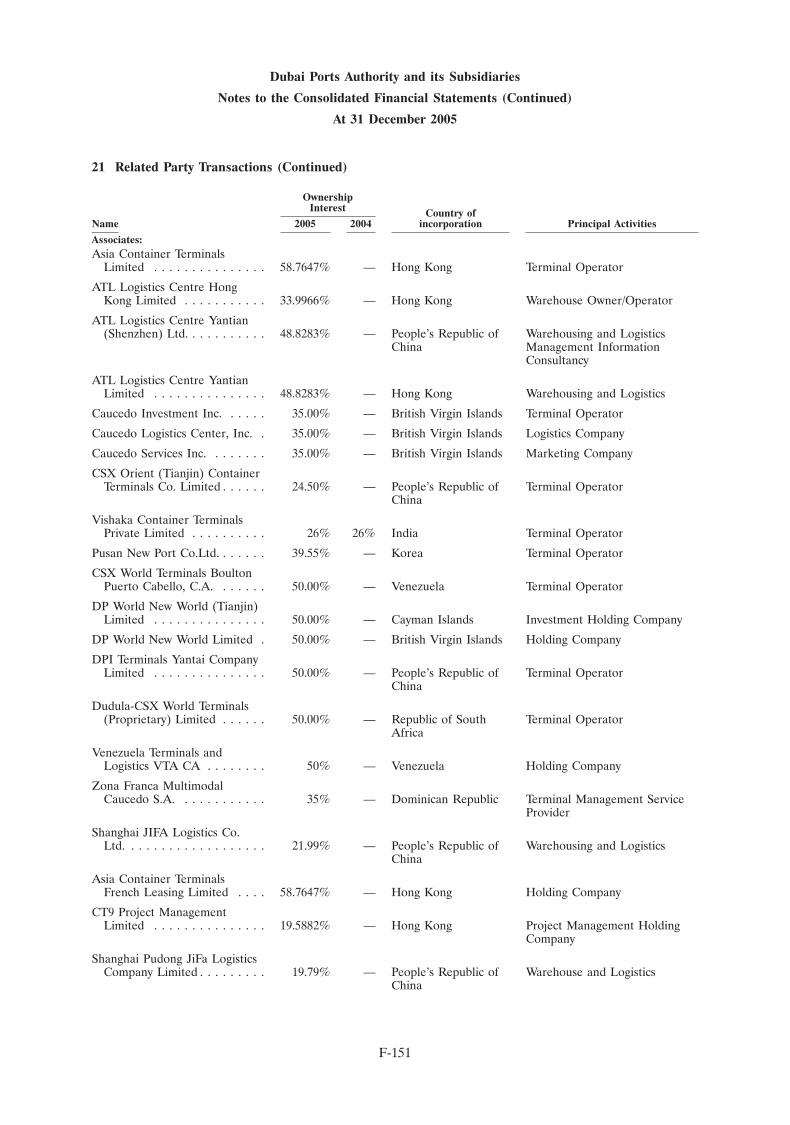
Dubai Ports Authority and its Subsidiaries
Notes to the Consolidated Financial Statements (Continued)
At 31 December 2005
21 Related Party Transactions (Continued)
OwnershipInterest Country of
Name 2005 2004 incorporation Principal Activities
Associates:Asia Container Terminals
Limited . . . . . . . . . . . . . . . 58.7647% — Hong Kong Terminal Operator
ATL Logistics Centre HongKong Limited . . . . . . . . . . . 33.9966% — Hong Kong Warehouse Owner/Operator
ATL Logistics Centre Yantian(Shenzhen) Ltd. . . . . . . . . . . 48.8283% — People’s Republic of Warehousing and Logistics
China Management InformationConsultancy
ATL Logistics Centre YantianLimited . . . . . . . . . . . . . . . 48.8283% — Hong Kong Warehousing and Logistics
Caucedo Investment Inc. . . . . . 35.00% — British Virgin Islands Terminal Operator
Caucedo Logistics Center, Inc. . 35.00% — British Virgin Islands Logistics Company
Caucedo Services Inc. . . . . . . . 35.00% — British Virgin Islands Marketing Company
CSX Orient (Tianjin) ContainerTerminals Co. Limited . . . . . . 24.50% — People’s Republic of Terminal Operator
China
Vishaka Container TerminalsPrivate Limited . . . . . . . . . . 26% 26% India Terminal Operator
Pusan New Port Co.Ltd. . . . . . . 39.55% — Korea Terminal Operator
CSX World Terminals BoultonPuerto Cabello, C.A. . . . . . . 50.00% — Venezuela Terminal Operator
DP World New World (Tianjin)Limited . . . . . . . . . . . . . . . 50.00% — Cayman Islands Investment Holding Company
DP World New World Limited . 50.00% — British Virgin Islands Holding Company
DPI Terminals Yantai CompanyLimited . . . . . . . . . . . . . . . 50.00% — People’s Republic of Terminal Operator
China
Dudula-CSX World Terminals(Proprietary) Limited . . . . . . 50.00% — Republic of South Terminal Operator
Africa
Venezuela Terminals andLogistics VTA CA . . . . . . . . 50% — Venezuela Holding Company
Zona Franca MultimodalCaucedo S.A. . . . . . . . . . . . 35% — Dominican Republic Terminal Management Service
Provider
Shanghai JIFA Logistics Co.Ltd. . . . . . . . . . . . . . . . . . . 21.99% — People’s Republic of Warehousing and Logistics
China
Asia Container TerminalsFrench Leasing Limited . . . . 58.7647% — Hong Kong Holding Company
CT9 Project ManagementLimited . . . . . . . . . . . . . . . 19.5882% — Hong Kong Project Management Holding
Company
Shanghai Pudong JiFa LogisticsCompany Limited . . . . . . . . . 19.79% — People’s Republic of Warehouse and Logistics
China
F-151
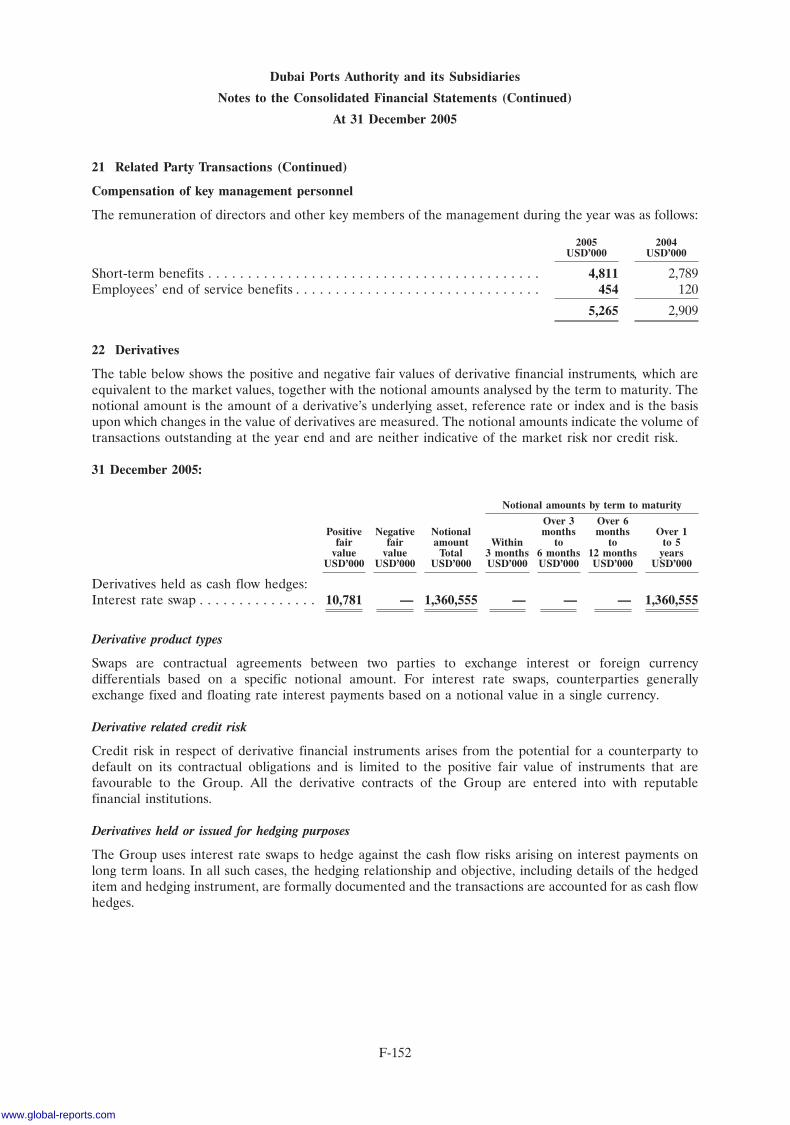
Dubai Ports Authority and its Subsidiaries
Notes to the Consolidated Financial Statements (Continued)
At 31 December 2005
21 Related Party Transactions (Continued)
Compensation of key management personnel
The remuneration of directors and other key members of the management during the year was as follows:
2005 2004USD’000 USD’000
Short-term benefits . . . . . . . . . . . . . . . . . . . . . . . . . . . . . . . . . . . . . . . . . . 4,811 2,789Employees’ end of service benefits . . . . . . . . . . . . . . . . . . . . . . . . . . . . . . . 454 120
5,265 2,909
22 Derivatives
The table below shows the positive and negative fair values of derivative financial instruments, which areequivalent to the market values, together with the notional amounts analysed by the term to maturity. Thenotional amount is the amount of a derivative’s underlying asset, reference rate or index and is the basisupon which changes in the value of derivatives are measured. The notional amounts indicate the volume oftransactions outstanding at the year end and are neither indicative of the market risk nor credit risk.
31 December 2005:
Notional amounts by term to maturity
Over 3 Over 6Positive Negative Notional months months Over 1
fair fair amount Within to to to 5value value Total 3 months 6 months 12 months years
USD’000 USD’000 USD’000 USD’000 USD’000 USD’000 USD’000
Derivatives held as cash flow hedges:Interest rate swap . . . . . . . . . . . . . . . 10,781 — 1,360,555 — — — 1,360,555
Derivative product types
Swaps are contractual agreements between two parties to exchange interest or foreign currencydifferentials based on a specific notional amount. For interest rate swaps, counterparties generallyexchange fixed and floating rate interest payments based on a notional value in a single currency.
Derivative related credit risk
Credit risk in respect of derivative financial instruments arises from the potential for a counterparty todefault on its contractual obligations and is limited to the positive fair value of instruments that arefavourable to the Group. All the derivative contracts of the Group are entered into with reputablefinancial institutions.
Derivatives held or issued for hedging purposes
The Group uses interest rate swaps to hedge against the cash flow risks arising on interest payments onlong term loans. In all such cases, the hedging relationship and objective, including details of the hedgeditem and hedging instrument, are formally documented and the transactions are accounted for as cash flowhedges.
F-152
www.global-reports.com
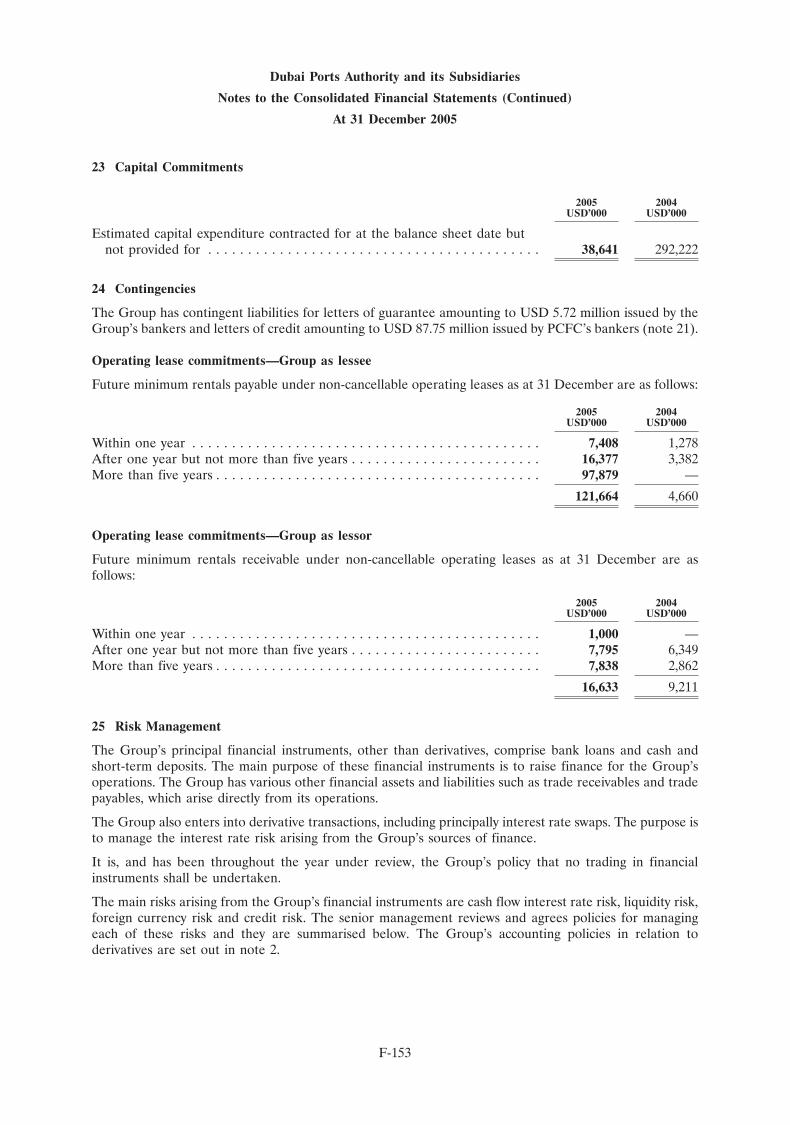
Dubai Ports Authority and its Subsidiaries
Notes to the Consolidated Financial Statements (Continued)
At 31 December 2005
23 Capital Commitments
2005 2004USD’000 USD’000
Estimated capital expenditure contracted for at the balance sheet date butnot provided for . . . . . . . . . . . . . . . . . . . . . . . . . . . . . . . . . . . . . . . . . . 38,641 292,222
24 Contingencies
The Group has contingent liabilities for letters of guarantee amounting to USD 5.72 million issued by theGroup’s bankers and letters of credit amounting to USD 87.75 million issued by PCFC’s bankers (note 21).
Operating lease commitments—Group as lessee
Future minimum rentals payable under non-cancellable operating leases as at 31 December are as follows:
2005 2004USD’000 USD’000
Within one year . . . . . . . . . . . . . . . . . . . . . . . . . . . . . . . . . . . . . . . . . . . . 7,408 1,278After one year but not more than five years . . . . . . . . . . . . . . . . . . . . . . . . 16,377 3,382More than five years . . . . . . . . . . . . . . . . . . . . . . . . . . . . . . . . . . . . . . . . . 97,879 —
121,664 4,660
Operating lease commitments—Group as lessor
Future minimum rentals receivable under non-cancellable operating leases as at 31 December are asfollows:
2005 2004USD’000 USD’000
Within one year . . . . . . . . . . . . . . . . . . . . . . . . . . . . . . . . . . . . . . . . . . . . 1,000 —After one year but not more than five years . . . . . . . . . . . . . . . . . . . . . . . . 7,795 6,349More than five years . . . . . . . . . . . . . . . . . . . . . . . . . . . . . . . . . . . . . . . . . 7,838 2,862
16,633 9,211
25 Risk Management
The Group’s principal financial instruments, other than derivatives, comprise bank loans and cash andshort-term deposits. The main purpose of these financial instruments is to raise finance for the Group’soperations. The Group has various other financial assets and liabilities such as trade receivables and tradepayables, which arise directly from its operations.
The Group also enters into derivative transactions, including principally interest rate swaps. The purpose isto manage the interest rate risk arising from the Group’s sources of finance.
It is, and has been throughout the year under review, the Group’s policy that no trading in financialinstruments shall be undertaken.
The main risks arising from the Group’s financial instruments are cash flow interest rate risk, liquidity risk,foreign currency risk and credit risk. The senior management reviews and agrees policies for managingeach of these risks and they are summarised below. The Group’s accounting policies in relation toderivatives are set out in note 2.
F-153
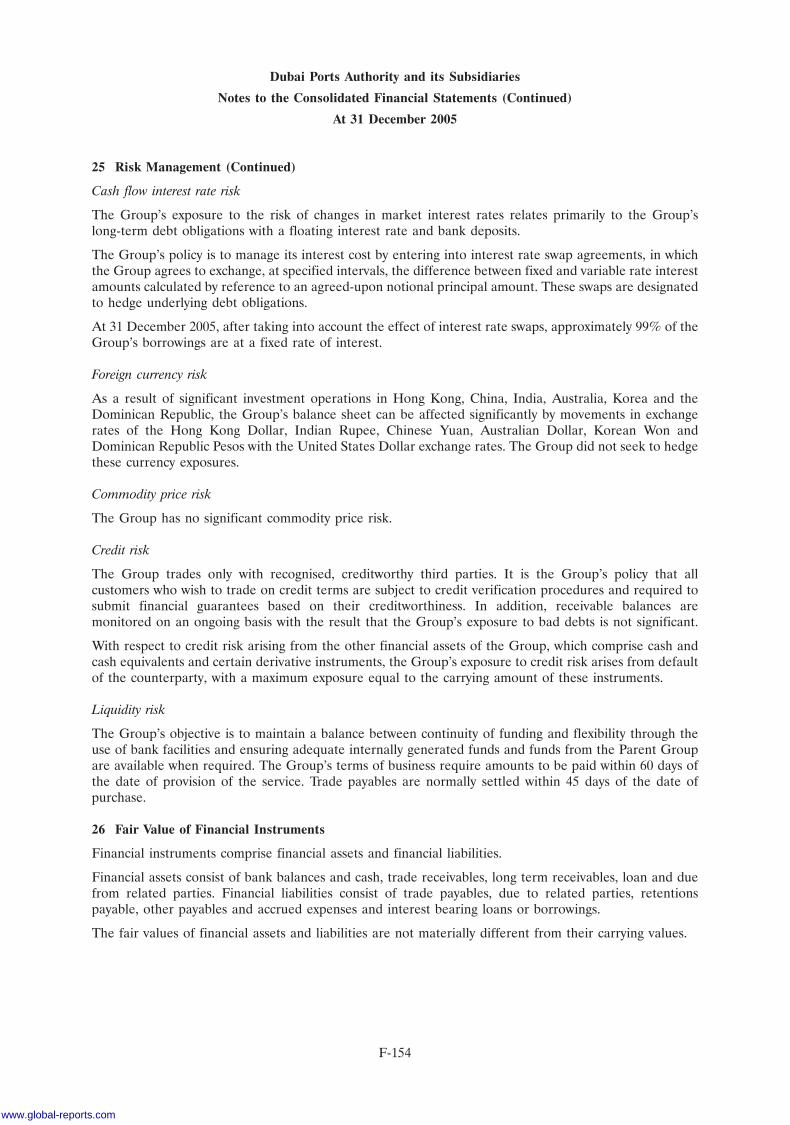
Dubai Ports Authority and its Subsidiaries
Notes to the Consolidated Financial Statements (Continued)
At 31 December 2005
25 Risk Management (Continued)
Cash flow interest rate risk
The Group’s exposure to the risk of changes in market interest rates relates primarily to the Group’slong-term debt obligations with a floating interest rate and bank deposits.
The Group’s policy is to manage its interest cost by entering into interest rate swap agreements, in whichthe Group agrees to exchange, at specified intervals, the difference between fixed and variable rate interestamounts calculated by reference to an agreed-upon notional principal amount. These swaps are designatedto hedge underlying debt obligations.
At 31 December 2005, after taking into account the effect of interest rate swaps, approximately 99% of theGroup’s borrowings are at a fixed rate of interest.
Foreign currency risk
As a result of significant investment operations in Hong Kong, China, India, Australia, Korea and theDominican Republic, the Group’s balance sheet can be affected significantly by movements in exchangerates of the Hong Kong Dollar, Indian Rupee, Chinese Yuan, Australian Dollar, Korean Won andDominican Republic Pesos with the United States Dollar exchange rates. The Group did not seek to hedgethese currency exposures.
Commodity price risk
The Group has no significant commodity price risk.
Credit risk
The Group trades only with recognised, creditworthy third parties. It is the Group’s policy that allcustomers who wish to trade on credit terms are subject to credit verification procedures and required tosubmit financial guarantees based on their creditworthiness. In addition, receivable balances aremonitored on an ongoing basis with the result that the Group’s exposure to bad debts is not significant.
With respect to credit risk arising from the other financial assets of the Group, which comprise cash andcash equivalents and certain derivative instruments, the Group’s exposure to credit risk arises from defaultof the counterparty, with a maximum exposure equal to the carrying amount of these instruments.
Liquidity risk
The Group’s objective is to maintain a balance between continuity of funding and flexibility through theuse of bank facilities and ensuring adequate internally generated funds and funds from the Parent Groupare available when required. The Group’s terms of business require amounts to be paid within 60 days ofthe date of provision of the service. Trade payables are normally settled within 45 days of the date ofpurchase.
26 Fair Value of Financial Instruments
Financial instruments comprise financial assets and financial liabilities.
Financial assets consist of bank balances and cash, trade receivables, long term receivables, loan and duefrom related parties. Financial liabilities consist of trade payables, due to related parties, retentionspayable, other payables and accrued expenses and interest bearing loans or borrowings.
The fair values of financial assets and liabilities are not materially different from their carrying values.
F-154
www.global-reports.com
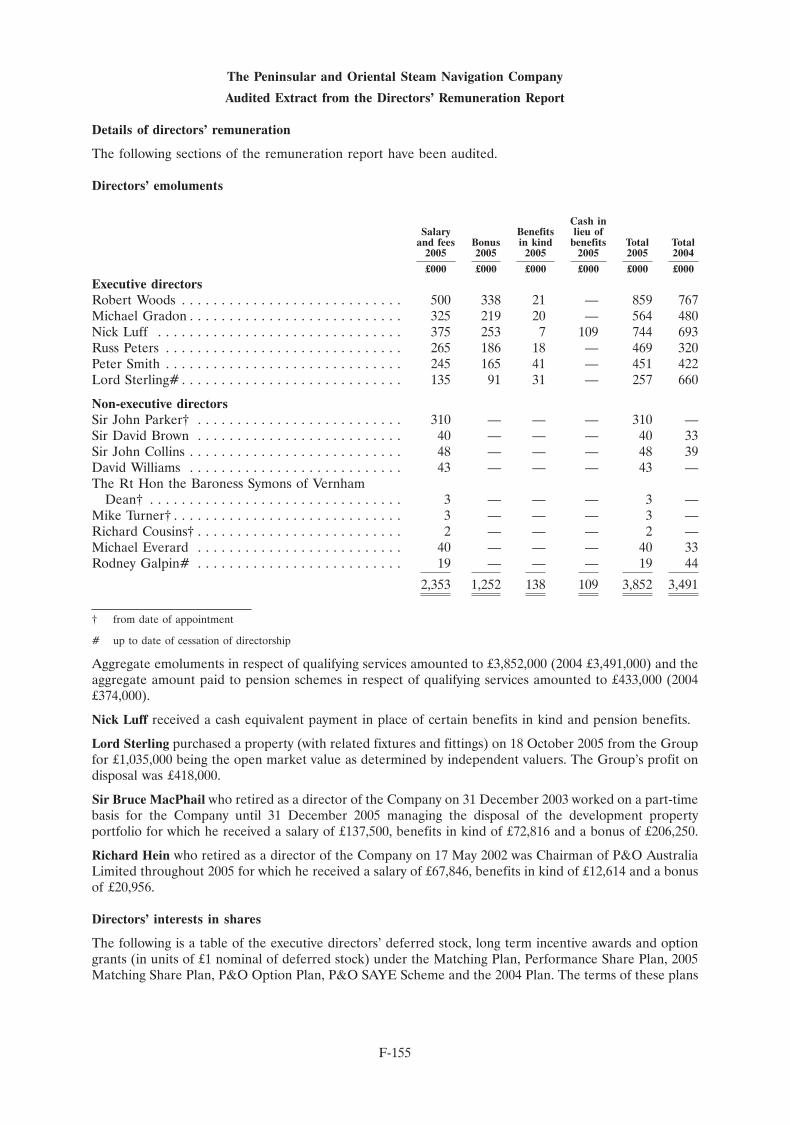
The Peninsular and Oriental Steam Navigation Company
Audited Extract from the Directors’ Remuneration Report
Details of directors’ remuneration
The following sections of the remuneration report have been audited.
Directors’ emoluments
Cash inSalary Benefits lieu of
and fees Bonus in kind benefits Total Total2005 2005 2005 2005 2005 2004
£000 £000 £000 £000 £000 £000
Executive directorsRobert Woods . . . . . . . . . . . . . . . . . . . . . . . . . . . . 500 338 21 — 859 767Michael Gradon . . . . . . . . . . . . . . . . . . . . . . . . . . . 325 219 20 — 564 480Nick Luff . . . . . . . . . . . . . . . . . . . . . . . . . . . . . . . 375 253 7 109 744 693Russ Peters . . . . . . . . . . . . . . . . . . . . . . . . . . . . . . 265 186 18 — 469 320Peter Smith . . . . . . . . . . . . . . . . . . . . . . . . . . . . . . 245 165 41 — 451 422Lord Sterling# . . . . . . . . . . . . . . . . . . . . . . . . . . . . 135 91 31 — 257 660
Non-executive directorsSir John Parker† . . . . . . . . . . . . . . . . . . . . . . . . . . 310 — — — 310 —Sir David Brown . . . . . . . . . . . . . . . . . . . . . . . . . . 40 — — — 40 33Sir John Collins . . . . . . . . . . . . . . . . . . . . . . . . . . . 48 — — — 48 39David Williams . . . . . . . . . . . . . . . . . . . . . . . . . . . 43 — — — 43 —The Rt Hon the Baroness Symons of Vernham
Dean† . . . . . . . . . . . . . . . . . . . . . . . . . . . . . . . . 3 — — — 3 —Mike Turner† . . . . . . . . . . . . . . . . . . . . . . . . . . . . . 3 — — — 3 —Richard Cousins† . . . . . . . . . . . . . . . . . . . . . . . . . . 2 — — — 2 —Michael Everard . . . . . . . . . . . . . . . . . . . . . . . . . . 40 — — — 40 33Rodney Galpin# . . . . . . . . . . . . . . . . . . . . . . . . . . 19 — — — 19 44
2,353 1,252 138 109 3,852 3,491
† from date of appointment
# up to date of cessation of directorship
Aggregate emoluments in respect of qualifying services amounted to £3,852,000 (2004 £3,491,000) and theaggregate amount paid to pension schemes in respect of qualifying services amounted to £433,000 (2004£374,000).
Nick Luff received a cash equivalent payment in place of certain benefits in kind and pension benefits.
Lord Sterling purchased a property (with related fixtures and fittings) on 18 October 2005 from the Groupfor £1,035,000 being the open market value as determined by independent valuers. The Group’s profit ondisposal was £418,000.
Sir Bruce MacPhail who retired as a director of the Company on 31 December 2003 worked on a part-timebasis for the Company until 31 December 2005 managing the disposal of the development propertyportfolio for which he received a salary of £137,500, benefits in kind of £72,816 and a bonus of £206,250.
Richard Hein who retired as a director of the Company on 17 May 2002 was Chairman of P&O AustraliaLimited throughout 2005 for which he received a salary of £67,846, benefits in kind of £12,614 and a bonusof £20,956.
Directors’ interests in shares
The following is a table of the executive directors’ deferred stock, long term incentive awards and optiongrants (in units of £1 nominal of deferred stock) under the Matching Plan, Performance Share Plan, 2005Matching Share Plan, P&O Option Plan, P&O SAYE Scheme and the 2004 Plan. The terms of these plans
F-155
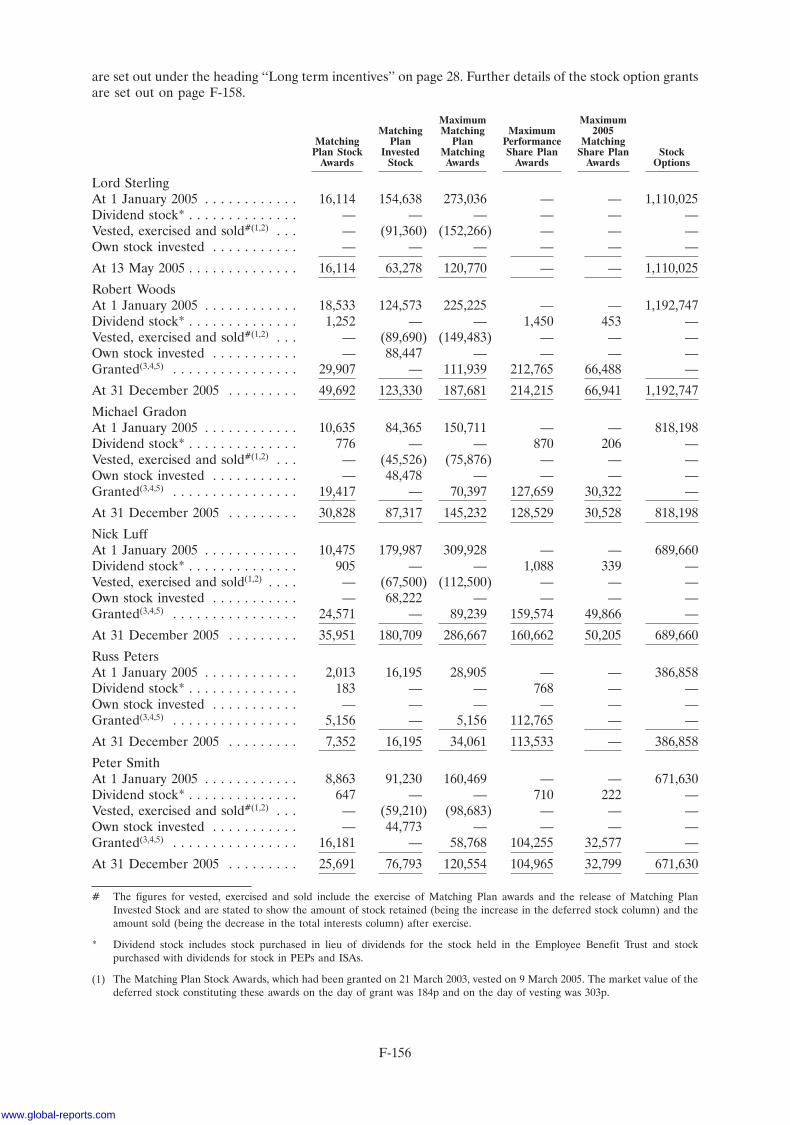
are set out under the heading ‘‘Long term incentives’’ on page 28. Further details of the stock option grantsare set out on page F-158.
Maximum MaximumMatching Matching Maximum 2005
Matching Plan Plan Performance MatchingPlan Stock Invested Matching Share Plan Share Plan Stock
Awards Stock Awards Awards Awards Options
Lord SterlingAt 1 January 2005 . . . . . . . . . . . . 16,114 154,638 273,036 — — 1,110,025Dividend stock* . . . . . . . . . . . . . . — — — — — —Vested, exercised and sold#(1,2) . . . — (91,360) (152,266) — — —Own stock invested . . . . . . . . . . . — — — — — —
At 13 May 2005 . . . . . . . . . . . . . . 16,114 63,278 120,770 — — 1,110,025
Robert WoodsAt 1 January 2005 . . . . . . . . . . . . 18,533 124,573 225,225 — — 1,192,747Dividend stock* . . . . . . . . . . . . . . 1,252 — — 1,450 453 —Vested, exercised and sold#(1,2) . . . — (89,690) (149,483) — — —Own stock invested . . . . . . . . . . . — 88,447 — — — —Granted(3,4,5) . . . . . . . . . . . . . . . . 29,907 — 111,939 212,765 66,488 —
At 31 December 2005 . . . . . . . . . 49,692 123,330 187,681 214,215 66,941 1,192,747
Michael GradonAt 1 January 2005 . . . . . . . . . . . . 10,635 84,365 150,711 — — 818,198Dividend stock* . . . . . . . . . . . . . . 776 — — 870 206 —Vested, exercised and sold#(1,2) . . . — (45,526) (75,876) — — —Own stock invested . . . . . . . . . . . — 48,478 — — — —Granted(3,4,5) . . . . . . . . . . . . . . . . 19,417 — 70,397 127,659 30,322 —
At 31 December 2005 . . . . . . . . . 30,828 87,317 145,232 128,529 30,528 818,198
Nick LuffAt 1 January 2005 . . . . . . . . . . . . 10,475 179,987 309,928 — — 689,660Dividend stock* . . . . . . . . . . . . . . 905 — — 1,088 339 —Vested, exercised and sold(1,2) . . . . — (67,500) (112,500) — — —Own stock invested . . . . . . . . . . . — 68,222 — — — —Granted(3,4,5) . . . . . . . . . . . . . . . . 24,571 — 89,239 159,574 49,866 —
At 31 December 2005 . . . . . . . . . 35,951 180,709 286,667 160,662 50,205 689,660
Russ PetersAt 1 January 2005 . . . . . . . . . . . . 2,013 16,195 28,905 — — 386,858Dividend stock* . . . . . . . . . . . . . . 183 — — 768 — —Own stock invested . . . . . . . . . . . — — — — — —Granted(3,4,5) . . . . . . . . . . . . . . . . 5,156 — 5,156 112,765 — —
At 31 December 2005 . . . . . . . . . 7,352 16,195 34,061 113,533 — 386,858
Peter SmithAt 1 January 2005 . . . . . . . . . . . . 8,863 91,230 160,469 — — 671,630Dividend stock* . . . . . . . . . . . . . . 647 — — 710 222 —Vested, exercised and sold#(1,2) . . . — (59,210) (98,683) — — —Own stock invested . . . . . . . . . . . — 44,773 — — — —Granted(3,4,5) . . . . . . . . . . . . . . . . 16,181 — 58,768 104,255 32,577 —
At 31 December 2005 . . . . . . . . . 25,691 76,793 120,554 104,965 32,799 671,630
# The figures for vested, exercised and sold include the exercise of Matching Plan awards and the release of Matching PlanInvested Stock and are stated to show the amount of stock retained (being the increase in the deferred stock column) and theamount sold (being the decrease in the total interests column) after exercise.
* Dividend stock includes stock purchased in lieu of dividends for the stock held in the Employee Benefit Trust and stockpurchased with dividends for stock in PEPs and ISAs.
(1) The Matching Plan Stock Awards, which had been granted on 21 March 2003, vested on 9 March 2005. The market value of thedeferred stock constituting these awards on the day of grant was 184p and on the day of vesting was 303p.
F-156
www.global-reports.com
(2) The date of exercise of the Matching Plan Stock Award was 9 March 2005. The market value of the deferred stock constitutingthese awards on the day of exercise was 303p.
(3) The 2005 Matching Plan Awards were granted on 9 March 2005 and the market value of the deferred stock constituting theseawards on the day of the grant was 303p. The performance conditions and performance period for these awards are described onpage 29.
(4) The 2005 Performance Share Plan awards were granted on 13 May 2005 and the market value of the deferred stock constitutingthese awards on the day of the grant was 282p. The performance conditions and performance period for these awards aredescribed on page 29.
(5) The 2005 Matching Share Plan awards were granted on 13 May 2005 and the market value of the deferred stock constitutingthese awards on the day of the grant was 282p. The performance conditions and performance period for these awards aredescribed on page 29.
‘‘Invested stock’’ includes invested stock under both the Matching Plan and the 2005 Matching share Plan.
The aggregate net value of assets received or receivable by directors during the year under long termincentive plans was £3,826,138 (2004 £1,544,555).
No director had interests, whether beneficial or non-beneficial, in the Company’s preferred stock ordebenture stocks or in the share capital, loan stocks or debenture stocks of the Company’s subsidiaries atthe beginning or end of the year or at the date of this report. No director had a material interest in anycontract of significance with the Company or any subsidiary, joint venture or associate during the year.
As potential beneficiaries of the P&O Employee Benefit Trust (the ‘‘Trust’’), the executive directors aretechnically deemed to be interested in deferred stock of the Company held by the Trust. At 31 December2005, the Trust held £12,207,682 nominal of deferred stock.
Stock Awards
The Trustee waives its right to receive dividends on stock held in the Trust and the amount of stock towhich Stock Awards relate increased during the year, due to additional P&O deferred stock purchased bythe Trustee which had a value equivalent to the value of the dividend forgone. Stock Awards are eligiblefor Matching Awards in accordance with the rules of the Matching Plan as described above. The terms ofthe Matching Plan (including the performance conditions) are summarised on page 29. Stock Awards aresubject to a retention period of two years from the date of grant. Stock Awards granted in 2004 and 2005would normally have become exercisable from the announcement of the 2005 and 2006 preliminary resultsrespectively. However, upon the change of control of P&O on 8 March 2006, Stock Awards under theMatching Plan, performance awards under the Performance Share Plan and Matching Awards underthe Matching Plan and 2005 Matching Share Plan became exercisable in accordance with the rules of theplans. Under the Matching Plan, Stock Awards vested in full. Under all plans, Matching and PerformanceAwards vested in full (subject to pro-rating to the date of departure for those who had left the Companybefore the end of the relevant performance period).
F-157
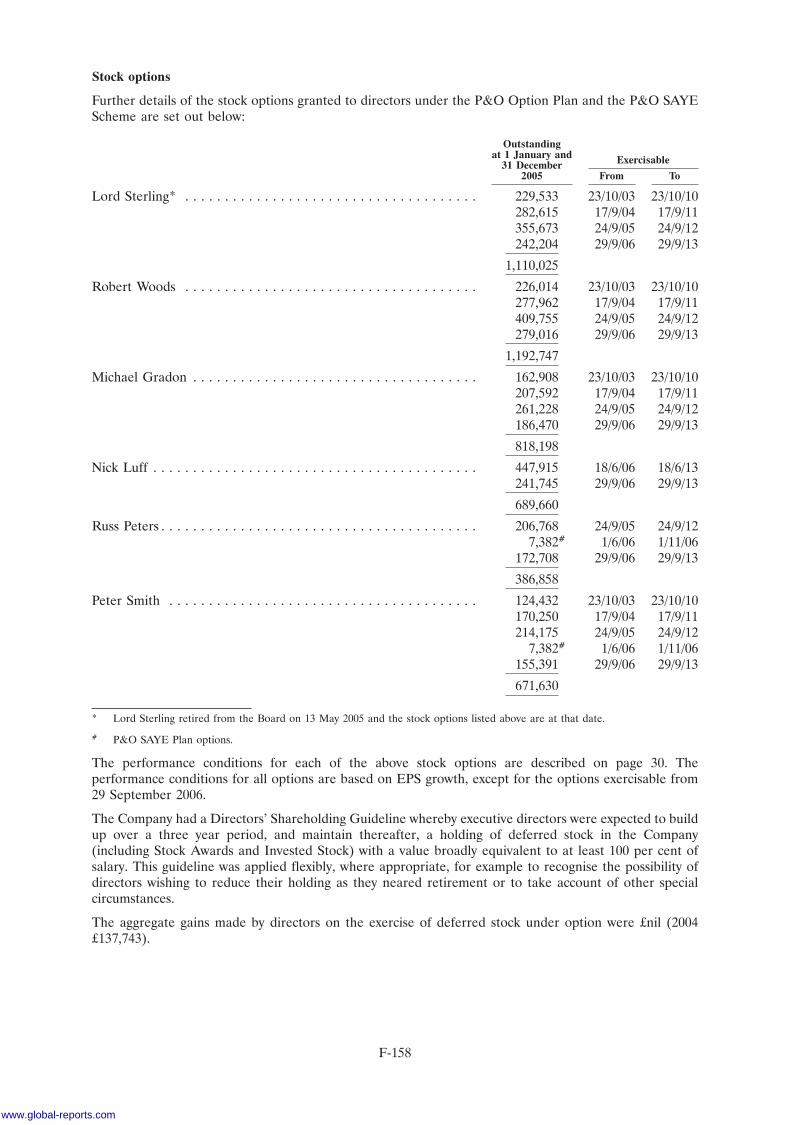
Stock options
Further details of the stock options granted to directors under the P&O Option Plan and the P&O SAYEScheme are set out below:
Outstandingat 1 January and Exercisable31 December
2005 From To
Lord Sterling* . . . . . . . . . . . . . . . . . . . . . . . . . . . . . . . . . . . . . 229,533 23/10/03 23/10/10282,615 17/9/04 17/9/11355,673 24/9/05 24/9/12242,204 29/9/06 29/9/13
1,110,025
Robert Woods . . . . . . . . . . . . . . . . . . . . . . . . . . . . . . . . . . . . . 226,014 23/10/03 23/10/10277,962 17/9/04 17/9/11409,755 24/9/05 24/9/12279,016 29/9/06 29/9/13
1,192,747
Michael Gradon . . . . . . . . . . . . . . . . . . . . . . . . . . . . . . . . . . . . 162,908 23/10/03 23/10/10207,592 17/9/04 17/9/11261,228 24/9/05 24/9/12186,470 29/9/06 29/9/13
818,198
Nick Luff . . . . . . . . . . . . . . . . . . . . . . . . . . . . . . . . . . . . . . . . . 447,915 18/6/06 18/6/13241,745 29/9/06 29/9/13
689,660
Russ Peters . . . . . . . . . . . . . . . . . . . . . . . . . . . . . . . . . . . . . . . . 206,768 24/9/05 24/9/127,382# 1/6/06 1/11/06
172,708 29/9/06 29/9/13
386,858
Peter Smith . . . . . . . . . . . . . . . . . . . . . . . . . . . . . . . . . . . . . . . 124,432 23/10/03 23/10/10170,250 17/9/04 17/9/11214,175 24/9/05 24/9/12
7,382# 1/6/06 1/11/06155,391 29/9/06 29/9/13
671,630
* Lord Sterling retired from the Board on 13 May 2005 and the stock options listed above are at that date.
# P&O SAYE Plan options.
The performance conditions for each of the above stock options are described on page 30. Theperformance conditions for all options are based on EPS growth, except for the options exercisable from29 September 2006.
The Company had a Directors’ Shareholding Guideline whereby executive directors were expected to buildup over a three year period, and maintain thereafter, a holding of deferred stock in the Company(including Stock Awards and Invested Stock) with a value broadly equivalent to at least 100 per cent ofsalary. This guideline was applied flexibly, where appropriate, for example to recognise the possibility ofdirectors wishing to reduce their holding as they neared retirement or to take account of other specialcircumstances.
The aggregate gains made by directors on the exercise of deferred stock under option were £nil (2004£137,743).
F-158
www.global-reports.com
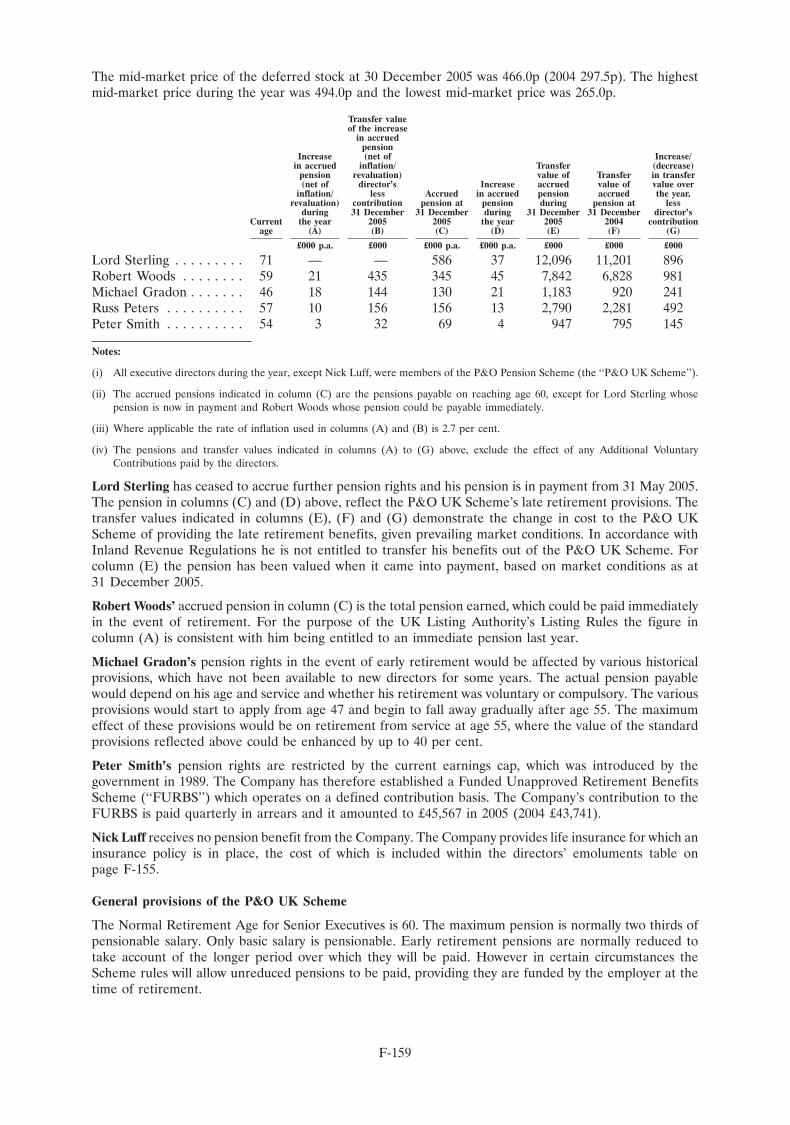
The mid-market price of the deferred stock at 30 December 2005 was 466.0p (2004 297.5p). The highestmid-market price during the year was 494.0p and the lowest mid-market price was 265.0p.
Transfer valueof the increase
in accruedpension
Increase (net of Increase/in accrued inflation/ Transfer (decrease)
pension revaluation) value of Transfer in transfer(net of director’s Increase accrued value of value over
inflation/ less Accrued in accrued pension accrued the year,revaluation) contribution pension at pension during pension at less
during 31 December 31 December during 31 December 31 December director’sCurrent the year 2005 2005 the year 2005 2004 contribution
age (A) (B) (C) (D) (E) (F) (G)
£000 p.a. £000 £000 p.a. £000 p.a. £000 £000 £000
Lord Sterling . . . . . . . . . 71 — — 586 37 12,096 11,201 896Robert Woods . . . . . . . . 59 21 435 345 45 7,842 6,828 981Michael Gradon . . . . . . . 46 18 144 130 21 1,183 920 241Russ Peters . . . . . . . . . . 57 10 156 156 13 2,790 2,281 492Peter Smith . . . . . . . . . . 54 3 32 69 4 947 795 145
Notes:
(i) All executive directors during the year, except Nick Luff, were members of the P&O Pension Scheme (the ‘‘P&O UK Scheme’’).
(ii) The accrued pensions indicated in column (C) are the pensions payable on reaching age 60, except for Lord Sterling whosepension is now in payment and Robert Woods whose pension could be payable immediately.
(iii) Where applicable the rate of inflation used in columns (A) and (B) is 2.7 per cent.
(iv) The pensions and transfer values indicated in columns (A) to (G) above, exclude the effect of any Additional VoluntaryContributions paid by the directors.
Lord Sterling has ceased to accrue further pension rights and his pension is in payment from 31 May 2005.The pension in columns (C) and (D) above, reflect the P&O UK Scheme’s late retirement provisions. Thetransfer values indicated in columns (E), (F) and (G) demonstrate the change in cost to the P&O UKScheme of providing the late retirement benefits, given prevailing market conditions. In accordance withInland Revenue Regulations he is not entitled to transfer his benefits out of the P&O UK Scheme. Forcolumn (E) the pension has been valued when it came into payment, based on market conditions as at31 December 2005.
Robert Woods’ accrued pension in column (C) is the total pension earned, which could be paid immediatelyin the event of retirement. For the purpose of the UK Listing Authority’s Listing Rules the figure incolumn (A) is consistent with him being entitled to an immediate pension last year.
Michael Gradon’s pension rights in the event of early retirement would be affected by various historicalprovisions, which have not been available to new directors for some years. The actual pension payablewould depend on his age and service and whether his retirement was voluntary or compulsory. The variousprovisions would start to apply from age 47 and begin to fall away gradually after age 55. The maximumeffect of these provisions would be on retirement from service at age 55, where the value of the standardprovisions reflected above could be enhanced by up to 40 per cent.
Peter Smith’s pension rights are restricted by the current earnings cap, which was introduced by thegovernment in 1989. The Company has therefore established a Funded Unapproved Retirement BenefitsScheme (‘‘FURBS’’) which operates on a defined contribution basis. The Company’s contribution to theFURBS is paid quarterly in arrears and it amounted to £45,567 in 2005 (2004 £43,741).
Nick Luff receives no pension benefit from the Company. The Company provides life insurance for which aninsurance policy is in place, the cost of which is included within the directors’ emoluments table onpage F-155.
General provisions of the P&O UK Scheme
The Normal Retirement Age for Senior Executives is 60. The maximum pension is normally two thirds ofpensionable salary. Only basic salary is pensionable. Early retirement pensions are normally reduced totake account of the longer period over which they will be paid. However in certain circumstances theScheme rules will allow unreduced pensions to be paid, providing they are funded by the employer at thetime of retirement.
F-159
The P&O UK Scheme’s rules guarantee pension increases during retirement fully in line with RPIincreases up to 3 per cent, subject to the minimum introduced in the Pensions Act 1995. Increases above3 per cent are not guaranteed but the trustee has the power to grant them, if circumstances permit, withoutreferring to the Company. Increases greater than 80 per cent of the increase in RPI may only be given withthe agreement of the Company. The current policy of the Company and the trustee is to fund the P&O UKScheme for increases up to 80 per cent of the increase in RPI, subject to the above guarantees, allowancefor which is made in transfer value calculations.
In the event of death before retirement, the P&O UK Scheme provides a capital sum equal to four timesbasic salary (or four times the earnings cap for those joining after 1989) plus spouse pensions or, at thetrustee’s discretion, a dependents pension of up to 66 per cent of the member’s pension. Children’sallowances are also payable at the rate of 25 per cent of the spouse/dependents pension.
F-160
www.global-reports.com
The Peninsular and Oriental Steam Navigation Company
Statement of Directors’ Responsibilities in Respect of the Annual Report and the Financial Statements
The directors are responsible for preparing the Annual Report and the Group and parent companyfinancial statements, in accordance with applicable law and regulations.
Company law requires the directors to prepare Group and parent company financial statements for eachfinancial year. Under that law the directors are required to prepare the Group financial statements inaccordance with IFRSs as adopted by the EU and have elected to prepare the parent company financialstatements in accordance with UK Accounting Standards.
The Group financial statements are required by law and IFRSs as adopted by the EU to present fairly thefinancial position and performance of the Group; the Companies Act 1985 provides in relation to suchfinancial statements that references in the relevant part of that Act to financial statements giving a trueand fair view are references to their achieving a fair presentation.
The parent company financial statements are required by law to give a true and fair view of the state ofaffairs of the parent company.
In preparing each of the Group and parent company financial statements, the directors are required to:
� select suitable accounting policies and then apply them consistently;
� make judgements and estimates that are reasonable and prudent;
� for the Group financial statements, state whether they have been prepared in accordance withIFRSs as adopted by the EU;
� for the parent company financial statements, state whether applicable UK Accounting Standardshave been followed, subject to any material departures disclosed and explained in the parentcompany financial statements; and
� prepare the financial statements on the going concern basis unless it is inappropriate to presumethat the Group and the parent company will continue in business.
The directors are responsible for keeping proper accounting records that disclose with reasonable accuracyat any time the financial position of the parent company and enable them to ensure that its financialstatements comply with the Companies Act 1985. They have general responsibility for taking such steps asare reasonably open to them to safeguard the assets of the Group and to prevent and detect fraud andother irregularities.
Under applicable law and regulations, the directors are also responsible for preparing a Directors’ Reportand Directors’ Remuneration Report that comply with that law and those regulations.
The directors are responsible for the maintenance and integrity of the corporate and financial informationincluded on the company’s website. Legislation in the UK governing the preparation and dissemination offinancial statements may differ from legislation in other jurisdictions.
F-161
The Peninsular and Oriental Steam Navigation Company
Report of the Independent Auditors
Independent auditors’ report to the members of The Peninsular and Oriental Steam NavigationCompany
We have audited the Group and Parent company financial statements (the ‘‘financial statements’’) of ThePeninsular and Oriental Steam Navigation Company for the year ended 31 December 2005 which comprisethe Consolidated income statement, the Consolidated and Parent company balance sheets, theConsolidated statement of cash flows, the Consolidated statement of recognised income and expense andthe related notes. These financial statements have been prepared under the accounting policies set outtherein. We have also audited the information in the Directors’ Remuneration Report that is described ashaving been audited.
This report is made solely to the company’s members, as a body, in accordance with section 235 of theCompanies Act 1985. Our audit work has been undertaken so that we might state to the company’smembers those matters we are required to state to them in an auditor’s report and for no other purpose.To the fullest extent permitted by law, we do not accept or assume responsibility to anyone other than thecompany and the company’s members as a body, for our audit work, for this report, or for the opinions wehave formed.
Respective responsibilities of directors and auditors
The directors’ responsibilities for preparing the Annual Report and the Group financial statements inaccordance with applicable law and International Financial Reporting Standards (IFRSs) as adopted bythe EU, and for preparing the parent company financial statements and the Directors’ RemunerationReport in accordance with applicable law and UK Accounting Standards (UK Generally AcceptedAccounting Practice) are set out in the Statement of Directors’ Responsibilities on page F-161.
Our responsibility is to audit the financial statements and the part of the Directors’ Remuneration Reportto be audited in accordance with relevant legal and regulatory requirements and International Standardson Auditing (UK and Ireland).
We report to you our opinion as to whether the financial statements give a true and fair view and whetherthe financial statements and the part of the Directors’ Remuneration Report to be audited have beenproperly prepared in accordance with the Companies Act 1985 and whether, in addition, the Groupfinancial statements have been properly prepared in accordance with Article 4 of the IAS Regulation. Wealso report to you if, in our opinion, the Directors’ Report is not consistent with the financial statements, ifthe company has not kept proper accounting records, if we have not received all the information andexplanations we require for our audit, or if information specified by law regarding directors’ remunerationand other transactions is not disclosed.
We read other information contained in the Annual Report and consider whether it is consistent with theaudited financial statements. We consider the implications for our report if we become aware of anyapparent misstatements or material inconsistencies with the financial statements. Our responsibilities donot extend to any other information.
Basis of audit opinion
We conducted our audit in accordance with International Standards on Auditing (UK and Ireland) issuedby the Auditing Practices Board. An audit includes examination, on a test basis, of evidence relevant to theamounts and disclosures in the financial statements and the part of the Directors’ Remuneration Report tobe audited. It also includes an assessment of the significant estimates and judgements made by thedirectors in the preparation of the financial statements, and of whether the accounting policies areappropriate to the Group’s and company’s circumstances, consistently applied and adequately disclosed.
We planned and performed our audit so as to obtain all the information and explanations which weconsidered necessary in order to provide us with sufficient evidence to give reasonable assurance that thefinancial statements and the part of the Directors’ Remuneration Report to be audited are free frommaterial misstatement, whether caused by fraud or other irregularity or error. In forming our opinion wealso evaluated the overall adequacy of the presentation of information in the financial statements and thepart of the Directors’ Remuneration Report to be audited.
F-162
www.global-reports.com
Opinion
In our opinion:
— the Group financial statements give a true and fair view, in accordance with IFRSs as adopted by theEU, of the state of the Group’s affairs as at 31 December 2005 and of its profit for the year thenended;
— the Group financial statements have been properly prepared in accordance with the Companies Act1985 and Article 4 of the IAS Regulation;
— the Parent company financial statements give a true and fair view, in accordance with UK GenerallyAccepted Accounting Practice, of the state of the Parent company’s affairs as at 31 December 2005;and
— the Parent company financial statements and the part of the Directors’ Remuneration Report to beaudited have been properly prepared in accordance with the Companies Act 1985.
KPMG Audit Plc 8 Salisbury SquareChartered Accountants LondonRegistered Auditor EC4Y 8BB
1 June 2006
F-163
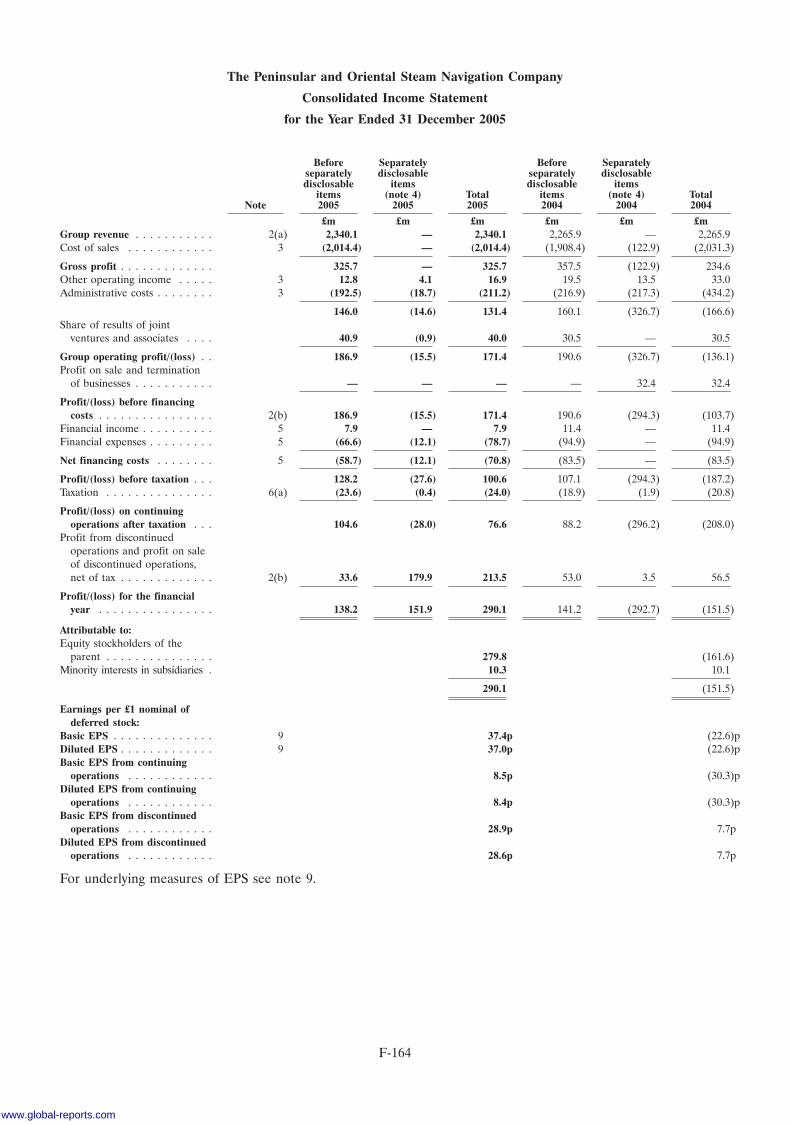
The Peninsular and Oriental Steam Navigation Company
Consolidated Income Statement
for the Year Ended 31 December 2005
Before Separately Before Separatelyseparately disclosable separately disclosabledisclosable items disclosable items
items (note 4) Total items (note 4) TotalNote 2005 2005 2005 2004 2004 2004
£m £m £m £m £m £mGroup revenue . . . . . . . . . . . 2(a) 2,340.1 — 2,340.1 2,265.9 — 2,265.9Cost of sales . . . . . . . . . . . . 3 (2,014.4) — (2,014.4) (1,908.4) (122.9) (2,031.3)
Gross profit . . . . . . . . . . . . . 325.7 — 325.7 357.5 (122.9) 234.6Other operating income . . . . . 3 12.8 4.1 16.9 19.5 13.5 33.0Administrative costs . . . . . . . . 3 (192.5) (18.7) (211.2) (216.9) (217.3) (434.2)
146.0 (14.6) 131.4 160.1 (326.7) (166.6)Share of results of joint
ventures and associates . . . . 40.9 (0.9) 40.0 30.5 — 30.5
Group operating profit/(loss) . . 186.9 (15.5) 171.4 190.6 (326.7) (136.1)Profit on sale and termination
of businesses . . . . . . . . . . . — — — — 32.4 32.4
Profit/(loss) before financingcosts . . . . . . . . . . . . . . . . 2(b) 186.9 (15.5) 171.4 190.6 (294.3) (103.7)
Financial income . . . . . . . . . . 5 7.9 — 7.9 11.4 — 11.4Financial expenses . . . . . . . . . 5 (66.6) (12.1) (78.7) (94.9) — (94.9)
Net financing costs . . . . . . . . 5 (58.7) (12.1) (70.8) (83.5) — (83.5)
Profit/(loss) before taxation . . . 128.2 (27.6) 100.6 107.1 (294.3) (187.2)Taxation . . . . . . . . . . . . . . . 6(a) (23.6) (0.4) (24.0) (18.9) (1.9) (20.8)
Profit/(loss) on continuingoperations after taxation . . . 104.6 (28.0) 76.6 88.2 (296.2) (208.0)
Profit from discontinuedoperations and profit on saleof discontinued operations,net of tax . . . . . . . . . . . . . 2(b) 33.6 179.9 213.5 53.0 3.5 56.5
Profit/(loss) for the financialyear . . . . . . . . . . . . . . . . 138.2 151.9 290.1 141.2 (292.7) (151.5)
Attributable to:Equity stockholders of the
parent . . . . . . . . . . . . . . . 279.8 (161.6)Minority interests in subsidiaries . 10.3 10.1
290.1 (151.5)
Earnings per £1 nominal ofdeferred stock:
Basic EPS . . . . . . . . . . . . . . 9 37.4p (22.6)pDiluted EPS . . . . . . . . . . . . . 9 37.0p (22.6)pBasic EPS from continuing
operations . . . . . . . . . . . . 8.5p (30.3)pDiluted EPS from continuing
operations . . . . . . . . . . . . 8.4p (30.3)pBasic EPS from discontinued
operations . . . . . . . . . . . . 28.9p 7.7pDiluted EPS from discontinued
operations . . . . . . . . . . . . 28.6p 7.7p
For underlying measures of EPS see note 9.
F-164
www.global-reports.com
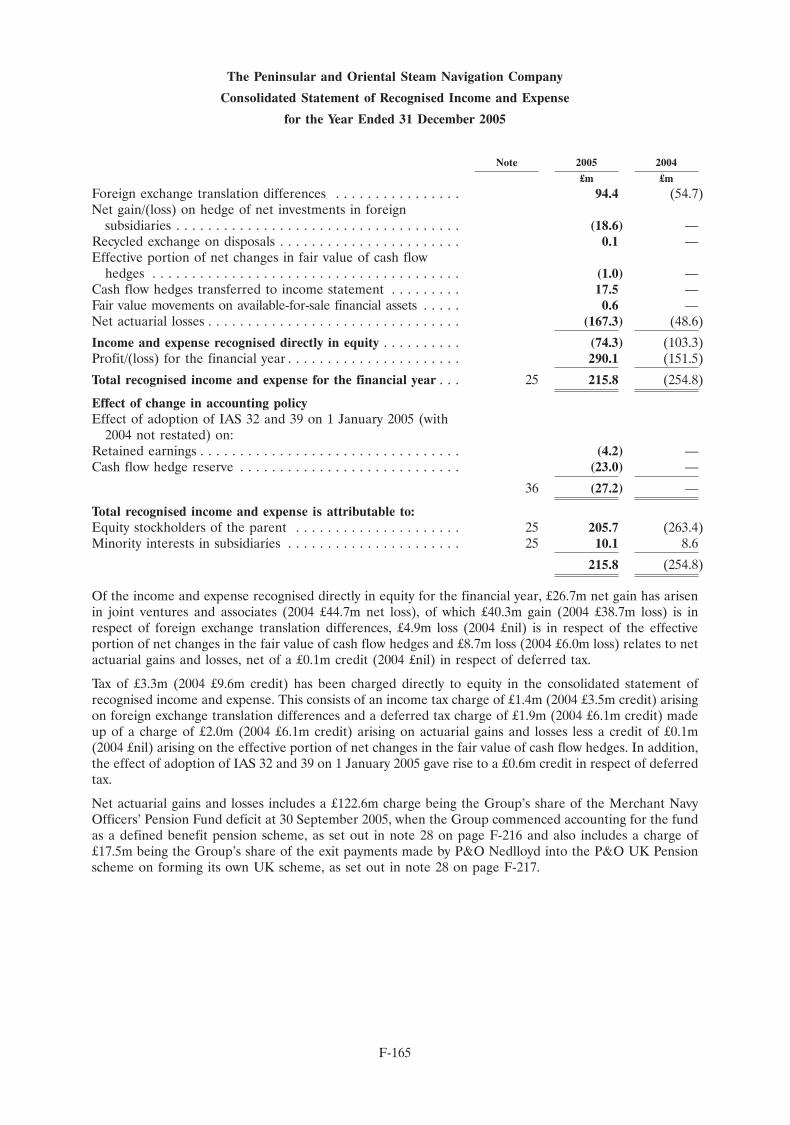
The Peninsular and Oriental Steam Navigation Company
Consolidated Statement of Recognised Income and Expense
for the Year Ended 31 December 2005
Note 2005 2004
£m £m
Foreign exchange translation differences . . . . . . . . . . . . . . . . 94.4 (54.7)Net gain/(loss) on hedge of net investments in foreign
subsidiaries . . . . . . . . . . . . . . . . . . . . . . . . . . . . . . . . . . . . (18.6) —Recycled exchange on disposals . . . . . . . . . . . . . . . . . . . . . . . 0.1 —Effective portion of net changes in fair value of cash flow
hedges . . . . . . . . . . . . . . . . . . . . . . . . . . . . . . . . . . . . . . . (1.0) —Cash flow hedges transferred to income statement . . . . . . . . . 17.5 —Fair value movements on available-for-sale financial assets . . . . . 0.6 —Net actuarial losses . . . . . . . . . . . . . . . . . . . . . . . . . . . . . . . . (167.3) (48.6)
Income and expense recognised directly in equity . . . . . . . . . . (74.3) (103.3)Profit/(loss) for the financial year . . . . . . . . . . . . . . . . . . . . . . 290.1 (151.5)
Total recognised income and expense for the financial year . . . 25 215.8 (254.8)
Effect of change in accounting policyEffect of adoption of IAS 32 and 39 on 1 January 2005 (with
2004 not restated) on:Retained earnings . . . . . . . . . . . . . . . . . . . . . . . . . . . . . . . . . (4.2) —Cash flow hedge reserve . . . . . . . . . . . . . . . . . . . . . . . . . . . . (23.0) —
36 (27.2) —
Total recognised income and expense is attributable to:Equity stockholders of the parent . . . . . . . . . . . . . . . . . . . . . 25 205.7 (263.4)Minority interests in subsidiaries . . . . . . . . . . . . . . . . . . . . . . 25 10.1 8.6
215.8 (254.8)
Of the income and expense recognised directly in equity for the financial year, £26.7m net gain has arisenin joint ventures and associates (2004 £44.7m net loss), of which £40.3m gain (2004 £38.7m loss) is inrespect of foreign exchange translation differences, £4.9m loss (2004 £nil) is in respect of the effectiveportion of net changes in the fair value of cash flow hedges and £8.7m loss (2004 £6.0m loss) relates to netactuarial gains and losses, net of a £0.1m credit (2004 £nil) in respect of deferred tax.
Tax of £3.3m (2004 £9.6m credit) has been charged directly to equity in the consolidated statement ofrecognised income and expense. This consists of an income tax charge of £1.4m (2004 £3.5m credit) arisingon foreign exchange translation differences and a deferred tax charge of £1.9m (2004 £6.1m credit) madeup of a charge of £2.0m (2004 £6.1m credit) arising on actuarial gains and losses less a credit of £0.1m(2004 £nil) arising on the effective portion of net changes in the fair value of cash flow hedges. In addition,the effect of adoption of IAS 32 and 39 on 1 January 2005 gave rise to a £0.6m credit in respect of deferredtax.
Net actuarial gains and losses includes a £122.6m charge being the Group’s share of the Merchant NavyOfficers’ Pension Fund deficit at 30 September 2005, when the Group commenced accounting for the fundas a defined benefit pension scheme, as set out in note 28 on page F-216 and also includes a charge of£17.5m being the Group’s share of the exit payments made by P&O Nedlloyd into the P&O UK Pensionscheme on forming its own UK scheme, as set out in note 28 on page F-217.
F-165
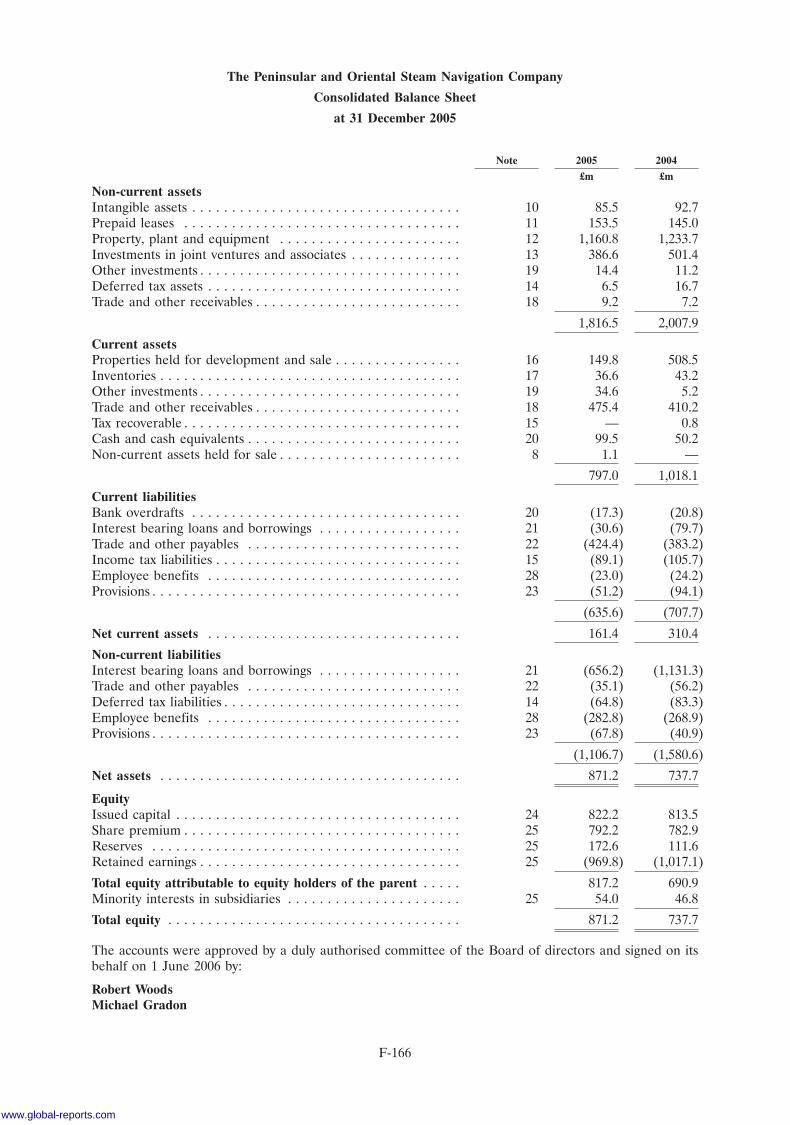
The Peninsular and Oriental Steam Navigation Company
Consolidated Balance Sheet
at 31 December 2005
Note 2005 2004
£m £m
Non-current assetsIntangible assets . . . . . . . . . . . . . . . . . . . . . . . . . . . . . . . . . . 10 85.5 92.7Prepaid leases . . . . . . . . . . . . . . . . . . . . . . . . . . . . . . . . . . . 11 153.5 145.0Property, plant and equipment . . . . . . . . . . . . . . . . . . . . . . . 12 1,160.8 1,233.7Investments in joint ventures and associates . . . . . . . . . . . . . . 13 386.6 501.4Other investments . . . . . . . . . . . . . . . . . . . . . . . . . . . . . . . . . 19 14.4 11.2Deferred tax assets . . . . . . . . . . . . . . . . . . . . . . . . . . . . . . . . 14 6.5 16.7Trade and other receivables . . . . . . . . . . . . . . . . . . . . . . . . . . 18 9.2 7.2
1,816.5 2,007.9
Current assetsProperties held for development and sale . . . . . . . . . . . . . . . . 16 149.8 508.5Inventories . . . . . . . . . . . . . . . . . . . . . . . . . . . . . . . . . . . . . . 17 36.6 43.2Other investments . . . . . . . . . . . . . . . . . . . . . . . . . . . . . . . . . 19 34.6 5.2Trade and other receivables . . . . . . . . . . . . . . . . . . . . . . . . . . 18 475.4 410.2Tax recoverable . . . . . . . . . . . . . . . . . . . . . . . . . . . . . . . . . . . 15 — 0.8Cash and cash equivalents . . . . . . . . . . . . . . . . . . . . . . . . . . . 20 99.5 50.2Non-current assets held for sale . . . . . . . . . . . . . . . . . . . . . . . 8 1.1 —
797.0 1,018.1
Current liabilitiesBank overdrafts . . . . . . . . . . . . . . . . . . . . . . . . . . . . . . . . . . 20 (17.3) (20.8)Interest bearing loans and borrowings . . . . . . . . . . . . . . . . . . 21 (30.6) (79.7)Trade and other payables . . . . . . . . . . . . . . . . . . . . . . . . . . . 22 (424.4) (383.2)Income tax liabilities . . . . . . . . . . . . . . . . . . . . . . . . . . . . . . . 15 (89.1) (105.7)Employee benefits . . . . . . . . . . . . . . . . . . . . . . . . . . . . . . . . 28 (23.0) (24.2)Provisions . . . . . . . . . . . . . . . . . . . . . . . . . . . . . . . . . . . . . . . 23 (51.2) (94.1)
(635.6) (707.7)
Net current assets . . . . . . . . . . . . . . . . . . . . . . . . . . . . . . . . 161.4 310.4
Non-current liabilitiesInterest bearing loans and borrowings . . . . . . . . . . . . . . . . . . 21 (656.2) (1,131.3)Trade and other payables . . . . . . . . . . . . . . . . . . . . . . . . . . . 22 (35.1) (56.2)Deferred tax liabilities . . . . . . . . . . . . . . . . . . . . . . . . . . . . . . 14 (64.8) (83.3)Employee benefits . . . . . . . . . . . . . . . . . . . . . . . . . . . . . . . . 28 (282.8) (268.9)Provisions . . . . . . . . . . . . . . . . . . . . . . . . . . . . . . . . . . . . . . . 23 (67.8) (40.9)
(1,106.7) (1,580.6)
Net assets . . . . . . . . . . . . . . . . . . . . . . . . . . . . . . . . . . . . . . 871.2 737.7
EquityIssued capital . . . . . . . . . . . . . . . . . . . . . . . . . . . . . . . . . . . . 24 822.2 813.5Share premium . . . . . . . . . . . . . . . . . . . . . . . . . . . . . . . . . . . 25 792.2 782.9Reserves . . . . . . . . . . . . . . . . . . . . . . . . . . . . . . . . . . . . . . . 25 172.6 111.6Retained earnings . . . . . . . . . . . . . . . . . . . . . . . . . . . . . . . . . 25 (969.8) (1,017.1)
Total equity attributable to equity holders of the parent . . . . . 817.2 690.9Minority interests in subsidiaries . . . . . . . . . . . . . . . . . . . . . . 25 54.0 46.8
Total equity . . . . . . . . . . . . . . . . . . . . . . . . . . . . . . . . . . . . . 871.2 737.7
The accounts were approved by a duly authorised committee of the Board of directors and signed on itsbehalf on 1 June 2006 by:
Robert WoodsMichael Gradon
F-166
www.global-reports.com
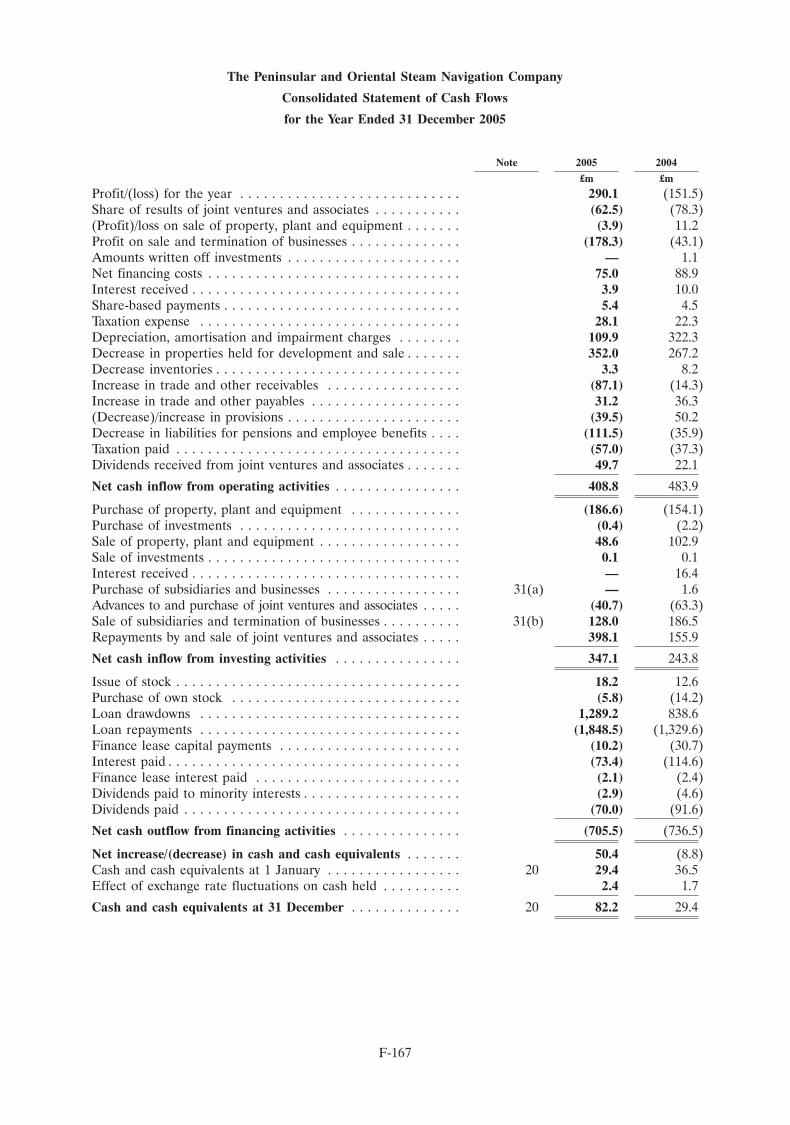
The Peninsular and Oriental Steam Navigation Company
Consolidated Statement of Cash Flows
for the Year Ended 31 December 2005
Note 2005 2004
£m £m
Profit/(loss) for the year . . . . . . . . . . . . . . . . . . . . . . . . . . . . 290.1 (151.5)Share of results of joint ventures and associates . . . . . . . . . . . (62.5) (78.3)(Profit)/loss on sale of property, plant and equipment . . . . . . . (3.9) 11.2Profit on sale and termination of businesses . . . . . . . . . . . . . . (178.3) (43.1)Amounts written off investments . . . . . . . . . . . . . . . . . . . . . . — 1.1Net financing costs . . . . . . . . . . . . . . . . . . . . . . . . . . . . . . . . 75.0 88.9Interest received . . . . . . . . . . . . . . . . . . . . . . . . . . . . . . . . . . 3.9 10.0Share-based payments . . . . . . . . . . . . . . . . . . . . . . . . . . . . . . 5.4 4.5Taxation expense . . . . . . . . . . . . . . . . . . . . . . . . . . . . . . . . . 28.1 22.3Depreciation, amortisation and impairment charges . . . . . . . . 109.9 322.3Decrease in properties held for development and sale . . . . . . . 352.0 267.2Decrease inventories . . . . . . . . . . . . . . . . . . . . . . . . . . . . . . . 3.3 8.2Increase in trade and other receivables . . . . . . . . . . . . . . . . . (87.1) (14.3)Increase in trade and other payables . . . . . . . . . . . . . . . . . . . 31.2 36.3(Decrease)/increase in provisions . . . . . . . . . . . . . . . . . . . . . . (39.5) 50.2Decrease in liabilities for pensions and employee benefits . . . . (111.5) (35.9)Taxation paid . . . . . . . . . . . . . . . . . . . . . . . . . . . . . . . . . . . . (57.0) (37.3)Dividends received from joint ventures and associates . . . . . . . 49.7 22.1
Net cash inflow from operating activities . . . . . . . . . . . . . . . . 408.8 483.9
Purchase of property, plant and equipment . . . . . . . . . . . . . . (186.6) (154.1)Purchase of investments . . . . . . . . . . . . . . . . . . . . . . . . . . . . (0.4) (2.2)Sale of property, plant and equipment . . . . . . . . . . . . . . . . . . 48.6 102.9Sale of investments . . . . . . . . . . . . . . . . . . . . . . . . . . . . . . . . 0.1 0.1Interest received . . . . . . . . . . . . . . . . . . . . . . . . . . . . . . . . . . — 16.4Purchase of subsidiaries and businesses . . . . . . . . . . . . . . . . . 31(a) — 1.6Advances to and purchase of joint ventures and associates . . . . . (40.7) (63.3)Sale of subsidiaries and termination of businesses . . . . . . . . . . 31(b) 128.0 186.5Repayments by and sale of joint ventures and associates . . . . . 398.1 155.9
Net cash inflow from investing activities . . . . . . . . . . . . . . . . 347.1 243.8
Issue of stock . . . . . . . . . . . . . . . . . . . . . . . . . . . . . . . . . . . . 18.2 12.6Purchase of own stock . . . . . . . . . . . . . . . . . . . . . . . . . . . . . (5.8) (14.2)Loan drawdowns . . . . . . . . . . . . . . . . . . . . . . . . . . . . . . . . . 1,289.2 838.6Loan repayments . . . . . . . . . . . . . . . . . . . . . . . . . . . . . . . . . (1,848.5) (1,329.6)Finance lease capital payments . . . . . . . . . . . . . . . . . . . . . . . (10.2) (30.7)Interest paid . . . . . . . . . . . . . . . . . . . . . . . . . . . . . . . . . . . . . (73.4) (114.6)Finance lease interest paid . . . . . . . . . . . . . . . . . . . . . . . . . . (2.1) (2.4)Dividends paid to minority interests . . . . . . . . . . . . . . . . . . . . (2.9) (4.6)Dividends paid . . . . . . . . . . . . . . . . . . . . . . . . . . . . . . . . . . . (70.0) (91.6)
Net cash outflow from financing activities . . . . . . . . . . . . . . . (705.5) (736.5)
Net increase/(decrease) in cash and cash equivalents . . . . . . . 50.4 (8.8)Cash and cash equivalents at 1 January . . . . . . . . . . . . . . . . . 20 29.4 36.5Effect of exchange rate fluctuations on cash held . . . . . . . . . . 2.4 1.7
Cash and cash equivalents at 31 December . . . . . . . . . . . . . . 20 82.2 29.4
F-167
The Peninsular and Oriental Steam Navigation Company
Notes to the Consolidated Financial Statements
1 Significant accounting policies
The Peninsular and Oriental Steam Navigation Company is a company domiciled in the United Kingdom.The consolidated financial statements of the Company for the year ended 31 December 2005 comprise theCompany and its subsidiaries (together referred to as the ‘‘Group’’) and the Group’s interests in associatesand jointly controlled entities.
The consolidated financial statements were authorised for issuance by the directors on 1 June 2006.
Transition to International Financial Reporting Standards (‘‘IFRS’’)
The consolidated financial statements have been prepared in accordance with IFRS as adopted by the EUand its interpretations adopted by the International Accounting Standards Board (‘‘IASB’’). These are theGroup’s first consolidated financial statements under IFRS and IFRS 1 ‘First-time Adoption ofInternational Financial Reporting Standards’ has been applied.
An explanation of how the transition to IFRS has affected the reported financial position, financialperformance and cash flows of the Group is provided in note 36.
The Company has elected to prepare its financial statements in accordance with UK GAAP. These arepresented on pages F-239 to F-261.
Basis of preparation
These financial statements are presented in sterling, the Group’s functional currency, rounded to thenearest 0.1 million. They are prepared on the historical cost basis except for derivative financialinstruments and available-for-sale assets, which are stated at fair value, and non-current assets held for salewhich are stated at the lower of previous carrying amount and fair value less costs to sell.
The preparation of financial statements in conformity with IFRS requires management to makejudgements, estimates and assumptions that affect the application of policies and reported amounts ofassets and liabilities, income and expenses. The estimates and associated assumptions are based onhistorical experience and various other factors that are believed to be reasonable under the circumstances,the results of which form the basis of making the judgements about carrying values of assets and liabilitiesthat are not readily apparent from other sources. Actual results may differ from these estimates.
The estimates and underlying assumptions are reviewed on an ongoing basis. Revisions to accountingestimates are recognised in the period in which the estimate is revised if the revision affects only thatperiod, or in the period of the revision and future periods if the revision affects both current and futureperiods.
Judgements made by management in the application of IFRS that have a significant effect on the financialstatements and estimates with a significant risk of material adjustment in the next year are discussed innote 35.
The following accounting policies, unless otherwise stated, have been applied consistently to all periodspresented in these consolidated financial statements in dealing with items which are considered material inrelation to these consolidated financial statements and in preparing an opening IFRS balance sheet at1 January 2004 for the purposes of transition to IFRS.
They have been applied consistently by Group entities.
Transitional arrangements
The rules for first time adoption of IFRS are set out in IFRS 1. In general a company is required todetermine its IFRS accounting policies and apply these retrospectively to determine the opening IFRScompliant balance sheet. The standard permits a number of exceptions to this general principle to assistcompanies as they transition to IFRS.
F-168
www.global-reports.com
The Peninsular and Oriental Steam Navigation Company
Notes to the Consolidated Financial Statements (Continued)
1 Significant accounting policies (Continued)
When preparing the Group’s IFRS balance sheet at 1 January 2004, the date of transition, the followingoptional exemptions, provided by IFRS 1, from full retrospective application of IFRS accounting policieshave been adopted:
� IFRS 3 ‘Business Combinations’—the provisions of IFRS 3 have been applied prospectively from1 January 2004, and the classification and accounting treatment of business combinations thatoccurred prior to this date have not been reconsidered in the preparation of the Group’s openingIFRS balance sheet at 1 January 2004;
� IAS 32 ‘Financial Instruments: Disclosure and Presentation’ and IAS 39 ‘Financial Instruments:Recognition and Measurement’—the provisions of IAS 32 and IAS 39 have not been applied tothe financial statements for the year ended 31 December 2004, which form the comparativeperiod to the Group’s first IFRS compliant financial statements and which, for these purposes,have been prepared on the basis of previous UK GAAP accounting policies. The Group hasapplied the exemption available under IFRS 1 that allows comparatives not to be restated forIAS 32 and IAS 39. The effect of adopting IAS 32 and IAS 39 is explained in note 36;
� Until 31 December 2004 the Group adopted hedge accounting for interest rate transactions andforeign exchange transactions in accordance with UK GAAP. With effect from 1 January 2005,subject to specific criteria, derivative financial instruments, financial assets and financial liabilitiesmay be designated as forming hedge relationships as a result of which fair value changes areoffset in the income statement or recognised directly in the statement of recognised income andexpense depending on the nature of the hedge relationship;
� Where items of property, plant and equipment have previously been revalued, the revaluedamount at 1 January 2004 has been deemed to be the cost at that date;
� Cumulative translation differences arising on consolidation of subsidiaries—IAS 21 ‘The Effectsof Changes in Foreign Exchange Rates’ requires such differences to be held in a separate reserve,rather than included in the profit and loss reserve under UK GAAP. This reserve has beendeemed to be nil on 1 January 2004; and
� IFRS 5 ‘Non-current Assets Held for Sale and Discontinued Operations’ has been appliedprospectively from 1 January 2005 (see page F-177).
Basis of consolidation
Intragroup balances and any unrealised gains and losses or income and expenses arising from intragrouptransactions, are eliminated in preparing the consolidated financial statements. Unrealised gains fromtransactions with joint ventures and associates are eliminated to the extent of the Group’s interest in theentity. Unrealised losses are eliminated in the same way as unrealised gains, but only to the extent thatthere is no evidence of impairment.
Subsidiaries
The Group financial statements include the results of the Company and its subsidiary undertakingstogether with the Group’s share of the results of its joint ventures and associates. A subsidiary is an entitycontrolled by the Company. Control is regarded as the power, directly or indirectly, to govern the financialand operating policies of an entity so as to obtain benefits from its activities. In assessing control, potentialvoting rights that are presently exercisable or convertible are taken into account. The financial statementsof subsidiaries are consolidated from the date that control commences until the date that control ceases.
Associates
An associate is an undertaking in which the Group has significant influence, but not control, over thefinancial and operating policies. The Group’s share of the total recognised gains and losses of associates isincluded on an equity accounted basis in the consolidated income statement or statement of recognised
F-169
The Peninsular and Oriental Steam Navigation Company
Notes to the Consolidated Financial Statements (Continued)
1 Significant accounting policies (Continued)
income and expense (as appropriate) and its interest in their net assets is included within investments inthe consolidated balance sheet from the date that significant influence commences until the date thatsignificant influence ceases. When the Group’s share of losses exceeds the carrying amount of theassociate, the carrying amount is reduced to nil and recognition of further losses is discontinued except tothe extent that the Group has incurred legal or constructive obligations in respect of the associate.
Joint ventures
A joint venture is an undertaking in which the Group has joint control, established by a contractualarrangement with one or more other parties. The Group equity accounts for its joint ventures andtherefore its share of the profits less losses of joint ventures are included in the consolidated incomestatement or statement of recognised income and expense (as appropriate) and its interest in their netassets is included in investments in the consolidated balance sheet.
Foreign currency
Foreign currency transactions
Transactions in foreign currencies are recorded at the rate of exchange ruling at the date of the transaction.Monetary assets and liabilities denominated in foreign currencies at the balance sheet date are translatedinto sterling at the rate of exchange ruling at that date. Foreign exchange differences arising on translationare recognised in the income statement. Non-monetary asset and liabilities that are measured in terms ofhistorical cost in a foreign currency are translated using the rate of exchange ruling at the date of thetransaction.
Financial statements of foreign operations
The assets and liabilities of foreign operations, including goodwill and fair value adjustments arising onconsolidation, are translated to sterling at the rates of exchange ruling at the balance sheet date. Therevenues and expenses of foreign operations are translated into sterling at rates approximating to the ratesof exchange ruling at the dates of the transactions. Foreign exchange differences arising on retranslationare recognised directly in a separate component of equity.
Net investment in foreign operations
Exchange differences arising from the translation of the net investment in foreign operations, and ofrelated hedges, are taken to the translation reserve in accordance with the hedging policy described below.
Financial instruments
IAS 32 and IAS 39 address the accounting for, and reporting of, financial instruments. IAS 39 sets outdetailed accounting requirements in relation to financial assets and liabilities. As outlined above undertransitional arrangements, this has been applied by the Group for the first time for the year ended31 December 2005. Under the exemption available in IFRS 1 the comparatives have not been restated forIAS 32 and IAS 39 and continue to reflect previously applied UK GAAP. The respective accountingpolicies are described below.
The Group uses derivative financial instruments, including interest rate swaps, foreign exchange contractsand options to hedge its exposure to foreign exchange and interest rate risks arising from operating,financing and investing activities. In accordance with its treasury policy, the Group does not hold or issuederivative financial instruments for speculative purposes.
Derivative financial instruments are recognised initially at cost. Subsequent to initial recognition,derivative financial instruments are stated at fair value. Where derivatives qualify for hedge accounting,recognition of any resultant gain or loss depends on the nature of the item being hedged (see accountingpolicy for hedging), otherwise the gain or loss on remeasurement to fair value is recognised immediately inprofit or loss.
F-170
www.global-reports.com
The Peninsular and Oriental Steam Navigation Company
Notes to the Consolidated Financial Statements (Continued)
1 Significant accounting policies (Continued)
The fair value of interest rate swaps is the estimated amount that the Group would receive or pay toterminate the swap at the balance sheet date, taking into account current interest rates and the currentcreditworthiness of the swap counterparties. The fair value of forward exchange contracts is their quotedmarket price at the balance sheet date.
Hedging
Cash flow hedges
Where a derivative financial instrument is designated as a hedge of the variability in cash flows of arecognised asset or liability, or a highly probable forecasted transaction, the effective part of any gain orloss on the derivative financial instrument is recognised directly in equity. When the forecasted transactionsubsequently results in the recognition of a non-financial asset or non-financial liability, or the forecasttransaction for a non-financial asset or non-financial liability becomes a firm commitment for which fairvalue hedge accounting is applied, the associated cumulative gain or loss is removed from equity andincluded in the initial cost or other carrying amount of the non-financial asset or non-financial liability. If ahedge of a forecasted transaction subsequently results in the recognition of a financial asset or a financialliability, the associated gains and losses that were recognised directly in equity are reclassified into profit orloss in the same period or periods during which the asset acquired or liability assumed affects profit or loss(i.e. when interest income or expense is recognised). For cash flow hedges other than those covered by thepreceding two policy statements, the associated cumulative gain or loss is removed from equity andrecognised in the income statement in the same period or periods during which the hedged forecasttransaction affects profit or loss. Any gain or loss arising on an ineffective part of a hedge transaction isrecognised in the income statement immediately.
When a hedging instrument expires or is sold, terminated or exercised, or the entity revokes designation ofthe hedge relationship but the hedged forecast transaction is still expected to occur, the cumulative gain orloss at that point remains in equity and is recognised in accordance with the above policy when thetransaction occurs. If the hedged transaction is no longer expected to take place, the cumulative unrealisedgain or loss recognised in equity is recognised immediately in the income statement.
Hedge of net investment in foreign operations
Where a foreign currency liability hedges a net investment in a foreign operation, the portion of foreignexchange differences arising on translation of the liability that is determined to be an effective hedge isrecognised directly in equity. The ineffective portion is recognised immediately in profit or loss. Whereexchange differences have been deferred in equity, they are recycled to the income statement upondisposal of the respective foreign operation.
As noted above, the comparatives have not been restated for IAS 32 and IAS 39. Accordingly the Grouphas continued to apply its previous UK GAAP accounting policy, in its comparative figures. Under thisaccounting policy amounts payable or receivable in respect of interest rate swaps are recognised within theinterest expense over the period of the contracts. Non interest bearing amounts due after one year arediscounted at a rate approximating to current interest rates. Gains and losses on instruments used forhedging are not recognised until the exposure that is being hedged is itself recognised.
Financial guarantees
The Group has not adopted amendments to IAS 39 and IFRS 4 in relation to financial guarantee contractswhich will apply for periods commencing on or after 1 January 2006.
Where the Group enters into financial guarantee contracts to guarantee the indebtedness of joint venturesor associates, the Group considers these to be insurance arrangements, and accounts for them as such. Inthis respect, the Group treats the guarantee contract as a contingent liability until such time as it becomesprobable that the Group will be required to make a payment under the guarantee.
F-171
The Peninsular and Oriental Steam Navigation Company
Notes to the Consolidated Financial Statements (Continued)
1 Significant accounting policies (Continued)
The Group does not expect the amendments to have any impact on the financial statements for the periodcommencing 1 January 2006.
Investments
Investments in debt and equity securities
Where the Group has the positive intent and ability to hold debt instruments to maturity, they are stated atamortised cost less impairment losses.
Other investments in debt and equity securities held by the Group are classified as being available-for-saleand are stated at fair value, with any resultant gain or loss being recognised directly in equity, except forimpairment losses and, in the case of monetary items such as debt securities, foreign exchange gains andlosses. When these investments are derecognised, the cumulative gain or loss previously recognised inequity is recognised in profit or loss. Where these investments are interest-bearing, interest calculatedusing the effective interest method is recognised in profit or loss.
The fair value of financial instruments classified as available-for-sale is their quoted bid-price at thebalance sheet date. Available-for-sale investments are recognised/derecognised by the Group on the date itcommits to purchase/sell the investments. Securities held-to-maturity are recognised/derecognised on theday they are transferred to/by the Group.
The Group does not hold investments in debt or equity securities for trading purposes.
The comparative information for other investments are presented in accordance with UK GAAP and arestated at historical cost net of provisions for impairment.
Intangible assets
Goodwill arising on consolidation
Purchased goodwill represents amounts arising on acquisition of subsidiaries, associates and joint ventures.Goodwill represents the difference between the cost of the acquisition and the fair value of the netidentifiable assets acquired.
In respect of acquisitions prior to 1 January 2004, goodwill is included on the basis of its deemed costwhich represents the carrying amount (net of accumulated amortisation) as recorded previously underUK GAAP.
Goodwill is stated at cost or deemed cost less any accumulated impairment losses. Goodwill is allocated tocash generating units and is not amortised but is tested annually for impairments (see accounting policy forimpairment). In respect of associates and joint ventures the carrying amount of goodwill is included as partof the carrying amount of the investment in the associate or joint venture.
Negative goodwill arising on acquisition is recognised directly in the income statement.
The Group’s policy prior to 1998 was to eliminate goodwill arising upon acquisitions against reserves.Under IFRS 1 and IFRS 3, such goodwill remains eliminated against reserves.
Property, plant and equipment
Owned assets
Items of property, plant and equipment are stated at cost or deemed cost less accumulated depreciation(see below) and impairment losses (see accounting policy for impairment). The cost of self-constructedassets includes the cost of materials, direct labour and an appropriate proportion of production overheads.Interest incurred in respect of costs relating to assets under construction is capitalised into the cost of theasset concerned.
F-172
www.global-reports.com
The Peninsular and Oriental Steam Navigation Company
Notes to the Consolidated Financial Statements (Continued)
1 Significant accounting policies (Continued)
Certain items of property, plant and equipment that had been revalued to fair value on or prior to1 January 2004, the date of transition to IFRS, are measured on the basis of deemed costs, being therevalued amount at the date of that revaluation.
Where an item of property, plant and equipment comprises major components having different usefullives, they are accounted for as separate items of property, plant and equipment.
Leased assets
Leases under which the Group assumes substantially all of the risks and rewards of ownership areclassified as finance leases. An asset acquired by way of a finance lease is stated at an amount equal to thelower of its fair value and the present value of the minimum lease payments at inception of the lease, lessaccumulated depreciation (see below) and impairment losses (see accounting policy for impairment). Thecapital element of future lease payments is treated as a liability. The interest element is charged to theincome statement over the period of the finance lease in proportion to the balance of capital repayments.
All other leases are classified as operating leases with the lease rentals payable being charged to theincome statement on a systematic basis over the term of the lease.
Subsequent expenditure
Expenditure incurred to replace a component of an item of property, plant and equipment that isaccounted for separately, including major inspection and overhaul expenditure, is capitalised. Othersubsequent expenditure is capitalised only when it increases the future economic benefits embodied in theitem of property, plant and equipment. All other expenditure is recognised in the income statement as anexpense as incurred.
Depreciation
Depreciation is calculated to write down the cost of property, plant and equipment to their estimatedresidual value on a straight line basis over the expected useful life of the asset concerned. Generally forships this is between 10 and 35 years, for freehold property 50 years and for other fixed assets (reportedwithin plant and machinery, fixtures and fittings) various periods of up to 40 years, the most significant ofwhich are cold storage facilities (up to 40 years), port equipment, such as cranes and straddle carriers (upto 25 years), Ports IT systems (up to 10 years) and other port equipment, such as forklifts, tractors andtrailers (5 to 10 years). Leased assets are depreciated over the remainder of the lease period. Nodepreciation is provided on freehold land.
Assets constructed by the Group are depreciated from the date on which they come into use.
Prepaid leases
Advance payments at the inception of operating leases are recognised as prepayments in respect of thatlease and recognised in profit or loss over the lease term on a systematic basis.
Properties held for development and sale
Properties held for development and sale are included in current assets at the lower of cost and netrealisable value, with any resultant gain or loss recognised in the income statement. Net realisable value isthe estimated selling price in the ordinary course of business, less the estimated costs of completion andselling expenses. Interest and other outgoings less income receivable are charged to the income statementduring development, except in respect of properties where the development period is extensive, when suchamounts are included in cost.
F-173
The Peninsular and Oriental Steam Navigation Company
Notes to the Consolidated Financial Statements (Continued)
1 Significant accounting policies (Continued)
Inventories
Inventories and work in progress are stated at the lower of cost and net realisable value. Net realisablevalue is the estimated selling price in the ordinary course of business, less the estimated costs ofcompletion and selling expenses. The cost of inventories within Ferries is based on the First-in-First-outprinciple, whilst within Ports inventories are accounted for on a weighted average basis.
Trade and other receivables
Trade and other receivables are stated at their cost less impairment losses (see accounting policy forimpairment).
Cash and cash equivalents
Cash and cash equivalents comprises cash balances and call deposits. Bank overdrafts that are repayableon demand and form an integral part of the Group’s cash management are included as a component ofcash and cash equivalents for the purpose of the statement of cash flows.
Trade and other payables
Trade and other payables are stated at cost.
Impairment
The carrying amounts of the Group’s assets, other than properties held for development and sale (seeaccounting policy for properties held for development and sale), inventories (see accounting policy forinventories) and deferred tax assets (see accounting policy for taxation), are reviewed at each balance sheetdate to determine whether there is any indication of impairment. If any such indication exists, the asset’srecoverable amount is estimated. For goodwill the recoverable amount is estimated at each balance sheetdate as well as when there are indications that the carrying value may not be recoverable. An impairmentloss is recognised whenever the carrying amount of an asset or its cash generating unit exceeds itsrecoverable amount. Impairment losses are recognised in the income statement.
Impairment losses recognised in respect of cash generating units are allocated first to reduce the carryingamount of any goodwill allocated to cash generating units, and then to reduce the carrying amount of theother assets in the unit on a pro rata basis. A cash generating unit is the smallest identifiable group ofassets that generates cash inflows that are largely independent of the cash flows from other assets orgroups of assets.
On transition to IFRS all goodwill was tested for impairment as at 1 January 2004, the date of transition,even though no indication of impairment existed.
Calculation of recoverable amount
The recoverable amount of assets other than receivables, is the greater of their net selling price and valuein use. In assessing value in use, the estimated future cash flows are discounted to their present value usinga pre-tax discount rate that reflects current market assessments of the time value of money and the risksspecific to the asset. For an asset that does not generate largely independent cash inflows, the recoverableamount is determined for the cash generating unit to which the asset belongs.
Reversals of impairment
An impairment loss in respect of goodwill is not reversed.
In respect of other assets, an impairment loss is reversed if there has been a change in the estimates usedto determine the recoverable amount.
F-174
www.global-reports.com
The Peninsular and Oriental Steam Navigation Company
Notes to the Consolidated Financial Statements (Continued)
1 Significant accounting policies (Continued)
An impairment loss is reversed only to the extent that the asset’s carrying amount does not exceed thecarrying amount that would have been determined, net of deprecation or amortisation, if no impairmentloss had been recognised.
Interest bearing loans and borrowings
Interest bearing loans and borrowings are recognised initially at fair value less attributable transactioncosts. Subsequent to initial recognition, interest bearing loans and borrowings are stated at amortised costswith any difference between cost and redemption value being recognised in the income statement over theperiod of the borrowings on an effective interest basis.
Share capital
Preference and concessionary stock
Preference and concessionary stock are classified as equity as they are non-redeemable and the directorsretain discretion over dividend payments. Dividends are recognised as distributions within equity and arerecognised as a liability in the period in which they are declared.
Repurchase of share capital
When share capital recognised as equity is purchased by the Company, the amount of the considerationpaid, including directly attributable costs, is recognised as a change in equity. Repurchased shares areclassified as treasury shares and are presented as a deduction from total equity.
Employee benefits
Pensions
The Group’s net obligation in respect of defined benefit pension plans is calculated separately for eachplan by estimating the amount of future benefit that employees have earned in return for their service inthe current and prior periods. That benefit is discounted to determine the present value, and the fair valueof any plan assets is deducted. The calculation is performed by a qualified actuary using the projected unitcredit method. The discount rate is the yield at the balance sheet date on AA credit rated bonds or localequivalent that have maturity dates approximating to the terms of the Group’s obligations.
When the benefits of a plan are improved, the portion of the increased benefit relating to past service byemployees is recognised as an expense in the income statement on a straight line basis over the averageperiod until the benefits become vested. To the extent that the benefits vest immediately, the expense isrecognised immediately in the income statement.
Actuarial gains and losses that arise in calculating the Group’s obligation in respect of a plan arerecognised in the period in which they arise directly in the statement of recognised income and expenses.
The operating and financing costs of defined benefit pension plans are recognised separately in the incomestatement; current service costs are spread systematically over the expected average remaining service livesof employees and financing costs are recognised in the periods within which they arise.
Contributions, including lump sum payments, in respect of defined contribution pension schemes andmulti employer defined benefit schemes where it is not possible to identify the Group’s share of thescheme, are charged to the income statement as they fall due.
Share-based payments
The Group operated five employee share plans: the Executive Stock Option Plan (‘‘P&O Option Plan’’),the P&O 2004 UK Sharesave Plan (‘‘2004 Plan’’), the Deferred Bonus and Co-investment Matching Plan(‘‘Matching Plan’’), the P&O Performance Share Plan (‘‘Performance Share Plan’’) and the P&O 2005Matching Share Plan (‘‘2005 Matching Share Plan’’). The fair values of grants under the P&O Option Plan
F-175
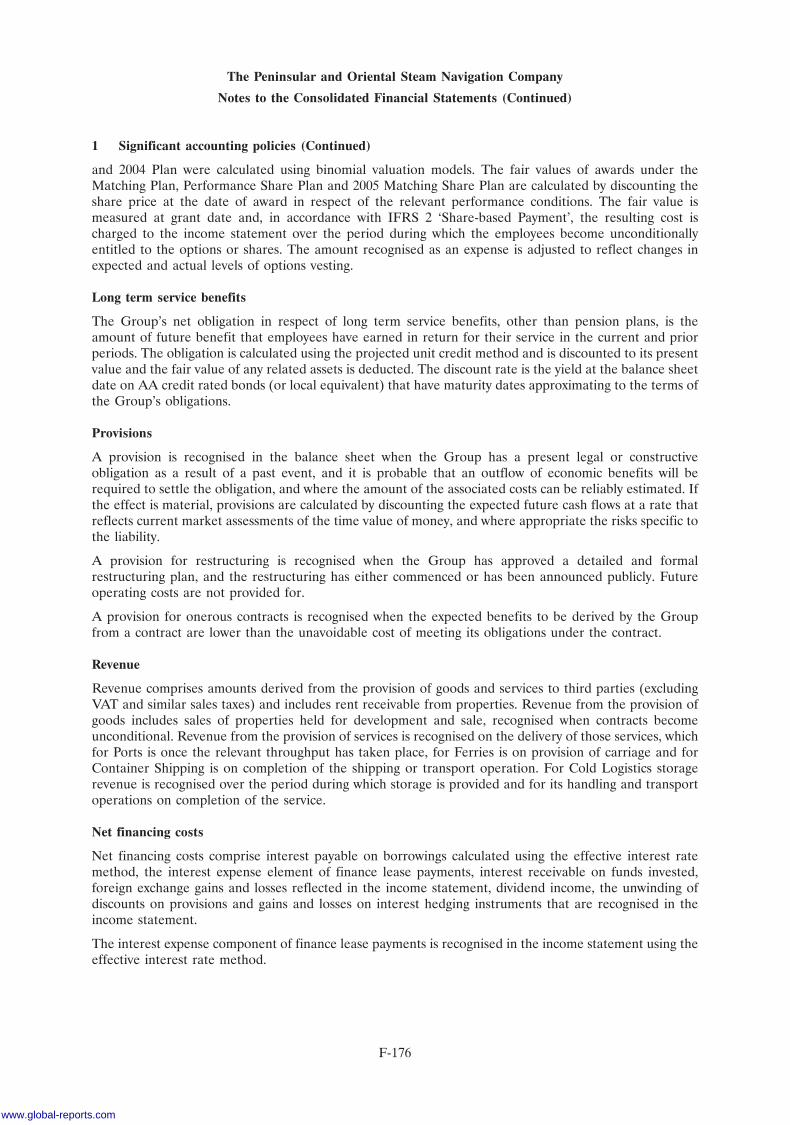
The Peninsular and Oriental Steam Navigation Company
Notes to the Consolidated Financial Statements (Continued)
1 Significant accounting policies (Continued)
and 2004 Plan were calculated using binomial valuation models. The fair values of awards under theMatching Plan, Performance Share Plan and 2005 Matching Share Plan are calculated by discounting theshare price at the date of award in respect of the relevant performance conditions. The fair value ismeasured at grant date and, in accordance with IFRS 2 ‘Share-based Payment’, the resulting cost ischarged to the income statement over the period during which the employees become unconditionallyentitled to the options or shares. The amount recognised as an expense is adjusted to reflect changes inexpected and actual levels of options vesting.
Long term service benefits
The Group’s net obligation in respect of long term service benefits, other than pension plans, is theamount of future benefit that employees have earned in return for their service in the current and priorperiods. The obligation is calculated using the projected unit credit method and is discounted to its presentvalue and the fair value of any related assets is deducted. The discount rate is the yield at the balance sheetdate on AA credit rated bonds (or local equivalent) that have maturity dates approximating to the terms ofthe Group’s obligations.
Provisions
A provision is recognised in the balance sheet when the Group has a present legal or constructiveobligation as a result of a past event, and it is probable that an outflow of economic benefits will berequired to settle the obligation, and where the amount of the associated costs can be reliably estimated. Ifthe effect is material, provisions are calculated by discounting the expected future cash flows at a rate thatreflects current market assessments of the time value of money, and where appropriate the risks specific tothe liability.
A provision for restructuring is recognised when the Group has approved a detailed and formalrestructuring plan, and the restructuring has either commenced or has been announced publicly. Futureoperating costs are not provided for.
A provision for onerous contracts is recognised when the expected benefits to be derived by the Groupfrom a contract are lower than the unavoidable cost of meeting its obligations under the contract.
Revenue
Revenue comprises amounts derived from the provision of goods and services to third parties (excludingVAT and similar sales taxes) and includes rent receivable from properties. Revenue from the provision ofgoods includes sales of properties held for development and sale, recognised when contracts becomeunconditional. Revenue from the provision of services is recognised on the delivery of those services, whichfor Ports is once the relevant throughput has taken place, for Ferries is on provision of carriage and forContainer Shipping is on completion of the shipping or transport operation. For Cold Logistics storagerevenue is recognised over the period during which storage is provided and for its handling and transportoperations on completion of the service.
Net financing costs
Net financing costs comprise interest payable on borrowings calculated using the effective interest ratemethod, the interest expense element of finance lease payments, interest receivable on funds invested,foreign exchange gains and losses reflected in the income statement, dividend income, the unwinding ofdiscounts on provisions and gains and losses on interest hedging instruments that are recognised in theincome statement.
The interest expense component of finance lease payments is recognised in the income statement using theeffective interest rate method.
F-176
www.global-reports.com
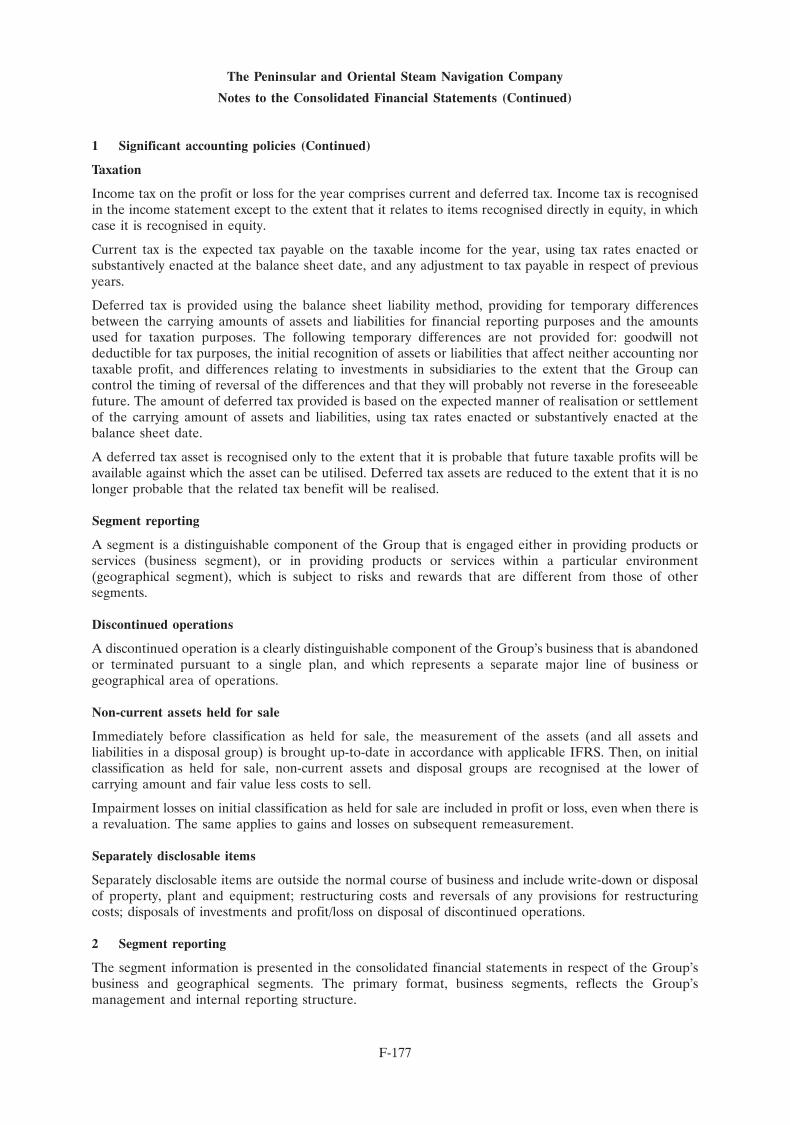
The Peninsular and Oriental Steam Navigation Company
Notes to the Consolidated Financial Statements (Continued)
1 Significant accounting policies (Continued)
Taxation
Income tax on the profit or loss for the year comprises current and deferred tax. Income tax is recognisedin the income statement except to the extent that it relates to items recognised directly in equity, in whichcase it is recognised in equity.
Current tax is the expected tax payable on the taxable income for the year, using tax rates enacted orsubstantively enacted at the balance sheet date, and any adjustment to tax payable in respect of previousyears.
Deferred tax is provided using the balance sheet liability method, providing for temporary differencesbetween the carrying amounts of assets and liabilities for financial reporting purposes and the amountsused for taxation purposes. The following temporary differences are not provided for: goodwill notdeductible for tax purposes, the initial recognition of assets or liabilities that affect neither accounting nortaxable profit, and differences relating to investments in subsidiaries to the extent that the Group cancontrol the timing of reversal of the differences and that they will probably not reverse in the foreseeablefuture. The amount of deferred tax provided is based on the expected manner of realisation or settlementof the carrying amount of assets and liabilities, using tax rates enacted or substantively enacted at thebalance sheet date.
A deferred tax asset is recognised only to the extent that it is probable that future taxable profits will beavailable against which the asset can be utilised. Deferred tax assets are reduced to the extent that it is nolonger probable that the related tax benefit will be realised.
Segment reporting
A segment is a distinguishable component of the Group that is engaged either in providing products orservices (business segment), or in providing products or services within a particular environment(geographical segment), which is subject to risks and rewards that are different from those of othersegments.
Discontinued operations
A discontinued operation is a clearly distinguishable component of the Group’s business that is abandonedor terminated pursuant to a single plan, and which represents a separate major line of business orgeographical area of operations.
Non-current assets held for sale
Immediately before classification as held for sale, the measurement of the assets (and all assets andliabilities in a disposal group) is brought up-to-date in accordance with applicable IFRS. Then, on initialclassification as held for sale, non-current assets and disposal groups are recognised at the lower ofcarrying amount and fair value less costs to sell.
Impairment losses on initial classification as held for sale are included in profit or loss, even when there isa revaluation. The same applies to gains and losses on subsequent remeasurement.
Separately disclosable items
Separately disclosable items are outside the normal course of business and include write-down or disposalof property, plant and equipment; restructuring costs and reversals of any provisions for restructuringcosts; disposals of investments and profit/loss on disposal of discontinued operations.
2 Segment reporting
The segment information is presented in the consolidated financial statements in respect of the Group’sbusiness and geographical segments. The primary format, business segments, reflects the Group’smanagement and internal reporting structure.
F-177
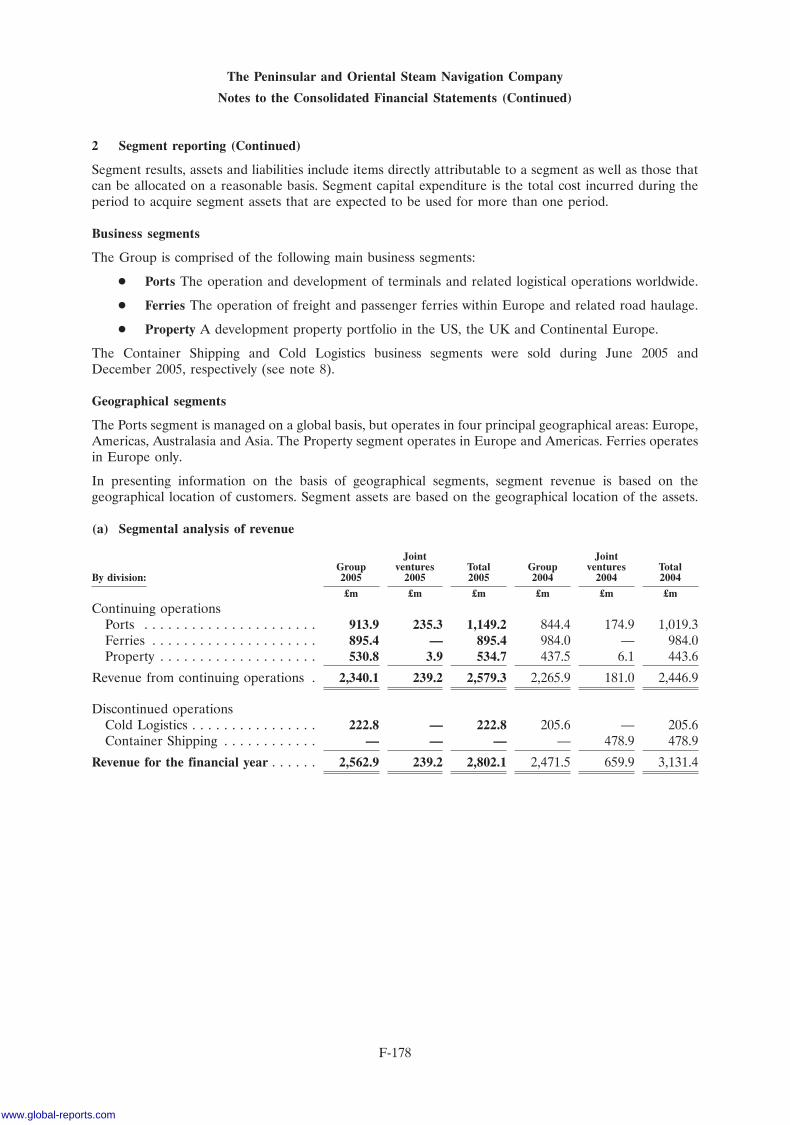
The Peninsular and Oriental Steam Navigation Company
Notes to the Consolidated Financial Statements (Continued)
2 Segment reporting (Continued)
Segment results, assets and liabilities include items directly attributable to a segment as well as those thatcan be allocated on a reasonable basis. Segment capital expenditure is the total cost incurred during theperiod to acquire segment assets that are expected to be used for more than one period.
Business segments
The Group is comprised of the following main business segments:
� Ports The operation and development of terminals and related logistical operations worldwide.
� Ferries The operation of freight and passenger ferries within Europe and related road haulage.
� Property A development property portfolio in the US, the UK and Continental Europe.
The Container Shipping and Cold Logistics business segments were sold during June 2005 andDecember 2005, respectively (see note 8).
Geographical segments
The Ports segment is managed on a global basis, but operates in four principal geographical areas: Europe,Americas, Australasia and Asia. The Property segment operates in Europe and Americas. Ferries operatesin Europe only.
In presenting information on the basis of geographical segments, segment revenue is based on thegeographical location of customers. Segment assets are based on the geographical location of the assets.
(a) Segmental analysis of revenue
Joint JointGroup ventures Total Group ventures Total
By division: 2005 2005 2005 2004 2004 2004
£m £m £m £m £m £m
Continuing operationsPorts . . . . . . . . . . . . . . . . . . . . . . 913.9 235.3 1,149.2 844.4 174.9 1,019.3Ferries . . . . . . . . . . . . . . . . . . . . . 895.4 — 895.4 984.0 — 984.0Property . . . . . . . . . . . . . . . . . . . . 530.8 3.9 534.7 437.5 6.1 443.6
Revenue from continuing operations . 2,340.1 239.2 2,579.3 2,265.9 181.0 2,446.9
Discontinued operationsCold Logistics . . . . . . . . . . . . . . . . 222.8 — 222.8 205.6 — 205.6Container Shipping . . . . . . . . . . . . — — — — 478.9 478.9
Revenue for the financial year . . . . . . 2,562.9 239.2 2,802.1 2,471.5 659.9 3,131.4
F-178
www.global-reports.com
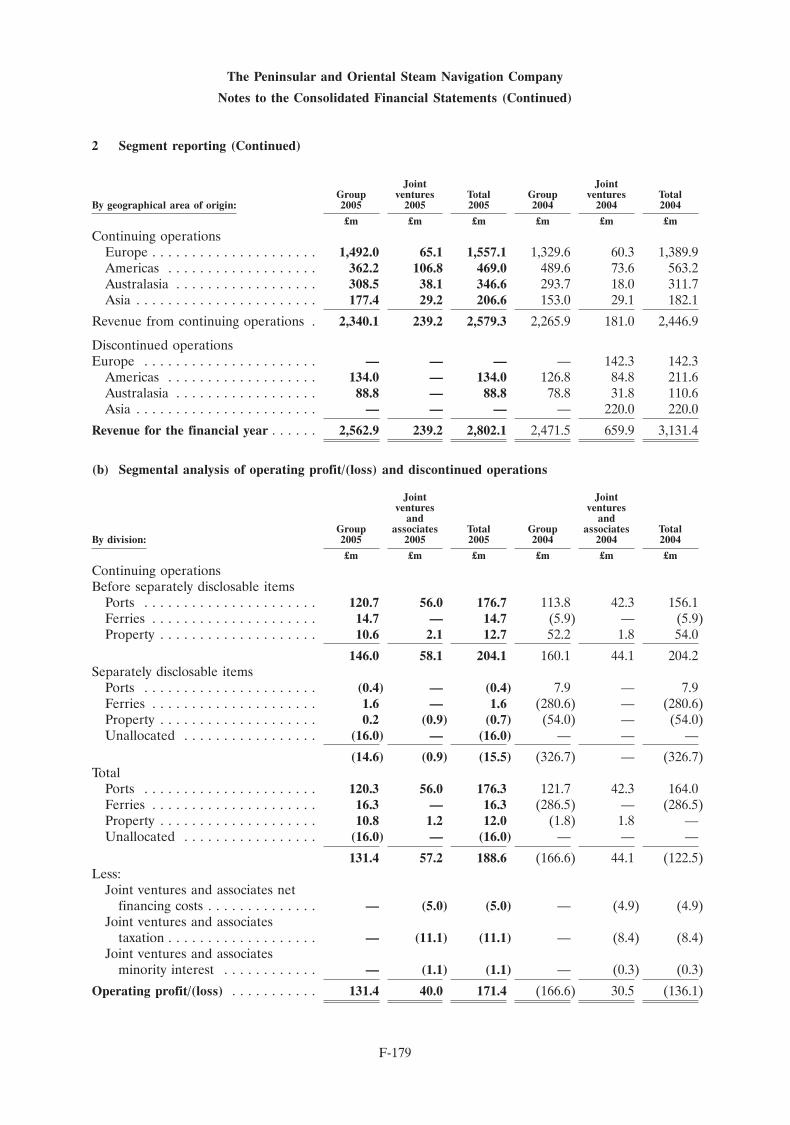
The Peninsular and Oriental Steam Navigation Company
Notes to the Consolidated Financial Statements (Continued)
2 Segment reporting (Continued)
Joint JointGroup ventures Total Group ventures Total
By geographical area of origin: 2005 2005 2005 2004 2004 2004
£m £m £m £m £m £m
Continuing operationsEurope . . . . . . . . . . . . . . . . . . . . . 1,492.0 65.1 1,557.1 1,329.6 60.3 1,389.9Americas . . . . . . . . . . . . . . . . . . . 362.2 106.8 469.0 489.6 73.6 563.2Australasia . . . . . . . . . . . . . . . . . . 308.5 38.1 346.6 293.7 18.0 311.7Asia . . . . . . . . . . . . . . . . . . . . . . . 177.4 29.2 206.6 153.0 29.1 182.1
Revenue from continuing operations . 2,340.1 239.2 2,579.3 2,265.9 181.0 2,446.9
Discontinued operationsEurope . . . . . . . . . . . . . . . . . . . . . . — — — — 142.3 142.3
Americas . . . . . . . . . . . . . . . . . . . 134.0 — 134.0 126.8 84.8 211.6Australasia . . . . . . . . . . . . . . . . . . 88.8 — 88.8 78.8 31.8 110.6Asia . . . . . . . . . . . . . . . . . . . . . . . — — — — 220.0 220.0
Revenue for the financial year . . . . . . 2,562.9 239.2 2,802.1 2,471.5 659.9 3,131.4
(b) Segmental analysis of operating profit/(loss) and discontinued operations
Joint Jointventures ventures
and andGroup associates Total Group associates Total
By division: 2005 2005 2005 2004 2004 2004
£m £m £m £m £m £m
Continuing operationsBefore separately disclosable items
Ports . . . . . . . . . . . . . . . . . . . . . . 120.7 56.0 176.7 113.8 42.3 156.1Ferries . . . . . . . . . . . . . . . . . . . . . 14.7 — 14.7 (5.9) — (5.9)Property . . . . . . . . . . . . . . . . . . . . 10.6 2.1 12.7 52.2 1.8 54.0
146.0 58.1 204.1 160.1 44.1 204.2Separately disclosable items
Ports . . . . . . . . . . . . . . . . . . . . . . (0.4) — (0.4) 7.9 — 7.9Ferries . . . . . . . . . . . . . . . . . . . . . 1.6 — 1.6 (280.6) — (280.6)Property . . . . . . . . . . . . . . . . . . . . 0.2 (0.9) (0.7) (54.0) — (54.0)Unallocated . . . . . . . . . . . . . . . . . (16.0) — (16.0) — — —
(14.6) (0.9) (15.5) (326.7) — (326.7)Total
Ports . . . . . . . . . . . . . . . . . . . . . . 120.3 56.0 176.3 121.7 42.3 164.0Ferries . . . . . . . . . . . . . . . . . . . . . 16.3 — 16.3 (286.5) — (286.5)Property . . . . . . . . . . . . . . . . . . . . 10.8 1.2 12.0 (1.8) 1.8 —Unallocated . . . . . . . . . . . . . . . . . (16.0) — (16.0) — — —
131.4 57.2 188.6 (166.6) 44.1 (122.5)Less:
Joint ventures and associates netfinancing costs . . . . . . . . . . . . . . — (5.0) (5.0) — (4.9) (4.9)
Joint ventures and associatestaxation . . . . . . . . . . . . . . . . . . . — (11.1) (11.1) — (8.4) (8.4)
Joint ventures and associatesminority interest . . . . . . . . . . . . — (1.1) (1.1) — (0.3) (0.3)
Operating profit/(loss) . . . . . . . . . . . 131.4 40.0 171.4 (166.6) 30.5 (136.1)
F-179
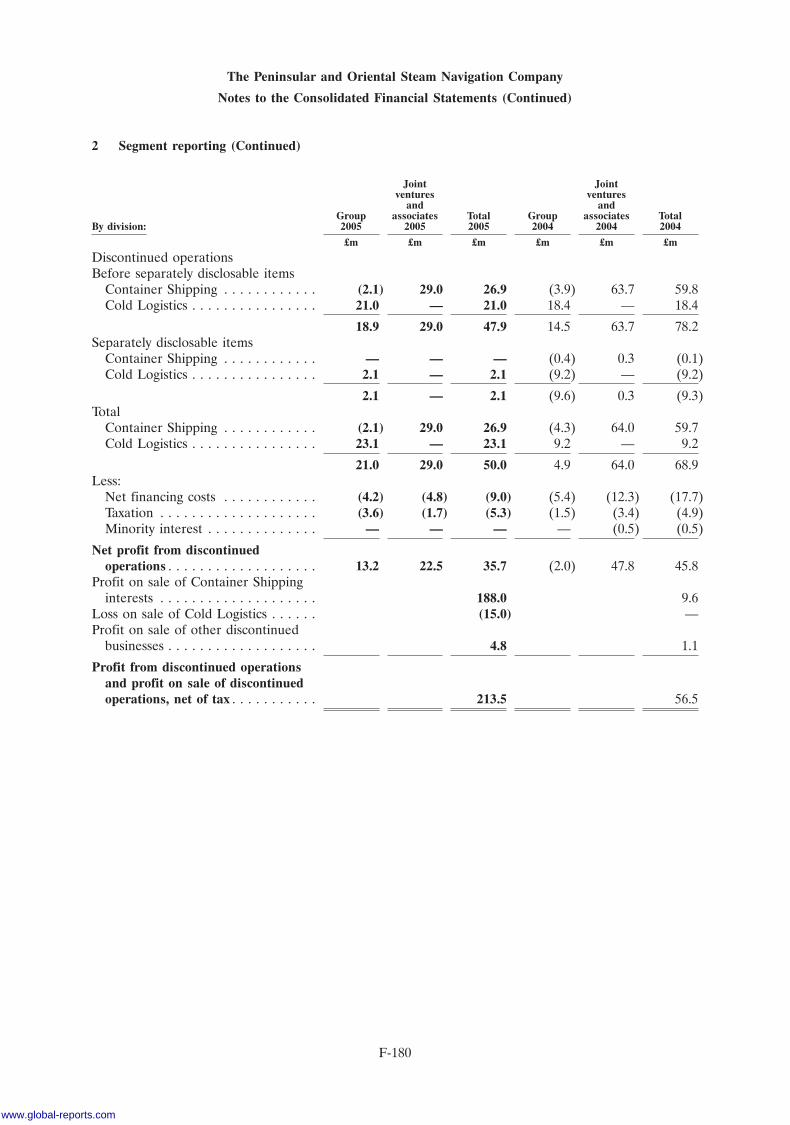
The Peninsular and Oriental Steam Navigation Company
Notes to the Consolidated Financial Statements (Continued)
2 Segment reporting (Continued)
Joint Jointventures ventures
and andGroup associates Total Group associates Total
By division: 2005 2005 2005 2004 2004 2004
£m £m £m £m £m £m
Discontinued operationsBefore separately disclosable items
Container Shipping . . . . . . . . . . . . (2.1) 29.0 26.9 (3.9) 63.7 59.8Cold Logistics . . . . . . . . . . . . . . . . 21.0 — 21.0 18.4 — 18.4
18.9 29.0 47.9 14.5 63.7 78.2Separately disclosable items
Container Shipping . . . . . . . . . . . . — — — (0.4) 0.3 (0.1)Cold Logistics . . . . . . . . . . . . . . . . 2.1 — 2.1 (9.2) — (9.2)
2.1 — 2.1 (9.6) 0.3 (9.3)Total
Container Shipping . . . . . . . . . . . . (2.1) 29.0 26.9 (4.3) 64.0 59.7Cold Logistics . . . . . . . . . . . . . . . . 23.1 — 23.1 9.2 — 9.2
21.0 29.0 50.0 4.9 64.0 68.9Less:
Net financing costs . . . . . . . . . . . . (4.2) (4.8) (9.0) (5.4) (12.3) (17.7)Taxation . . . . . . . . . . . . . . . . . . . . (3.6) (1.7) (5.3) (1.5) (3.4) (4.9)Minority interest . . . . . . . . . . . . . . — — — — (0.5) (0.5)
Net profit from discontinuedoperations . . . . . . . . . . . . . . . . . . . 13.2 22.5 35.7 (2.0) 47.8 45.8
Profit on sale of Container Shippinginterests . . . . . . . . . . . . . . . . . . . . 188.0 9.6
Loss on sale of Cold Logistics . . . . . . (15.0) —Profit on sale of other discontinued
businesses . . . . . . . . . . . . . . . . . . . 4.8 1.1
Profit from discontinued operationsand profit on sale of discontinuedoperations, net of tax . . . . . . . . . . . 213.5 56.5
F-180
www.global-reports.com
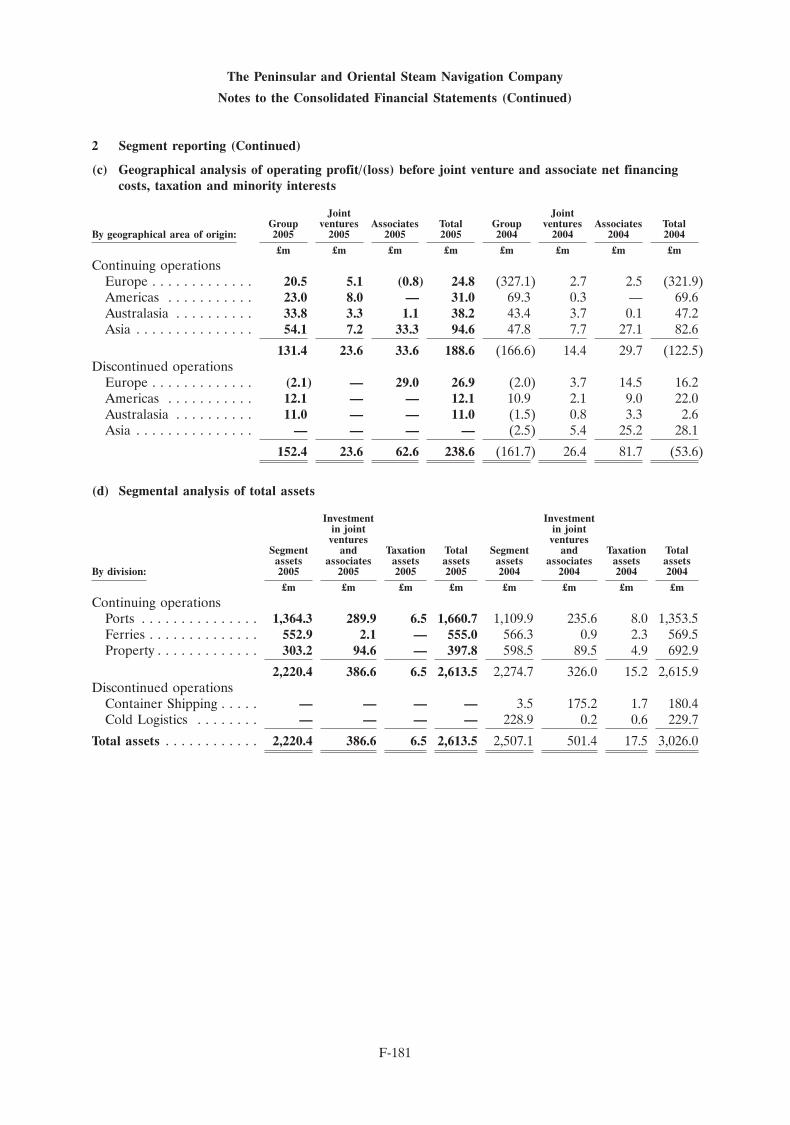
The Peninsular and Oriental Steam Navigation Company
Notes to the Consolidated Financial Statements (Continued)
2 Segment reporting (Continued)
(c) Geographical analysis of operating profit/(loss) before joint venture and associate net financingcosts, taxation and minority interests
Joint JointGroup ventures Associates Total Group ventures Associates Total
By geographical area of origin: 2005 2005 2005 2005 2004 2004 2004 2004
£m £m £m £m £m £m £m £m
Continuing operationsEurope . . . . . . . . . . . . . 20.5 5.1 (0.8) 24.8 (327.1) 2.7 2.5 (321.9)Americas . . . . . . . . . . . 23.0 8.0 — 31.0 69.3 0.3 — 69.6Australasia . . . . . . . . . . 33.8 3.3 1.1 38.2 43.4 3.7 0.1 47.2Asia . . . . . . . . . . . . . . . 54.1 7.2 33.3 94.6 47.8 7.7 27.1 82.6
131.4 23.6 33.6 188.6 (166.6) 14.4 29.7 (122.5)Discontinued operations
Europe . . . . . . . . . . . . . (2.1) — 29.0 26.9 (2.0) 3.7 14.5 16.2Americas . . . . . . . . . . . 12.1 — — 12.1 10.9 2.1 9.0 22.0Australasia . . . . . . . . . . 11.0 — — 11.0 (1.5) 0.8 3.3 2.6Asia . . . . . . . . . . . . . . . — — — — (2.5) 5.4 25.2 28.1
152.4 23.6 62.6 238.6 (161.7) 26.4 81.7 (53.6)
(d) Segmental analysis of total assets
Investment Investmentin joint in jointventures ventures
Segment and Taxation Total Segment and Taxation Totalassets associates assets assets assets associates assets assets
By division: 2005 2005 2005 2005 2004 2004 2004 2004
£m £m £m £m £m £m £m £m
Continuing operationsPorts . . . . . . . . . . . . . . . 1,364.3 289.9 6.5 1,660.7 1,109.9 235.6 8.0 1,353.5Ferries . . . . . . . . . . . . . . 552.9 2.1 — 555.0 566.3 0.9 2.3 569.5Property . . . . . . . . . . . . . 303.2 94.6 — 397.8 598.5 89.5 4.9 692.9
2,220.4 386.6 6.5 2,613.5 2,274.7 326.0 15.2 2,615.9Discontinued operations
Container Shipping . . . . . — — — — 3.5 175.2 1.7 180.4Cold Logistics . . . . . . . . — — — — 228.9 0.2 0.6 229.7
Total assets . . . . . . . . . . . . 2,220.4 386.6 6.5 2,613.5 2,507.1 501.4 17.5 3,026.0
F-181
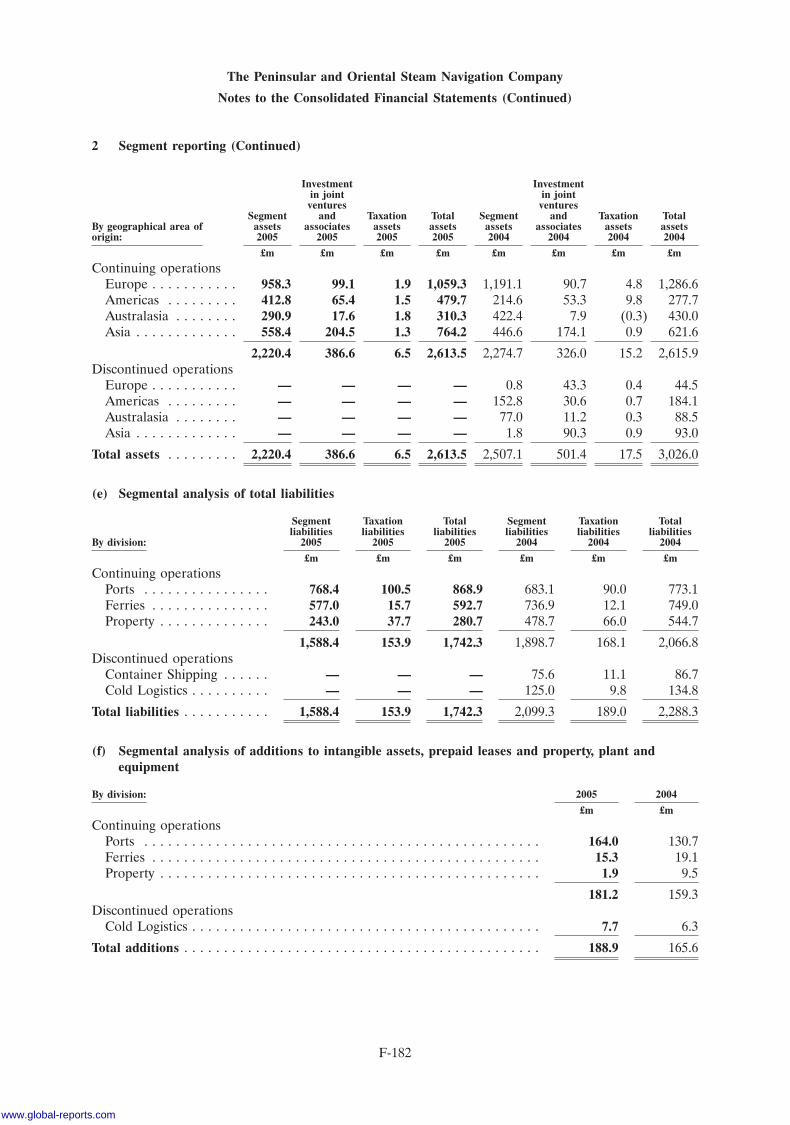
The Peninsular and Oriental Steam Navigation Company
Notes to the Consolidated Financial Statements (Continued)
2 Segment reporting (Continued)
Investment Investmentin joint in jointventures ventures
Segment and Taxation Total Segment and Taxation TotalBy geographical area of assets associates assets assets assets associates assets assetsorigin: 2005 2005 2005 2005 2004 2004 2004 2004
£m £m £m £m £m £m £m £m
Continuing operationsEurope . . . . . . . . . . . 958.3 99.1 1.9 1,059.3 1,191.1 90.7 4.8 1,286.6Americas . . . . . . . . . 412.8 65.4 1.5 479.7 214.6 53.3 9.8 277.7Australasia . . . . . . . . 290.9 17.6 1.8 310.3 422.4 7.9 (0.3) 430.0Asia . . . . . . . . . . . . . 558.4 204.5 1.3 764.2 446.6 174.1 0.9 621.6
2,220.4 386.6 6.5 2,613.5 2,274.7 326.0 15.2 2,615.9Discontinued operations
Europe . . . . . . . . . . . — — — — 0.8 43.3 0.4 44.5Americas . . . . . . . . . — — — — 152.8 30.6 0.7 184.1Australasia . . . . . . . . — — — — 77.0 11.2 0.3 88.5Asia . . . . . . . . . . . . . — — — — 1.8 90.3 0.9 93.0
Total assets . . . . . . . . . 2,220.4 386.6 6.5 2,613.5 2,507.1 501.4 17.5 3,026.0
(e) Segmental analysis of total liabilities
Segment Taxation Total Segment Taxation Totalliabilities liabilities liabilities liabilities liabilities liabilities
By division: 2005 2005 2005 2004 2004 2004
£m £m £m £m £m £m
Continuing operationsPorts . . . . . . . . . . . . . . . . 768.4 100.5 868.9 683.1 90.0 773.1Ferries . . . . . . . . . . . . . . . 577.0 15.7 592.7 736.9 12.1 749.0Property . . . . . . . . . . . . . . 243.0 37.7 280.7 478.7 66.0 544.7
1,588.4 153.9 1,742.3 1,898.7 168.1 2,066.8Discontinued operations
Container Shipping . . . . . . — — — 75.6 11.1 86.7Cold Logistics . . . . . . . . . . — — — 125.0 9.8 134.8
Total liabilities . . . . . . . . . . . 1,588.4 153.9 1,742.3 2,099.3 189.0 2,288.3
(f) Segmental analysis of additions to intangible assets, prepaid leases and property, plant andequipment
By division: 2005 2004
£m £m
Continuing operationsPorts . . . . . . . . . . . . . . . . . . . . . . . . . . . . . . . . . . . . . . . . . . . . . . . . . . 164.0 130.7Ferries . . . . . . . . . . . . . . . . . . . . . . . . . . . . . . . . . . . . . . . . . . . . . . . . . 15.3 19.1Property . . . . . . . . . . . . . . . . . . . . . . . . . . . . . . . . . . . . . . . . . . . . . . . . 1.9 9.5
181.2 159.3Discontinued operations
Cold Logistics . . . . . . . . . . . . . . . . . . . . . . . . . . . . . . . . . . . . . . . . . . . . 7.7 6.3
Total additions . . . . . . . . . . . . . . . . . . . . . . . . . . . . . . . . . . . . . . . . . . . . . 188.9 165.6
F-182
www.global-reports.com
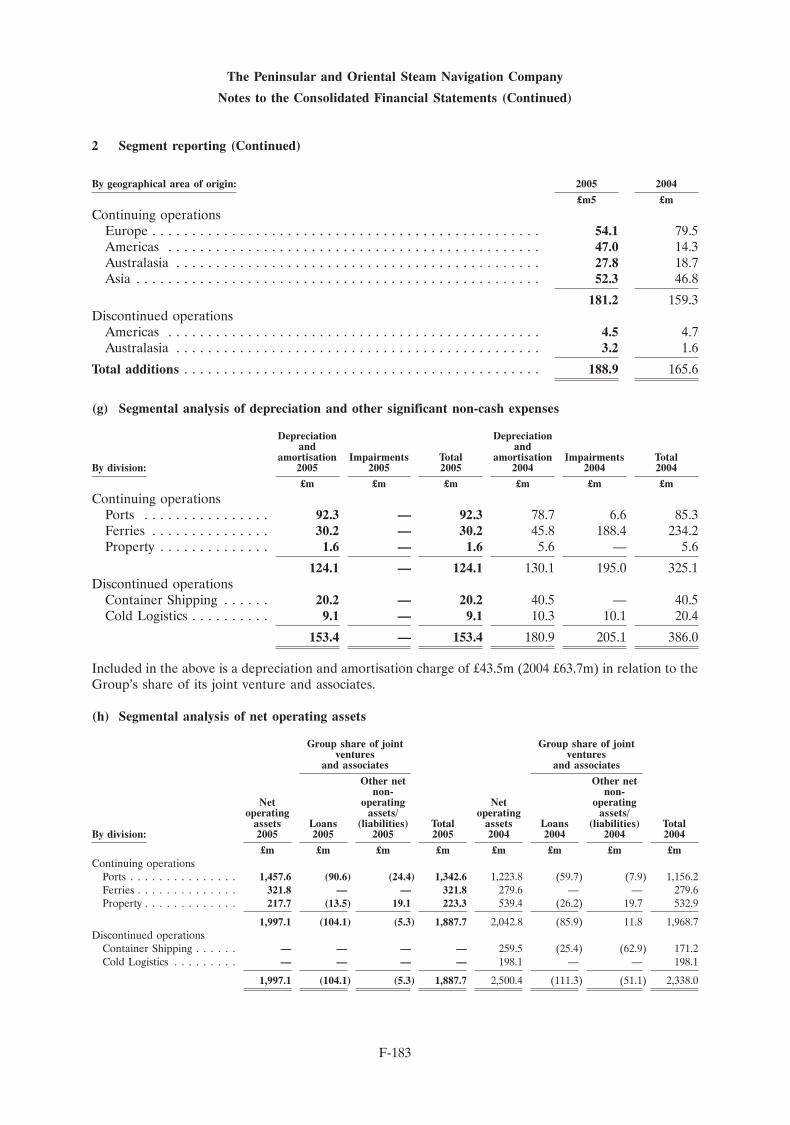
The Peninsular and Oriental Steam Navigation Company
Notes to the Consolidated Financial Statements (Continued)
2 Segment reporting (Continued)
By geographical area of origin: 2005 2004
£m5 £m
Continuing operationsEurope . . . . . . . . . . . . . . . . . . . . . . . . . . . . . . . . . . . . . . . . . . . . . . . . . 54.1 79.5Americas . . . . . . . . . . . . . . . . . . . . . . . . . . . . . . . . . . . . . . . . . . . . . . . 47.0 14.3Australasia . . . . . . . . . . . . . . . . . . . . . . . . . . . . . . . . . . . . . . . . . . . . . . 27.8 18.7Asia . . . . . . . . . . . . . . . . . . . . . . . . . . . . . . . . . . . . . . . . . . . . . . . . . . . 52.3 46.8
181.2 159.3Discontinued operations
Americas . . . . . . . . . . . . . . . . . . . . . . . . . . . . . . . . . . . . . . . . . . . . . . . 4.5 4.7Australasia . . . . . . . . . . . . . . . . . . . . . . . . . . . . . . . . . . . . . . . . . . . . . . 3.2 1.6
Total additions . . . . . . . . . . . . . . . . . . . . . . . . . . . . . . . . . . . . . . . . . . . . . 188.9 165.6
(g) Segmental analysis of depreciation and other significant non-cash expenses
Depreciation Depreciationand and
amortisation Impairments Total amortisation Impairments TotalBy division: 2005 2005 2005 2004 2004 2004
£m £m £m £m £m £m
Continuing operationsPorts . . . . . . . . . . . . . . . . 92.3 — 92.3 78.7 6.6 85.3Ferries . . . . . . . . . . . . . . . 30.2 — 30.2 45.8 188.4 234.2Property . . . . . . . . . . . . . . 1.6 — 1.6 5.6 — 5.6
124.1 — 124.1 130.1 195.0 325.1Discontinued operations
Container Shipping . . . . . . 20.2 — 20.2 40.5 — 40.5Cold Logistics . . . . . . . . . . 9.1 — 9.1 10.3 10.1 20.4
153.4 — 153.4 180.9 205.1 386.0
Included in the above is a depreciation and amortisation charge of £43.5m (2004 £63.7m) in relation to theGroup’s share of its joint venture and associates.
(h) Segmental analysis of net operating assets
Group share of joint Group share of jointventures ventures
and associates and associates
Other net Other netnon- non-
Net operating Net operatingoperating assets/ operating assets/
assets Loans (liabilities) Total assets Loans (liabilities) TotalBy division: 2005 2005 2005 2005 2004 2004 2004 2004
£m £m £m £m £m £m £m £mContinuing operations
Ports . . . . . . . . . . . . . . . 1,457.6 (90.6) (24.4) 1,342.6 1,223.8 (59.7) (7.9) 1,156.2Ferries . . . . . . . . . . . . . . 321.8 — — 321.8 279.6 — — 279.6Property . . . . . . . . . . . . . 217.7 (13.5) 19.1 223.3 539.4 (26.2) 19.7 532.9
1,997.1 (104.1) (5.3) 1,887.7 2,042.8 (85.9) 11.8 1,968.7Discontinued operations
Container Shipping . . . . . . — — — — 259.5 (25.4) (62.9) 171.2Cold Logistics . . . . . . . . . — — — — 198.1 — — 198.1
1,997.1 (104.1) (5.3) 1,887.7 2,500.4 (111.3) (51.1) 2,338.0
F-183
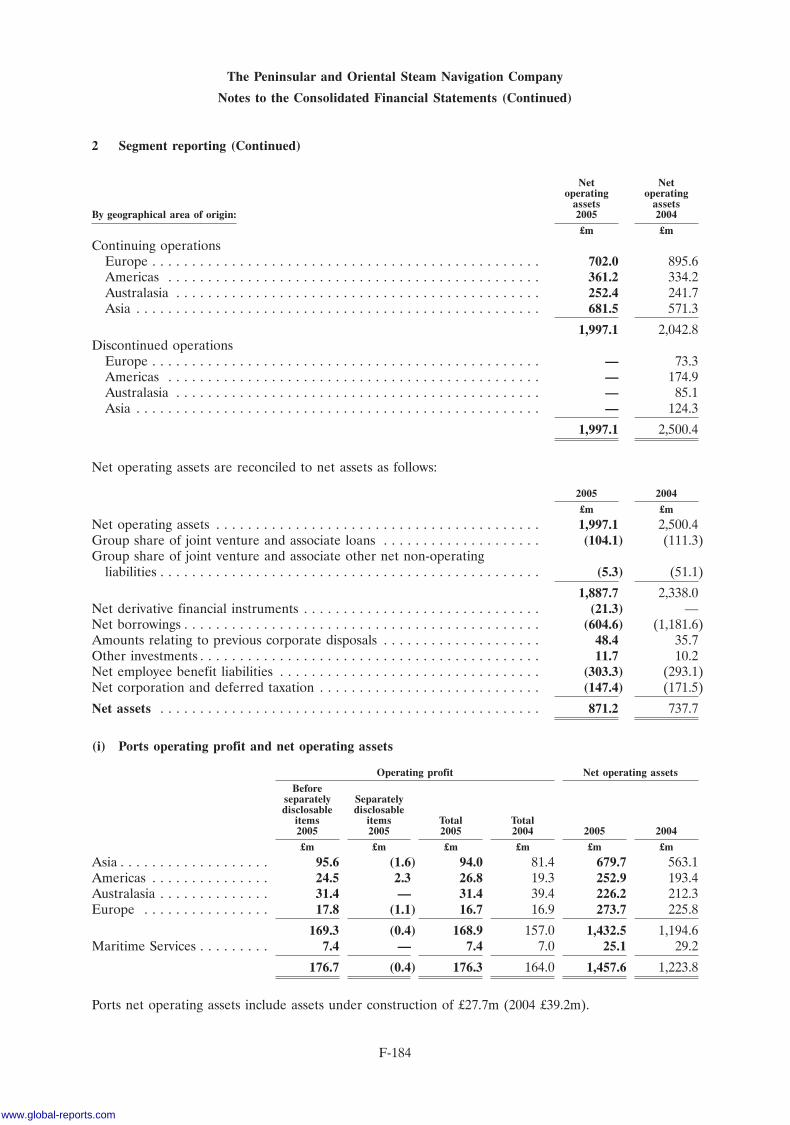
The Peninsular and Oriental Steam Navigation Company
Notes to the Consolidated Financial Statements (Continued)
2 Segment reporting (Continued)
Net Netoperating operating
assets assetsBy geographical area of origin: 2005 2004
£m £m
Continuing operationsEurope . . . . . . . . . . . . . . . . . . . . . . . . . . . . . . . . . . . . . . . . . . . . . . . . . 702.0 895.6Americas . . . . . . . . . . . . . . . . . . . . . . . . . . . . . . . . . . . . . . . . . . . . . . . 361.2 334.2Australasia . . . . . . . . . . . . . . . . . . . . . . . . . . . . . . . . . . . . . . . . . . . . . . 252.4 241.7Asia . . . . . . . . . . . . . . . . . . . . . . . . . . . . . . . . . . . . . . . . . . . . . . . . . . . 681.5 571.3
1,997.1 2,042.8Discontinued operations
Europe . . . . . . . . . . . . . . . . . . . . . . . . . . . . . . . . . . . . . . . . . . . . . . . . . — 73.3Americas . . . . . . . . . . . . . . . . . . . . . . . . . . . . . . . . . . . . . . . . . . . . . . . — 174.9Australasia . . . . . . . . . . . . . . . . . . . . . . . . . . . . . . . . . . . . . . . . . . . . . . — 85.1Asia . . . . . . . . . . . . . . . . . . . . . . . . . . . . . . . . . . . . . . . . . . . . . . . . . . . — 124.3
1,997.1 2,500.4
Net operating assets are reconciled to net assets as follows:
2005 2004
£m £m
Net operating assets . . . . . . . . . . . . . . . . . . . . . . . . . . . . . . . . . . . . . . . . . 1,997.1 2,500.4Group share of joint venture and associate loans . . . . . . . . . . . . . . . . . . . . (104.1) (111.3)Group share of joint venture and associate other net non-operating
liabilities . . . . . . . . . . . . . . . . . . . . . . . . . . . . . . . . . . . . . . . . . . . . . . . . (5.3) (51.1)
1,887.7 2,338.0Net derivative financial instruments . . . . . . . . . . . . . . . . . . . . . . . . . . . . . . (21.3) —Net borrowings . . . . . . . . . . . . . . . . . . . . . . . . . . . . . . . . . . . . . . . . . . . . . (604.6) (1,181.6)Amounts relating to previous corporate disposals . . . . . . . . . . . . . . . . . . . . 48.4 35.7Other investments . . . . . . . . . . . . . . . . . . . . . . . . . . . . . . . . . . . . . . . . . . . 11.7 10.2Net employee benefit liabilities . . . . . . . . . . . . . . . . . . . . . . . . . . . . . . . . . (303.3) (293.1)Net corporation and deferred taxation . . . . . . . . . . . . . . . . . . . . . . . . . . . . (147.4) (171.5)
Net assets . . . . . . . . . . . . . . . . . . . . . . . . . . . . . . . . . . . . . . . . . . . . . . . . 871.2 737.7
(i) Ports operating profit and net operating assets
Operating profit Net operating assets
Beforeseparately Separatelydisclosable disclosable
items items Total Total2005 2005 2005 2004 2005 2004
£m £m £m £m £m £m
Asia . . . . . . . . . . . . . . . . . . . 95.6 (1.6) 94.0 81.4 679.7 563.1Americas . . . . . . . . . . . . . . . 24.5 2.3 26.8 19.3 252.9 193.4Australasia . . . . . . . . . . . . . . 31.4 — 31.4 39.4 226.2 212.3Europe . . . . . . . . . . . . . . . . 17.8 (1.1) 16.7 16.9 273.7 225.8
169.3 (0.4) 168.9 157.0 1,432.5 1,194.6Maritime Services . . . . . . . . . 7.4 — 7.4 7.0 25.1 29.2
176.7 (0.4) 176.3 164.0 1,457.6 1,223.8
Ports net operating assets include assets under construction of £27.7m (2004 £39.2m).
F-184
www.global-reports.com
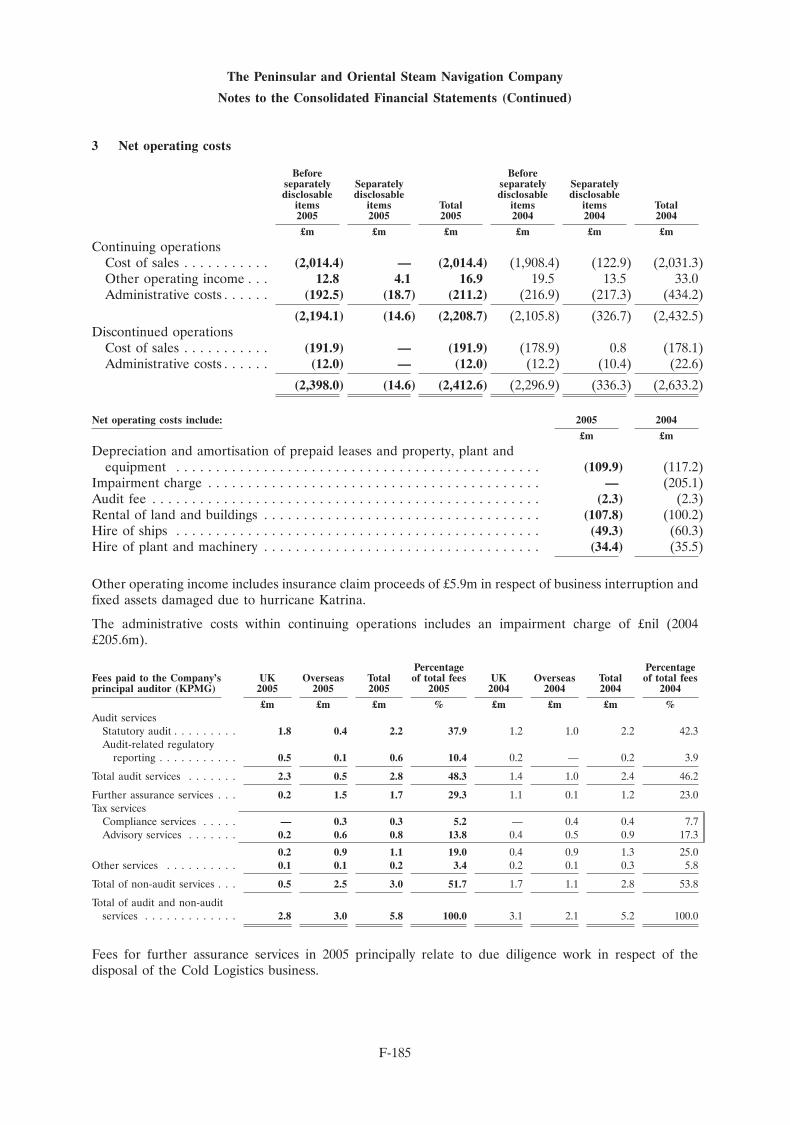
The Peninsular and Oriental Steam Navigation Company
Notes to the Consolidated Financial Statements (Continued)
3 Net operating costs
Before Beforeseparately Separately separately Separatelydisclosable disclosable disclosable disclosable
items items Total items items Total2005 2005 2005 2004 2004 2004
£m £m £m £m £m £m
Continuing operationsCost of sales . . . . . . . . . . . (2,014.4) — (2,014.4) (1,908.4) (122.9) (2,031.3)Other operating income . . . 12.8 4.1 16.9 19.5 13.5 33.0Administrative costs . . . . . . (192.5) (18.7) (211.2) (216.9) (217.3) (434.2)
(2,194.1) (14.6) (2,208.7) (2,105.8) (326.7) (2,432.5)Discontinued operations
Cost of sales . . . . . . . . . . . (191.9) — (191.9) (178.9) 0.8 (178.1)Administrative costs . . . . . . (12.0) — (12.0) (12.2) (10.4) (22.6)
(2,398.0) (14.6) (2,412.6) (2,296.9) (336.3) (2,633.2)
Net operating costs include: 2005 2004
£m £m
Depreciation and amortisation of prepaid leases and property, plant andequipment . . . . . . . . . . . . . . . . . . . . . . . . . . . . . . . . . . . . . . . . . . . . . . (109.9) (117.2)
Impairment charge . . . . . . . . . . . . . . . . . . . . . . . . . . . . . . . . . . . . . . . . . . — (205.1)Audit fee . . . . . . . . . . . . . . . . . . . . . . . . . . . . . . . . . . . . . . . . . . . . . . . . . (2.3) (2.3)Rental of land and buildings . . . . . . . . . . . . . . . . . . . . . . . . . . . . . . . . . . . (107.8) (100.2)Hire of ships . . . . . . . . . . . . . . . . . . . . . . . . . . . . . . . . . . . . . . . . . . . . . . (49.3) (60.3)Hire of plant and machinery . . . . . . . . . . . . . . . . . . . . . . . . . . . . . . . . . . . (34.4) (35.5)
Other operating income includes insurance claim proceeds of £5.9m in respect of business interruption andfixed assets damaged due to hurricane Katrina.
The administrative costs within continuing operations includes an impairment charge of £nil (2004£205.6m).
Percentage PercentageFees paid to the Company’s UK Overseas Total of total fees UK Overseas Total of total feesprincipal auditor (KPMG) 2005 2005 2005 2005 2004 2004 2004 2004
£m £m £m % £m £m £m %Audit services
Statutory audit . . . . . . . . . 1.8 0.4 2.2 37.9 1.2 1.0 2.2 42.3Audit-related regulatory
reporting . . . . . . . . . . . 0.5 0.1 0.6 10.4 0.2 — 0.2 3.9
Total audit services . . . . . . . 2.3 0.5 2.8 48.3 1.4 1.0 2.4 46.2
Further assurance services . . . 0.2 1.5 1.7 29.3 1.1 0.1 1.2 23.0Tax services
Compliance services . . . . . — 0.3 0.3 5.2 — 0.4 0.4 7.7Advisory services . . . . . . . 0.2 0.6 0.8 13.8 0.4 0.5 0.9 17.3
0.2 0.9 1.1 19.0 0.4 0.9 1.3 25.0Other services . . . . . . . . . . 0.1 0.1 0.2 3.4 0.2 0.1 0.3 5.8
Total of non-audit services . . . 0.5 2.5 3.0 51.7 1.7 1.1 2.8 53.8
Total of audit and non-auditservices . . . . . . . . . . . . . 2.8 3.0 5.8 100.0 3.1 2.1 5.2 100.0
Fees for further assurance services in 2005 principally relate to due diligence work in respect of thedisposal of the Cold Logistics business.
F-185
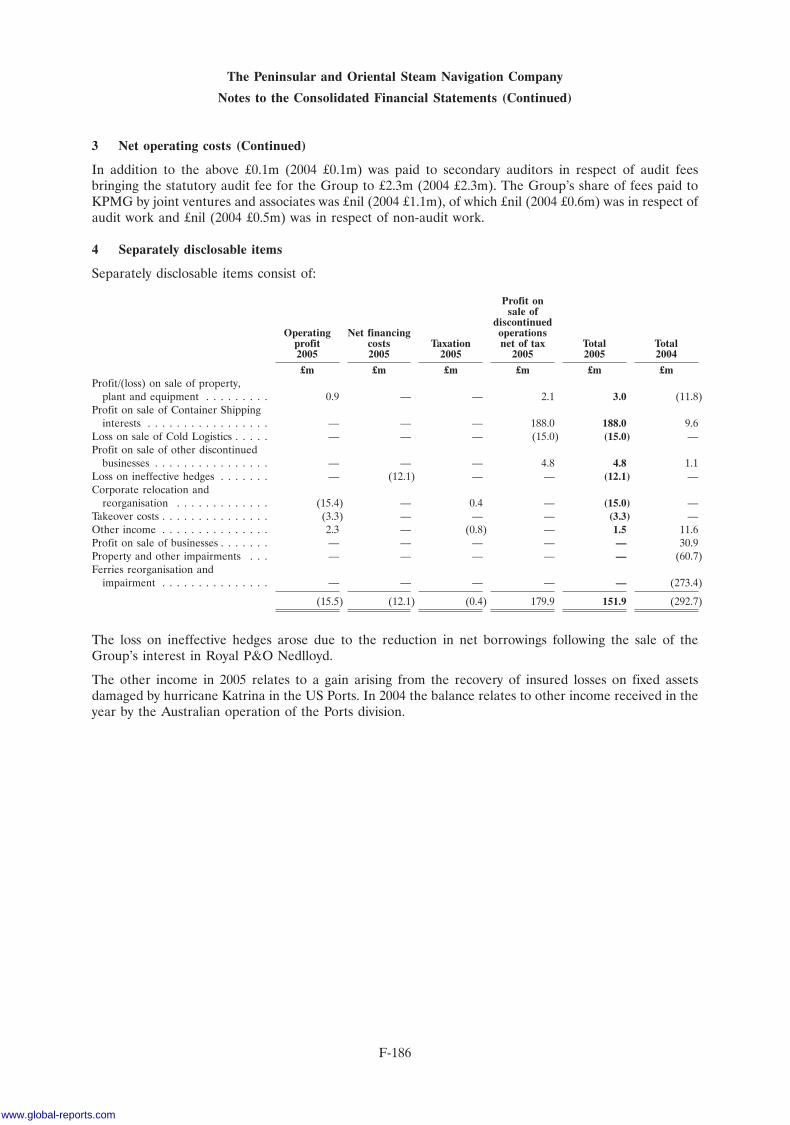
The Peninsular and Oriental Steam Navigation Company
Notes to the Consolidated Financial Statements (Continued)
3 Net operating costs (Continued)
In addition to the above £0.1m (2004 £0.1m) was paid to secondary auditors in respect of audit feesbringing the statutory audit fee for the Group to £2.3m (2004 £2.3m). The Group’s share of fees paid toKPMG by joint ventures and associates was £nil (2004 £1.1m), of which £nil (2004 £0.6m) was in respect ofaudit work and £nil (2004 £0.5m) was in respect of non-audit work.
4 Separately disclosable items
Separately disclosable items consist of:
Profit onsale of
discontinuedOperating Net financing operations
profit costs Taxation net of tax Total Total2005 2005 2005 2005 2005 2004
£m £m £m £m £m £mProfit/(loss) on sale of property,
plant and equipment . . . . . . . . . 0.9 — — 2.1 3.0 (11.8)Profit on sale of Container Shipping
interests . . . . . . . . . . . . . . . . . — — — 188.0 188.0 9.6Loss on sale of Cold Logistics . . . . . — — — (15.0) (15.0) —Profit on sale of other discontinued
businesses . . . . . . . . . . . . . . . . — — — 4.8 4.8 1.1Loss on ineffective hedges . . . . . . . — (12.1) — — (12.1) —Corporate relocation and
reorganisation . . . . . . . . . . . . . (15.4) — 0.4 — (15.0) —Takeover costs . . . . . . . . . . . . . . . (3.3) — — — (3.3) —Other income . . . . . . . . . . . . . . . 2.3 — (0.8) — 1.5 11.6Profit on sale of businesses . . . . . . . — — — — — 30.9Property and other impairments . . . — — — — — (60.7)Ferries reorganisation and
impairment . . . . . . . . . . . . . . . — — — — — (273.4)
(15.5) (12.1) (0.4) 179.9 151.9 (292.7)
The loss on ineffective hedges arose due to the reduction in net borrowings following the sale of theGroup’s interest in Royal P&O Nedlloyd.
The other income in 2005 relates to a gain arising from the recovery of insured losses on fixed assetsdamaged by hurricane Katrina in the US Ports. In 2004 the balance relates to other income received in theyear by the Australian operation of the Ports division.
F-186
www.global-reports.com

The Peninsular and Oriental Steam Navigation Company
Notes to the Consolidated Financial Statements (Continued)
5 Net financing costs
2005 2004
£m £m
Financial incomeInterest income and similar items . . . . . . . . . . . . . . . . . . . . . . . . . . . . . . . 4.1 6.8Exchange gains . . . . . . . . . . . . . . . . . . . . . . . . . . . . . . . . . . . . . . . . . . . . . 3.8 —Gain on refinancing . . . . . . . . . . . . . . . . . . . . . . . . . . . . . . . . . . . . . . . . . — 4.6
7.9 11.4
Financial expensesInterest payable and similar items . . . . . . . . . . . . . . . . . . . . . . . . . . . . . . . (60.1) (92.6)Debt redemption and other costs . . . . . . . . . . . . . . . . . . . . . . . . . . . . . . . . (0.2) (2.1)Ineffective portion of cash flow hedges recycled through the income
statement . . . . . . . . . . . . . . . . . . . . . . . . . . . . . . . . . . . . . . . . . . . . . . . (12.1) —Exchange losses . . . . . . . . . . . . . . . . . . . . . . . . . . . . . . . . . . . . . . . . . . . . (2.1) —Interest capitalised . . . . . . . . . . . . . . . . . . . . . . . . . . . . . . . . . . . . . . . . . . 2.8 5.3Unwinding of discounts on provisions . . . . . . . . . . . . . . . . . . . . . . . . . . . . (5.4) (2.7)Other net financing costs in respect of pension plans . . . . . . . . . . . . . . . . . (1.6) (1.5)Breakage of swap contracts . . . . . . . . . . . . . . . . . . . . . . . . . . . . . . . . . . . . — (1.3)
(78.7) (94.9)
Net financing costs . . . . . . . . . . . . . . . . . . . . . . . . . . . . . . . . . . . . . . . . . . (70.8) (83.5)
Interest capitalised in the year comprises £1.0m (2004 £1.4m) in respect of property, plant and equipmentand £1.8m (2004 £3.9m) in respect of properties held for development and sale. At the year end theaggregate interest capitalised was £2.4m (2004 £2.0m) on property, plant and equipment and £2.1m (2004£8.1m) on properties held for development and sale.
The net financing costs is before an interest charge of £4.2m (2004 £5.4m) in respect of discontinuedoperations.
F-187
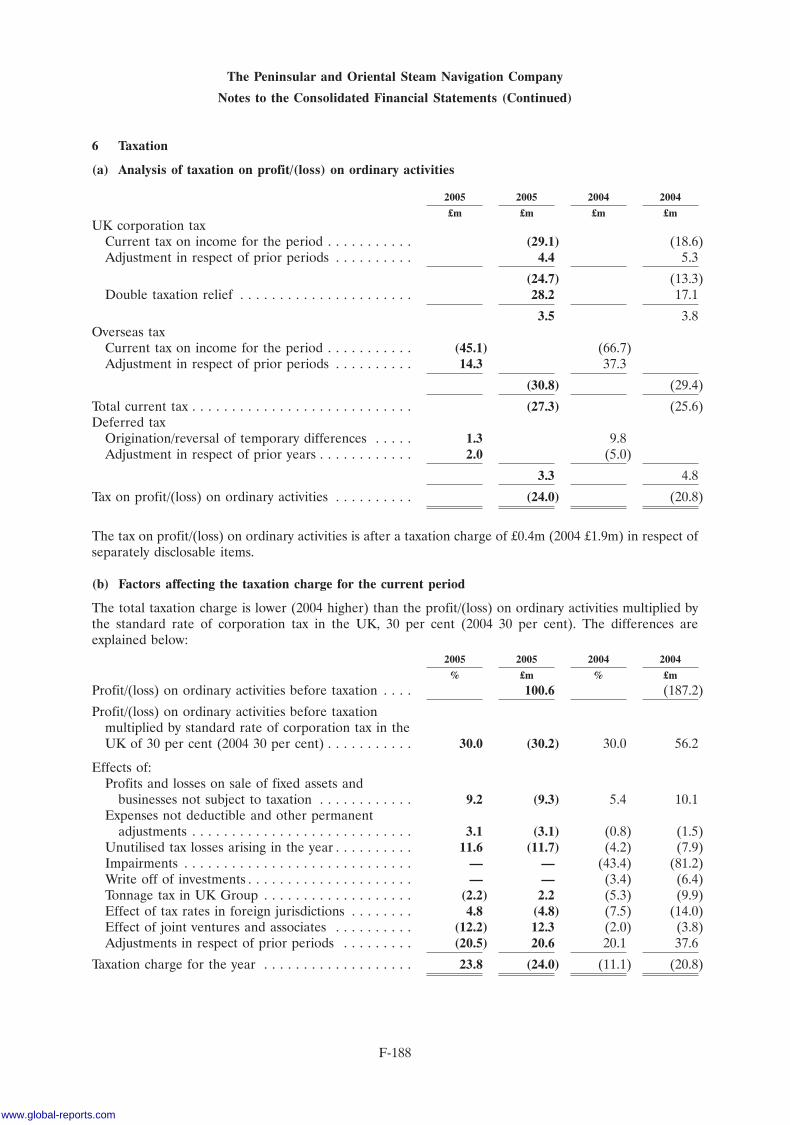
The Peninsular and Oriental Steam Navigation Company
Notes to the Consolidated Financial Statements (Continued)
6 Taxation
(a) Analysis of taxation on profit/(loss) on ordinary activities
2005 2005 2004 2004
£m £m £m £mUK corporation tax
Current tax on income for the period . . . . . . . . . . . (29.1) (18.6)Adjustment in respect of prior periods . . . . . . . . . . 4.4 5.3
(24.7) (13.3)Double taxation relief . . . . . . . . . . . . . . . . . . . . . . 28.2 17.1
3.5 3.8Overseas tax
Current tax on income for the period . . . . . . . . . . . (45.1) (66.7)Adjustment in respect of prior periods . . . . . . . . . . 14.3 37.3
(30.8) (29.4)
Total current tax . . . . . . . . . . . . . . . . . . . . . . . . . . . . (27.3) (25.6)Deferred tax
Origination/reversal of temporary differences . . . . . 1.3 9.8Adjustment in respect of prior years . . . . . . . . . . . . 2.0 (5.0)
3.3 4.8
Tax on profit/(loss) on ordinary activities . . . . . . . . . . (24.0) (20.8)
The tax on profit/(loss) on ordinary activities is after a taxation charge of £0.4m (2004 £1.9m) in respect ofseparately disclosable items.
(b) Factors affecting the taxation charge for the current period
The total taxation charge is lower (2004 higher) than the profit/(loss) on ordinary activities multiplied bythe standard rate of corporation tax in the UK, 30 per cent (2004 30 per cent). The differences areexplained below:
2005 2005 2004 2004
% £m % £m
Profit/(loss) on ordinary activities before taxation . . . . 100.6 (187.2)
Profit/(loss) on ordinary activities before taxationmultiplied by standard rate of corporation tax in theUK of 30 per cent (2004 30 per cent) . . . . . . . . . . . 30.0 (30.2) 30.0 56.2
Effects of:Profits and losses on sale of fixed assets and
businesses not subject to taxation . . . . . . . . . . . . 9.2 (9.3) 5.4 10.1Expenses not deductible and other permanent
adjustments . . . . . . . . . . . . . . . . . . . . . . . . . . . . 3.1 (3.1) (0.8) (1.5)Unutilised tax losses arising in the year . . . . . . . . . . 11.6 (11.7) (4.2) (7.9)Impairments . . . . . . . . . . . . . . . . . . . . . . . . . . . . . — — (43.4) (81.2)Write off of investments . . . . . . . . . . . . . . . . . . . . . — — (3.4) (6.4)Tonnage tax in UK Group . . . . . . . . . . . . . . . . . . . (2.2) 2.2 (5.3) (9.9)Effect of tax rates in foreign jurisdictions . . . . . . . . 4.8 (4.8) (7.5) (14.0)Effect of joint ventures and associates . . . . . . . . . . (12.2) 12.3 (2.0) (3.8)Adjustments in respect of prior periods . . . . . . . . . (20.5) 20.6 20.1 37.6
Taxation charge for the year . . . . . . . . . . . . . . . . . . . 23.8 (24.0) (11.1) (20.8)
F-188
www.global-reports.com
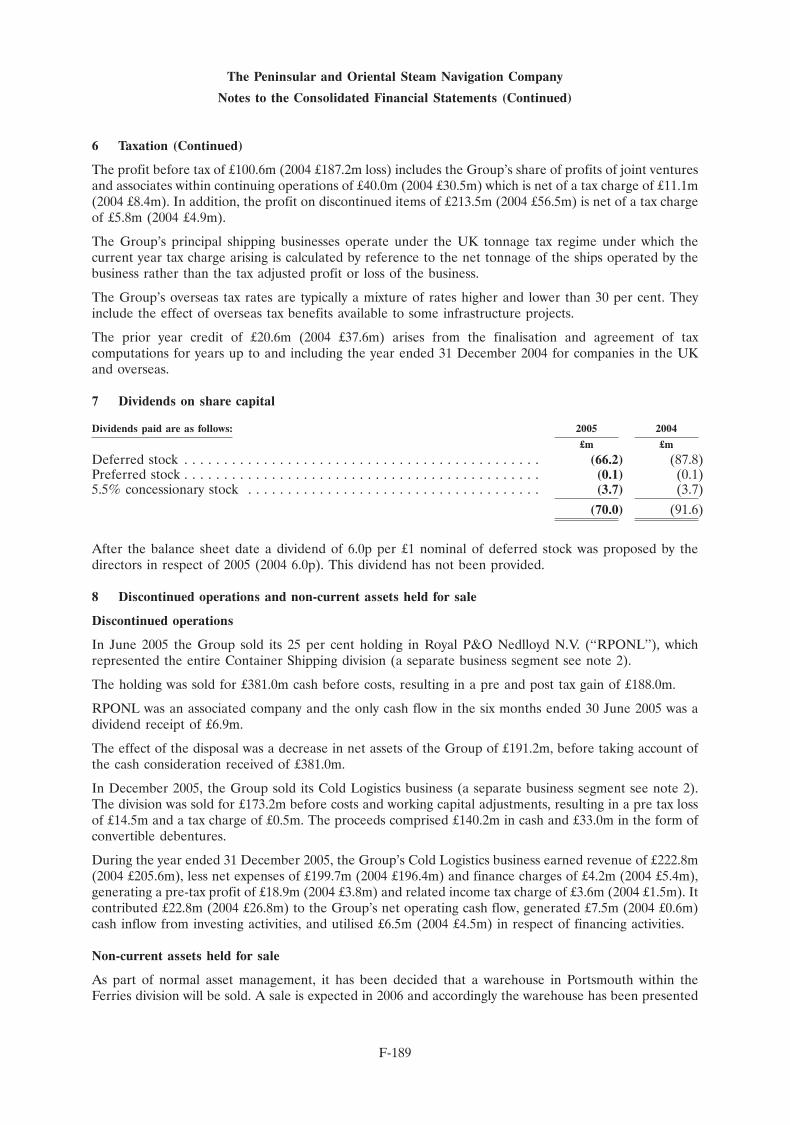
The Peninsular and Oriental Steam Navigation Company
Notes to the Consolidated Financial Statements (Continued)
6 Taxation (Continued)
The profit before tax of £100.6m (2004 £187.2m loss) includes the Group’s share of profits of joint venturesand associates within continuing operations of £40.0m (2004 £30.5m) which is net of a tax charge of £11.1m(2004 £8.4m). In addition, the profit on discontinued items of £213.5m (2004 £56.5m) is net of a tax chargeof £5.8m (2004 £4.9m).
The Group’s principal shipping businesses operate under the UK tonnage tax regime under which thecurrent year tax charge arising is calculated by reference to the net tonnage of the ships operated by thebusiness rather than the tax adjusted profit or loss of the business.
The Group’s overseas tax rates are typically a mixture of rates higher and lower than 30 per cent. Theyinclude the effect of overseas tax benefits available to some infrastructure projects.
The prior year credit of £20.6m (2004 £37.6m) arises from the finalisation and agreement of taxcomputations for years up to and including the year ended 31 December 2004 for companies in the UKand overseas.
7 Dividends on share capital
Dividends paid are as follows: 2005 2004
£m £m
Deferred stock . . . . . . . . . . . . . . . . . . . . . . . . . . . . . . . . . . . . . . . . . . . . . (66.2) (87.8)Preferred stock . . . . . . . . . . . . . . . . . . . . . . . . . . . . . . . . . . . . . . . . . . . . . (0.1) (0.1)5.5% concessionary stock . . . . . . . . . . . . . . . . . . . . . . . . . . . . . . . . . . . . . (3.7) (3.7)
(70.0) (91.6)
After the balance sheet date a dividend of 6.0p per £1 nominal of deferred stock was proposed by thedirectors in respect of 2005 (2004 6.0p). This dividend has not been provided.
8 Discontinued operations and non-current assets held for sale
Discontinued operations
In June 2005 the Group sold its 25 per cent holding in Royal P&O Nedlloyd N.V. (‘‘RPONL’’), whichrepresented the entire Container Shipping division (a separate business segment see note 2).
The holding was sold for £381.0m cash before costs, resulting in a pre and post tax gain of £188.0m.
RPONL was an associated company and the only cash flow in the six months ended 30 June 2005 was adividend receipt of £6.9m.
The effect of the disposal was a decrease in net assets of the Group of £191.2m, before taking account ofthe cash consideration received of £381.0m.
In December 2005, the Group sold its Cold Logistics business (a separate business segment see note 2).The division was sold for £173.2m before costs and working capital adjustments, resulting in a pre tax lossof £14.5m and a tax charge of £0.5m. The proceeds comprised £140.2m in cash and £33.0m in the form ofconvertible debentures.
During the year ended 31 December 2005, the Group’s Cold Logistics business earned revenue of £222.8m(2004 £205.6m), less net expenses of £199.7m (2004 £196.4m) and finance charges of £4.2m (2004 £5.4m),generating a pre-tax profit of £18.9m (2004 £3.8m) and related income tax charge of £3.6m (2004 £1.5m). Itcontributed £22.8m (2004 £26.8m) to the Group’s net operating cash flow, generated £7.5m (2004 £0.6m)cash inflow from investing activities, and utilised £6.5m (2004 £4.5m) in respect of financing activities.
Non-current assets held for sale
As part of normal asset management, it has been decided that a warehouse in Portsmouth within theFerries division will be sold. A sale is expected in 2006 and accordingly the warehouse has been presented
F-189
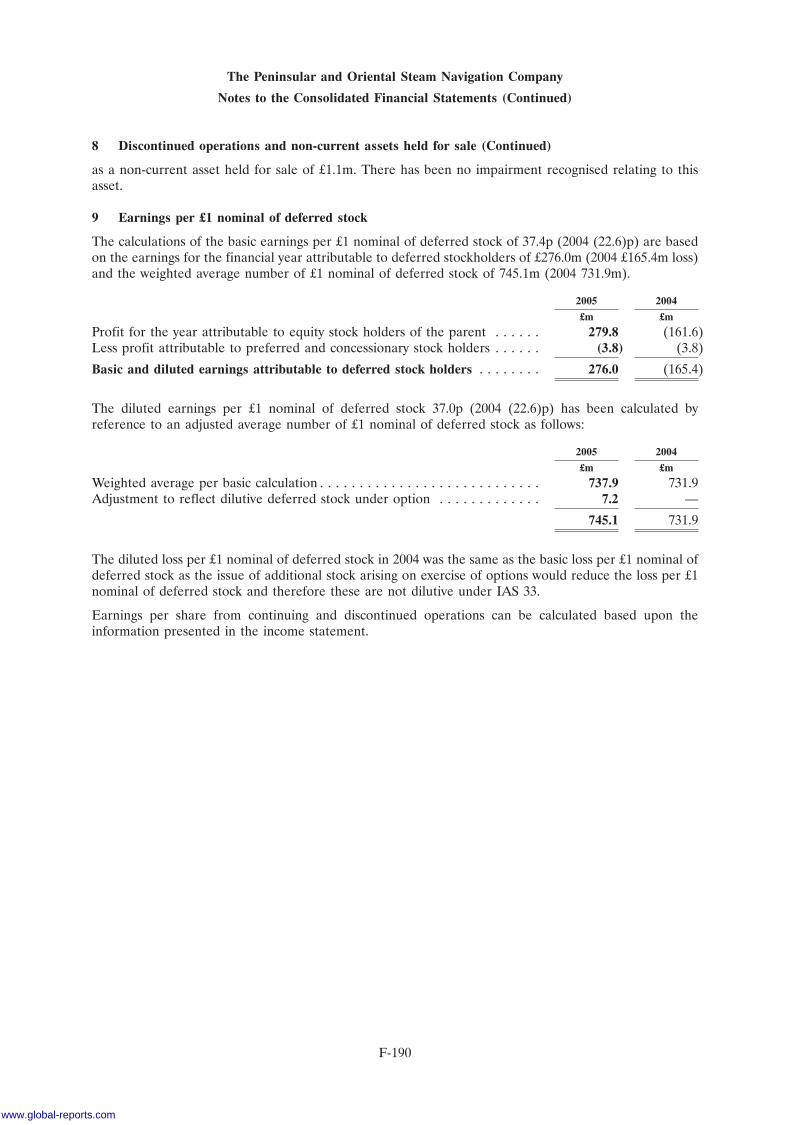
The Peninsular and Oriental Steam Navigation Company
Notes to the Consolidated Financial Statements (Continued)
8 Discontinued operations and non-current assets held for sale (Continued)
as a non-current asset held for sale of £1.1m. There has been no impairment recognised relating to thisasset.
9 Earnings per £1 nominal of deferred stock
The calculations of the basic earnings per £1 nominal of deferred stock of 37.4p (2004 (22.6)p) are basedon the earnings for the financial year attributable to deferred stockholders of £276.0m (2004 £165.4m loss)and the weighted average number of £1 nominal of deferred stock of 745.1m (2004 731.9m).
2005 2004
£m £m
Profit for the year attributable to equity stock holders of the parent . . . . . . 279.8 (161.6)Less profit attributable to preferred and concessionary stock holders . . . . . . (3.8) (3.8)
Basic and diluted earnings attributable to deferred stock holders . . . . . . . . 276.0 (165.4)
The diluted earnings per £1 nominal of deferred stock 37.0p (2004 (22.6)p) has been calculated byreference to an adjusted average number of £1 nominal of deferred stock as follows:
2005 2004
£m £m
Weighted average per basic calculation . . . . . . . . . . . . . . . . . . . . . . . . . . . . 737.9 731.9Adjustment to reflect dilutive deferred stock under option . . . . . . . . . . . . . 7.2 —
745.1 731.9
The diluted loss per £1 nominal of deferred stock in 2004 was the same as the basic loss per £1 nominal ofdeferred stock as the issue of additional stock arising on exercise of options would reduce the loss per £1nominal of deferred stock and therefore these are not dilutive under IAS 33.
Earnings per share from continuing and discontinued operations can be calculated based upon theinformation presented in the income statement.
F-190
www.global-reports.com
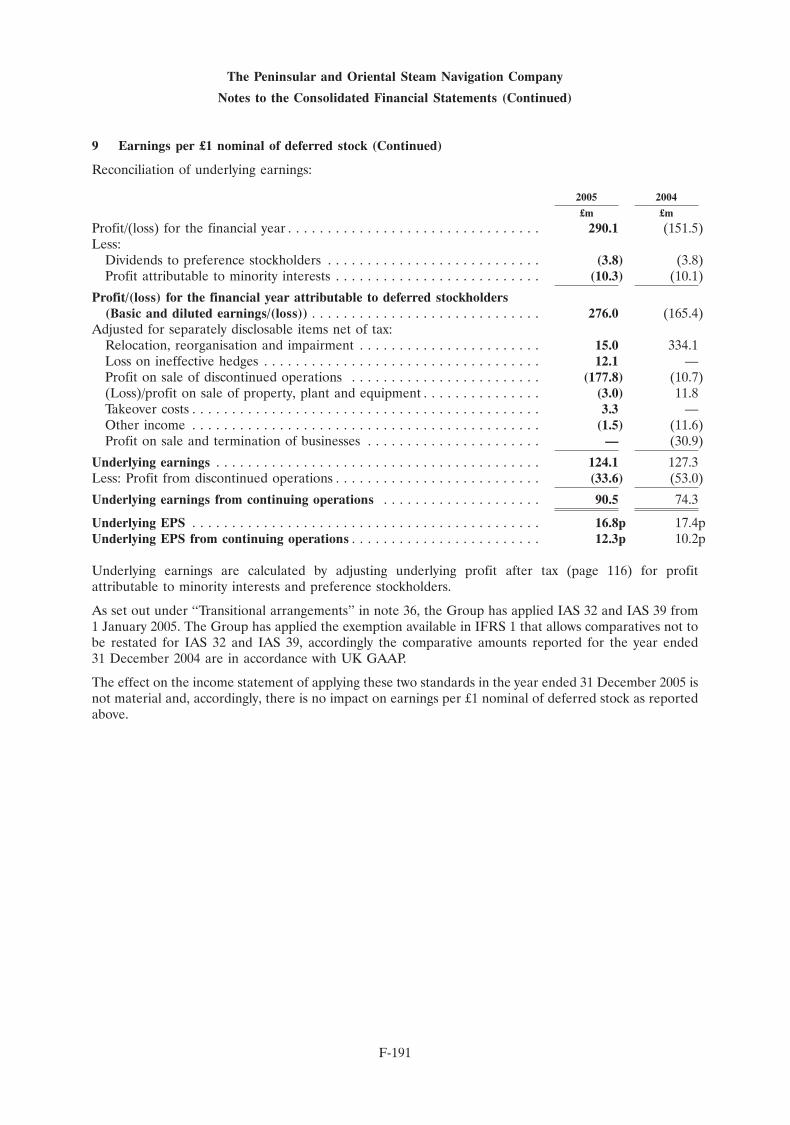
The Peninsular and Oriental Steam Navigation Company
Notes to the Consolidated Financial Statements (Continued)
9 Earnings per £1 nominal of deferred stock (Continued)
Reconciliation of underlying earnings:
2005 2004
£m £m
Profit/(loss) for the financial year . . . . . . . . . . . . . . . . . . . . . . . . . . . . . . . . 290.1 (151.5)Less:
Dividends to preference stockholders . . . . . . . . . . . . . . . . . . . . . . . . . . . (3.8) (3.8)Profit attributable to minority interests . . . . . . . . . . . . . . . . . . . . . . . . . . (10.3) (10.1)
Profit/(loss) for the financial year attributable to deferred stockholders(Basic and diluted earnings/(loss)) . . . . . . . . . . . . . . . . . . . . . . . . . . . . . 276.0 (165.4)
Adjusted for separately disclosable items net of tax:Relocation, reorganisation and impairment . . . . . . . . . . . . . . . . . . . . . . . 15.0 334.1Loss on ineffective hedges . . . . . . . . . . . . . . . . . . . . . . . . . . . . . . . . . . . 12.1 —Profit on sale of discontinued operations . . . . . . . . . . . . . . . . . . . . . . . . (177.8) (10.7)(Loss)/profit on sale of property, plant and equipment . . . . . . . . . . . . . . . (3.0) 11.8Takeover costs . . . . . . . . . . . . . . . . . . . . . . . . . . . . . . . . . . . . . . . . . . . . 3.3 —Other income . . . . . . . . . . . . . . . . . . . . . . . . . . . . . . . . . . . . . . . . . . . . (1.5) (11.6)Profit on sale and termination of businesses . . . . . . . . . . . . . . . . . . . . . . — (30.9)
Underlying earnings . . . . . . . . . . . . . . . . . . . . . . . . . . . . . . . . . . . . . . . . . 124.1 127.3Less: Profit from discontinued operations . . . . . . . . . . . . . . . . . . . . . . . . . . (33.6) (53.0)
Underlying earnings from continuing operations . . . . . . . . . . . . . . . . . . . . 90.5 74.3
Underlying EPS . . . . . . . . . . . . . . . . . . . . . . . . . . . . . . . . . . . . . . . . . . . . 16.8p 17.4pUnderlying EPS from continuing operations . . . . . . . . . . . . . . . . . . . . . . . . 12.3p 10.2p
Underlying earnings are calculated by adjusting underlying profit after tax (page 116) for profitattributable to minority interests and preference stockholders.
As set out under ‘‘Transitional arrangements’’ in note 36, the Group has applied IAS 32 and IAS 39 from1 January 2005. The Group has applied the exemption available in IFRS 1 that allows comparatives not tobe restated for IAS 32 and IAS 39, accordingly the comparative amounts reported for the year ended31 December 2004 are in accordance with UK GAAP.
The effect on the income statement of applying these two standards in the year ended 31 December 2005 isnot material and, accordingly, there is no impact on earnings per £1 nominal of deferred stock as reportedabove.
F-191
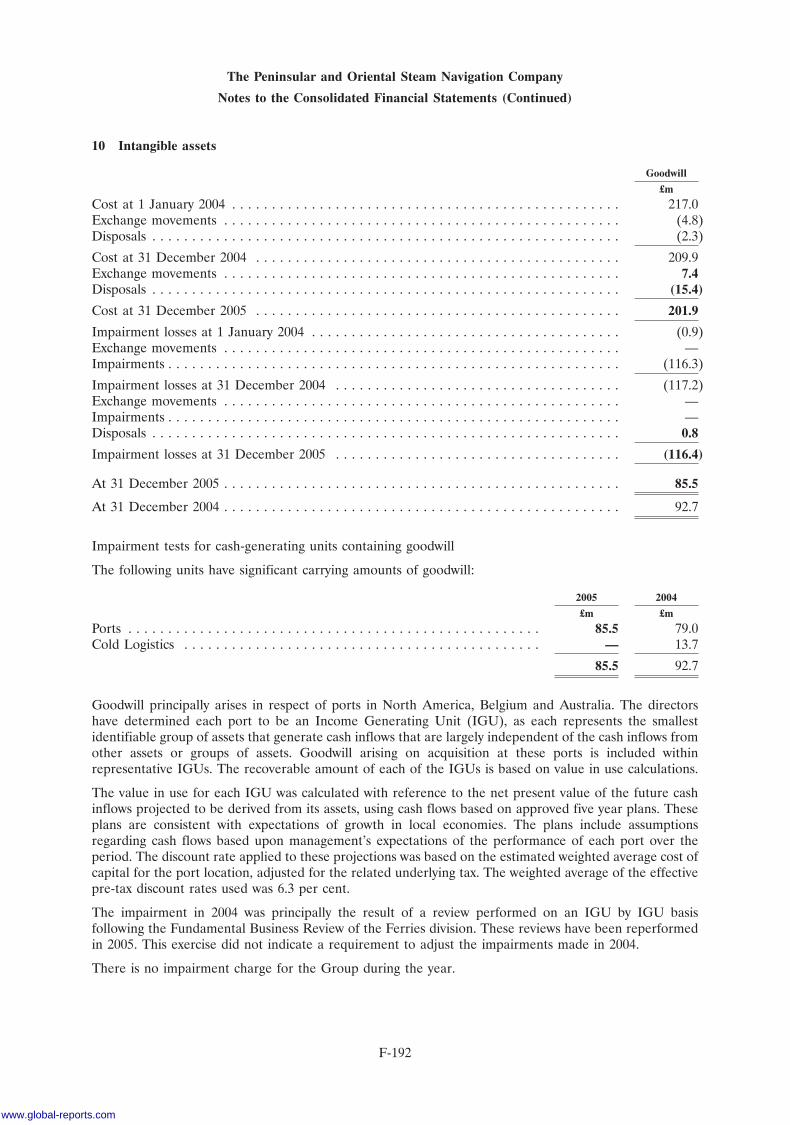
The Peninsular and Oriental Steam Navigation Company
Notes to the Consolidated Financial Statements (Continued)
10 Intangible assets
Goodwill
£m
Cost at 1 January 2004 . . . . . . . . . . . . . . . . . . . . . . . . . . . . . . . . . . . . . . . . . . . . . . . . . 217.0Exchange movements . . . . . . . . . . . . . . . . . . . . . . . . . . . . . . . . . . . . . . . . . . . . . . . . . . (4.8)Disposals . . . . . . . . . . . . . . . . . . . . . . . . . . . . . . . . . . . . . . . . . . . . . . . . . . . . . . . . . . . (2.3)
Cost at 31 December 2004 . . . . . . . . . . . . . . . . . . . . . . . . . . . . . . . . . . . . . . . . . . . . . . 209.9Exchange movements . . . . . . . . . . . . . . . . . . . . . . . . . . . . . . . . . . . . . . . . . . . . . . . . . . 7.4Disposals . . . . . . . . . . . . . . . . . . . . . . . . . . . . . . . . . . . . . . . . . . . . . . . . . . . . . . . . . . . (15.4)
Cost at 31 December 2005 . . . . . . . . . . . . . . . . . . . . . . . . . . . . . . . . . . . . . . . . . . . . . . 201.9
Impairment losses at 1 January 2004 . . . . . . . . . . . . . . . . . . . . . . . . . . . . . . . . . . . . . . . (0.9)Exchange movements . . . . . . . . . . . . . . . . . . . . . . . . . . . . . . . . . . . . . . . . . . . . . . . . . . —Impairments . . . . . . . . . . . . . . . . . . . . . . . . . . . . . . . . . . . . . . . . . . . . . . . . . . . . . . . . . (116.3)
Impairment losses at 31 December 2004 . . . . . . . . . . . . . . . . . . . . . . . . . . . . . . . . . . . . (117.2)Exchange movements . . . . . . . . . . . . . . . . . . . . . . . . . . . . . . . . . . . . . . . . . . . . . . . . . . —Impairments . . . . . . . . . . . . . . . . . . . . . . . . . . . . . . . . . . . . . . . . . . . . . . . . . . . . . . . . . —Disposals . . . . . . . . . . . . . . . . . . . . . . . . . . . . . . . . . . . . . . . . . . . . . . . . . . . . . . . . . . . 0.8
Impairment losses at 31 December 2005 . . . . . . . . . . . . . . . . . . . . . . . . . . . . . . . . . . . . (116.4)
At 31 December 2005 . . . . . . . . . . . . . . . . . . . . . . . . . . . . . . . . . . . . . . . . . . . . . . . . . . 85.5
At 31 December 2004 . . . . . . . . . . . . . . . . . . . . . . . . . . . . . . . . . . . . . . . . . . . . . . . . . . 92.7
Impairment tests for cash-generating units containing goodwill
The following units have significant carrying amounts of goodwill:
2005 2004
£m £m
Ports . . . . . . . . . . . . . . . . . . . . . . . . . . . . . . . . . . . . . . . . . . . . . . . . . . . . 85.5 79.0Cold Logistics . . . . . . . . . . . . . . . . . . . . . . . . . . . . . . . . . . . . . . . . . . . . . — 13.7
85.5 92.7
Goodwill principally arises in respect of ports in North America, Belgium and Australia. The directorshave determined each port to be an Income Generating Unit (IGU), as each represents the smallestidentifiable group of assets that generate cash inflows that are largely independent of the cash inflows fromother assets or groups of assets. Goodwill arising on acquisition at these ports is included withinrepresentative IGUs. The recoverable amount of each of the IGUs is based on value in use calculations.
The value in use for each IGU was calculated with reference to the net present value of the future cashinflows projected to be derived from its assets, using cash flows based on approved five year plans. Theseplans are consistent with expectations of growth in local economies. The plans include assumptionsregarding cash flows based upon management’s expectations of the performance of each port over theperiod. The discount rate applied to these projections was based on the estimated weighted average cost ofcapital for the port location, adjusted for the related underlying tax. The weighted average of the effectivepre-tax discount rates used was 6.3 per cent.
The impairment in 2004 was principally the result of a review performed on an IGU by IGU basisfollowing the Fundamental Business Review of the Ferries division. These reviews have been reperformedin 2005. This exercise did not indicate a requirement to adjust the impairments made in 2004.
There is no impairment charge for the Group during the year.
F-192
www.global-reports.com
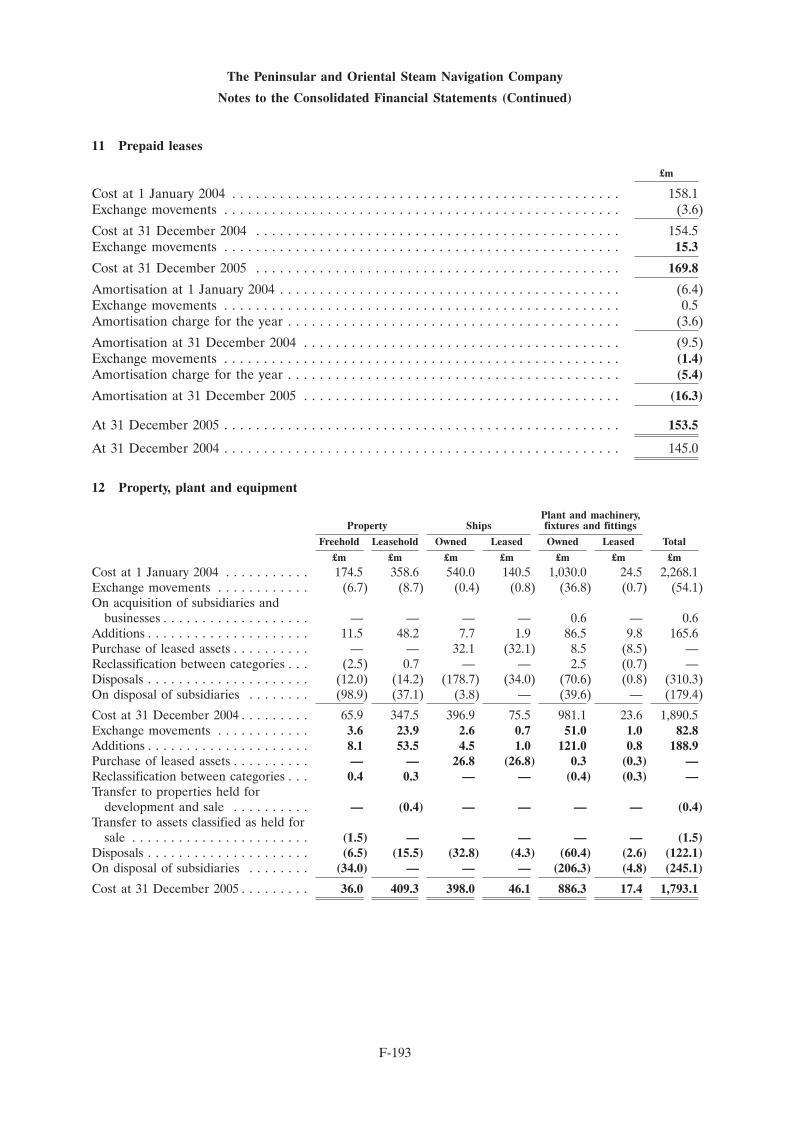
The Peninsular and Oriental Steam Navigation Company
Notes to the Consolidated Financial Statements (Continued)
11 Prepaid leases
£m
Cost at 1 January 2004 . . . . . . . . . . . . . . . . . . . . . . . . . . . . . . . . . . . . . . . . . . . . . . . . . 158.1Exchange movements . . . . . . . . . . . . . . . . . . . . . . . . . . . . . . . . . . . . . . . . . . . . . . . . . . (3.6)
Cost at 31 December 2004 . . . . . . . . . . . . . . . . . . . . . . . . . . . . . . . . . . . . . . . . . . . . . . 154.5Exchange movements . . . . . . . . . . . . . . . . . . . . . . . . . . . . . . . . . . . . . . . . . . . . . . . . . . 15.3
Cost at 31 December 2005 . . . . . . . . . . . . . . . . . . . . . . . . . . . . . . . . . . . . . . . . . . . . . . 169.8
Amortisation at 1 January 2004 . . . . . . . . . . . . . . . . . . . . . . . . . . . . . . . . . . . . . . . . . . . (6.4)Exchange movements . . . . . . . . . . . . . . . . . . . . . . . . . . . . . . . . . . . . . . . . . . . . . . . . . . 0.5Amortisation charge for the year . . . . . . . . . . . . . . . . . . . . . . . . . . . . . . . . . . . . . . . . . . (3.6)
Amortisation at 31 December 2004 . . . . . . . . . . . . . . . . . . . . . . . . . . . . . . . . . . . . . . . . (9.5)Exchange movements . . . . . . . . . . . . . . . . . . . . . . . . . . . . . . . . . . . . . . . . . . . . . . . . . . (1.4)Amortisation charge for the year . . . . . . . . . . . . . . . . . . . . . . . . . . . . . . . . . . . . . . . . . . (5.4)
Amortisation at 31 December 2005 . . . . . . . . . . . . . . . . . . . . . . . . . . . . . . . . . . . . . . . . (16.3)
At 31 December 2005 . . . . . . . . . . . . . . . . . . . . . . . . . . . . . . . . . . . . . . . . . . . . . . . . . . 153.5
At 31 December 2004 . . . . . . . . . . . . . . . . . . . . . . . . . . . . . . . . . . . . . . . . . . . . . . . . . . 145.0
12 Property, plant and equipment
Plant and machinery,Property Ships fixtures and fittings
Freehold Leasehold Owned Leased Owned Leased Total
£m £m £m £m £m £m £mCost at 1 January 2004 . . . . . . . . . . . 174.5 358.6 540.0 140.5 1,030.0 24.5 2,268.1Exchange movements . . . . . . . . . . . . (6.7) (8.7) (0.4) (0.8) (36.8) (0.7) (54.1)On acquisition of subsidiaries and
businesses . . . . . . . . . . . . . . . . . . . — — — — 0.6 — 0.6Additions . . . . . . . . . . . . . . . . . . . . . 11.5 48.2 7.7 1.9 86.5 9.8 165.6Purchase of leased assets . . . . . . . . . . — — 32.1 (32.1) 8.5 (8.5) —Reclassification between categories . . . (2.5) 0.7 — — 2.5 (0.7) —Disposals . . . . . . . . . . . . . . . . . . . . . (12.0) (14.2) (178.7) (34.0) (70.6) (0.8) (310.3)On disposal of subsidiaries . . . . . . . . (98.9) (37.1) (3.8) — (39.6) — (179.4)
Cost at 31 December 2004 . . . . . . . . . 65.9 347.5 396.9 75.5 981.1 23.6 1,890.5Exchange movements . . . . . . . . . . . . 3.6 23.9 2.6 0.7 51.0 1.0 82.8Additions . . . . . . . . . . . . . . . . . . . . . 8.1 53.5 4.5 1.0 121.0 0.8 188.9Purchase of leased assets . . . . . . . . . . — — 26.8 (26.8) 0.3 (0.3) —Reclassification between categories . . . 0.4 0.3 — — (0.4) (0.3) —Transfer to properties held for
development and sale . . . . . . . . . . — (0.4) — — — — (0.4)Transfer to assets classified as held for
sale . . . . . . . . . . . . . . . . . . . . . . . (1.5) — — — — — (1.5)Disposals . . . . . . . . . . . . . . . . . . . . . (6.5) (15.5) (32.8) (4.3) (60.4) (2.6) (122.1)On disposal of subsidiaries . . . . . . . . (34.0) — — — (206.3) (4.8) (245.1)
Cost at 31 December 2005 . . . . . . . . . 36.0 409.3 398.0 46.1 886.3 17.4 1,793.1
F-193
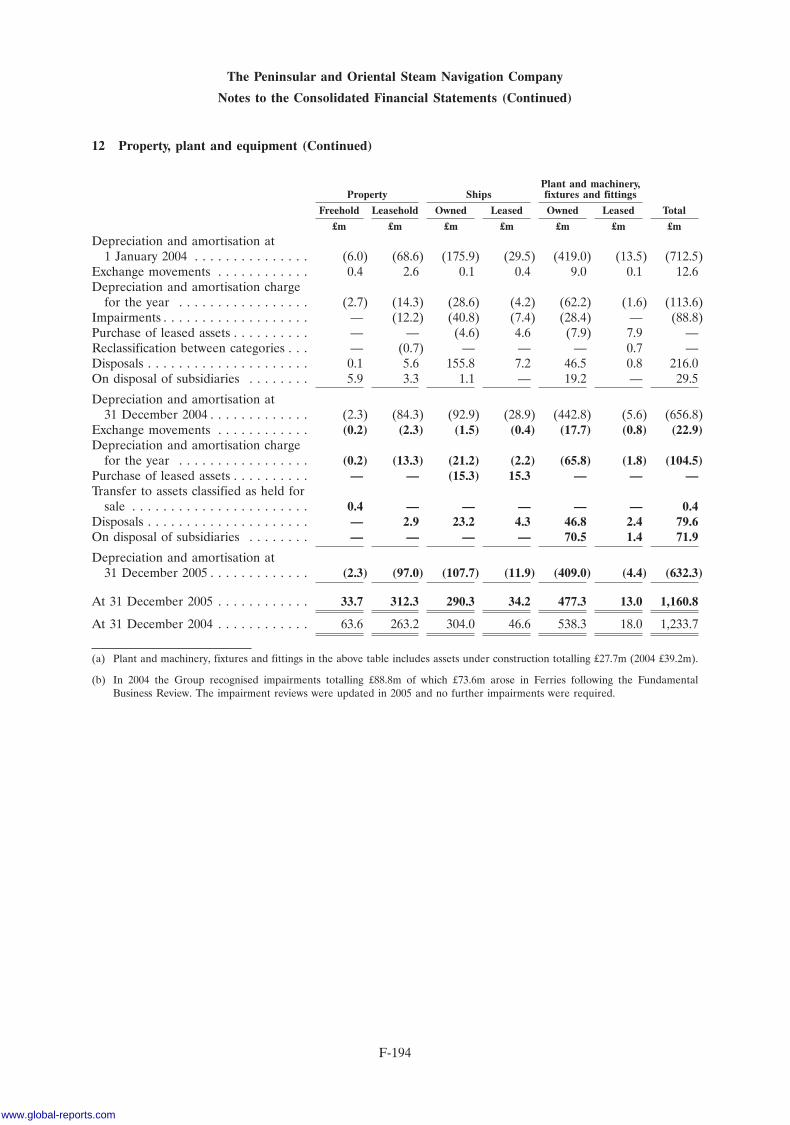
The Peninsular and Oriental Steam Navigation Company
Notes to the Consolidated Financial Statements (Continued)
12 Property, plant and equipment (Continued)
Plant and machinery,Property Ships fixtures and fittings
Freehold Leasehold Owned Leased Owned Leased Total
£m £m £m £m £m £m £mDepreciation and amortisation at
1 January 2004 . . . . . . . . . . . . . . . (6.0) (68.6) (175.9) (29.5) (419.0) (13.5) (712.5)Exchange movements . . . . . . . . . . . . 0.4 2.6 0.1 0.4 9.0 0.1 12.6Depreciation and amortisation charge
for the year . . . . . . . . . . . . . . . . . (2.7) (14.3) (28.6) (4.2) (62.2) (1.6) (113.6)Impairments . . . . . . . . . . . . . . . . . . . — (12.2) (40.8) (7.4) (28.4) — (88.8)Purchase of leased assets . . . . . . . . . . — — (4.6) 4.6 (7.9) 7.9 —Reclassification between categories . . . — (0.7) — — — 0.7 —Disposals . . . . . . . . . . . . . . . . . . . . . 0.1 5.6 155.8 7.2 46.5 0.8 216.0On disposal of subsidiaries . . . . . . . . 5.9 3.3 1.1 — 19.2 — 29.5
Depreciation and amortisation at31 December 2004 . . . . . . . . . . . . . (2.3) (84.3) (92.9) (28.9) (442.8) (5.6) (656.8)
Exchange movements . . . . . . . . . . . . (0.2) (2.3) (1.5) (0.4) (17.7) (0.8) (22.9)Depreciation and amortisation charge
for the year . . . . . . . . . . . . . . . . . (0.2) (13.3) (21.2) (2.2) (65.8) (1.8) (104.5)Purchase of leased assets . . . . . . . . . . — — (15.3) 15.3 — — —Transfer to assets classified as held for
sale . . . . . . . . . . . . . . . . . . . . . . . 0.4 — — — — — 0.4Disposals . . . . . . . . . . . . . . . . . . . . . — 2.9 23.2 4.3 46.8 2.4 79.6On disposal of subsidiaries . . . . . . . . — — — — 70.5 1.4 71.9
Depreciation and amortisation at31 December 2005 . . . . . . . . . . . . . (2.3) (97.0) (107.7) (11.9) (409.0) (4.4) (632.3)
At 31 December 2005 . . . . . . . . . . . . 33.7 312.3 290.3 34.2 477.3 13.0 1,160.8
At 31 December 2004 . . . . . . . . . . . . 63.6 263.2 304.0 46.6 538.3 18.0 1,233.7
(a) Plant and machinery, fixtures and fittings in the above table includes assets under construction totalling £27.7m (2004 £39.2m).
(b) In 2004 the Group recognised impairments totalling £88.8m of which £73.6m arose in Ferries following the FundamentalBusiness Review. The impairment reviews were updated in 2005 and no further impairments were required.
F-194
www.global-reports.com
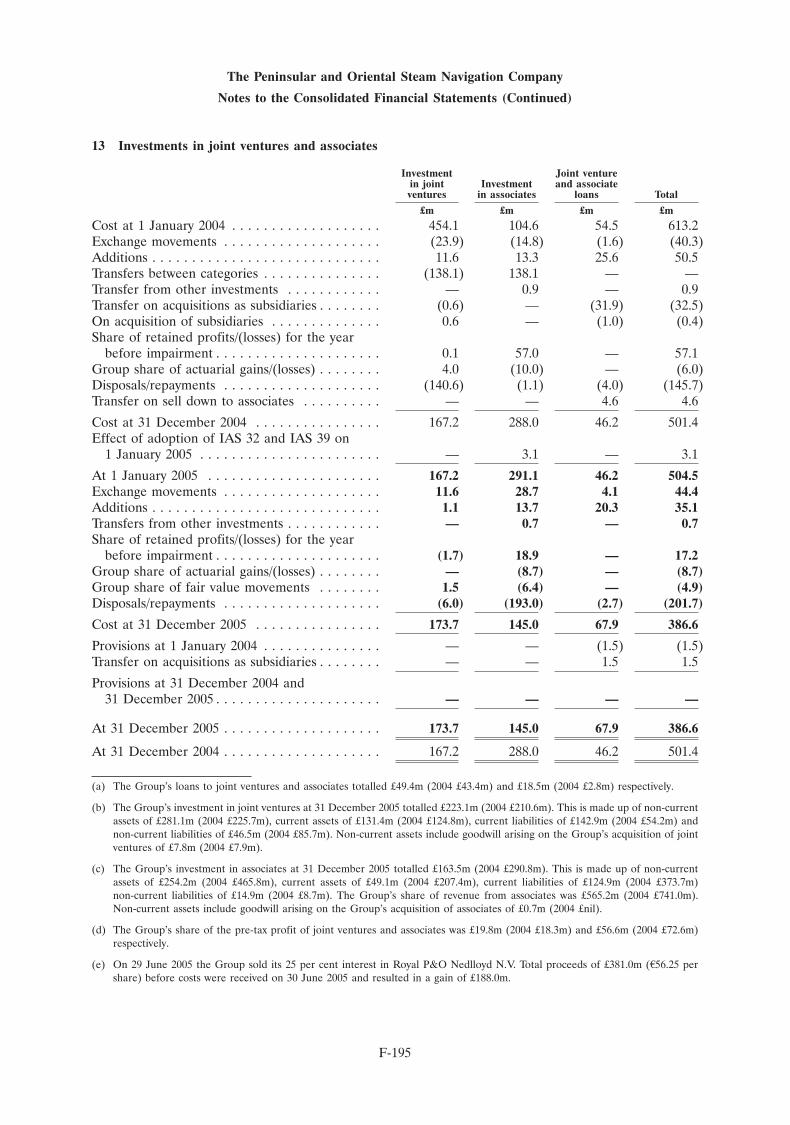
The Peninsular and Oriental Steam Navigation Company
Notes to the Consolidated Financial Statements (Continued)
13 Investments in joint ventures and associates
Investment Joint venturein joint Investment and associateventures in associates loans Total
£m £m £m £m
Cost at 1 January 2004 . . . . . . . . . . . . . . . . . . . 454.1 104.6 54.5 613.2Exchange movements . . . . . . . . . . . . . . . . . . . . (23.9) (14.8) (1.6) (40.3)Additions . . . . . . . . . . . . . . . . . . . . . . . . . . . . . 11.6 13.3 25.6 50.5Transfers between categories . . . . . . . . . . . . . . . (138.1) 138.1 — —Transfer from other investments . . . . . . . . . . . . — 0.9 — 0.9Transfer on acquisitions as subsidiaries . . . . . . . . (0.6) — (31.9) (32.5)On acquisition of subsidiaries . . . . . . . . . . . . . . 0.6 — (1.0) (0.4)Share of retained profits/(losses) for the year
before impairment . . . . . . . . . . . . . . . . . . . . . 0.1 57.0 — 57.1Group share of actuarial gains/(losses) . . . . . . . . 4.0 (10.0) — (6.0)Disposals/repayments . . . . . . . . . . . . . . . . . . . . (140.6) (1.1) (4.0) (145.7)Transfer on sell down to associates . . . . . . . . . . — — 4.6 4.6
Cost at 31 December 2004 . . . . . . . . . . . . . . . . 167.2 288.0 46.2 501.4Effect of adoption of IAS 32 and IAS 39 on
1 January 2005 . . . . . . . . . . . . . . . . . . . . . . . — 3.1 — 3.1
At 1 January 2005 . . . . . . . . . . . . . . . . . . . . . . 167.2 291.1 46.2 504.5Exchange movements . . . . . . . . . . . . . . . . . . . . 11.6 28.7 4.1 44.4Additions . . . . . . . . . . . . . . . . . . . . . . . . . . . . . 1.1 13.7 20.3 35.1Transfers from other investments . . . . . . . . . . . . — 0.7 — 0.7Share of retained profits/(losses) for the year
before impairment . . . . . . . . . . . . . . . . . . . . . (1.7) 18.9 — 17.2Group share of actuarial gains/(losses) . . . . . . . . — (8.7) — (8.7)Group share of fair value movements . . . . . . . . 1.5 (6.4) — (4.9)Disposals/repayments . . . . . . . . . . . . . . . . . . . . (6.0) (193.0) (2.7) (201.7)
Cost at 31 December 2005 . . . . . . . . . . . . . . . . 173.7 145.0 67.9 386.6
Provisions at 1 January 2004 . . . . . . . . . . . . . . . — — (1.5) (1.5)Transfer on acquisitions as subsidiaries . . . . . . . . — — 1.5 1.5
Provisions at 31 December 2004 and31 December 2005 . . . . . . . . . . . . . . . . . . . . . — — — —
At 31 December 2005 . . . . . . . . . . . . . . . . . . . . 173.7 145.0 67.9 386.6
At 31 December 2004 . . . . . . . . . . . . . . . . . . . . 167.2 288.0 46.2 501.4
(a) The Group’s loans to joint ventures and associates totalled £49.4m (2004 £43.4m) and £18.5m (2004 £2.8m) respectively.
(b) The Group’s investment in joint ventures at 31 December 2005 totalled £223.1m (2004 £210.6m). This is made up of non-currentassets of £281.1m (2004 £225.7m), current assets of £131.4m (2004 £124.8m), current liabilities of £142.9m (2004 £54.2m) andnon-current liabilities of £46.5m (2004 £85.7m). Non-current assets include goodwill arising on the Group’s acquisition of jointventures of £7.8m (2004 £7.9m).
(c) The Group’s investment in associates at 31 December 2005 totalled £163.5m (2004 £290.8m). This is made up of non-currentassets of £254.2m (2004 £465.8m), current assets of £49.1m (2004 £207.4m), current liabilities of £124.9m (2004 £373.7m)non-current liabilities of £14.9m (2004 £8.7m). The Group’s share of revenue from associates was £565.2m (2004 £741.0m).Non-current assets include goodwill arising on the Group’s acquisition of associates of £0.7m (2004 £nil).
(d) The Group’s share of the pre-tax profit of joint ventures and associates was £19.8m (2004 £18.3m) and £56.6m (2004 £72.6m)respectively.
(e) On 29 June 2005 the Group sold its 25 per cent interest in Royal P&O Nedlloyd N.V. Total proceeds of £381.0m (A56.25 pershare) before costs were received on 30 June 2005 and resulted in a gain of £188.0m.
F-195
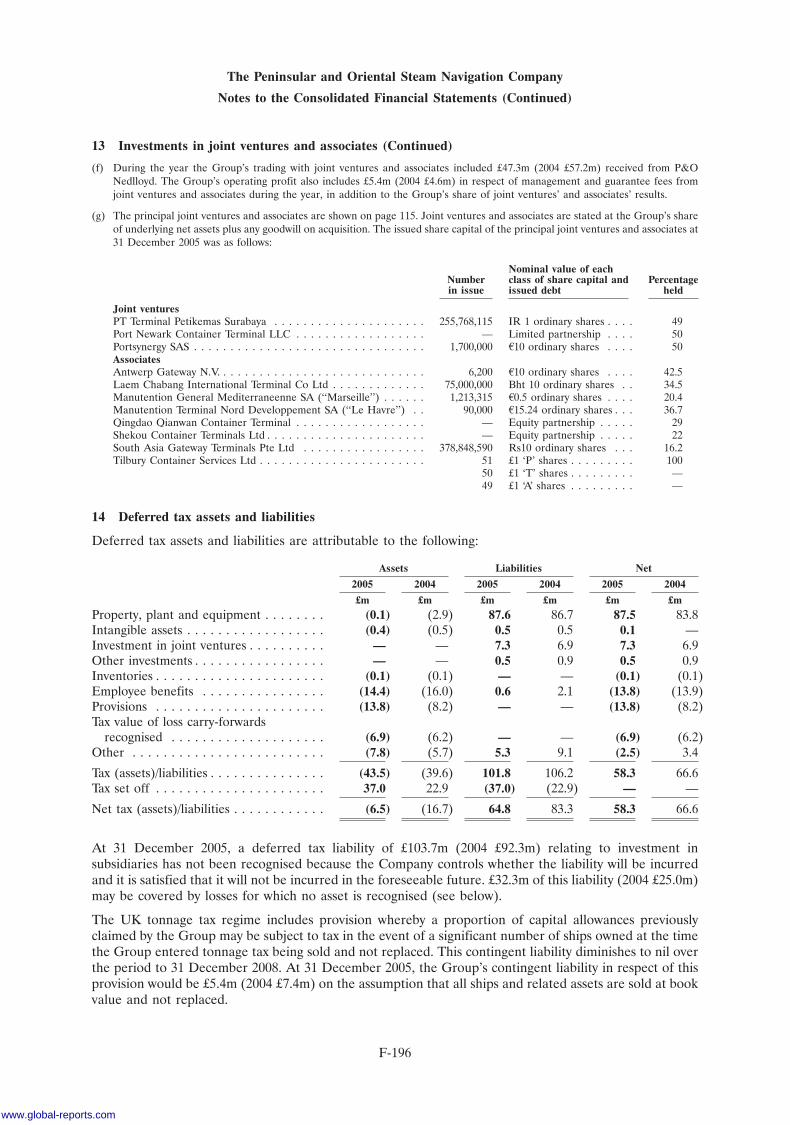
The Peninsular and Oriental Steam Navigation Company
Notes to the Consolidated Financial Statements (Continued)
13 Investments in joint ventures and associates (Continued)
(f) During the year the Group’s trading with joint ventures and associates included £47.3m (2004 £57.2m) received from P&ONedlloyd. The Group’s operating profit also includes £5.4m (2004 £4.6m) in respect of management and guarantee fees fromjoint ventures and associates during the year, in addition to the Group’s share of joint ventures’ and associates’ results.
(g) The principal joint ventures and associates are shown on page 115. Joint ventures and associates are stated at the Group’s shareof underlying net assets plus any goodwill on acquisition. The issued share capital of the principal joint ventures and associates at31 December 2005 was as follows:
Nominal value of eachNumber class of share capital and Percentagein issue issued debt held
Joint venturesPT Terminal Petikemas Surabaya . . . . . . . . . . . . . . . . . . . . . 255,768,115 IR 1 ordinary shares . . . . 49Port Newark Container Terminal LLC . . . . . . . . . . . . . . . . . . — Limited partnership . . . . 50Portsynergy SAS . . . . . . . . . . . . . . . . . . . . . . . . . . . . . . . . 1,700,000 A10 ordinary shares . . . . 50AssociatesAntwerp Gateway N.V. . . . . . . . . . . . . . . . . . . . . . . . . . . . . 6,200 A10 ordinary shares . . . . 42.5Laem Chabang International Terminal Co Ltd . . . . . . . . . . . . . 75,000,000 Bht 10 ordinary shares . . 34.5Manutention General Mediterraneenne SA (‘‘Marseille’’) . . . . . . 1,213,315 A0.5 ordinary shares . . . . 20.4Manutention Terminal Nord Developpement SA (‘‘Le Havre’’) . . 90,000 A15.24 ordinary shares . . . 36.7Qingdao Qianwan Container Terminal . . . . . . . . . . . . . . . . . . — Equity partnership . . . . . 29Shekou Container Terminals Ltd . . . . . . . . . . . . . . . . . . . . . . — Equity partnership . . . . . 22South Asia Gateway Terminals Pte Ltd . . . . . . . . . . . . . . . . . 378,848,590 Rs10 ordinary shares . . . 16.2Tilbury Container Services Ltd . . . . . . . . . . . . . . . . . . . . . . . 51 £1 ‘P’ shares . . . . . . . . . 100
50 £1 ‘T’ shares . . . . . . . . . —49 £1 ‘A’ shares . . . . . . . . . —
14 Deferred tax assets and liabilities
Deferred tax assets and liabilities are attributable to the following:
Assets Liabilities Net
2005 2004 2005 2004 2005 2004
£m £m £m £m £m £mProperty, plant and equipment . . . . . . . . (0.1) (2.9) 87.6 86.7 87.5 83.8Intangible assets . . . . . . . . . . . . . . . . . . (0.4) (0.5) 0.5 0.5 0.1 —Investment in joint ventures . . . . . . . . . . — — 7.3 6.9 7.3 6.9Other investments . . . . . . . . . . . . . . . . . — — 0.5 0.9 0.5 0.9Inventories . . . . . . . . . . . . . . . . . . . . . . (0.1) (0.1) — — (0.1) (0.1)Employee benefits . . . . . . . . . . . . . . . . (14.4) (16.0) 0.6 2.1 (13.8) (13.9)Provisions . . . . . . . . . . . . . . . . . . . . . . (13.8) (8.2) — — (13.8) (8.2)Tax value of loss carry-forwards
recognised . . . . . . . . . . . . . . . . . . . . (6.9) (6.2) — — (6.9) (6.2)Other . . . . . . . . . . . . . . . . . . . . . . . . . (7.8) (5.7) 5.3 9.1 (2.5) 3.4
Tax (assets)/liabilities . . . . . . . . . . . . . . . (43.5) (39.6) 101.8 106.2 58.3 66.6Tax set off . . . . . . . . . . . . . . . . . . . . . . 37.0 22.9 (37.0) (22.9) — —
Net tax (assets)/liabilities . . . . . . . . . . . . (6.5) (16.7) 64.8 83.3 58.3 66.6
At 31 December 2005, a deferred tax liability of £103.7m (2004 £92.3m) relating to investment insubsidiaries has not been recognised because the Company controls whether the liability will be incurredand it is satisfied that it will not be incurred in the foreseeable future. £32.3m of this liability (2004 £25.0m)may be covered by losses for which no asset is recognised (see below).
The UK tonnage tax regime includes provision whereby a proportion of capital allowances previouslyclaimed by the Group may be subject to tax in the event of a significant number of ships owned at the timethe Group entered tonnage tax being sold and not replaced. This contingent liability diminishes to nil overthe period to 31 December 2008. At 31 December 2005, the Group’s contingent liability in respect of thisprovision would be £5.4m (2004 £7.4m) on the assumption that all ships and related assets are sold at bookvalue and not replaced.
F-196
www.global-reports.com
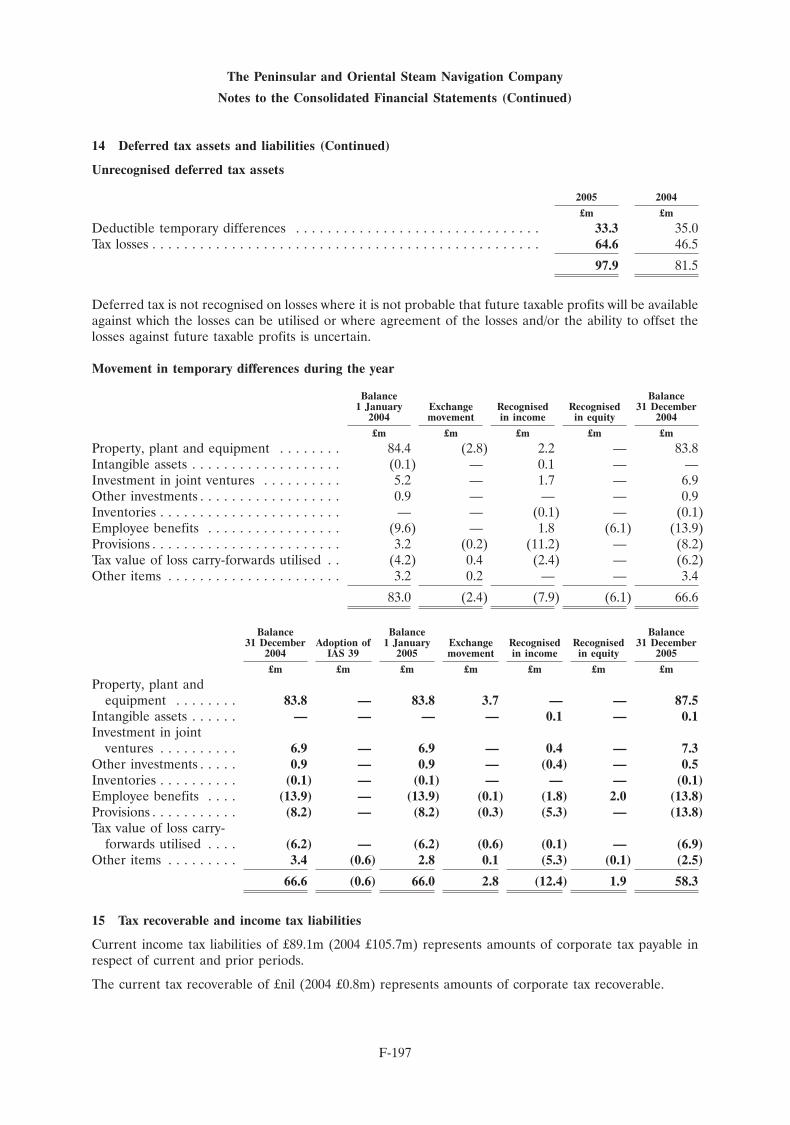
The Peninsular and Oriental Steam Navigation Company
Notes to the Consolidated Financial Statements (Continued)
14 Deferred tax assets and liabilities (Continued)
Unrecognised deferred tax assets
2005 2004
£m £m
Deductible temporary differences . . . . . . . . . . . . . . . . . . . . . . . . . . . . . . . 33.3 35.0Tax losses . . . . . . . . . . . . . . . . . . . . . . . . . . . . . . . . . . . . . . . . . . . . . . . . . 64.6 46.5
97.9 81.5
Deferred tax is not recognised on losses where it is not probable that future taxable profits will be availableagainst which the losses can be utilised or where agreement of the losses and/or the ability to offset thelosses against future taxable profits is uncertain.
Movement in temporary differences during the year
Balance Balance1 January Exchange Recognised Recognised 31 December
2004 movement in income in equity 2004
£m £m £m £m £m
Property, plant and equipment . . . . . . . . 84.4 (2.8) 2.2 — 83.8Intangible assets . . . . . . . . . . . . . . . . . . . (0.1) — 0.1 — —Investment in joint ventures . . . . . . . . . . 5.2 — 1.7 — 6.9Other investments . . . . . . . . . . . . . . . . . . 0.9 — — — 0.9Inventories . . . . . . . . . . . . . . . . . . . . . . . — — (0.1) — (0.1)Employee benefits . . . . . . . . . . . . . . . . . (9.6) — 1.8 (6.1) (13.9)Provisions . . . . . . . . . . . . . . . . . . . . . . . . 3.2 (0.2) (11.2) — (8.2)Tax value of loss carry-forwards utilised . . (4.2) 0.4 (2.4) — (6.2)Other items . . . . . . . . . . . . . . . . . . . . . . 3.2 0.2 — — 3.4
83.0 (2.4) (7.9) (6.1) 66.6
Balance Balance Balance31 December Adoption of 1 January Exchange Recognised Recognised 31 December
2004 IAS 39 2005 movement in income in equity 2005
£m £m £m £m £m £m £m
Property, plant andequipment . . . . . . . . 83.8 — 83.8 3.7 — — 87.5
Intangible assets . . . . . . — — — — 0.1 — 0.1Investment in joint
ventures . . . . . . . . . . 6.9 — 6.9 — 0.4 — 7.3Other investments . . . . . 0.9 — 0.9 — (0.4) — 0.5Inventories . . . . . . . . . . (0.1) — (0.1) — — — (0.1)Employee benefits . . . . (13.9) — (13.9) (0.1) (1.8) 2.0 (13.8)Provisions . . . . . . . . . . . (8.2) — (8.2) (0.3) (5.3) — (13.8)Tax value of loss carry-
forwards utilised . . . . (6.2) — (6.2) (0.6) (0.1) — (6.9)Other items . . . . . . . . . 3.4 (0.6) 2.8 0.1 (5.3) (0.1) (2.5)
66.6 (0.6) 66.0 2.8 (12.4) 1.9 58.3
15 Tax recoverable and income tax liabilities
Current income tax liabilities of £89.1m (2004 £105.7m) represents amounts of corporate tax payable inrespect of current and prior periods.
The current tax recoverable of £nil (2004 £0.8m) represents amounts of corporate tax recoverable.
F-197
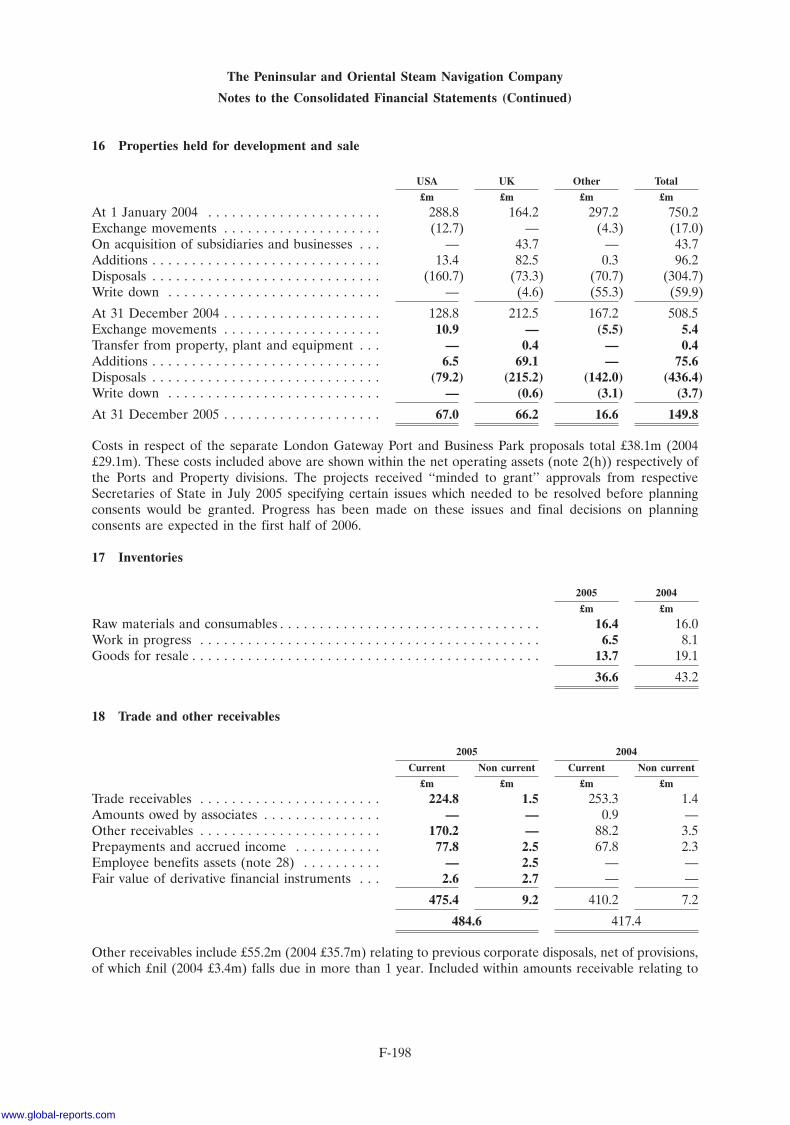
The Peninsular and Oriental Steam Navigation Company
Notes to the Consolidated Financial Statements (Continued)
16 Properties held for development and sale
USA UK Other Total
£m £m £m £m
At 1 January 2004 . . . . . . . . . . . . . . . . . . . . . . 288.8 164.2 297.2 750.2Exchange movements . . . . . . . . . . . . . . . . . . . . (12.7) — (4.3) (17.0)On acquisition of subsidiaries and businesses . . . — 43.7 — 43.7Additions . . . . . . . . . . . . . . . . . . . . . . . . . . . . . 13.4 82.5 0.3 96.2Disposals . . . . . . . . . . . . . . . . . . . . . . . . . . . . . (160.7) (73.3) (70.7) (304.7)Write down . . . . . . . . . . . . . . . . . . . . . . . . . . . — (4.6) (55.3) (59.9)
At 31 December 2004 . . . . . . . . . . . . . . . . . . . . 128.8 212.5 167.2 508.5Exchange movements . . . . . . . . . . . . . . . . . . . . 10.9 — (5.5) 5.4Transfer from property, plant and equipment . . . — 0.4 — 0.4Additions . . . . . . . . . . . . . . . . . . . . . . . . . . . . . 6.5 69.1 — 75.6Disposals . . . . . . . . . . . . . . . . . . . . . . . . . . . . . (79.2) (215.2) (142.0) (436.4)Write down . . . . . . . . . . . . . . . . . . . . . . . . . . . — (0.6) (3.1) (3.7)
At 31 December 2005 . . . . . . . . . . . . . . . . . . . . 67.0 66.2 16.6 149.8
Costs in respect of the separate London Gateway Port and Business Park proposals total £38.1m (2004£29.1m). These costs included above are shown within the net operating assets (note 2(h)) respectively ofthe Ports and Property divisions. The projects received ‘‘minded to grant’’ approvals from respectiveSecretaries of State in July 2005 specifying certain issues which needed to be resolved before planningconsents would be granted. Progress has been made on these issues and final decisions on planningconsents are expected in the first half of 2006.
17 Inventories
2005 2004
£m £m
Raw materials and consumables . . . . . . . . . . . . . . . . . . . . . . . . . . . . . . . . . 16.4 16.0Work in progress . . . . . . . . . . . . . . . . . . . . . . . . . . . . . . . . . . . . . . . . . . . 6.5 8.1Goods for resale . . . . . . . . . . . . . . . . . . . . . . . . . . . . . . . . . . . . . . . . . . . . 13.7 19.1
36.6 43.2
18 Trade and other receivables
2005 2004
Current Non current Current Non current
£m £m £m £m
Trade receivables . . . . . . . . . . . . . . . . . . . . . . . 224.8 1.5 253.3 1.4Amounts owed by associates . . . . . . . . . . . . . . . — — 0.9 —Other receivables . . . . . . . . . . . . . . . . . . . . . . . 170.2 — 88.2 3.5Prepayments and accrued income . . . . . . . . . . . 77.8 2.5 67.8 2.3Employee benefits assets (note 28) . . . . . . . . . . — 2.5 — —Fair value of derivative financial instruments . . . 2.6 2.7 — —
475.4 9.2 410.2 7.2
484.6 417.4
Other receivables include £55.2m (2004 £35.7m) relating to previous corporate disposals, net of provisions,of which £nil (2004 £3.4m) falls due in more than 1 year. Included within amounts receivable relating to
F-198
www.global-reports.com
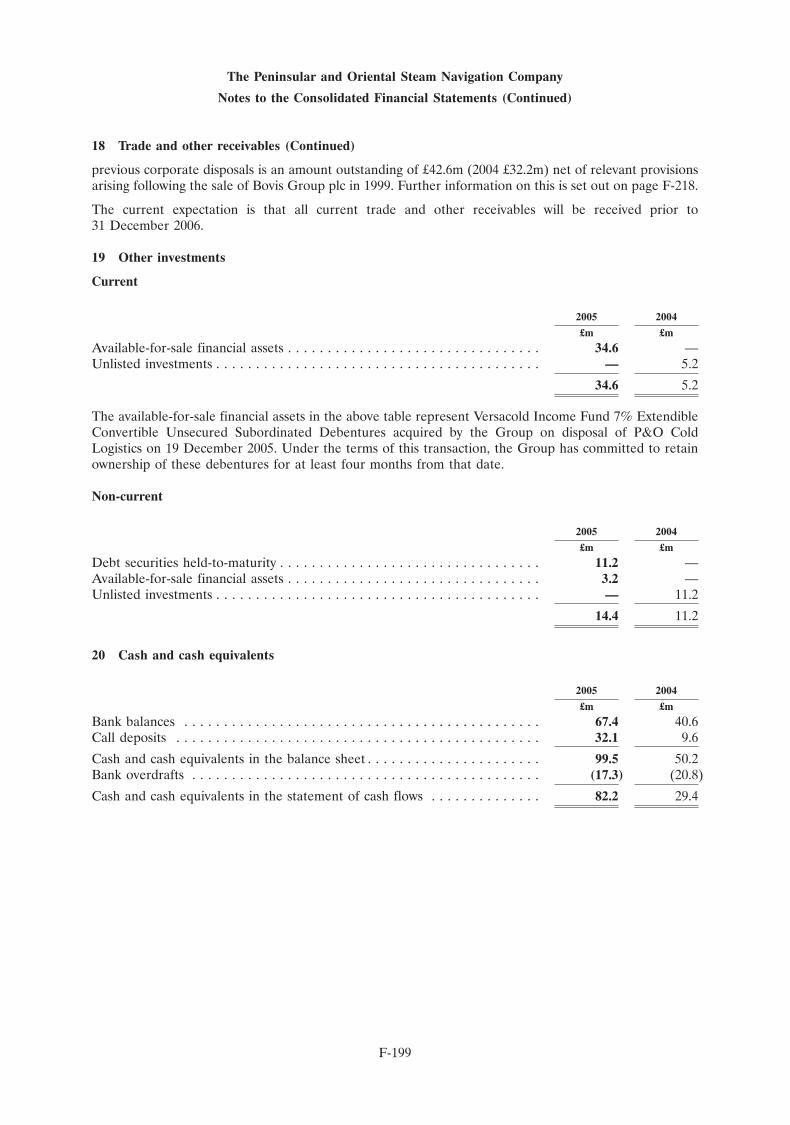
The Peninsular and Oriental Steam Navigation Company
Notes to the Consolidated Financial Statements (Continued)
18 Trade and other receivables (Continued)
previous corporate disposals is an amount outstanding of £42.6m (2004 £32.2m) net of relevant provisionsarising following the sale of Bovis Group plc in 1999. Further information on this is set out on page F-218.
The current expectation is that all current trade and other receivables will be received prior to31 December 2006.
19 Other investments
Current
2005 2004
£m £m
Available-for-sale financial assets . . . . . . . . . . . . . . . . . . . . . . . . . . . . . . . . 34.6 —Unlisted investments . . . . . . . . . . . . . . . . . . . . . . . . . . . . . . . . . . . . . . . . . — 5.2
34.6 5.2
The available-for-sale financial assets in the above table represent Versacold Income Fund 7% ExtendibleConvertible Unsecured Subordinated Debentures acquired by the Group on disposal of P&O ColdLogistics on 19 December 2005. Under the terms of this transaction, the Group has committed to retainownership of these debentures for at least four months from that date.
Non-current
2005 2004
£m £m
Debt securities held-to-maturity . . . . . . . . . . . . . . . . . . . . . . . . . . . . . . . . . 11.2 —Available-for-sale financial assets . . . . . . . . . . . . . . . . . . . . . . . . . . . . . . . . 3.2 —Unlisted investments . . . . . . . . . . . . . . . . . . . . . . . . . . . . . . . . . . . . . . . . . — 11.2
14.4 11.2
20 Cash and cash equivalents
2005 2004
£m £m
Bank balances . . . . . . . . . . . . . . . . . . . . . . . . . . . . . . . . . . . . . . . . . . . . . 67.4 40.6Call deposits . . . . . . . . . . . . . . . . . . . . . . . . . . . . . . . . . . . . . . . . . . . . . . 32.1 9.6
Cash and cash equivalents in the balance sheet . . . . . . . . . . . . . . . . . . . . . . 99.5 50.2Bank overdrafts . . . . . . . . . . . . . . . . . . . . . . . . . . . . . . . . . . . . . . . . . . . . (17.3) (20.8)
Cash and cash equivalents in the statement of cash flows . . . . . . . . . . . . . . 82.2 29.4
F-199
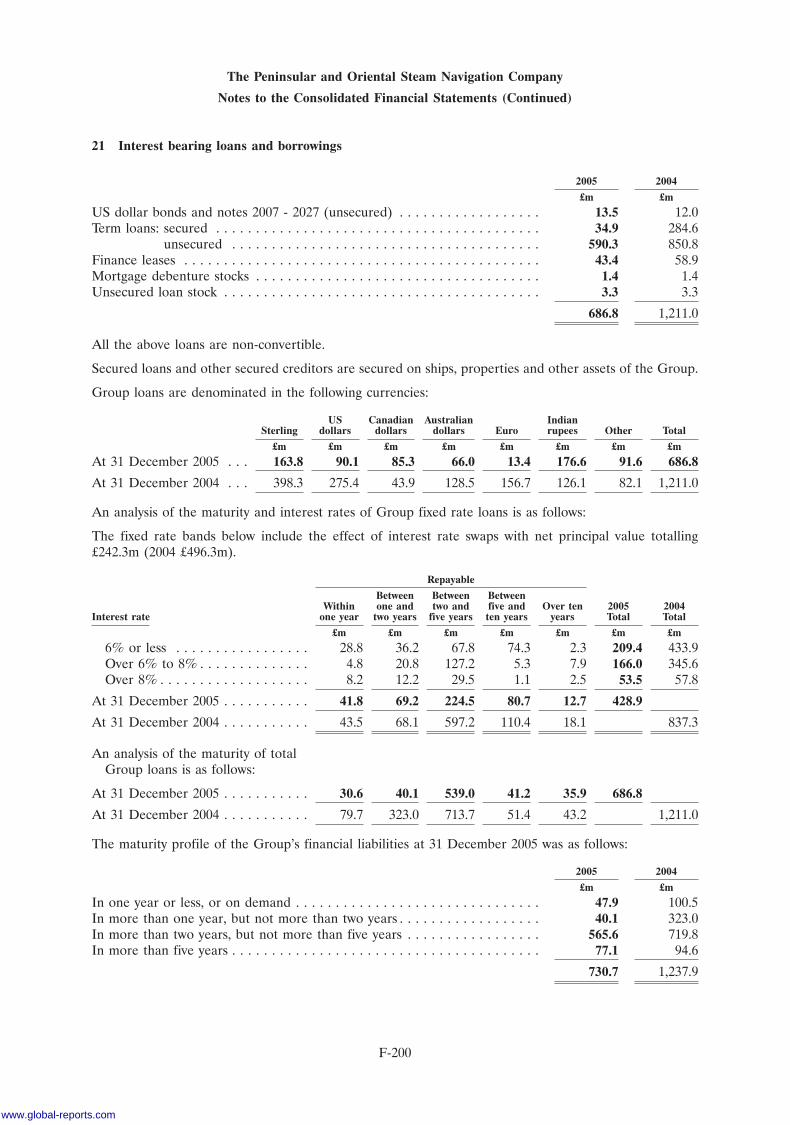
The Peninsular and Oriental Steam Navigation Company
Notes to the Consolidated Financial Statements (Continued)
21 Interest bearing loans and borrowings
2005 2004
£m £m
US dollar bonds and notes 2007 - 2027 (unsecured) . . . . . . . . . . . . . . . . . . 13.5 12.0Term loans: secured . . . . . . . . . . . . . . . . . . . . . . . . . . . . . . . . . . . . . . . . . 34.9 284.6
unsecured . . . . . . . . . . . . . . . . . . . . . . . . . . . . . . . . . . . . . . . 590.3 850.8Finance leases . . . . . . . . . . . . . . . . . . . . . . . . . . . . . . . . . . . . . . . . . . . . . 43.4 58.9Mortgage debenture stocks . . . . . . . . . . . . . . . . . . . . . . . . . . . . . . . . . . . . 1.4 1.4Unsecured loan stock . . . . . . . . . . . . . . . . . . . . . . . . . . . . . . . . . . . . . . . . 3.3 3.3
686.8 1,211.0
All the above loans are non-convertible.
Secured loans and other secured creditors are secured on ships, properties and other assets of the Group.
Group loans are denominated in the following currencies:
US Canadian Australian IndianSterling dollars dollars dollars Euro rupees Other Total
£m £m £m £m £m £m £m £m
At 31 December 2005 . . . 163.8 90.1 85.3 66.0 13.4 176.6 91.6 686.8
At 31 December 2004 . . . 398.3 275.4 43.9 128.5 156.7 126.1 82.1 1,211.0
An analysis of the maturity and interest rates of Group fixed rate loans is as follows:
The fixed rate bands below include the effect of interest rate swaps with net principal value totalling£242.3m (2004 £496.3m).
Repayable
Between Between BetweenWithin one and two and five and Over ten 2005 2004
Interest rate one year two years five years ten years years Total Total
£m £m £m £m £m £m £m
6% or less . . . . . . . . . . . . . . . . . 28.8 36.2 67.8 74.3 2.3 209.4 433.9Over 6% to 8% . . . . . . . . . . . . . . 4.8 20.8 127.2 5.3 7.9 166.0 345.6Over 8% . . . . . . . . . . . . . . . . . . . 8.2 12.2 29.5 1.1 2.5 53.5 57.8
At 31 December 2005 . . . . . . . . . . . 41.8 69.2 224.5 80.7 12.7 428.9
At 31 December 2004 . . . . . . . . . . . 43.5 68.1 597.2 110.4 18.1 837.3
An analysis of the maturity of totalGroup loans is as follows:
At 31 December 2005 . . . . . . . . . . . 30.6 40.1 539.0 41.2 35.9 686.8
At 31 December 2004 . . . . . . . . . . . 79.7 323.0 713.7 51.4 43.2 1,211.0
The maturity profile of the Group’s financial liabilities at 31 December 2005 was as follows:
2005 2004
£m £m
In one year or less, or on demand . . . . . . . . . . . . . . . . . . . . . . . . . . . . . . . 47.9 100.5In more than one year, but not more than two years . . . . . . . . . . . . . . . . . . 40.1 323.0In more than two years, but not more than five years . . . . . . . . . . . . . . . . . 565.6 719.8In more than five years . . . . . . . . . . . . . . . . . . . . . . . . . . . . . . . . . . . . . . . 77.1 94.6
730.7 1,237.9
F-200
www.global-reports.com
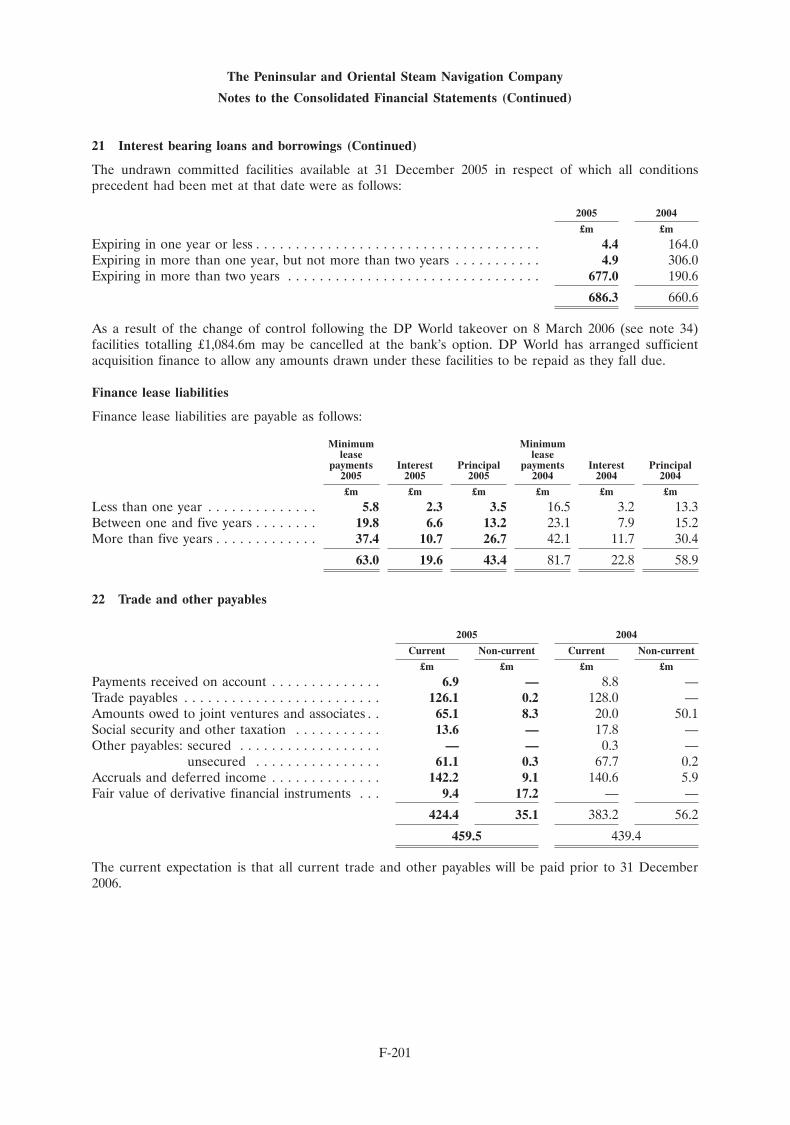
The Peninsular and Oriental Steam Navigation Company
Notes to the Consolidated Financial Statements (Continued)
21 Interest bearing loans and borrowings (Continued)
The undrawn committed facilities available at 31 December 2005 in respect of which all conditionsprecedent had been met at that date were as follows:
2005 2004
£m £m
Expiring in one year or less . . . . . . . . . . . . . . . . . . . . . . . . . . . . . . . . . . . . 4.4 164.0Expiring in more than one year, but not more than two years . . . . . . . . . . . 4.9 306.0Expiring in more than two years . . . . . . . . . . . . . . . . . . . . . . . . . . . . . . . . 677.0 190.6
686.3 660.6
As a result of the change of control following the DP World takeover on 8 March 2006 (see note 34)facilities totalling £1,084.6m may be cancelled at the bank’s option. DP World has arranged sufficientacquisition finance to allow any amounts drawn under these facilities to be repaid as they fall due.
Finance lease liabilities
Finance lease liabilities are payable as follows:
Minimum Minimumlease lease
payments Interest Principal payments Interest Principal2005 2005 2005 2004 2004 2004
£m £m £m £m £m £m
Less than one year . . . . . . . . . . . . . . 5.8 2.3 3.5 16.5 3.2 13.3Between one and five years . . . . . . . . 19.8 6.6 13.2 23.1 7.9 15.2More than five years . . . . . . . . . . . . . 37.4 10.7 26.7 42.1 11.7 30.4
63.0 19.6 43.4 81.7 22.8 58.9
22 Trade and other payables
2005 2004
Current Non-current Current Non-current
£m £m £m £m
Payments received on account . . . . . . . . . . . . . . 6.9 — 8.8 —Trade payables . . . . . . . . . . . . . . . . . . . . . . . . . 126.1 0.2 128.0 —Amounts owed to joint ventures and associates . . 65.1 8.3 20.0 50.1Social security and other taxation . . . . . . . . . . . 13.6 — 17.8 —Other payables: secured . . . . . . . . . . . . . . . . . . — — 0.3 —
unsecured . . . . . . . . . . . . . . . . 61.1 0.3 67.7 0.2Accruals and deferred income . . . . . . . . . . . . . . 142.2 9.1 140.6 5.9Fair value of derivative financial instruments . . . 9.4 17.2 — —
424.4 35.1 383.2 56.2
459.5 439.4
The current expectation is that all current trade and other payables will be paid prior to 31 December2006.
F-201
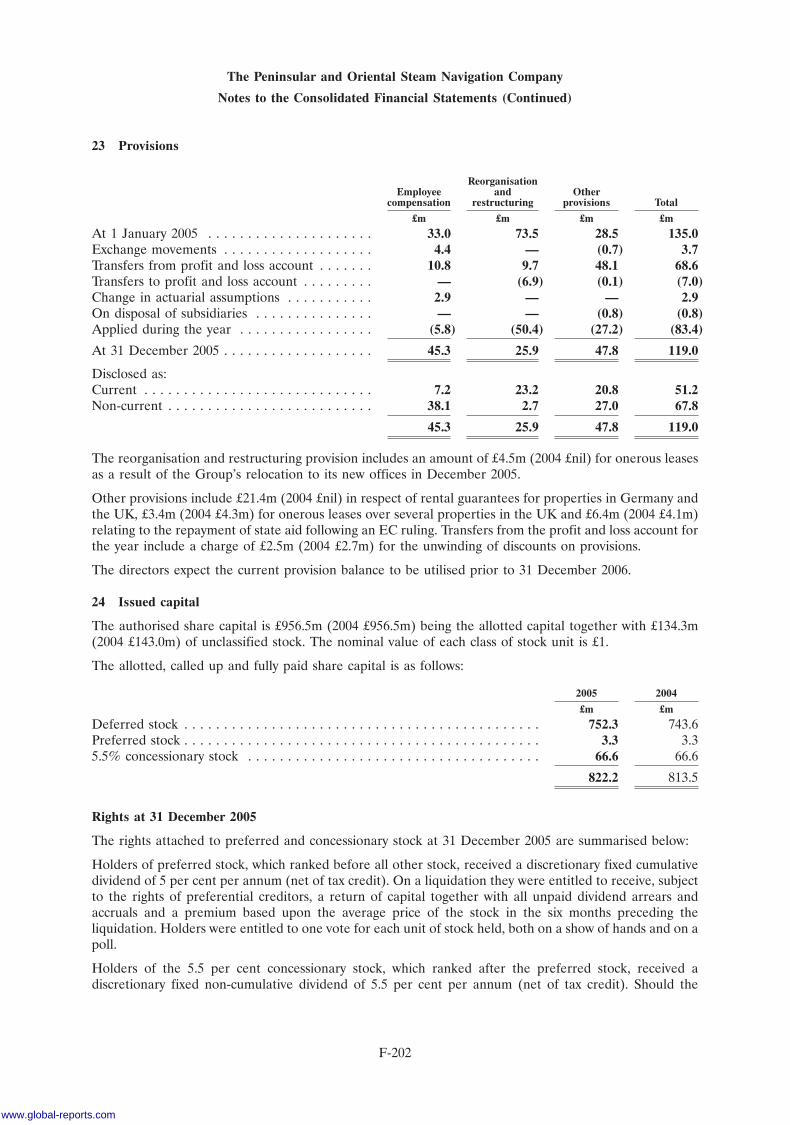
The Peninsular and Oriental Steam Navigation Company
Notes to the Consolidated Financial Statements (Continued)
23 Provisions
ReorganisationEmployee and Other
compensation restructuring provisions Total
£m £m £m £m
At 1 January 2005 . . . . . . . . . . . . . . . . . . . . . 33.0 73.5 28.5 135.0Exchange movements . . . . . . . . . . . . . . . . . . . 4.4 — (0.7) 3.7Transfers from profit and loss account . . . . . . . 10.8 9.7 48.1 68.6Transfers to profit and loss account . . . . . . . . . — (6.9) (0.1) (7.0)Change in actuarial assumptions . . . . . . . . . . . 2.9 — — 2.9On disposal of subsidiaries . . . . . . . . . . . . . . . — — (0.8) (0.8)Applied during the year . . . . . . . . . . . . . . . . . (5.8) (50.4) (27.2) (83.4)
At 31 December 2005 . . . . . . . . . . . . . . . . . . . 45.3 25.9 47.8 119.0
Disclosed as:Current . . . . . . . . . . . . . . . . . . . . . . . . . . . . . 7.2 23.2 20.8 51.2Non-current . . . . . . . . . . . . . . . . . . . . . . . . . . 38.1 2.7 27.0 67.8
45.3 25.9 47.8 119.0
The reorganisation and restructuring provision includes an amount of £4.5m (2004 £nil) for onerous leasesas a result of the Group’s relocation to its new offices in December 2005.
Other provisions include £21.4m (2004 £nil) in respect of rental guarantees for properties in Germany andthe UK, £3.4m (2004 £4.3m) for onerous leases over several properties in the UK and £6.4m (2004 £4.1m)relating to the repayment of state aid following an EC ruling. Transfers from the profit and loss account forthe year include a charge of £2.5m (2004 £2.7m) for the unwinding of discounts on provisions.
The directors expect the current provision balance to be utilised prior to 31 December 2006.
24 Issued capital
The authorised share capital is £956.5m (2004 £956.5m) being the allotted capital together with £134.3m(2004 £143.0m) of unclassified stock. The nominal value of each class of stock unit is £1.
The allotted, called up and fully paid share capital is as follows:
2005 2004
£m £m
Deferred stock . . . . . . . . . . . . . . . . . . . . . . . . . . . . . . . . . . . . . . . . . . . . . 752.3 743.6Preferred stock . . . . . . . . . . . . . . . . . . . . . . . . . . . . . . . . . . . . . . . . . . . . . 3.3 3.35.5% concessionary stock . . . . . . . . . . . . . . . . . . . . . . . . . . . . . . . . . . . . . 66.6 66.6
822.2 813.5
Rights at 31 December 2005
The rights attached to preferred and concessionary stock at 31 December 2005 are summarised below:
Holders of preferred stock, which ranked before all other stock, received a discretionary fixed cumulativedividend of 5 per cent per annum (net of tax credit). On a liquidation they were entitled to receive, subjectto the rights of preferential creditors, a return of capital together with all unpaid dividend arrears andaccruals and a premium based upon the average price of the stock in the six months preceding theliquidation. Holders were entitled to one vote for each unit of stock held, both on a show of hands and on apoll.
Holders of the 5.5 per cent concessionary stock, which ranked after the preferred stock, received adiscretionary fixed non-cumulative dividend of 5.5 per cent per annum (net of tax credit). Should the
F-202
www.global-reports.com
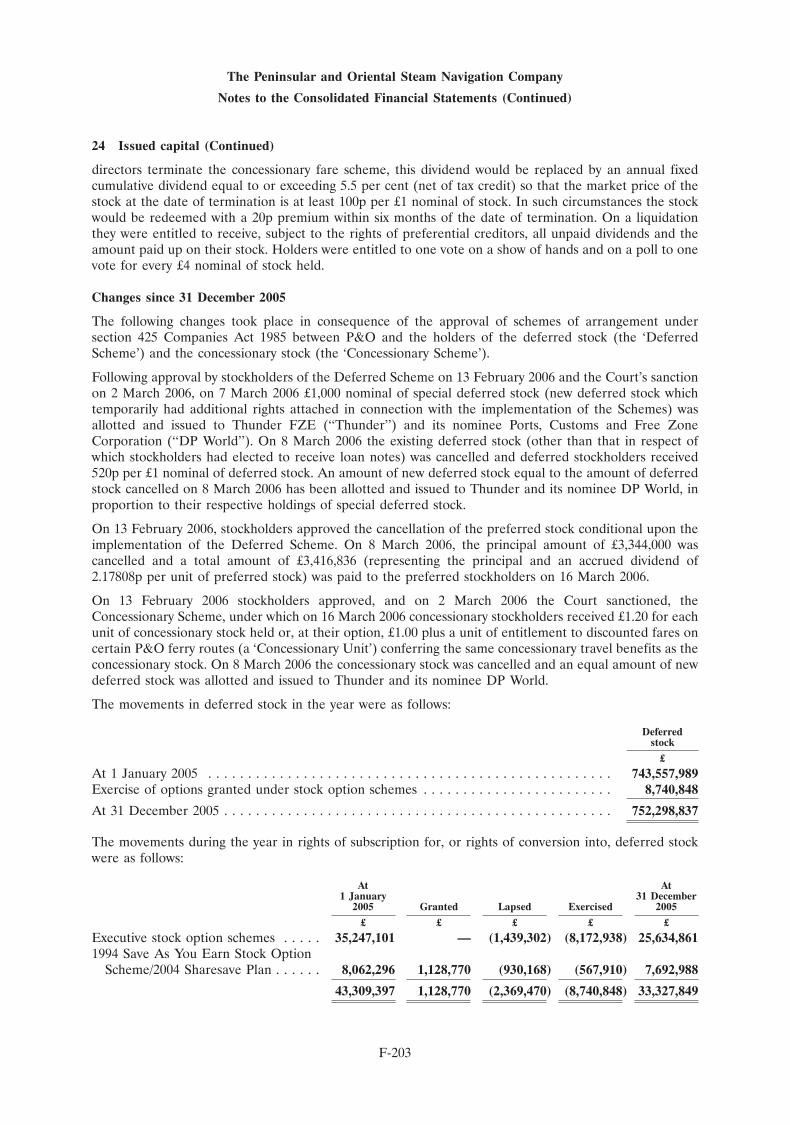
The Peninsular and Oriental Steam Navigation Company
Notes to the Consolidated Financial Statements (Continued)
24 Issued capital (Continued)
directors terminate the concessionary fare scheme, this dividend would be replaced by an annual fixedcumulative dividend equal to or exceeding 5.5 per cent (net of tax credit) so that the market price of thestock at the date of termination is at least 100p per £1 nominal of stock. In such circumstances the stockwould be redeemed with a 20p premium within six months of the date of termination. On a liquidationthey were entitled to receive, subject to the rights of preferential creditors, all unpaid dividends and theamount paid up on their stock. Holders were entitled to one vote on a show of hands and on a poll to onevote for every £4 nominal of stock held.
Changes since 31 December 2005
The following changes took place in consequence of the approval of schemes of arrangement undersection 425 Companies Act 1985 between P&O and the holders of the deferred stock (the ‘DeferredScheme’) and the concessionary stock (the ‘Concessionary Scheme’).
Following approval by stockholders of the Deferred Scheme on 13 February 2006 and the Court’s sanctionon 2 March 2006, on 7 March 2006 £1,000 nominal of special deferred stock (new deferred stock whichtemporarily had additional rights attached in connection with the implementation of the Schemes) wasallotted and issued to Thunder FZE (‘‘Thunder’’) and its nominee Ports, Customs and Free ZoneCorporation (‘‘DP World’’). On 8 March 2006 the existing deferred stock (other than that in respect ofwhich stockholders had elected to receive loan notes) was cancelled and deferred stockholders received520p per £1 nominal of deferred stock. An amount of new deferred stock equal to the amount of deferredstock cancelled on 8 March 2006 has been allotted and issued to Thunder and its nominee DP World, inproportion to their respective holdings of special deferred stock.
On 13 February 2006, stockholders approved the cancellation of the preferred stock conditional upon theimplementation of the Deferred Scheme. On 8 March 2006, the principal amount of £3,344,000 wascancelled and a total amount of £3,416,836 (representing the principal and an accrued dividend of2.17808p per unit of preferred stock) was paid to the preferred stockholders on 16 March 2006.
On 13 February 2006 stockholders approved, and on 2 March 2006 the Court sanctioned, theConcessionary Scheme, under which on 16 March 2006 concessionary stockholders received £1.20 for eachunit of concessionary stock held or, at their option, £1.00 plus a unit of entitlement to discounted fares oncertain P&O ferry routes (a ‘Concessionary Unit’) conferring the same concessionary travel benefits as theconcessionary stock. On 8 March 2006 the concessionary stock was cancelled and an equal amount of newdeferred stock was allotted and issued to Thunder and its nominee DP World.
The movements in deferred stock in the year were as follows:
Deferredstock
£
At 1 January 2005 . . . . . . . . . . . . . . . . . . . . . . . . . . . . . . . . . . . . . . . . . . . . . . . . . . . 743,557,989Exercise of options granted under stock option schemes . . . . . . . . . . . . . . . . . . . . . . . . 8,740,848
At 31 December 2005 . . . . . . . . . . . . . . . . . . . . . . . . . . . . . . . . . . . . . . . . . . . . . . . . . 752,298,837
The movements during the year in rights of subscription for, or rights of conversion into, deferred stockwere as follows:
At At1 January 31 December
2005 Granted Lapsed Exercised 2005
£ £ £ £ £
Executive stock option schemes . . . . . 35,247,101 — (1,439,302) (8,172,938) 25,634,8611994 Save As You Earn Stock Option
Scheme/2004 Sharesave Plan . . . . . . 8,062,296 1,128,770 (930,168) (567,910) 7,692,988
43,309,397 1,128,770 (2,369,470) (8,740,848) 33,327,849
F-203
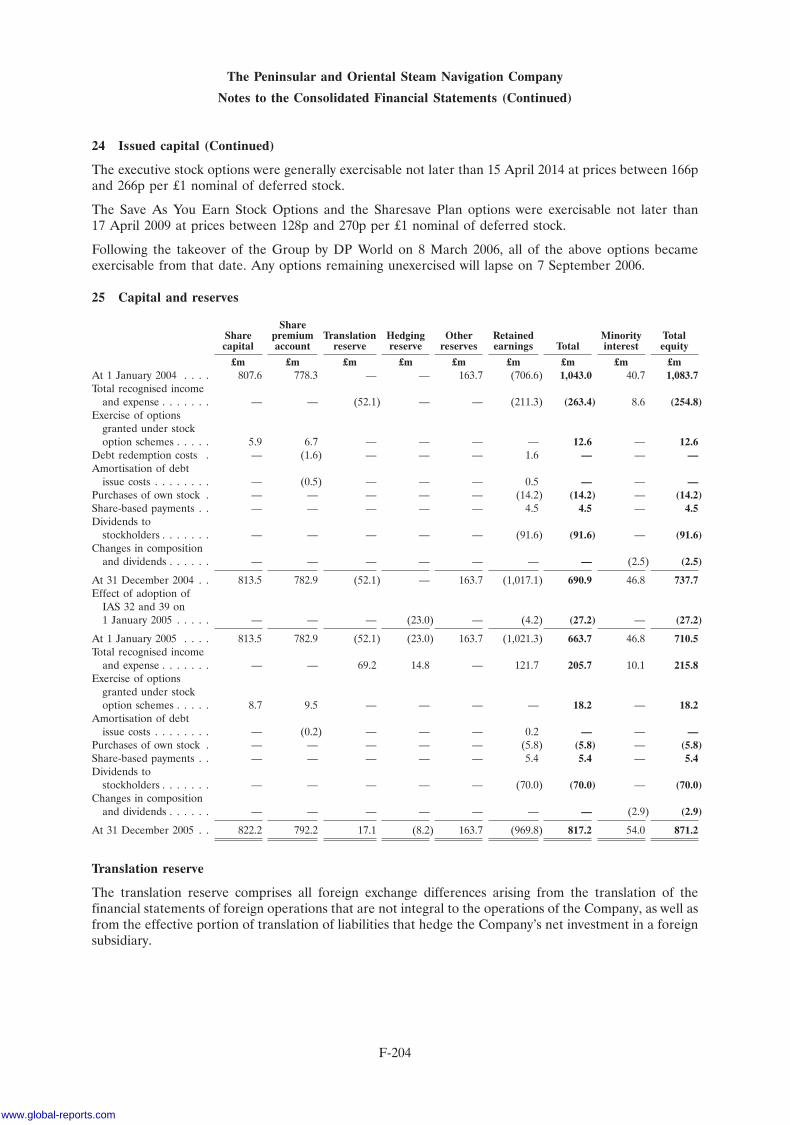
The Peninsular and Oriental Steam Navigation Company
Notes to the Consolidated Financial Statements (Continued)
24 Issued capital (Continued)
The executive stock options were generally exercisable not later than 15 April 2014 at prices between 166pand 266p per £1 nominal of deferred stock.
The Save As You Earn Stock Options and the Sharesave Plan options were exercisable not later than17 April 2009 at prices between 128p and 270p per £1 nominal of deferred stock.
Following the takeover of the Group by DP World on 8 March 2006, all of the above options becameexercisable from that date. Any options remaining unexercised will lapse on 7 September 2006.
25 Capital and reserves
ShareShare premium Translation Hedging Other Retained Minority Totalcapital account reserve reserve reserves earnings Total interest equity
£m £m £m £m £m £m £m £m £mAt 1 January 2004 . . . . 807.6 778.3 — — 163.7 (706.6) 1,043.0 40.7 1,083.7Total recognised income
and expense . . . . . . . — — (52.1) — — (211.3) (263.4) 8.6 (254.8)Exercise of options
granted under stockoption schemes . . . . . 5.9 6.7 — — — — 12.6 — 12.6
Debt redemption costs . — (1.6) — — — 1.6 — — —Amortisation of debt
issue costs . . . . . . . . — (0.5) — — — 0.5 — — —Purchases of own stock . — — — — — (14.2) (14.2) — (14.2)Share-based payments . . — — — — — 4.5 4.5 — 4.5Dividends to
stockholders . . . . . . . — — — — — (91.6) (91.6) — (91.6)Changes in composition
and dividends . . . . . . — — — — — — — (2.5) (2.5)
At 31 December 2004 . . 813.5 782.9 (52.1) — 163.7 (1,017.1) 690.9 46.8 737.7Effect of adoption of
IAS 32 and 39 on1 January 2005 . . . . . — — — (23.0) — (4.2) (27.2) — (27.2)
At 1 January 2005 . . . . 813.5 782.9 (52.1) (23.0) 163.7 (1,021.3) 663.7 46.8 710.5Total recognised income
and expense . . . . . . . — — 69.2 14.8 — 121.7 205.7 10.1 215.8Exercise of options
granted under stockoption schemes . . . . . 8.7 9.5 — — — — 18.2 — 18.2
Amortisation of debtissue costs . . . . . . . . — (0.2) — — — 0.2 — — —
Purchases of own stock . — — — — — (5.8) (5.8) — (5.8)Share-based payments . . — — — — — 5.4 5.4 — 5.4Dividends to
stockholders . . . . . . . — — — — — (70.0) (70.0) — (70.0)Changes in composition
and dividends . . . . . . — — — — — — — (2.9) (2.9)
At 31 December 2005 . . 822.2 792.2 17.1 (8.2) 163.7 (969.8) 817.2 54.0 871.2
Translation reserve
The translation reserve comprises all foreign exchange differences arising from the translation of thefinancial statements of foreign operations that are not integral to the operations of the Company, as well asfrom the effective portion of translation of liabilities that hedge the Company’s net investment in a foreignsubsidiary.
F-204
www.global-reports.com
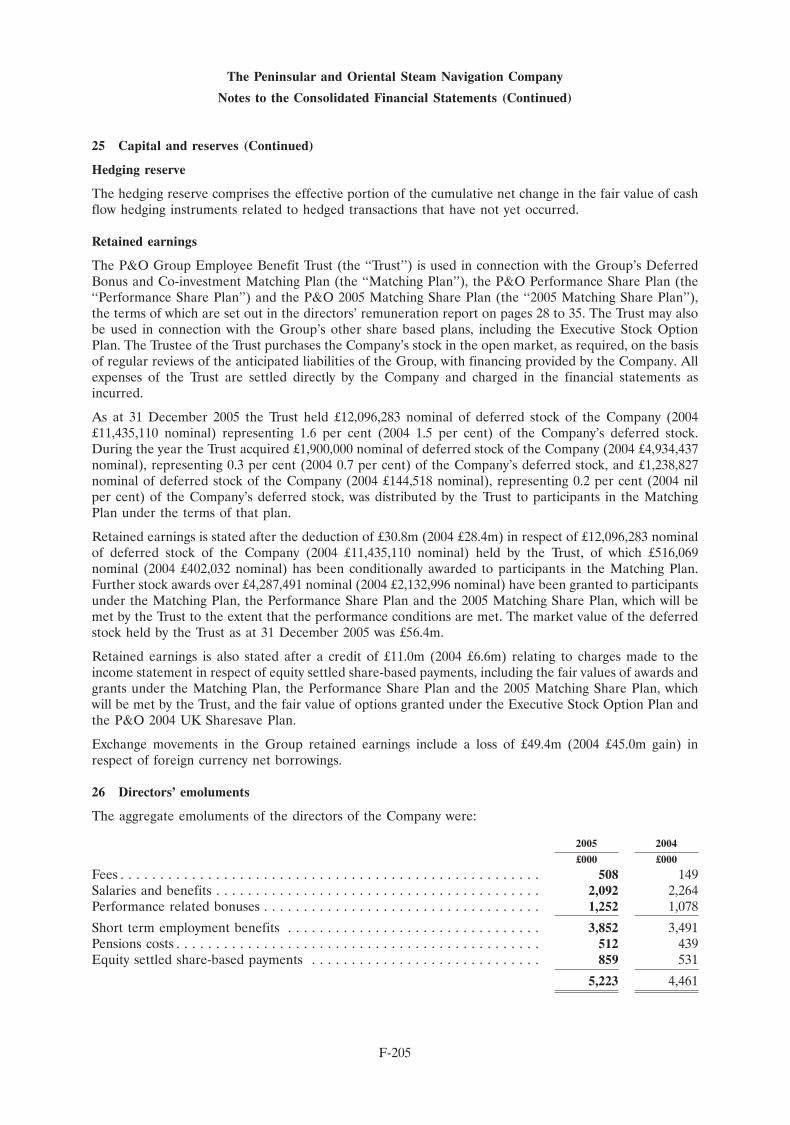
The Peninsular and Oriental Steam Navigation Company
Notes to the Consolidated Financial Statements (Continued)
25 Capital and reserves (Continued)
Hedging reserve
The hedging reserve comprises the effective portion of the cumulative net change in the fair value of cashflow hedging instruments related to hedged transactions that have not yet occurred.
Retained earnings
The P&O Group Employee Benefit Trust (the ‘‘Trust’’) is used in connection with the Group’s DeferredBonus and Co-investment Matching Plan (the ‘‘Matching Plan’’), the P&O Performance Share Plan (the‘‘Performance Share Plan’’) and the P&O 2005 Matching Share Plan (the ‘‘2005 Matching Share Plan’’),the terms of which are set out in the directors’ remuneration report on pages 28 to 35. The Trust may alsobe used in connection with the Group’s other share based plans, including the Executive Stock OptionPlan. The Trustee of the Trust purchases the Company’s stock in the open market, as required, on the basisof regular reviews of the anticipated liabilities of the Group, with financing provided by the Company. Allexpenses of the Trust are settled directly by the Company and charged in the financial statements asincurred.
As at 31 December 2005 the Trust held £12,096,283 nominal of deferred stock of the Company (2004£11,435,110 nominal) representing 1.6 per cent (2004 1.5 per cent) of the Company’s deferred stock.During the year the Trust acquired £1,900,000 nominal of deferred stock of the Company (2004 £4,934,437nominal), representing 0.3 per cent (2004 0.7 per cent) of the Company’s deferred stock, and £1,238,827nominal of deferred stock of the Company (2004 £144,518 nominal), representing 0.2 per cent (2004 nilper cent) of the Company’s deferred stock, was distributed by the Trust to participants in the MatchingPlan under the terms of that plan.
Retained earnings is stated after the deduction of £30.8m (2004 £28.4m) in respect of £12,096,283 nominalof deferred stock of the Company (2004 £11,435,110 nominal) held by the Trust, of which £516,069nominal (2004 £402,032 nominal) has been conditionally awarded to participants in the Matching Plan.Further stock awards over £4,287,491 nominal (2004 £2,132,996 nominal) have been granted to participantsunder the Matching Plan, the Performance Share Plan and the 2005 Matching Share Plan, which will bemet by the Trust to the extent that the performance conditions are met. The market value of the deferredstock held by the Trust as at 31 December 2005 was £56.4m.
Retained earnings is also stated after a credit of £11.0m (2004 £6.6m) relating to charges made to theincome statement in respect of equity settled share-based payments, including the fair values of awards andgrants under the Matching Plan, the Performance Share Plan and the 2005 Matching Share Plan, whichwill be met by the Trust, and the fair value of options granted under the Executive Stock Option Plan andthe P&O 2004 UK Sharesave Plan.
Exchange movements in the Group retained earnings include a loss of £49.4m (2004 £45.0m gain) inrespect of foreign currency net borrowings.
26 Directors’ emoluments
The aggregate emoluments of the directors of the Company were:
2005 2004
£000 £000
Fees . . . . . . . . . . . . . . . . . . . . . . . . . . . . . . . . . . . . . . . . . . . . . . . . . . . . . 508 149Salaries and benefits . . . . . . . . . . . . . . . . . . . . . . . . . . . . . . . . . . . . . . . . . 2,092 2,264Performance related bonuses . . . . . . . . . . . . . . . . . . . . . . . . . . . . . . . . . . . 1,252 1,078
Short term employment benefits . . . . . . . . . . . . . . . . . . . . . . . . . . . . . . . . 3,852 3,491Pensions costs . . . . . . . . . . . . . . . . . . . . . . . . . . . . . . . . . . . . . . . . . . . . . . 512 439Equity settled share-based payments . . . . . . . . . . . . . . . . . . . . . . . . . . . . . 859 531
5,223 4,461
F-205
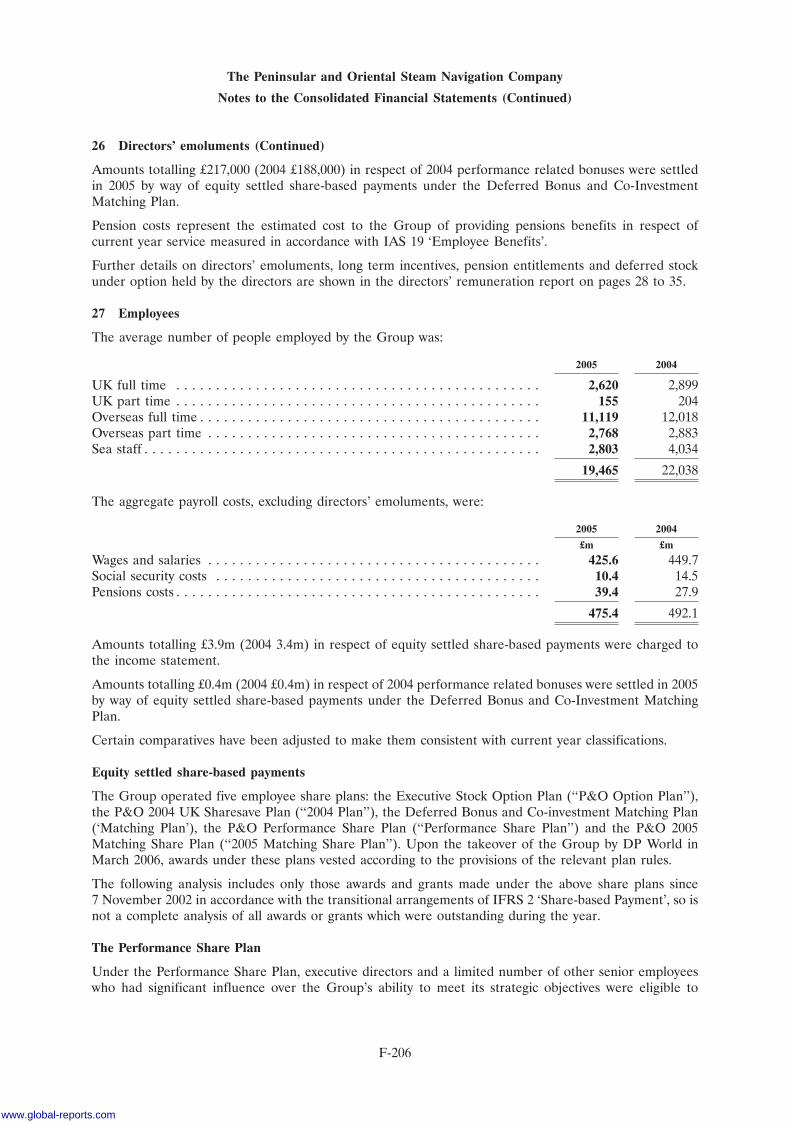
The Peninsular and Oriental Steam Navigation Company
Notes to the Consolidated Financial Statements (Continued)
26 Directors’ emoluments (Continued)
Amounts totalling £217,000 (2004 £188,000) in respect of 2004 performance related bonuses were settledin 2005 by way of equity settled share-based payments under the Deferred Bonus and Co-InvestmentMatching Plan.
Pension costs represent the estimated cost to the Group of providing pensions benefits in respect ofcurrent year service measured in accordance with IAS 19 ‘Employee Benefits’.
Further details on directors’ emoluments, long term incentives, pension entitlements and deferred stockunder option held by the directors are shown in the directors’ remuneration report on pages 28 to 35.
27 Employees
The average number of people employed by the Group was:
2005 2004
UK full time . . . . . . . . . . . . . . . . . . . . . . . . . . . . . . . . . . . . . . . . . . . . . . 2,620 2,899UK part time . . . . . . . . . . . . . . . . . . . . . . . . . . . . . . . . . . . . . . . . . . . . . . 155 204Overseas full time . . . . . . . . . . . . . . . . . . . . . . . . . . . . . . . . . . . . . . . . . . . 11,119 12,018Overseas part time . . . . . . . . . . . . . . . . . . . . . . . . . . . . . . . . . . . . . . . . . . 2,768 2,883Sea staff . . . . . . . . . . . . . . . . . . . . . . . . . . . . . . . . . . . . . . . . . . . . . . . . . . 2,803 4,034
19,465 22,038
The aggregate payroll costs, excluding directors’ emoluments, were:
2005 2004
£m £m
Wages and salaries . . . . . . . . . . . . . . . . . . . . . . . . . . . . . . . . . . . . . . . . . . 425.6 449.7Social security costs . . . . . . . . . . . . . . . . . . . . . . . . . . . . . . . . . . . . . . . . . 10.4 14.5Pensions costs . . . . . . . . . . . . . . . . . . . . . . . . . . . . . . . . . . . . . . . . . . . . . . 39.4 27.9
475.4 492.1
Amounts totalling £3.9m (2004 3.4m) in respect of equity settled share-based payments were charged tothe income statement.
Amounts totalling £0.4m (2004 £0.4m) in respect of 2004 performance related bonuses were settled in 2005by way of equity settled share-based payments under the Deferred Bonus and Co-Investment MatchingPlan.
Certain comparatives have been adjusted to make them consistent with current year classifications.
Equity settled share-based payments
The Group operated five employee share plans: the Executive Stock Option Plan (‘‘P&O Option Plan’’),the P&O 2004 UK Sharesave Plan (‘‘2004 Plan’’), the Deferred Bonus and Co-investment Matching Plan(‘Matching Plan’), the P&O Performance Share Plan (‘‘Performance Share Plan’’) and the P&O 2005Matching Share Plan (‘‘2005 Matching Share Plan’’). Upon the takeover of the Group by DP World inMarch 2006, awards under these plans vested according to the provisions of the relevant plan rules.
The following analysis includes only those awards and grants made under the above share plans since7 November 2002 in accordance with the transitional arrangements of IFRS 2 ‘Share-based Payment’, so isnot a complete analysis of all awards or grants which were outstanding during the year.
The Performance Share Plan
Under the Performance Share Plan, executive directors and a limited number of other senior employeeswho had significant influence over the Group’s ability to meet its strategic objectives were eligible to
F-206
www.global-reports.com
The Peninsular and Oriental Steam Navigation Company
Notes to the Consolidated Financial Statements (Continued)
27 Employees (Continued)
receive annual awards, in the form of deferred stock, worth up to 120 per cent of salary. In order to provideflexibility, the scheme rules allowed annual awards of up to a maximum of 200 per cent of salary.
Awards would vest after three years subject to the Company’s TSR (‘‘Total Shareholder Return’’)performance against the constituents of the FTSE 350 (excluding investment trusts) at the date of award,25 per cent of the award would vest if the Company was ranked at the median. The full award would vest ifthe Company was ranked at, or above, the upper quartile. Between these two points, the award would veston a straight line basis. No portion of the award would vest if the Company was ranked below the median,and any unvested award at the end of the three year period would automatically lapse.
Awards would only vest subject to the remuneration committee determining that the TSR performancewas a genuine reflection of the Company’s underlying financial performance over the three year period.
Awards could be satisfied by the use of stock purchased in the market or newly issued stock and to theextent that new issue stock was used this was subject to the normal dilution limits (i.e. options/awards overstock in the Company did not exceed 5 per cent of the Company’s issued deferred stock in any rolling10 year period in respect of executive schemes, or 10 per cent in any 10 year period in respect of allschemes).
The 2005 Matching Share Plan
Executive directors were able to invest their own cash resources up to a limit of 50 per cent of theirmaximum bonus opportunity into stock in the Company (‘‘Invested Stock’’). Participants who made suchinvestment received a performance based matching award equal in value to the Invested Stock (valuing theInvested Stock on a pre-tax basis). Awards were designed to vest after three years, subject in normalcircumstances to the participant continuing to hold the Invested Stock for the three year period and wouldvest based on the same TSR performance conditions as under the Performance Share Plan.
The Matching Plan
The Matching Plan provided participants with the opportunity to receive matching awards of deferredstock depending upon the performance of the Company over a two year retention period following theyear in which an original bonus-related award was earned.
One third of any annual bonus awarded to directors and other executives who were participants in theMatching Plan was in the form of a Stock Award which was automatically invested in the Matching Plan.Participants were also invited to commit their own resources to the Matching Plan, by investing in furtherdeferred stock in the Company (described as Invested Stock) subject to an overall limit on the amountinvested in the Matching Plan in any one year of up to 75 per cent of base salary. Subject to the discretionof the Matching Plan Trustee, Matching Plan participants receive Matching Awards. Matching Awardsentitled the participants to acquire a maximum amount of deterred stock which, at the date of grant, had avalue equal to the aggregate value of the executive’s Stock Award and Invested Stock (valuing InvestedStock on a gross of tax basis).
The amount of deferred stock over which a Matching Award might be exercised was dependent on theCompany’s TSR over the retention period compared to that of the other companies in the FTSE 350index. If the Company achieved median performance a participant was entitled to exercise 25 per cent ofhis Matching Award and if the Company achieves upper quartile performance, a participant was entitled toexercise 100 per cent of his Matching Award. For performance between median and upper quartile,entitlement was calculated on a straight line basis.
Matching Awards were only exercisable if a secondary validating performance condition was also met. Thisrequired earnings per share (‘‘EPS’’) growth (after appropriate adjustments to ensure consistencythroughout the period) over the retention period to exceed the growth in the UK Index of Retail Prices byan average of at least 3 per cent per annum.
F-207
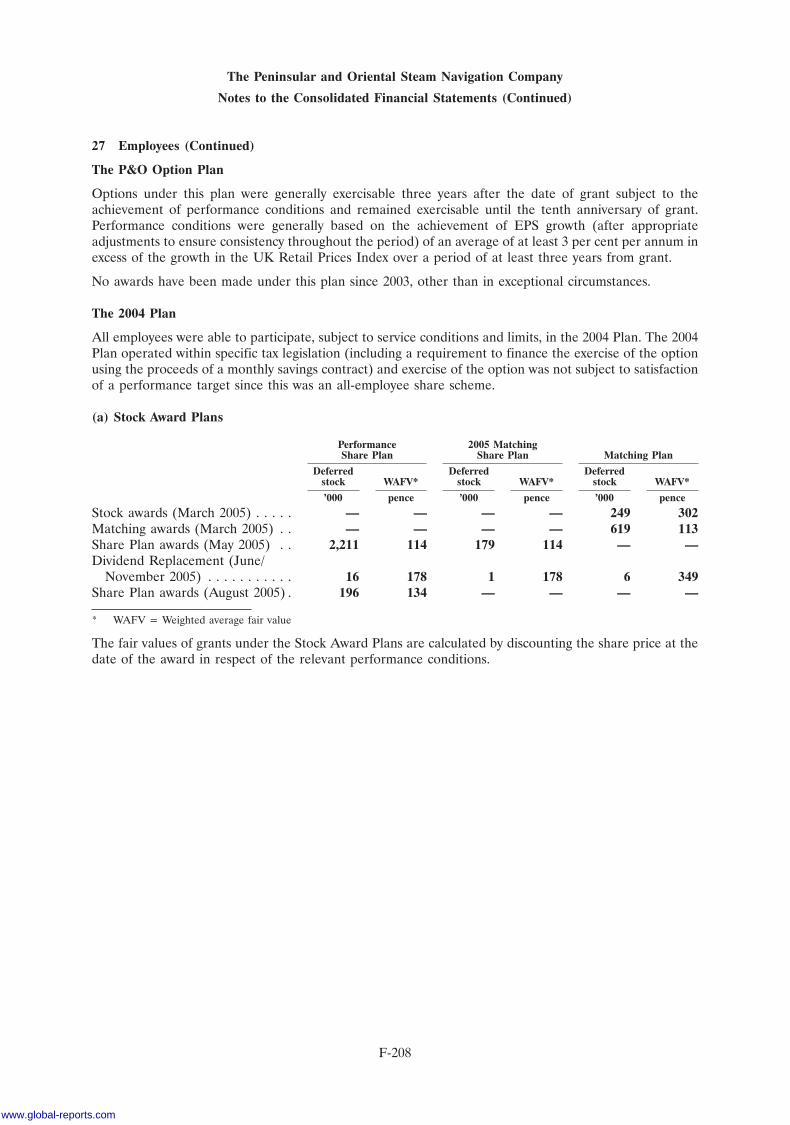
The Peninsular and Oriental Steam Navigation Company
Notes to the Consolidated Financial Statements (Continued)
27 Employees (Continued)
The P&O Option Plan
Options under this plan were generally exercisable three years after the date of grant subject to theachievement of performance conditions and remained exercisable until the tenth anniversary of grant.Performance conditions were generally based on the achievement of EPS growth (after appropriateadjustments to ensure consistency throughout the period) of an average of at least 3 per cent per annum inexcess of the growth in the UK Retail Prices Index over a period of at least three years from grant.
No awards have been made under this plan since 2003, other than in exceptional circumstances.
The 2004 Plan
All employees were able to participate, subject to service conditions and limits, in the 2004 Plan. The 2004Plan operated within specific tax legislation (including a requirement to finance the exercise of the optionusing the proceeds of a monthly savings contract) and exercise of the option was not subject to satisfactionof a performance target since this was an all-employee share scheme.
(a) Stock Award Plans
Performance 2005 MatchingShare Plan Share Plan Matching Plan
Deferred Deferred Deferredstock WAFV* stock WAFV* stock WAFV*
’000 pence ’000 pence ’000 pence
Stock awards (March 2005) . . . . . — — — — 249 302Matching awards (March 2005) . . — — — — 619 113Share Plan awards (May 2005) . . 2,211 114 179 114 — —Dividend Replacement (June/
November 2005) . . . . . . . . . . . 16 178 1 178 6 349Share Plan awards (August 2005) . 196 134 — — — —
* WAFV = Weighted average fair value
The fair values of grants under the Stock Award Plans are calculated by discounting the share price at thedate of the award in respect of the relevant performance conditions.
F-208
www.global-reports.com
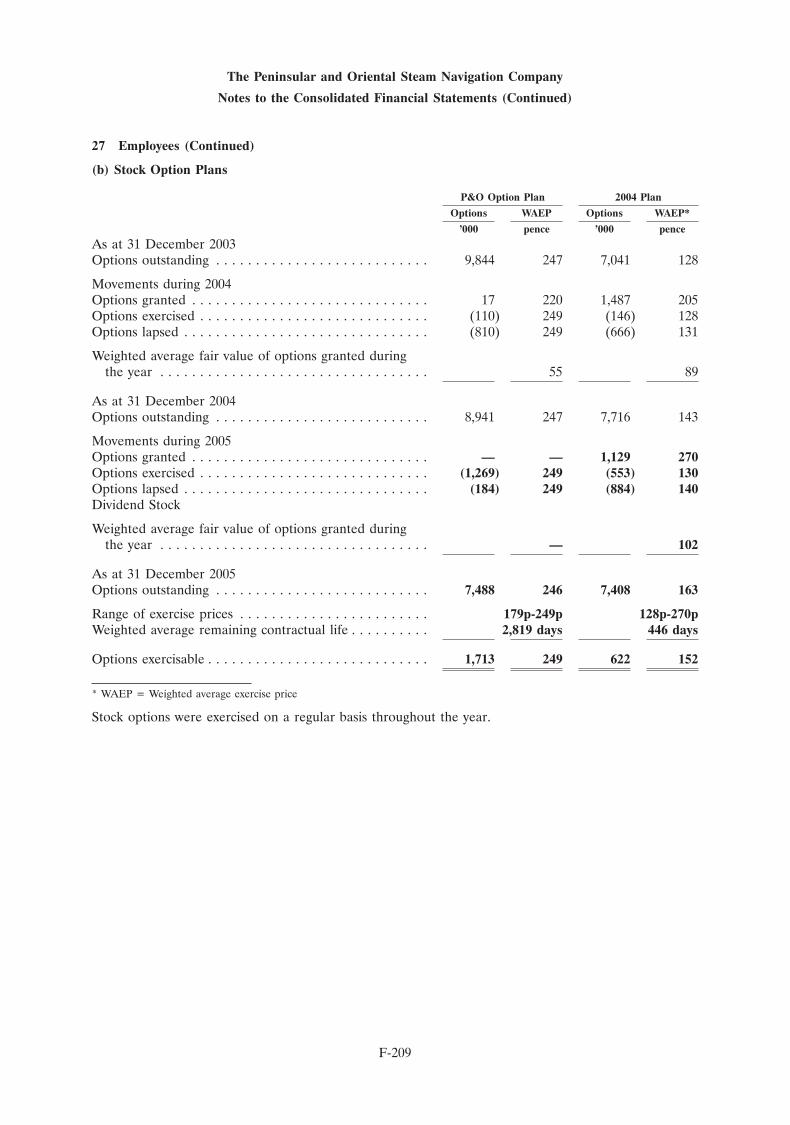
The Peninsular and Oriental Steam Navigation Company
Notes to the Consolidated Financial Statements (Continued)
27 Employees (Continued)
(b) Stock Option Plans
P&O Option Plan 2004 Plan
Options WAEP Options WAEP*
’000 pence ’000 pence
As at 31 December 2003Options outstanding . . . . . . . . . . . . . . . . . . . . . . . . . . . 9,844 247 7,041 128
Movements during 2004Options granted . . . . . . . . . . . . . . . . . . . . . . . . . . . . . . 17 220 1,487 205Options exercised . . . . . . . . . . . . . . . . . . . . . . . . . . . . . (110) 249 (146) 128Options lapsed . . . . . . . . . . . . . . . . . . . . . . . . . . . . . . . (810) 249 (666) 131
Weighted average fair value of options granted duringthe year . . . . . . . . . . . . . . . . . . . . . . . . . . . . . . . . . . 55 89
As at 31 December 2004Options outstanding . . . . . . . . . . . . . . . . . . . . . . . . . . . 8,941 247 7,716 143
Movements during 2005Options granted . . . . . . . . . . . . . . . . . . . . . . . . . . . . . . — — 1,129 270Options exercised . . . . . . . . . . . . . . . . . . . . . . . . . . . . . (1,269) 249 (553) 130Options lapsed . . . . . . . . . . . . . . . . . . . . . . . . . . . . . . . (184) 249 (884) 140Dividend Stock
Weighted average fair value of options granted duringthe year . . . . . . . . . . . . . . . . . . . . . . . . . . . . . . . . . . — 102
As at 31 December 2005Options outstanding . . . . . . . . . . . . . . . . . . . . . . . . . . . 7,488 246 7,408 163
Range of exercise prices . . . . . . . . . . . . . . . . . . . . . . . . 179p-249p 128p-270pWeighted average remaining contractual life . . . . . . . . . . 2,819 days 446 days
Options exercisable . . . . . . . . . . . . . . . . . . . . . . . . . . . . 1,713 249 622 152
* WAEP = Weighted average exercise price
Stock options were exercised on a regular basis throughout the year.
F-209
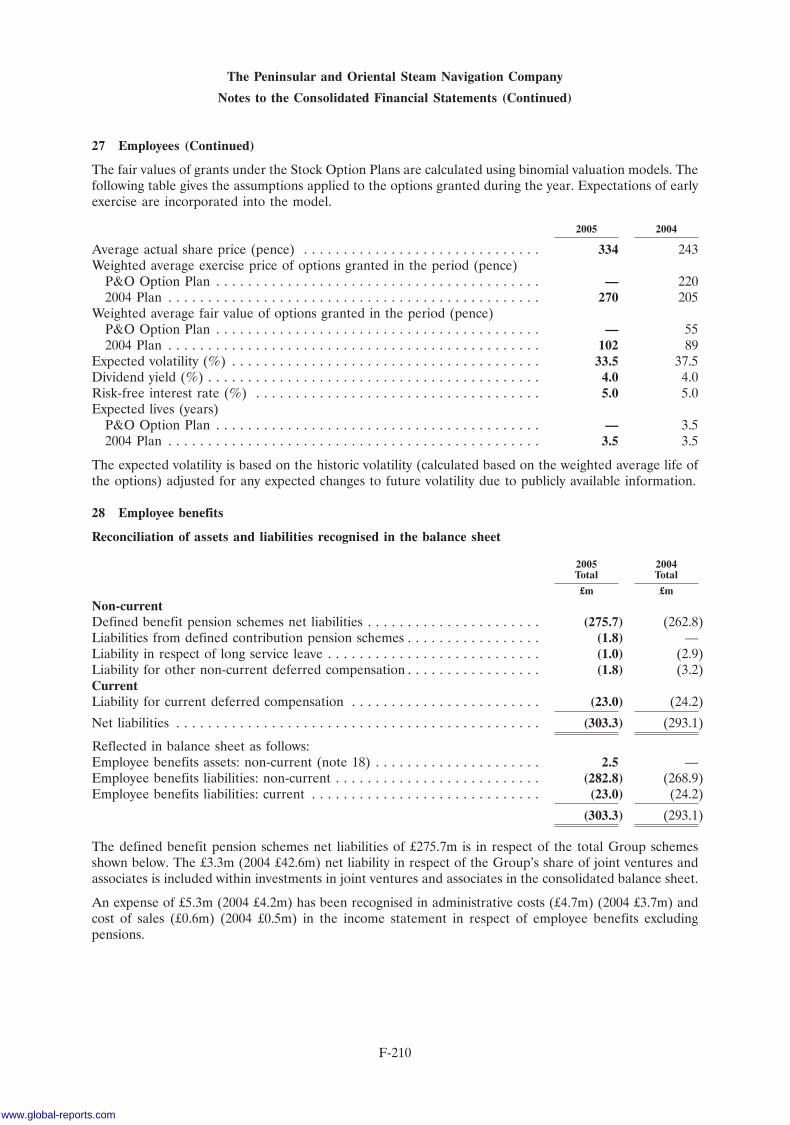
The Peninsular and Oriental Steam Navigation Company
Notes to the Consolidated Financial Statements (Continued)
27 Employees (Continued)
The fair values of grants under the Stock Option Plans are calculated using binomial valuation models. Thefollowing table gives the assumptions applied to the options granted during the year. Expectations of earlyexercise are incorporated into the model.
2005 2004
Average actual share price (pence) . . . . . . . . . . . . . . . . . . . . . . . . . . . . . . 334 243Weighted average exercise price of options granted in the period (pence)
P&O Option Plan . . . . . . . . . . . . . . . . . . . . . . . . . . . . . . . . . . . . . . . . . — 2202004 Plan . . . . . . . . . . . . . . . . . . . . . . . . . . . . . . . . . . . . . . . . . . . . . . . 270 205
Weighted average fair value of options granted in the period (pence)P&O Option Plan . . . . . . . . . . . . . . . . . . . . . . . . . . . . . . . . . . . . . . . . . — 552004 Plan . . . . . . . . . . . . . . . . . . . . . . . . . . . . . . . . . . . . . . . . . . . . . . . 102 89
Expected volatility (%) . . . . . . . . . . . . . . . . . . . . . . . . . . . . . . . . . . . . . . . 33.5 37.5Dividend yield (%) . . . . . . . . . . . . . . . . . . . . . . . . . . . . . . . . . . . . . . . . . . 4.0 4.0Risk-free interest rate (%) . . . . . . . . . . . . . . . . . . . . . . . . . . . . . . . . . . . . 5.0 5.0Expected lives (years)
P&O Option Plan . . . . . . . . . . . . . . . . . . . . . . . . . . . . . . . . . . . . . . . . . — 3.52004 Plan . . . . . . . . . . . . . . . . . . . . . . . . . . . . . . . . . . . . . . . . . . . . . . . 3.5 3.5
The expected volatility is based on the historic volatility (calculated based on the weighted average life ofthe options) adjusted for any expected changes to future volatility due to publicly available information.
28 Employee benefits
Reconciliation of assets and liabilities recognised in the balance sheet
2005 2004Total Total
£m £m
Non-currentDefined benefit pension schemes net liabilities . . . . . . . . . . . . . . . . . . . . . . (275.7) (262.8)Liabilities from defined contribution pension schemes . . . . . . . . . . . . . . . . . (1.8) —Liability in respect of long service leave . . . . . . . . . . . . . . . . . . . . . . . . . . . (1.0) (2.9)Liability for other non-current deferred compensation . . . . . . . . . . . . . . . . . (1.8) (3.2)CurrentLiability for current deferred compensation . . . . . . . . . . . . . . . . . . . . . . . . (23.0) (24.2)
Net liabilities . . . . . . . . . . . . . . . . . . . . . . . . . . . . . . . . . . . . . . . . . . . . . . (303.3) (293.1)
Reflected in balance sheet as follows:Employee benefits assets: non-current (note 18) . . . . . . . . . . . . . . . . . . . . . 2.5 —Employee benefits liabilities: non-current . . . . . . . . . . . . . . . . . . . . . . . . . . (282.8) (268.9)Employee benefits liabilities: current . . . . . . . . . . . . . . . . . . . . . . . . . . . . . (23.0) (24.2)
(303.3) (293.1)
The defined benefit pension schemes net liabilities of £275.7m is in respect of the total Group schemesshown below. The £3.3m (2004 £42.6m) net liability in respect of the Group’s share of joint ventures andassociates is included within investments in joint ventures and associates in the consolidated balance sheet.
An expense of £5.3m (2004 £4.2m) has been recognised in administrative costs (£4.7m) (2004 £3.7m) andcost of sales (£0.6m) (2004 £0.5m) in the income statement in respect of employee benefits excludingpensions.
F-210
www.global-reports.com
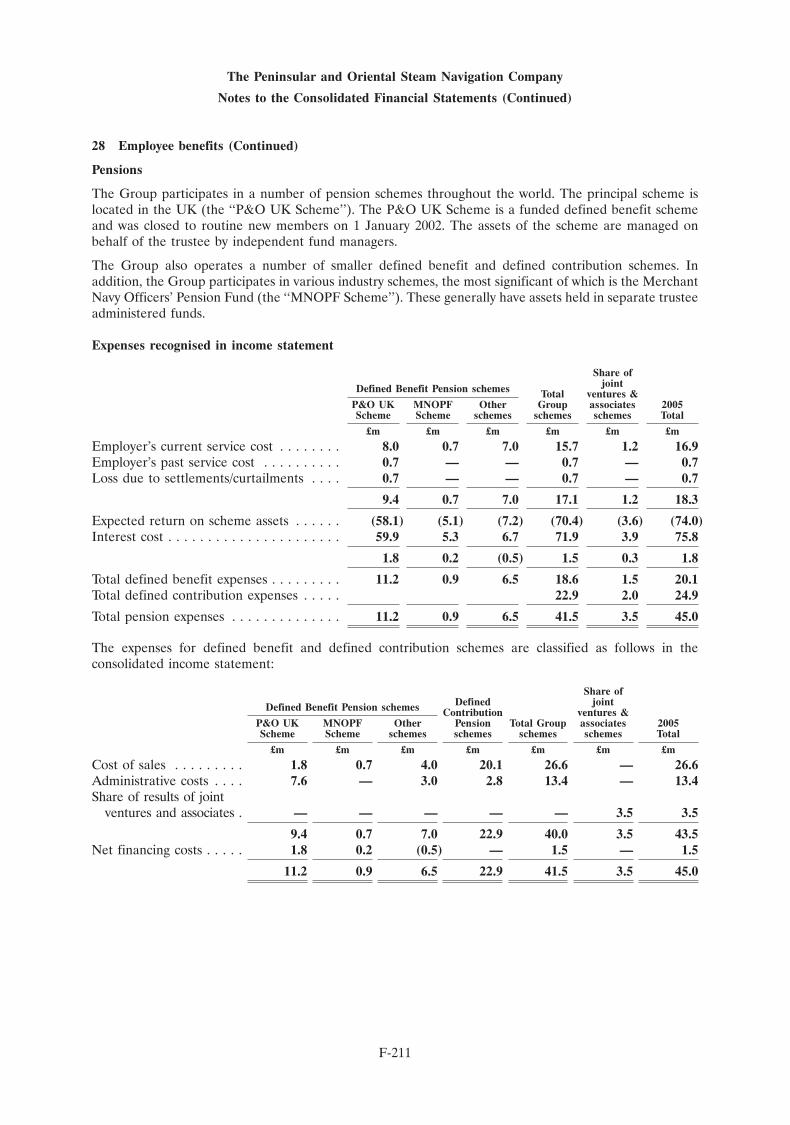
The Peninsular and Oriental Steam Navigation Company
Notes to the Consolidated Financial Statements (Continued)
28 Employee benefits (Continued)
Pensions
The Group participates in a number of pension schemes throughout the world. The principal scheme islocated in the UK (the ‘‘P&O UK Scheme’’). The P&O UK Scheme is a funded defined benefit schemeand was closed to routine new members on 1 January 2002. The assets of the scheme are managed onbehalf of the trustee by independent fund managers.
The Group also operates a number of smaller defined benefit and defined contribution schemes. Inaddition, the Group participates in various industry schemes, the most significant of which is the MerchantNavy Officers’ Pension Fund (the ‘‘MNOPF Scheme’’). These generally have assets held in separate trusteeadministered funds.
Expenses recognised in income statement
Share ofjointDefined Benefit Pension schemes Total ventures &
P&O UK MNOPF Other Group associates 2005Scheme Scheme schemes schemes schemes Total
£m £m £m £m £m £m
Employer’s current service cost . . . . . . . . 8.0 0.7 7.0 15.7 1.2 16.9Employer’s past service cost . . . . . . . . . . 0.7 — — 0.7 — 0.7Loss due to settlements/curtailments . . . . 0.7 — — 0.7 — 0.7
9.4 0.7 7.0 17.1 1.2 18.3
Expected return on scheme assets . . . . . . (58.1) (5.1) (7.2) (70.4) (3.6) (74.0)Interest cost . . . . . . . . . . . . . . . . . . . . . . 59.9 5.3 6.7 71.9 3.9 75.8
1.8 0.2 (0.5) 1.5 0.3 1.8
Total defined benefit expenses . . . . . . . . . 11.2 0.9 6.5 18.6 1.5 20.1Total defined contribution expenses . . . . . 22.9 2.0 24.9
Total pension expenses . . . . . . . . . . . . . . 11.2 0.9 6.5 41.5 3.5 45.0
The expenses for defined benefit and defined contribution schemes are classified as follows in theconsolidated income statement:
Share ofDefined jointDefined Benefit Pension schemes Contribution ventures &
P&O UK MNOPF Other Pension Total Group associates 2005Scheme Scheme schemes schemes schemes schemes Total
£m £m £m £m £m £m £m
Cost of sales . . . . . . . . . 1.8 0.7 4.0 20.1 26.6 — 26.6Administrative costs . . . . 7.6 — 3.0 2.8 13.4 — 13.4Share of results of joint
ventures and associates . — — — — — 3.5 3.5
9.4 0.7 7.0 22.9 40.0 3.5 43.5Net financing costs . . . . . 1.8 0.2 (0.5) — 1.5 — 1.5
11.2 0.9 6.5 22.9 41.5 3.5 45.0
F-211
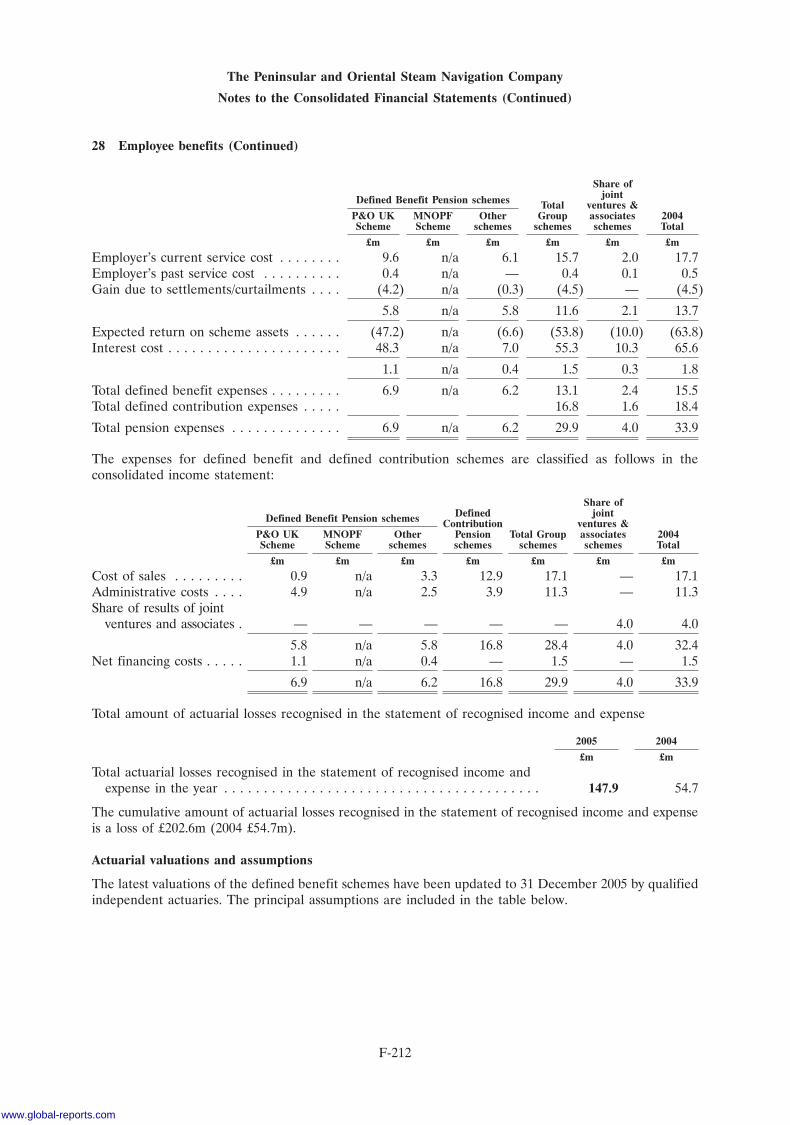
The Peninsular and Oriental Steam Navigation Company
Notes to the Consolidated Financial Statements (Continued)
28 Employee benefits (Continued)
Share ofjointDefined Benefit Pension schemes Total ventures &
P&O UK MNOPF Other Group associates 2004Scheme Scheme schemes schemes schemes Total
£m £m £m £m £m £m
Employer’s current service cost . . . . . . . . 9.6 n/a 6.1 15.7 2.0 17.7Employer’s past service cost . . . . . . . . . . 0.4 n/a — 0.4 0.1 0.5Gain due to settlements/curtailments . . . . (4.2) n/a (0.3) (4.5) — (4.5)
5.8 n/a 5.8 11.6 2.1 13.7
Expected return on scheme assets . . . . . . (47.2) n/a (6.6) (53.8) (10.0) (63.8)Interest cost . . . . . . . . . . . . . . . . . . . . . . 48.3 n/a 7.0 55.3 10.3 65.6
1.1 n/a 0.4 1.5 0.3 1.8
Total defined benefit expenses . . . . . . . . . 6.9 n/a 6.2 13.1 2.4 15.5Total defined contribution expenses . . . . . 16.8 1.6 18.4
Total pension expenses . . . . . . . . . . . . . . 6.9 n/a 6.2 29.9 4.0 33.9
The expenses for defined benefit and defined contribution schemes are classified as follows in theconsolidated income statement:
Share ofDefined jointDefined Benefit Pension schemes Contribution ventures &
P&O UK MNOPF Other Pension Total Group associates 2004Scheme Scheme schemes schemes schemes schemes Total
£m £m £m £m £m £m £m
Cost of sales . . . . . . . . . 0.9 n/a 3.3 12.9 17.1 — 17.1Administrative costs . . . . 4.9 n/a 2.5 3.9 11.3 — 11.3Share of results of joint
ventures and associates . — — — — — 4.0 4.0
5.8 n/a 5.8 16.8 28.4 4.0 32.4Net financing costs . . . . . 1.1 n/a 0.4 — 1.5 — 1.5
6.9 n/a 6.2 16.8 29.9 4.0 33.9
Total amount of actuarial losses recognised in the statement of recognised income and expense
2005 2004
£m £m
Total actuarial losses recognised in the statement of recognised income andexpense in the year . . . . . . . . . . . . . . . . . . . . . . . . . . . . . . . . . . . . . . . . 147.9 54.7
The cumulative amount of actuarial losses recognised in the statement of recognised income and expenseis a loss of £202.6m (2004 £54.7m).
Actuarial valuations and assumptions
The latest valuations of the defined benefit schemes have been updated to 31 December 2005 by qualifiedindependent actuaries. The principal assumptions are included in the table below.
F-212
www.global-reports.com
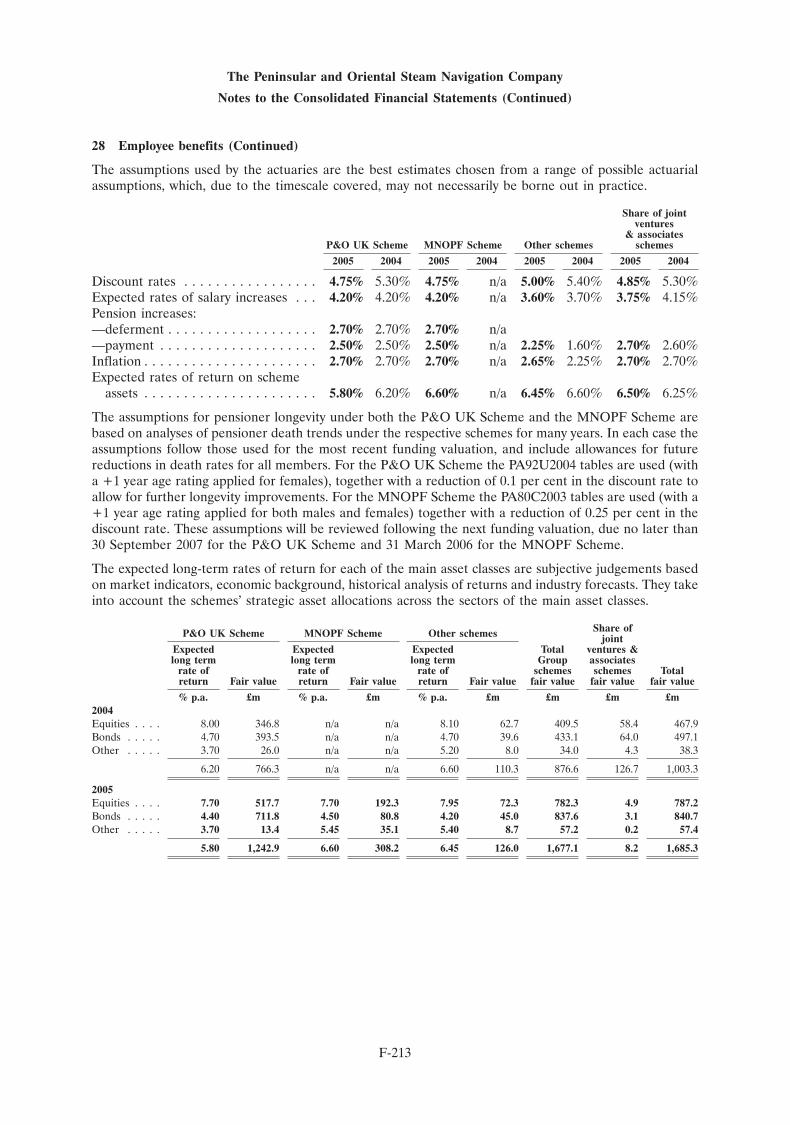
The Peninsular and Oriental Steam Navigation Company
Notes to the Consolidated Financial Statements (Continued)
28 Employee benefits (Continued)
The assumptions used by the actuaries are the best estimates chosen from a range of possible actuarialassumptions, which, due to the timescale covered, may not necessarily be borne out in practice.
Share of jointventures
& associatesP&O UK Scheme MNOPF Scheme Other schemes schemes
2005 2004 2005 2004 2005 2004 2005 2004
Discount rates . . . . . . . . . . . . . . . . . 4.75% 5.30% 4.75% n/a 5.00% 5.40% 4.85% 5.30%Expected rates of salary increases . . . 4.20% 4.20% 4.20% n/a 3.60% 3.70% 3.75% 4.15%Pension increases:—deferment . . . . . . . . . . . . . . . . . . . 2.70% 2.70% 2.70% n/a—payment . . . . . . . . . . . . . . . . . . . . 2.50% 2.50% 2.50% n/a 2.25% 1.60% 2.70% 2.60%Inflation . . . . . . . . . . . . . . . . . . . . . . 2.70% 2.70% 2.70% n/a 2.65% 2.25% 2.70% 2.70%Expected rates of return on scheme
assets . . . . . . . . . . . . . . . . . . . . . . 5.80% 6.20% 6.60% n/a 6.45% 6.60% 6.50% 6.25%
The assumptions for pensioner longevity under both the P&O UK Scheme and the MNOPF Scheme arebased on analyses of pensioner death trends under the respective schemes for many years. In each case theassumptions follow those used for the most recent funding valuation, and include allowances for futurereductions in death rates for all members. For the P&O UK Scheme the PA92U2004 tables are used (witha +1 year age rating applied for females), together with a reduction of 0.1 per cent in the discount rate toallow for further longevity improvements. For the MNOPF Scheme the PA80C2003 tables are used (with a+1 year age rating applied for both males and females) together with a reduction of 0.25 per cent in thediscount rate. These assumptions will be reviewed following the next funding valuation, due no later than30 September 2007 for the P&O UK Scheme and 31 March 2006 for the MNOPF Scheme.
The expected long-term rates of return for each of the main asset classes are subjective judgements basedon market indicators, economic background, historical analysis of returns and industry forecasts. They takeinto account the schemes’ strategic asset allocations across the sectors of the main asset classes.
Share ofP&O UK Scheme MNOPF Scheme Other schemes jointExpected Expected Expected Total ventures &long term long term long term Group associates
rate of rate of rate of schemes schemes Totalreturn Fair value return Fair value return Fair value fair value fair value fair value
% p.a. £m % p.a. £m % p.a. £m £m £m £m2004Equities . . . . 8.00 346.8 n/a n/a 8.10 62.7 409.5 58.4 467.9Bonds . . . . . 4.70 393.5 n/a n/a 4.70 39.6 433.1 64.0 497.1Other . . . . . 3.70 26.0 n/a n/a 5.20 8.0 34.0 4.3 38.3
6.20 766.3 n/a n/a 6.60 110.3 876.6 126.7 1,003.3
2005Equities . . . . 7.70 517.7 7.70 192.3 7.95 72.3 782.3 4.9 787.2Bonds . . . . . 4.40 711.8 4.50 80.8 4.20 45.0 837.6 3.1 840.7Other . . . . . 3.70 13.4 5.45 35.1 5.40 8.7 57.2 0.2 57.4
5.80 1,242.9 6.60 308.2 6.45 126.0 1,677.1 8.2 1,685.3
F-213
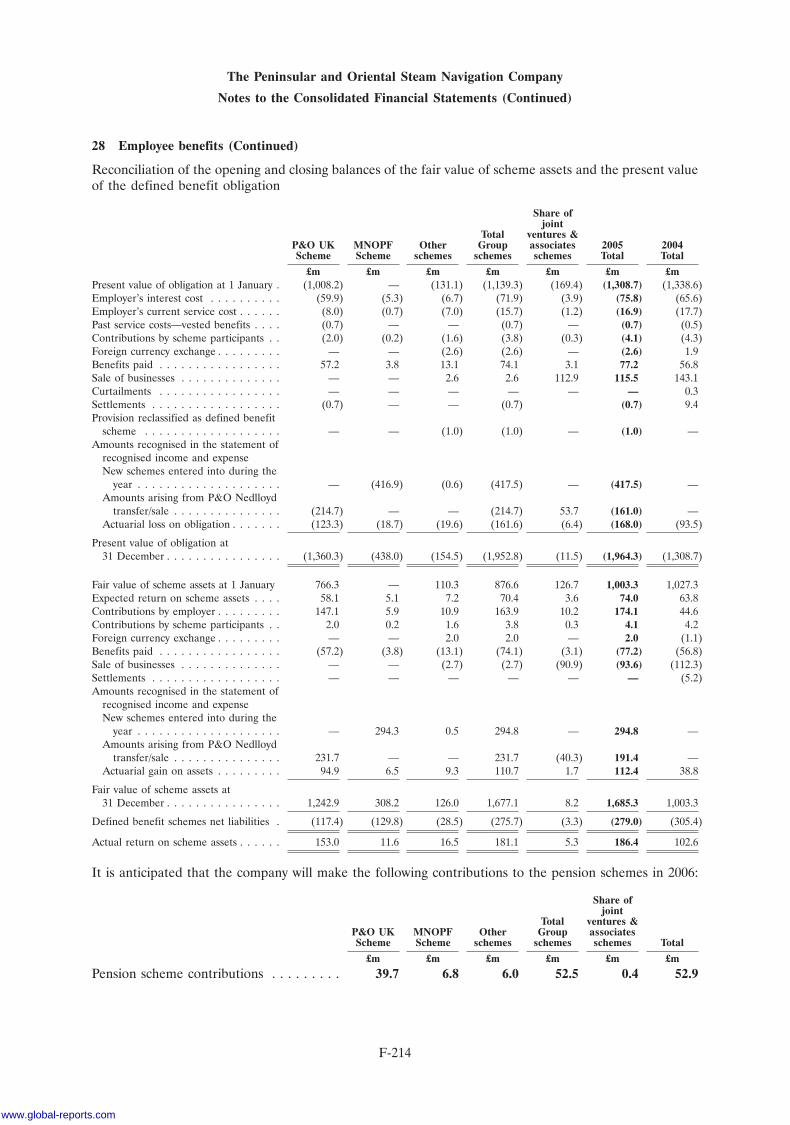
The Peninsular and Oriental Steam Navigation Company
Notes to the Consolidated Financial Statements (Continued)
28 Employee benefits (Continued)
Reconciliation of the opening and closing balances of the fair value of scheme assets and the present valueof the defined benefit obligation
Share ofjoint
Total ventures &P&O UK MNOPF Other Group associates 2005 2004Scheme Scheme schemes schemes schemes Total Total
£m £m £m £m £m £m £mPresent value of obligation at 1 January . (1,008.2) — (131.1) (1,139.3) (169.4) (1,308.7) (1,338.6)Employer’s interest cost . . . . . . . . . . (59.9) (5.3) (6.7) (71.9) (3.9) (75.8) (65.6)Employer’s current service cost . . . . . . (8.0) (0.7) (7.0) (15.7) (1.2) (16.9) (17.7)Past service costs—vested benefits . . . . (0.7) — — (0.7) — (0.7) (0.5)Contributions by scheme participants . . (2.0) (0.2) (1.6) (3.8) (0.3) (4.1) (4.3)Foreign currency exchange . . . . . . . . . — — (2.6) (2.6) — (2.6) 1.9Benefits paid . . . . . . . . . . . . . . . . . 57.2 3.8 13.1 74.1 3.1 77.2 56.8Sale of businesses . . . . . . . . . . . . . . — — 2.6 2.6 112.9 115.5 143.1Curtailments . . . . . . . . . . . . . . . . . — — — — — — 0.3Settlements . . . . . . . . . . . . . . . . . . (0.7) — — (0.7) (0.7) 9.4Provision reclassified as defined benefit
scheme . . . . . . . . . . . . . . . . . . . — — (1.0) (1.0) — (1.0) —Amounts recognised in the statement of
recognised income and expenseNew schemes entered into during the
year . . . . . . . . . . . . . . . . . . . . — (416.9) (0.6) (417.5) — (417.5) —Amounts arising from P&O Nedlloyd
transfer/sale . . . . . . . . . . . . . . . (214.7) — — (214.7) 53.7 (161.0) —Actuarial loss on obligation . . . . . . . (123.3) (18.7) (19.6) (161.6) (6.4) (168.0) (93.5)
Present value of obligation at31 December . . . . . . . . . . . . . . . . (1,360.3) (438.0) (154.5) (1,952.8) (11.5) (1,964.3) (1,308.7)
Fair value of scheme assets at 1 January 766.3 — 110.3 876.6 126.7 1,003.3 1,027.3Expected return on scheme assets . . . . 58.1 5.1 7.2 70.4 3.6 74.0 63.8Contributions by employer . . . . . . . . . 147.1 5.9 10.9 163.9 10.2 174.1 44.6Contributions by scheme participants . . 2.0 0.2 1.6 3.8 0.3 4.1 4.2Foreign currency exchange . . . . . . . . . — — 2.0 2.0 — 2.0 (1.1)Benefits paid . . . . . . . . . . . . . . . . . (57.2) (3.8) (13.1) (74.1) (3.1) (77.2) (56.8)Sale of businesses . . . . . . . . . . . . . . — — (2.7) (2.7) (90.9) (93.6) (112.3)Settlements . . . . . . . . . . . . . . . . . . — — — — — — (5.2)Amounts recognised in the statement of
recognised income and expenseNew schemes entered into during the
year . . . . . . . . . . . . . . . . . . . . — 294.3 0.5 294.8 — 294.8 —Amounts arising from P&O Nedlloyd
transfer/sale . . . . . . . . . . . . . . . 231.7 — — 231.7 (40.3) 191.4 —Actuarial gain on assets . . . . . . . . . 94.9 6.5 9.3 110.7 1.7 112.4 38.8
Fair value of scheme assets at31 December . . . . . . . . . . . . . . . . 1,242.9 308.2 126.0 1,677.1 8.2 1,685.3 1,003.3
Defined benefit schemes net liabilities . (117.4) (129.8) (28.5) (275.7) (3.3) (279.0) (305.4)
Actual return on scheme assets . . . . . . 153.0 11.6 16.5 181.1 5.3 186.4 102.6
It is anticipated that the company will make the following contributions to the pension schemes in 2006:
Share ofjoint
Total ventures &P&O UK MNOPF Other Group associatesScheme Scheme schemes schemes schemes Total
£m £m £m £m £m £m
Pension scheme contributions . . . . . . . . . 39.7 6.8 6.0 52.5 0.4 52.9
F-214
www.global-reports.com
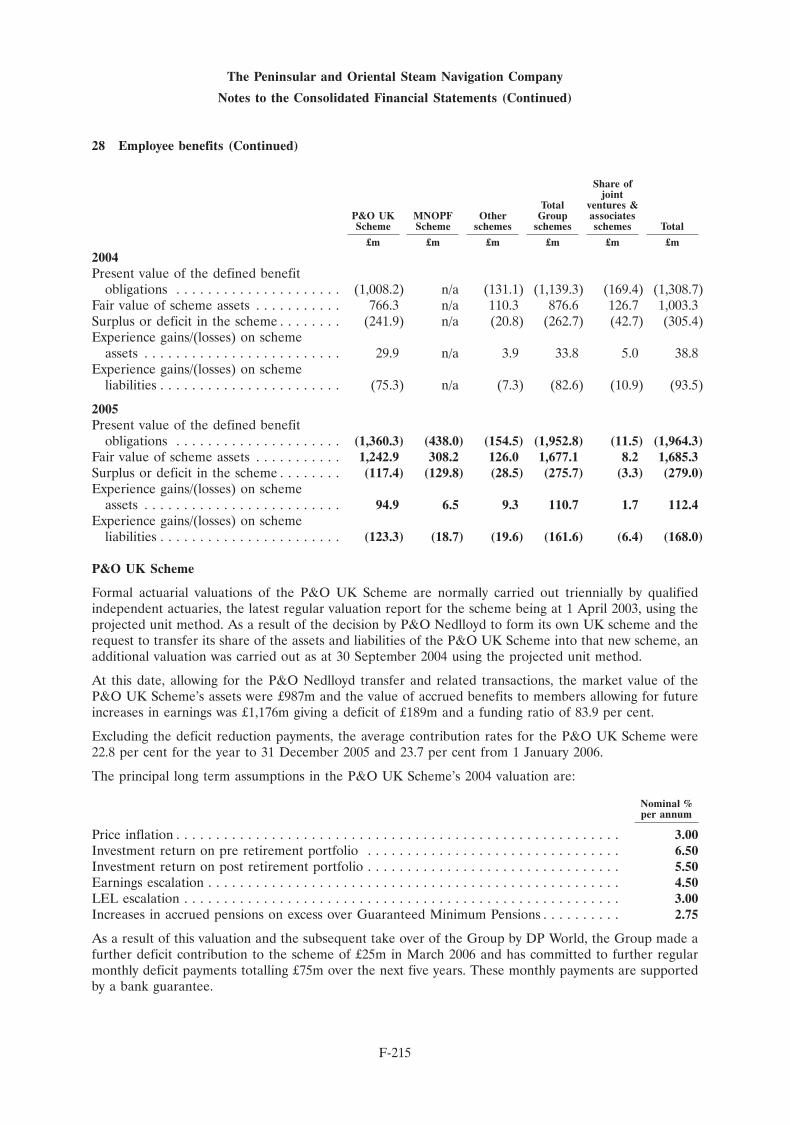
The Peninsular and Oriental Steam Navigation Company
Notes to the Consolidated Financial Statements (Continued)
28 Employee benefits (Continued)
Share ofjoint
Total ventures &P&O UK MNOPF Other Group associatesScheme Scheme schemes schemes schemes Total
£m £m £m £m £m £m
2004Present value of the defined benefit
obligations . . . . . . . . . . . . . . . . . . . . . (1,008.2) n/a (131.1) (1,139.3) (169.4) (1,308.7)Fair value of scheme assets . . . . . . . . . . . 766.3 n/a 110.3 876.6 126.7 1,003.3Surplus or deficit in the scheme . . . . . . . . (241.9) n/a (20.8) (262.7) (42.7) (305.4)Experience gains/(losses) on scheme
assets . . . . . . . . . . . . . . . . . . . . . . . . . 29.9 n/a 3.9 33.8 5.0 38.8Experience gains/(losses) on scheme
liabilities . . . . . . . . . . . . . . . . . . . . . . . (75.3) n/a (7.3) (82.6) (10.9) (93.5)
2005Present value of the defined benefit
obligations . . . . . . . . . . . . . . . . . . . . . (1,360.3) (438.0) (154.5) (1,952.8) (11.5) (1,964.3)Fair value of scheme assets . . . . . . . . . . . 1,242.9 308.2 126.0 1,677.1 8.2 1,685.3Surplus or deficit in the scheme . . . . . . . . (117.4) (129.8) (28.5) (275.7) (3.3) (279.0)Experience gains/(losses) on scheme
assets . . . . . . . . . . . . . . . . . . . . . . . . . 94.9 6.5 9.3 110.7 1.7 112.4Experience gains/(losses) on scheme
liabilities . . . . . . . . . . . . . . . . . . . . . . . (123.3) (18.7) (19.6) (161.6) (6.4) (168.0)
P&O UK Scheme
Formal actuarial valuations of the P&O UK Scheme are normally carried out triennially by qualifiedindependent actuaries, the latest regular valuation report for the scheme being at 1 April 2003, using theprojected unit method. As a result of the decision by P&O Nedlloyd to form its own UK scheme and therequest to transfer its share of the assets and liabilities of the P&O UK Scheme into that new scheme, anadditional valuation was carried out as at 30 September 2004 using the projected unit method.
At this date, allowing for the P&O Nedlloyd transfer and related transactions, the market value of theP&O UK Scheme’s assets were £987m and the value of accrued benefits to members allowing for futureincreases in earnings was £1,176m giving a deficit of £189m and a funding ratio of 83.9 per cent.
Excluding the deficit reduction payments, the average contribution rates for the P&O UK Scheme were22.8 per cent for the year to 31 December 2005 and 23.7 per cent from 1 January 2006.
The principal long term assumptions in the P&O UK Scheme’s 2004 valuation are:
Nominal %per annum
Price inflation . . . . . . . . . . . . . . . . . . . . . . . . . . . . . . . . . . . . . . . . . . . . . . . . . . . . . . . . 3.00Investment return on pre retirement portfolio . . . . . . . . . . . . . . . . . . . . . . . . . . . . . . . . 6.50Investment return on post retirement portfolio . . . . . . . . . . . . . . . . . . . . . . . . . . . . . . . . 5.50Earnings escalation . . . . . . . . . . . . . . . . . . . . . . . . . . . . . . . . . . . . . . . . . . . . . . . . . . . . 4.50LEL escalation . . . . . . . . . . . . . . . . . . . . . . . . . . . . . . . . . . . . . . . . . . . . . . . . . . . . . . . 3.00Increases in accrued pensions on excess over Guaranteed Minimum Pensions . . . . . . . . . . 2.75
As a result of this valuation and the subsequent take over of the Group by DP World, the Group made afurther deficit contribution to the scheme of £25m in March 2006 and has committed to further regularmonthly deficit payments totalling £75m over the next five years. These monthly payments are supportedby a bank guarantee.
F-215
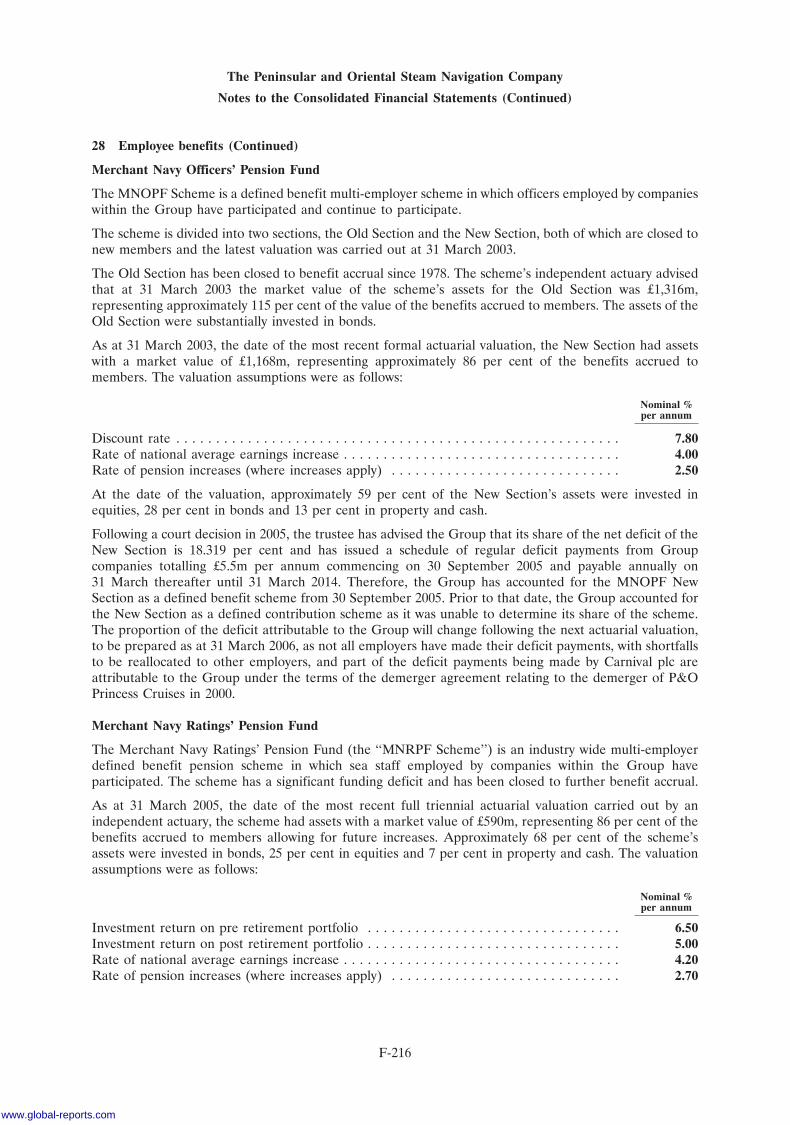
The Peninsular and Oriental Steam Navigation Company
Notes to the Consolidated Financial Statements (Continued)
28 Employee benefits (Continued)
Merchant Navy Officers’ Pension Fund
The MNOPF Scheme is a defined benefit multi-employer scheme in which officers employed by companieswithin the Group have participated and continue to participate.
The scheme is divided into two sections, the Old Section and the New Section, both of which are closed tonew members and the latest valuation was carried out at 31 March 2003.
The Old Section has been closed to benefit accrual since 1978. The scheme’s independent actuary advisedthat at 31 March 2003 the market value of the scheme’s assets for the Old Section was £1,316m,representing approximately 115 per cent of the value of the benefits accrued to members. The assets of theOld Section were substantially invested in bonds.
As at 31 March 2003, the date of the most recent formal actuarial valuation, the New Section had assetswith a market value of £1,168m, representing approximately 86 per cent of the benefits accrued tomembers. The valuation assumptions were as follows:
Nominal %per annum
Discount rate . . . . . . . . . . . . . . . . . . . . . . . . . . . . . . . . . . . . . . . . . . . . . . . . . . . . . . . . 7.80Rate of national average earnings increase . . . . . . . . . . . . . . . . . . . . . . . . . . . . . . . . . . . 4.00Rate of pension increases (where increases apply) . . . . . . . . . . . . . . . . . . . . . . . . . . . . . 2.50
At the date of the valuation, approximately 59 per cent of the New Section’s assets were invested inequities, 28 per cent in bonds and 13 per cent in property and cash.
Following a court decision in 2005, the trustee has advised the Group that its share of the net deficit of theNew Section is 18.319 per cent and has issued a schedule of regular deficit payments from Groupcompanies totalling £5.5m per annum commencing on 30 September 2005 and payable annually on31 March thereafter until 31 March 2014. Therefore, the Group has accounted for the MNOPF NewSection as a defined benefit scheme from 30 September 2005. Prior to that date, the Group accounted forthe New Section as a defined contribution scheme as it was unable to determine its share of the scheme.The proportion of the deficit attributable to the Group will change following the next actuarial valuation,to be prepared as at 31 March 2006, as not all employers have made their deficit payments, with shortfallsto be reallocated to other employers, and part of the deficit payments being made by Carnival plc areattributable to the Group under the terms of the demerger agreement relating to the demerger of P&OPrincess Cruises in 2000.
Merchant Navy Ratings’ Pension Fund
The Merchant Navy Ratings’ Pension Fund (the ‘‘MNRPF Scheme’’) is an industry wide multi-employerdefined benefit pension scheme in which sea staff employed by companies within the Group haveparticipated. The scheme has a significant funding deficit and has been closed to further benefit accrual.
As at 31 March 2005, the date of the most recent full triennial actuarial valuation carried out by anindependent actuary, the scheme had assets with a market value of £590m, representing 86 per cent of thebenefits accrued to members allowing for future increases. Approximately 68 per cent of the scheme’sassets were invested in bonds, 25 per cent in equities and 7 per cent in property and cash. The valuationassumptions were as follows:
Nominal %per annum
Investment return on pre retirement portfolio . . . . . . . . . . . . . . . . . . . . . . . . . . . . . . . . 6.50Investment return on post retirement portfolio . . . . . . . . . . . . . . . . . . . . . . . . . . . . . . . . 5.00Rate of national average earnings increase . . . . . . . . . . . . . . . . . . . . . . . . . . . . . . . . . . . 4.20Rate of pension increases (where increases apply) . . . . . . . . . . . . . . . . . . . . . . . . . . . . . 2.70
F-216
www.global-reports.com
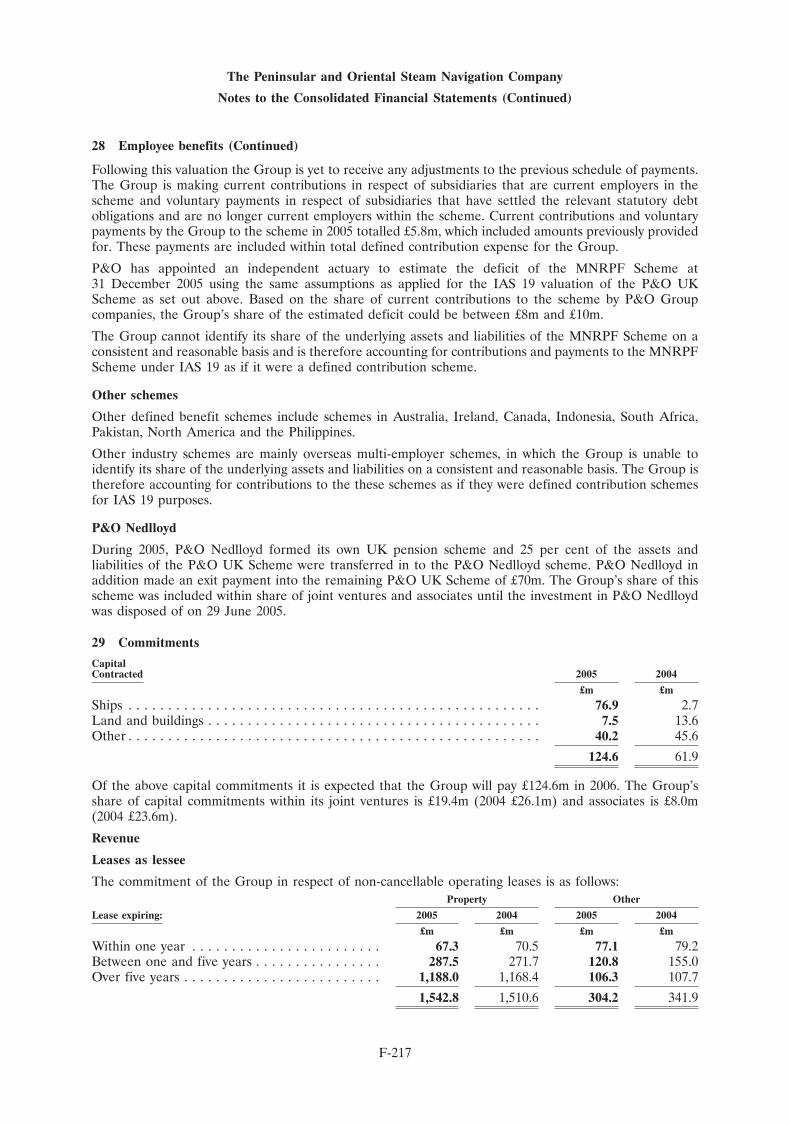
The Peninsular and Oriental Steam Navigation Company
Notes to the Consolidated Financial Statements (Continued)
28 Employee benefits (Continued)
Following this valuation the Group is yet to receive any adjustments to the previous schedule of payments.The Group is making current contributions in respect of subsidiaries that are current employers in thescheme and voluntary payments in respect of subsidiaries that have settled the relevant statutory debtobligations and are no longer current employers within the scheme. Current contributions and voluntarypayments by the Group to the scheme in 2005 totalled £5.8m, which included amounts previously providedfor. These payments are included within total defined contribution expense for the Group.
P&O has appointed an independent actuary to estimate the deficit of the MNRPF Scheme at31 December 2005 using the same assumptions as applied for the IAS 19 valuation of the P&O UKScheme as set out above. Based on the share of current contributions to the scheme by P&O Groupcompanies, the Group’s share of the estimated deficit could be between £8m and £10m.
The Group cannot identify its share of the underlying assets and liabilities of the MNRPF Scheme on aconsistent and reasonable basis and is therefore accounting for contributions and payments to the MNRPFScheme under IAS 19 as if it were a defined contribution scheme.
Other schemes
Other defined benefit schemes include schemes in Australia, Ireland, Canada, Indonesia, South Africa,Pakistan, North America and the Philippines.
Other industry schemes are mainly overseas multi-employer schemes, in which the Group is unable toidentify its share of the underlying assets and liabilities on a consistent and reasonable basis. The Group istherefore accounting for contributions to the these schemes as if they were defined contribution schemesfor IAS 19 purposes.
P&O Nedlloyd
During 2005, P&O Nedlloyd formed its own UK pension scheme and 25 per cent of the assets andliabilities of the P&O UK Scheme were transferred in to the P&O Nedlloyd scheme. P&O Nedlloyd inaddition made an exit payment into the remaining P&O UK Scheme of £70m. The Group’s share of thisscheme was included within share of joint ventures and associates until the investment in P&O Nedlloydwas disposed of on 29 June 2005.
29 Commitments
CapitalContracted 2005 2004
£m £m
Ships . . . . . . . . . . . . . . . . . . . . . . . . . . . . . . . . . . . . . . . . . . . . . . . . . . . . 76.9 2.7Land and buildings . . . . . . . . . . . . . . . . . . . . . . . . . . . . . . . . . . . . . . . . . . 7.5 13.6Other . . . . . . . . . . . . . . . . . . . . . . . . . . . . . . . . . . . . . . . . . . . . . . . . . . . . 40.2 45.6
124.6 61.9
Of the above capital commitments it is expected that the Group will pay £124.6m in 2006. The Group’sshare of capital commitments within its joint ventures is £19.4m (2004 £26.1m) and associates is £8.0m(2004 £23.6m).
Revenue
Leases as lessee
The commitment of the Group in respect of non-cancellable operating leases is as follows:Property Other
Lease expiring: 2005 2004 2005 2004
£m £m £m £m
Within one year . . . . . . . . . . . . . . . . . . . . . . . . 67.3 70.5 77.1 79.2Between one and five years . . . . . . . . . . . . . . . . 287.5 271.7 120.8 155.0Over five years . . . . . . . . . . . . . . . . . . . . . . . . . 1,188.0 1,168.4 106.3 107.7
1,542.8 1,510.6 304.2 341.9
F-217
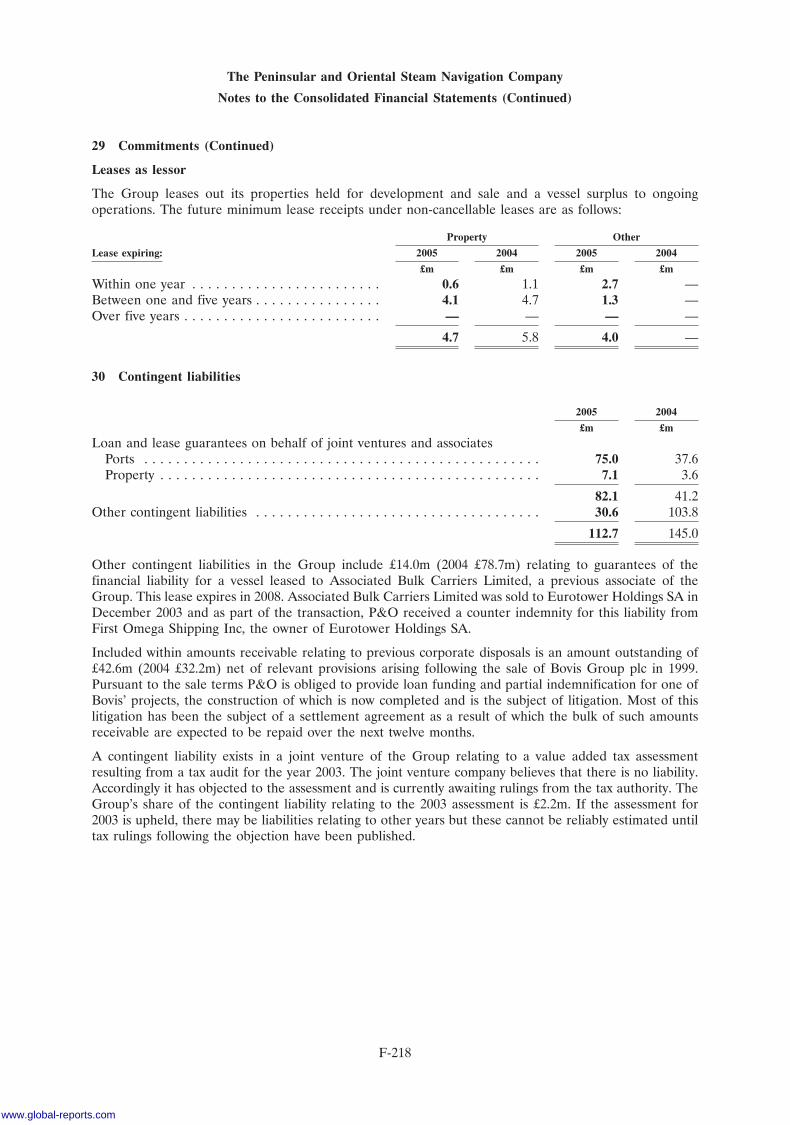
The Peninsular and Oriental Steam Navigation Company
Notes to the Consolidated Financial Statements (Continued)
29 Commitments (Continued)
Leases as lessor
The Group leases out its properties held for development and sale and a vessel surplus to ongoingoperations. The future minimum lease receipts under non-cancellable leases are as follows:
Property Other
Lease expiring: 2005 2004 2005 2004
£m £m £m £m
Within one year . . . . . . . . . . . . . . . . . . . . . . . . 0.6 1.1 2.7 —Between one and five years . . . . . . . . . . . . . . . . 4.1 4.7 1.3 —Over five years . . . . . . . . . . . . . . . . . . . . . . . . . — — — —
4.7 5.8 4.0 —
30 Contingent liabilities
2005 2004
£m £m
Loan and lease guarantees on behalf of joint ventures and associatesPorts . . . . . . . . . . . . . . . . . . . . . . . . . . . . . . . . . . . . . . . . . . . . . . . . . . 75.0 37.6Property . . . . . . . . . . . . . . . . . . . . . . . . . . . . . . . . . . . . . . . . . . . . . . . . 7.1 3.6
82.1 41.2Other contingent liabilities . . . . . . . . . . . . . . . . . . . . . . . . . . . . . . . . . . . . 30.6 103.8
112.7 145.0
Other contingent liabilities in the Group include £14.0m (2004 £78.7m) relating to guarantees of thefinancial liability for a vessel leased to Associated Bulk Carriers Limited, a previous associate of theGroup. This lease expires in 2008. Associated Bulk Carriers Limited was sold to Eurotower Holdings SA inDecember 2003 and as part of the transaction, P&O received a counter indemnity for this liability fromFirst Omega Shipping Inc, the owner of Eurotower Holdings SA.
Included within amounts receivable relating to previous corporate disposals is an amount outstanding of£42.6m (2004 £32.2m) net of relevant provisions arising following the sale of Bovis Group plc in 1999.Pursuant to the sale terms P&O is obliged to provide loan funding and partial indemnification for one ofBovis’ projects, the construction of which is now completed and is the subject of litigation. Most of thislitigation has been the subject of a settlement agreement as a result of which the bulk of such amountsreceivable are expected to be repaid over the next twelve months.
A contingent liability exists in a joint venture of the Group relating to a value added tax assessmentresulting from a tax audit for the year 2003. The joint venture company believes that there is no liability.Accordingly it has objected to the assessment and is currently awaiting rulings from the tax authority. TheGroup’s share of the contingent liability relating to the 2003 assessment is £2.2m. If the assessment for2003 is upheld, there may be liabilities relating to other years but these cannot be reliably estimated untiltax rulings following the objection have been published.
F-218
www.global-reports.com
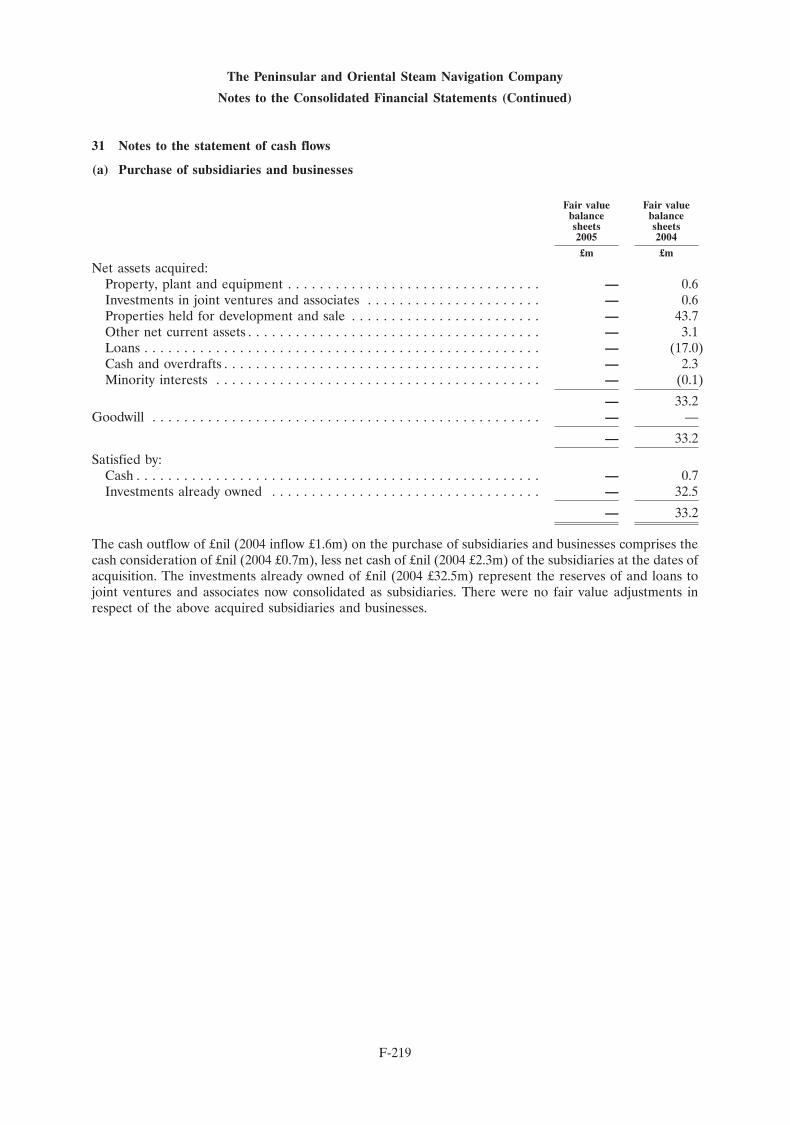
The Peninsular and Oriental Steam Navigation Company
Notes to the Consolidated Financial Statements (Continued)
31 Notes to the statement of cash flows
(a) Purchase of subsidiaries and businesses
Fair value Fair valuebalance balancesheets sheets2005 2004
£m £m
Net assets acquired:Property, plant and equipment . . . . . . . . . . . . . . . . . . . . . . . . . . . . . . . . — 0.6Investments in joint ventures and associates . . . . . . . . . . . . . . . . . . . . . . — 0.6Properties held for development and sale . . . . . . . . . . . . . . . . . . . . . . . . — 43.7Other net current assets . . . . . . . . . . . . . . . . . . . . . . . . . . . . . . . . . . . . . — 3.1Loans . . . . . . . . . . . . . . . . . . . . . . . . . . . . . . . . . . . . . . . . . . . . . . . . . . — (17.0)Cash and overdrafts . . . . . . . . . . . . . . . . . . . . . . . . . . . . . . . . . . . . . . . . — 2.3Minority interests . . . . . . . . . . . . . . . . . . . . . . . . . . . . . . . . . . . . . . . . . — (0.1)
— 33.2Goodwill . . . . . . . . . . . . . . . . . . . . . . . . . . . . . . . . . . . . . . . . . . . . . . . . . — —
— 33.2
Satisfied by:Cash . . . . . . . . . . . . . . . . . . . . . . . . . . . . . . . . . . . . . . . . . . . . . . . . . . . — 0.7Investments already owned . . . . . . . . . . . . . . . . . . . . . . . . . . . . . . . . . . — 32.5
— 33.2
The cash outflow of £nil (2004 inflow £1.6m) on the purchase of subsidiaries and businesses comprises thecash consideration of £nil (2004 £0.7m), less net cash of £nil (2004 £2.3m) of the subsidiaries at the dates ofacquisition. The investments already owned of £nil (2004 £32.5m) represent the reserves of and loans tojoint ventures and associates now consolidated as subsidiaries. There were no fair value adjustments inrespect of the above acquired subsidiaries and businesses.
F-219
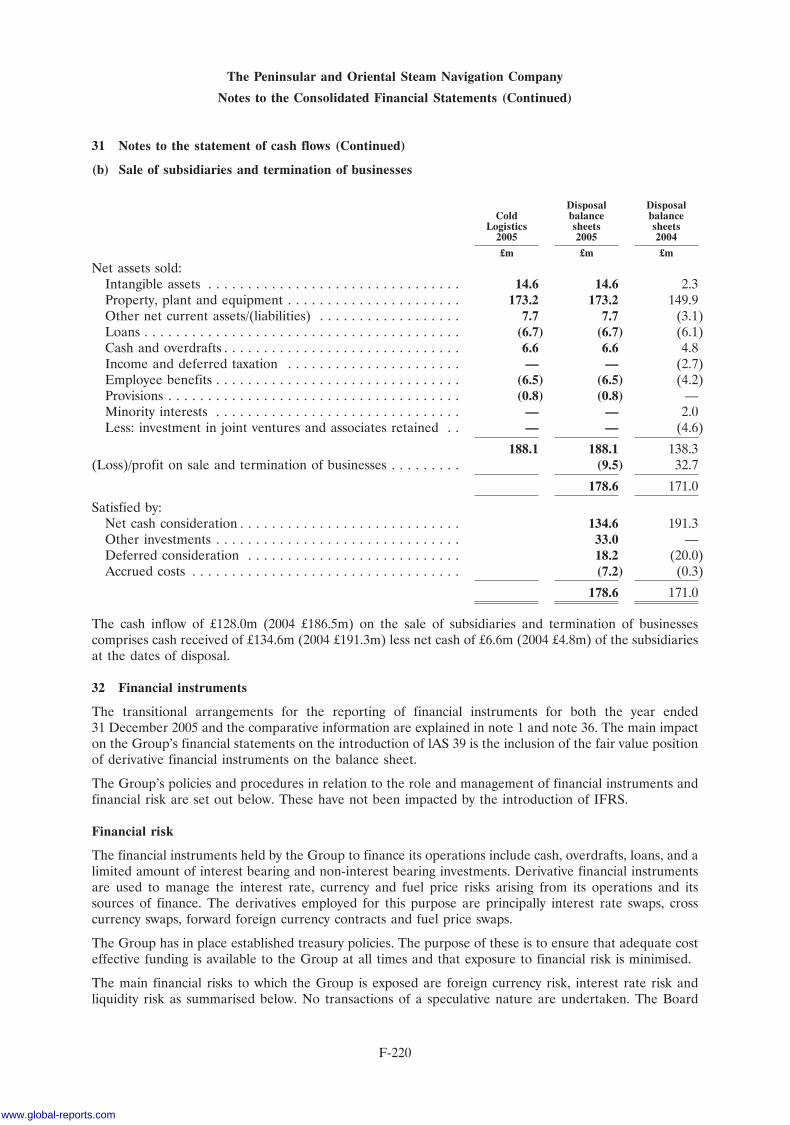
The Peninsular and Oriental Steam Navigation Company
Notes to the Consolidated Financial Statements (Continued)
31 Notes to the statement of cash flows (Continued)
(b) Sale of subsidiaries and termination of businesses
Disposal DisposalCold balance balance
Logistics sheets sheets2005 2005 2004
£m £m £m
Net assets sold:Intangible assets . . . . . . . . . . . . . . . . . . . . . . . . . . . . . . . . 14.6 14.6 2.3Property, plant and equipment . . . . . . . . . . . . . . . . . . . . . . 173.2 173.2 149.9Other net current assets/(liabilities) . . . . . . . . . . . . . . . . . . 7.7 7.7 (3.1)Loans . . . . . . . . . . . . . . . . . . . . . . . . . . . . . . . . . . . . . . . . (6.7) (6.7) (6.1)Cash and overdrafts . . . . . . . . . . . . . . . . . . . . . . . . . . . . . . 6.6 6.6 4.8Income and deferred taxation . . . . . . . . . . . . . . . . . . . . . . — — (2.7)Employee benefits . . . . . . . . . . . . . . . . . . . . . . . . . . . . . . . (6.5) (6.5) (4.2)Provisions . . . . . . . . . . . . . . . . . . . . . . . . . . . . . . . . . . . . . (0.8) (0.8) —Minority interests . . . . . . . . . . . . . . . . . . . . . . . . . . . . . . . — — 2.0Less: investment in joint ventures and associates retained . . — — (4.6)
188.1 188.1 138.3(Loss)/profit on sale and termination of businesses . . . . . . . . . (9.5) 32.7
178.6 171.0
Satisfied by:Net cash consideration . . . . . . . . . . . . . . . . . . . . . . . . . . . . 134.6 191.3Other investments . . . . . . . . . . . . . . . . . . . . . . . . . . . . . . . 33.0 —Deferred consideration . . . . . . . . . . . . . . . . . . . . . . . . . . . 18.2 (20.0)Accrued costs . . . . . . . . . . . . . . . . . . . . . . . . . . . . . . . . . . (7.2) (0.3)
178.6 171.0
The cash inflow of £128.0m (2004 £186.5m) on the sale of subsidiaries and termination of businessescomprises cash received of £134.6m (2004 £191.3m) less net cash of £6.6m (2004 £4.8m) of the subsidiariesat the dates of disposal.
32 Financial instruments
The transitional arrangements for the reporting of financial instruments for both the year ended31 December 2005 and the comparative information are explained in note 1 and note 36. The main impacton the Group’s financial statements on the introduction of lAS 39 is the inclusion of the fair value positionof derivative financial instruments on the balance sheet.
The Group’s policies and procedures in relation to the role and management of financial instruments andfinancial risk are set out below. These have not been impacted by the introduction of IFRS.
Financial risk
The financial instruments held by the Group to finance its operations include cash, overdrafts, loans, and alimited amount of interest bearing and non-interest bearing investments. Derivative financial instrumentsare used to manage the interest rate, currency and fuel price risks arising from its operations and itssources of finance. The derivatives employed for this purpose are principally interest rate swaps, crosscurrency swaps, forward foreign currency contracts and fuel price swaps.
The Group has in place established treasury policies. The purpose of these is to ensure that adequate costeffective funding is available to the Group at all times and that exposure to financial risk is minimised.
The main financial risks to which the Group is exposed are foreign currency risk, interest rate risk andliquidity risk as summarised below. No transactions of a speculative nature are undertaken. The Board
F-220
www.global-reports.com
The Peninsular and Oriental Steam Navigation Company
Notes to the Consolidated Financial Statements (Continued)
32 Financial instruments (Continued)
receives regular reports which monitor these risks in accordance with agreed policies. None of thesepolicies have been altered during the year.
Liquidity risk
The Group has cash balances and undrawn committed facilities to provide liquidity as required. At31 December 2005 committed undrawn facilities totalled £686.3m (2004 £660.6m). Most of this borrowingcapacity is available under a syndicated loan which is repayable in June 2010. The syndicated loanagreement contains representations, warranties, undertakings (including financial condition covenants andundertakings requiring the provision of guarantees from various subsidiary companies) in favour of thelenders which are typical for this type of credit agreement and customary events of default uponoccurrence of which the lenders may terminate and demand repayment of the facility. The agreement alsoincludes the requirement to effect a mandatory prepayment upon a change of control of The Peninsularand Oriental steam Navigation Company.
The DP World takeover has affected liquidity and the effect is shown in the loan note on page F-201.
Foreign currency risk
The Group has extensive overseas and international business operations and operates in a number offoreign currencies which gives rise to transactional and translational foreign exchange risk. The mostimportant foreign currency to the Group is the US dollar, followed by the Australian dollar and the Indianrupee. In general, the Group’s profits and stockholders’ funds benefit if these currencies are strong againststerling. The year end rate for the US dollar was $1.717=£1 (2004 $1.92=£1), for the Australian dollar itwas $2.340=£1 (2004 $2.449=£1) and for the Indian rupee it was INR77.271=£1 (2004 INR83.458=£1).
Translational currency risk
The proportion of the Group’s net operating assets denominated in foreign currencies is 73 per cent withthe result that the Group’s sterling consolidated balance sheet, and in particular stockholders’ funds, canbe significantly affected by currency movements when it is retranslated at each period end rate. The Groupmitigates the effect of such movements by borrowing in the same currencies as those in which the assetsare denominated and using cross currency swaps. In addition the majority of the Group’s operating profitin 2005 was generated by businesses with functional currencies other than sterling. The results of thesebusinesses are translated into sterling at average exchange rates for the purposes of consolidation. Theimpact of currency movements on operating profit is mitigated partially by interest costs being incurred inforeign currencies.
Exchange arising on foreign currency investments are taken directly to equity. Most foreign currency loansare accounted for as hedges and the exchange arising from retranslating these loans at each balance sheetdate is taken to equity to the extent that this hedge is deemed to be effective. Where cross currency swapsare used to hedge overseas equity investments the movement in the fair value of the instrument is alsotaken to equity.
Transactional currency risk
A portion of the Group’s businesses generate part of their revenue and incur some costs outside their mainfunctional currency. Due to the diverse number of locations in which the Group operates there is somenatural hedging that occurs within the Group. When it is considered that currency volatility could have amaterial impact on the results of an operation, hedging, generally up to 12 months using forward contracts,is undertaken to reduce the short term effect of currency movements.
When the Group’s businesses enter into capital expenditure or lease commitments in currencies other thantheir main functional currency, these commitments are hedged in most instances using forward contractsand currency swaps in order to fix the cost when converted to the functional currency. The main exposure
F-221
The Peninsular and Oriental Steam Navigation Company
Notes to the Consolidated Financial Statements (Continued)
32 Financial instruments (Continued)
of the Group’s foreign currency commitments of this nature is in respect of ferry operating leasecommitments. Forward contracts match the expected cash flows of capital and lease commitments.
The Group classifies its forward exchange contracts hedging forecasted transactions as cash flow hedgesand in accordance with IAS 39 states them at fair value. The fair value of forward exchange contracts at1 January 2005 was adjusted against the opening balance of the hedging reserve at that date. The fairvalues of hedges of forecasted transactions at 31 December 2005 are shown in the fair value table below.
As well as the direct effect on cash flows, exchange rates also affect the Group’s businesses because of theiroverall economic influence. In particular, exchange rates affect international trade flows which impact onthe activities of the Group.
Interest rate risk
A small proportion of the Group’s underlying borrowings are at fixed rates of interest. In addition, theGroup uses interest rate swaps and other instruments to fix the interest cost on its floating rate borrowingsin order to limit the impact of increases in interest rates. In the medium term, the Group’s policy is tomaintain between 50 per cent and 75 per cent of borrowings at a fixed rate of interest. In the short term,the level of fixed rate borrowings may move out of the 50 per cent to 75 per cent range, in which case aplan is put in place to move back within this range. Interest rate swaps have been taken out for periods ofbetween 2 and 13 years with an average life of 3.7 years at 31 December 2005. £428.9m of borrowings wereat fixed rates of interest as at 31 December 2005 (2004 £837.3m), either directly or indirectly through swaparrangements. This represents 71 per cent (2004 71 per cent) of net borrowings, with 66 per cent (200462 per cent) at rates fixed for more than one year.
The Group classifies interest rate swaps as cash flow hedges and states them at fair value. The fair value ofswaps at 1 January 2005 was adjusted against the opening balance of the hedging reserve at that date. Thenet fair values of swaps at 31 December 2005 are shown in the fair value table below.
Fuel price risk
During 2005 P&O Ferries used fuel price swaps to fix a proportion of its fuel requirement for 2006 inaccordance with its fuel hedging policy. These swaps are classified as cash flow hedges and stated at fairvalue. The fair value of the swaps at the 31 December 2005 was £nil (2004 £nil). There were no fuel swapsoutstanding in Group companies at the end of 2004.
Credit risk
At the balance sheet date there were no significant concentrations of credit risk. The maximum exposureto credit risk is represented by the carrying amount of each financial asset, including derivative financialinstruments, in the balance sheet.
F-222
www.global-reports.com
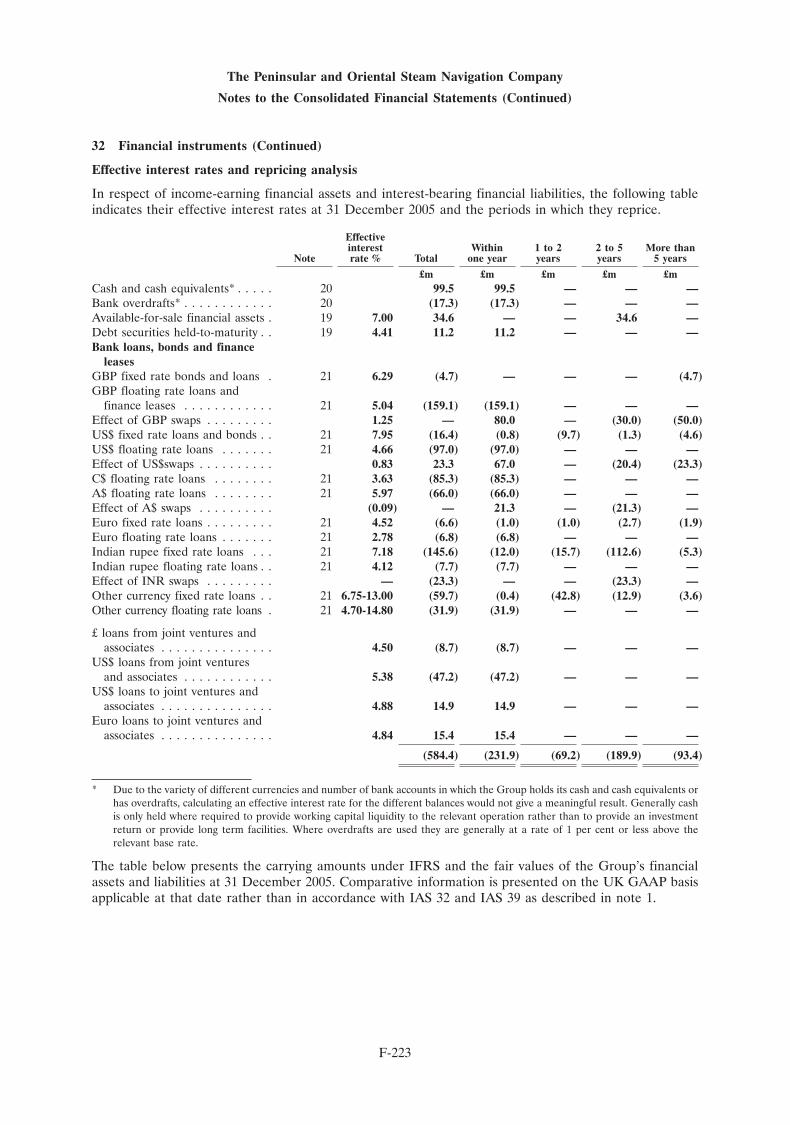
The Peninsular and Oriental Steam Navigation Company
Notes to the Consolidated Financial Statements (Continued)
32 Financial instruments (Continued)
Effective interest rates and repricing analysis
In respect of income-earning financial assets and interest-bearing financial liabilities, the following tableindicates their effective interest rates at 31 December 2005 and the periods in which they reprice.
Effectiveinterest Within 1 to 2 2 to 5 More than
Note rate % Total one year years years 5 years
£m £m £m £m £mCash and cash equivalents* . . . . . 20 99.5 99.5 — — —Bank overdrafts* . . . . . . . . . . . . 20 (17.3) (17.3) — — —Available-for-sale financial assets . 19 7.00 34.6 — — 34.6 —Debt securities held-to-maturity . . 19 4.41 11.2 11.2 — — —Bank loans, bonds and finance
leasesGBP fixed rate bonds and loans . 21 6.29 (4.7) — — — (4.7)GBP floating rate loans and
finance leases . . . . . . . . . . . . 21 5.04 (159.1) (159.1) — — —Effect of GBP swaps . . . . . . . . . 1.25 — 80.0 — (30.0) (50.0)US$ fixed rate loans and bonds . . 21 7.95 (16.4) (0.8) (9.7) (1.3) (4.6)US$ floating rate loans . . . . . . . 21 4.66 (97.0) (97.0) — — —Effect of US$swaps . . . . . . . . . . 0.83 23.3 67.0 — (20.4) (23.3)C$ floating rate loans . . . . . . . . 21 3.63 (85.3) (85.3) — — —A$ floating rate loans . . . . . . . . 21 5.97 (66.0) (66.0) — — —Effect of A$ swaps . . . . . . . . . . (0.09) — 21.3 — (21.3) —Euro fixed rate loans . . . . . . . . . 21 4.52 (6.6) (1.0) (1.0) (2.7) (1.9)Euro floating rate loans . . . . . . . 21 2.78 (6.8) (6.8) — — —Indian rupee fixed rate loans . . . 21 7.18 (145.6) (12.0) (15.7) (112.6) (5.3)Indian rupee floating rate loans . . 21 4.12 (7.7) (7.7) — — —Effect of INR swaps . . . . . . . . . — (23.3) — — (23.3) —Other currency fixed rate loans . . 21 6.75-13.00 (59.7) (0.4) (42.8) (12.9) (3.6)Other currency floating rate loans . 21 4.70-14.80 (31.9) (31.9) — — —
£ loans from joint ventures andassociates . . . . . . . . . . . . . . . 4.50 (8.7) (8.7) — — —
US$ loans from joint venturesand associates . . . . . . . . . . . . 5.38 (47.2) (47.2) — — —
US$ loans to joint ventures andassociates . . . . . . . . . . . . . . . 4.88 14.9 14.9 — — —
Euro loans to joint ventures andassociates . . . . . . . . . . . . . . . 4.84 15.4 15.4 — — —
(584.4) (231.9) (69.2) (189.9) (93.4)
* Due to the variety of different currencies and number of bank accounts in which the Group holds its cash and cash equivalents orhas overdrafts, calculating an effective interest rate for the different balances would not give a meaningful result. Generally cashis only held where required to provide working capital liquidity to the relevant operation rather than to provide an investmentreturn or provide long term facilities. Where overdrafts are used they are generally at a rate of 1 per cent or less above therelevant base rate.
The table below presents the carrying amounts under IFRS and the fair values of the Group’s financialassets and liabilities at 31 December 2005. Comparative information is presented on the UK GAAP basisapplicable at that date rather than in accordance with IAS 32 and IAS 39 as described in note 1.
F-223
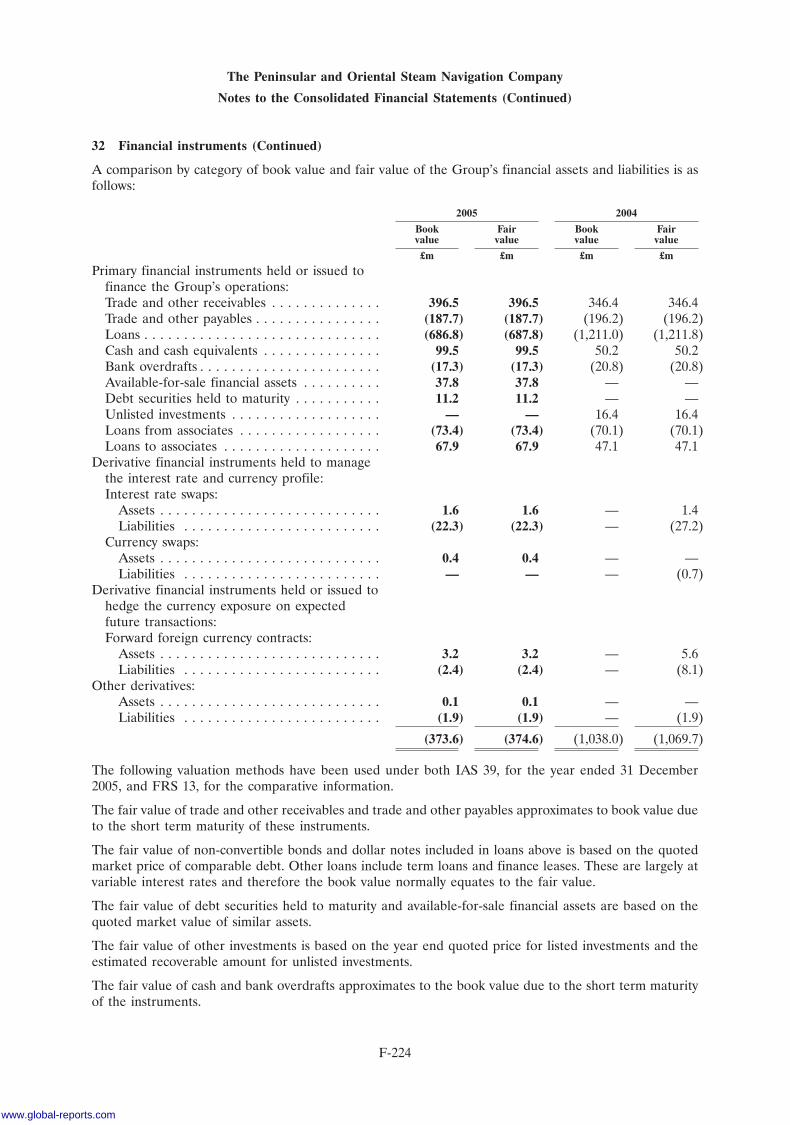
The Peninsular and Oriental Steam Navigation Company
Notes to the Consolidated Financial Statements (Continued)
32 Financial instruments (Continued)
A comparison by category of book value and fair value of the Group’s financial assets and liabilities is asfollows:
2005 2004
Book Fair Book Fairvalue value value value
£m £m £m £m
Primary financial instruments held or issued tofinance the Group’s operations:Trade and other receivables . . . . . . . . . . . . . . 396.5 396.5 346.4 346.4Trade and other payables . . . . . . . . . . . . . . . . (187.7) (187.7) (196.2) (196.2)Loans . . . . . . . . . . . . . . . . . . . . . . . . . . . . . . (686.8) (687.8) (1,211.0) (1,211.8)Cash and cash equivalents . . . . . . . . . . . . . . . 99.5 99.5 50.2 50.2Bank overdrafts . . . . . . . . . . . . . . . . . . . . . . . (17.3) (17.3) (20.8) (20.8)Available-for-sale financial assets . . . . . . . . . . 37.8 37.8 — —Debt securities held to maturity . . . . . . . . . . . 11.2 11.2 — —Unlisted investments . . . . . . . . . . . . . . . . . . . — — 16.4 16.4Loans from associates . . . . . . . . . . . . . . . . . . (73.4) (73.4) (70.1) (70.1)Loans to associates . . . . . . . . . . . . . . . . . . . . 67.9 67.9 47.1 47.1
Derivative financial instruments held to managethe interest rate and currency profile:Interest rate swaps:
Assets . . . . . . . . . . . . . . . . . . . . . . . . . . . . 1.6 1.6 — 1.4Liabilities . . . . . . . . . . . . . . . . . . . . . . . . . (22.3) (22.3) — (27.2)
Currency swaps:Assets . . . . . . . . . . . . . . . . . . . . . . . . . . . . 0.4 0.4 — —Liabilities . . . . . . . . . . . . . . . . . . . . . . . . . — — — (0.7)
Derivative financial instruments held or issued tohedge the currency exposure on expectedfuture transactions:Forward foreign currency contracts:
Assets . . . . . . . . . . . . . . . . . . . . . . . . . . . . 3.2 3.2 — 5.6Liabilities . . . . . . . . . . . . . . . . . . . . . . . . . (2.4) (2.4) — (8.1)
Other derivatives:Assets . . . . . . . . . . . . . . . . . . . . . . . . . . . . 0.1 0.1 — —Liabilities . . . . . . . . . . . . . . . . . . . . . . . . . (1.9) (1.9) — (1.9)
(373.6) (374.6) (1,038.0) (1,069.7)
The following valuation methods have been used under both IAS 39, for the year ended 31 December2005, and FRS 13, for the comparative information.
The fair value of trade and other receivables and trade and other payables approximates to book value dueto the short term maturity of these instruments.
The fair value of non-convertible bonds and dollar notes included in loans above is based on the quotedmarket price of comparable debt. Other loans include term loans and finance leases. These are largely atvariable interest rates and therefore the book value normally equates to the fair value.
The fair value of debt securities held to maturity and available-for-sale financial assets are based on thequoted market value of similar assets.
The fair value of other investments is based on the year end quoted price for listed investments and theestimated recoverable amount for unlisted investments.
The fair value of cash and bank overdrafts approximates to the book value due to the short term maturityof the instruments.
F-224
www.global-reports.com
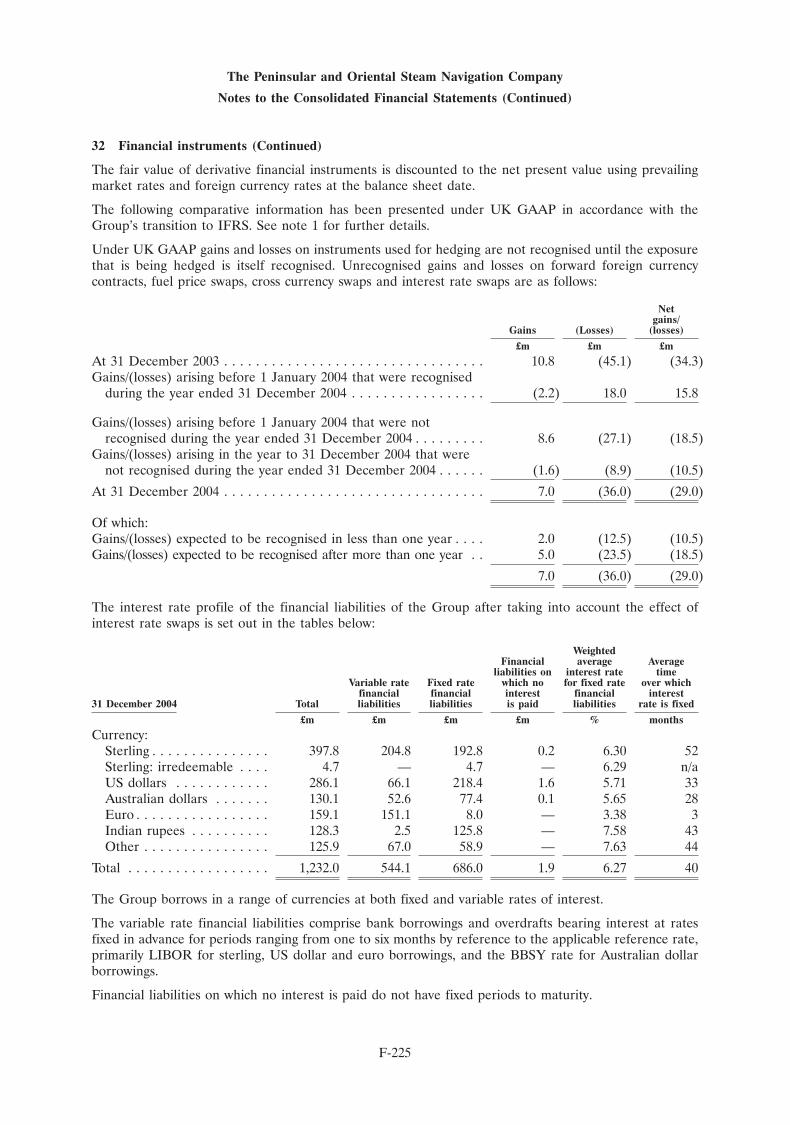
The Peninsular and Oriental Steam Navigation Company
Notes to the Consolidated Financial Statements (Continued)
32 Financial instruments (Continued)
The fair value of derivative financial instruments is discounted to the net present value using prevailingmarket rates and foreign currency rates at the balance sheet date.
The following comparative information has been presented under UK GAAP in accordance with theGroup’s transition to IFRS. See note 1 for further details.
Under UK GAAP gains and losses on instruments used for hedging are not recognised until the exposurethat is being hedged is itself recognised. Unrecognised gains and losses on forward foreign currencycontracts, fuel price swaps, cross currency swaps and interest rate swaps are as follows:
Netgains/
Gains (Losses) (losses)
£m £m £m
At 31 December 2003 . . . . . . . . . . . . . . . . . . . . . . . . . . . . . . . . . 10.8 (45.1) (34.3)Gains/(losses) arising before 1 January 2004 that were recognised
during the year ended 31 December 2004 . . . . . . . . . . . . . . . . . (2.2) 18.0 15.8
Gains/(losses) arising before 1 January 2004 that were notrecognised during the year ended 31 December 2004 . . . . . . . . . 8.6 (27.1) (18.5)
Gains/(losses) arising in the year to 31 December 2004 that werenot recognised during the year ended 31 December 2004 . . . . . . (1.6) (8.9) (10.5)
At 31 December 2004 . . . . . . . . . . . . . . . . . . . . . . . . . . . . . . . . . 7.0 (36.0) (29.0)
Of which:Gains/(losses) expected to be recognised in less than one year . . . . 2.0 (12.5) (10.5)Gains/(losses) expected to be recognised after more than one year . . 5.0 (23.5) (18.5)
7.0 (36.0) (29.0)
The interest rate profile of the financial liabilities of the Group after taking into account the effect ofinterest rate swaps is set out in the tables below:
WeightedFinancial average Average
liabilities on interest rate timeVariable rate Fixed rate which no for fixed rate over which
financial financial interest financial interest31 December 2004 Total liabilities liabilities is paid liabilities rate is fixed
£m £m £m £m % months
Currency:Sterling . . . . . . . . . . . . . . . 397.8 204.8 192.8 0.2 6.30 52Sterling: irredeemable . . . . 4.7 — 4.7 — 6.29 n/aUS dollars . . . . . . . . . . . . 286.1 66.1 218.4 1.6 5.71 33Australian dollars . . . . . . . 130.1 52.6 77.4 0.1 5.65 28Euro . . . . . . . . . . . . . . . . . 159.1 151.1 8.0 — 3.38 3Indian rupees . . . . . . . . . . 128.3 2.5 125.8 — 7.58 43Other . . . . . . . . . . . . . . . . 125.9 67.0 58.9 — 7.63 44
Total . . . . . . . . . . . . . . . . . . 1,232.0 544.1 686.0 1.9 6.27 40
The Group borrows in a range of currencies at both fixed and variable rates of interest.
The variable rate financial liabilities comprise bank borrowings and overdrafts bearing interest at ratesfixed in advance for periods ranging from one to six months by reference to the applicable reference rate,primarily LIBOR for sterling, US dollar and euro borrowings, and the BBSY rate for Australian dollarborrowings.
Financial liabilities on which no interest is paid do not have fixed periods to maturity.
F-225
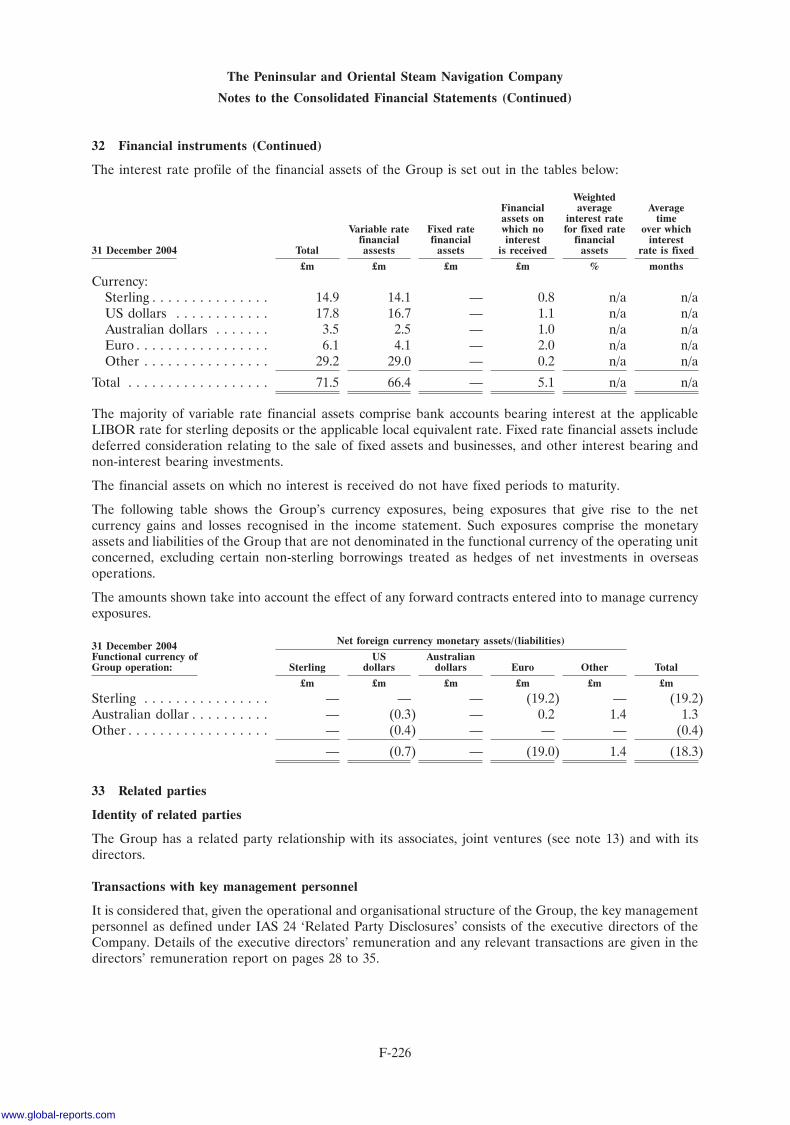
The Peninsular and Oriental Steam Navigation Company
Notes to the Consolidated Financial Statements (Continued)
32 Financial instruments (Continued)
The interest rate profile of the financial assets of the Group is set out in the tables below:
WeightedFinancial average Averageassets on interest rate time
Variable rate Fixed rate which no for fixed rate over whichfinancial financial interest financial interest
31 December 2004 Total assests assets is received assets rate is fixed
£m £m £m £m % months
Currency:Sterling . . . . . . . . . . . . . . . 14.9 14.1 — 0.8 n/a n/aUS dollars . . . . . . . . . . . . 17.8 16.7 — 1.1 n/a n/aAustralian dollars . . . . . . . 3.5 2.5 — 1.0 n/a n/aEuro . . . . . . . . . . . . . . . . . 6.1 4.1 — 2.0 n/a n/aOther . . . . . . . . . . . . . . . . 29.2 29.0 — 0.2 n/a n/a
Total . . . . . . . . . . . . . . . . . . 71.5 66.4 — 5.1 n/a n/a
The majority of variable rate financial assets comprise bank accounts bearing interest at the applicableLIBOR rate for sterling deposits or the applicable local equivalent rate. Fixed rate financial assets includedeferred consideration relating to the sale of fixed assets and businesses, and other interest bearing andnon-interest bearing investments.
The financial assets on which no interest is received do not have fixed periods to maturity.
The following table shows the Group’s currency exposures, being exposures that give rise to the netcurrency gains and losses recognised in the income statement. Such exposures comprise the monetaryassets and liabilities of the Group that are not denominated in the functional currency of the operating unitconcerned, excluding certain non-sterling borrowings treated as hedges of net investments in overseasoperations.
The amounts shown take into account the effect of any forward contracts entered into to manage currencyexposures.
Net foreign currency monetary assets/(liabilities)31 December 2004Functional currency of US AustralianGroup operation: Sterling dollars dollars Euro Other Total
£m £m £m £m £m £m
Sterling . . . . . . . . . . . . . . . . — — — (19.2) — (19.2)Australian dollar . . . . . . . . . . — (0.3) — 0.2 1.4 1.3Other . . . . . . . . . . . . . . . . . . — (0.4) — — — (0.4)
— (0.7) — (19.0) 1.4 (18.3)
33 Related parties
Identity of related parties
The Group has a related party relationship with its associates, joint ventures (see note 13) and with itsdirectors.
Transactions with key management personnel
It is considered that, given the operational and organisational structure of the Group, the key managementpersonnel as defined under IAS 24 ‘Related Party Disclosures’ consists of the executive directors of theCompany. Details of the executive directors’ remuneration and any relevant transactions are given in thedirectors’ remuneration report on pages 28 to 35.
F-226
www.global-reports.com
The Peninsular and Oriental Steam Navigation Company
Notes to the Consolidated Financial Statements (Continued)
33 Related parties (Continued)
Other related party transactions
Transactions with joint ventures and associates have been disclosed in note 13.
Ultimate parent company
The Company’s immediate controlling party is Thunder FZE, a wholly owned subsidiary of Ports, Customsand Free Zone Corporation, Dubai. No other group financial statements include the results of the Group.
34 Post balance sheet events
On 1 February 2006, the Group announced it had sold its entire property portfolio in Denver to SheaHomes Limited Partnership. The portfolio had a book value of approximately US$120m (£67m) and as aresult of the sale, the Group has largely exited its property interests in the US.
The Tariff Authority for Major Ports in India (‘‘TAMP’’) has after review passed an order dated 7 March2006 amending the royalty allowed at Nhava Sheva International Container Terminal (‘‘NSICT’’) resultingin a reduction in the scale of rates of NSICT by 12 per cent. The said order amends TAMP’s order dated22 July 2005. NSICT is seeking to challenge this new order.
Takeover by DP World
On 29 November 2005, the P&O Board recommended the cash acquisition of P&O by Thunder FZE (awholly owned subsidiary of Ports, Customs and Free Zone Corporation, Dubai (‘‘DP World’’)) by way ofschemes of arrangement. Following the announcement of an offer by PSA Venture (UK) Limited (a whollyowned subsidiary of PSA International Pte Ltd (‘‘PSA’’) of Singapore) (also recommended by the Board)on the morning of 26 January 2006, the Board recommended revised proposals from Thunder FZE on theevening of 26 January 2006. These proposals were approved by the stockholders at meetings held on13 February 2006, and following approval of the schemes by the High Court the schemes became effectiveon 8 March 2006 and P&O became a wholly owned subsidiary of DP World as at that date.
Following the acquisition of the Company by DP World, it has been announced that the Group’s US portsbusiness, P&O Ports North America, will be sold. A sale process has commenced.
As a result of DP World acquiring control of the Company, the Port Authority of New York and NewJersey has commenced legal proceedings that could, if pursued and if successful, result in the terminationof the lease of a terminal by Port Newark Container Terminal LLC, a partnership in which the Group has a50 per cent interest. It is anticipated that this litigation will be resolved by the sale of P&O Ports NorthAmerica, without the lease being terminated.
The Group is engaged in ongoing litigation with its joint venture partners in its port businesses in Miami.The Group is confident of its contractual position and does not anticipate any significant adverse financialor operational impact from this litigation.
In addition to this litigation the Group is in dispute with shareholders and other stakeholders over mattersarising from the takeover in respect of its port businesses in Mundra (India), Colombo (Sri Lanka) andLaem Chabang (Thailand). The Group is confident of its contractual position and does not anticipate anysignificant adverse financial impact from these disputes.
As a result of the change of control following the DP World takeover certain borrowing and loan facilitiesmay be cancelled at the bank’s option (see note 21). DP World has arranged sufficient finance to allow anyamounts drawn under these facilities to be repaid as they fall due.
35 Accounting estimates and judgements
Management discussed with the Audit Committee the development, selection and disclosure of theGroup’s critical accounting policies and estimates and the estimates and the application of these policiesand estimates.
F-227
The Peninsular and Oriental Steam Navigation Company
Notes to the Consolidated Financial Statements (Continued)
35 Accounting estimates and judgements (Continued)
Key sources of estimation uncertainty
Note 10 contains information about the assumptions and their risk factors relating to goodwill impairment.
Pension assumptions
For each pension scheme the Group has decided on the expected long term rate of return for each of themain asset classes based on market indicators, economic background, historical analysis of returns andindustry forecasts. If these were to reduce, then the Group’s share of the increased deficit would becharged to reserves and recognised in the balance sheet in 2006. A more detailed analysis of theseassumptions is provided in note 28.
36 Explanation of transition to IFRS
As stated in note 1, these are the Group’s first consolidated financial statements prepared in accordancewith IFRS.
The accounting policies referred to in note 1 have been applied in preparing the financial statements forthe year ended 31 December 2005, the comparative information presented in these financial statements forthe year ended 31 December 2004 and the preparation of an opening IFRS balance sheet at 1 January2004 (the Group’s date of transition).
In preparing its opening IFRS balance sheet, the Group has adjusted amounts reported previously infinancial statements prepared in accordance with UK GAAP.
An explanation of how the transition from UK GAAP to IFRS has affected the Group’s financial position,financial performance and cash flows is set out in the following tables and the notes that accompany thetables. This information differs to that published in a press release on 15 June 2005 due to balance sheetreclassifications relating to provisions and employee benefits, income statement reclassifications to reflectdiscontinued operations for businesses sold and an adjustment to the income statement and balance sheets(both 1 January 2004 and 31 December 2004) to reflect a revision to the accounting treatment of certainleases.
The major accounting changes which were required by the adoption of IFRS are:
� Pensions, where defined benefit pension scheme surpluses and deficits are now recognised on thebalance sheet
� The consolidation of the entity which owned the Hanseatic Trade Center property developmentin Hamburg, which had been accounted for as an associate under UK GAAP
� The cessation of amortisation of goodwill
� The recording of share-based payments at fair value
� The provision of deferred tax on unremitted earnings of certain overseas subsidiaries, jointventures and associates, revalued assets and rolled over gains
� Accounting for the partial sell down of the Group’s holding in P&O Nedlloyd
Additionally there are significant presentational changes in the income statement and cash flow statement,particularly in respect of equity accounted joint ventures and associates.
The Group has applied the exemption available under IFRS 1 ‘First-time Adoption of InternationalFinancial Reporting Standards’ that allows for comparatives not to be restated for IAS 32 ‘FinancialInstruments: Disclosure and Presentation’ and IAS 39 ‘Financial Instruments: Recognition andMeasurement’ and for IFRS 5 ‘Non-current assets held for sale and discontinued operations’ to be appliedprospectively from 1 January 2005. The summarised accounting policies in respect of these items, asapplied from 1 January 2005, are outlined in Section B below.
F-228
www.global-reports.com
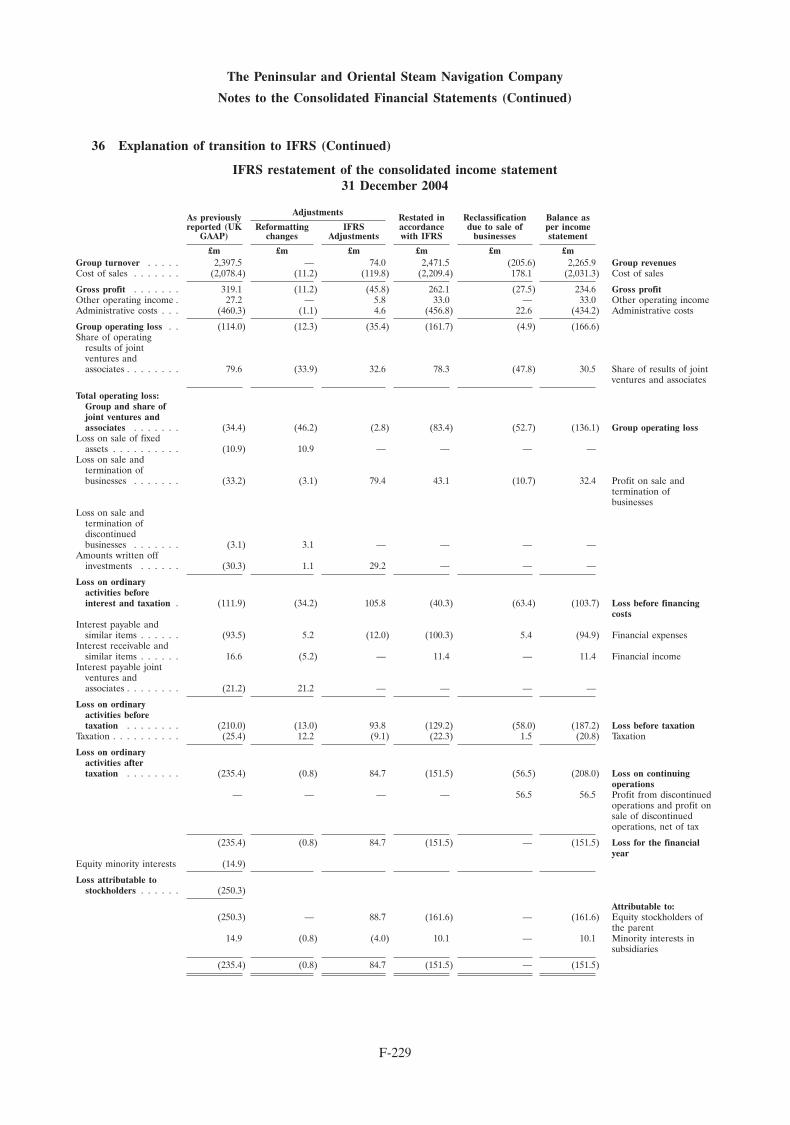
The Peninsular and Oriental Steam Navigation Company
Notes to the Consolidated Financial Statements (Continued)
36 Explanation of transition to IFRS (Continued)
IFRS restatement of the consolidated income statement31 December 2004
AdjustmentsAs previously Restated in Reclassification Balance asreported (UK Reformatting IFRS accordance due to sale of per income
GAAP) changes Adjustments with IFRS businesses statement
£m £m £m £m £m £mGroup turnover . . . . . 2,397.5 — 74.0 2,471.5 (205.6) 2,265.9 Group revenuesCost of sales . . . . . . . (2,078.4) (11.2) (119.8) (2,209.4) 178.1 (2,031.3) Cost of sales
Gross profit . . . . . . . 319.1 (11.2) (45.8) 262.1 (27.5) 234.6 Gross profitOther operating income . 27.2 — 5.8 33.0 — 33.0 Other operating incomeAdministrative costs . . . (460.3) (1.1) 4.6 (456.8) 22.6 (434.2) Administrative costs
Group operating loss . . (114.0) (12.3) (35.4) (161.7) (4.9) (166.6)Share of operating
results of jointventures andassociates . . . . . . . . 79.6 (33.9) 32.6 78.3 (47.8) 30.5 Share of results of joint
ventures and associates
Total operating loss:Group and share ofjoint ventures andassociates . . . . . . . (34.4) (46.2) (2.8) (83.4) (52.7) (136.1) Group operating loss
Loss on sale of fixedassets . . . . . . . . . . (10.9) 10.9 — — — —
Loss on sale andtermination ofbusinesses . . . . . . . (33.2) (3.1) 79.4 43.1 (10.7) 32.4 Profit on sale and
termination ofbusinesses
Loss on sale andtermination ofdiscontinuedbusinesses . . . . . . . (3.1) 3.1 — — — —
Amounts written offinvestments . . . . . . (30.3) 1.1 29.2 — — —
Loss on ordinaryactivities beforeinterest and taxation . (111.9) (34.2) 105.8 (40.3) (63.4) (103.7) Loss before financing
costsInterest payable and
similar items . . . . . . (93.5) 5.2 (12.0) (100.3) 5.4 (94.9) Financial expensesInterest receivable and
similar items . . . . . . 16.6 (5.2) — 11.4 — 11.4 Financial incomeInterest payable joint
ventures andassociates . . . . . . . . (21.2) 21.2 — — — —
Loss on ordinaryactivities beforetaxation . . . . . . . . (210.0) (13.0) 93.8 (129.2) (58.0) (187.2) Loss before taxation
Taxation . . . . . . . . . . (25.4) 12.2 (9.1) (22.3) 1.5 (20.8) Taxation
Loss on ordinaryactivities aftertaxation . . . . . . . . (235.4) (0.8) 84.7 (151.5) (56.5) (208.0) Loss on continuing
operations— — — — 56.5 56.5 Profit from discontinued
operations and profit onsale of discontinuedoperations, net of tax
(235.4) (0.8) 84.7 (151.5) — (151.5) Loss for the financialyear
Equity minority interests (14.9)
Loss attributable tostockholders . . . . . . (250.3)
Attributable to:(250.3) — 88.7 (161.6) — (161.6) Equity stockholders of
the parent14.9 (0.8) (4.0) 10.1 — 10.1 Minority interests in
subsidiaries
(235.4) (0.8) 84.7 (151.5) — (151.5)
F-229
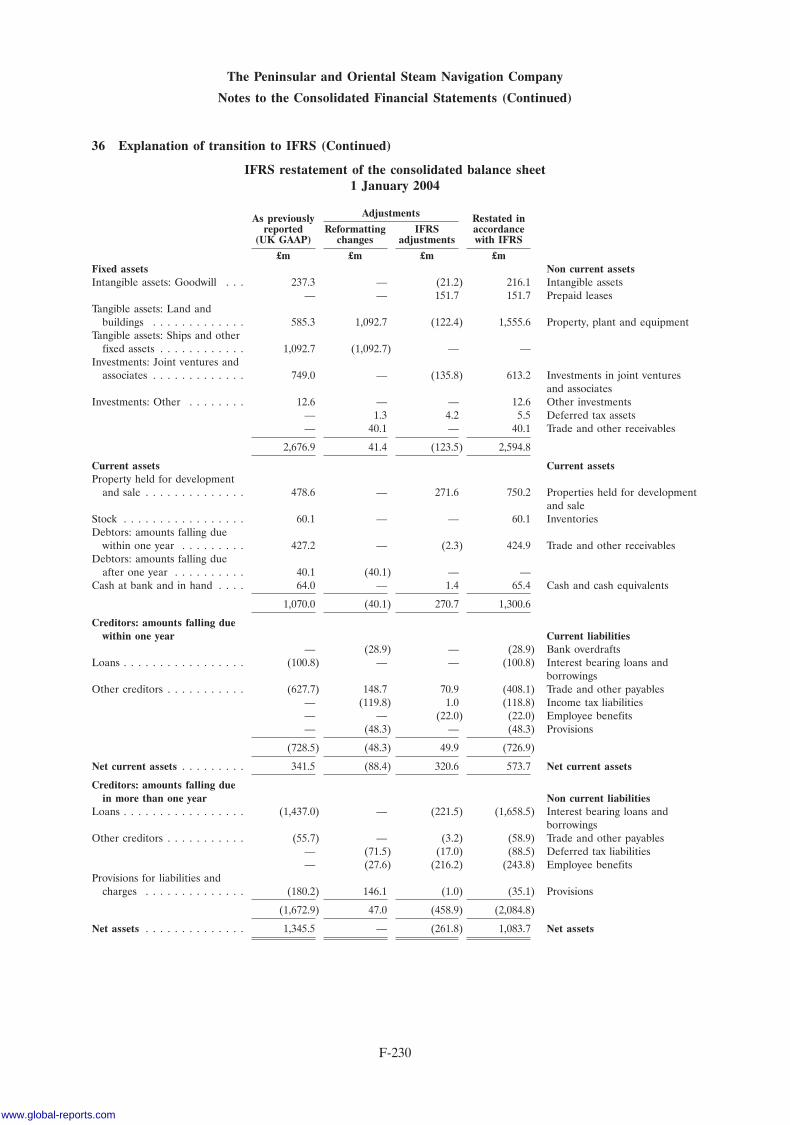
The Peninsular and Oriental Steam Navigation Company
Notes to the Consolidated Financial Statements (Continued)
36 Explanation of transition to IFRS (Continued)
IFRS restatement of the consolidated balance sheet1 January 2004
AdjustmentsAs previously Restated inreported Reformatting IFRS accordance
(UK GAAP) changes adjustments with IFRS
£m £m £m £mFixed assets Non current assetsIntangible assets: Goodwill . . . 237.3 — (21.2) 216.1 Intangible assets
— — 151.7 151.7 Prepaid leasesTangible assets: Land and
buildings . . . . . . . . . . . . . 585.3 1,092.7 (122.4) 1,555.6 Property, plant and equipmentTangible assets: Ships and other
fixed assets . . . . . . . . . . . . 1,092.7 (1,092.7) — —Investments: Joint ventures and
associates . . . . . . . . . . . . . 749.0 — (135.8) 613.2 Investments in joint venturesand associates
Investments: Other . . . . . . . . 12.6 — — 12.6 Other investments— 1.3 4.2 5.5 Deferred tax assets— 40.1 — 40.1 Trade and other receivables
2,676.9 41.4 (123.5) 2,594.8
Current assets Current assetsProperty held for development
and sale . . . . . . . . . . . . . . 478.6 — 271.6 750.2 Properties held for developmentand sale
Stock . . . . . . . . . . . . . . . . . 60.1 — — 60.1 InventoriesDebtors: amounts falling due
within one year . . . . . . . . . 427.2 — (2.3) 424.9 Trade and other receivablesDebtors: amounts falling due
after one year . . . . . . . . . . 40.1 (40.1) — —Cash at bank and in hand . . . . 64.0 — 1.4 65.4 Cash and cash equivalents
1,070.0 (40.1) 270.7 1,300.6
Creditors: amounts falling duewithin one year Current liabilities
— (28.9) — (28.9) Bank overdraftsLoans . . . . . . . . . . . . . . . . . (100.8) — — (100.8) Interest bearing loans and
borrowingsOther creditors . . . . . . . . . . . (627.7) 148.7 70.9 (408.1) Trade and other payables
— (119.8) 1.0 (118.8) Income tax liabilities— — (22.0) (22.0) Employee benefits— (48.3) — (48.3) Provisions
(728.5) (48.3) 49.9 (726.9)
Net current assets . . . . . . . . . 341.5 (88.4) 320.6 573.7 Net current assets
Creditors: amounts falling duein more than one year Non current liabilities
Loans . . . . . . . . . . . . . . . . . (1,437.0) — (221.5) (1,658.5) Interest bearing loans andborrowings
Other creditors . . . . . . . . . . . (55.7) — (3.2) (58.9) Trade and other payables— (71.5) (17.0) (88.5) Deferred tax liabilities— (27.6) (216.2) (243.8) Employee benefits
Provisions for liabilities andcharges . . . . . . . . . . . . . . (180.2) 146.1 (1.0) (35.1) Provisions
(1,672.9) 47.0 (458.9) (2,084.8)
Net assets . . . . . . . . . . . . . . 1,345.5 — (261.8) 1,083.7 Net assets
F-230
www.global-reports.com
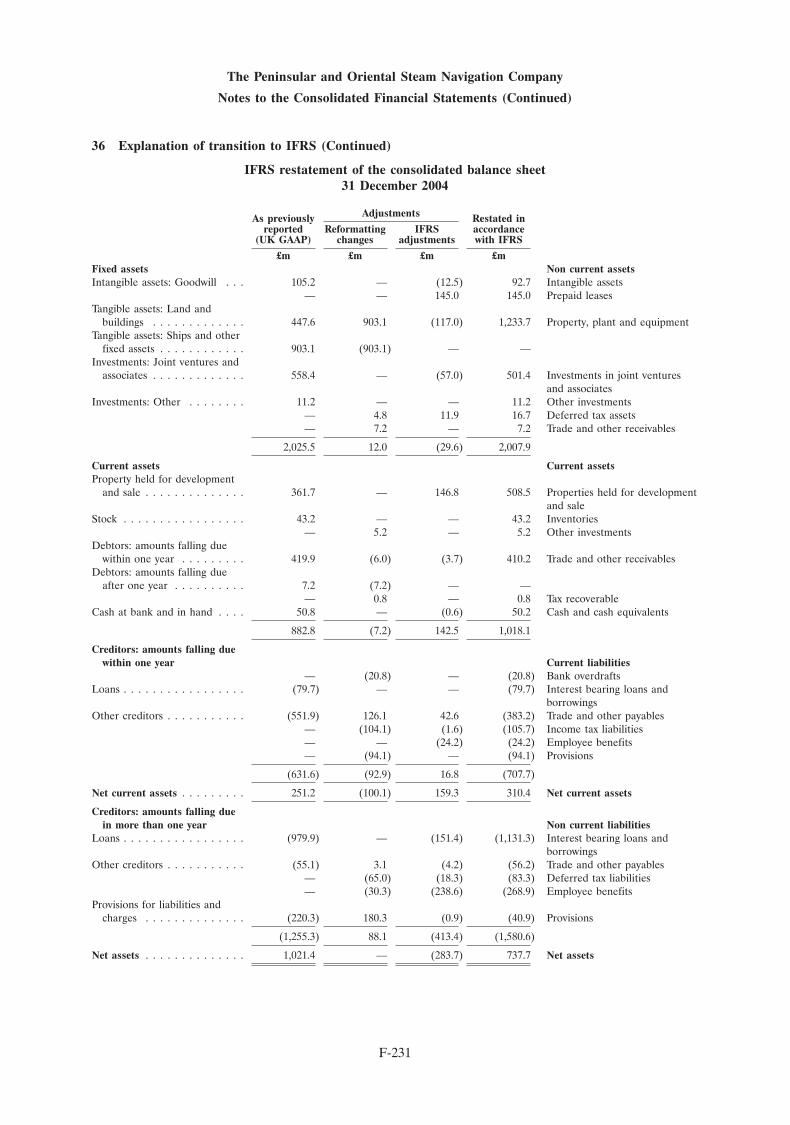
The Peninsular and Oriental Steam Navigation Company
Notes to the Consolidated Financial Statements (Continued)
36 Explanation of transition to IFRS (Continued)
IFRS restatement of the consolidated balance sheet31 December 2004
AdjustmentsAs previously Restated inreported Reformatting IFRS accordance
(UK GAAP) changes adjustments with IFRS
£m £m £m £mFixed assets Non current assetsIntangible assets: Goodwill . . . 105.2 — (12.5) 92.7 Intangible assets
— — 145.0 145.0 Prepaid leasesTangible assets: Land and
buildings . . . . . . . . . . . . . 447.6 903.1 (117.0) 1,233.7 Property, plant and equipmentTangible assets: Ships and other
fixed assets . . . . . . . . . . . . 903.1 (903.1) — —Investments: Joint ventures and
associates . . . . . . . . . . . . . 558.4 — (57.0) 501.4 Investments in joint venturesand associates
Investments: Other . . . . . . . . 11.2 — — 11.2 Other investments— 4.8 11.9 16.7 Deferred tax assets— 7.2 — 7.2 Trade and other receivables
2,025.5 12.0 (29.6) 2,007.9
Current assets Current assetsProperty held for development
and sale . . . . . . . . . . . . . . 361.7 — 146.8 508.5 Properties held for developmentand sale
Stock . . . . . . . . . . . . . . . . . 43.2 — — 43.2 Inventories— 5.2 — 5.2 Other investments
Debtors: amounts falling duewithin one year . . . . . . . . . 419.9 (6.0) (3.7) 410.2 Trade and other receivables
Debtors: amounts falling dueafter one year . . . . . . . . . . 7.2 (7.2) — —
— 0.8 — 0.8 Tax recoverableCash at bank and in hand . . . . 50.8 — (0.6) 50.2 Cash and cash equivalents
882.8 (7.2) 142.5 1,018.1
Creditors: amounts falling duewithin one year Current liabilities
— (20.8) — (20.8) Bank overdraftsLoans . . . . . . . . . . . . . . . . . (79.7) — — (79.7) Interest bearing loans and
borrowingsOther creditors . . . . . . . . . . . (551.9) 126.1 42.6 (383.2) Trade and other payables
— (104.1) (1.6) (105.7) Income tax liabilities— — (24.2) (24.2) Employee benefits— (94.1) — (94.1) Provisions
(631.6) (92.9) 16.8 (707.7)
Net current assets . . . . . . . . . 251.2 (100.1) 159.3 310.4 Net current assets
Creditors: amounts falling duein more than one year Non current liabilities
Loans . . . . . . . . . . . . . . . . . (979.9) — (151.4) (1,131.3) Interest bearing loans andborrowings
Other creditors . . . . . . . . . . . (55.1) 3.1 (4.2) (56.2) Trade and other payables— (65.0) (18.3) (83.3) Deferred tax liabilities— (30.3) (238.6) (268.9) Employee benefits
Provisions for liabilities andcharges . . . . . . . . . . . . . . (220.3) 180.3 (0.9) (40.9) Provisions
(1,255.3) 88.1 (413.4) (1,580.6)
Net assets . . . . . . . . . . . . . . 1,021.4 — (283.7) 737.7 Net assets
F-231
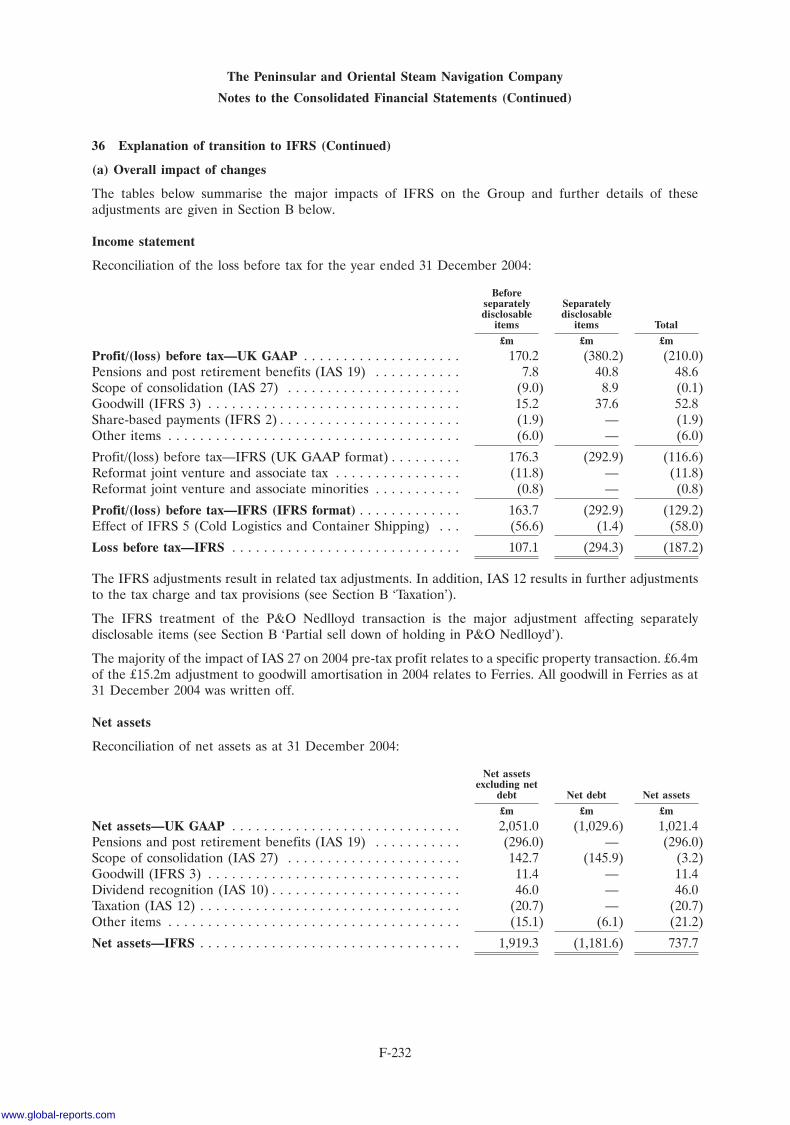
The Peninsular and Oriental Steam Navigation Company
Notes to the Consolidated Financial Statements (Continued)
36 Explanation of transition to IFRS (Continued)
(a) Overall impact of changes
The tables below summarise the major impacts of IFRS on the Group and further details of theseadjustments are given in Section B below.
Income statement
Reconciliation of the loss before tax for the year ended 31 December 2004:
Beforeseparately Separatelydisclosable disclosable
items items Total
£m £m £m
Profit/(loss) before tax—UK GAAP . . . . . . . . . . . . . . . . . . . . 170.2 (380.2) (210.0)Pensions and post retirement benefits (IAS 19) . . . . . . . . . . . 7.8 40.8 48.6Scope of consolidation (IAS 27) . . . . . . . . . . . . . . . . . . . . . . (9.0) 8.9 (0.1)Goodwill (IFRS 3) . . . . . . . . . . . . . . . . . . . . . . . . . . . . . . . . 15.2 37.6 52.8Share-based payments (IFRS 2) . . . . . . . . . . . . . . . . . . . . . . . (1.9) — (1.9)Other items . . . . . . . . . . . . . . . . . . . . . . . . . . . . . . . . . . . . . (6.0) — (6.0)
Profit/(loss) before tax—IFRS (UK GAAP format) . . . . . . . . . 176.3 (292.9) (116.6)Reformat joint venture and associate tax . . . . . . . . . . . . . . . . (11.8) — (11.8)Reformat joint venture and associate minorities . . . . . . . . . . . (0.8) — (0.8)
Profit/(loss) before tax—IFRS (IFRS format) . . . . . . . . . . . . . 163.7 (292.9) (129.2)Effect of IFRS 5 (Cold Logistics and Container Shipping) . . . (56.6) (1.4) (58.0)
Loss before tax—IFRS . . . . . . . . . . . . . . . . . . . . . . . . . . . . . 107.1 (294.3) (187.2)
The IFRS adjustments result in related tax adjustments. In addition, IAS 12 results in further adjustmentsto the tax charge and tax provisions (see Section B ‘Taxation’).
The IFRS treatment of the P&O Nedlloyd transaction is the major adjustment affecting separatelydisclosable items (see Section B ‘Partial sell down of holding in P&O Nedlloyd’).
The majority of the impact of IAS 27 on 2004 pre-tax profit relates to a specific property transaction. £6.4mof the £15.2m adjustment to goodwill amortisation in 2004 relates to Ferries. All goodwill in Ferries as at31 December 2004 was written off.
Net assets
Reconciliation of net assets as at 31 December 2004:
Net assetsexcluding net
debt Net debt Net assets
£m £m £m
Net assets—UK GAAP . . . . . . . . . . . . . . . . . . . . . . . . . . . . . 2,051.0 (1,029.6) 1,021.4Pensions and post retirement benefits (IAS 19) . . . . . . . . . . . (296.0) — (296.0)Scope of consolidation (IAS 27) . . . . . . . . . . . . . . . . . . . . . . 142.7 (145.9) (3.2)Goodwill (IFRS 3) . . . . . . . . . . . . . . . . . . . . . . . . . . . . . . . . 11.4 — 11.4Dividend recognition (IAS 10) . . . . . . . . . . . . . . . . . . . . . . . . 46.0 — 46.0Taxation (IAS 12) . . . . . . . . . . . . . . . . . . . . . . . . . . . . . . . . . (20.7) — (20.7)Other items . . . . . . . . . . . . . . . . . . . . . . . . . . . . . . . . . . . . . (15.1) (6.1) (21.2)
Net assets—IFRS . . . . . . . . . . . . . . . . . . . . . . . . . . . . . . . . . 1,919.3 (1,181.6) 737.7
F-232
www.global-reports.com
The Peninsular and Oriental Steam Navigation Company
Notes to the Consolidated Financial Statements (Continued)
36 Explanation of transition to IFRS (Continued)
Cash flow
IFRS accounting adjustments have no impact on the Group’s actual cash flow. However, thereclassification of certain balance sheet items slightly changes the reported cash equivalent balance and, ascan be seen from the net asset statement above, the change to the scope of consolidation increases theGroup’s borrowings (see Section B ‘Scope of consolidation’).
(b) Changes in accounting policies
The significant changes in the Group’s accounting policies required by IFRS are set out below.
Presentation of financial statements
The Group’s financial statements have been presented in accordance with IAS 1 ‘Presentation of FinancialStatements’.
The major impact on the income statement is in the presentation of the Group’s share of the results ofassociates and equity accounted joint ventures as a single line item. Under UK GAAP, the Group’s share ofoperating results, interest, taxation and minorities were reported separately within the relevant sub totalsof the Group’s profit and loss statement. Thus under IFRS the Group’s share of the taxation and minorityinterests of joint ventures and associates is included in profit before taxation. This does not affect the profitattributable to stockholders.
The format of the balance sheet has been changed to reflect the items required by IAS 1 to be disclosed onthe face of the balance sheet and a number of other reclassifications.
These presentational changes are set out on pages F-229 to F-231 which reconciles the UK GAAP formatto the IFRS format before the IFRS accounting policy adjustments described in the remainder of thissection.
Transitional arrangements
IFRS 1 sets out the rules for first time adoption of IFRS. In general, these require a company to determineits IFRS accounting policies and then apply those retrospectively to determine its opening or ‘transitionbalance sheet’. There are, however, certain exemptions to this general transitional requirement which theGroup has adopted as follows:
� The Group has elected not to restate business combinations that took place before the transitiondate
� In some cases the latest valuations of property at the transition date have been used as deemedcost and property will no longer be revalued
� The Group has taken advantage of the exemption available under IFRS to ‘zero’ the foreigncurrency translation reserve at transition date
� The Group has applied the exemption available under IFRS 1 that allows for comparatives not tobe restated for IAS 32 and IAS 39
� IFRS 5 has been applied prospectively from 1 January 2005
Pensions and other post retirement benefits
IAS 19 ‘Employee Benefits’ requires defined benefit pension fund surpluses and deficits to be recognisedon the balance sheet and separate recognition of the operating and financing costs of the schemes withinthe income statement. There are a number of options for the recognition of any actuarial gains and losseswhich arise and the Group has adopted the policy to recognise any variations in full in the statement ofrecognised income and expense.
These accounting treatments have no impact on the cash funding of the schemes.
F-233
The Peninsular and Oriental Steam Navigation Company
Notes to the Consolidated Financial Statements (Continued)
36 Explanation of transition to IFRS (Continued)
The impact of IAS 19 can be summarised as follows:
Year ended31 December
2004
£m
Income statementOperating loss . . . . . . . . . . . . . . . . . . . . . . . . . . . . . . . . . . . . . . . . . . . . . . . . . . . . . . . 13.5Share of result of joint ventures and associates . . . . . . . . . . . . . . . . . . . . . . . . . . . . . . . . 1.2Net financing costs . . . . . . . . . . . . . . . . . . . . . . . . . . . . . . . . . . . . . . . . . . . . . . . . . . . . (1.5)Loss on sale of businesses . . . . . . . . . . . . . . . . . . . . . . . . . . . . . . . . . . . . . . . . . . . . . . . 35.4
Adjustment to loss before taxation . . . . . . . . . . . . . . . . . . . . . . . . . . . . . . . . . . . . . . . . . 48.6Related taxation adjustment . . . . . . . . . . . . . . . . . . . . . . . . . . . . . . . . . . . . . . . . . . . . . (2.2)
Adjustment to loss after taxation . . . . . . . . . . . . . . . . . . . . . . . . . . . . . . . . . . . . . . . . . . 46.4
Adjustment to loss before taxation analysed asBefore separately disclosable items . . . . . . . . . . . . . . . . . . . . . . . . . . . . . . . . . . . . . . . . 7.8Separately disclosable items . . . . . . . . . . . . . . . . . . . . . . . . . . . . . . . . . . . . . . . . . . . . . . 40.8
48.6
At At1 January 31 December
2004 2004
£m £m
Net assetsWrite back SSAP 24 balances . . . . . . . . . . . . . . . . . . . . . . . . . . . . . . . . . . 6.1 (10.6)Include pension holiday prepayment . . . . . . . . . . . . . . . . . . . . . . . . . . . . . — 5.3Include IAS 19 pension liability:
Main P&O pension scheme . . . . . . . . . . . . . . . . . . . . . . . . . . . . . . . . . . (218.7) (242.0)Share of P&O Nedlloyd pension schemes* . . . . . . . . . . . . . . . . . . . . . . . (69.5) (39.4)
Other pension schemes and benefits . . . . . . . . . . . . . . . . . . . . . . . . . . . . . (22.1) (23.0)
(304.2) (309.7)Related taxation adjustment . . . . . . . . . . . . . . . . . . . . . . . . . . . . . . . . . . . 9.7 13.7
Adjustment to net assets . . . . . . . . . . . . . . . . . . . . . . . . . . . . . . . . . . . . . . (294.5) (296.0)
* Included within investments in joint ventures and associates
For 2004 under IFRS, the Group continued to account for the two merchant navy industry-wide schemes(the MNOPF and the MNRPF) on a cash basis as if they were defined contribution schemes. However,following the court decision in 2005, in respect of the MNOPF the Group has sufficient information toaccount for its share of the scheme as a defined benefit scheme under IAS 19 and recognise its share of thedeficit on the balance sheet for 2005. Page F-216 outlines in detail the effect of the court case on theGroup in 2005.
The deficit on the main P&O scheme is higher than that disclosed under UK GAAP (FRS 17) due to theadoption of bid values for the scheme assets and the capitalisation of the present value of the futurescheme administration costs associated with past benefit accruals.
Scope of consolidation
IAS 27 ‘Consolidated and Separate Financial Statements’ requires that the ‘power to control’ is consideredin determining whether an entity should be consolidated, which is a broader definition than under UKGAAP. The Group reviewed the facts and circumstances of all of its investments at the transition date andconcluded that there was one entity, the Hanseatic Trade Center (‘HTC’), which was accounted for as a47.5 per cent associate under UK GAAP where the existence of certain options over the interests of the
F-234
www.global-reports.com
The Peninsular and Oriental Steam Navigation Company
Notes to the Consolidated Financial Statements (Continued)
36 Explanation of transition to IFRS (Continued)
other partners need to be taken into account under IFRS. Hence the entity has been consolidated as asubsidiary under IFRS. For the Company financial statements which are still being prepared under UKGAAP HTC is treated as an associate.
The impact of the change can be summarised as follows:
Year ended31 December
2004
£m
Income statementOperating loss . . . . . . . . . . . . . . . . . . . . . . . . . . . . . . . . . . . . . . . . . . . . . . . . . . . . . . . (52.2)Share of loss of joint ventures and associates pre-tax . . . . . . . . . . . . . . . . . . . . . . . . . . . 32.8Amounts written off investments . . . . . . . . . . . . . . . . . . . . . . . . . . . . . . . . . . . . . . . . . . 29.2Net financing costs . . . . . . . . . . . . . . . . . . . . . . . . . . . . . . . . . . . . . . . . . . . . . . . . . . . . (9.9)
Adjustment to loss before taxation . . . . . . . . . . . . . . . . . . . . . . . . . . . . . . . . . . . . . . . . . (0.1)Share of joint ventures and associates tax . . . . . . . . . . . . . . . . . . . . . . . . . . . . . . . . . . . . 0.4
Adjustment to IFRS loss before taxation . . . . . . . . . . . . . . . . . . . . . . . . . . . . . . . . . . . . 0.3Related taxation adjustment . . . . . . . . . . . . . . . . . . . . . . . . . . . . . . . . . . . . . . . . . . . . . (0.8)
Adjustment to loss after taxation . . . . . . . . . . . . . . . . . . . . . . . . . . . . . . . . . . . . . . . . . . (0.5)
Adjustment to loss before taxation analysed asBefore separately disclosable items . . . . . . . . . . . . . . . . . . . . . . . . . . . . . . . . . . . . . . . . (9.0)Separately disclosable items . . . . . . . . . . . . . . . . . . . . . . . . . . . . . . . . . . . . . . . . . . . . . . 8.9
(0.1)
At At1 January 31 December
2004 2004
£m £m
Net assetsMovement in joint ventures and associates . . . . . . . . . . . . . . . . . . . . . . . . . (54.1) 1.1Increase in property held for development and sale . . . . . . . . . . . . . . . . . . 271.6 146.8Decrease in net current assets . . . . . . . . . . . . . . . . . . . . . . . . . . . . . . . . . . (1.7) (4.3)Increase in borrowings . . . . . . . . . . . . . . . . . . . . . . . . . . . . . . . . . . . . . . . (217.2) (145.2)
(1.4) (1.6)Related taxation adjustment . . . . . . . . . . . . . . . . . . . . . . . . . . . . . . . . . . . (1.0) (1.6)
Adjustment to net assets . . . . . . . . . . . . . . . . . . . . . . . . . . . . . . . . . . . . . . (2.4) (3.2)
The HTC property was sold during 2005. Under IFRS, the cash proceeds of approximately A200m (£140m)were recognised in the Group’s cash flow statement.
Goodwill and business combinations
IFRS 3 ‘Business Combinations’ prohibits the amortisation of goodwill. It requires goodwill to be carriedat cost with an annual impairment test performed. Under IFRS goodwill previously written off to reservesis not ‘clawed back’ when the relevant business is sold, as it was under UK GAAP.
The Group has elected to adopt the exemption available under IFRS 1 and has applied IFRS 3prospectively from the transition date. This results in the value of any goodwill being frozen at thetransition date and any amortisation previously charged in the year ended 31 December 2004 beingreversed as part of the IFRS restatement.
F-235
The Peninsular and Oriental Steam Navigation Company
Notes to the Consolidated Financial Statements (Continued)
36 Explanation of transition to IFRS (Continued)
The impact of these changes can be summarised as follows:
Year ended31 December
2004
£m
Income statementReversal of goodwill amortisation in subsidiaries . . . . . . . . . . . . . . . . . . . . . . . . . . . . . . . 12.9Movements in negative goodwill . . . . . . . . . . . . . . . . . . . . . . . . . . . . . . . . . . . . . . . . . . (0.4)Reversal of goodwill amortisation in joint ventures and associates . . . . . . . . . . . . . . . . . . 2.1Reversal of goodwill clawback on sale of businesses . . . . . . . . . . . . . . . . . . . . . . . . . . . . 44.6Additional impairment of goodwill . . . . . . . . . . . . . . . . . . . . . . . . . . . . . . . . . . . . . . . . . (6.4)
Adjustment to loss before taxation . . . . . . . . . . . . . . . . . . . . . . . . . . . . . . . . . . . . . . . . . 52.8Related taxation adjustment . . . . . . . . . . . . . . . . . . . . . . . . . . . . . . . . . . . . . . . . . . . . . —Adjustment to loss after taxation . . . . . . . . . . . . . . . . . . . . . . . . . . . . . . . . . . . . . . . . . . 52.8
Adjustment to loss before taxation analysed asBefore separately disclosable items . . . . . . . . . . . . . . . . . . . . . . . . . . . . . . . . . . . . . . . . 15.2Separately disclosable items . . . . . . . . . . . . . . . . . . . . . . . . . . . . . . . . . . . . . . . . . . . . . . 37.6
52.8
At At1 January 31 December
2004 2004
£m £m
Net assetsReversal of goodwill amortisation . . . . . . . . . . . . . . . . . . . . . . . . . . . . . . . — 12.9Additional impairment of goodwill . . . . . . . . . . . . . . . . . . . . . . . . . . . . . . . (0.9) (7.1)Adjustments to goodwill within joint ventures and associates . . . . . . . . . . . . 0.2 1.8Write back negative goodwill . . . . . . . . . . . . . . . . . . . . . . . . . . . . . . . . . . . 4.5 3.8
3.8 11.4Related taxation adjustment . . . . . . . . . . . . . . . . . . . . . . . . . . . . . . . . . . . — —
Adjustment to net assets . . . . . . . . . . . . . . . . . . . . . . . . . . . . . . . . . . . . . . 3.8 11.4
Dividend recognition
Under IAS 10 ‘Events After the Balance Sheet Date’ dividends are not recognised until they are declared.As a result the accrued final dividend on deferred stock has been reversed. This adjustment has increasednet assets by £67.7m at 1 January 2004 and £46.0m at 31 December 2004.
Share-based payments
The approach to share-based payments is different to that previously applied under UK GAAP. IFRS 2‘Share-based Payment’ requires that a fair value charge is made to the income statement for all share-based payments granted to employees since 7 November 2002.
The impact of this treatment is a charge to the income statement of £1.9m in 2004. There is no material taximpact and no impact on net assets.
Taxation
The taxation impact of each of the IFRS adjustments has been included within the details of the relevantadjustment above.
F-236
www.global-reports.com
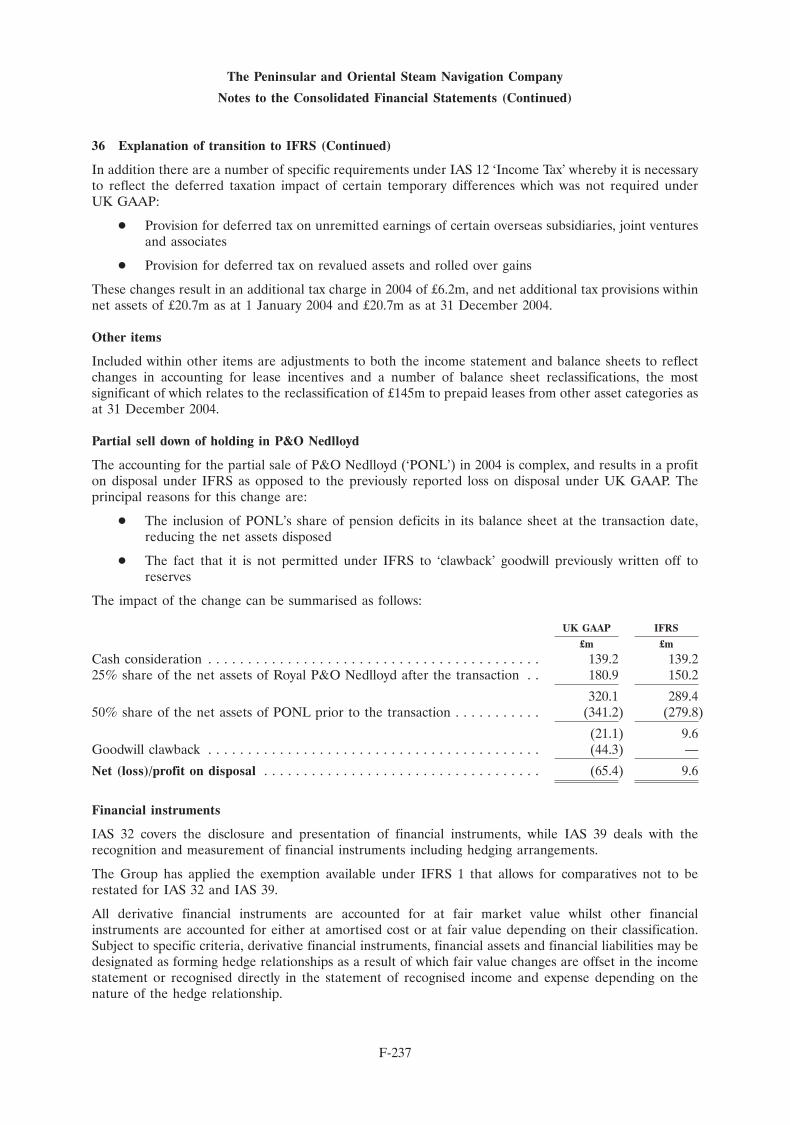
The Peninsular and Oriental Steam Navigation Company
Notes to the Consolidated Financial Statements (Continued)
36 Explanation of transition to IFRS (Continued)
In addition there are a number of specific requirements under IAS 12 ‘Income Tax’ whereby it is necessaryto reflect the deferred taxation impact of certain temporary differences which was not required underUK GAAP:
� Provision for deferred tax on unremitted earnings of certain overseas subsidiaries, joint venturesand associates
� Provision for deferred tax on revalued assets and rolled over gains
These changes result in an additional tax charge in 2004 of £6.2m, and net additional tax provisions withinnet assets of £20.7m as at 1 January 2004 and £20.7m as at 31 December 2004.
Other items
Included within other items are adjustments to both the income statement and balance sheets to reflectchanges in accounting for lease incentives and a number of balance sheet reclassifications, the mostsignificant of which relates to the reclassification of £145m to prepaid leases from other asset categories asat 31 December 2004.
Partial sell down of holding in P&O Nedlloyd
The accounting for the partial sale of P&O Nedlloyd (‘PONL’) in 2004 is complex, and results in a profiton disposal under IFRS as opposed to the previously reported loss on disposal under UK GAAP. Theprincipal reasons for this change are:
� The inclusion of PONL’s share of pension deficits in its balance sheet at the transaction date,reducing the net assets disposed
� The fact that it is not permitted under IFRS to ‘clawback’ goodwill previously written off toreserves
The impact of the change can be summarised as follows:
UK GAAP IFRS
£m £m
Cash consideration . . . . . . . . . . . . . . . . . . . . . . . . . . . . . . . . . . . . . . . . . . 139.2 139.225% share of the net assets of Royal P&O Nedlloyd after the transaction . . 180.9 150.2
320.1 289.450% share of the net assets of PONL prior to the transaction . . . . . . . . . . . (341.2) (279.8)
(21.1) 9.6Goodwill clawback . . . . . . . . . . . . . . . . . . . . . . . . . . . . . . . . . . . . . . . . . . (44.3) —
Net (loss)/profit on disposal . . . . . . . . . . . . . . . . . . . . . . . . . . . . . . . . . . . (65.4) 9.6
Financial instruments
IAS 32 covers the disclosure and presentation of financial instruments, while IAS 39 deals with therecognition and measurement of financial instruments including hedging arrangements.
The Group has applied the exemption available under IFRS 1 that allows for comparatives not to berestated for IAS 32 and IAS 39.
All derivative financial instruments are accounted for at fair market value whilst other financialinstruments are accounted for either at amortised cost or at fair value depending on their classification.Subject to specific criteria, derivative financial instruments, financial assets and financial liabilities may bedesignated as forming hedge relationships as a result of which fair value changes are offset in the incomestatement or recognised directly in the statement of recognised income and expense depending on thenature of the hedge relationship.
F-237
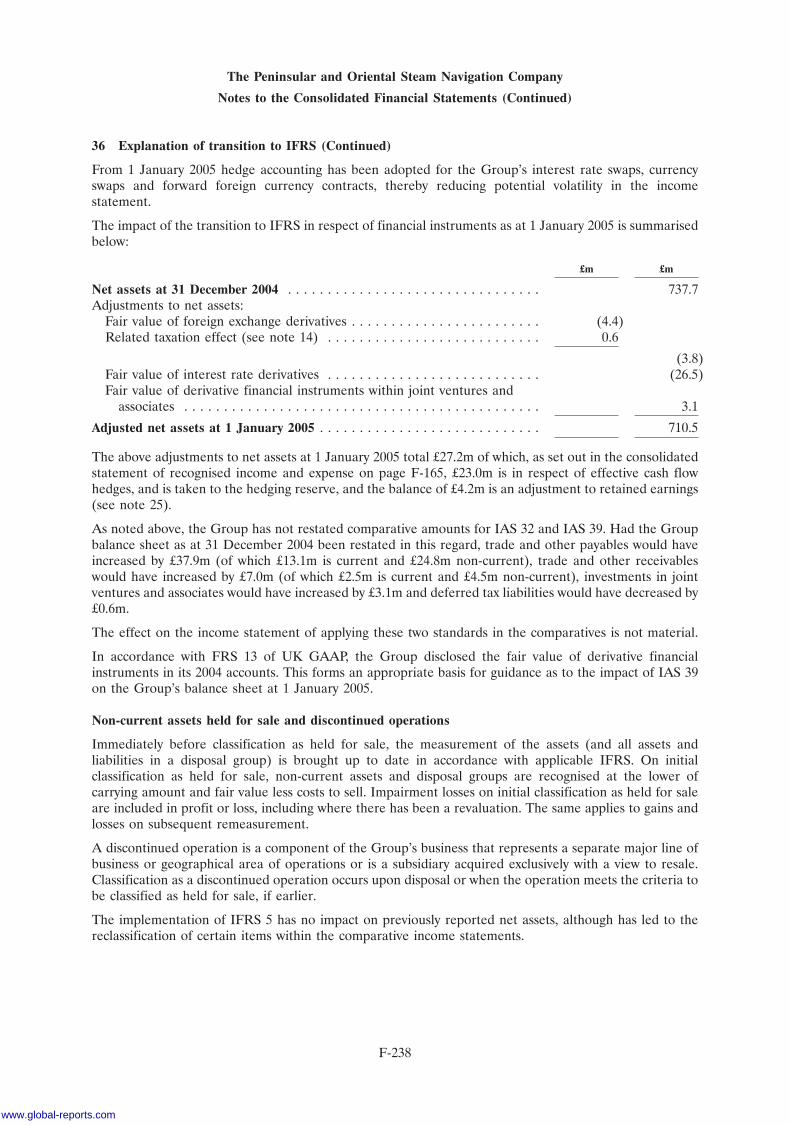
The Peninsular and Oriental Steam Navigation Company
Notes to the Consolidated Financial Statements (Continued)
36 Explanation of transition to IFRS (Continued)
From 1 January 2005 hedge accounting has been adopted for the Group’s interest rate swaps, currencyswaps and forward foreign currency contracts, thereby reducing potential volatility in the incomestatement.
The impact of the transition to IFRS in respect of financial instruments as at 1 January 2005 is summarisedbelow:
£m £m
Net assets at 31 December 2004 . . . . . . . . . . . . . . . . . . . . . . . . . . . . . . . . 737.7Adjustments to net assets:
Fair value of foreign exchange derivatives . . . . . . . . . . . . . . . . . . . . . . . . (4.4)Related taxation effect (see note 14) . . . . . . . . . . . . . . . . . . . . . . . . . . . 0.6
(3.8)Fair value of interest rate derivatives . . . . . . . . . . . . . . . . . . . . . . . . . . . (26.5)Fair value of derivative financial instruments within joint ventures and
associates . . . . . . . . . . . . . . . . . . . . . . . . . . . . . . . . . . . . . . . . . . . . . 3.1
Adjusted net assets at 1 January 2005 . . . . . . . . . . . . . . . . . . . . . . . . . . . . 710.5
The above adjustments to net assets at 1 January 2005 total £27.2m of which, as set out in the consolidatedstatement of recognised income and expense on page F-165, £23.0m is in respect of effective cash flowhedges, and is taken to the hedging reserve, and the balance of £4.2m is an adjustment to retained earnings(see note 25).
As noted above, the Group has not restated comparative amounts for IAS 32 and IAS 39. Had the Groupbalance sheet as at 31 December 2004 been restated in this regard, trade and other payables would haveincreased by £37.9m (of which £13.1m is current and £24.8m non-current), trade and other receivableswould have increased by £7.0m (of which £2.5m is current and £4.5m non-current), investments in jointventures and associates would have increased by £3.1m and deferred tax liabilities would have decreased by£0.6m.
The effect on the income statement of applying these two standards in the comparatives is not material.
In accordance with FRS 13 of UK GAAP, the Group disclosed the fair value of derivative financialinstruments in its 2004 accounts. This forms an appropriate basis for guidance as to the impact of IAS 39on the Group’s balance sheet at 1 January 2005.
Non-current assets held for sale and discontinued operations
Immediately before classification as held for sale, the measurement of the assets (and all assets andliabilities in a disposal group) is brought up to date in accordance with applicable IFRS. On initialclassification as held for sale, non-current assets and disposal groups are recognised at the lower ofcarrying amount and fair value less costs to sell. Impairment losses on initial classification as held for saleare included in profit or loss, including where there has been a revaluation. The same applies to gains andlosses on subsequent remeasurement.
A discontinued operation is a component of the Group’s business that represents a separate major line ofbusiness or geographical area of operations or is a subsidiary acquired exclusively with a view to resale.Classification as a discontinued operation occurs upon disposal or when the operation meets the criteria tobe classified as held for sale, if earlier.
The implementation of IFRS 5 has no impact on previously reported net assets, although has led to thereclassification of certain items within the comparative income statements.
F-238
www.global-reports.com
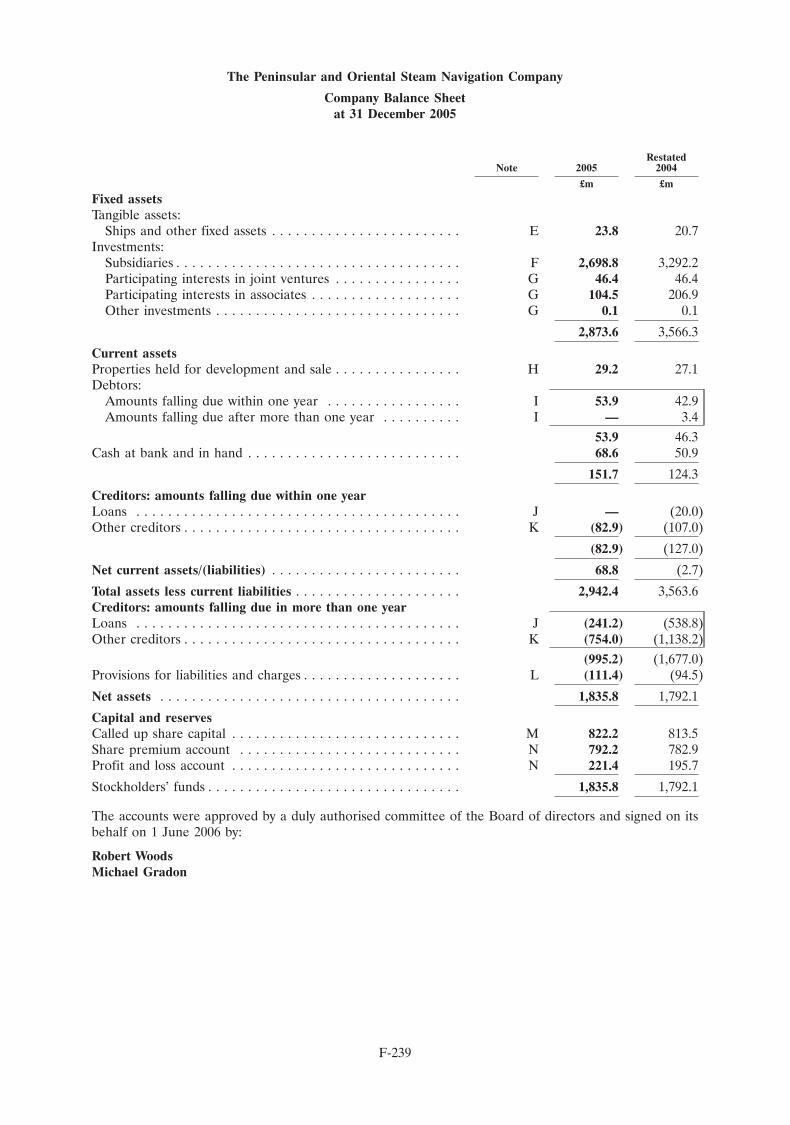
The Peninsular and Oriental Steam Navigation Company
Company Balance Sheetat 31 December 2005
RestatedNote 2005 2004
£m £m
Fixed assetsTangible assets:
Ships and other fixed assets . . . . . . . . . . . . . . . . . . . . . . . . E 23.8 20.7Investments:
Subsidiaries . . . . . . . . . . . . . . . . . . . . . . . . . . . . . . . . . . . . F 2,698.8 3,292.2Participating interests in joint ventures . . . . . . . . . . . . . . . . G 46.4 46.4Participating interests in associates . . . . . . . . . . . . . . . . . . . G 104.5 206.9Other investments . . . . . . . . . . . . . . . . . . . . . . . . . . . . . . . G 0.1 0.1
2,873.6 3,566.3
Current assetsProperties held for development and sale . . . . . . . . . . . . . . . . H 29.2 27.1Debtors:
Amounts falling due within one year . . . . . . . . . . . . . . . . . I 53.9 42.9Amounts falling due after more than one year . . . . . . . . . . I — 3.4
53.9 46.3Cash at bank and in hand . . . . . . . . . . . . . . . . . . . . . . . . . . . 68.6 50.9
151.7 124.3
Creditors: amounts falling due within one yearLoans . . . . . . . . . . . . . . . . . . . . . . . . . . . . . . . . . . . . . . . . . J — (20.0)Other creditors . . . . . . . . . . . . . . . . . . . . . . . . . . . . . . . . . . . K (82.9) (107.0)
(82.9) (127.0)
Net current assets/(liabilities) . . . . . . . . . . . . . . . . . . . . . . . . 68.8 (2.7)
Total assets less current liabilities . . . . . . . . . . . . . . . . . . . . . 2,942.4 3,563.6Creditors: amounts falling due in more than one yearLoans . . . . . . . . . . . . . . . . . . . . . . . . . . . . . . . . . . . . . . . . . J (241.2) (538.8)Other creditors . . . . . . . . . . . . . . . . . . . . . . . . . . . . . . . . . . . K (754.0) (1,138.2)
(995.2) (1,677.0)Provisions for liabilities and charges . . . . . . . . . . . . . . . . . . . . L (111.4) (94.5)
Net assets . . . . . . . . . . . . . . . . . . . . . . . . . . . . . . . . . . . . . . 1,835.8 1,792.1
Capital and reservesCalled up share capital . . . . . . . . . . . . . . . . . . . . . . . . . . . . . M 822.2 813.5Share premium account . . . . . . . . . . . . . . . . . . . . . . . . . . . . N 792.2 782.9Profit and loss account . . . . . . . . . . . . . . . . . . . . . . . . . . . . . N 221.4 195.7
Stockholders’ funds . . . . . . . . . . . . . . . . . . . . . . . . . . . . . . . . 1,835.8 1,792.1
The accounts were approved by a duly authorised committee of the Board of directors and signed on itsbehalf on 1 June 2006 by:
Robert WoodsMichael Gradon
F-239
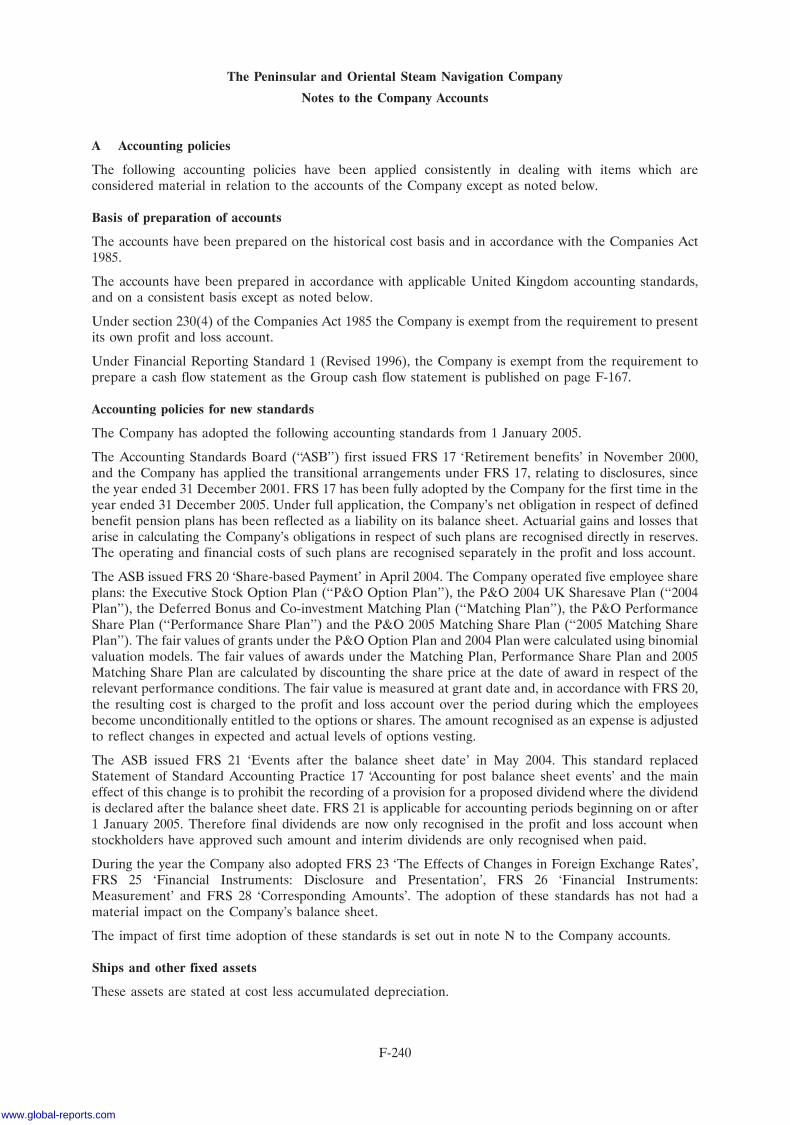
The Peninsular and Oriental Steam Navigation Company
Notes to the Company Accounts
A Accounting policies
The following accounting policies have been applied consistently in dealing with items which areconsidered material in relation to the accounts of the Company except as noted below.
Basis of preparation of accounts
The accounts have been prepared on the historical cost basis and in accordance with the Companies Act1985.
The accounts have been prepared in accordance with applicable United Kingdom accounting standards,and on a consistent basis except as noted below.
Under section 230(4) of the Companies Act 1985 the Company is exempt from the requirement to presentits own profit and loss account.
Under Financial Reporting Standard 1 (Revised 1996), the Company is exempt from the requirement toprepare a cash flow statement as the Group cash flow statement is published on page F-167.
Accounting policies for new standards
The Company has adopted the following accounting standards from 1 January 2005.
The Accounting Standards Board (‘‘ASB’’) first issued FRS 17 ‘Retirement benefits’ in November 2000,and the Company has applied the transitional arrangements under FRS 17, relating to disclosures, sincethe year ended 31 December 2001. FRS 17 has been fully adopted by the Company for the first time in theyear ended 31 December 2005. Under full application, the Company’s net obligation in respect of definedbenefit pension plans has been reflected as a liability on its balance sheet. Actuarial gains and losses thatarise in calculating the Company’s obligations in respect of such plans are recognised directly in reserves.The operating and financial costs of such plans are recognised separately in the profit and loss account.
The ASB issued FRS 20 ‘Share-based Payment’ in April 2004. The Company operated five employee shareplans: the Executive Stock Option Plan (‘‘P&O Option Plan’’), the P&O 2004 UK Sharesave Plan (‘‘2004Plan’’), the Deferred Bonus and Co-investment Matching Plan (‘‘Matching Plan’’), the P&O PerformanceShare Plan (‘‘Performance Share Plan’’) and the P&O 2005 Matching Share Plan (‘‘2005 Matching SharePlan’’). The fair values of grants under the P&O Option Plan and 2004 Plan were calculated using binomialvaluation models. The fair values of awards under the Matching Plan, Performance Share Plan and 2005Matching Share Plan are calculated by discounting the share price at the date of award in respect of therelevant performance conditions. The fair value is measured at grant date and, in accordance with FRS 20,the resulting cost is charged to the profit and loss account over the period during which the employeesbecome unconditionally entitled to the options or shares. The amount recognised as an expense is adjustedto reflect changes in expected and actual levels of options vesting.
The ASB issued FRS 21 ‘Events after the balance sheet date’ in May 2004. This standard replacedStatement of Standard Accounting Practice 17 ‘Accounting for post balance sheet events’ and the maineffect of this change is to prohibit the recording of a provision for a proposed dividend where the dividendis declared after the balance sheet date. FRS 21 is applicable for accounting periods beginning on or after1 January 2005. Therefore final dividends are now only recognised in the profit and loss account whenstockholders have approved such amount and interim dividends are only recognised when paid.
During the year the Company also adopted FRS 23 ‘The Effects of Changes in Foreign Exchange Rates’,FRS 25 ‘Financial Instruments: Disclosure and Presentation’, FRS 26 ‘Financial Instruments:Measurement’ and FRS 28 ‘Corresponding Amounts’. The adoption of these standards has not had amaterial impact on the Company’s balance sheet.
The impact of first time adoption of these standards is set out in note N to the Company accounts.
Ships and other fixed assets
These assets are stated at cost less accumulated depreciation.
F-240
www.global-reports.com
The Peninsular and Oriental Steam Navigation Company
Notes to the Company Accounts (Continued)
A Accounting policies (Continued)
Assets acquired under finance leases are stated at cost less accumulated depreciation, the future capitalpayments being included in loans.
Depreciation is calculated to write off the cost of these assets to estimated residual value, on a straight linebasis over the expected useful life of the asset concerned. Generally for ships this is between 10 and35 years, and for other fixed assets (reported within plant and machinery, fixtures and fittings) variousperiods of up to 40 years.
Provision for any impairment in value of ships and other fixed assets is made in the profit and loss account.
Assets constructed by the Company are depreciated from the date on which they come into use. Interestincurred in respect of assets under construction is capitalised into the cost of the asset concerned.
Properties held for development and sale
Properties held for development and sale are included in current assets at the lower of cost and netrealisable value.
Turnover
Turnover comprises amounts derived from the provision of goods and services to third parties (excludingVAT and similar sales taxes). Turnover from the provision of services is recognised on the delivery of thoseservices.
Leases
Ships, plant and machinery and land and buildings financed by leasing agreements giving rightsapproximating to ownership are capitalised as tangible fixed assets at cost less accumulated depreciation.The capital element of future lease payments is treated as a liability. The interest element is charged to theprofit and loss account over the period of the finance lease in proportion to the balance of capitalrepayments outstanding.
All other leases are classified as operating leases with the lease rentals payable being charged to the profitand loss account on a straight line basis.
Employee benefits
Pensions
The Company’s net obligation in respect of defined benefit pension plans is calculated separately for eachplan by estimating the amount of future benefit that employees have earned in return for their service inthe current and prior periods. That benefit is discounted to determine the present value, and the fair valueof any plan assets is deducted. The calculation is performed by a qualified actuary using the projected unitcredit method. The discount rate is the yield at the balance sheet date on AA credit rated bonds or localequivalent that have maturity dates approximating to the terms of the Group’s obligations.
When the benefits of a plan are improved, the portion of the increased benefit relating to past service byemployees is recognised as an expense in the profit and loss account on a straight line basis over theaverage period until the benefits become vested. To the extent that the benefits vest immediately, theexpense is recognised immediately in the profit and loss account.
Actuarial gains and losses that arise in calculating the Company’s obligation in respect of a plan arerecognised in the period in which they arise directly in reserves.
The operating and financing costs of defined benefit pension plans are recognised separately in the profitand loss account; current service costs are spread systematically over the expected average remainingservice lives of employees and financing costs are recognised in the periods within which they arise.
F-241
The Peninsular and Oriental Steam Navigation Company
Notes to the Company Accounts (Continued)
A Accounting policies (Continued)
Contributions, including lump sum payments, in respect of defined contribution pension schemes andmulti employer defined benefit schemes where it is not possible to identify the Company’s share of thescheme, are charged to the profit and loss account as they fall due.
Deferred taxation
Deferred tax is recognised without discounting, in respect of all timing differences between the treatmentof certain items for taxation and accounting purposes which have arisen but not reversed by the balancesheet dates except in respect of revalued fixed assets where there is no commitment to sell the asset, gainson sale of assets which are rolled over into replacement assets and the remittance of taxable subsidiary,associate or joint venture earnings where no commitment has been made to the remittance of thoseearnings.
Foreign currency
Foreign currency transactions
Transactions in foreign currencies are recorded at the rate of exchange ruling at the date of the transaction.Monetary assets and liabilities denominated in foreign currencies at the balance sheet date are translatedinto sterling at the rate of exchange ruling at that date. Foreign exchange differences arising on translationare recognised in the profit and loss account. Non-monetary asset and liabilities that are measured in termsof historical cost in a foreign currency are translated using the rate of exchange ruling at the date of thetransaction.
Net investment in foreign operations
Exchange differences arising from the translation of the net investment in foreign operations, and ofrelated hedges, are taken to the translation reserve in accordance with the hedging policy described below.
Financial instruments
FRS 25 and FRS 26 address the accounting for, and reporting of, financial instruments. FRS 26 sets outdetailed accounting requirements in relation to financial assets and liabilities. As outlined above under‘Accounting policies for new standards’, this has been applied by the Company for the first time for theyear ended 31 December 2005. Under the exemption available the comparatives have not been restated forFRS 25 and FRS 26 and continue to reflect the disclosure requirements of FRS 13 ‘Derivatives and otherFinancial instruments: disclosures’.
Hedging
Hedge of foreign investments
Where a foreign currency liability hedges a net investment in a foreign operation, the portion of foreignexchange differences arising on translation of the liability that is determined to be an effective hedge isrecognised directly in equity. The ineffective portion is recognised immediately in profit or loss. Whereexchange differences have been deferred in equity, they are recycled to the income statement upondisposal of the respective foreign investments.
As noted above, the comparatives have not been restated for FRS 25 and FRS 26. Accordingly theCompany has continued to reflect FRS 13, in its comparative figures.
Financial guarantees
The Company has not adopted the amendment to FRS 26 in relation to financial guarantee contractswhich will apply for periods commencing on or after 1 January 2006.
Where the Company enters into financial guarantee contracts to guarantee the indebtedness of othercompanies within its group, joint ventures or associates, the Company considers these to be insurance
F-242
www.global-reports.com
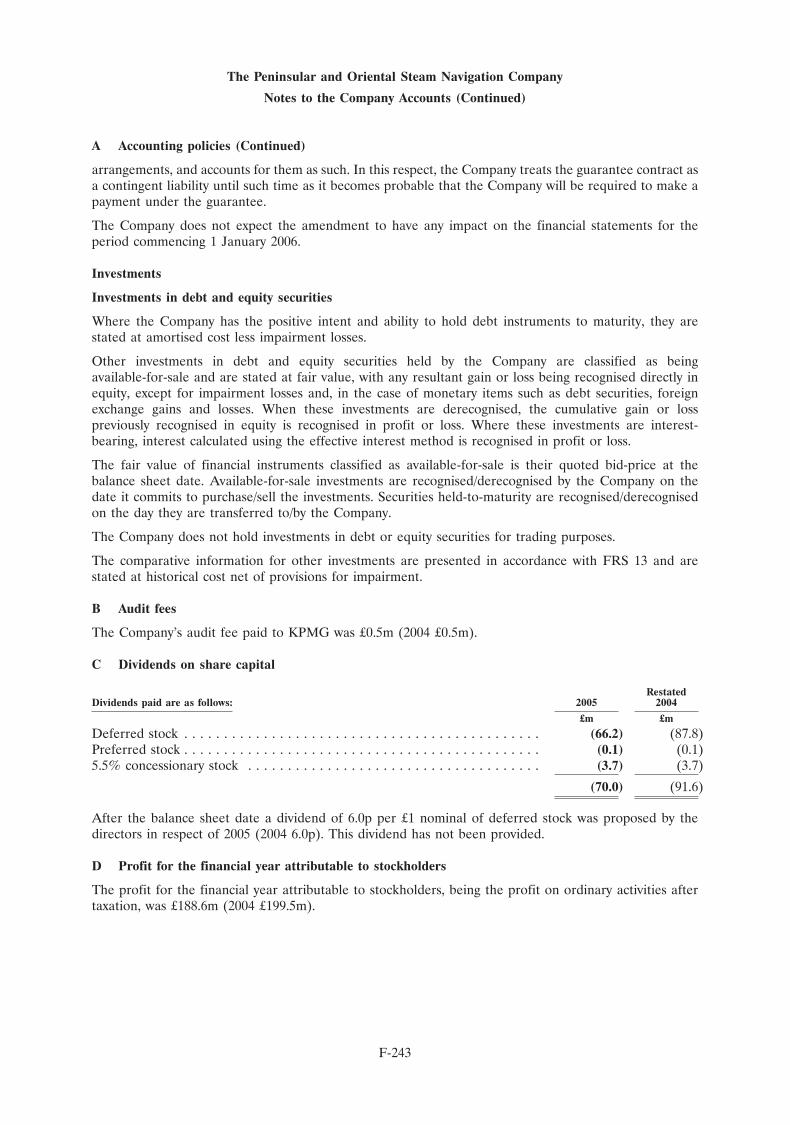
The Peninsular and Oriental Steam Navigation Company
Notes to the Company Accounts (Continued)
A Accounting policies (Continued)
arrangements, and accounts for them as such. In this respect, the Company treats the guarantee contract asa contingent liability until such time as it becomes probable that the Company will be required to make apayment under the guarantee.
The Company does not expect the amendment to have any impact on the financial statements for theperiod commencing 1 January 2006.
Investments
Investments in debt and equity securities
Where the Company has the positive intent and ability to hold debt instruments to maturity, they arestated at amortised cost less impairment losses.
Other investments in debt and equity securities held by the Company are classified as beingavailable-for-sale and are stated at fair value, with any resultant gain or loss being recognised directly inequity, except for impairment losses and, in the case of monetary items such as debt securities, foreignexchange gains and losses. When these investments are derecognised, the cumulative gain or losspreviously recognised in equity is recognised in profit or loss. Where these investments are interest-bearing, interest calculated using the effective interest method is recognised in profit or loss.
The fair value of financial instruments classified as available-for-sale is their quoted bid-price at thebalance sheet date. Available-for-sale investments are recognised/derecognised by the Company on thedate it commits to purchase/sell the investments. Securities held-to-maturity are recognised/derecognisedon the day they are transferred to/by the Company.
The Company does not hold investments in debt or equity securities for trading purposes.
The comparative information for other investments are presented in accordance with FRS 13 and arestated at historical cost net of provisions for impairment.
B Audit fees
The Company’s audit fee paid to KPMG was £0.5m (2004 £0.5m).
C Dividends on share capital
RestatedDividends paid are as follows: 2005 2004
£m £m
Deferred stock . . . . . . . . . . . . . . . . . . . . . . . . . . . . . . . . . . . . . . . . . . . . . (66.2) (87.8)Preferred stock . . . . . . . . . . . . . . . . . . . . . . . . . . . . . . . . . . . . . . . . . . . . . (0.1) (0.1)5.5% concessionary stock . . . . . . . . . . . . . . . . . . . . . . . . . . . . . . . . . . . . . (3.7) (3.7)
(70.0) (91.6)
After the balance sheet date a dividend of 6.0p per £1 nominal of deferred stock was proposed by thedirectors in respect of 2005 (2004 6.0p). This dividend has not been provided.
D Profit for the financial year attributable to stockholders
The profit for the financial year attributable to stockholders, being the profit on ordinary activities aftertaxation, was £188.6m (2004 £199.5m).
F-243
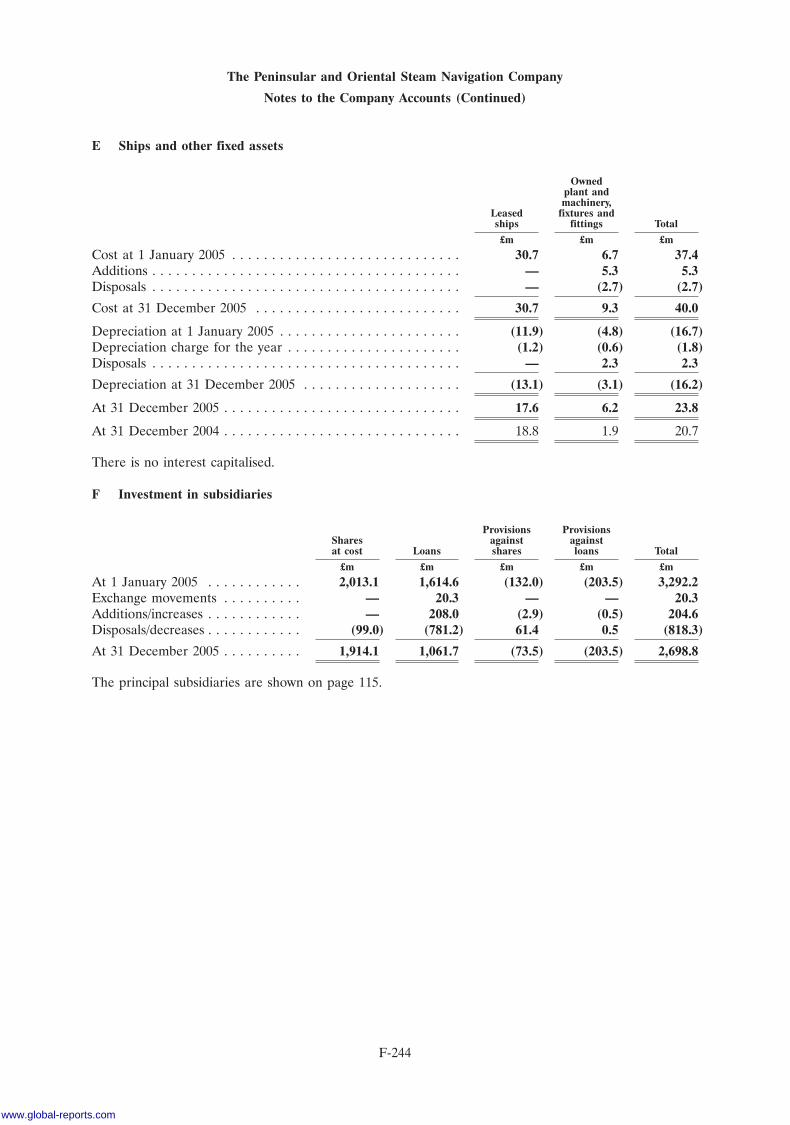
The Peninsular and Oriental Steam Navigation Company
Notes to the Company Accounts (Continued)
E Ships and other fixed assets
Ownedplant andmachinery,
Leased fixtures andships fittings Total
£m £m £m
Cost at 1 January 2005 . . . . . . . . . . . . . . . . . . . . . . . . . . . . . 30.7 6.7 37.4Additions . . . . . . . . . . . . . . . . . . . . . . . . . . . . . . . . . . . . . . . — 5.3 5.3Disposals . . . . . . . . . . . . . . . . . . . . . . . . . . . . . . . . . . . . . . . — (2.7) (2.7)
Cost at 31 December 2005 . . . . . . . . . . . . . . . . . . . . . . . . . . 30.7 9.3 40.0
Depreciation at 1 January 2005 . . . . . . . . . . . . . . . . . . . . . . . (11.9) (4.8) (16.7)Depreciation charge for the year . . . . . . . . . . . . . . . . . . . . . . (1.2) (0.6) (1.8)Disposals . . . . . . . . . . . . . . . . . . . . . . . . . . . . . . . . . . . . . . . — 2.3 2.3
Depreciation at 31 December 2005 . . . . . . . . . . . . . . . . . . . . (13.1) (3.1) (16.2)
At 31 December 2005 . . . . . . . . . . . . . . . . . . . . . . . . . . . . . . 17.6 6.2 23.8
At 31 December 2004 . . . . . . . . . . . . . . . . . . . . . . . . . . . . . . 18.8 1.9 20.7
There is no interest capitalised.
F Investment in subsidiaries
Provisions ProvisionsShares against againstat cost Loans shares loans Total
£m £m £m £m £m
At 1 January 2005 . . . . . . . . . . . . 2,013.1 1,614.6 (132.0) (203.5) 3,292.2Exchange movements . . . . . . . . . . — 20.3 — — 20.3Additions/increases . . . . . . . . . . . . — 208.0 (2.9) (0.5) 204.6Disposals/decreases . . . . . . . . . . . . (99.0) (781.2) 61.4 0.5 (818.3)
At 31 December 2005 . . . . . . . . . . 1,914.1 1,061.7 (73.5) (203.5) 2,698.8
The principal subsidiaries are shown on page 115.
F-244
www.global-reports.com
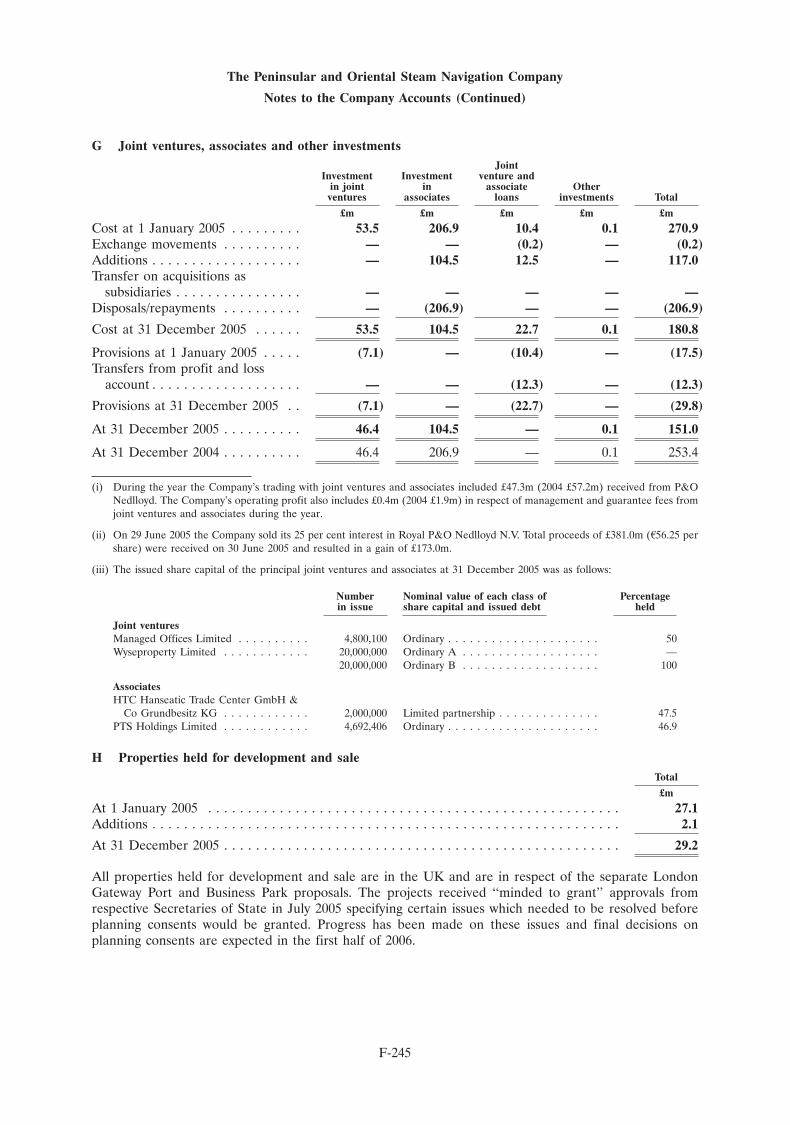
The Peninsular and Oriental Steam Navigation Company
Notes to the Company Accounts (Continued)
G Joint ventures, associates and other investmentsJoint
Investment Investment venture andin joint in associate Otherventures associates loans investments Total
£m £m £m £m £m
Cost at 1 January 2005 . . . . . . . . . 53.5 206.9 10.4 0.1 270.9Exchange movements . . . . . . . . . . — — (0.2) — (0.2)Additions . . . . . . . . . . . . . . . . . . . — 104.5 12.5 — 117.0Transfer on acquisitions as
subsidiaries . . . . . . . . . . . . . . . . — — — — —Disposals/repayments . . . . . . . . . . — (206.9) — — (206.9)
Cost at 31 December 2005 . . . . . . 53.5 104.5 22.7 0.1 180.8
Provisions at 1 January 2005 . . . . . (7.1) — (10.4) — (17.5)Transfers from profit and loss
account . . . . . . . . . . . . . . . . . . . — — (12.3) — (12.3)
Provisions at 31 December 2005 . . (7.1) — (22.7) — (29.8)
At 31 December 2005 . . . . . . . . . . 46.4 104.5 — 0.1 151.0
At 31 December 2004 . . . . . . . . . . 46.4 206.9 — 0.1 253.4
(i) During the year the Company’s trading with joint ventures and associates included £47.3m (2004 £57.2m) received from P&ONedlloyd. The Company’s operating profit also includes £0.4m (2004 £1.9m) in respect of management and guarantee fees fromjoint ventures and associates during the year.
(ii) On 29 June 2005 the Company sold its 25 per cent interest in Royal P&O Nedlloyd N.V. Total proceeds of £381.0m (A56.25 pershare) were received on 30 June 2005 and resulted in a gain of £173.0m.
(iii) The issued share capital of the principal joint ventures and associates at 31 December 2005 was as follows:
Number Nominal value of each class of Percentagein issue share capital and issued debt held
Joint venturesManaged Offices Limited . . . . . . . . . . 4,800,100 Ordinary . . . . . . . . . . . . . . . . . . . . . 50Wyseproperty Limited . . . . . . . . . . . . 20,000,000 Ordinary A . . . . . . . . . . . . . . . . . . . —
20,000,000 Ordinary B . . . . . . . . . . . . . . . . . . . 100
AssociatesHTC Hanseatic Trade Center GmbH &
Co Grundbesitz KG . . . . . . . . . . . . 2,000,000 Limited partnership . . . . . . . . . . . . . . 47.5PTS Holdings Limited . . . . . . . . . . . . 4,692,406 Ordinary . . . . . . . . . . . . . . . . . . . . . 46.9
H Properties held for development and saleTotal
£m
At 1 January 2005 . . . . . . . . . . . . . . . . . . . . . . . . . . . . . . . . . . . . . . . . . . . . . . . . . . . . 27.1Additions . . . . . . . . . . . . . . . . . . . . . . . . . . . . . . . . . . . . . . . . . . . . . . . . . . . . . . . . . . . 2.1
At 31 December 2005 . . . . . . . . . . . . . . . . . . . . . . . . . . . . . . . . . . . . . . . . . . . . . . . . . . 29.2
All properties held for development and sale are in the UK and are in respect of the separate LondonGateway Port and Business Park proposals. The projects received ‘‘minded to grant’’ approvals fromrespective Secretaries of State in July 2005 specifying certain issues which needed to be resolved beforeplanning consents would be granted. Progress has been made on these issues and final decisions onplanning consents are expected in the first half of 2006.
F-245
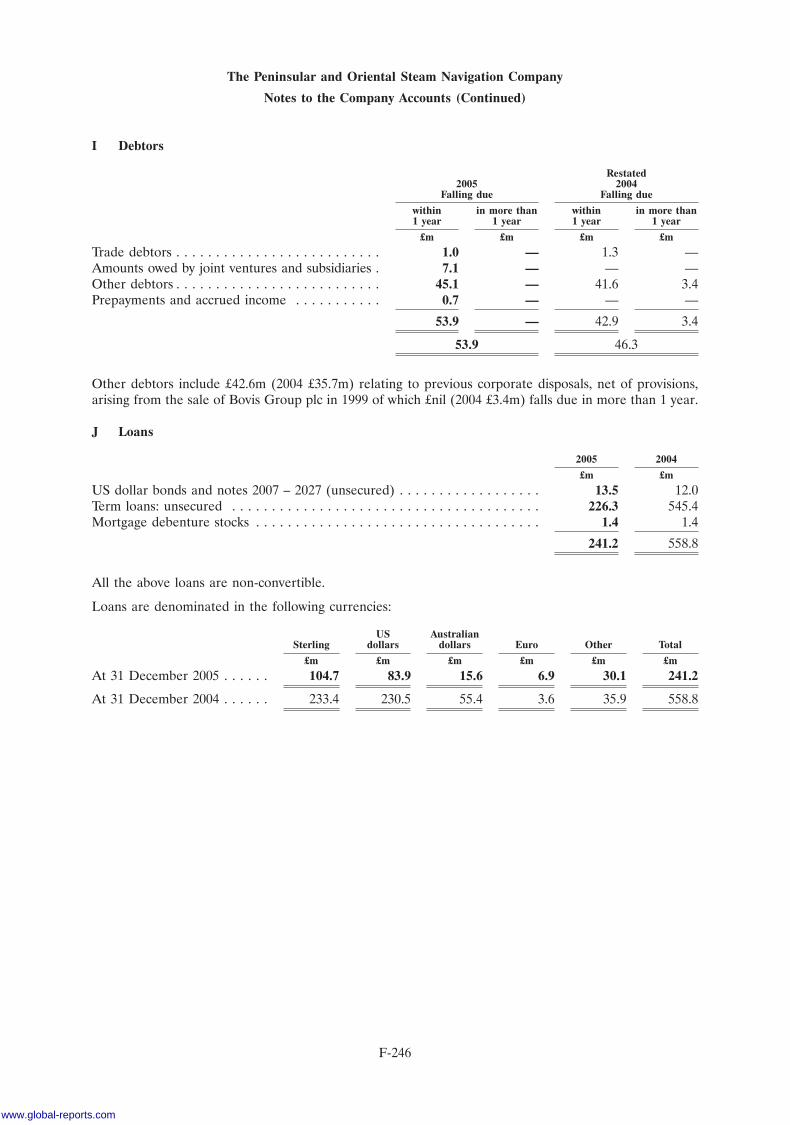
The Peninsular and Oriental Steam Navigation Company
Notes to the Company Accounts (Continued)
I Debtors
Restated2005 2004
Falling due Falling due
within in more than within in more than1 year 1 year 1 year 1 year
£m £m £m £m
Trade debtors . . . . . . . . . . . . . . . . . . . . . . . . . . 1.0 — 1.3 —Amounts owed by joint ventures and subsidiaries . 7.1 — — —Other debtors . . . . . . . . . . . . . . . . . . . . . . . . . . 45.1 — 41.6 3.4Prepayments and accrued income . . . . . . . . . . . 0.7 — — —
53.9 — 42.9 3.4
53.9 46.3
Other debtors include £42.6m (2004 £35.7m) relating to previous corporate disposals, net of provisions,arising from the sale of Bovis Group plc in 1999 of which £nil (2004 £3.4m) falls due in more than 1 year.
J Loans
2005 2004
£m £m
US dollar bonds and notes 2007 – 2027 (unsecured) . . . . . . . . . . . . . . . . . . 13.5 12.0Term loans: unsecured . . . . . . . . . . . . . . . . . . . . . . . . . . . . . . . . . . . . . . . 226.3 545.4Mortgage debenture stocks . . . . . . . . . . . . . . . . . . . . . . . . . . . . . . . . . . . . 1.4 1.4
241.2 558.8
All the above loans are non-convertible.
Loans are denominated in the following currencies:
US AustralianSterling dollars dollars Euro Other Total
£m £m £m £m £m £m
At 31 December 2005 . . . . . . 104.7 83.9 15.6 6.9 30.1 241.2
At 31 December 2004 . . . . . . 233.4 230.5 55.4 3.6 35.9 558.8
F-246
www.global-reports.com
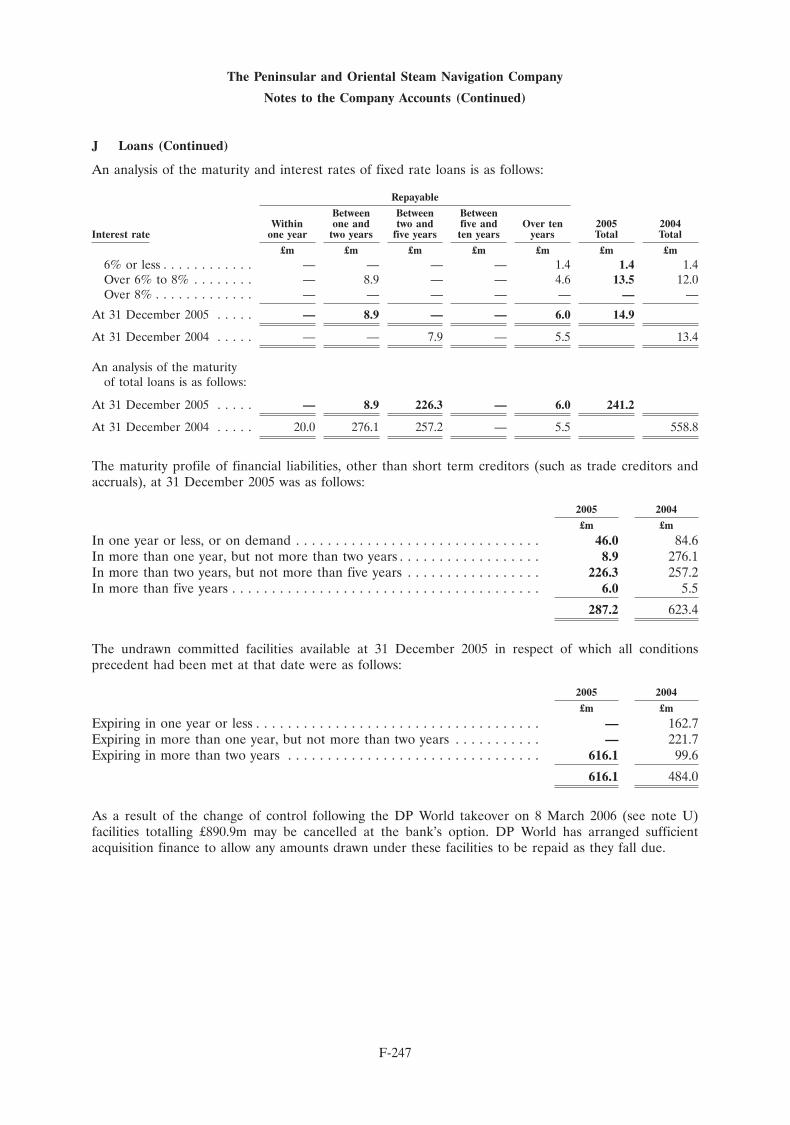
The Peninsular and Oriental Steam Navigation Company
Notes to the Company Accounts (Continued)
J Loans (Continued)
An analysis of the maturity and interest rates of fixed rate loans is as follows:
Repayable
Between Between BetweenWithin one and two and five and Over ten 2005 2004
Interest rate one year two years five years ten years years Total Total
£m £m £m £m £m £m £m6% or less . . . . . . . . . . . . — — — — 1.4 1.4 1.4Over 6% to 8% . . . . . . . . — 8.9 — — 4.6 13.5 12.0Over 8% . . . . . . . . . . . . . — — — — — — —
At 31 December 2005 . . . . . — 8.9 — — 6.0 14.9
At 31 December 2004 . . . . . — — 7.9 — 5.5 13.4
An analysis of the maturityof total loans is as follows:
At 31 December 2005 . . . . . — 8.9 226.3 — 6.0 241.2
At 31 December 2004 . . . . . 20.0 276.1 257.2 — 5.5 558.8
The maturity profile of financial liabilities, other than short term creditors (such as trade creditors andaccruals), at 31 December 2005 was as follows:
2005 2004
£m £m
In one year or less, or on demand . . . . . . . . . . . . . . . . . . . . . . . . . . . . . . . 46.0 84.6In more than one year, but not more than two years . . . . . . . . . . . . . . . . . . 8.9 276.1In more than two years, but not more than five years . . . . . . . . . . . . . . . . . 226.3 257.2In more than five years . . . . . . . . . . . . . . . . . . . . . . . . . . . . . . . . . . . . . . . 6.0 5.5
287.2 623.4
The undrawn committed facilities available at 31 December 2005 in respect of which all conditionsprecedent had been met at that date were as follows:
2005 2004
£m £m
Expiring in one year or less . . . . . . . . . . . . . . . . . . . . . . . . . . . . . . . . . . . . — 162.7Expiring in more than one year, but not more than two years . . . . . . . . . . . — 221.7Expiring in more than two years . . . . . . . . . . . . . . . . . . . . . . . . . . . . . . . . 616.1 99.6
616.1 484.0
As a result of the change of control following the DP World takeover on 8 March 2006 (see note U)facilities totalling £890.9m may be cancelled at the bank’s option. DP World has arranged sufficientacquisition finance to allow any amounts drawn under these facilities to be repaid as they fall due.
F-247
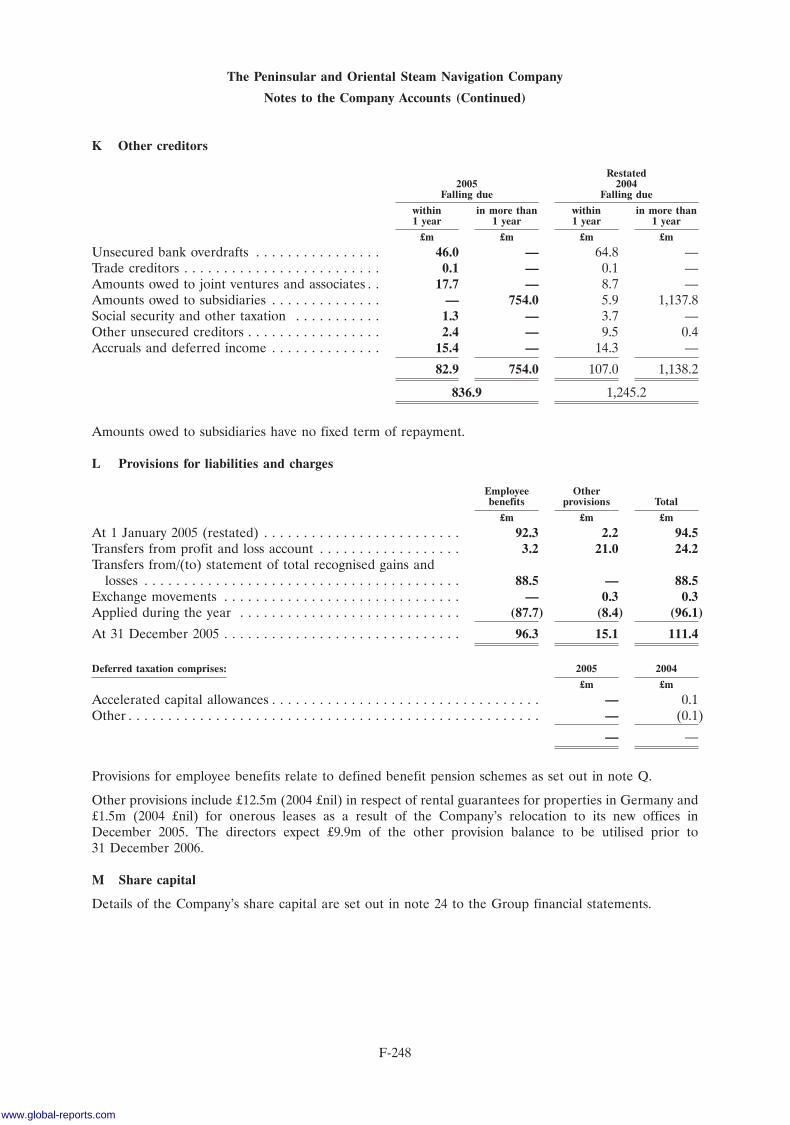
The Peninsular and Oriental Steam Navigation Company
Notes to the Company Accounts (Continued)
K Other creditors
Restated2005 2004
Falling due Falling due
within in more than within in more than1 year 1 year 1 year 1 year
£m £m £m £m
Unsecured bank overdrafts . . . . . . . . . . . . . . . . 46.0 — 64.8 —Trade creditors . . . . . . . . . . . . . . . . . . . . . . . . . 0.1 — 0.1 —Amounts owed to joint ventures and associates . . 17.7 — 8.7 —Amounts owed to subsidiaries . . . . . . . . . . . . . . — 754.0 5.9 1,137.8Social security and other taxation . . . . . . . . . . . 1.3 — 3.7 —Other unsecured creditors . . . . . . . . . . . . . . . . . 2.4 — 9.5 0.4Accruals and deferred income . . . . . . . . . . . . . . 15.4 — 14.3 —
82.9 754.0 107.0 1,138.2
836.9 1,245.2
Amounts owed to subsidiaries have no fixed term of repayment.
L Provisions for liabilities and charges
Employee Otherbenefits provisions Total
£m £m £m
At 1 January 2005 (restated) . . . . . . . . . . . . . . . . . . . . . . . . . 92.3 2.2 94.5Transfers from profit and loss account . . . . . . . . . . . . . . . . . . 3.2 21.0 24.2Transfers from/(to) statement of total recognised gains and
losses . . . . . . . . . . . . . . . . . . . . . . . . . . . . . . . . . . . . . . . . 88.5 — 88.5Exchange movements . . . . . . . . . . . . . . . . . . . . . . . . . . . . . . — 0.3 0.3Applied during the year . . . . . . . . . . . . . . . . . . . . . . . . . . . . (87.7) (8.4) (96.1)
At 31 December 2005 . . . . . . . . . . . . . . . . . . . . . . . . . . . . . . 96.3 15.1 111.4
Deferred taxation comprises: 2005 2004
£m £m
Accelerated capital allowances . . . . . . . . . . . . . . . . . . . . . . . . . . . . . . . . . . — 0.1Other . . . . . . . . . . . . . . . . . . . . . . . . . . . . . . . . . . . . . . . . . . . . . . . . . . . . — (0.1)
— —
Provisions for employee benefits relate to defined benefit pension schemes as set out in note Q.
Other provisions include £12.5m (2004 £nil) in respect of rental guarantees for properties in Germany and£1.5m (2004 £nil) for onerous leases as a result of the Company’s relocation to its new offices inDecember 2005. The directors expect £9.9m of the other provision balance to be utilised prior to31 December 2006.
M Share capital
Details of the Company’s share capital are set out in note 24 to the Group financial statements.
F-248
www.global-reports.com
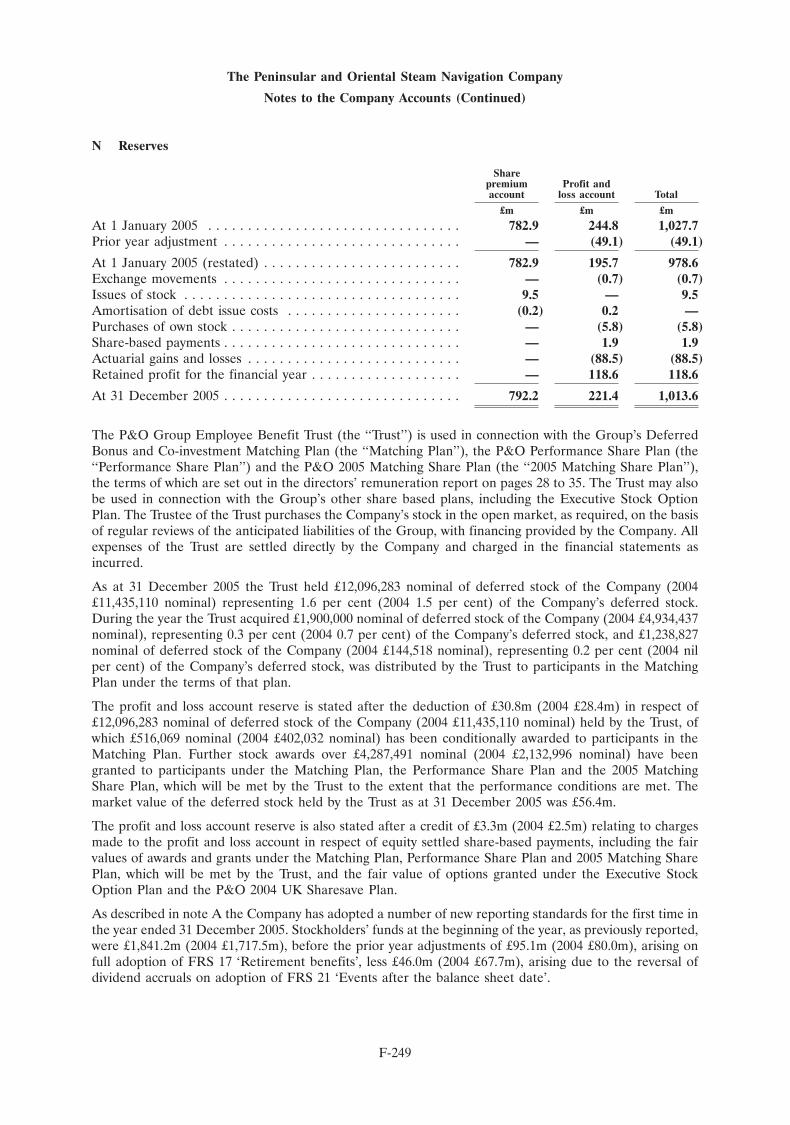
The Peninsular and Oriental Steam Navigation Company
Notes to the Company Accounts (Continued)
N Reserves
Sharepremium Profit andaccount loss account Total
£m £m £m
At 1 January 2005 . . . . . . . . . . . . . . . . . . . . . . . . . . . . . . . . 782.9 244.8 1,027.7Prior year adjustment . . . . . . . . . . . . . . . . . . . . . . . . . . . . . . — (49.1) (49.1)
At 1 January 2005 (restated) . . . . . . . . . . . . . . . . . . . . . . . . . 782.9 195.7 978.6Exchange movements . . . . . . . . . . . . . . . . . . . . . . . . . . . . . . — (0.7) (0.7)Issues of stock . . . . . . . . . . . . . . . . . . . . . . . . . . . . . . . . . . . 9.5 — 9.5Amortisation of debt issue costs . . . . . . . . . . . . . . . . . . . . . . (0.2) 0.2 —Purchases of own stock . . . . . . . . . . . . . . . . . . . . . . . . . . . . . — (5.8) (5.8)Share-based payments . . . . . . . . . . . . . . . . . . . . . . . . . . . . . . — 1.9 1.9Actuarial gains and losses . . . . . . . . . . . . . . . . . . . . . . . . . . . — (88.5) (88.5)Retained profit for the financial year . . . . . . . . . . . . . . . . . . . — 118.6 118.6
At 31 December 2005 . . . . . . . . . . . . . . . . . . . . . . . . . . . . . . 792.2 221.4 1,013.6
The P&O Group Employee Benefit Trust (the ‘‘Trust’’) is used in connection with the Group’s DeferredBonus and Co-investment Matching Plan (the ‘‘Matching Plan’’), the P&O Performance Share Plan (the‘‘Performance Share Plan’’) and the P&O 2005 Matching Share Plan (the ‘‘2005 Matching Share Plan’’),the terms of which are set out in the directors’ remuneration report on pages 28 to 35. The Trust may alsobe used in connection with the Group’s other share based plans, including the Executive Stock OptionPlan. The Trustee of the Trust purchases the Company’s stock in the open market, as required, on the basisof regular reviews of the anticipated liabilities of the Group, with financing provided by the Company. Allexpenses of the Trust are settled directly by the Company and charged in the financial statements asincurred.
As at 31 December 2005 the Trust held £12,096,283 nominal of deferred stock of the Company (2004£11,435,110 nominal) representing 1.6 per cent (2004 1.5 per cent) of the Company’s deferred stock.During the year the Trust acquired £1,900,000 nominal of deferred stock of the Company (2004 £4,934,437nominal), representing 0.3 per cent (2004 0.7 per cent) of the Company’s deferred stock, and £1,238,827nominal of deferred stock of the Company (2004 £144,518 nominal), representing 0.2 per cent (2004 nilper cent) of the Company’s deferred stock, was distributed by the Trust to participants in the MatchingPlan under the terms of that plan.
The profit and loss account reserve is stated after the deduction of £30.8m (2004 £28.4m) in respect of£12,096,283 nominal of deferred stock of the Company (2004 £11,435,110 nominal) held by the Trust, ofwhich £516,069 nominal (2004 £402,032 nominal) has been conditionally awarded to participants in theMatching Plan. Further stock awards over £4,287,491 nominal (2004 £2,132,996 nominal) have beengranted to participants under the Matching Plan, the Performance Share Plan and the 2005 MatchingShare Plan, which will be met by the Trust to the extent that the performance conditions are met. Themarket value of the deferred stock held by the Trust as at 31 December 2005 was £56.4m.
The profit and loss account reserve is also stated after a credit of £3.3m (2004 £2.5m) relating to chargesmade to the profit and loss account in respect of equity settled share-based payments, including the fairvalues of awards and grants under the Matching Plan, Performance Share Plan and 2005 Matching SharePlan, which will be met by the Trust, and the fair value of options granted under the Executive StockOption Plan and the P&O 2004 UK Sharesave Plan.
As described in note A the Company has adopted a number of new reporting standards for the first time inthe year ended 31 December 2005. Stockholders’ funds at the beginning of the year, as previously reported,were £1,841.2m (2004 £1,717.5m), before the prior year adjustments of £95.1m (2004 £80.0m), arising onfull adoption of FRS 17 ‘Retirement benefits’, less £46.0m (2004 £67.7m), arising due to the reversal ofdividend accruals on adoption of FRS 21 ‘Events after the balance sheet date’.
F-249
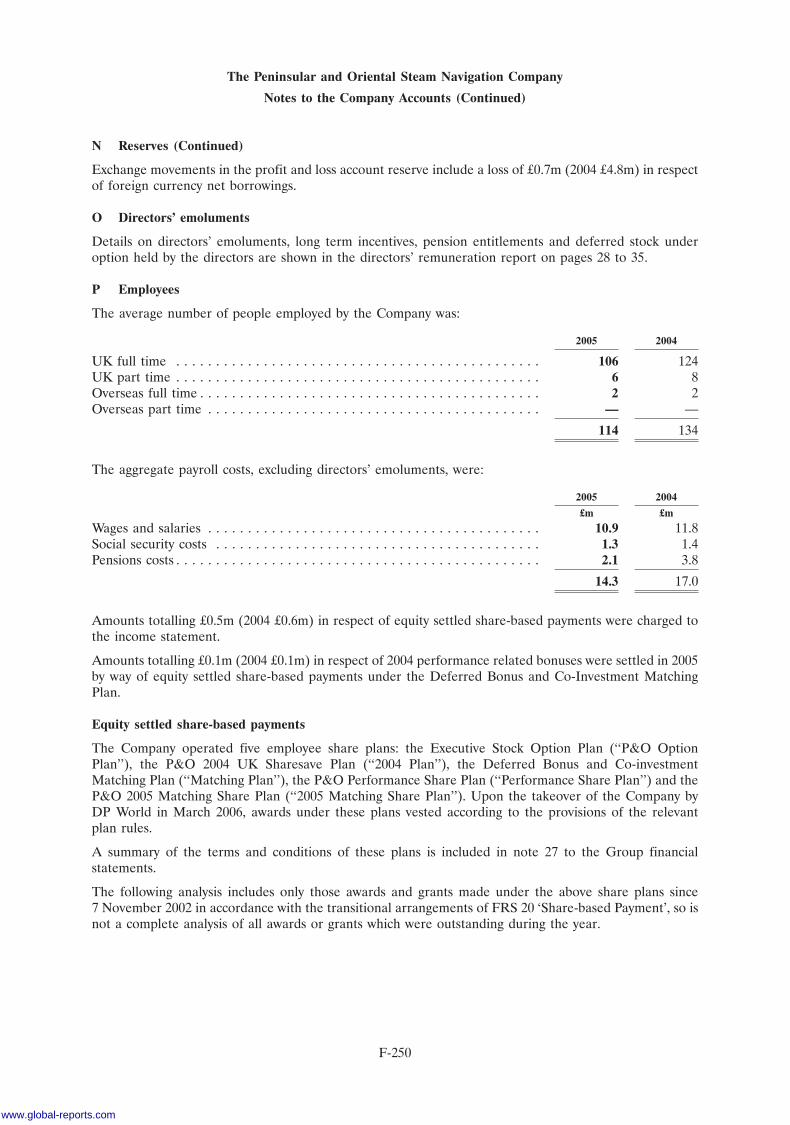
The Peninsular and Oriental Steam Navigation Company
Notes to the Company Accounts (Continued)
N Reserves (Continued)
Exchange movements in the profit and loss account reserve include a loss of £0.7m (2004 £4.8m) in respectof foreign currency net borrowings.
O Directors’ emoluments
Details on directors’ emoluments, long term incentives, pension entitlements and deferred stock underoption held by the directors are shown in the directors’ remuneration report on pages 28 to 35.
P Employees
The average number of people employed by the Company was:
2005 2004
UK full time . . . . . . . . . . . . . . . . . . . . . . . . . . . . . . . . . . . . . . . . . . . . . . 106 124UK part time . . . . . . . . . . . . . . . . . . . . . . . . . . . . . . . . . . . . . . . . . . . . . . 6 8Overseas full time . . . . . . . . . . . . . . . . . . . . . . . . . . . . . . . . . . . . . . . . . . . 2 2Overseas part time . . . . . . . . . . . . . . . . . . . . . . . . . . . . . . . . . . . . . . . . . . — —
114 134
The aggregate payroll costs, excluding directors’ emoluments, were:
2005 2004
£m £m
Wages and salaries . . . . . . . . . . . . . . . . . . . . . . . . . . . . . . . . . . . . . . . . . . 10.9 11.8Social security costs . . . . . . . . . . . . . . . . . . . . . . . . . . . . . . . . . . . . . . . . . 1.3 1.4Pensions costs . . . . . . . . . . . . . . . . . . . . . . . . . . . . . . . . . . . . . . . . . . . . . . 2.1 3.8
14.3 17.0
Amounts totalling £0.5m (2004 £0.6m) in respect of equity settled share-based payments were charged tothe income statement.
Amounts totalling £0.1m (2004 £0.1m) in respect of 2004 performance related bonuses were settled in 2005by way of equity settled share-based payments under the Deferred Bonus and Co-Investment MatchingPlan.
Equity settled share-based payments
The Company operated five employee share plans: the Executive Stock Option Plan (‘‘P&O OptionPlan’’), the P&O 2004 UK Sharesave Plan (‘‘2004 Plan’’), the Deferred Bonus and Co-investmentMatching Plan (‘‘Matching Plan’’), the P&O Performance Share Plan (‘‘Performance Share Plan’’) and theP&O 2005 Matching Share Plan (‘‘2005 Matching Share Plan’’). Upon the takeover of the Company byDP World in March 2006, awards under these plans vested according to the provisions of the relevantplan rules.
A summary of the terms and conditions of these plans is included in note 27 to the Group financialstatements.
The following analysis includes only those awards and grants made under the above share plans since7 November 2002 in accordance with the transitional arrangements of FRS 20 ‘Share-based Payment’, so isnot a complete analysis of all awards or grants which were outstanding during the year.
F-250
www.global-reports.com
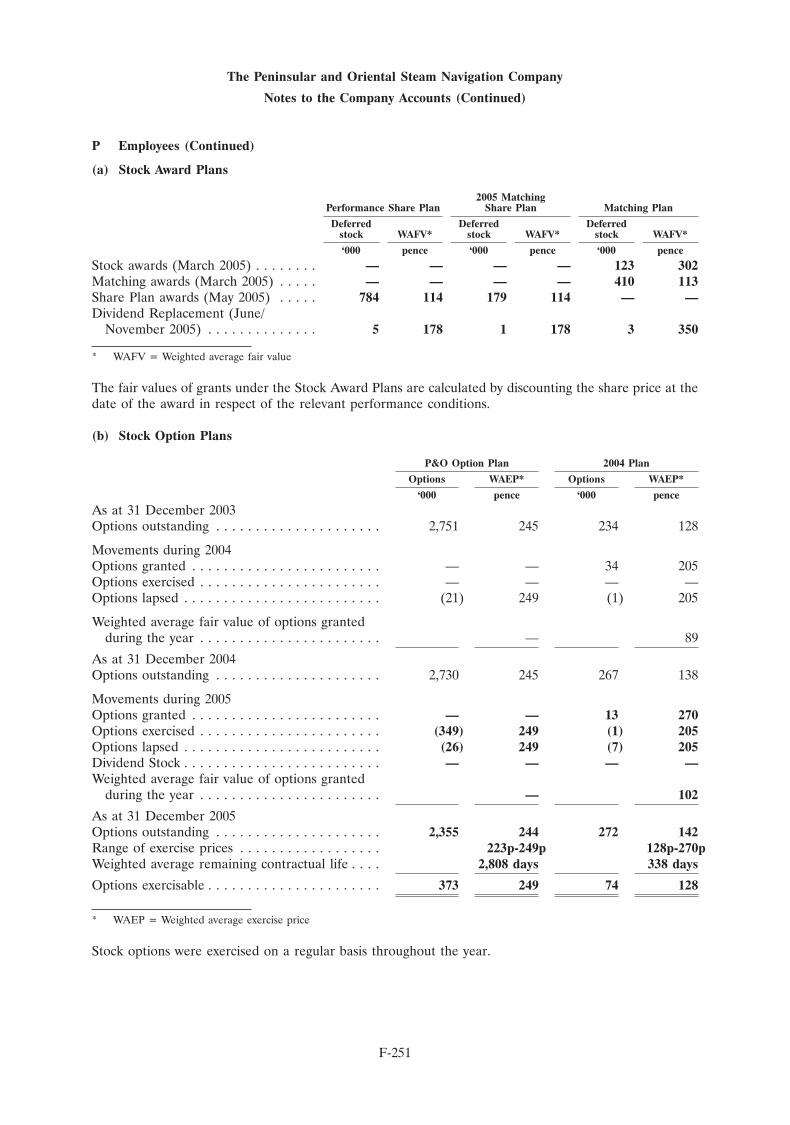
The Peninsular and Oriental Steam Navigation Company
Notes to the Company Accounts (Continued)
P Employees (Continued)
(a) Stock Award Plans
2005 MatchingPerformance Share Plan Share Plan Matching Plan
Deferred Deferred Deferredstock WAFV* stock WAFV* stock WAFV*
‘000 pence ‘000 pence ‘000 pence
Stock awards (March 2005) . . . . . . . . — — — — 123 302Matching awards (March 2005) . . . . . — — — — 410 113Share Plan awards (May 2005) . . . . . 784 114 179 114 — —Dividend Replacement (June/
November 2005) . . . . . . . . . . . . . . 5 178 1 178 3 350
* WAFV = Weighted average fair value
The fair values of grants under the Stock Award Plans are calculated by discounting the share price at thedate of the award in respect of the relevant performance conditions.
(b) Stock Option Plans
P&O Option Plan 2004 Plan
Options WAEP* Options WAEP*
‘000 pence ‘000 pence
As at 31 December 2003Options outstanding . . . . . . . . . . . . . . . . . . . . . 2,751 245 234 128
Movements during 2004Options granted . . . . . . . . . . . . . . . . . . . . . . . . — — 34 205Options exercised . . . . . . . . . . . . . . . . . . . . . . . — — — —Options lapsed . . . . . . . . . . . . . . . . . . . . . . . . . (21) 249 (1) 205
Weighted average fair value of options grantedduring the year . . . . . . . . . . . . . . . . . . . . . . . — 89
As at 31 December 2004Options outstanding . . . . . . . . . . . . . . . . . . . . . 2,730 245 267 138
Movements during 2005Options granted . . . . . . . . . . . . . . . . . . . . . . . . — — 13 270Options exercised . . . . . . . . . . . . . . . . . . . . . . . (349) 249 (1) 205Options lapsed . . . . . . . . . . . . . . . . . . . . . . . . . (26) 249 (7) 205Dividend Stock . . . . . . . . . . . . . . . . . . . . . . . . . — — — —Weighted average fair value of options granted
during the year . . . . . . . . . . . . . . . . . . . . . . . — 102
As at 31 December 2005Options outstanding . . . . . . . . . . . . . . . . . . . . . 2,355 244 272 142Range of exercise prices . . . . . . . . . . . . . . . . . . 223p-249p 128p-270pWeighted average remaining contractual life . . . . 2,808 days 338 days
Options exercisable . . . . . . . . . . . . . . . . . . . . . . 373 249 74 128
* WAEP = Weighted average exercise price
Stock options were exercised on a regular basis throughout the year.
F-251
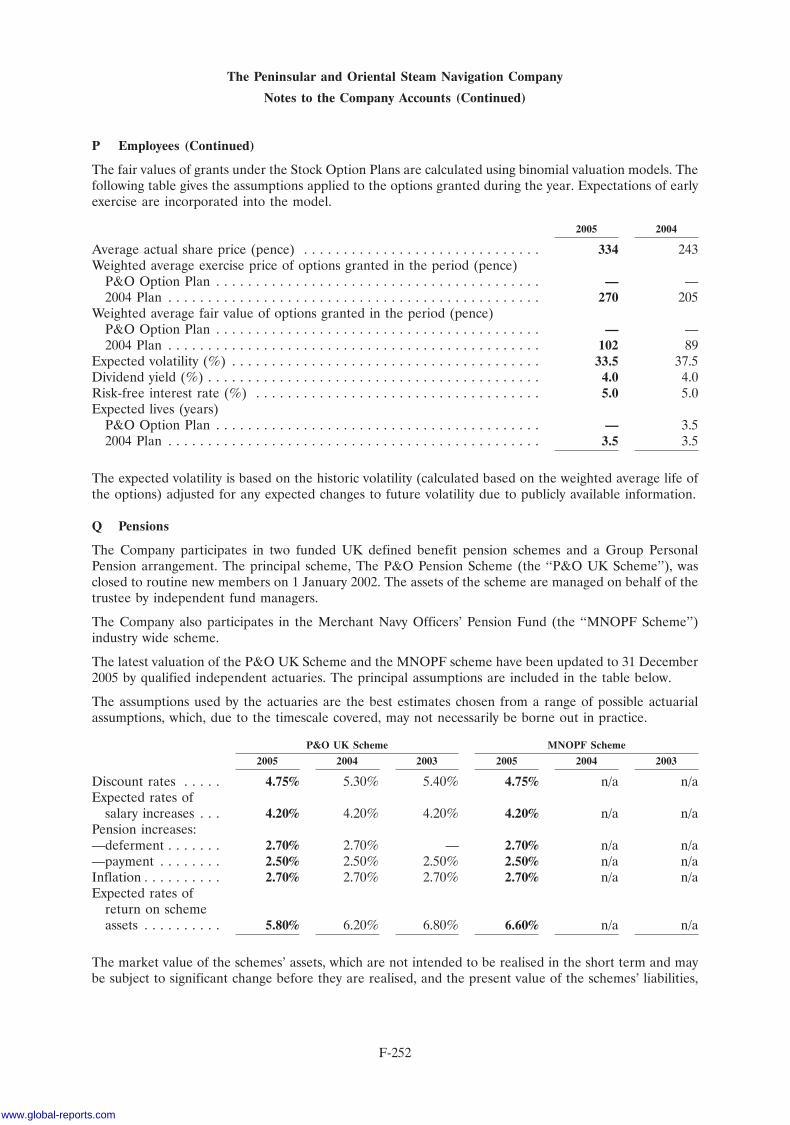
The Peninsular and Oriental Steam Navigation Company
Notes to the Company Accounts (Continued)
P Employees (Continued)
The fair values of grants under the Stock Option Plans are calculated using binomial valuation models. Thefollowing table gives the assumptions applied to the options granted during the year. Expectations of earlyexercise are incorporated into the model.
2005 2004
Average actual share price (pence) . . . . . . . . . . . . . . . . . . . . . . . . . . . . . . 334 243Weighted average exercise price of options granted in the period (pence)
P&O Option Plan . . . . . . . . . . . . . . . . . . . . . . . . . . . . . . . . . . . . . . . . . — —2004 Plan . . . . . . . . . . . . . . . . . . . . . . . . . . . . . . . . . . . . . . . . . . . . . . . 270 205
Weighted average fair value of options granted in the period (pence)P&O Option Plan . . . . . . . . . . . . . . . . . . . . . . . . . . . . . . . . . . . . . . . . . — —2004 Plan . . . . . . . . . . . . . . . . . . . . . . . . . . . . . . . . . . . . . . . . . . . . . . . 102 89
Expected volatility (%) . . . . . . . . . . . . . . . . . . . . . . . . . . . . . . . . . . . . . . . 33.5 37.5Dividend yield (%) . . . . . . . . . . . . . . . . . . . . . . . . . . . . . . . . . . . . . . . . . . 4.0 4.0Risk-free interest rate (%) . . . . . . . . . . . . . . . . . . . . . . . . . . . . . . . . . . . . 5.0 5.0Expected lives (years)
P&O Option Plan . . . . . . . . . . . . . . . . . . . . . . . . . . . . . . . . . . . . . . . . . — 3.52004 Plan . . . . . . . . . . . . . . . . . . . . . . . . . . . . . . . . . . . . . . . . . . . . . . . 3.5 3.5
The expected volatility is based on the historic volatility (calculated based on the weighted average life ofthe options) adjusted for any expected changes to future volatility due to publicly available information.
Q Pensions
The Company participates in two funded UK defined benefit pension schemes and a Group PersonalPension arrangement. The principal scheme, The P&O Pension Scheme (the ‘‘P&O UK Scheme’’), wasclosed to routine new members on 1 January 2002. The assets of the scheme are managed on behalf of thetrustee by independent fund managers.
The Company also participates in the Merchant Navy Officers’ Pension Fund (the ‘‘MNOPF Scheme’’)industry wide scheme.
The latest valuation of the P&O UK Scheme and the MNOPF scheme have been updated to 31 December2005 by qualified independent actuaries. The principal assumptions are included in the table below.
The assumptions used by the actuaries are the best estimates chosen from a range of possible actuarialassumptions, which, due to the timescale covered, may not necessarily be borne out in practice.
P&O UK Scheme MNOPF Scheme
2005 2004 2003 2005 2004 2003
Discount rates . . . . . 4.75% 5.30% 5.40% 4.75% n/a n/aExpected rates of
salary increases . . . 4.20% 4.20% 4.20% 4.20% n/a n/aPension increases:—deferment . . . . . . . 2.70% 2.70% — 2.70% n/a n/a—payment . . . . . . . . 2.50% 2.50% 2.50% 2.50% n/a n/aInflation . . . . . . . . . . 2.70% 2.70% 2.70% 2.70% n/a n/aExpected rates of
return on schemeassets . . . . . . . . . . 5.80% 6.20% 6.80% 6.60% n/a n/a
The market value of the schemes’ assets, which are not intended to be realised in the short term and maybe subject to significant change before they are realised, and the present value of the schemes’ liabilities,
F-252
www.global-reports.com
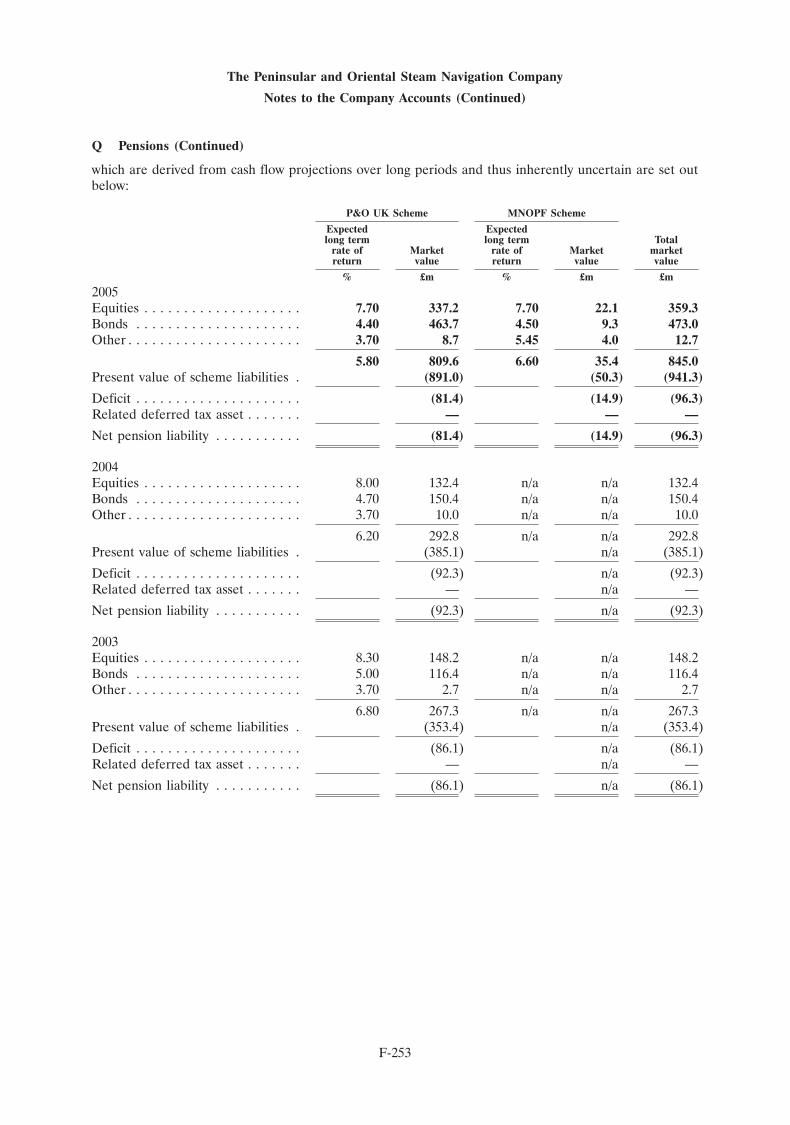
The Peninsular and Oriental Steam Navigation Company
Notes to the Company Accounts (Continued)
Q Pensions (Continued)
which are derived from cash flow projections over long periods and thus inherently uncertain are set outbelow:
P&O UK Scheme MNOPF Scheme
Expected Expectedlong term long term Total
rate of Market rate of Market marketreturn value return value value
% £m % £m £m
2005Equities . . . . . . . . . . . . . . . . . . . . 7.70 337.2 7.70 22.1 359.3Bonds . . . . . . . . . . . . . . . . . . . . . 4.40 463.7 4.50 9.3 473.0Other . . . . . . . . . . . . . . . . . . . . . . 3.70 8.7 5.45 4.0 12.7
5.80 809.6 6.60 35.4 845.0Present value of scheme liabilities . (891.0) (50.3) (941.3)
Deficit . . . . . . . . . . . . . . . . . . . . . (81.4) (14.9) (96.3)Related deferred tax asset . . . . . . . — — —
Net pension liability . . . . . . . . . . . (81.4) (14.9) (96.3)
2004Equities . . . . . . . . . . . . . . . . . . . . 8.00 132.4 n/a n/a 132.4Bonds . . . . . . . . . . . . . . . . . . . . . 4.70 150.4 n/a n/a 150.4Other . . . . . . . . . . . . . . . . . . . . . . 3.70 10.0 n/a n/a 10.0
6.20 292.8 n/a n/a 292.8Present value of scheme liabilities . (385.1) n/a (385.1)
Deficit . . . . . . . . . . . . . . . . . . . . . (92.3) n/a (92.3)Related deferred tax asset . . . . . . . — n/a —
Net pension liability . . . . . . . . . . . (92.3) n/a (92.3)
2003Equities . . . . . . . . . . . . . . . . . . . . 8.30 148.2 n/a n/a 148.2Bonds . . . . . . . . . . . . . . . . . . . . . 5.00 116.4 n/a n/a 116.4Other . . . . . . . . . . . . . . . . . . . . . . 3.70 2.7 n/a n/a 2.7
6.80 267.3 n/a n/a 267.3Present value of scheme liabilities . (353.4) n/a (353.4)
Deficit . . . . . . . . . . . . . . . . . . . . . (86.1) n/a (86.1)Related deferred tax asset . . . . . . . — n/a —
Net pension liability . . . . . . . . . . . (86.1) n/a (86.1)
F-253
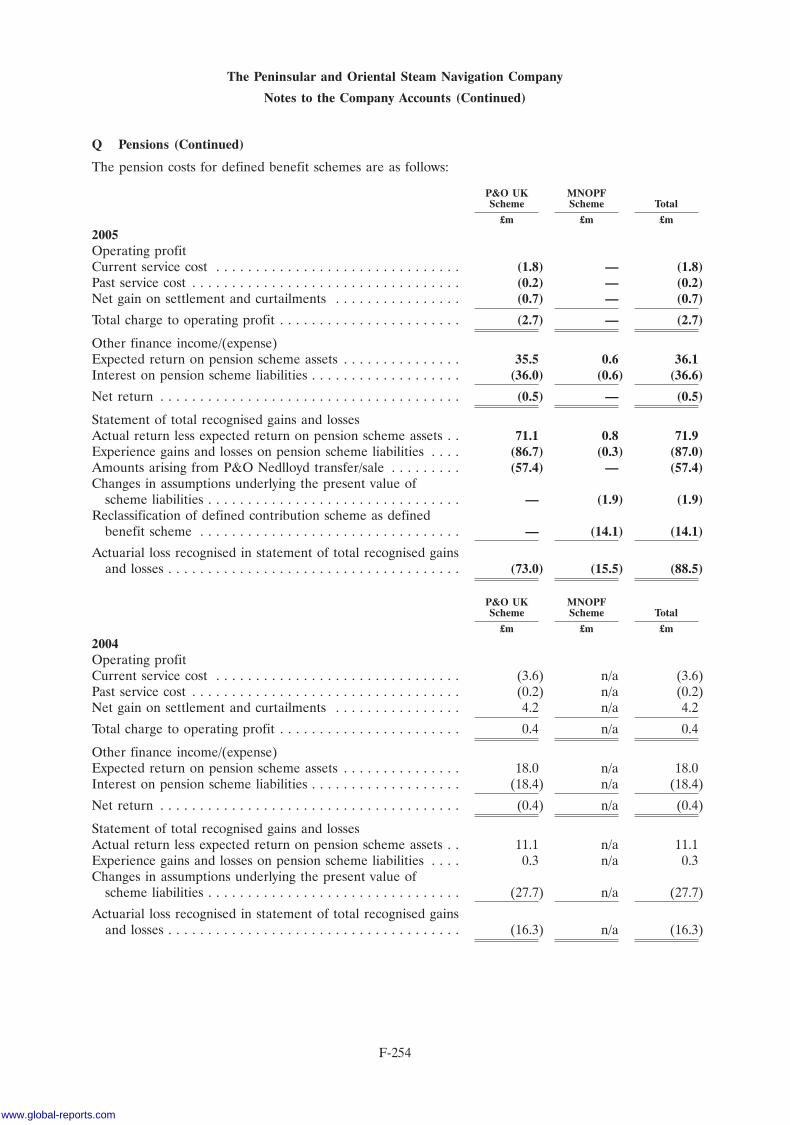
The Peninsular and Oriental Steam Navigation Company
Notes to the Company Accounts (Continued)
Q Pensions (Continued)
The pension costs for defined benefit schemes are as follows:
P&O UK MNOPFScheme Scheme Total
£m £m £m
2005Operating profitCurrent service cost . . . . . . . . . . . . . . . . . . . . . . . . . . . . . . . (1.8) — (1.8)Past service cost . . . . . . . . . . . . . . . . . . . . . . . . . . . . . . . . . . (0.2) — (0.2)Net gain on settlement and curtailments . . . . . . . . . . . . . . . . (0.7) — (0.7)
Total charge to operating profit . . . . . . . . . . . . . . . . . . . . . . . (2.7) — (2.7)
Other finance income/(expense)Expected return on pension scheme assets . . . . . . . . . . . . . . . 35.5 0.6 36.1Interest on pension scheme liabilities . . . . . . . . . . . . . . . . . . . (36.0) (0.6) (36.6)
Net return . . . . . . . . . . . . . . . . . . . . . . . . . . . . . . . . . . . . . . (0.5) — (0.5)
Statement of total recognised gains and lossesActual return less expected return on pension scheme assets . . 71.1 0.8 71.9Experience gains and losses on pension scheme liabilities . . . . (86.7) (0.3) (87.0)Amounts arising from P&O Nedlloyd transfer/sale . . . . . . . . . (57.4) — (57.4)Changes in assumptions underlying the present value of
scheme liabilities . . . . . . . . . . . . . . . . . . . . . . . . . . . . . . . . — (1.9) (1.9)Reclassification of defined contribution scheme as defined
benefit scheme . . . . . . . . . . . . . . . . . . . . . . . . . . . . . . . . . — (14.1) (14.1)
Actuarial loss recognised in statement of total recognised gainsand losses . . . . . . . . . . . . . . . . . . . . . . . . . . . . . . . . . . . . . (73.0) (15.5) (88.5)
P&O UK MNOPFScheme Scheme Total
£m £m £m
2004Operating profitCurrent service cost . . . . . . . . . . . . . . . . . . . . . . . . . . . . . . . (3.6) n/a (3.6)Past service cost . . . . . . . . . . . . . . . . . . . . . . . . . . . . . . . . . . (0.2) n/a (0.2)Net gain on settlement and curtailments . . . . . . . . . . . . . . . . 4.2 n/a 4.2
Total charge to operating profit . . . . . . . . . . . . . . . . . . . . . . . 0.4 n/a 0.4
Other finance income/(expense)Expected return on pension scheme assets . . . . . . . . . . . . . . . 18.0 n/a 18.0Interest on pension scheme liabilities . . . . . . . . . . . . . . . . . . . (18.4) n/a (18.4)
Net return . . . . . . . . . . . . . . . . . . . . . . . . . . . . . . . . . . . . . . (0.4) n/a (0.4)
Statement of total recognised gains and lossesActual return less expected return on pension scheme assets . . 11.1 n/a 11.1Experience gains and losses on pension scheme liabilities . . . . 0.3 n/a 0.3Changes in assumptions underlying the present value of
scheme liabilities . . . . . . . . . . . . . . . . . . . . . . . . . . . . . . . . (27.7) n/a (27.7)
Actuarial loss recognised in statement of total recognised gainsand losses . . . . . . . . . . . . . . . . . . . . . . . . . . . . . . . . . . . . . (16.3) n/a (16.3)
F-254
www.global-reports.com
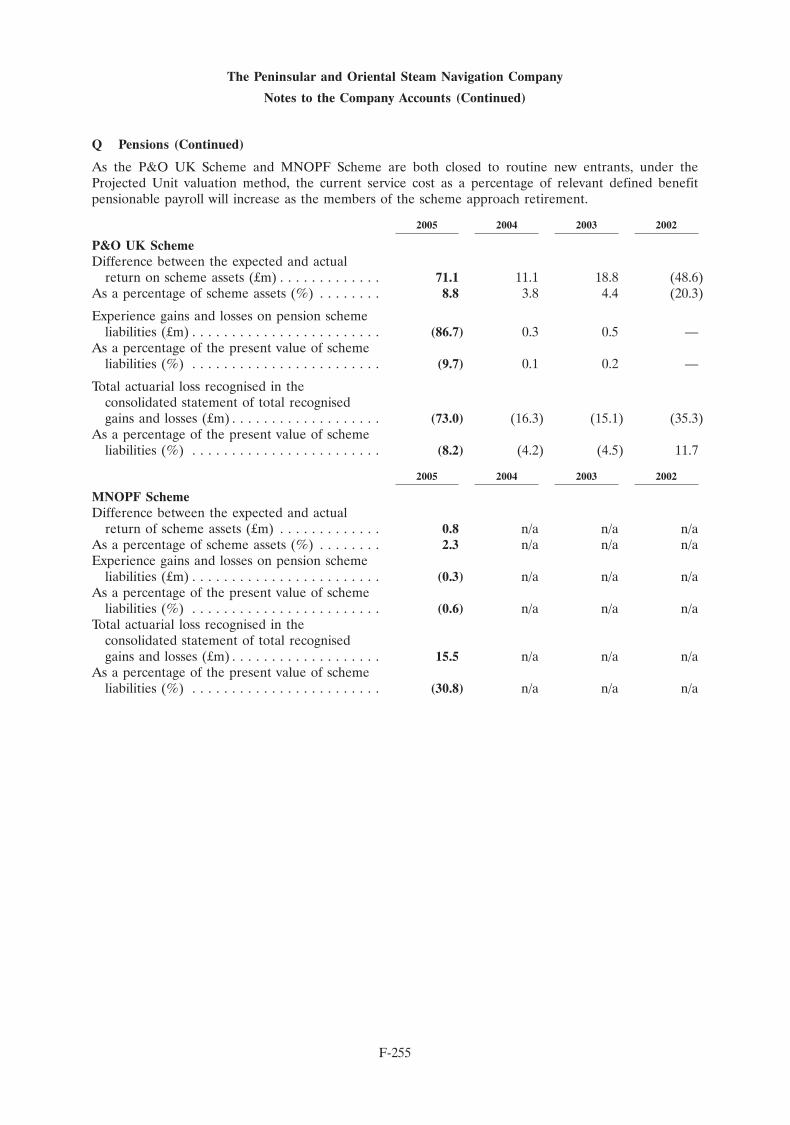
The Peninsular and Oriental Steam Navigation Company
Notes to the Company Accounts (Continued)
Q Pensions (Continued)
As the P&O UK Scheme and MNOPF Scheme are both closed to routine new entrants, under theProjected Unit valuation method, the current service cost as a percentage of relevant defined benefitpensionable payroll will increase as the members of the scheme approach retirement.
2005 2004 2003 2002
P&O UK SchemeDifference between the expected and actual
return on scheme assets (£m) . . . . . . . . . . . . . 71.1 11.1 18.8 (48.6)As a percentage of scheme assets (%) . . . . . . . . 8.8 3.8 4.4 (20.3)
Experience gains and losses on pension schemeliabilities (£m) . . . . . . . . . . . . . . . . . . . . . . . . (86.7) 0.3 0.5 —
As a percentage of the present value of schemeliabilities (%) . . . . . . . . . . . . . . . . . . . . . . . . (9.7) 0.1 0.2 —
Total actuarial loss recognised in theconsolidated statement of total recognisedgains and losses (£m) . . . . . . . . . . . . . . . . . . . (73.0) (16.3) (15.1) (35.3)
As a percentage of the present value of schemeliabilities (%) . . . . . . . . . . . . . . . . . . . . . . . . (8.2) (4.2) (4.5) 11.7
2005 2004 2003 2002
MNOPF SchemeDifference between the expected and actual
return of scheme assets (£m) . . . . . . . . . . . . . 0.8 n/a n/a n/aAs a percentage of scheme assets (%) . . . . . . . . 2.3 n/a n/a n/aExperience gains and losses on pension scheme
liabilities (£m) . . . . . . . . . . . . . . . . . . . . . . . . (0.3) n/a n/a n/aAs a percentage of the present value of scheme
liabilities (%) . . . . . . . . . . . . . . . . . . . . . . . . (0.6) n/a n/a n/aTotal actuarial loss recognised in the
consolidated statement of total recognisedgains and losses (£m) . . . . . . . . . . . . . . . . . . . 15.5 n/a n/a n/a
As a percentage of the present value of schemeliabilities (%) . . . . . . . . . . . . . . . . . . . . . . . . (30.8) n/a n/a n/a
F-255
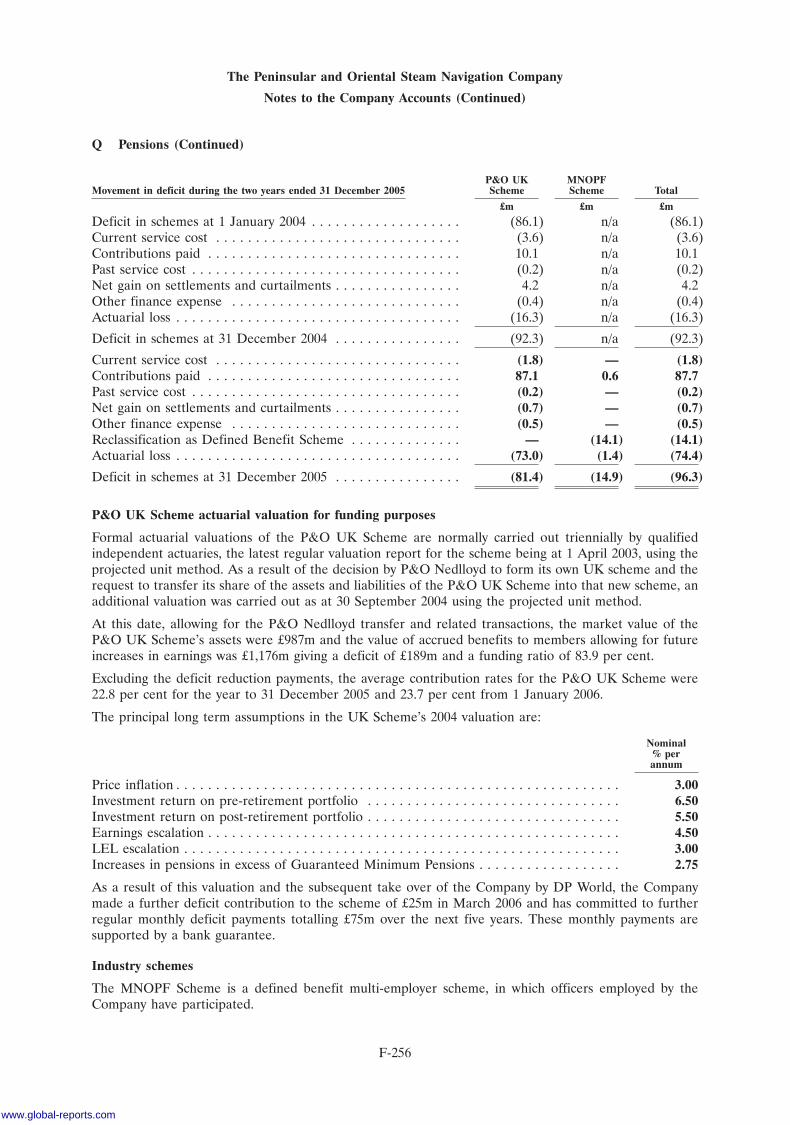
The Peninsular and Oriental Steam Navigation Company
Notes to the Company Accounts (Continued)
Q Pensions (Continued)
P&O UK MNOPFMovement in deficit during the two years ended 31 December 2005 Scheme Scheme Total
£m £m £m
Deficit in schemes at 1 January 2004 . . . . . . . . . . . . . . . . . . . (86.1) n/a (86.1)Current service cost . . . . . . . . . . . . . . . . . . . . . . . . . . . . . . . (3.6) n/a (3.6)Contributions paid . . . . . . . . . . . . . . . . . . . . . . . . . . . . . . . . 10.1 n/a 10.1Past service cost . . . . . . . . . . . . . . . . . . . . . . . . . . . . . . . . . . (0.2) n/a (0.2)Net gain on settlements and curtailments . . . . . . . . . . . . . . . . 4.2 n/a 4.2Other finance expense . . . . . . . . . . . . . . . . . . . . . . . . . . . . . (0.4) n/a (0.4)Actuarial loss . . . . . . . . . . . . . . . . . . . . . . . . . . . . . . . . . . . . (16.3) n/a (16.3)
Deficit in schemes at 31 December 2004 . . . . . . . . . . . . . . . . (92.3) n/a (92.3)
Current service cost . . . . . . . . . . . . . . . . . . . . . . . . . . . . . . . (1.8) — (1.8)Contributions paid . . . . . . . . . . . . . . . . . . . . . . . . . . . . . . . . 87.1 0.6 87.7Past service cost . . . . . . . . . . . . . . . . . . . . . . . . . . . . . . . . . . (0.2) — (0.2)Net gain on settlements and curtailments . . . . . . . . . . . . . . . . (0.7) — (0.7)Other finance expense . . . . . . . . . . . . . . . . . . . . . . . . . . . . . (0.5) — (0.5)Reclassification as Defined Benefit Scheme . . . . . . . . . . . . . . — (14.1) (14.1)Actuarial loss . . . . . . . . . . . . . . . . . . . . . . . . . . . . . . . . . . . . (73.0) (1.4) (74.4)
Deficit in schemes at 31 December 2005 . . . . . . . . . . . . . . . . (81.4) (14.9) (96.3)
P&O UK Scheme actuarial valuation for funding purposes
Formal actuarial valuations of the P&O UK Scheme are normally carried out triennially by qualifiedindependent actuaries, the latest regular valuation report for the scheme being at 1 April 2003, using theprojected unit method. As a result of the decision by P&O Nedlloyd to form its own UK scheme and therequest to transfer its share of the assets and liabilities of the P&O UK Scheme into that new scheme, anadditional valuation was carried out as at 30 September 2004 using the projected unit method.
At this date, allowing for the P&O Nedlloyd transfer and related transactions, the market value of theP&O UK Scheme’s assets were £987m and the value of accrued benefits to members allowing for futureincreases in earnings was £1,176m giving a deficit of £189m and a funding ratio of 83.9 per cent.
Excluding the deficit reduction payments, the average contribution rates for the P&O UK Scheme were22.8 per cent for the year to 31 December 2005 and 23.7 per cent from 1 January 2006.
The principal long term assumptions in the UK Scheme’s 2004 valuation are:
Nominal% perannum
Price inflation . . . . . . . . . . . . . . . . . . . . . . . . . . . . . . . . . . . . . . . . . . . . . . . . . . . . . . . . 3.00Investment return on pre-retirement portfolio . . . . . . . . . . . . . . . . . . . . . . . . . . . . . . . . 6.50Investment return on post-retirement portfolio . . . . . . . . . . . . . . . . . . . . . . . . . . . . . . . . 5.50Earnings escalation . . . . . . . . . . . . . . . . . . . . . . . . . . . . . . . . . . . . . . . . . . . . . . . . . . . . 4.50LEL escalation . . . . . . . . . . . . . . . . . . . . . . . . . . . . . . . . . . . . . . . . . . . . . . . . . . . . . . . 3.00Increases in pensions in excess of Guaranteed Minimum Pensions . . . . . . . . . . . . . . . . . . 2.75
As a result of this valuation and the subsequent take over of the Company by DP World, the Companymade a further deficit contribution to the scheme of £25m in March 2006 and has committed to furtherregular monthly deficit payments totalling £75m over the next five years. These monthly payments aresupported by a bank guarantee.
Industry schemes
The MNOPF Scheme is a defined benefit multi-employer scheme, in which officers employed by theCompany have participated.
F-256
www.global-reports.com
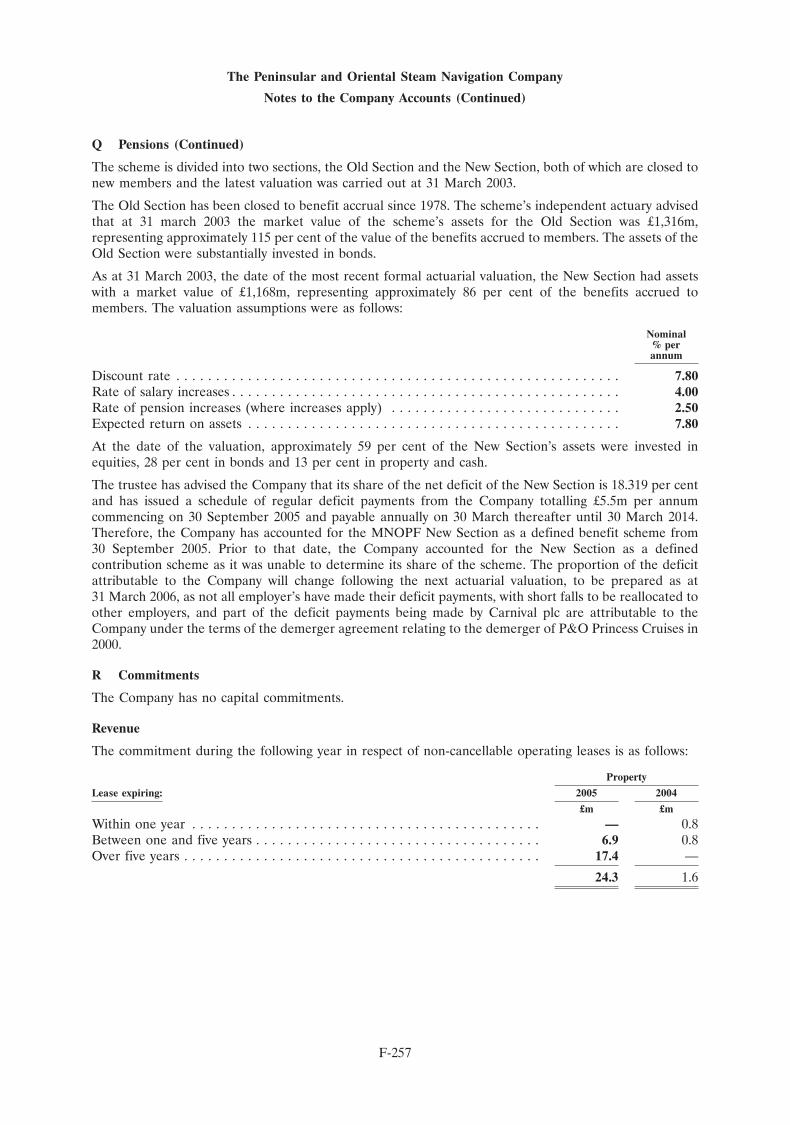
The Peninsular and Oriental Steam Navigation Company
Notes to the Company Accounts (Continued)
Q Pensions (Continued)
The scheme is divided into two sections, the Old Section and the New Section, both of which are closed tonew members and the latest valuation was carried out at 31 March 2003.
The Old Section has been closed to benefit accrual since 1978. The scheme’s independent actuary advisedthat at 31 march 2003 the market value of the scheme’s assets for the Old Section was £1,316m,representing approximately 115 per cent of the value of the benefits accrued to members. The assets of theOld Section were substantially invested in bonds.
As at 31 March 2003, the date of the most recent formal actuarial valuation, the New Section had assetswith a market value of £1,168m, representing approximately 86 per cent of the benefits accrued tomembers. The valuation assumptions were as follows:
Nominal% perannum
Discount rate . . . . . . . . . . . . . . . . . . . . . . . . . . . . . . . . . . . . . . . . . . . . . . . . . . . . . . . . 7.80Rate of salary increases . . . . . . . . . . . . . . . . . . . . . . . . . . . . . . . . . . . . . . . . . . . . . . . . . 4.00Rate of pension increases (where increases apply) . . . . . . . . . . . . . . . . . . . . . . . . . . . . . 2.50Expected return on assets . . . . . . . . . . . . . . . . . . . . . . . . . . . . . . . . . . . . . . . . . . . . . . . 7.80
At the date of the valuation, approximately 59 per cent of the New Section’s assets were invested inequities, 28 per cent in bonds and 13 per cent in property and cash.
The trustee has advised the Company that its share of the net deficit of the New Section is 18.319 per centand has issued a schedule of regular deficit payments from the Company totalling £5.5m per annumcommencing on 30 September 2005 and payable annually on 30 March thereafter until 30 March 2014.Therefore, the Company has accounted for the MNOPF New Section as a defined benefit scheme from30 September 2005. Prior to that date, the Company accounted for the New Section as a definedcontribution scheme as it was unable to determine its share of the scheme. The proportion of the deficitattributable to the Company will change following the next actuarial valuation, to be prepared as at31 March 2006, as not all employer’s have made their deficit payments, with short falls to be reallocated toother employers, and part of the deficit payments being made by Carnival plc are attributable to theCompany under the terms of the demerger agreement relating to the demerger of P&O Princess Cruises in2000.
R Commitments
The Company has no capital commitments.
Revenue
The commitment during the following year in respect of non-cancellable operating leases is as follows:
Property
Lease expiring: 2005 2004
£m £m
Within one year . . . . . . . . . . . . . . . . . . . . . . . . . . . . . . . . . . . . . . . . . . . . — 0.8Between one and five years . . . . . . . . . . . . . . . . . . . . . . . . . . . . . . . . . . . . 6.9 0.8Over five years . . . . . . . . . . . . . . . . . . . . . . . . . . . . . . . . . . . . . . . . . . . . . 17.4 —
24.3 1.6
F-257
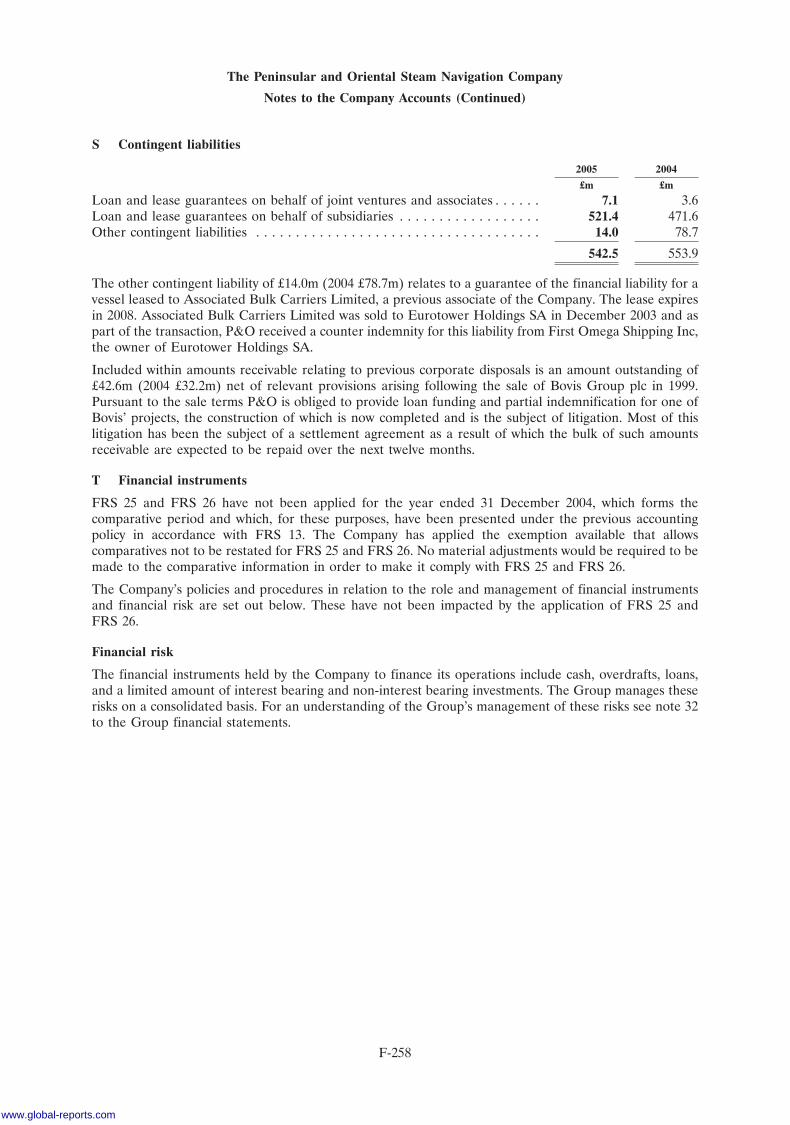
The Peninsular and Oriental Steam Navigation Company
Notes to the Company Accounts (Continued)
S Contingent liabilities
2005 2004
£m £m
Loan and lease guarantees on behalf of joint ventures and associates . . . . . . 7.1 3.6Loan and lease guarantees on behalf of subsidiaries . . . . . . . . . . . . . . . . . . 521.4 471.6Other contingent liabilities . . . . . . . . . . . . . . . . . . . . . . . . . . . . . . . . . . . . 14.0 78.7
542.5 553.9
The other contingent liability of £14.0m (2004 £78.7m) relates to a guarantee of the financial liability for avessel leased to Associated Bulk Carriers Limited, a previous associate of the Company. The lease expiresin 2008. Associated Bulk Carriers Limited was sold to Eurotower Holdings SA in December 2003 and aspart of the transaction, P&O received a counter indemnity for this liability from First Omega Shipping Inc,the owner of Eurotower Holdings SA.
Included within amounts receivable relating to previous corporate disposals is an amount outstanding of£42.6m (2004 £32.2m) net of relevant provisions arising following the sale of Bovis Group plc in 1999.Pursuant to the sale terms P&O is obliged to provide loan funding and partial indemnification for one ofBovis’ projects, the construction of which is now completed and is the subject of litigation. Most of thislitigation has been the subject of a settlement agreement as a result of which the bulk of such amountsreceivable are expected to be repaid over the next twelve months.
T Financial instruments
FRS 25 and FRS 26 have not been applied for the year ended 31 December 2004, which forms thecomparative period and which, for these purposes, have been presented under the previous accountingpolicy in accordance with FRS 13. The Company has applied the exemption available that allowscomparatives not to be restated for FRS 25 and FRS 26. No material adjustments would be required to bemade to the comparative information in order to make it comply with FRS 25 and FRS 26.
The Company’s policies and procedures in relation to the role and management of financial instrumentsand financial risk are set out below. These have not been impacted by the application of FRS 25 andFRS 26.
Financial risk
The financial instruments held by the Company to finance its operations include cash, overdrafts, loans,and a limited amount of interest bearing and non-interest bearing investments. The Group manages theserisks on a consolidated basis. For an understanding of the Group’s management of these risks see note 32to the Group financial statements.
F-258
www.global-reports.com
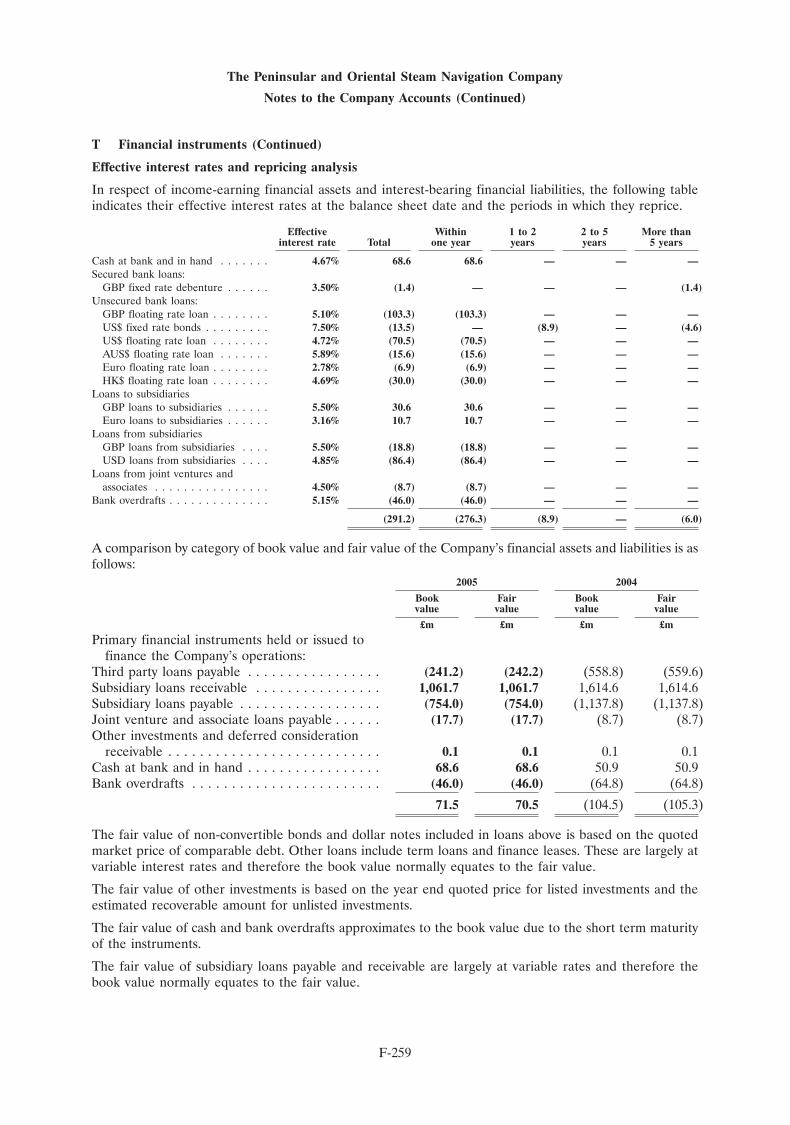
The Peninsular and Oriental Steam Navigation Company
Notes to the Company Accounts (Continued)
T Financial instruments (Continued)
Effective interest rates and repricing analysis
In respect of income-earning financial assets and interest-bearing financial liabilities, the following tableindicates their effective interest rates at the balance sheet date and the periods in which they reprice.
Effective Within 1 to 2 2 to 5 More thaninterest rate Total one year years years 5 years
Cash at bank and in hand . . . . . . . 4.67% 68.6 68.6 — — —Secured bank loans:
GBP fixed rate debenture . . . . . . 3.50% (1.4) — — — (1.4)Unsecured bank loans:
GBP floating rate loan . . . . . . . . 5.10% (103.3) (103.3) — — —US$ fixed rate bonds . . . . . . . . . 7.50% (13.5) — (8.9) — (4.6)US$ floating rate loan . . . . . . . . 4.72% (70.5) (70.5) — — —AUS$ floating rate loan . . . . . . . 5.89% (15.6) (15.6) — — —Euro floating rate loan . . . . . . . . 2.78% (6.9) (6.9) — — —HK$ floating rate loan . . . . . . . . 4.69% (30.0) (30.0) — — —
Loans to subsidiariesGBP loans to subsidiaries . . . . . . 5.50% 30.6 30.6 — — —Euro loans to subsidiaries . . . . . . 3.16% 10.7 10.7 — — —
Loans from subsidiariesGBP loans from subsidiaries . . . . 5.50% (18.8) (18.8) — — —USD loans from subsidiaries . . . . 4.85% (86.4) (86.4) — — —
Loans from joint ventures andassociates . . . . . . . . . . . . . . . . 4.50% (8.7) (8.7) — — —
Bank overdrafts . . . . . . . . . . . . . . 5.15% (46.0) (46.0) — — —
(291.2) (276.3) (8.9) — (6.0)
A comparison by category of book value and fair value of the Company’s financial assets and liabilities is asfollows:
2005 2004
Book Fair Book Fairvalue value value value
£m £m £m £m
Primary financial instruments held or issued tofinance the Company’s operations:
Third party loans payable . . . . . . . . . . . . . . . . . (241.2) (242.2) (558.8) (559.6)Subsidiary loans receivable . . . . . . . . . . . . . . . . 1,061.7 1,061.7 1,614.6 1,614.6Subsidiary loans payable . . . . . . . . . . . . . . . . . . (754.0) (754.0) (1,137.8) (1,137.8)Joint venture and associate loans payable . . . . . . (17.7) (17.7) (8.7) (8.7)Other investments and deferred consideration
receivable . . . . . . . . . . . . . . . . . . . . . . . . . . . 0.1 0.1 0.1 0.1Cash at bank and in hand . . . . . . . . . . . . . . . . . 68.6 68.6 50.9 50.9Bank overdrafts . . . . . . . . . . . . . . . . . . . . . . . . (46.0) (46.0) (64.8) (64.8)
71.5 70.5 (104.5) (105.3)
The fair value of non-convertible bonds and dollar notes included in loans above is based on the quotedmarket price of comparable debt. Other loans include term loans and finance leases. These are largely atvariable interest rates and therefore the book value normally equates to the fair value.
The fair value of other investments is based on the year end quoted price for listed investments and theestimated recoverable amount for unlisted investments.
The fair value of cash and bank overdrafts approximates to the book value due to the short term maturityof the instruments.
The fair value of subsidiary loans payable and receivable are largely at variable rates and therefore thebook value normally equates to the fair value.
F-259
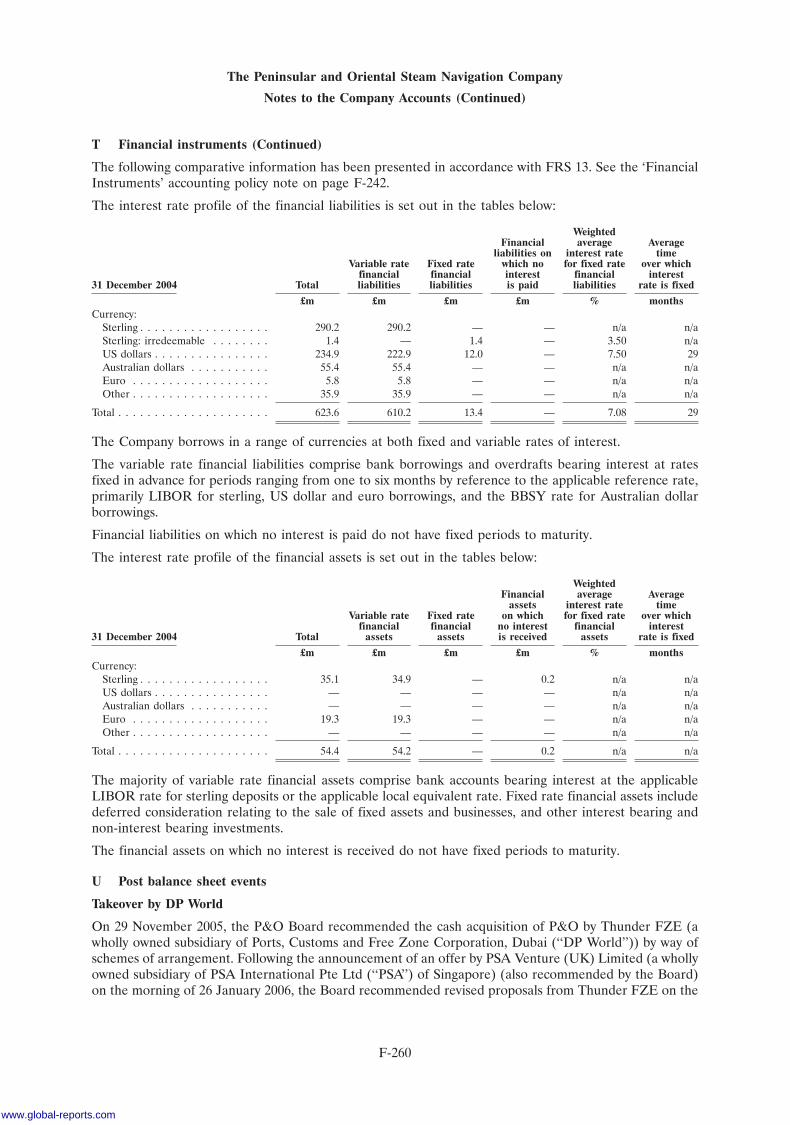
The Peninsular and Oriental Steam Navigation Company
Notes to the Company Accounts (Continued)
T Financial instruments (Continued)
The following comparative information has been presented in accordance with FRS 13. See the ‘FinancialInstruments’ accounting policy note on page F-242.
The interest rate profile of the financial liabilities is set out in the tables below:
WeightedFinancial average Average
liabilities on interest rate timeVariable rate Fixed rate which no for fixed rate over which
financial financial interest financial interest31 December 2004 Total liabilities liabilities is paid liabilities rate is fixed
£m £m £m £m % monthsCurrency:
Sterling . . . . . . . . . . . . . . . . . . 290.2 290.2 — — n/a n/aSterling: irredeemable . . . . . . . . 1.4 — 1.4 — 3.50 n/aUS dollars . . . . . . . . . . . . . . . . 234.9 222.9 12.0 — 7.50 29Australian dollars . . . . . . . . . . . 55.4 55.4 — — n/a n/aEuro . . . . . . . . . . . . . . . . . . . 5.8 5.8 — — n/a n/aOther . . . . . . . . . . . . . . . . . . . 35.9 35.9 — — n/a n/a
Total . . . . . . . . . . . . . . . . . . . . . 623.6 610.2 13.4 — 7.08 29
The Company borrows in a range of currencies at both fixed and variable rates of interest.
The variable rate financial liabilities comprise bank borrowings and overdrafts bearing interest at ratesfixed in advance for periods ranging from one to six months by reference to the applicable reference rate,primarily LIBOR for sterling, US dollar and euro borrowings, and the BBSY rate for Australian dollarborrowings.
Financial liabilities on which no interest is paid do not have fixed periods to maturity.
The interest rate profile of the financial assets is set out in the tables below:
WeightedFinancial average Average
assets interest rate timeVariable rate Fixed rate on which for fixed rate over which
financial financial no interest financial interest31 December 2004 Total assets assets is received assets rate is fixed
£m £m £m £m % monthsCurrency:
Sterling . . . . . . . . . . . . . . . . . . 35.1 34.9 — 0.2 n/a n/aUS dollars . . . . . . . . . . . . . . . . — — — — n/a n/aAustralian dollars . . . . . . . . . . . — — — — n/a n/aEuro . . . . . . . . . . . . . . . . . . . 19.3 19.3 — — n/a n/aOther . . . . . . . . . . . . . . . . . . . — — — — n/a n/a
Total . . . . . . . . . . . . . . . . . . . . . 54.4 54.2 — 0.2 n/a n/a
The majority of variable rate financial assets comprise bank accounts bearing interest at the applicableLIBOR rate for sterling deposits or the applicable local equivalent rate. Fixed rate financial assets includedeferred consideration relating to the sale of fixed assets and businesses, and other interest bearing andnon-interest bearing investments.
The financial assets on which no interest is received do not have fixed periods to maturity.
U Post balance sheet events
Takeover by DP World
On 29 November 2005, the P&O Board recommended the cash acquisition of P&O by Thunder FZE (awholly owned subsidiary of Ports, Customs and Free Zone Corporation, Dubai (‘‘DP World’’)) by way ofschemes of arrangement. Following the announcement of an offer by PSA Venture (UK) Limited (a whollyowned subsidiary of PSA International Pte Ltd (‘‘PSA’’) of Singapore) (also recommended by the Board)on the morning of 26 January 2006, the Board recommended revised proposals from Thunder FZE on the
F-260
www.global-reports.com
The Peninsular and Oriental Steam Navigation Company
Notes to the Company Accounts (Continued)
U Post balance sheet events (Continued)
evening of 26 January 2006. These proposals were approved by the stockholders at meetings held on13 February 2006, and following approval of the schemes by the High Court the schemes became effectiveon 8 March 2006 and P&O became a wholly owned subsidiary of DP World as at that date.
As a result of the change of control following the DP World takeover certain borrowing and loan facilitiesmay be cancelled at the bank’s option (see note J). DP World has arranged sufficient finance to allow anyamounts drawn under these facilities to be repaid as they fall due.
F-261

(This page has been left blank intentionally.)
www.global-reports.com

(This page has been left blank intentionally.)
COMPANY
DP World LimitedP.O. Box 17000
Dubai, United Arab Emirates
SELLING SHAREHOLDER
Port & Free Zone World FZEP.O. Box 17000
Dubai, United Arab Emirates
JOINT GLOBAL COORDINATORS
Deutsche Bank AG, London Branch Merrill Lynch InternationalWinchester House Merrill Lynch Financial Centre
1 Great Winchester Street 2 King Edward StreetLondon EC2N 2DB London EC1A 1HQ
United Kingdom
Millennium Finance Corporation Ltd. SHUAA Capital psc(Regulated by the DFSA) Emirates Towers
The Gate Level 28East Wing, 2nd Floor P.O. Box 31045
Dubai International Financial Centre Dubai, United Arab EmiratesP.O. Box 125952
Dubai, United Arab Emirates
LEGAL ADVISERS
To the Company as to English and US law To the Company as to the laws of the UAEand the DIFC
Clifford Chance LLP Clifford Chance LLP10 Upper Bank Street 3rd Floor, The Exchange Building
London E14 5JJ Dubai International Financial CentreUnited Kingdom P.O. Box 9380
Dubai, United Arab Emirates
To the Company as to certain matters of UAE lawAl Tamimi & Company
6th Floor, Building 4 EastDubai International Financial Centre
P.O. Box 9275Dubai, United Arab Emirates
To the Joint Global Coordinators To the Joint Global Coordinatorsand the Underwriters and the Underwriters
as to English and US law as to the laws of the DIFCLinklaters LLP Linklaters LLPOne Silk Street Suite 4, 3rd Floor, Gate Building 3
London EC2Y 8HQ Dubai International Financial CentreUnited Kingdom P.O. Box 506516
Dubai, United Arab Emirates
AUDITORS TO THE COMPANY
KPMG LLPP.O. Box 3800
Level 32, Emirates TowersSheikh Zayed Road
Dubai, United Arab Emirates
www.global-reports.com

30OCT200721261833
Merrill Corporation Ltd, London07ZAD14702
www.global-reports.com