Embed Size (px)
Citation preview

FACTSHEET31 July 2017

2
Index
Commentary - Equity Outlook 1
Commentary - Debt Outlook 3
IDFC Classic Equity Fund 4
IDFC Sterling Equity Fund 5
IDFC Premier Equity Fund 6
IDFC Focused Equity Fund 7
IDFC Equity Fund 8
IDFC Nifty Fund 9
IDFC Infrastructure Fund 10
IDFC Tax Advantage (ELSS) Fund 11
IDFC Arbitrage Fund 12
IDFC Arbitrage Plus Fund 13
IDFC Sensex Exchange Traded Fund 14
IDFC Nifty Exchange Traded Fund 14
IDFC Dynamic Equity Fund 15
IDFC Balanced Fund 16
IDFC Monthly Income Plan 17
IDFC Asset Allocation Fund of Funds 18
IDFC All Seasons Bond Fund 19
IDFC Cash Fund 20
IDFC Ultra Short Term Fund 21
IDFC Money Manager Fund – Treasury Plan 22
IDFC Money Manager Fund – Investment Plan 23
IDFC Banking & PSU Debt Fund 24
IDFC Super Saver Income Fund – Short Term 25
IDFC Corporate Bond Fund 26
IDFC Credit Opportunities Fund 27
IDFC Super Saver Income Fund – Medium Term 28
IDFC Super Saver Income Fund – Investment Plan 29
IDFC Dynamic Bond Fund 30
IDFC Government Securities Fund – Short Term Plan 31
IDFC Government Securities Fund – Provident Fund Plan 32
IDFC Government Securities Fund – Investment Plan 32
Performance Table 33
SIP Performance 36
Dividend History 38
Fund Manager Details 40
Investment Objective 40

1
WHAT WENT BY
Global Factors
Global Economy seems to be firing, finally: Global economy appears to be in the middle of a synchronised global recovery. This is, in fact, the first time since ‘09 that all regions are participating. In ‘10-’11, Eurozone was the headwind given Greek and Italian debt issues, and in ‘12-’15, EMs disappointed, driven by China, Brazil and Russia. This time around, the Eurozone activity momentum is strong, as seen in latest PMIs and IFO prints, which are consistent with 3% real GDP growth. EMs are also encouraging, with favourable base effects, ex China. Chinese growth momentum is under pressure given the rollover in stimulus support, but even there, house prices, consumption and loan growth remain stable.
President Trump and the Fed continue to be the focal points: After facing defeat in the efforts to repeal Obamacare, President Trump is expected to shift his focus to cutting Corporate Tax Rates in the US. US corporates are currently subject to 35% Federal tax rate, in addition to state taxes. President Trump plans to cut this tax rate to 15%, in effect boosting EPS and further supporting valuations. S&P 500 Index was up 2.06% in the month of July. The index is up 17.1% since 8th November 2016, the day of Trump’s election victory. The US Fed is expected to continue raising interest rates through the year, though the frequency of these hikes may be limited to 2 as against earlier expectation of 3-4 hikes in CY 17.
After strengthening for last couple of years, weakness in dollar: After the strength seen in the Dollar for the last couple of years due to the prospects of Fed raising interest rates, dollar has continued to depreciate after hitting a high in December. A key factor in Dollar weakness is the resurgence in Euro after positive electoral results in France and receding fears of nationalist/centrist parties gaining ground across key countries. In July, the Dollar Index depreciated 2.93%. Weak dollar was good news for emerging markets, resulting in increased FII flows. Any reversal in this trend will be negative for emerging markets including India.
Domestic Factors:
Markets continue upward surge: Domestic indices continued the upward momentum in July with NIFTY, NSE Midcap and NSE Small Cap gaining 6.86%, 4.64% and 6.81% respectively. NIFTY and SENSEX both hit all time high levels during the month with the NIFTY Index crossing 10,000 for the first time ever.
BJP and JDU combine to form government in Bihar: The BJP consolidated its political position over the month. Mr. Ram Nath Kovind, the BJP’s nominee got elected as President of India by a better than expected majority. Nitish Kumar led JDU formed an alliance with the BJP to form the Government in Bihar. This alliance should strengthen the BJP political position, both in the State and at the Centre (particularly in the Upper House of Parliament) and bodes well for their performance in the National Elections in 2019.
GST goes live, short term uncertainty expected: India’s landmark goods and services tax (GST) went live on July 1st. GST is one of the most ambitious reforms ever attempted in India, with a single tax rate per good or service across the country, replacing a myriad of central, state, inter-state and local taxes. Key benefits of new tax regime include a) India finally becomes a common market for all goods and services which should significantly ease the movement across the country, reduce transactions costs, and boost allocative efficiency. 2) the self-policing nature of a value added tax is likely to increase compliance, broaden the tax base and eventually boost tax revenues. 3) Moving from production to consumption taxes is likely to have several redistributive consequences across states. Tax revenues are likely to move from large production states (Gujarat, Maharashtra, Tamil Nadu) to large consumption states (Uttar Pradesh, Bihar, Madhya Pradesh). In the near term, growth hit is possible as firms have been running down inventories ahead of GST, along with teething problems/implementation challenges that could impact activity in the first 2Qs of FY18. We also note that restocking could be more gradual over the next 2-3 Qs thereby keeping near term growth moderate.
Monsoon appears to be normal, South still a worry- Cumulative rainfall is 2% above normal on an aggregate basis (June 1st-July 30th). Out of 36 meteorological subdivisions, rainfall so far has been excess /normal in 30 and deficient in 6 meteorological sub-divisions. Kharif crop sowing is underway with acreage up 3% y/y as per the latest data received. Water Reservoir Levels move up considerably w/w.
Inflation still muted: CPI prices contracted for a third consecutive month, & pulled down June CPI inflation to a series-low of 1.5% and from 2.2% in May. Muted price pressures were visible across the board. Food prices declined for a third straight month taking year-on-year food inflation to - 1.2%, also a series-low. More importantly, monthly core-core price momentum remained soft at 0.2% m/m, in June causing year-on-year core-core inflation to remain at 4% -- the RBI’s medium-term inflation target – for a third consecutive month. June WPI fell to 0.9% in June vs. 2.17% in May as food prices eased. Inflation in pulses, vegetables and potatoes declined the most. Benchmark 10 year treasury yields have eased by 4bps in July to 6.47%. Inflation trends both WPI and CPI have remained soft
Commentary - Equity OutlookMr. Anoop Bhaskar Head - Equity

2
thereby increasing expectations of a rate cut at the upcoming monetary policy meeting. Fiscal deficit at the end of Jun stood at 80.8% (vs. 61.1% LY) of the budgeted annual deficit. INR appreciated by 0.8% (vs. USD) in July to 64.1. Note the DXY depreciated by 2.9% over the month. India FX reserves increased marginally to US$391Bn.
Macro-economic variables mostly stable: Crude prices strengthened over the last month by 7.6% to $49.5 levels. India’s monthly trade deficit remained elevated for a 3rd consecutive month, narrowing only modestly to $12.96 billion from the 30-month high of $13.8 billion in May. The monthly trade deficit has averaged $13.4 billion over the last 3 months, versus $10.5 billion over prior 6 months thereby accentuating the trend of widening deficits. More importantly, the widening in recent months has come largely on the import front, primarily from higher non-oil, non-gold imports compounded by a rise in gold/silver imports. India’s manufacturing PMI softened to 50.9 in June from 51.6 in May as industrial firms undertook production cuts to run down inventories before the introduction of GST given perceived uncertainty about the treatment of pre-existing inventories. On the other hand, the June services PMI continued to recover, increasing from 52.2 in May to 53.1 in June –though still below the pre-demonetization levels. May-17 IP grew sequentially by 0.4% m/m, taking the year-on-year print to 1.7%. Recovery after demonetization is still very incomplete. The average monthly momentum from January to May is 0.5% m/m, which is below the pre-demonetization run rate of 0.6% m/m, (August to October). While consumer durables grew for the third successive month in May, seasonally adjusted monthly production is still lower than the levels witnessed in October before demonetization. In a pleasant surprise, consumer non-durables had another strong month in May. Investment growth however continues to be lacklustre.
Earnings slightly above depressed estimates: 1QFY18 Earnings growth so far has been decent with +1% Y/Y earnings for Nifty universe (~60% reported) despite GST transition led destocking impact in most sectors. We note that metal companies with favourable base are yet to report. Initial read through suggests that Telecom & Cement sectors have surprised positively. Healthcare (Dr Reddy’s) and Energy (ONGC) have been laggards. Financials performance in 1Q has been mixed with retail banks/ rural NBFC franchise seeing positive trends on growth; while corporate lenders continue to disappoint on asset quality pressures.
GOING FORWARD
Broader indices like BSE 200 registered double digit earnings growth in Q3 and Q4 FY 17 led by commodity and energy stocks. Though this trend may be broken in Q1 FY 18 due to destocking on implementation of GST, restocking along with early onset of the festive season should boost Q2 and Q3 earnings. Over the medium term, pickup in nominal GDP growth, two consecutive normal monsoons, GST implementation, government spending and the 7th Pay Commission should boost earnings growth towards the elusive 15-17% range. In this context, the current market levels don’t signify a market top. Though a market correction shouldn’t be ruled out, there could be price as well as time correction. For the medium term, the revival in earnings growth should provide a foundation for the current uptrend to sustain.
Currency & Commodities Last Price % Change YTD % Change MTD
USD / INR 64.188 -5.50% -0.61%
Dollar Index 92.86 -9.14% -2.89%
Gold 1,269.44 10.17% 2.25%
Crude OIL
WTI (Nymex) 50.17 -6.61% 8.97%
Brent Crude 52.65 -7.34% 9.87%
India Macro Analysis Latest Equity Flows USD Mn
GDP 6.10 FII (USD mln)
IIP 1.70 YTD 8,826.90
Inflation (WPI Monthly) 0.90 MTD 388.69
Inflation (CPI Monthly) 1.54 *DII (USD mln)
Commodity (CRB Index) 441.74 YTD 8,244.21
MTD 1,830.20
Data as on 31st July 2017
Equity Markets Index % Change YTD % Change MTD P/E
Nifty 10,077.10 23.10% 5.84% 19.54
Sensex 32,514.94 22.12% 5.15% 20.14
Dow Jones 21,891.12 10.77% 2.54% 18.08
Shanghai 3,273.03 5.46% 2.52% 14.48
Nikkei 19,925.18 4.24% -0.54% 17.17
Hang Sang 27,323.99 24.20% 6.05% 13.12
FTSE 7,372.00 3.21% 0.81% 15.38
MSCI E.M. (USD) 1,066.23 23.65% 5.48% 13.62
MSCI D.M.(USD) 1,961.10 11.98% 2.33% 17.53
MSCI India (INR) 1,193.33 21.37% 6.56% 19.34
Source: Bloomberg, SEBI
3
WHAT WENT BY
RBI in its August’17 monetary policy cut the key rates by 25bps while maintaining its neutral stance of monetary policy – repo rate was reduced by 25bps from 6.25% to 6%. Consequently, the reverse repo rate stands adjusted to 5.75%, and the marginal standing facility (MSF) rate and the Bank Rate to 6.25%. The confidence for the rate cut implemented has come about owing to 1) A downward shift in assessment of future CPI even from the last policy. The baseline path of headline CPI has fallen to a little over 4% by Q4. In fact the Governor mentioned that including central HRA also the assessment for Q4 is of CPI to be closer to 4%. 2) Core CPI has fallen significantly over the past 3 months. 3) GST roll out has been smooth and monsoons normal.
On the global front, as was widely expected, US Fed maintained status quo in its July policy. However FOMC did mention that they would ‘begin implementing its balance sheet normalization program “relatively soon”, provided that the economy evolves broadly as anticipated. The ECB too in its monetary policy kept the rates unchanged.
Liquidity in the banking system continues to be in surplus. The average liquidity was around 2,90,000 cr for July’17. In order to absorb this excess liquidity, so far this fiscal year RBI has conducted around INR 20,000cr worth of OMO sales, another 10,000cr of auction for August 10th has been announced. The 10 year yield declined by 5bps to end at 6.47%, after remaining range-bound for most of the month In spite of OMO sales on expectations of lower inflation prints and expectations of a rate cut in the August policy.
Both CPI and WPI readings inched sharply lower this month. The CPI inflation reading was lower than RBI’s H1FY17 inflation projection of 2-3.5%. CPI eased to a record low of 1.54% in June’17 from 2.18% in May’17 on account of favourable base effect and fall in prices of food articles. Food prices continued to deflate in June as well. Further, Core CPI too dropped below 4% to 3.8% for June’17. Meanwhile WPI slipped to a low of 0.9% compared to 2.17% in May’17.
GOING FORWARD
Both the RBI and markets have been somewhat surprised by the extent of fall in CPI and both are struggling to figure out how much of this is likely to be structural. The MPC has an open mind and seems willing to act further if parts of the current disinflation prove to be structural. While it is obvious that inflation is going to rise from here, the question is how much does it rise to once the dust settles on the current temporary factors at play. And on this, the RBI’s verdict seems to be that it will settle lower than where it earlier thought it would; and probably not very much higher than its 4% target.
Further the MPC is quite worried about private sector growth. While this may not directly entail a reaction from that, it is reasonably clear that they will not look for the closing of output gaps in the near foreseeable future. There is a chance that the RBI steps up its liquidity operations as currency in circulation trends stabilize. Moreover as the MSS ceiling gets hiked it may eliminate the need to step up OMOs. Finally, the so-called real rate to be maintained will also ultimately depend on what the global backdrop is like. Thus if the current benign global backdrop persists then the MPC may have no choice but to eventually lower the real rate target or else sustain continued pain from an appreciating currency. A decisive turn to the cycle will have to be accompanied by either a turn in local CPI and / or an escalation in prospects of global volatility.
Given the above, bonds remain very much in play for asset allocators. Currently our preference for the time ahead is to run duration positions with government bonds. However, we continue to like spread bonds in the 5 – 6 year maturity and below; given the handsome carry that they provide even with respect to corresponding corporate bonds. Short term and medium term funds continue to look good given the attractive spread between overnight rate and front end bonds.
Commentary - Debt OutlookMr. Suyash Choudhary
Head - Fixed Income

4
IDFC Classic Equity FundAn open ended ‘diversified’ equity fund
31st July 2017
FUND FEATURES
INDUSTRY ALLOCATION
Size
Large Cap
Mid Cap
Small Cap
Style Growth Blend Value
About the Fund: IDFC Classic Equity fund is a diversified equity fund with a large cap bias currently. The focus of the fund is to build a portfolio of Quality companies while being cognizant of the relative valuation.
Nature: Equity
Monthly Avg AUM: ` 1,347.29 Crores
Month end AUM: ` 1,435.64 Crores
Inception Date: 9 August 2005
Fund Manager: Mr. Anoop Bhaskar (w.e.f. 30th April 2016)
Other Parameter: Beta 1.02
R Square 0.91
Standard Deviation (Annualized) 14.12%
Sharpe* 0.75
Portfolio Turnover Equity 0.29
Aggregate^ 1.81
Expense Ratio Regular 2.17%
Direct 0.95%
Benchmark: S&P BSE 200
SIP (Minimum Amount): ` 1,000/-
SIP Frequency: Monthly
SIP Dates (Monthly): Any day of the month, except 29th, 30th & 31st day of the monthInvestment Objective: Refer Pg No from 40 to 41 Minimum Investment Amount : ` 5,000/- and any amount thereafter
Option Available: Growth, Dividend - (Payout, Reinvestment and Sweep (from Equity Schemes to Debt Schemes only))
Exit Load: 1% if redeemed within 365 days from the date of allotment. (w.e.f. 10th May 2016)
Top 10 Equity Holdings
Banks 24.17%Finance 7.39%Software 6.98%Petroleum Products 6.33%Auto 6.00%Power 5.44%Auto Ancillaries 5.10%Consumer Non Durables 4.66%Cement 3.79%Pharmaceuticals 3.58%Retailing 3.44%Construction Project 3.05%
Performance Table Regular Plan - Growth Direct Plan - GrowthScheme Name CAGR Returns (%) Current Value of Investment of ` 10,000 CAGR Returns (%) Current Value of Investment of ` 10,000
1 Year 3 Years 5 Years
SinceInceptionAug 09,
2005
1 Year 3 Years 5 Years
SinceInceptionAug 09,
2005
1 Year3
Years5
Years
SinceInception
Jan 01, 20131 Year 3 Years 5 Years
SinceInception
Jan 01, 2013
IDFC Classic Equity Fund 24.65% 16.79% 17.65% 12.95% 12,480 15,939 22,553 43,020 26.69% 18.56% NA 16.23% 12,685 16,673 NA 19,913
S&P BSE 200# 18.56% 11.68% 15.68% 13.24% 11,867 13,933 20,722 44,369 18.56% 11.68% NA 13.57% 11,867 13,933 NA 17,911
Nifty 50## 16.56% 9.27% 14.01% 13.04% 11,665 13,051 19,272 43,460 16.56% 9.27% NA 12.19% 11,665 13,051 NA 16,934
The fund is being managed by Mr. Anoop Bhaskar (w.e.f. 30th April 2016)Performance based on NAV as on 31/07/2017. Past performance may or may not be sustained in future.For other funds managed by the fund manager, please refer page no. 33 - 35 & the respective fund pages Regular and Direct Plans have different expense structure. Direct Plan shall have a lower expense ratio excluding distribution expenses, commission expenses etc.*Risk-free rate assumed to be 6.25% (FBIL OVERNIGHT MIBOR as on 31st July 2017). Ratios calculated on the basis of 3 years history of monthly data. ^Portfolio Turnover ratio is calculated as Lower of purchase or sale during the period / Average AUM for the last one year (includes Fixed Income securities and Equity derivatives). #Benchmark Returns. ##Alternate Benchmark Returns.
SIP PERFORMANCE
Monthly SIP of ` 10,000 in IDFC Classic Equity Fund - Regular Plan - Growth
1 Year 3 Years 5 Years 7 Years 10 YearsSince
InceptionAug 09, 2005
Total Amount Invested (`) 1,20,000 3,60,000 6,00,000 8,40,000 12,00,000 14,40,000 Total Value as on July 31, 2017 (`) 1,38,966 4,78,001 9,45,863 14,71,241 23,84,791 31,59,391 Fund Returns (%) 30.72 19.32 18.27 15.73 13.17 12.38Total Value of S&P BSE 200# 1,37,083 4,46,998 8,81,472 13,54,747 22,52,946 30,28,519 S&P BSE 200 Returns (%)# 27.56 14.59 15.39 13.42 12.11 11.74Total Value of Nifty 50 Index## 1,36,500 4,34,380 8,36,566 12,83,988 21,25,229 28,68,861 Nifty 50 Index Returns (%)## 26.58 12.60 13.26 11.92 11.01 10.91Past performance may or may not be sustained in future.Dividends are assumed to be reinvested and bonus is adjusted. Load is not taken into consideration. To illustrate the advantages of SIP investment, this is how your investment would have grown if you had invested say `10,000 systematically on the first business Day of every month over a period of time. Returns are calculated by using XIRR approach. XIRR helps in calculating return on investment given an initial and final value and a series of cash inflows and outflows with the correct allowance for the time impact of the transactions. Regular and Direct plans have different expense structure. Direct Plan shall have a lower expense ratio excluding distribution expenses, commision expenses etc. #Benchmark Returns. ##Alternate Benchmark Returns. Data as on July 31, 2017.
Riskometer
Investors understand that their principal will be at Moderately High risk
This product is suitable for investors who are seeking*:
Create wealth over a long period of time.•
Investment predominantly in equity and •equity related instruments across market capitalisation.
*Investors should consult their financial advisers if in doubt about whether the product is suitable for them.
Non - Ferrous Metals 2.66%Industrial Capital Goods 2.52%Gas 1.87%Hotels, Resorts And Other Recreational Activities
1.45%
Ferrous Metals 1.05%Industrial Products 1.01%Consumer Durables 0.99%Fertilisers 0.90%Chemicals 0.87%Oil 0.75%Textile Products 0.50%
NAV (`)
Regular Plan Growth 43.0195Regular Plan Dividend 15.9341Direct Plan Growth 45.4092Direct Plan Dividend 17.6340
PORTFOLIO
Name % of NAV
Equity and Equity related Instruments 94.51%Banks 24.17%HDFC Bank 6.86%IndusInd Bank 3.19%Kotak Mahindra Bank 2.68%Axis Bank 2.41%
RBL Bank 1.98%
The Federal Bank 1.54%
State Bank of India 1.39%
State Bank of India - Equity Futures 0.78%
ICICI Bank 1.12%
ICICI Bank - Equity Futures 0.73%
Punjab National Bank 0.66%
Bank of Baroda 0.46%
The Karnataka Bank 0.39%
Finance 7.39%Housing Development Finance Corporation 2.48%
ICICI Prudential Life Insurance Company 0.99%
SREI Infrastructure Finance 0.94%
Max Financial Services 0.85%
Mahindra & Mahindra Financial Services 0.77%
Magma Fincorp 0.73%
Ratings 0.63%
Software 6.98%Infosys 4.28%
HCL Technologies 1.17%
KPIT Technologies 0.89%
Mastek 0.64%
Petroleum Products 6.33%Reliance Industries 3.38%
Indian Oil Corporation 1.26%
Bharat Petroleum Corporation 0.85%
Castrol India 0.84%
Auto 6.00%Hero MotoCorp 2.32%
Maruti Suzuki India 1.66%
Mahindra & Mahindra 1.25%
Bajaj Auto 0.78%
Power 5.44%NTPC 1.42%
Kalpataru Power Transmission 1.41%
Power Grid Corporation of India 1.35%
Nava Bharat Ventures 1.26%
Auto Ancillaries 5.10%MRF 1.77%
Minda Industries 1.44%
Apollo Tyres 1.23%
Exide Industries 0.66%
Consumer Non Durables 4.66%ITC 3.47%
Tata Coffee 0.63%
DCM Shriram 0.55%
Cement 3.79%
Name % of NAV
Ambuja Cements 1.44%
Deccan Cements 0.79%
UltraTech Cement 0.57%
Sagar Cements 0.50%
The Ramco Cements 0.48%
Pharmaceuticals 3.58%Indoco Remedies 1.25%
Cadila Healthcare 0.82%
Lupin 0.52%
Sun Pharmaceutical Industries 0.51%
Eris Lifesciences 0.49%
Retailing 3.44%Future Retail 1.80%
Future Lifestyle Fashions 1.64%
Construction Project 3.05%Larsen & Toubro 3.05%
Non - Ferrous Metals 2.66%Vedanta 1.61%
Hindalco Industries 1.04%
Industrial Capital Goods 2.52%Bharat Electronics 1.30%
Skipper 0.72%
CG Power and Industrial Solutions 0.50%
Gas 1.87%GAIL (India) 1.23%
Petronet LNG 0.64%
Hotels, Resorts And Other Recreational Activities 1.45%The Indian Hotels Company 0.96%
Taj GVK Hotels & Resorts 0.49%
Ferrous Metals 1.05%JSW Steel 0.99%
Jindal Steel & Power 0.06%
Industrial Products 1.01%Bharat Forge 1.01%
Consumer Durables 0.99%Sheela Foam 0.58%
Crompton Greaves Consumer Electricals 0.41%
Fertilisers 0.90%Coromandel International 0.90%
Chemicals 0.87%Deepak Nitrite 0.87%
Oil 0.75%Oil & Natural Gas Corporation 0.75%
Textile Products 0.50%Dollar Industries 0.50%
Preference Shares 0.02%Media & Entertainment 0.02%Zee Entertainment Enterprises 0.02%
Net Cash and Cash Equivalent 5.48%Grand Total 100.00%

5
IDFC Sterling Equity FundAn open ended ‘mid cap’ equity fund
31st July 2017
FUND FEATURES
INDUSTRY ALLOCATION
Size
Large Cap
Mid Cap
Small Cap
Style Growth Blend Value
About the Fund: IDFC Sterling Equity Fund is a mid/small cap fund that focuses on active stock selection strategy.
Nature: Equity
Monthly Avg AUM: ` 1,519.98 Crores
Month end AUM: ` 1,553.86 Crores
Inception Date: 7 March 2008
Fund Manager: Mr. Anoop Bhaskar (w.e.f. 30th April 2016) & Mr. Daylynn Pinto (w.e.f. 20th October 2016)
Other Parameter:
Beta 1.06
R Square 0.83
Standard Deviation (Annualized) 16.67%
Sharpe* 0.85
Portfolio Turnover
Equity 0.38 Aggregate^ 0.45
Expense Ratio
Regular 2.15%
Direct 1.36%
Benchmark: Nifty Free Float Midcap 100
SIP (Minimum Amount): ` 1,000/-
SIP Frequency: Monthly
SIP Dates (Monthly): Any day of the month, except 29th, 30th & 31st day of the monthInvestment Objective: Refer Pg No from 40 to 41
Minimum Investment Amount : ` 5,000/- and any amount thereafter
Option Available: Growth, Dividend (Payout, Reinvestment and Sweep (from Equity Schemes to Debt Schemes only))
Exit Load: 1.00% if redeemed on or before 365 days from the date of allotment. (w.e.f. 7th September, 2015)
Top 10 Equity Holdings
Banks 12.28%Auto Ancillaries 10.65%Retailing 10.12%Construction Project 9.02%Finance 7.73%Cement 6.06%Industrial Capital Goods 5.73%Media & Entertainment 3.64%Consumer Non Durables 3.51%Pharmaceuticals 3.43%Software 3.31%Power 3.17%
Performance Table Regular Plan - Growth Direct Plan - GrowthScheme Name CAGR Returns (%) Current Value of Investment of ` 10,000 CAGR Returns (%) Current Value of Investment of ` 10,000
1 Year 3 Years 5 YearsSince
InceptionMar 07, 2008
1 Year 3 Years 5 YearsSince
InceptionMar 07, 2008
1 Year 3 Years 5 YearsSince
InceptionJan 01, 2013
1 Year 3 Years 5 YearsSince
InceptionJan 01, 2013
IDFC Sterling Equity Fund 32.93% 20.50% 22.46% 18.86% 13,314 17,506 27,556 50,788 34.19% 21.50% NA 21.17% 13,441 17,945 NA 24,098
Nifty Free Float Midcap 100#
25.18% 19.52% 20.88% 11.77% 12,533 17,083 25,828 28,478 25.18% 19.52% NA 18.21% 12,533 17,083 NA 21,522
Nifty 50## 16.56% 9.27% 14.01% 8.27% 11,665 13,051 19,272 21,119 16.56% 9.27% NA 12.19% 11,665 13,051 NA 16,934
The fund is being managed by Mr. Anoop Bhaskar (w.e.f. 30th April 2016) & Mr. Daylynn Pinto (w.e.f. 20th October 2016) Performance based on NAV as on 31/07/2017. Past performance may or may not be sustained in future.For other funds managed by the fund manager, please refer page no. 33 - 35 & the respective fund pages Regular and Direct Plans have different expense structure. Direct Plan shall have a lower expense ratio excluding distribution expenses, commission expenses etc.*Risk-free rate assumed to be 6.25% (FBIL OVERNIGHT MIBOR as on 31st July 2017). Ratios calculated on the basis of 3 years history of monthly data. ^Portfolio Turnover ratio is calculated as Lower of purchase or sale during the period / Average AUM for the last one year (includes Fixed Income securities and Equity derivatives). #Benchmark Returns. ##Alternate Benchmark Returns.
SIP PERFORMANCE
Monthly SIP of ` 10,000 in IDFC Sterling Equity Fund - Regular Plan - Growth
1 Year 3 Years 5 Years 7 YearsSince
InceptionMar 07, 2008
Total Amount Invested (`) 1,20,000 3,60,000 6,00,000 8,40,000 11,30,000
Total Value as on July 31, 2017 (`) 1,47,140 5,02,344 10,79,989 17,54,517 31,78,282
Fund Returns (%) 44.68 22.90 23.74 20.68 20.97
Total Value of Nifty Free Float Midcap 100# 1,37,871 4,86,863 10,50,510 16,22,885 26,25,906
Nifty Free Float Midcap 100 Returns (%)# 28.88 20.64 22.59 18.48 17.17
Total Value of Nifty 50 Index## 1,36,500 4,34,380 8,36,566 12,83,988 19,90,349
Nifty 50 Index Returns (%)## 26.58 12.60 13.26 11.92 11.62
Past performance may or may not be sustained in future.Dividends are assumed to be reinvested and bonus is adjusted. Load is not taken into consideration. To illustrate the advantages of SIP investment, this is how your investment would have grown if you had invested say `10,000 systematically on the first business Day of every month over a period of time. Returns are calculated by using XIRR approach. XIRR helps in calculating return on investment given an initial and final value and a series of cash inflows and outflows with the correct allowance for the time impact of the transactions. Regular and Direct plans have different expense structure. Direct Plan shall have a lower expense ratio excluding distribution expenses, commision expenses etc. #Benchmark Returns. ##Alternate Benchmark Returns. Data as on July 31, 2017.
Riskometer
Investors understand that their principal will be at Moderately High risk
This product is suitable for investors who are seeking*:
Create wealth over a long period of time.•
Investment predominantly in equity and equity •related instruments in the mid cap segment.
*Investors should consult their financial advisers if in doubt about whether the product is suitable for them.
Hotels, Resorts And Other Recreational Activities 2.72%
Consumer Durables 2.71%Transportation 2.48%Petroleum Products 2.23%Textile Products 2.03%Industrial Products 2.00%Gas 1.73%Chemicals 1.31%Ferrous Metals 0.99%Miscellaneous 0.92%Fertilisers 0.80%Oil 0.32%
NAV (`)Regular Plan Growth 50.7879Regular Plan Dividend 21.1456Direct Plan Growth 52.7532Direct Plan Dividend 22.0988
PORTFOLIO
Name % of NAV
Equity and Equity related Instruments 98.88%Banks 12.28%IndusInd Bank 4.13%Union Bank of India 1.63%RBL Bank 1.61%RBL Bank - Equity Futures 0.22%The Karnataka Bank 1.07%Bank of Baroda 1.04%The Federal Bank 0.96%Punjab National Bank 0.84%Lakshmi Vilas Bank 0.78%Auto Ancillaries 10.65%Minda Industries 3.36%Exide Industries 1.68%Igarashi Motors India 1.64%Asahi India Glass 1.16%MRF 1.07%WABCO India 0.98%Sterling Tools 0.75%Retailing 10.12%Future Retail 5.99%V-Mart Retail 2.09%Aditya Birla Fashion and Retail 1.11%Future Lifestyle Fashions 0.93%Construction Project 9.02%KEC International 3.53%Voltas 1.95%Engineers India 1.94%NCC 1.60%Finance 7.73%Bajaj Finance 4.11%Magma Fincorp 1.14%Max Financial Services 1.02%Equitas Holdings 0.75%Mahindra & Mahindra Financial Services 0.71%Cement 6.06%The Ramco Cements 4.19%JK Lakshmi Cement 1.33%Sagar Cements 0.55%Industrial Capital Goods 5.73%Lakshmi Machine Works 1.73%Skipper 1.20%TD Power Systems 1.04%CG Power and Industrial Solutions 0.93%Bharat Electronics 0.84%Media & Entertainment 3.64%PVR 1.29%Zee Entertainment Enterprises 1.29%Entertainment Network (India) 1.06%Consumer Non Durables 3.51%
Name % of NAV
HBL Power Systems 1.78%Procter & Gamble Hygiene and Health Care 1.29%Linc Pen & Plastics 0.44%Pharmaceuticals 3.43%Aurobindo Pharma 1.48%Hikal 1.31%Indoco Remedies 0.64%Software 3.31%Cyient 1.28%Persistent Systems 1.04%KPIT Technologies 0.99%Power 3.17%Nava Bharat Ventures 1.20%Kalpataru Power Transmission 1.02%CESC 0.95%Hotels, Resorts And Other Recreational Activities 2.72%Wonderla Holidays 1.18%The Indian Hotels Company 0.88%EIH 0.66%Consumer Durables 2.71%Crompton Greaves Consumer Electricals 1.69%Greenply Industries 0.86%HPL Electric & Power 0.16%Transportation 2.48%VRL Logistics 2.48%Petroleum Products 2.23%Hindustan Petroleum Corporation 1.48%Castrol India 0.75%Textile Products 2.03%K.P.R. Mill 1.25%Dollar Industries 0.78%Industrial Products 2.00%KEI Industries 1.12%Bharat Forge 0.89%Gas 1.73%Petronet LNG 1.05%Gujarat Gas 0.68%Chemicals 1.31%Deepak Nitrite 1.31%Ferrous Metals 0.99%Jindal Steel & Power 0.99%Miscellaneous 0.92%Dishman Carbogen Amcis 0.92%Fertilisers 0.80%Gujarat State Fertilizers & Chemicals 0.80%Oil 0.32%Oil India 0.32%Net Cash and Cash Equivalent 1.12%Grand Total 100.00%

6
IDFC Premier Equity FundAn open ended ‘multi cap’ equity fund
31st July 2017
FUND FEATURES
INDUSTRY ALLOCATION
Size
Large Cap
Mid Cap
Small Cap
Style Growth Blend Value
About the Fund: IDFC Premier Equity Fund is a multi-cap Equity Fund. It is a fund that encourages systematic investing. The fund in the past has been opened for lump sum investments for limited time periods.
Nature: Equity
Monthly Avg AUM: ` 5,985.92 Crores
Month end AUM: ` 5,966.46 Crores
Inception Date: 28 September 2005
Fund Manager: Mr. Anoop Bhaskar (w.e.f. 30th April 2016)
Other Parameter:
Beta 0.91
R Square 0.75
Standard Deviation (Annualized) 14.05%
Sharpe* 0.71
Portfolio Turnover
Equity 0.23 Aggregate^ 0.28
Expense Ratio
Regular 2.00%
Direct 1.33%
Benchmark: S&P BSE 500
SIP (Minimum Amount): ` 2,000/-
SIP Frequency: Monthly
SIP Dates (Monthly): Any day of the month, except 29th, 30th & 31st day of the month
Investment Objective: Refer Pg No from 40 to 41Minimum Investment Amount: ` 10,000/- and any amount thereafter (During the period when the fund is open for lump sum subscription)
Option Available: Growth, Dividend - (Payout, Reinvestment and Sweep (from Equity Schemes to Debt Schemes only))
Exit Load: 1.00% if redeemed before 365 days from the date of allotment. (w.e.f. 1st September, 2009)
Top 10 Equity Holdings
Consumer Non Durables 11.52%
Finance 11.32%
Banks 8.48%
Transportation 7.79%
Industrial Products 7.26%
Pharmaceuticals 5.67%
Auto 5.18%
Construction Project 3.99%
Chemicals 3.98%
Auto Ancillaries 3.78%
Ferrous Metals 3.58%
Engineering Services 3.07%
Performance Table Regular Plan - Growth Direct Plan - GrowthScheme Name CAGR Returns (%) Current Value of Investment of ` 10,000 CAGR Returns (%) Current Value of Investment of ` 10,000
1 Year 3 Years 5 Years
SinceInception Sep 28, 2005
1 Year 3 Years 5 Years
SinceInceptionSep 28, 2005
1 Year 3 Years 5 Years
SinceInception
Jan 01, 20131 Year 3 Years 5 Years
SinceInception
Jan 01, 2013
IDFC Premier Equity Fund 12.71% 16.21% 21.85% 20.22% 11,279 15,700 26,874 88,620 13.58% 17.08% NA 19.53% 11,366 16,055 NA 22,640
S&P BSE 500# 19.83% 12.22% 16.03% 12.28% 11,995 14,135 21,038 39,434 19.83% 12.22% NA 13.92% 11,995 14,135 NA 18,165
Nifty 50## 16.56% 9.27% 14.01% 12.12% 11,665 13,051 19,272 38,787 16.56% 9.27% NA 12.19% 11,665 13,051 NA 16,934
The fund is being managed by Mr. Anoop Bhaskar (w.e.f. 30th April 2016)Performance based on NAV as on 31/07/2017. Past performance may or may not be sustained in future.For other funds managed by the fund manager, please refer page no. 33 - 35 & the respective fund pages Regular and Direct Plans have different expense structure. Direct Plan shall have a lower expense ratio excluding distribution expenses, commission expenses etc.*Risk-free rate assumed to be 6.25% (FBIL OVERNIGHT MIBOR as on 31st July 2017). Ratios calculated on the basis of 3 years history of monthly data. ^Portfolio Turnover ratio is calculated as Lower of purchase or sale during the period / Average AUM for the last one year (includes Fixed Income securities and Equity derivatives). #Benchmark Returns. ##Alternate Benchmark Returns.
SIP PERFORMANCE
Monthly SIP of ` 10,000 in IDFC Premier Equity Fund -Regular Plan - Growth
1 Year 3 Years 5 Years 7 Years 10 YearsSince
InceptionSep 28, 2005
Total Amount Invested (`) 1,20,000 3,60,000 6,00,000 8,40,000 12,00,000 14,30,000
Total Value as on July 31, 2017 (`) 1,34,099 4,42,158 9,82,000 16,37,187 32,86,536 50,42,360
Fund Returns (%) 22.60 13.83 19.81 18.73 19.14 19.65
Total Value of S&P BSE 500# 1,37,781 4,51,953 8,96,173 13,74,186 22,80,583 30,03,819
S&P BSE 500 Returns (%)# 28.73 15.36 16.06 13.82 12.33 11.81
Total Value of Nifty 50 Index## 1,36,500 4,34,380 8,36,566 12,83,988 21,25,229 28,22,092
Nifty 50 Index Returns (%)## 26.58 12.60 13.26 11.92 11.01 10.85Past performance may or may not be sustained in future.Dividends are assumed to be reinvested and bonus is adjusted. Load is not taken into consideration. To illustrate the advantages of SIP investment, this is how your investment would have grown if you had invested say `10,000 systematically on the first business Day of every month over a period of time. Returns are calculated by using XIRR approach. XIRR helps in calculating return on investment given an initial and final value and a series of cash inflows and outflows with the correct allowance for the time impact of the transactions. Regular and Direct plans have different expense structure. Direct Plan shall have a lower expense ratio excluding distribution expenses, commision expenses etc. #Benchmark Returns. ##Alternate Benchmark Returns. Data as on July 31, 2017.
Riskometer
Investors understand that their principal will be at Moderately High risk
This product is suitable for investors who are seeking*:
Create wealth over a long period of time.•
Investment predominantly in equity and •equity related instruments across market capitalisation.
*Investors should consult their financial advisers if in doubt about whether the product is suitable for them.
Gas 3.04%
IT Consulting & Other Services 2.90%
Cement 2.47%
Commercial Services 2.35%
Industrial Capital Goods 2.16%
Textiles - Cotton 1.91%
Textile Products 1.84%
Media & Entertainment 1.73%
Consumer Durables 1.54%
Construction 1.37%
Petroleum Products 1.26%
Retailing 0.75%
NAV (`)
Regular Plan Growth 88.6199Regular Plan Dividend 34.8406Direct Plan Growth 91.5594Direct Plan Dividend 35.8906
PORTFOLIO
Name % of NAV
Equity and Equity related Instruments 98.95%Consumer Non Durables 11.52%Asian Paints 3.04%Balrampur Chini Mills 2.58%Procter & Gamble Hygiene and Health Care 1.89%Britannia Industries 1.40%Mcleod Russel India 1.25%Colgate Palmolive (India) 0.80%S H Kelkar and Company 0.56%Finance 11.32%JM Financial 3.49%ICICI Prudential Life Insurance Company 2.78%Multi Commodity Exchange of India 1.88%Max Financial Services 1.23%Bharat Financial Inclusion 0.96%Shriram City Union Finance 0.90%CRISIL 0.08%Banks 8.48%HDFC Bank 3.29%Kotak Mahindra Bank 2.97%City Union Bank 1.18%RBL Bank 1.05%Transportation 7.79%Container Corporation of India 3.24%Blue Dart Express 2.38%TCI Express 1.20%Transport Corporation of India 0.98%Industrial Products 7.26%Greaves Cotton 2.97%FAG Bearings India 2.87%Ingersoll Rand (India) 0.77%Kirloskar Pneumatic Company 0.66%Pharmaceuticals 5.67%Sun Pharmaceutical Industries 1.65%Suven Life Sciences 1.19%Natco Pharma 1.14%Aurobindo Pharma 0.86%Eris Lifesciences 0.84%Auto 5.18%Maruti Suzuki India 3.25%Ashok Leyland 1.07%Hero MotoCorp 0.87%Construction Project 3.99%Voltas 3.55%Power Mech Projects 0.44%Chemicals 3.98%Tata Chemicals 2.39%Pidilite Industries 1.01%
Name % of NAV
Atul 0.58%Auto Ancillaries 3.78%Tube Investments of India 1.17%Minda Industries 0.96%MRF 0.94%Precision Camshafts 0.72%Ferrous Metals 3.58%APL Apollo Tubes 3.58%Engineering Services 3.07%VA Tech Wabag 3.07%Gas 3.04%Gujarat State Petronet 3.04%IT Consulting & Other Services 2.90%Cognizant Technology Solutions Corp - International Equities 2.90%
Cement 2.47%Ambuja Cements 2.47%Commercial Services 2.35%3M India 2.35%Industrial Capital Goods 2.16%Bharat Electronics 1.00%Disa India 0.73%Kennametal India 0.42%Textiles - Cotton 1.91%RSWM 1.03%Vardhman Textiles 0.88%Textile Products 1.84%Page Industries 1.84%Media & Entertainment 1.73%Entertainment Network (India) 1.17%Dish TV India 0.56%Consumer Durables 1.54%Bata India 1.54%Construction 1.37%Poddar Housing and Development 0.75%ITD Cementation India 0.62%Petroleum Products 1.26%Castrol India 1.26%Retailing 0.75%Future Retail 0.49%Future Lifestyle Fashions 0.26%Preference Shares 0.14%Media & Entertainment 0.14%Zee Entertainment Enterprises 0.14%Net Cash and Cash Equivalent 0.91%Grand Total 100.00%
7
IDFC Focused Equity Fund (The Fund was earlier known as IDFC Imperial Equity Fund)$$ An open ended ‘focused’ equity fund 31st July 2017
FUND FEATURES
INDUSTRY ALLOCATION
Size
Large Cap
Mid Cap
Small Cap
Style Growth Blend Value
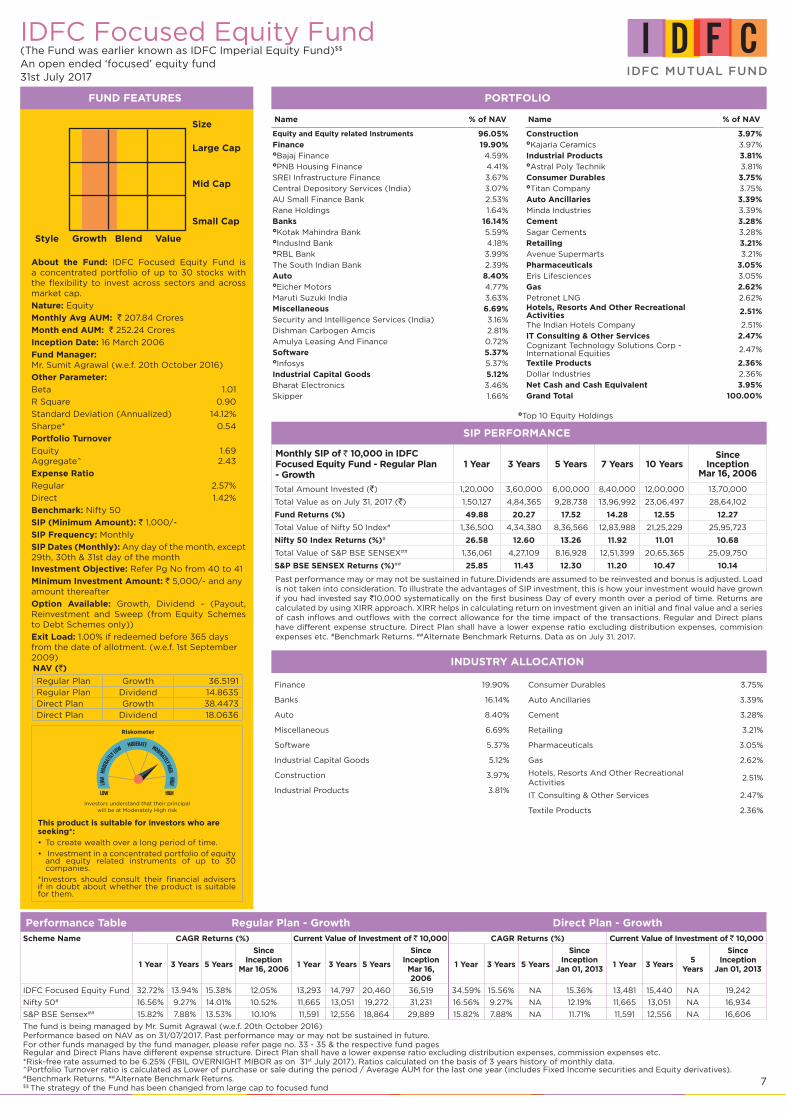
About the Fund: IDFC Focused Equity Fund is a concentrated portfolio of up to 30 stocks with the flexibility to invest across sectors and across market cap.
Nature: Equity
Monthly Avg AUM: ` 207.84 Crores
Month end AUM: ` 252.24 Crores
Inception Date: 16 March 2006
Fund Manager: Mr. Sumit Agrawal (w.e.f. 20th October 2016)
Other Parameter:
Beta 1.01
R Square 0.90
Standard Deviation (Annualized) 14.12%
Sharpe* 0.54
Portfolio Turnover
Equity 1.69 Aggregate^ 2.43
Expense Ratio
Regular 2.57%
Direct 1.42%
Benchmark: Nifty 50
SIP (Minimum Amount): ` 1,000/-
SIP Frequency: Monthly
SIP Dates (Monthly): Any day of the month, except 29th, 30th & 31st day of the monthInvestment Objective: Refer Pg No from 40 to 41
Minimum Investment Amount: ` 5,000/- and any amount thereafter
Option Available: Growth, Dividend - (Payout, Reinvestment and Sweep (from Equity Schemes to Debt Schemes only))
Exit Load: 1.00% if redeemed before 365 days from the date of allotment. (w.e.f. 1st September 2009)
Top 10 Equity Holdings
Finance 19.90%
Banks 16.14%
Auto 8.40%
Miscellaneous 6.69%
Software 5.37%
Industrial Capital Goods 5.12%
Construction 3.97%
Industrial Products 3.81%
Performance Table Regular Plan - Growth Direct Plan - GrowthScheme Name CAGR Returns (%) Current Value of Investment of ` 10,000 CAGR Returns (%) Current Value of Investment of ` 10,000
1 Year 3 Years 5 Years
SinceInception
Mar 16, 20061 Year 3 Years 5 Years
SinceInception
Mar 16, 2006
1 Year 3 Years 5 Years
SinceInception
Jan 01, 20131 Year 3 Years
5 Years
SinceInception
Jan 01, 2013
IDFC Focused Equity Fund 32.72% 13.94% 15.38% 12.05% 13,293 14,797 20,460 36,519 34.59% 15.56% NA 15.36% 13,481 15,440 NA 19,242
Nifty 50# 16.56% 9.27% 14.01% 10.52% 11,665 13,051 19,272 31,231 16.56% 9.27% NA 12.19% 11,665 13,051 NA 16,934
S&P BSE Sensex## 15.82% 7.88% 13.53% 10.10% 11,591 12,556 18,864 29,889 15.82% 7.88% NA 11.71% 11,591 12,556 NA 16,606
The fund is being managed by Mr. Sumit Agrawal (w.e.f. 20th October 2016)Performance based on NAV as on 31/07/2017. Past performance may or may not be sustained in future.For other funds managed by the fund manager, please refer page no. 33 - 35 & the respective fund pages Regular and Direct Plans have different expense structure. Direct Plan shall have a lower expense ratio excluding distribution expenses, commission expenses etc.*Risk-free rate assumed to be 6.25% (FBIL OVERNIGHT MIBOR as on 31st July 2017). Ratios calculated on the basis of 3 years history of monthly data. ^Portfolio Turnover ratio is calculated as Lower of purchase or sale during the period / Average AUM for the last one year (includes Fixed Income securities and Equity derivatives). #Benchmark Returns. ##Alternate Benchmark Returns.$$ The strategy of the Fund has been changed from large cap to focused fund
SIP PERFORMANCE
Monthly SIP of ` 10,000 in IDFC Focused Equity Fund - Regular Plan - Growth
1 Year 3 Years 5 Years 7 Years 10 YearsSince
InceptionMar 16, 2006
Total Amount Invested (`) 1,20,000 3,60,000 6,00,000 8,40,000 12,00,000 13,70,000
Total Value as on July 31, 2017 (`) 1,50,127 4,84,365 9,28,738 13,96,992 23,06,497 28,64,102
Fund Returns (%) 49.88 20.27 17.52 14.28 12.55 12.27
Total Value of Nifty 50 Index# 1,36,500 4,34,380 8,36,566 12,83,988 21,25,229 25,95,723
Nifty 50 Index Returns (%)# 26.58 12.60 13.26 11.92 11.01 10.68
Total Value of S&P BSE SENSEX## 1,36,061 4,27,109 8,16,928 12,51,399 20,65,365 25,09,750
S&P BSE SENSEX Returns (%)## 25.85 11.43 12.30 11.20 10.47 10.14
Past performance may or may not be sustained in future.Dividends are assumed to be reinvested and bonus is adjusted. Load is not taken into consideration. To illustrate the advantages of SIP investment, this is how your investment would have grown if you had invested say `10,000 systematically on the first business Day of every month over a period of time. Returns are calculated by using XIRR approach. XIRR helps in calculating return on investment given an initial and final value and a series of cash inflows and outflows with the correct allowance for the time impact of the transactions. Regular and Direct plans have different expense structure. Direct Plan shall have a lower expense ratio excluding distribution expenses, commision expenses etc. #Benchmark Returns. ##Alternate Benchmark Returns. Data as on July 31, 2017.
Riskometer
Investors understand that their principal will be at Moderately High risk
This product is suitable for investors who are seeking*:
To create wealth over a long period of time.•
Investment in a concentrated portfolio of equity •and equity related instruments of up to 30 companies.
*Investors should consult their financial advisers if in doubt about whether the product is suitable for them.
Consumer Durables 3.75%
Auto Ancillaries 3.39%
Cement 3.28%
Retailing 3.21%
Pharmaceuticals 3.05%
Gas 2.62%
Hotels, Resorts And Other Recreational Activities
2.51%
IT Consulting & Other Services 2.47%
Textile Products 2.36%
NAV (`)
Regular Plan Growth 36.5191Regular Plan Dividend 14.8635Direct Plan Growth 38.4473Direct Plan Dividend 18.0636
PORTFOLIO
Name % of NAV
Equity and Equity related Instruments 96.05%Finance 19.90%Bajaj Finance 4.59%PNB Housing Finance 4.41%
SREI Infrastructure Finance 3.67%
Central Depository Services (India) 3.07%
AU Small Finance Bank 2.53%
Rane Holdings 1.64%
Banks 16.14%Kotak Mahindra Bank 5.59%IndusInd Bank 4.18%RBL Bank 3.99%
The South Indian Bank 2.39%
Auto 8.40%Eicher Motors 4.77%
Maruti Suzuki India 3.63%
Miscellaneous 6.69%Security and Intelligence Services (India) 3.16%
Dishman Carbogen Amcis 2.81%
Amulya Leasing And Finance 0.72%
Software 5.37%Infosys 5.37%
Industrial Capital Goods 5.12%Bharat Electronics 3.46%
Skipper 1.66%
Name % of NAV
Construction 3.97%Kajaria Ceramics 3.97%
Industrial Products 3.81%Astral Poly Technik 3.81%
Consumer Durables 3.75%Titan Company 3.75%
Auto Ancillaries 3.39%Minda Industries 3.39%
Cement 3.28%Sagar Cements 3.28%
Retailing 3.21%Avenue Supermarts 3.21%
Pharmaceuticals 3.05%Eris Lifesciences 3.05%
Gas 2.62%Petronet LNG 2.62%Hotels, Resorts And Other Recreational Activities 2.51%
The Indian Hotels Company 2.51%
IT Consulting & Other Services 2.47%Cognizant Technology Solutions Corp - International Equities 2.47%
Textile Products 2.36%Dollar Industries 2.36%
Net Cash and Cash Equivalent 3.95%Grand Total 100.00%

8
IDFC Equity Fund(The Fund has been repositioned with effect from April 18, 2017)$$ An open ended ‘large cap’ equity fund31st July 2017
FUND FEATURES
INDUSTRY ALLOCATION
Size
Large Cap
Mid Cap
Small Cap
Style Growth Blend Value
About the Fund: IDFC Equity Fund focuses on investing predominantly in Large Cap stocks.
Nature: Equity
Monthly Avg AUM: ` 273.50 Crores
Month end AUM: ` 277.24 Crores
Inception Date: 9 June 2006
Fund Manager: Mr. Sumit Agrawal & Mr. Arpit Kapoor (w.e.f. 1st March 2017)
Other Parameter:
Beta 0.96
R Square 0.96
Standard Deviation (Annualized) 13.02%
Sharpe* 0.30
Portfolio Turnover
Equity 0.84
Aggregate^ 0.96
Expense Ratio
Regular 2.54%
Direct 1.76%
Benchmark: S&P BSE 100 (w.e.f. April 18, 2017)
SIP (Minimum Amount): ` 1,000/-
SIP Frequency: Monthly
SIP Dates (Monthly): Any day of the month, except 29th, 30th & 31st day of the monthInvestment Objective: Refer Pg No from 40 to 41
Minimum Investment Amount : ` 5,000/- and any amount thereafter
Option Available: Growth, Dividend (Payout, Reinvestment and Sweep (from Equity Schemes to Debt Schemes only))
Exit Load: 1.00% if redeemed before 365 days from the date of allotment. (w.e.f. 1st September 2009)
Top 10 Equity Holdings
Banks 20.92%Finance 13.28%Auto 9.15%Consumer Non Durables 8.34%Software 7.48%Petroleum Products 4.81%Cement 4.53%Pharmaceuticals 3.80%Construction Project 3.75%Power 3.35%Consumer Durables 2.96%Retailing 2.79%
Performance Table Regular Plan - Growth Direct Plan - GrowthScheme Name CAGR Returns (%) Current Value of Investment of ` 10,000 CAGR Returns (%) Current Value of Investment of ` 10,000
1 Year 3 Years 5 Years
SinceInceptionJun 09, 2006
1 Year 3 Years 5 Years
SinceInceptionJun 09, 2006
1 Year 3 Years 5 Years
SinceInception
Jan 01, 2013
1 Year 3 Years 5 Years
SinceInception
Jan 01, 2013
IDFC Equity Fund 20.12% 10.10% 14.40% 10.35% 12,024 13,350 19,604 29,993 21.75% 11.68% NA 14.15% 12,188 13,933 NA 18,338
S&P BSE 100# 16.41% 9.23% 13.98% 11.92% 11,650 13,034 19,247 35,112 16.41% 9.23% NA 12.15% 11,650 13,034 NA 16,912
Nifty 50## 16.56% 9.27% 14.01% 11.94% 11,665 13,051 19,272 35,157 16.56% 9.27% NA 12.19% 11,665 13,051 NA 16,934
The fund is being managed by Mr. Sumit Agrawal & Mr. Arpit Kapoor (w.e.f. 1st March 2017). Performance based on NAV as on 31/07/2017. Past performance may or may not be sustained in future. For other funds managed by the fund manager, please refer page no. 33 - 35 & the respective fund pages Regular and Direct Plans have different expense structure. Direct Plan shall have a lower expense ratio excluding distribution expenses, commission expenses etc.*Risk-free rate assumed to be 6.25% (FBIL OVERNIGHT MIBOR as on 31st July 2017). Ratios calculated on the basis of 3 years history of monthly data. ^Portfolio Turnover ratio is calculated as Lower of purchase or sale during the period / Average AUM for the last one year (includes Fixed Income securities and Equity derivatives). #Benchmark Returns. ##Alternate Benchmark Returns. Current Index performance adjusted for the period from since inception to April 18, 2017 with the performance of Nifty 50 (Benchmark)$$For details please refer Notice (https://www.idfcmf.com/uploads/140320171238No-14-Change-in-Investmenty-Strategy-of-IDFC-Equity-Fund.pdf)
SIP PERFORMANCE
Monthly SIP of ` 10,000 in IDFC Equity Fund - Regular Plan - Growth
1 Year 3 Years 5 Years 7 Years 10 YearsSince
InceptionJun 09, 2006
Total Amount Invested (`) 1,20,000 3,60,000 6,00,000 8,40,000 12,00,000 13,40,000
Total Value as on July 31, 2017 (`) 1,38,792 4,45,294 8,54,530 13,18,655 21,89,732 25,66,200
Fund Returns (%) 30.42 14.33 14.13 12.67 11.58 11.12
Total Value of S&P BSE 100 Index# 1,36,338 4,33,671 8,35,105 12,81,459 21,21,560 25,04,325
S&P BSE 100 Index Returns (%)# 26.31 12.49 13.20 11.86 10.98 10.71
Total Value of Nifty 50## 1,36,500 4,34,214 8,36,161 12,83,086 21,24,263 25,07,517
Nifty 50 Returns (%)## 26.58 12.58 13.25 11.90 11.00 10.73
Past performance may or may not be sustained in future.Dividends are assumed to be reinvested and bonus is adjusted. Load is not taken into consideration. To illustrate the advantages of SIP investment, this is how your investment would have grown if you had invested say `10,000 systematically on the first business Day of every month over a period of time. Returns are calculated by using XIRR approach. XIRR helps in calculating return on investment given an initial and final value and a series of cash inflows and outflows with the correct allowance for the time impact of the transactions. Regular and Direct plans have different expense structure. Direct Plan shall have a lower expense ratio excluding distribution expenses, commision expenses etc. #Benchmark Returns. ##Alternate Benchmark Returns. Data as on July 31, 2017.
Riskometer
Investors understand that their principal will be at Moderately High risk
This product is suitable for investors who are seeking*:
To create wealth over a long period of time.•
Investment predominantly in equity and equity •related instruments in the large cap segment.
*Investors should consult their financial advisers if in doubt about whether the product is suitable for them.
Industrial Capital Goods 2.30%Gas 1.89%Auto Ancillaries 1.80%Construction 1.50%Textile Products 1.36%Ferrous Metals 1.10%Oil 1.00%Hotels, Resorts And Other Recreational Activities
0.95%
Industrial Products 0.94%Transportation 0.87%
NAV (`)Regular Plan Growth 29.9934Regular Plan Dividend 14.9568Direct Plan Growth 31.5507Direct Plan Dividend 18.0235
PORTFOLIO
Name % of NAV
Equity and Equity related Instruments 98.85%Banks 20.92%HDFC Bank 7.34%ICICI Bank 4.80%IndusInd Bank 2.61%Kotak Mahindra Bank 2.51%RBL Bank 2.08%State Bank of India 1.58%Finance 13.28%Bajaj Finance 2.95%Housing Development Finance Corporation 2.84%PNB Housing Finance 2.60%Central Depository Services (India) 1.81%ICICI Prudential Life Insurance Company 1.29%Magma Fincorp 0.96%GIC Housing Finance 0.82%Auto 9.15%Maruti Suzuki India 3.30%Mahindra & Mahindra 2.02%Eicher Motors 1.95%Hero MotoCorp 1.85%Tata Motors 0.03%Consumer Non Durables 8.34%ITC 4.53%Hindustan Unilever 2.42%Tata Coffee 0.95%Marico 0.24%Britannia Industries 0.20%Software 7.48%Infosys 5.40%HCL Technologies 1.10%Tech Mahindra 0.95%NIIT Technologies 0.04%Petroleum Products 4.81%Reliance Industries 3.15%Indian Oil Corporation 0.98%Castrol India 0.58%Bharat Petroleum Corporation 0.10%Cement 4.53%Ambuja Cements 1.33%Shree Cements 1.21%Deccan Cements 1.00%UltraTech Cement 1.00%
Name % of NAV
Pharmaceuticals 3.80%Aurobindo Pharma 1.74%Cadila Healthcare 1.14%Indoco Remedies 0.75%Alkem Laboratories 0.13%Sun Pharmaceutical Industries 0.04%Construction Project 3.75%Larsen & Toubro 3.75%Power 3.35%Power Grid Corporation of India 2.42%Nava Bharat Ventures 0.93%Consumer Durables 2.96%Titan Company 1.57%Mirza International 1.39%Retailing 2.79%Avenue Supermarts 2.79%Industrial Capital Goods 2.30%Bharat Electronics 1.29%Texmaco Rail & Engineering 1.01%Gas 1.89%Petronet LNG 1.24%GAIL (India) 0.65%Auto Ancillaries 1.80%Exide Industries 1.10%MRF 0.70%Construction 1.50%PSP Projects 1.50%Textile Products 1.36%Dollar Industries 1.36%Ferrous Metals 1.10%Tata Steel 1.10%Oil 1.00%Oil & Natural Gas Corporation 1.00%Hotels, Resorts And Other Recreational Activities 0.95%
Taj GVK Hotels & Resorts 0.95%Industrial Products 0.94%INEOS Styrolution India 0.94%Transportation 0.87%VRL Logistics 0.87%Net Cash and Cash Equivalent 1.15%Grand Total 100.00%
Size
Large Cap
Mid Cap
Small Cap
Style Growth Blend Value

9
IDFC Nifty FundAn Open Ended Index Linked Equity Scheme
31st July 2017
FUND FEATURES
INDUSTRY ALLOCATION
About the Fund: IDFC Nifty Fund is an index fund which is managed passively by investing in proportion to the Nifty 50.Nature: EquityMonthly Avg AUM: ` 88.67 Crores Month end AUM: ` 91.12 Crores Inception Date: 30 April 2010Fund Manager: Mr. Arpit Kapoor & Mr. Sumit Agrawal (w.e.f. 1st March 2017) Other Parameter:Beta 1.01R Square 1.00 Standard Deviation (Annualized) 13.44%Sharpe* 0.28Portfolio TurnoverEquity 0.32Aggregate^ 0.51Tracking Error (Annualized) 0.64%Expense Ratio Regular 0.25%Direct 0.15%Benchmark: Nifty 50SIP (Minimum Amount): ` 100/- SIP Frequency: Monthly SIP Dates (Monthly): Any day of the month, except 29th, 30th & 31st day of the monthInvestment Objective: Refer Pg No from 40 to 41Minimum Investment Amount: ` 100/- and any amount thereafterOption Available: Growth, Dividend - (Payout, Reinvestment and Sweep (from Equity Schemes to Debt Schemes only))Exit Load: 1% if redeemed/switched out (to any non-equity scheme of IDFC Mutual Fund) within 7 days.
Top 10 Equity Holdings
Banks 26.90%
Software 11.47%
Auto 10.08%
Consumer Non Durables 9.80%
Petroleum Products 8.83%
Finance 8.30%
Pharmaceuticals 4.19%
Construction Project 3.79%
Power 2.68%
Non - Ferrous Metals 2.16%
Cement 1.97%
Performance Table Regular Plan - Growth Direct Plan - GrowthScheme Name CAGR Returns (%) Current Value of Investment of ` 10,000 CAGR Returns (%) Current Value of Investment of ` 10,000
1 Year 3 Years 5 YearsSince
InceptionApr 30, 2010
1 Year 3 Years 5 YearsSince
InceptionApr 30, 2010
1 Year 3 Years 5 YearsSince
InceptionJan 01, 2013
1 Year 3 Years 5 YearsSince
InceptionJan 01, 2013
IDFC Nifty Fund 17.24% 10.08% 14.88% 10.38% 11,734 13,341 20,021 20,484 17.35% 10.18% NA 13.18% 11,746 13,377 NA 17,630
Nifty 50# 16.56% 9.27% 14.01% 9.32% 11,665 13,051 19,272 19,093 16.56% 9.27% NA 12.19% 11,665 13,051 NA 16,934
S&P BSE Sensex## 15.82% 7.88% 13.53% 8.86% 11,591 12,556 18,864 18,518 15.82% 7.88% NA 11.71% 11,591 12,556 NA 16,606
The fund is being managed by Mr. Arpit Kapoor & Mr. Sumit Agrawal (w.e.f. 1st March 2017)Performance based on NAV as on 31/07/2017. Past performance may or may not be sustained in future.For other funds managed by the fund manager, please refer page no. 33 - 35 & the respective fund pages Regular and Direct Plans have different expense structure. Direct Plan shall have a lower expense ratio excluding distribution expenses, commission expenses etc.*Risk-free rate assumed to be 6.25% (FBIL OVERNIGHT MIBOR as on 31st July 2017). Ratios calculated on the basis of 3 years history of monthly data. ^Portfolio Turnover ratio is calculated as Lower of purchase or sale during the period / Average AUM for the last one year (includes Fixed Income securities and Equity derivatives). #Benchmark Returns. ##Alternate Benchmark Returns.
SIP PERFORMANCE
Monthly SIP of ` 10,000 in IDFC Nifty - Regular Plan - Growth
1 Year 3 Years 5 Years 7 YearsSince
InceptionApr 30, 2010
Total Amount Invested (`) 1,20,000 3,60,000 6,00,000 8,40,000 8,80,000
Total Value as on July 31, 2017 (`) 1,37,267 4,40,289 8,55,840 13,31,127 14,14,587
Fund Returns (%) 27.87 13.53 14.19 12.93 12.69
Total Value of Nifty 50 Index# 1,36,500 4,34,380 8,36,566 12,83,988 13,61,840
Nifty 50 Index Returns (%)# 26.58 12.60 13.26 11.92 11.68
Total Value of S&P BSE SENSEX## 1,36,061 4,27,109 8,16,928 12,51,399 13,26,809
S&P BSE SENSEX Returns (%)## 25.85 11.43 12.30 11.20 10.99
Past performance may or may not be sustained in future.Dividends are assumed to be reinvested and bonus is adjusted. Load is not taken into consideration. To illustrate the advantages of SIP investment, this is how your investment would have grown if you had invested say `10,000 systematically on the first business Day of every month over a period of time. Returns are calculated by using XIRR approach. XIRR helps in calculating return on investment given an initial and final value and a series of cash inflows and outflows with the correct allowance for the time impact of the transactions. Regular and Direct plans have different expense structure. Direct Plan shall have a lower expense ratio excluding distribution expenses, commision expenses etc. #Benchmark Returns. ##Alternate Benchmark Returns. Data as on July 31, 2017.
Riskometer
Investors understand that their principal will be at Moderately High risk
This product is suitable for investors who are seeking*:
Create wealth over a long period of time.•Replicate the Nifty 50 by investing in securities of •the Nifty 50 in the same proportion/weightage.
*Investors should consult their financial advisers if in doubt about whether the product is suitable for them.
Telecom - Services 1.41%
Oil 1.23%
Ferrous Metals 0.98%
Minerals/Mining 0.85%
Transportation 0.83%
Media & Entertainment 0.77%
Telecom - Equipment & Accessories 0.73%
Gas 0.64%
Auto Ancillaries 0.57%
NAV (`)
Regular Plan Growth 20.4840Regular Plan Dividend 20.6450Direct Plan Growth 20.5559Direct Plan Dividend 20.7311
PORTFOLIO
Name Rating % of NAV
Equity and Equity related Instruments 99.85%Banks 26.90%HDFC Bank 9.34%ICICI Bank 4.97%Kotak Mahindra Bank 3.23%State Bank of India 2.87%
Axis Bank 2.26%
IndusInd Bank 2.12%
Yes Bank 1.72%
Bank of Baroda 0.39%
Software 11.47%Infosys 5.19%Tata Consultancy Services 3.39%
HCL Technologies 1.32%
Wipro 0.95%
Tech Mahindra 0.62%
Auto 10.08%Maruti Suzuki India 2.66%
Tata Motors Ltd 2.17%
Mahindra & Mahindra 1.68%
Hero MotoCorp 1.22%
Eicher Motors 1.03%
Bajaj Auto 0.98%
Tata Motors Ltd DVR Shares 0.35%
Consumer Non Durables 9.80%ITC 6.32%
Hindustan Unilever 2.12%
Asian Paints 1.35%
Petroleum Products 8.83%Reliance Industries 6.89%
Indian Oil Corporation 0.98%
Bharat Petroleum Corporation 0.96%
Finance 8.30%Housing Development Finance Corporation 7.34%
Indiabulls Housing Finance 0.97%
Pharmaceuticals 4.19%Sun Pharmaceutical Industries 1.53%
Dr. Reddy's Laboratories 0.75%
Cipla 0.73%
Lupin 0.65%
Name Rating % of NAV
Aurobindo Pharma 0.53%
Construction Project 3.79%Larsen & Toubro 3.79%
Power 2.68%Power Grid Corporation of India 1.24%
NTPC 1.05%
Tata Power Company 0.39%
Non - Ferrous Metals 2.16%Vedanta 1.34%
Hindalco Industries 0.82%
Cement 1.97%UltraTech Cement 1.09%
Ambuja Cements 0.50%
ACC 0.38%
Index 1.66%Nifty Index - Equity Futures 1.66%
Telecom - Services 1.41%Bharti Airtel 1.41%
Oil 1.23%Oil & Natural Gas Corporation 1.23%
Ferrous Metals 0.98%Tata Steel 0.98%
Minerals/Mining 0.85%Coal India 0.85%
Transportation 0.83%Adani Ports and Special Economic Zone 0.83%
Media & Entertainment 0.77%Zee Entertainment Enterprises 0.77%
Telecom - Equipment & Accessories 0.73%Bharti Infratel 0.73%
Gas 0.64%GAIL (India) 0.64%
Auto Ancillaries 0.57%Bosch 0.57%
Corporate Bond 0.02%NTPC AAA 0.02%
Net Cash and Cash Equivalent 0.12%Grand Total 100.00%
Size
Large Cap
Mid Cap
Small Cap
Style Growth Blend Value

10
IDFC Infrastructure FundAn Open Ended Equity Scheme Fund
31st July 2017
FUND FEATURES
INDUSTRY ALLOCATION
About the Fund: A dedicated Infrastructure fund, that invests across the infrastructure value chain with exclusions like Banking, Autos, IT, Pharma and FMCG. It is a diversified portfolio of companies that are participating in and benefitting from the Indian Infrastructure and Infrastructure related activities.
Nature: Equity
Monthly Avg AUM: ` 349.01 Crores
Month end AUM: ` 375.97 Crores
Inception Date: 8 March 2011
Fund Manager: Mr. Rajendra Kumar Mishra (w.e.f. 27th June 2013)
Other Parameter:
Beta 0.74
R Square 0.67
Standard Deviation (Annualized) 16.45%
Sharpe* 0.75
Portfolio Turnover
Equity 0.30 Aggregate^ 0.30
Expense Ratio
Regular 2.52%
Direct 0.89%
Benchmark: Nifty Infrastructure
SIP (Minimum Amount): ` 1,000/-
SIP Frequency: Monthly
SIP Dates (Monthly): Any day of the month, except 29th, 30th & 31st day of the monthInvestment Objective: Refer Pg No from 40 to 41
Minimum Investment Amount: ` 5,000/- and any amount thereafter
Option Available: Growth, Dividend - (Payout, Reinvestment and Sweep (from Equity Schemes to Debt Schemes only))
Exit Load: 1.00% if redeemed before 365 days from the date of allotment.
Top 10 Equity Holdings
Construction 13.85%Construction Project 11.56%Power 11.21%Transportation 9.11%Non - Ferrous Metals 7.16%Industrial Capital Goods 6.62%Telecom - Services 6.51%Gas 4.47%Ferrous Metals 4.26%
Performance Table Regular Plan - Growth Direct Plan - GrowthScheme Name CAGR Returns (%) Current Value of Investment of ` 10,000 CAGR Returns (%) Current Value of Investment of ` 10,000
1 Year3
Years5 Years
SinceInception
Mar 08, 20111 Year 3 Years 5 Years
SinceInception
Mar 08, 20111 Year 3 Years 5 Years
SinceInception
Jan 01, 20131 Year 3 Years 5 Years
SinceInception
Jan 01, 2013
IDFC Infrastructure Fund 41.12% 18.67% 14.97% 8.40% 14,138 16,721 20,093 16,764 43.20% 20.49% NA 16.27% 14,349 17,503 NA 19,950
Nifty Infrastructure# 14.57% 2.44% 7.68% 2.56% 11,466 10,752 14,477 11,754 14.57% 2.44% NA 5.90% 11,466 10,752 NA 13,004
Nifty 50## 16.56% 9.27% 14.01% 9.85% 11,665 13,051 19,272 18,253 16.56% 9.27% NA 12.19% 11,665 13,051 NA 16,934
The fund is being managed by Mr. Rajendra Kumar Mishra (w.e.f. 27th June 2013)Performance based on NAV as on 31/07/2017. Past performance may or may not be sustained in future.For other funds managed by the fund manager, please refer page no. 33 - 35 & the respective fund pages Regular and Direct Plans have different expense structure. Direct Plan shall have a lower expense ratio excluding distribution expenses, commission expenses etc.*Risk-free rate assumed to be 6.25% (FBIL OVERNIGHT MIBOR as on 31st July 2017). Ratios calculated on the basis of 3 years history of monthly data. ^Portfolio Turnover ratio is calculated as Lower of purchase or sale during the period / Average AUM for the last one year (includes Fixed Income securities and Equity derivatives). #Benchmark Returns. ##Alternate Benchmark Returns.
SIP PERFORMANCE
Monthly SIP of ` 10,000 in IDFC Infrastructure Fund - Regular Plan - Growth
1 Year 3 Years 5 YearsSince
InceptionMar 08, 2011
Total Amount Invested (`) 1,20,000 3,60,000 6,00,000 7,70,000
Total Value as on July 31, 2017 (`) 1,48,094 5,10,894 10,09,899 13,18,806
Fund Returns (%) 46.34 24.13 20.96 16.57
Total Values of Nifty Infrastructure# 1,37,065 4,13,637 7,49,439 9,69,056
Nifty Infrastructure Returns (%)# 27.53 9.24 8.83 7.07
Total Value of Nifty 50 Index## 1,36,500 4,34,380 8,36,566 11,62,276
Nifty 50 Index returns (%)## 26.58 12.60 13.26 12.67
Past performance may or may not be sustained in future.Dividends are assumed to be reinvested and bonus is adjusted. Load is not taken into consideration. To illustrate the advantages of SIP investment, this is how your investment would have grown if you had invested say `10,000 systematically on the first business Day of every month over a period of time. Returns are calculated by using XIRR approach. XIRR helps in calculating return on investment given an initial and final value and a series of cash inflows and outflows with the correct allowance for the time impact of the transactions. Regular and Direct plans have different expense structure. Direct Plan shall have a lower expense ratio excluding distribution expenses, commision expenses etc. #Benchmark Returns. ##Alternate Benchmark Returns. Data as on July 31, 2017.
Riskometer
Investors understand that their principal will be at High risk
This product is suitable for investors who are seeking*:
Create wealth over a long period of time.•Investment predominantly in equity and equity •related instruments of companies that are participating in and benefiting from growth in Indian infrastructure and infrastructural related activities.
*Investors should consult their financial advisers if in doubt about whether the product is suitable for them.
Telecom - Equipment & Accessories 3.54%Engineering Services 3.08%Finance 2.17%Consumer Durables 1.77%Cement 1.55%Hotels, Resorts And Other Recreational Activities
1.34%
Petroleum Products 1.15%Industrial Products 0.63%
NAV (`)
Regular Plan Growth 16.7635Regular Plan Dividend 16.7706Direct Plan Growth 17.7250Direct Plan Dividend 17.7132
Size
Large Cap
Mid Cap
Small Cap
Style Growth Blend Value
PORTFOLIO
Name % of NAV
Equity and Equity related Instruments 89.98%
Construction 13.85%Dilip Buildcon 3.30%NBCC (India) 2.80%
J.Kumar Infraprojects 2.39%
PSP Projects 1.91%
Ahluwalia Contracts (India) 1.67%
PNC Infratech 1.32%
ITD Cementation India 0.45%
Construction Project 11.56%Engineers India 4.67%Larsen & Toubro 2.91%
Sadbhav Engineering 2.27%
Techno Electric & Engineering Company 1.47%
Sadbhav Infrastructure Project 0.24%
Power 11.21%NTPC 2.99%
CESC 2.26%
Power Grid Corporation of India 2.08%
Adani Transmission 1.96%
PTC India 1.92%
Transportation 9.11%InterGlobe Aviation 2.75%
Adani Ports and Special Economic Zone 2.34%
Gateway Distriparks 2.19%
Navkar Corporation 1.82%
Snowman Logistics 0.02%
Non - Ferrous Metals 7.16%Vedanta 4.61%
National Aluminium Company 1.58%
Hindalco Industries 0.96%
Industrial Capital Goods 6.62%
Bharat Electronics 2.17%
BEML 1.51%
Bharat Heavy Electricals 1.35%
Praj Industries 1.10%
TD Power Systems 0.49%
Name % of NAV
Telecom - Services 6.51%Bharti Airtel 4.79%
Idea Cellular 1.72%
Gas 4.47%
Gujarat State Petronet 2.34%
Indraprastha Gas 1.57%
Gujarat Gas 0.57%
Ferrous Metals 4.26%
Maharashtra Seamless 1.62%
Jindal Saw 1.61%
Ratnamani Metals & Tubes 1.03%
Telecom - Equipment & Accessories 3.54%Tejas Networks 3.54%
Engineering Services 3.08%VA Tech Wabag 3.08%
Finance 2.17%
SREI Infrastructure Finance 1.32%
PTC India Financial Services 0.85%
Consumer Durables 1.77%
Blue Star 1.77%
Cement 1.55%
UltraTech Cement 0.92%
Sagar Cements 0.36%
Deccan Cements 0.28%Hotels, Resorts And Other Recreational Activities 1.34%
Taj GVK Hotels & Resorts 1.34%
Petroleum Products 1.15%
Reliance Industries 1.15%
Industrial Products 0.63%
Kirloskar Oil Engines 0.63%
Preference Shares 0.31%
Non - Ferrous Metals 0.31%
Vedanta 0.31%
Net Cash and Cash Equivalent 9.71%
Grand Total 100.00%

11
IDFC Tax Advantage (ELSS) FundAn Open Ended Equity Linked Saving Scheme with Lock in Period of 3 Years
31st July 2017
FUND FEATURES
INDUSTRY ALLOCATION
About the Fund: The Fund is an Equity Linked Savings Scheme (ELSS) that aims to generate long term capital growth from a diversified equity portfolio and enables investors to avail of a deduction from total income, as permitted under the Income Tax Act, 1961.
Nature: Equity
Monthly Avg AUM: ` 642.63 Crores
Month end AUM: ` 655.33 Crores
Inception Date: 26 December 2008
Fund Manager: Mr. Daylynn Pinto (w.e.f. 20th October 2016)
Other Parameter:
Beta 1.02 R Square 0.82 Standard Deviation (Annualized) 14.97% Sharpe* 0.80
Portfolio Turnover
Equity 0.66 Aggregate^ 0.66
Expense Ratio
Regular 2.39%
Direct 1.44%
Benchmark: S&P BSE 200
SIP (Minimum Amount): ` 500/-
SIP Frequency : Monthly
SIP Dates (Monthly): Any day of the month, except 29th, 30th & 31st day of the monthInvestment Objective: Refer Pg No from 40 to 41
Minimum Investment Amount: ` 500/- and in multiples of ` 500/- thereafter.
Option Available: Growth, Dividend (Payout, Reinvestment and Sweep (from Equity Schemes to Debt Schemes only))
Exit Load: Nil
Top 10 Equity Holdings
Banks 18.16%Consumer Non Durables 9.71%Auto Ancillaries 7.23%Finance 6.34%Software 6.27%Construction Project 6.12%Retailing 5.38%Cement 4.69%Auto 4.58%Gas 2.88%Ferrous Metals 2.30%Construction 2.27%Miscellaneous 2.20%
Performance Table Regular Plan - Growth Direct Plan - GrowthScheme Name CAGR Returns (%) Current Value of Investment of ` 10,000 CAGR Returns (%) Current Value of Investment of ` 10,000
1 Year 3 Years 5 Years
SinceInceptionDec 26, 2008
1 Year 3 Years 5 Years
SinceInceptionDec 26, 2008
1 Year 3 Years 5 Years
SinceInception
Jan 01, 2013
1 Year 3 Years 5 Years
SinceInception
Jan 01, 2013
IDFC Tax Advantage (ELSS) Fund
26.14% 18.30% 22.36% 21.17% 12,630 16,562 27,443 52,130 27.49% 19.80% NA 21.57% 12,766 17,203 NA 24,468
S&P BSE 200# 18.56% 11.68% 15.68% 17.24% 11,867 13,933 20,722 39,266 18.56% 11.68% NA 13.57% 11,867 13,933 NA 17,911
Nifty 50## 16.56% 9.27% 14.01% 15.78% 11,665 13,051 19,272 35,269 16.56% 9.27% NA 12.19% 11,665 13,051 NA 16,934
The fund is being managed by Mr. Daylynn Pinto (w.e.f. 20th October 2016), Performance based on NAV as on 31/07/2017, Past performancemay ormay not be sustained in future. Regular and Direct Plans have different expense structure. Direct Plan shall have a lower expense ratio excluding distribution expenses, commission expenses etc. For other funds managed by the fund manager, please refer page no. 33 - 35 & the respective fund pages. *Risk-free rate assumed to be 6.25% (FBIL OVERNIGHT MIBOR as on 31st July 2017). Ratios calculated on the basis of 3 years history of monthly data. ^Portfolio Turnover ratio is calculated as Lower of purchase or sale during the period / Average AUM for the last one year (includes Fixed Income securities and Equity derivatives). #Benchmark Returns. ##Alternate Benchmark Returns.
SIP PERFORMANCE
Monthly SIP of ` 10,000 in IDFC Tax Advantage (ELSS) Fund - Regular Plan - Growth
1 Year 3 Years 5 Years 7 YearsSince
InceptionDec 26, 2008
Total Amount Invested (`) 1,20,000 3,60,000 6,00,000 8,40,000 10,40,000
Total Value as on July 31, 2017 (`) 1,43,008 4,78,873 10,30,512 16,84,265 24,40,794
Fund Returns (%) 37.57 19.45 21.80 19.53 18.99
Total Value of S&P BSE 200# 1,37,083 4,46,998 8,81,472 13,54,747 18,84,167
S&P BSE 200 Returns (%)# 27.56 14.59 15.39 13.42 13.30
Total Value of NIFTY 50 Index## 1,36,500 4,34,380 8,36,566 12,83,988 17,75,016
NIFTY 50 Index Returns (%)## 26.58 12.60 13.26 11.92 11.98
Past performance may or may not be sustained in future.Dividends are assumed to be reinvested and bonus is adjusted. Load is not taken into consideration. To illustrate the advantages of SIP investment, this is how your investment would have grown if you had invested say `10,000 systematically on the first business Day of every month over a period of time. Returns are calculated by using XIRR approach. XIRR helps in calculating return on investment given an initial and final value and a series of cash inflows and outflows with the correct allowance for the time impact of the transactions. Regular and Direct plans have different expense structure. Direct Plan shall have a lower expense ratio excluding distribution expenses, commision expenses etc. #Benchmark Returns. ##Alternate Benchmark Returns. Data as on July 31, 2017.
Media & Entertainment 2.20%Power 2.04%Pharmaceuticals 2.01%Chemicals 1.91%Industrial Products 1.86%Transportation 1.75%Petroleum Products 1.68%Non - Ferrous Metals 1.44%Consumer Durables 1.23%Hotels, Resorts And Other Recreational Activities
1.06%
Oil 1.03%Industrial Capital Goods 1.00%Fertilisers 0.74%
NAV (`)
Regular Plan Growth 52.1301Regular Plan Dividend 17.3159Direct Plan Growth 54.5909Direct Plan Dividend 20.7848
Size
Large Cap
Mid Cap
Small Cap
Style Growth Blend Value
Riskometer
Investors understand that their principal will be at Moderately High risk
This product is suitable for investors who are seeking*:
Create wealth over a long period of time.•
Investment predominantly in Equity and Equity •related securities.
*Investors should consult their financial advisers if in doubt about whether the product is suitable for them.
PORTFOLIO
Name % of NAV
Equity and Equity related Instruments 98.08%Banks 18.16%HDFC Bank 5.72%ICICI Bank 3.56%Axis Bank 2.22%IndusInd Bank 2.01%Kotak Mahindra Bank 1.95%RBL Bank 1.80%The Federal Bank 0.91%Consumer Non Durables 9.71%ITC 3.70%Hindustan Unilever 1.94%Procter & Gamble Hygiene and Health Care 1.84%Mcleod Russel India 1.21%HBL Power Systems 1.02%Auto Ancillaries 7.23%Minda Industries 2.66%Igarashi Motors India 1.22%Apollo Tyres 1.02%Tube Investments of India 1.01%MRF 0.74%GNA Axles 0.59%Finance 6.34%Housing Development Finance Corporation 2.18%SREI Infrastructure Finance 1.30%ICICI Prudential Life Insurance Company 1.12%Magma Fincorp 1.03%Max Financial Services 0.70%Software 6.27%Infosys 3.12%HCL Technologies 1.33%Mastek 1.02%KPIT Technologies 0.80%Construction Project 6.12%KEC International 3.02%Voltas 1.77%Engineers India 1.33%Retailing 5.38%Future Retail 3.71%Future Lifestyle Fashions 1.67%Cement 4.69%The Ramco Cements 2.54%Ambuja Cements 1.41%Sagar Cements 0.75%Auto 4.58%Maruti Suzuki India 2.07%Tata Motors 1.59%Eicher Motors 0.92%Gas 2.88%GAIL (India) 2.01%
Name % of NAV
Petronet LNG 0.87%Ferrous Metals 2.30%Jindal Steel & Power 1.29%JSW Steel 1.01%Construction 2.27%PSP Projects 1.44%Asian Granito India 0.83%Miscellaneous 2.20%Dishman Carbogen Amcis 1.42%Amulya Leasing And Finance 0.79%Media & Entertainment 2.20%PVR 1.13%Zee Entertainment Enterprises 1.07%Power 2.04%Nava Bharat Ventures 1.11%Kalpataru Power Transmission 0.93%Pharmaceuticals 2.01%Aurobindo Pharma 1.10%Eris Lifesciences 0.91%Chemicals 1.91%Deepak Nitrite 1.24%Atul 0.67%Industrial Products 1.86%KEI Industries 0.99%Bharat Forge 0.88%Transportation 1.75%VRL Logistics 1.75%Petroleum Products 1.68%Indian Oil Corporation 1.68%Non - Ferrous Metals 1.44%Hindalco Industries 1.44%Consumer Durables 1.23%Crompton Greaves Consumer Electricals 1.23%Hotels, Resorts And Other Recreational Activities 1.06%
EIH 1.06%Oil 1.03%Oil & Natural Gas Corporation 1.03%Industrial Capital Goods 1.00%Texmaco Rail & Engineering 1.00%Fertilisers 0.74%Gujarat State Fertilizers & Chemicals 0.74%Preference Shares 0.04%Media & Entertainment 0.04%Zee Entertainment Enterprises 0.04%Net Cash and Cash Equivalent 1.88%Grand Total 100.00%
12
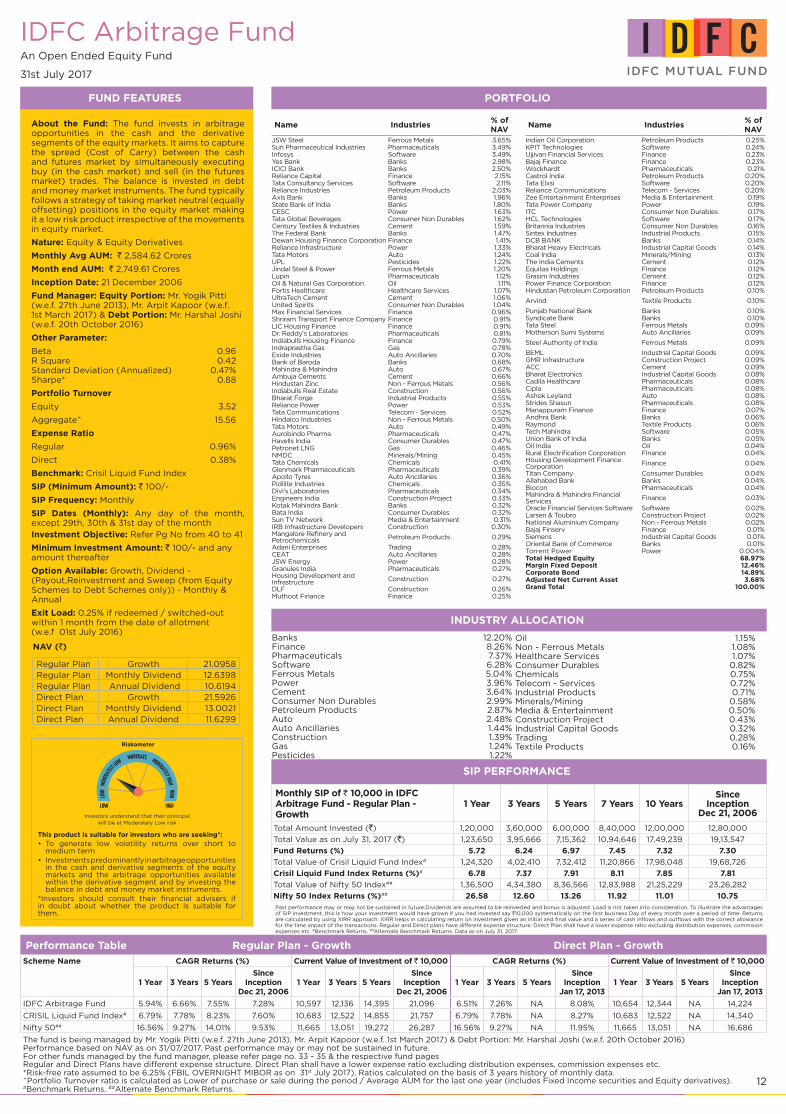
IDFC Arbitrage FundAn Open Ended Equity Fund
31st July 2017
FUND FEATURES
About the Fund: The fund invests in arbitrage opportunities in the cash and the derivative segments of the equity markets. It aims to capture the spread (Cost of Carry) between the cash and futures market by simultaneously executing buy (in the cash market) and sell (in the futures market) trades. The balance is invested in debt and money market instruments. The fund typically follows a strategy of taking market neutral (equally offsetting) positions in the equity market making it a low risk product irrespective of the movements in equity market.
Nature: Equity & Equity Derivatives
Monthly Avg AUM: ` 2,584.62 Crores
Month end AUM: ` 2,749.61 Crores
Inception Date: 21 December 2006
Fund Manager: Equity Portion: Mr. Yogik Pitti (w.e.f. 27th June 2013), Mr. Arpit Kapoor (w.e.f. 1st March 2017) & Debt Portion: Mr. Harshal Joshi (w.e.f. 20th October 2016)
Other Parameter:
Beta 0.96 R Square 0.42 Standard Deviation (Annualized) 0.47% Sharpe* 0.88
Portfolio Turnover
Equity 3.52
Aggregate^ 15.56
Expense Ratio
Regular 0.96%
Direct 0.38%
Benchmark: Crisil Liquid Fund Index
SIP (Minimum Amount): ` 100/-
SIP Frequency: Monthly
SIP Dates (Monthly): Any day of the month, except 29th, 30th & 31st day of the month Investment Objective: Refer Pg No from 40 to 41
Minimum Investment Amount: ` 100/- and any amount thereafter
Option Available: Growth, Dividend - (Payout,Reinvestment and Sweep (from Equity Schemes to Debt Schemes only)) - Monthly & Annual
Exit Load: 0.25% if redeemed / switched-out within 1 month from the date of allotment (w.e.f 01st July 2016)
Performance Table Regular Plan - Growth Direct Plan - GrowthScheme Name CAGR Returns (%) Current Value of Investment of ` 10,000 CAGR Returns (%) Current Value of Investment of ` 10,000
1 Year 3 Years 5 YearsSince
InceptionDec 21, 2006
1 Year 3 Years 5 YearsSince
InceptionDec 21, 2006
1 Year 3 Years 5 YearsSince
InceptionJan 17, 2013
1 Year 3 Years 5 YearsSince
InceptionJan 17, 2013
IDFC Arbitrage Fund 5.94% 6.66% 7.55% 7.28% 10,597 12,136 14,395 21,096 6.51% 7.26% NA 8.08% 10,654 12,344 NA 14,224
CRISIL Liquid Fund Index# 6.79% 7.78% 8.23% 7.60% 10,683 12,522 14,855 21,757 6.79% 7.78% NA 8.27% 10,683 12,522 NA 14,340
Nifty 50## 16.56% 9.27% 14.01% 9.53% 11,665 13,051 19,272 26,287 16.56% 9.27% NA 11.95% 11,665 13,051 NA 16,686
The fund is being managed by Mr. Yogik Pitti (w.e.f. 27th June 2013), Mr. Arpit Kapoor (w.e.f. 1st March 2017) & Debt Portion: Mr. Harshal Joshi (w.e.f. 20th October 2016)Performance based on NAV as on 31/07/2017. Past performance may or may not be sustained in future.For other funds managed by the fund manager, please refer page no. 33 - 35 & the respective fund pages Regular and Direct Plans have different expense structure. Direct Plan shall have a lower expense ratio excluding distribution expenses, commission expenses etc.*Risk-free rate assumed to be 6.25% (FBIL OVERNIGHT MIBOR as on 31st July 2017). Ratios calculated on the basis of 3 years history of monthly data. ^Portfolio Turnover ratio is calculated as Lower of purchase or sale during the period / Average AUM for the last one year (includes Fixed Income securities and Equity derivatives). #Benchmark Returns. ##Alternate Benchmark Returns.
SIP PERFORMANCE
Monthly SIP of ` 10,000 in IDFC Arbitrage Fund - Regular Plan - Growth
1 Year 3 Years 5 Years 7 Years 10 YearsSince
InceptionDec 21, 2006
Total Amount Invested (`) 1,20,000 3,60,000 6,00,000 8,40,000 12,00,000 12,80,000
Total Value as on July 31, 2017 (`) 1,23,650 3,95,666 7,15,362 10,94,646 17,49,239 19,13,547
Fund Returns (%) 5.72 6.24 6.97 7.45 7.32 7.30
Total Value of Crisil Liquid Fund Index# 1,24,320 4,02,410 7,32,412 11,20,866 17,98,048 19,68,726
Crisil Liquid Fund Index Returns (%)# 6.78 7.37 7.91 8.11 7.85 7.81
Total Value of Nifty 50 Index## 1,36,500 4,34,380 8,36,566 12,83,988 21,25,229 23,26,282
Nifty 50 Index Returns (%)## 26.58 12.60 13.26 11.92 11.01 10.75Past performance may or may not be sustained in future.Dividends are assumed to be reinvested and bonus is adjusted. Load is not taken into consideration. To illustrate the advantages of SIP investment, this is how your investment would have grown if you had invested say `10,000 systematically on the first business Day of every month over a period of time. Returns are calculated by using XIRR approach. XIRR helps in calculating return on investment given an initial and final value and a series of cash inflows and outflows with the correct allowance for the time impact of the transactions. Regular and Direct plans have different expense structure. Direct Plan shall have a lower expense ratio excluding distribution expenses, commision expenses etc. #Benchmark Returns. ##Alternate Benchmark Returns. Data as on July 31, 2017.
INDUSTRY ALLOCATION
Banks 12.20%Finance 8.26%Pharmaceuticals 7.37%Software 6.28%Ferrous Metals 5.04%Power 3.96%Cement 3.64%Consumer Non Durables 2.99%Petroleum Products 2.87%Auto 2.48%Auto Ancillaries 1.44%Construction 1.39%Gas 1.24%Pesticides 1.22%
Oil 1.15%Non - Ferrous Metals 1.08%Healthcare Services 1.07%Consumer Durables 0.82%Chemicals 0.75%Telecom - Services 0.72%Industrial Products 0.71%Minerals/Mining 0.58%Media & Entertainment 0.50%Construction Project 0.43%Industrial Capital Goods 0.32%Trading 0.28%Textile Products 0.16%
NAV (`)
Regular Plan Growth 21.0958Regular Plan Monthly Dividend 12.6398Regular Plan Annual Dividend 10.6194Direct Plan Growth 21.5926Direct Plan Monthly Dividend 13.0021Direct Plan Annual Dividend 11.6299
Riskometer
Investors understand that their principal will be at Moderately Low risk
This product is suitable for investors who are seeking*:
To generate low volatility returns over short to •medium termInvestments predominantly in arbitrage opportunities •in the cash and derivative segments of the equity markets and the arbitrage opportunities available within the derivative segment and by investing the balance in debt and money market instruments.
*Investors should consult their financial advisers if in doubt about whether the product is suitable for them.
PORTFOLIO
Name Industries% of NAV
JSW Steel Ferrous Metals 3.65%Sun Pharmaceutical Industries Pharmaceuticals 3.49%Infosys Software 3.49%Yes Bank Banks 2.98%ICICI Bank Banks 2.50%Reliance Capital Finance 2.15%Tata Consultancy Services Software 2.11%Reliance Industries Petroleum Products 2.03%Axis Bank Banks 1.96%State Bank of India Banks 1.80%CESC Power 1.63%Tata Global Beverages Consumer Non Durables 1.62%Century Textiles & Industries Cement 1.59%The Federal Bank Banks 1.47%Dewan Housing Finance Corporation Finance 1.41%Reliance Infrastructure Power 1.33%Tata Motors Auto 1.24%UPL Pesticides 1.22%Jindal Steel & Power Ferrous Metals 1.20%Lupin Pharmaceuticals 1.12%Oil & Natural Gas Corporation Oil 1.11%Fortis Healthcare Healthcare Services 1.07%UltraTech Cement Cement 1.06%United Spirits Consumer Non Durables 1.04%Max Financial Services Finance 0.96%Shriram Transport Finance Company Finance 0.91%LIC Housing Finance Finance 0.91%Dr. Reddy's Laboratories Pharmaceuticals 0.81%Indiabulls Housing Finance Finance 0.79%Indraprastha Gas Gas 0.78%Exide Industries Auto Ancillaries 0.70%Bank of Baroda Banks 0.68%Mahindra & Mahindra Auto 0.67%Ambuja Cements Cement 0.66%Hindustan Zinc Non - Ferrous Metals 0.56%Indiabulls Real Estate Construction 0.56%Bharat Forge Industrial Products 0.55%Reliance Power Power 0.53%Tata Communications Telecom - Services 0.52%Hindalco Industries Non - Ferrous Metals 0.50%Tata Motors Auto 0.49%Aurobindo Pharma Pharmaceuticals 0.47%Havells India Consumer Durables 0.47%Petronet LNG Gas 0.46%NMDC Minerals/Mining 0.45%Tata Chemicals Chemicals 0.41%Glenmark Pharmaceuticals Pharmaceuticals 0.39%Apollo Tyres Auto Ancillaries 0.36%Pidilite Industries Chemicals 0.35%Divi's Laboratories Pharmaceuticals 0.34%Engineers India Construction Project 0.33%Kotak Mahindra Bank Banks 0.32%Bata India Consumer Durables 0.32%Sun TV Network Media & Entertainment 0.31%IRB Infrastructure Developers Construction 0.30%Mangalore Refinery and Petrochemicals Petroleum Products 0.29%
Adani Enterprises Trading 0.28%CEAT Auto Ancillaries 0.28%JSW Energy Power 0.28%Granules India Pharmaceuticals 0.27%Housing Development and Infrastructure Construction 0.27%
DLF Construction 0.26%Muthoot Finance Finance 0.25%
Name Industries% of NAV
Indian Oil Corporation Petroleum Products 0.25%KPIT Technologies Software 0.24%Ujjivan Financial Services Finance 0.23%Bajaj Finance Finance 0.23%Wockhardt Pharmaceuticals 0.21%Castrol India Petroleum Products 0.20%Tata Elxsi Software 0.20%Reliance Communications Telecom - Services 0.20%Zee Entertainment Enterprises Media & Entertainment 0.19%Tata Power Company Power 0.19%ITC Consumer Non Durables 0.17%HCL Technologies Software 0.17%Britannia Industries Consumer Non Durables 0.16%Sintex Industries Industrial Products 0.15%DCB BANK Banks 0.14%Bharat Heavy Electricals Industrial Capital Goods 0.14%Coal India Minerals/Mining 0.13%The India Cements Cement 0.12%Equitas Holdings Finance 0.12%Grasim Industries Cement 0.12%Power Finance Corporation Finance 0.12%Hindustan Petroleum Corporation Petroleum Products 0.10%
Arvind Textile Products 0.10%
Punjab National Bank Banks 0.10%Syndicate Bank Banks 0.10%Tata Steel Ferrous Metals 0.09%Motherson Sumi Systems Auto Ancillaries 0.09%
Steel Authority of India Ferrous Metals 0.09%
BEML Industrial Capital Goods 0.09%GMR Infrastructure Construction Project 0.09%ACC Cement 0.09%Bharat Electronics Industrial Capital Goods 0.08%Cadila Healthcare Pharmaceuticals 0.08%Cipla Pharmaceuticals 0.08%Ashok Leyland Auto 0.08%Strides Shasun Pharmaceuticals 0.08%Manappuram Finance Finance 0.07%Andhra Bank Banks 0.06%Raymond Textile Products 0.06%Tech Mahindra Software 0.05%Union Bank of India Banks 0.05%Oil India Oil 0.04%Rural Electrification Corporation Finance 0.04%Housing Development Finance Corporation Finance 0.04%
Titan Company Consumer Durables 0.04%Allahabad Bank Banks 0.04%Biocon Pharmaceuticals 0.04%Mahindra & Mahindra Financial Services Finance 0.03%
Oracle Financial Services Software Software 0.02%Larsen & Toubro Construction Project 0.02%National Aluminium Company Non - Ferrous Metals 0.02%Bajaj Finserv Finance 0.01%Siemens Industrial Capital Goods 0.01%Oriental Bank of Commerce Banks 0.01%Torrent Power Power 0.004%Total Hedged Equity 68.97%Margin Fixed Deposit 12.46%Corporate Bond 14.89%Adjusted Net Current Asset 3.68%Grand Total 100.00%

13
IDFC Arbitrage Plus FundAn Open Ended Equity Fund
31st July 2017
FUND FEATURES
INDUSTRY ALLOCATION
About the Fund: The fund invests in arbitrage opportunities in the cash and the derivative segments of the equity markets. It aims to capture the spread between the cash and futures market by simultaneously executing buy (in the cash market) and sell (in the futures market) trades. The fund can also tactically participate in a mix of strategies like pair trades, corporate events like buybacks, etc, (restricted upto 5% of the portfolio). The balance is invested in actively managed debt and money market instruments.
Nature: Equity Derivatives
Monthly Avg AUM: ` 667.30 Crores
Month end AUM: ` 663.23 Crores
Inception Date: 9 June 2008
Fund Manager: Equity Portion: Mr. Yogik Pitti (w.e.f. 27th June 2013), Mr. Arpit Kapoor (w.e.f. 1st March 2017) & Debt Portion: Mr. Harshal Joshi (w.e.f. 20th October 2016)
Other Parameter:
Beta 1.44 R Square 0.21 Standard Deviation (Annualized) 0.98% Sharpe* 0.30
Portfolio Turnover
Equity 2.51 Aggregate^ 19.24
Expense Ratio
Regular 1.03%
Direct 0.37%
Benchmark: Crisil Liquid Fund Index
SIP (Minimum Amount): ` 1000/-
SIP Frequency: Monthly
SIP Dates (Monthly): Any day of the month, except 29th, 30th & 31st day of the monthInvestment Objective: Refer Pg No from 40 to 41
Minimum Investment Amount: ` 5,000/- and any amount thereafter
Option Available: Growth, Dividend - (Payout, Reinvestment and Sweep (from Equity Schemes to Debt Schemes only)) - Monthly & Annual
Exit Load: 0.25% if redeemed / switched-out within 1 (one) month from the date of allotment. (w.e.f. 12th August 2016)
Pharmaceuticals 14.13%Auto 8.21%Banks 6.85%Ferrous Metals 5.52%Finance 5.10%Cement 4.22%Healthcare Services 3.94%Construction 3.12%Software 3.04%Power 2.96%Industrial Capital Goods 2.79%Consumer Non Durables 2.42%
Performance Table Regular Plan - Growth Direct Plan - GrowthScheme Name CAGR Returns (%) Current Value of Investment of ` 10,000 CAGR Returns (%) Current Value of Investment of ` 10,000
1 Year 3 Years 5 Years
SinceInceptionJun 09, 2008
1 Year 3 Years 5 Years
SinceInceptionJun 09, 2008
1 Year 3 Years 5 Years
SinceInception
Dec 31, 20131 Year 3 Years 5 Years
SinceInception
Dec 31, 2013
IDFC Arbitrage Plus Fund 5.85% 6.55% 7.33% 7.01% 10,588 12,098 14,248 18,579 6.68% 7.31% NA 7.59% 10,672 12,359 NA 12,996
CRISIL Liquid Fund Index# 6.79% 7.78% 8.23% 7.62% 10,683 12,522 14,855 19,569 6.79% 7.78% NA 8.05% 10,683 12,522 NA 13,199
Nifty 50## 16.56% 9.27% 14.01% 9.21% 11,665 13,051 19,272 22,389 16.56% 9.27% NA 13.99% 11,665 13,051 NA 15,985
The fund is being managed by Mr. Yogik Pitti (w.e.f. 27th June 2013), Mr. Arpit Kapoor (w.e.f. 1st March 2017) & Debt Portion: Mr. Harshal Joshi (w.e.f. 20th October 2016)Performance based on NAV as on 31/07/2017. Past performance may or may not be sustained in future.For other funds managed by the fund manager, please refer page no. 33 - 35 & the respective fund pages Regular and Direct Plans have different expense structure. Direct Plan shall have a lower expense ratio excluding distribution expenses, commission expenses etc.*Risk-free rate assumed to be 6.25% (FBIL OVERNIGHT MIBOR as on 31st July 2017). Ratios calculated on the basis of 3 years history of monthly data. ^Portfolio Turnover ratio is calculated as Lower of purchase or sale during the period / Average AUM for the last one year (includes Fixed Income securities and Equity derivatives). #Benchmark Returns. ##Alternate Benchmark Returns.
SIP PERFORMANCE
Monthly SIP of ` 10,000 in IDFC Arbitrage Plus Fund - Regular Plan - Growth
1 Year 3 Years 5 Years 7 Years 10 YearsSince
InceptionJun 09, 2008
Total Amount Invested (`) 1,20,000 3,60,000 6,00,000 8,40,000 NA 11,00,000
Total Value as on July 31, 2017 (`) 1,23,332 3,95,544 7,12,403 10,84,392 NA 15,36,012
Fund Returns (%) 5.21 6.22 6.81 7.18 NA 7.11
Total Value of Crisil Liquid Fund Index# 1,24,320 4,02,410 7,32,412 11,20,866 NA 15,95,649
Crisil Liquid Fund Index Returns (%)# 6.78 7.37 7.91 8.11 NA 7.91
Total Value of Nifty 50 Index## 1,36,500 4,34,380 8,36,566 12,83,988 NA 19,30,175
Nifty 50 Index Returns (%)## 26.58 12.60 13.26 11.92 NA 11.87
Past performance may or may not be sustained in future.Dividends are assumed to be reinvested and bonus is adjusted. Load is not taken into consideration. To illustrate the advantages of SIP investment, this is how your investment would have grown if you had invested say `10,000 systematically on the first business Day of every month over a period of time. Returns are calculated by using XIRR approach. XIRR helps in calculating return on investment given an initial and final value and a series of cash inflows and outflows with the correct allowance for the time impact of the transactions. Regular and Direct plans have different expense structure. Direct Plan shall have a lower expense ratio excluding distribution expenses, commision expenses etc. #Benchmark Returns. ##Alternate Benchmark Returns. Data as on July 31, 2017.
Oil 0.94%Auto Ancillaries 0.71%Gas 0.63%Petroleum Products 0.63%Media & Entertainment 0.62%Textile Products 0.47%Non - Ferrous Metals 0.21%Telecom - Services 0.19%Chemicals 0.18%Pesticides 0.14%Industrial Products 0.12%Minerals/Mining 0.07%
NAV (`)
Regular Plan Growth 18.5786Regular Plan Monthly Dividend 12.0292Regular Plan Annual Dividend 10.7772Direct Plan Growth 19.0362Direct Plan Monthly Dividend 12.3162
Direct Plan Annual Dividend 11.0783
Riskometer
Investors understand that their principal will be at Moderate risk
This product is suitable for investors who are seeking*:
To generate low volatility returns over short to •medium term.Investments predominantly in arbitrage •opportunities in the cash and derivative segments of the equity markets and the arbitrage opportunities available within the derivative segment and by investing the balance in debt and money market instruments.
*Investors should consult their financial advisers if in doubt about whether the product is suitable for them.
PORTFOLIO
Name Industries% of NAV
Sun Pharmaceutical Industries Pharmaceuticals 7.81%
Tata Motors Auto 4.89%
Fortis Healthcare Healthcare Services 3.94%
Century Textiles & Industries Cement 3.65%
JSW Steel Ferrous Metals 3.06%
ICICI Bank Banks 2.91%
Infosys Software 2.84%
Bharat Electronics Industrial Capital Goods 2.66%
Lupin Pharmaceuticals 2.51%
Jindal Steel & Power Ferrous Metals 2.46%
Ashok Leyland Auto 2.36%
State Bank of India Banks 2.35%
Tata Global Beverages Consumer Non Durables 1.97%
Indiabulls Real Estate Construction 1.92%
Indiabulls Housing Finance Finance 1.62%
Aurobindo Pharma Pharmaceuticals 1.52%
CESC Power 1.36%
Dr. Reddy's Laboratories Pharmaceuticals 1.25%
IRB Infrastructure Developers Construction 1.21%
Reliance Power Power 1.12%
Ujjivan Financial Services Finance 0.97%
Mahindra & Mahindra Auto 0.96%
Oil & Natural Gas Corporation Oil 0.94%
LIC Housing Finance Finance 0.86%
Bank of Baroda Banks 0.72%
Power Finance Corporation Finance 0.71%
TV18 Broadcast Media & Entertainment 0.62%
Axis Bank Banks 0.51%
Castrol India Petroleum Products 0.51%
Glenmark Pharmaceuticals Pharmaceuticals 0.49%
SRF Textile Products 0.47%
Apollo Tyres Auto Ancillaries 0.45%
United Spirits Consumer Non Durables 0.40%
Biocon Pharmaceuticals 0.38%
Name Industries% of NAV
Dewan Housing Finance Corporation Finance 0.37%
Indraprastha Gas Gas 0.36%
UltraTech Cement Cement 0.35%
Mahindra & Mahindra Financial Services Finance 0.33%
JSW Energy Power 0.27%
Petronet LNG Gas 0.27%
Exide Industries Auto Ancillaries 0.26%
Syndicate Bank Banks 0.26%
Ambuja Cements Cement 0.22%
Hindalco Industries Non - Ferrous Metals 0.21%
Reliance Infrastructure Power 0.21%
Reliance Communications Telecom - Services 0.19%
MindTree Software 0.17%
Tata Chemicals Chemicals 0.17%
UPL Pesticides 0.14%
Divi's Laboratories Pharmaceuticals 0.14%
Bharat Heavy Electricals Industrial Capital Goods 0.13%
Rural Electrification Corporation Finance 0.13%
Hindustan Petroleum Corporation Petroleum Products 0.12%
Jain Irrigation Systems Industrial Products 0.12%
Max Financial Services Finance 0.11%
NMDC Minerals/Mining 0.07%
The Federal Bank Banks 0.06%
DCB BANK Banks 0.05%
ITC Consumer Non Durables 0.05%
Granules India Pharmaceuticals 0.04%
Just Dial Software 0.02%
Pidilite Industries Chemicals 0.01%
Total Hedged Equity 67.19%
Margin Fixed Deposit 11.44%
Corporate Bond 19.02%
Adjusted Net Current Asset 2.35%
Grand Total 100.00%
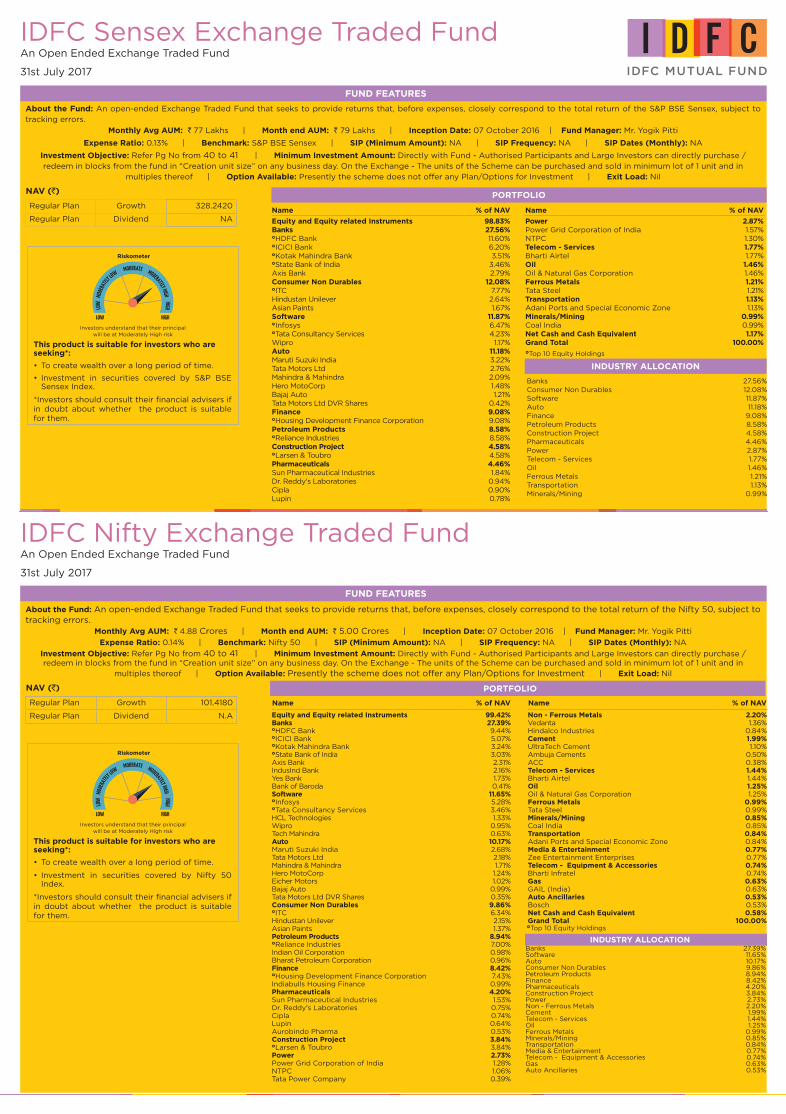
14
IDFC Sensex Exchange Traded FundAn Open Ended Exchange Traded Fund
31st July 2017
FUND FEATURES
FUND FEATURES
About the Fund: An open-ended Exchange Traded Fund that seeks to provide returns that, before expenses, closely correspond to the total return of the S&P BSE Sensex, subject to tracking errors.
About the Fund: An open-ended Exchange Traded Fund that seeks to provide returns that, before expenses, closely correspond to the total return of the Nifty 50, subject to tracking errors.
Monthly Avg AUM: ` 77 Lakhs | Month end AUM: ` 79 Lakhs | Inception Date: 07 October 2016 | Fund Manager: Mr. Yogik Pitti
Expense Ratio: 0.13% | Benchmark: S&P BSE Sensex | SIP (Minimum Amount): NA | SIP Frequency: NA | SIP Dates (Monthly): NA
Investment Objective: Refer Pg No from 40 to 41 | Minimum Investment Amount: Directly with Fund - Authorised Participants and Large Investors can directly purchase / redeem in blocks from the fund in “Creation unit size” on any business day. On the Exchange - The units of the Scheme can be purchased and sold in minimum lot of 1 unit and in
multiples thereof | Option Available: Presently the scheme does not offer any Plan/Options for Investment | Exit Load: Nil
NAV (`)
Regular Plan Growth 328.2420
Regular Plan Dividend NA
Monthly Avg AUM: ` 4.88 Crores | Month end AUM: ` 5.00 Crores | Inception Date: 07 October 2016 | Fund Manager: Mr. Yogik Pitti
Expense Ratio: 0.14% | Benchmark: Nifty 50 | SIP (Minimum Amount): NA | SIP Frequency: NA | SIP Dates (Monthly): NA
Investment Objective: Refer Pg No from 40 to 41 | Minimum Investment Amount: Directly with Fund - Authorised Participants and Large Investors can directly purchase / redeem in blocks from the fund in “Creation unit size” on any business day. On the Exchange - The units of the Scheme can be purchased and sold in minimum lot of 1 unit and in
multiples thereof | Option Available: Presently the scheme does not offer any Plan/Options for Investment | Exit Load: Nil
NAV (`)
Regular Plan Growth 101.4180
Regular Plan Dividend N.A
Riskometer
Investors understand that their principal will be at Moderately High risk
This product is suitable for investors who are seeking*:
To create wealth over a long period of time.•
Investment in securities covered by S&P BSE •Sensex Index.
*Investors should consult their financial advisers if in doubt about whether the product is suitable for them.
Riskometer
Investors understand that their principal will be at Moderately High risk
This product is suitable for investors who are seeking*:
To create wealth over a long period of time.•
Investment in securities covered by • Nifty 50 Index.
*Investors should consult their financial advisers if in doubt about whether the product is suitable for them.
PORTFOLIO
PORTFOLIO
Name % of NAV
Equity and Equity related Instruments 98.83%Banks 27.56%HDFC Bank 11.60%ICICI Bank 6.20%Kotak Mahindra Bank 3.51%State Bank of India 3.46%Axis Bank 2.79%Consumer Non Durables 12.08%ITC 7.77%Hindustan Unilever 2.64%Asian Paints 1.67%Software 11.87%Infosys 6.47%Tata Consultancy Services 4.23%Wipro 1.17%Auto 11.18%Maruti Suzuki India 3.22%Tata Motors Ltd 2.76%Mahindra & Mahindra 2.09%Hero MotoCorp 1.48%Bajaj Auto 1.21%Tata Motors Ltd DVR Shares 0.42%Finance 9.08%Housing Development Finance Corporation 9.08%Petroleum Products 8.58%Reliance Industries 8.58%Construction Project 4.58%Larsen & Toubro 4.58%Pharmaceuticals 4.46%Sun Pharmaceutical Industries 1.84%Dr. Reddy's Laboratories 0.94%Cipla 0.90%Lupin 0.78%
Name % of NAV
Power 2.87%Power Grid Corporation of India 1.57%NTPC 1.30%Telecom - Services 1.77%Bharti Airtel 1.77%Oil 1.46%Oil & Natural Gas Corporation 1.46%Ferrous Metals 1.21%Tata Steel 1.21%Transportation 1.13%Adani Ports and Special Economic Zone 1.13%Minerals/Mining 0.99%Coal India 0.99%Net Cash and Cash Equivalent 1.17%Grand Total 100.00%Top 10 Equity Holdings
Top 10 Equity Holdings
Banks 27.56%Consumer Non Durables 12.08%Software 11.87%Auto 11.18%Finance 9.08%Petroleum Products 8.58%Construction Project 4.58%Pharmaceuticals 4.46%Power 2.87%Telecom - Services 1.77%Oil 1.46%Ferrous Metals 1.21%Transportation 1.13%Minerals/Mining 0.99%
INDUSTRY ALLOCATION
Banks 27.39%Software 11.65%Auto 10.17%Consumer Non Durables 9.86%Petroleum Products 8.94%Finance 8.42%Pharmaceuticals 4.20%Construction Project 3.84%Power 2.73%Non - Ferrous Metals 2.20%Cement 1.99%Telecom - Services 1.44%Oil 1.25%Ferrous Metals 0.99%Minerals/Mining 0.85%Transportation 0.84%Media & Entertainment 0.77%Telecom - Equipment & Accessories 0.74%Gas 0.63%Auto Ancillaries 0.53%
INDUSTRY ALLOCATION
IDFC Nifty Exchange Traded FundAn Open Ended Exchange Traded Fund
31st July 2017
Name % of NAV
Equity and Equity related Instruments 99.42%Banks 27.39%HDFC Bank 9.44%ICICI Bank 5.07%Kotak Mahindra Bank 3.24%State Bank of India 3.03%Axis Bank 2.31%IndusInd Bank 2.16%Yes Bank 1.73%Bank of Baroda 0.41%Software 11.65%Infosys 5.28%Tata Consultancy Services 3.46%HCL Technologies 1.33%Wipro 0.95%Tech Mahindra 0.63%Auto 10.17%Maruti Suzuki India 2.68%Tata Motors Ltd 2.18%Mahindra & Mahindra 1.71%Hero MotoCorp 1.24%Eicher Motors 1.02%Bajaj Auto 0.99%Tata Motors Ltd DVR Shares 0.35%Consumer Non Durables 9.86%ITC 6.34%Hindustan Unilever 2.15%Asian Paints 1.37%Petroleum Products 8.94%Reliance Industries 7.00%Indian Oil Corporation 0.98%Bharat Petroleum Corporation 0.96%Finance 8.42%Housing Development Finance Corporation 7.43%Indiabulls Housing Finance 0.99%Pharmaceuticals 4.20%Sun Pharmaceutical Industries 1.53%Dr. Reddy's Laboratories 0.75%Cipla 0.74%Lupin 0.64%Aurobindo Pharma 0.53%Construction Project 3.84%Larsen & Toubro 3.84%Power 2.73%Power Grid Corporation of India 1.28%NTPC 1.06%Tata Power Company 0.39%
Name % of NAV
Non - Ferrous Metals 2.20%Vedanta 1.36%Hindalco Industries 0.84%Cement 1.99%UltraTech Cement 1.10%Ambuja Cements 0.50%ACC 0.38%Telecom - Services 1.44%Bharti Airtel 1.44%Oil 1.25%Oil & Natural Gas Corporation 1.25%Ferrous Metals 0.99%Tata Steel 0.99%Minerals/Mining 0.85%Coal India 0.85%Transportation 0.84%Adani Ports and Special Economic Zone 0.84%Media & Entertainment 0.77%Zee Entertainment Enterprises 0.77%Telecom - Equipment & Accessories 0.74%Bharti Infratel 0.74%Gas 0.63%GAIL (India) 0.63%Auto Ancillaries 0.53%Bosch 0.53%Net Cash and Cash Equivalent 0.58%Grand Total 100.00%
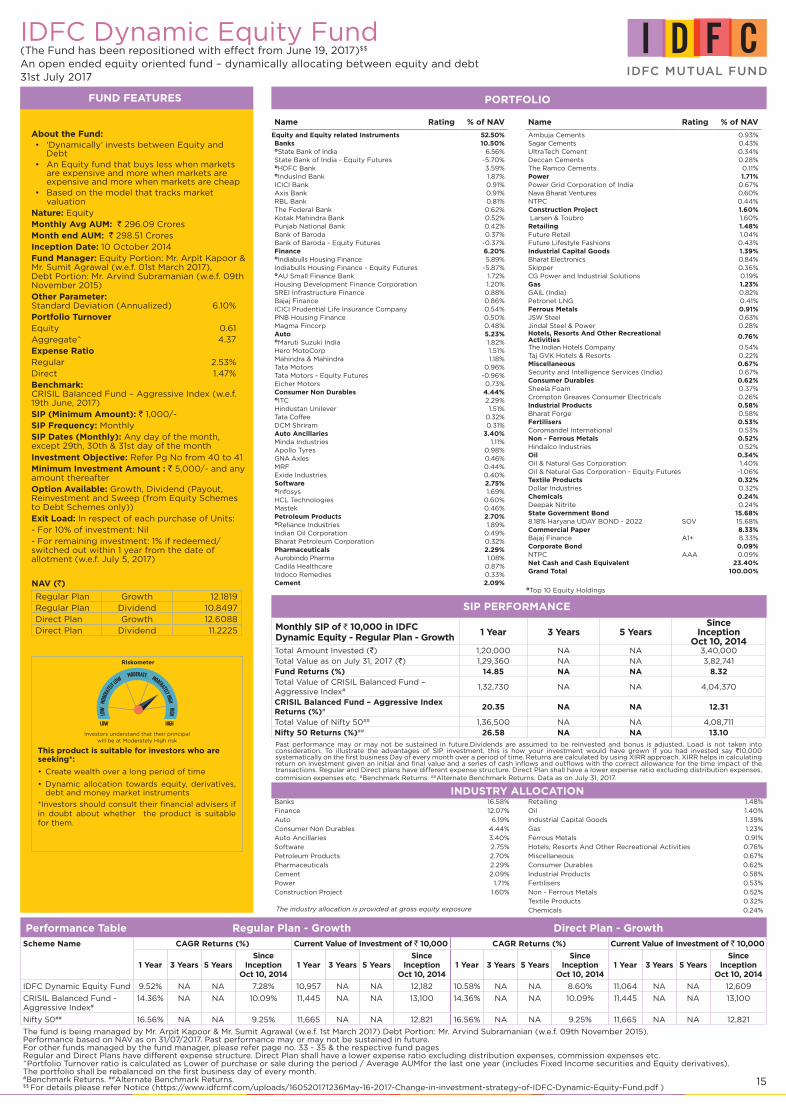
15
IDFC Dynamic Equity Fund(The Fund has been repositioned with effect from June 19, 2017)$$ An open ended equity oriented fund – dynamically allocating between equity and debt31st July 2017
FUND FEATURES PORTFOLIO
INDUSTRY ALLOCATION
About the Fund:‘Dynamically’ invests between Equity and •Debt An Equity fund that buys less when markets •are expensive and more when markets are expensive and more when markets are cheapBased on the model that tracks market •valuation
Nature: EquityMonthly Avg AUM: ` 296.09 Crores Month end AUM: ` 298.51 Crores Inception Date: 10 October 2014Fund Manager: Equity Portion: Mr. Arpit Kapoor & Mr. Sumit Agrawal (w.e.f. 01st March 2017), Debt Portion: Mr. Arvind Subramanian (w.e.f. 09th November 2015)Other Parameter: Standard Deviation (Annualized) 6.10%Portfolio TurnoverEquity 0.61Aggregate^ 4.37Expense Ratio Regular 2.53%Direct 1.47%Benchmark: CRISIL Balanced Fund – Aggressive Index (w.e.f. 19th June, 2017) SIP (Minimum Amount): ` 1,000/-SIP Frequency: Monthly SIP Dates (Monthly): Any day of the month, except 29th, 30th & 31st day of the monthInvestment Objective: Refer Pg No from 40 to 41Minimum Investment Amount : ` 5,000/- and any amount thereafterOption Available: Growth, Dividend (Payout, Reinvestment and Sweep (from Equity Schemes to Debt Schemes only))Exit Load: In respect of each purchase of Units:- For 10% of investment: Nil- For remaining investment: 1% if redeemed/ switched out within 1 year from the date of allotment (w.e.f. July 5, 2017)
Top 10 Equity Holdings
Name Rating % of NAV
Equity and Equity related Instruments 52.50%Banks 10.50%State Bank of India 6.56%State Bank of India - Equity Futures -5.70%HDFC Bank 3.59%IndusInd Bank 1.87%ICICI Bank 0.91%Axis Bank 0.91%RBL Bank 0.81%The Federal Bank 0.62%Kotak Mahindra Bank 0.52%Punjab National Bank 0.42%Bank of Baroda 0.37%Bank of Baroda - Equity Futures -0.37%Finance 6.20%Indiabulls Housing Finance 5.89%Indiabulls Housing Finance - Equity Futures -5.87%AU Small Finance Bank 1.72%Housing Development Finance Corporation 1.20%SREI Infrastructure Finance 0.88%Bajaj Finance 0.86%ICICI Prudential Life Insurance Company 0.54%PNB Housing Finance 0.50%Magma Fincorp 0.48%Auto 5.23%Maruti Suzuki India 1.82%Hero MotoCorp 1.51%Mahindra & Mahindra 1.18%Tata Motors 0.96%Tata Motors - Equity Futures -0.96%Eicher Motors 0.73%Consumer Non Durables 4.44%ITC 2.29%Hindustan Unilever 1.51%Tata Coffee 0.32%DCM Shriram 0.31%Auto Ancillaries 3.40%Minda Industries 1.11%Apollo Tyres 0.98%GNA Axles 0.46%MRF 0.44%Exide Industries 0.40%Software 2.75%Infosys 1.69%HCL Technologies 0.60%Mastek 0.46%Petroleum Products 2.70%Reliance Industries 1.89%Indian Oil Corporation 0.49%Bharat Petroleum Corporation 0.32%Pharmaceuticals 2.29%Aurobindo Pharma 1.08%Cadila Healthcare 0.87%Indoco Remedies 0.33%Cement 2.09%
Banks 16.58%
Finance 12.07%
Auto 6.19%
Consumer Non Durables 4.44%
Auto Ancillaries 3.40%
Software 2.75%
Petroleum Products 2.70%
Pharmaceuticals 2.29%
Cement 2.09%
Power 1.71%
Construction Project 1.60%
Performance Table Regular Plan - Growth Direct Plan - GrowthScheme Name CAGR Returns (%) Current Value of Investment of ` 10,000 CAGR Returns (%) Current Value of Investment of ` 10,000
1 Year 3 Years 5 YearsSince
InceptionOct 10, 2014
1 Year 3 Years 5 YearsSince
InceptionOct 10, 2014
1 Year 3 Years 5 YearsSince
InceptionOct 10, 2014
1 Year 3 Years 5 YearsSince
InceptionOct 10, 2014
IDFC Dynamic Equity Fund 9.52% NA NA 7.28% 10,957 NA NA 12,182 10.58% NA NA 8.60% 11,064 NA NA 12,609
CRISIL Balanced Fund - Aggressive Index#
14.36% NA NA 10.09% 11,445 NA NA 13,100 14.36% NA NA 10.09% 11,445 NA NA 13,100
Nifty 50## 16.56% NA NA 9.25% 11,665 NA NA 12,821 16.56% NA NA 9.25% 11,665 NA NA 12,821
The fund is being managed by Mr. Arpit Kapoor & Mr. Sumit Agrawal (w.e.f. 1st March 2017) Debt Portion: Mr. Arvind Subramanian (w.e.f. 09th November 2015). Performance based on NAV as on 31/07/2017. Past performance may or may not be sustained in future.For other funds managed by the fund manager, please refer page no. 33 - 35 & the respective fund pages Regular and Direct Plans have different expense structure. Direct Plan shall have a lower expense ratio excluding distribution expenses, commission expenses etc. ^Portfolio Turnover ratio is calculated as Lower of purchase or sale during the period / Average AUMfor the last one year (includes Fixed Income securities and Equity derivatives). The portfolio shall be rebalanced on the first business day of every month.#Benchmark Returns. ##Alternate Benchmark Returns.$$ For details please refer Notice (https://www.idfcmf.com/uploads/160520171236May-16-2017-Change-in-investment-strategy-of-IDFC-Dynamic-Equity-Fund.pdf )
SIP PERFORMANCE
Monthly SIP of ` 10,000 in IDFC Dynamic Equity - Regular Plan - Growth
1 Year 3 Years 5 YearsSince
InceptionOct 10, 2014
Total Amount Invested (`) 1,20,000 NA NA 3,40,000 Total Value as on July 31, 2017 (`) 1,29,360 NA NA 3,82,741 Fund Returns (%) 14.85 NA NA 8.32Total Value of CRISIL Balanced Fund – Aggressive Index# 1,32,730 NA NA 4,04,370
CRISIL Balanced Fund – Aggressive Index Returns (%)# 20.35 NA NA 12.31
Total Value of Nifty 50## 1,36,500 NA NA 4,08,711 Nifty 50 Returns (%)## 26.58 NA NA 13.10
Past performance may or may not be sustained in future.Dividends are assumed to be reinvested and bonus is adjusted. Load is not taken into consideration. To illustrate the advantages of SIP investment, this is how your investment would have grown if you had invested say `10,000 systematically on the first business Day of every month over a period of time. Returns are calculated by using XIRR approach. XIRR helps in calculating return on investment given an initial and final value and a series of cash inflows and outflows with the correct allowance for the time impact of the transactions. Regular and Direct plans have different expense structure. Direct Plan shall have a lower expense ratio excluding distribution expenses, commision expenses etc. #Benchmark Returns. ##Alternate Benchmark Returns. Data as on July 31, 2017.
Riskometer
Investors understand that their principal will be at Moderately High risk
This product is suitable for investors who are seeking*:
Create wealth over a long period of time•
Dynamic allocation towards equity, derivatives, •debt and money market instruments
*Investors should consult their financial advisers if in doubt about whether the product is suitable for them.
Name Rating % of NAV
Ambuja Cements 0.93%Sagar Cements 0.43%UltraTech Cement 0.34%Deccan Cements 0.28%The Ramco Cements 0.11%Power 1.71%Power Grid Corporation of India 0.67%Nava Bharat Ventures 0.60%NTPC 0.44%Construction Project 1.60%Larsen & Toubro 1.60%Retailing 1.48%Future Retail 1.04%Future Lifestyle Fashions 0.43%Industrial Capital Goods 1.39%Bharat Electronics 0.84%Skipper 0.36%CG Power and Industrial Solutions 0.19%Gas 1.23%GAIL (India) 0.82%Petronet LNG 0.41%Ferrous Metals 0.91%JSW Steel 0.63%Jindal Steel & Power 0.28%Hotels, Resorts And Other Recreational Activities 0.76%
The Indian Hotels Company 0.54%Taj GVK Hotels & Resorts 0.22%Miscellaneous 0.67%Security and Intelligence Services (India) 0.67%Consumer Durables 0.62%Sheela Foam 0.37%Crompton Greaves Consumer Electricals 0.26%Industrial Products 0.58%Bharat Forge 0.58%Fertilisers 0.53%Coromandel International 0.53%Non - Ferrous Metals 0.52%Hindalco Industries 0.52%Oil 0.34%Oil & Natural Gas Corporation 1.40%Oil & Natural Gas Corporation - Equity Futures -1.06%Textile Products 0.32%Dollar Industries 0.32%Chemicals 0.24%Deepak Nitrite 0.24%State Government Bond 15.68%8.18% Haryana UDAY BOND - 2022 SOV 15.68%Commercial Paper 8.33%Bajaj Finance A1+ 8.33%Corporate Bond 0.09%NTPC AAA 0.09%Net Cash and Cash Equivalent 23.40%Grand Total 100.00%
Retailing 1.48%
Oil 1.40%
Industrial Capital Goods 1.39%
Gas 1.23%
Ferrous Metals 0.91%
Hotels, Resorts And Other Recreational Activities 0.76%
Miscellaneous 0.67%
Consumer Durables 0.62%
Industrial Products 0.58%
Fertilisers 0.53%
Non - Ferrous Metals 0.52%
Textile Products 0.32%
Chemicals 0.24%
NAV (`)
Regular Plan Growth 12.1819Regular Plan Dividend 10.8497Direct Plan Growth 12.6088Direct Plan Dividend 11.2225
The industry allocation is provided at gross equity exposure
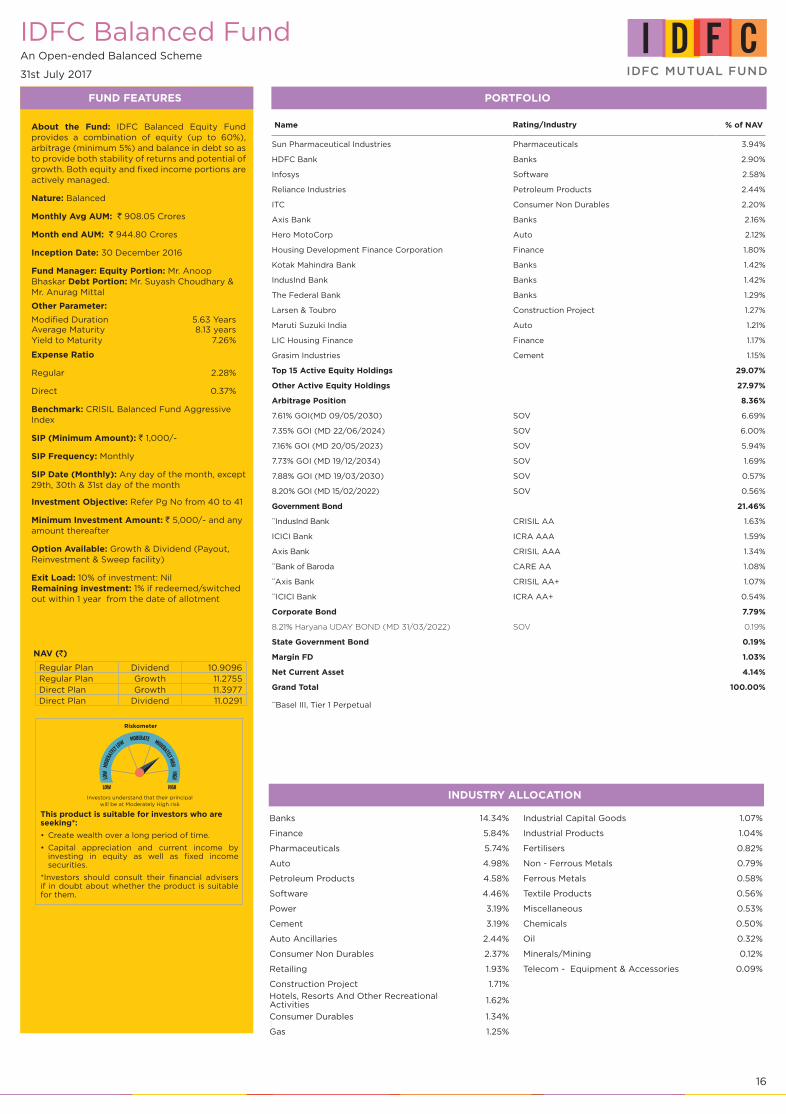
16
IDFC Balanced FundAn Open-ended Balanced Scheme
31st July 2017
FUND FEATURES
INDUSTRY ALLOCATION
About the Fund: IDFC Balanced Equity Fund provides a combination of equity (up to 60%), arbitrage (minimum 5%) and balance in debt so as to provide both stability of returns and potential of growth. Both equity and fixed income portions are actively managed.
Nature: Balanced
Monthly Avg AUM: ` 908.05 Crores
Month end AUM: ` 944.80 Crores
Inception Date: 30 December 2016
Fund Manager: Equity Portion: Mr. Anoop Bhaskar Debt Portion: Mr. Suyash Choudhary & Mr. Anurag Mittal
Other Parameter:
Modified Duration 5.63 Years Average Maturity 8.13 years Yield to Maturity 7.26%
Expense Ratio
Regular 2.28%
Direct 0.37%
Benchmark: CRISIL Balanced Fund Aggressive Index
SIP (Minimum Amount): ` 1,000/-
SIP Frequency: Monthly
SIP Date (Monthly): Any day of the month, except 29th, 30th & 31st day of the month
Investment Objective: Refer Pg No from 40 to 41
Minimum Investment Amount: ` 5,000/- and any amount thereafter
Option Available: Growth & Dividend (Payout, Reinvestment & Sweep facility)
Exit Load: 10% of investment: Nil Remaining investment: 1% if redeemed/switched out within 1 year from the date of allotment
Banks 14.34%
Finance 5.84%
Pharmaceuticals 5.74%
Auto 4.98%
Petroleum Products 4.58%
Software 4.46%
Power 3.19%
Cement 3.19%
Auto Ancillaries 2.44%
Consumer Non Durables 2.37%
Retailing 1.93%
Construction Project 1.71%
Hotels, Resorts And Other Recreational Activities 1.62%
Consumer Durables 1.34%
Gas 1.25%
Industrial Capital Goods 1.07%
Industrial Products 1.04%
Fertilisers 0.82%
Non - Ferrous Metals 0.79%
Ferrous Metals 0.58%
Textile Products 0.56%
Miscellaneous 0.53%
Chemicals 0.50%
Oil 0.32%
Minerals/Mining 0.12%
Telecom - Equipment & Accessories 0.09%
NAV (`)
Regular Plan Dividend 10.9096Regular Plan Growth 11.2755Direct Plan Growth 11.3977Direct Plan Dividend 11.0291
Riskometer
Investors understand that their principal will be at Moderately High risk
This product is suitable for investors who are seeking*:
Create wealth over a long period of time.•
Capital appreciation and current income by •investing in equity as well as fixed income securities.
*Investors should consult their financial advisers if in doubt about whether the product is suitable for them.
PORTFOLIO
**Basel III, Tier 1 Perpetual
Name Rating/Industry % of NAV
Sun Pharmaceutical Industries Pharmaceuticals 3.94%
HDFC Bank Banks 2.90%
Infosys Software 2.58%
Reliance Industries Petroleum Products 2.44%
ITC Consumer Non Durables 2.20%
Axis Bank Banks 2.16%
Hero MotoCorp Auto 2.12%
Housing Development Finance Corporation Finance 1.80%
Kotak Mahindra Bank Banks 1.42%
IndusInd Bank Banks 1.42%
The Federal Bank Banks 1.29%
Larsen & Toubro Construction Project 1.27%
Maruti Suzuki India Auto 1.21%
LIC Housing Finance Finance 1.17%
Grasim Industries Cement 1.15%
Top 15 Active Equity Holdings 29.07%
Other Active Equity Holdings 27.97%
Arbitrage Position 8.36%
7.61% GOI(MD 09/05/2030) SOV 6.69%
7.35% GOI (MD 22/06/2024) SOV 6.00%
7.16% GOI (MD 20/05/2023) SOV 5.94%
7.73% GOI (MD 19/12/2034) SOV 1.69%
7.88% GOI (MD 19/03/2030) SOV 0.57%
8.20% GOI (MD 15/02/2022) SOV 0.56%
Government Bond 21.46%
**IndusInd Bank CRISIL AA 1.63%
ICICI Bank ICRA AAA 1.59%
Axis Bank CRISIL AAA 1.34%
**Bank of Baroda CARE AA 1.08%
**Axis Bank CRISIL AA+ 1.07%
**ICICI Bank ICRA AA+ 0.54%
Corporate Bond 7.79%
8.21% Haryana UDAY BOND (MD 31/03/2022) SOV 0.19%
State Government Bond 0.19%
Margin FD 1.03%
Net Current Asset 4.14%
Grand Total 100.00%

17
IDFC Monthly Income PlanAn Open Ended Debt Fund
31st July 2017
FUND FEATURES
About the Fund: MIP is a hybrid fund which offers up to 25% participation in the equity markets with the balance invested in fixed income. The Equity portfolio of the fund is an actively managed all cap portfolio. The Fixed Income portfolio is also actively managed with a mix of debt and money market instruments.
Nature: Debt
Monthly Avg AUM: ` 250.70 Crores
Month end AUM: ` 252.93 Crores
Inception Date: 25 February 2010
Fund Manager: Equity Portion: Mr. Sumit Agrawal (w.e.f. 20th October 2016)
Debt Portion: Mr. Anurag Mittal (w.e.f. 09th November 2015)
Other Parameter:
Modified Duration 5.37 years Average Maturity 7.47 years Yield to Maturity* 7.20%
*Monthly income is not assured and is subject to availability of distributable surplus
Expense Ratio
Regular 2.30%
Direct 1.55%
Benchmark: Crisil MIP Blended Index
SIP (Minimum Amount): ` 1,000/-
SIP Frequency: Monthly
SIP Dates (Monthly): Any day of the month, except 29th, 30th & 31st day of the monthInvestment Objective: Refer Pg No from 40 to 41
Minimum Investment Amount: ` 5,000/- and any amount thereafter
Option Available: Growth, Dividend - Quarterly, Regular
Exit Load: 1% if redeemed/switched out within 1 year (365 days) from the date of subscription
Performance Table Regular Plan - Growth Direct Plan - GrowthScheme Name CAGR Returns (%) Current Value of Investment of ` 10,000 CAGR Returns (%) Current Value of Investment of ` 10,000
1 Year 3 Years 5 YearsSince
InceptionFeb 25, 2010
1 Year 3 Years 5 YearsSince
InceptionFeb 25, 2010
1 Year 3 Years 5 YearsSince
InceptionJan 01, 2013
1 Year 3 Years 5 YearsSince
InceptionJan 01, 2013
IDFC Monthly Income Plan 10.06% 10.88% 11.49% 9.92% 11,012 13,637 17,229 20,197 11.02% 11.94% NA 11.22% 11,109 14,031 NA 16,279
CRISIL MIP Blended Index# 11.00% 10.87% 10.40% 9.11% 11,106 13,634 16,404 19,117 11.00% 10.87% NA 10.10% 11,106 13,634 NA 15,540
10 Year GOI## 9.83% 11.15% 8.60% 7.29% 10,989 13,734 15,110 16,868 9.83% 11.15% NA 8.24% 10,989 13,734 NA 14,374
The fund is being managed by Mr. Sumit Agrawal (w.e.f. 20th October 2016) & Mr. Anurag Mittal (w.e.f. 09th November 2015)Performance based on NAV as on 31/07/2017. Past performance may or may not be sustained in future.Regular and Direct Plans have different expense structure. Direct Plan shall have a lower expense ratio excluding distribution expenses, commission expenses etc.For other funds managed by the fund manager, please refer page no. 33 - 35 & the respective fund pages#Benchmark Returns. ##Alternate Benchmark Returns.
SIP PERFORMANCE
Monthly SIP of ` 10,000 in IDFC Monthly Income Plan - Regular Plan - Growth
1 Year 3 Years 5 Years 7 Years 10 YearsSince
InceptionFeb 25, 2010
Total Amount Invested (`) 1,20,000 3,60,000 6,00,000 8,40,000 NA 9,00,000
Total Value as on July 31, 2017 (`) 1,26,767 4,19,939 7,89,730 12,33,420 NA 13,52,473
Fund Returns (%) 10.67 10.27 10.94 10.79 NA 10.65
Total Value of Crisil MIP Blended Fund Index# 1,27,429 4,23,750 7,87,857 12,08,515 NA 13,21,236
Crisil MIP Blended Fund Index Returns (%)# 11.74 10.89 10.84 10.22 NA 10.04
Total Value of CRISIL 10 Year Gilt Index## 1,25,140 4,20,237 7,62,916 11,49,337 NA 12,49,843
CRISIL 10 Year Gilt Index Returns (%)## 8.08 10.32 9.55 8.82 NA 8.60
Past performance may or may not be sustained in future.Dividends are assumed to be reinvested and bonus is adjusted. Load is not taken into consideration. To illustrate the advantages of SIP investment, this is how your investment would have grown if you had invested say `10,000 systematically on the first business Day of every month over a period of time. Returns are calculated by using XIRR approach. XIRR helps in calculating return on investment given an initial and final value and a series of cash inflows and outflows with the correct allowance for the time impact of the transactions. Regular and Direct plans have different expense structure. Direct Plan shall have a lower expense ratio excluding distribution expenses, commision expenses etc. #Benchmark Returns. ##Alternate Benchmark Returns. Data as on July 31, 2017.
NAV (`)
Regular Plan - Dividend - 13.2082
Regular Plan - Growth - 20.1967
Regular Plan - Dividend Quarterly 13.4382
Direct Plan - Growth - 21.0191
Direct Plan - Dividend - 13.9150
Direct Plan - Dividend Quarterly 14.3490
Riskometer
Investors understand that their principal will be at Moderately High risk
This product is suitable for investors who are seeking*:
Capital appreciation and provide regular income •over a long period of time.Investment primarily in debt securities to •generate regular returns and investment of a portion of the Scheme’s assets in equity securities to generate long-term capital appreciation.
*Investors should consult their financial advisers if in doubt about whether the product is suitable for them.
PORTFOLIO
Name Rating % of NAV
Government Bond 49.35%
7.35% - 2024 G-Sec SOV 24.47%
7.72% - 2025 G-Sec SOV 8.32%
7.16% - 2023 G-Sec SOV 6.06%
7.88% - 2030 G-Sec SOV 4.24%
7.61% - 2030 G-Sec SOV 4.16%
7.73% - 2034 G-Sec SOV 2.11%
Corporate Bond 23.93%
ICICI Bank AAA 7.94%**IndusInd Bank AA 4.05%**Axis Bank AA+ 2.79%
Blue Dart Express AA 2.71%
Axis Bank AAA 2.00%
Small Industries Dev Bank of India AAA 1.61%
HDFC Bank AAA 1.45%
NHPC AAA 1.38%
Equity 21.36%
Banks 4.15%HDFC Bank 1.41%ICICI Bank 1.24%Kotak Mahindra Bank 0.89%
State Bank of India 0.62%
Auto 2.08%Maruti Suzuki India 1.38%
Tata Motors 0.70%
Pharmaceuticals 1.84%Natco Pharma 0.92%
Alkem Laboratories 0.37%
Aurobindo Pharma 0.25%
Cadila Healthcare 0.21%
Sun Pharmaceutical Industries 0.08%
Power 1.57%Power Grid Corporation of India 1.19%
PTC India 0.38%
Petroleum Products 1.56%Reliance Industries 1.15%
Castrol India 0.41%
Fertilisers 1.24%Coromandel International 1.24%
Software 1.22%
Infosys 0.56%
HCL Technologies 0.34%
NIIT Technologies 0.16%
Tech Mahindra 0.15%
Consumer Non Durables 1.15%
DCM Shriram 0.63%
Linc Pen & Plastics 0.26%
S H Kelkar and Company 0.26%
Name Rating % of NAV
Transportation 1.03%
VRL Logistics 0.56%
Blue Dart Express 0.47%
Finance 1.01%
JM Financial 0.71%
SREI Infrastructure Finance 0.30%
Industrial Products 0.89%FAG Bearings India 0.89%
Oil 0.80%Oil & Natural Gas Corporation 0.80%
Gas 0.69%
Gujarat State Petronet 0.69%
Textiles - Cotton 0.67%
Vardhman Textiles 0.67%
Miscellaneous 0.59%
Dishman Carbogen Amcis 0.59%
Construction Project 0.57%
Larsen & Toubro 0.57%
Non - Ferrous Metals 0.28%
National Aluminium Company 0.28%
Net Cash and Cash Equivalent 5.36%
Grand Total 100.00%**Basel III, Tier 1 Perpetual
Asset Quality
AA+3.55%
AA8.60%
AAA Equivalent87.85%
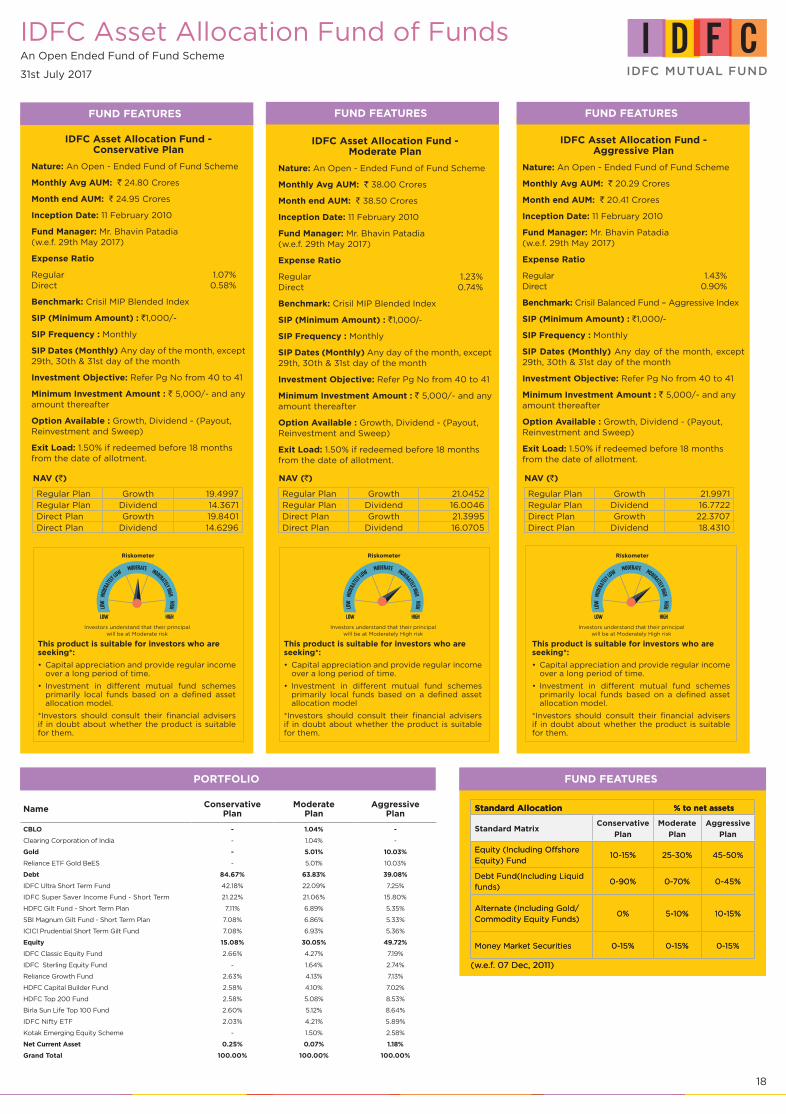
18
IDFC Asset Allocation Fund of FundsAn Open Ended Fund of Fund Scheme
31st July 2017
FUND FEATURES
NAV (`)
Regular Plan Growth 19.4997Regular Plan Dividend 14.3671Direct Plan Growth 19.8401Direct Plan Dividend 14.6296
IDFC Asset Allocation Fund - Conservative Plan
Nature: An Open - Ended Fund of Fund Scheme
Monthly Avg AUM: ` 24.80 Crores
Month end AUM: ` 24.95 Crores
Inception Date: 11 February 2010
Fund Manager: Mr. Bhavin Patadia (w.e.f. 29th May 2017)
Expense Ratio
Regular 1.07% Direct 0.58%
Benchmark: Crisil MIP Blended Index
SIP (Minimum Amount) : `1,000/-
SIP Frequency : Monthly
SIP Dates (Monthly) Any day of the month, except 29th, 30th & 31st day of the month
Investment Objective: Refer Pg No from 40 to 41
Minimum Investment Amount : ` 5,000/- and any amount thereafter
Option Available : Growth, Dividend - (Payout, Reinvestment and Sweep)
Exit Load: 1.50% if redeemed before 18 months from the date of allotment.
FUND FEATURES FUND FEATURES
IDFC Asset Allocation Fund - Moderate Plan
Nature: An Open - Ended Fund of Fund Scheme
Monthly Avg AUM: ` 38.00 Crores
Month end AUM: ` 38.50 Crores
Inception Date: 11 February 2010
Fund Manager: Mr. Bhavin Patadia (w.e.f. 29th May 2017)
Expense Ratio
Regular 1.23% Direct 0.74%
Benchmark: Crisil MIP Blended Index
SIP (Minimum Amount) : `1,000/-
SIP Frequency : Monthly
SIP Dates (Monthly) Any day of the month, except 29th, 30th & 31st day of the month
Investment Objective: Refer Pg No from 40 to 41
Minimum Investment Amount : ` 5,000/- and any amount thereafter
Option Available : Growth, Dividend - (Payout, Reinvestment and Sweep)
Exit Load: 1.50% if redeemed before 18 months from the date of allotment.
IDFC Asset Allocation Fund - Aggressive Plan
Nature: An Open - Ended Fund of Fund Scheme
Monthly Avg AUM: ` 20.29 Crores
Month end AUM: ` 20.41 Crores
Inception Date: 11 February 2010
Fund Manager: Mr. Bhavin Patadia (w.e.f. 29th May 2017)
Expense Ratio
Regular 1.43% Direct 0.90%
Benchmark: Crisil Balanced Fund – Aggressive Index
SIP (Minimum Amount) : `1,000/-
SIP Frequency : Monthly
SIP Dates (Monthly) Any day of the month, except 29th, 30th & 31st day of the month
Investment Objective: Refer Pg No from 40 to 41
Minimum Investment Amount : ` 5,000/- and any amount thereafter
Option Available : Growth, Dividend - (Payout, Reinvestment and Sweep)
Exit Load: 1.50% if redeemed before 18 months from the date of allotment.
NAV (`)
Regular Plan Growth 21.0452Regular Plan Dividend 16.0046Direct Plan Growth 21.3995Direct Plan Dividend 16.0705
NAV (`)
Regular Plan Growth 21.9971Regular Plan Dividend 16.7722Direct Plan Growth 22.3707Direct Plan Dividend 18.4310
Riskometer
Investors understand that their principal will be at Moderately High risk
This product is suitable for investors who are seeking*:
Capital appreciation and provide regular income •over a long period of time.
Investment in different mutual fund schemes •primarily local funds based on a defined asset allocation model.
*Investors should consult their financial advisers if in doubt about whether the product is suitable for them.
Riskometer
Investors understand that their principal will be at Moderate risk
This product is suitable for investors who are seeking*:
Capital appreciation and provide regular income •over a long period of time.
Investment in different mutual fund schemes •primarily local funds based on a defined asset allocation model.
*Investors should consult their financial advisers if in doubt about whether the product is suitable for them.
Riskometer
Investors understand that their principal will be at Moderately High risk
This product is suitable for investors who are seeking*:
Capital appreciation and provide regular income •over a long period of time.
Investment in different mutual fund schemes •primarily local funds based on a defined asset allocation model
*Investors should consult their financial advisers if in doubt about whether the product is suitable for them.
PORTFOLIO
Name ConservativePlan
ModeratePlan
AggressivePlan
CBLO - 1.04% -
Clearing Corporation of India - 1.04% -
Gold - 5.01% 10.03%
Reliance ETF Gold BeES - 5.01% 10.03%
Debt 84.67% 63.83% 39.08%
IDFC Ultra Short Term Fund 42.18% 22.09% 7.25%
IDFC Super Saver Income Fund - Short Term 21.22% 21.06% 15.80%
HDFC Gilt Fund - Short Term Plan 7.11% 6.89% 5.35%
SBI Magnum Gilt Fund - Short Term Plan 7.08% 6.86% 5.33%
ICICI Prudential Short Term Gilt Fund 7.08% 6.93% 5.36%
Equity 15.08% 30.05% 49.72%
IDFC Classic Equity Fund 2.66% 4.27% 7.19%
IDFC Sterling Equity Fund - 1.64% 2.74%
Reliance Growth Fund 2.63% 4.13% 7.13%
HDFC Capital Builder Fund 2.58% 4.10% 7.02%
HDFC Top 200 Fund 2.58% 5.08% 8.53%
Birla Sun Life Top 100 Fund 2.60% 5.12% 8.64%
IDFC Nifty ETF 2.03% 4.21% 5.89%
Kotak Emerging Equity Scheme - 1.50% 2.58%
Net Current Asset 0.25% 0.07% 1.18%
Grand Total 100.00% 100.00% 100.00%
PORTFOLIO FUND FEATURES
Standard Allocation % to net assets
Standard MatrixConservative
Plan
Moderate
Plan
Aggressive
Plan
Equity (Including Offshore
Equity) Fund10-15% 25-30% 45-50%
Debt Fund(Including Liquid
funds)0-90% 0-70% 0-45%
Alternate (Including Gold/
Commodity Equity Funds)0% 5-10% 10-15%
Money Market Securities 0-15% 0-15% 0-15%
(w.e.f. 07 Dec, 2011)
FUND FEATURES
Standard Allocation % to net assets
Standard MatrixConservative
Plan
Moderate
Plan
Aggressive
Plan
Equity (Including Offshore
Equity) Fund10-15% 25-30% 45-50%
Debt Fund(Including Liquid
funds)0-90% 0-70% 0-45%
Alternate (Including Gold/
Commodity Equity Funds)0% 5-10% 10-15%
Money Market Securities 0-15% 0-15% 0-15%
(w.e.f. 07 Dec, 2011)
19
Performance Table
Scheme Name CAGR Returns (%) Current Value of Investment of ` 10,000
1 Year 3 Years 5 Years Since Inception 1 Year 3 Years 5 Years Since Inception
IDFC Asset Allocation Fund - CP - Regular Plan - Growth* 10.72% 10.42% 10.67% 9.35% 11,078 13,466 16,603 19,500
CRISIL MIP Blended Index# 11.00% 10.87% 10.40% 9.10% 11,106 13,634 16,404 19,172
CRISIL 10 Year Gilt Index## 9.83% 11.15% 8.60% 7.33% 10,989 13,734 15,110 16,961
IDFC Asset Allocation Fund - CP - Direct Plan - Growth$ 11.27% 10.98% NA 11.04% 11,134 13,674 NA 15,742
CRISIL MIP Blended Index# 11.00% 10.87% NA 10.43% 11,106 13,634 NA 15,368
CRISIL 10 Year Gilt Index## 9.83% 11.15% NA 8.24% 10,989 13,734 NA 14,090
*Since Inception Regular Plan - Growth Feb 11, 2010. $Since Inception Direct Plan - Growth Apr 02, 2013.
Performance Table
Scheme Name CAGR Returns (%) Current Value of Investment of ` 10,000
1 Year 3 Years 5 Years Since Inception 1 Year 3 Years 5 Years Since Inception
IDFC Asset Allocation Fund - MP - Regular Plan - Growth* 11.49% 11.26% 11.77% 10.47% 11,156 13,776 17,452 21,045
CRISIL MIP Blended Index# 11.00% 10.87% 10.40% 9.10% 11,106 13,634 16,404 19,172
CRISIL 10 Year Gilt Index## 9.83% 11.15% 8.60% 7.33% 10,989 13,734 15,110 16,961
IDFC Asset Allocation Fund - MP - Direct Plan - Growth$ 12.04% 11.82% NA 11.94% 11,211 13,986 NA 16,478
CRISIL MIP Blended Index# 11.00% 10.87% NA 10.30% 11,106 13,634 NA 15,436
CRISIL 10 Year Gilt Index## 9.83% 11.15% NA 7.97% 10,989 13,734 NA 14,042
*Since Inception Regular Plan - Growth Feb 11, 2010. $Since Inception Direct Plan - Growth Feb 26, 2013.
Performance Table
Scheme Name CAGR Returns (%) Current Value of Investment of ` 10,000
1 Year 3 Years 5 Years Since Inception 1 Year 3 Years 5 Years Since Inception
IDFC Asset Allocation Fund - AP - Regular Plan - Growth* 13.33% 12.01% 12.97% 11.13% 11,341 14,058 18,404 21,997
CRISIL Balanced Fund – Aggressive Index# 14.36% 10.11% 12.71% 10.07% 11,445 13,355 18,193 20,484
CRISIL 10 Year Gilt Index## 9.83% 11.15% 8.60% 7.33% 10,989 13,734 15,110 16,961
IDFC Asset Allocation Fund - AP - Direct Plan - Growth$ 13.94% 12.60% NA 12.09% 11,402 14,279 NA 16,867
CRISIL Balanced Fund – Aggressive Index# 14.36% 10.11% NA 11.52% 11,445 13,355 NA 16,481
CRISIL 10 Year Gilt Index## 9.83% 11.15% NA 8.24% 10,989 13,734 NA 14,374
The fund is being managed by Mr. Bhavin Patadia (w.e.f. 29th May 2017). Performance based on NAV as on 31/07/2017. Past performance may or may not be sustained in future.Regular and Direct Plans have different expense structure. Direct Plan shall have a lower expense ratio excluding distribution expenses, commission expenses etc.For other funds managed by the fund manager, please refer page no. 33 - 35 & the respective fund pages. #Benchmark Returns. ##Alternate Benchmark Returns.*Since Inception Regular Plan - Growth Feb 11, 2010. $Since Inception Direct Plan - Growth Jan 01, 2013.
IDFC Asset Allocation Fund of FundsAn Open Ended Fund of Fund Scheme
31st July 2017
IDFC All Season Bond FundAn Open Ended Fund of Fund Scheme
31st July 2017
FUND FEATURES
About the Fund: All Seasons Bond Fund is a Fund of Fund (FOF) structure which can invest in one or more funds within our basket of short term offerings currently. The portfolio gives the fund manager the flexibility to play between debt and money market, benefiting from the accrual available in its space and optimizing the portfolio yields.
Nature: Fund of Fund | Monthly Avg AUM: ` 173.94 Crores | Month end AUM: ` 174.64 Crores
Inception Date: 13 September 2004 | Fund Manager: Mr. Harshal Joshi (w.e.f 15th July 2016)
Other Parameter Asset Quality Expense Ratio
Standard Deviation (Annualized) 1.51% AAA Equivalent 94.41% Regular 0.72%
Modified Duration 2.57 years AA+ 3.89% Direct 0.28%
Average Maturity 3.22 years AA 1.69%
Yield to Maturity 7.09%
Benchmark: CRISIL Short Term Bond Fund Index (w.e.f. 30th November 2015) | SIP (Minimum Amount): ` 1,000/- | SIP Frequency: Monthly
SIP Dates (Monthly): Any day of the month, except 29th, 30th & 31st day of the month | Investment Objective: Refer Pg No from 41 to 42
Minimum Investment Amount: ` 5,000/- and any amount thereafter | Option Available: Growth, Dividend - Daily, Weekly, Fortnightly, Quarterly, Half Yearly, Annual & Periodic
Exit Load: 0.50% if redeemed or switched before 3 months (w.e.f. 09th October 2013)
NAV (`)
Plan Option Freq NAVRegular Plan Growth - 26.1183Regular Plan Dividend Quarterly 12.4551Regular Plan Dividend Half Yearly 11.9983Regular Plan Dividend Annual 11.7978Regular Plan Dividend Fortnightly 11.0314Regular Plan Dividend Daily NARegular Plan Dividend Weekly 11.0022Regular Plan Dividend Periodic 12.9139Direct Plan Growth - 26.6512Direct Plan Dividend Daily 11.0212Direct Plan Dividend Quarterly 12.5976Direct Plan Dividend Fortnightly 11.0324Direct Plan Dividend Periodic 12.9407
PORTFOLIO
Name % of NAV
Mutual Fund Units 99.99%
IDFC Money Manager Fund – Investment Plan 58.24%
IDFC Government Securities Fund – Short Term Plan 41.76%
Net Cash and Cash Equivalent 0.01%
Grand Total 100.00%
Riskometer
Investors understand that their principal will be at Moderately Low Risk
This product is suitable for investors who are seeking*:
To generate short term optimal returns •with high liquidity.Investment predominantly in debt •oriented mutual fund schemes and money market instruments
*Investors should consult their financial advisers if in doubt about whether the product is suitable for them.
Performance TableScheme Name CAGR Returns (%) Current Value of Investment of ` 10,000
1 Year 3 Years 5 Years Since Inception 1 Year 3 Years 5 Years Since InceptionIDFC All Seasons Bond Fund - Regular Plan - Growth* 8.16% 8.92% 8.81% 7.73% 10,821 12,925 15,254 26,118CRISIL Short Term Bond Fund Index# 8.37% 9.14% 9.08% 7.64% 10,842 13,004 15,444 25,822CRISIL 1 Year T-Bill## 6.42% 7.54% 7.32% 6.09% 10,646 12,441 14,240 21,411IDFC All Seasons Bond Fund - Direct Plan - Growth$ 8.64% 9.40% NA 9.38% 10,869 13,096 NA 14,889CRISIL Short Term Bond Fund Index# 8.37% 9.14% NA 9.15% 10,842 13,004 NA 14,750CRISIL 1 Year T-Bill## 6.42% 7.54% NA 7.23% 10,646 12,441 NA 13,633
The fund is being managed by Mr. Harshal Joshi (w.e.f 15th July 2016). Performance based on NAV as on 31/07/2017. Past performance may or may not be sustained in future.Regular and Direct Plans have different expense structure. Direct Plan shall have a lower expense ratio excluding distribution expenses, commission expenses etc.For other funds managed by the fund manager, please refer page no. 33 - 35 & the respective fund pages. #Benchmark Returns. ##Alternate Benchmark Returns. *Since Inception Regular Plan - Growth Sep 13, 2004. $Since Inception Direct Plan - Growth Feb 22, 2013.
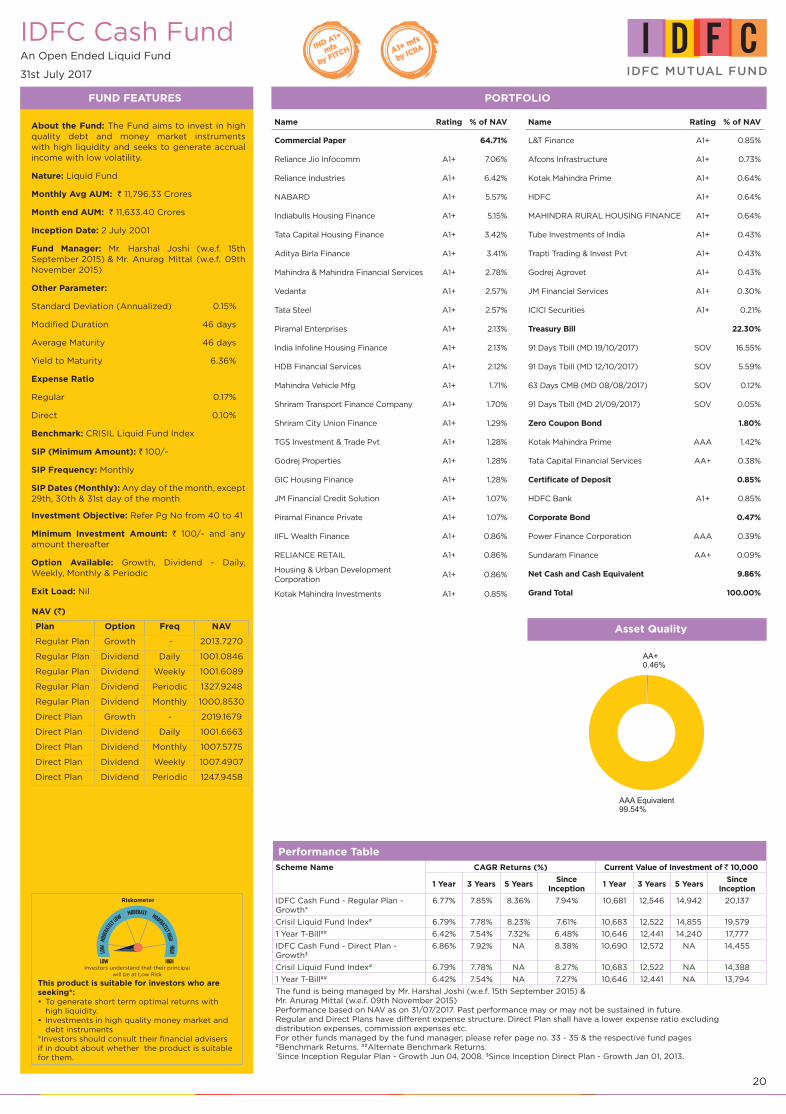
20
IDFC Cash FundAn Open Ended Liquid Fund
31st July 2017
FUND FEATURES PORTFOLIO
About the Fund: The Fund aims to invest in high quality debt and money market instruments with high liquidity and seeks to generate accrual income with low volatility.
Nature: Liquid Fund
Monthly Avg AUM: ` 11,796.33 Crores
Month end AUM: ` 11,633.40 Crores
Inception Date: 2 July 2001
Fund Manager: Mr. Harshal Joshi (w.e.f. 15th September 2015) & Mr. Anurag Mittal (w.e.f. 09th November 2015)
Other Parameter:
Standard Deviation (Annualized) 0.15%
Modified Duration 46 days
Average Maturity 46 days
Yield to Maturity 6.36%
Expense Ratio
Regular 0.17%
Direct 0.10%
Benchmark: CRISIL Liquid Fund Index
SIP (Minimum Amount): ` 100/-
SIP Frequency: Monthly
SIP Dates (Monthly): Any day of the month, except 29th, 30th & 31st day of the month
Investment Objective: Refer Pg No from 40 to 41
Minimum Investment Amount: ` 100/- and any amount thereafter
Option Available: Growth, Dividend - Daily, Weekly, Monthly & Periodic
Exit Load: Nil
NAV (`)
Plan Option Freq NAV
Regular Plan Growth - 2013.7270
Regular Plan Dividend Daily 1001.0846
Regular Plan Dividend Weekly 1001.6089
Regular Plan Dividend Periodic 1327.9248
Regular Plan Dividend Monthly 1000.8530
Direct Plan Growth - 2019.1679
Direct Plan Dividend Daily 1001.6663
Direct Plan Dividend Monthly 1007.5775
Direct Plan Dividend Weekly 1007.4907
Direct Plan Dividend Periodic 1247.9458
Name Rating % of NAV
Commercial Paper 64.71%
Reliance Jio Infocomm A1+ 7.06%
Reliance Industries A1+ 6.42%
NABARD A1+ 5.57%
Indiabulls Housing Finance A1+ 5.15%
Tata Capital Housing Finance A1+ 3.42%
Aditya Birla Finance A1+ 3.41%
Mahindra & Mahindra Financial Services A1+ 2.78%
Vedanta A1+ 2.57%
Tata Steel A1+ 2.57%
Piramal Enterprises A1+ 2.13%
India Infoline Housing Finance A1+ 2.13%
HDB Financial Services A1+ 2.12%
Mahindra Vehicle Mfg A1+ 1.71%
Shriram Transport Finance Company A1+ 1.70%
Shriram City Union Finance A1+ 1.29%
TGS Investment & Trade Pvt A1+ 1.28%
Godrej Properties A1+ 1.28%
GIC Housing Finance A1+ 1.28%
JM Financial Credit Solution A1+ 1.07%
Piramal Finance Private A1+ 1.07%
IIFL Wealth Finance A1+ 0.86%
RELIANCE RETAIL A1+ 0.86%
Housing & Urban Development Corporation
A1+ 0.86%
Kotak Mahindra Investments A1+ 0.85%
Performance TableScheme Name CAGR Returns (%) Current Value of Investment of ` 10,000
1 Year 3 Years 5 YearsSince
Inception1 Year 3 Years 5 Years
SinceInception
IDFC Cash Fund - Regular Plan - Growth*
6.77% 7.85% 8.36% 7.94% 10,681 12,546 14,942 20,137
Crisil Liquid Fund Index# 6.79% 7.78% 8.23% 7.61% 10,683 12,522 14,855 19,579
1 Year T-Bill## 6.42% 7.54% 7.32% 6.48% 10,646 12,441 14,240 17,777
IDFC Cash Fund - Direct Plan - Growth$
6.86% 7.92% NA 8.38% 10,690 12,572 NA 14,455
Crisil Liquid Fund Index# 6.79% 7.78% NA 8.27% 10,683 12,522 NA 14,388
1 Year T-Bill## 6.42% 7.54% NA 7.27% 10,646 12,441 NA 13,794
The fund is being managed by Mr. Harshal Joshi (w.e.f. 15th September 2015) & Mr. Anurag Mittal (w.e.f. 09th November 2015)Performance based on NAV as on 31/07/2017. Past performance may or may not be sustained in future.Regular and Direct Plans have different expense structure. Direct Plan shall have a lower expense ratio excluding distribution expenses, commission expenses etc.For other funds managed by the fund manager, please refer page no. 33 - 35 & the respective fund pages#Benchmark Returns. ##Alternate Benchmark Returns. *Since Inception Regular Plan - Growth Jun 04, 2008. $Since Inception Direct Plan - Growth Jan 01, 2013.
Riskometer
Investors understand that their principal will be at Low Risk
This product is suitable for investors who are seeking*:
To generate short term optimal returns with •high liquidity.Investments in high quality money market and •debt instruments
*Investors should consult their financial advisers if in doubt about whether the product is suitable for them.
Name Rating % of NAV
L&T Finance A1+ 0.85%
Afcons Infrastructure A1+ 0.73%
Kotak Mahindra Prime A1+ 0.64%
HDFC A1+ 0.64%
MAHINDRA RURAL HOUSING FINANCE A1+ 0.64%
Tube Investments of India A1+ 0.43%
Trapti Trading & Invest Pvt A1+ 0.43%
Godrej Agrovet A1+ 0.43%
JM Financial Services A1+ 0.30%
ICICI Securities A1+ 0.21%
Treasury Bill 22.30%
91 Days Tbill (MD 19/10/2017) SOV 16.55%
91 Days Tbill (MD 12/10/2017) SOV 5.59%
63 Days CMB (MD 08/08/2017) SOV 0.12%
91 Days Tbill (MD 21/09/2017) SOV 0.05%
Zero Coupon Bond 1.80%
Kotak Mahindra Prime AAA 1.42%
Tata Capital Financial Services AA+ 0.38%
Certificate of Deposit 0.85%
HDFC Bank A1+ 0.85%
Corporate Bond 0.47%
Power Finance Corporation AAA 0.39%
Sundaram Finance AA+ 0.09%
Net Cash and Cash Equivalent 9.86%
Grand Total 100.00%
Maturity Bucket Asset Quality
AA+0.46%
AAA Equivalent99.54%
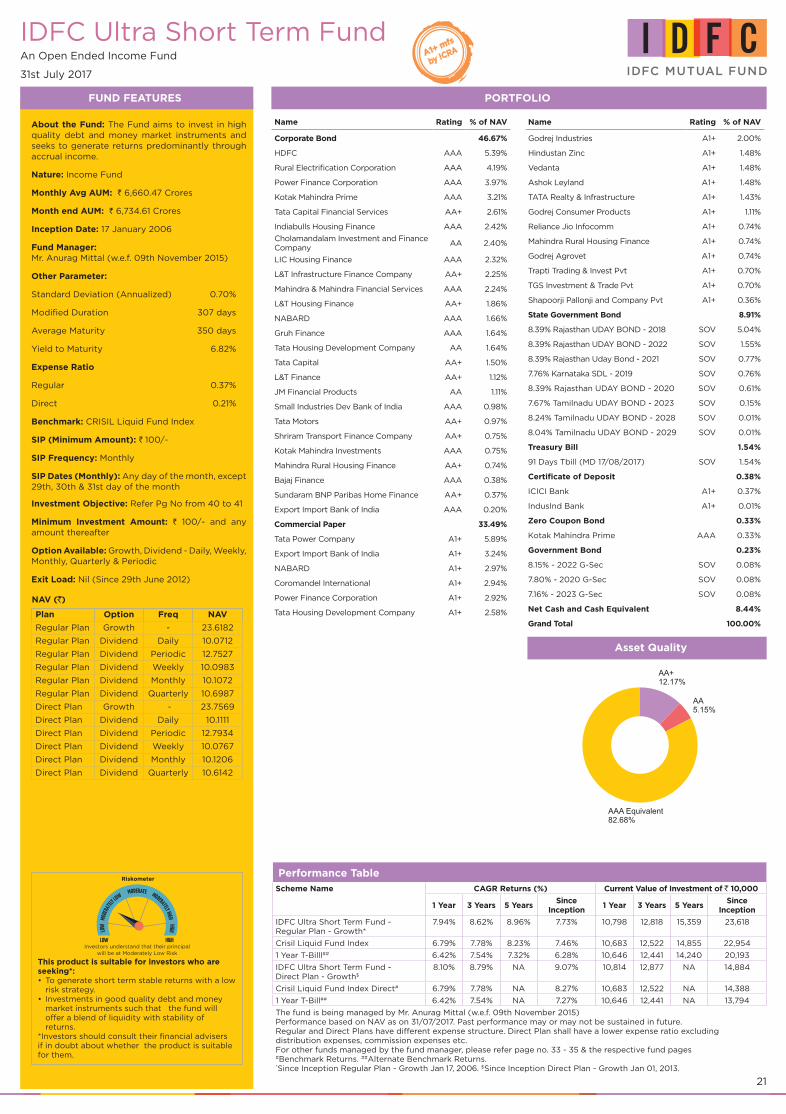
21
IDFC Ultra Short Term FundAn Open Ended Income Fund
31st July 2017
FUND FEATURES PORTFOLIO
About the Fund: The Fund aims to invest in high quality debt and money market instruments and seeks to generate returns predominantly through accrual income.
Nature: Income Fund
Monthly Avg AUM: ` 6,660.47 Crores
Month end AUM: ` 6,734.61 Crores
Inception Date: 17 January 2006
Fund Manager: Mr. Anurag Mittal (w.e.f. 09th November 2015)
Other Parameter:
Standard Deviation (Annualized) 0.70%
Modified Duration 307 days
Average Maturity 350 days
Yield to Maturity 6.82%
Expense Ratio
Regular 0.37%
Direct 0.21%
Benchmark: CRISIL Liquid Fund Index
SIP (Minimum Amount): ` 100/-
SIP Frequency: Monthly
SIP Dates (Monthly): Any day of the month, except 29th, 30th & 31st day of the month
Investment Objective: Refer Pg No from 40 to 41
Minimum Investment Amount: ` 100/- and any amount thereafter
Option Available: Growth, Dividend - Daily, Weekly, Monthly, Quarterly & Periodic
Exit Load: Nil (Since 29th June 2012)
NAV (`)
Plan Option Freq NAV
Regular Plan Growth - 23.6182
Regular Plan Dividend Daily 10.0712
Regular Plan Dividend Periodic 12.7527
Regular Plan Dividend Weekly 10.0983
Regular Plan Dividend Monthly 10.1072
Regular Plan Dividend Quarterly 10.6987
Direct Plan Growth - 23.7569
Direct Plan Dividend Daily 10.1111
Direct Plan Dividend Periodic 12.7934
Direct Plan Dividend Weekly 10.0767
Direct Plan Dividend Monthly 10.1206
Direct Plan Dividend Quarterly 10.6142
Name Rating % of NAV
Corporate Bond 46.67%
HDFC AAA 5.39%
Rural Electrification Corporation AAA 4.19%
Power Finance Corporation AAA 3.97%
Kotak Mahindra Prime AAA 3.21%
Tata Capital Financial Services AA+ 2.61%
Indiabulls Housing Finance AAA 2.42%
Cholamandalam Investment and Finance Company
AA 2.40%
LIC Housing Finance AAA 2.32%
L&T Infrastructure Finance Company AA+ 2.25%
Mahindra & Mahindra Financial Services AAA 2.24%
L&T Housing Finance AA+ 1.86%
NABARD AAA 1.66%
Gruh Finance AAA 1.64%
Tata Housing Development Company AA 1.64%
Tata Capital AA+ 1.50%
L&T Finance AA+ 1.12%
JM Financial Products AA 1.11%
Small Industries Dev Bank of India AAA 0.98%
Tata Motors AA+ 0.97%
Shriram Transport Finance Company AA+ 0.75%
Kotak Mahindra Investments AAA 0.75%
Mahindra Rural Housing Finance AA+ 0.74%
Bajaj Finance AAA 0.38%
Sundaram BNP Paribas Home Finance AA+ 0.37%
Export Import Bank of India AAA 0.20%
Commercial Paper 33.49%
Tata Power Company A1+ 5.89%
Export Import Bank of India A1+ 3.24%
NABARD A1+ 2.97%
Coromandel International A1+ 2.94%
Power Finance Corporation A1+ 2.92%
Tata Housing Development Company A1+ 2.58%
Performance TableScheme Name CAGR Returns (%) Current Value of Investment of ` 10,000
1 Year 3 Years 5 YearsSince
Inception1 Year 3 Years 5 Years
SinceInception
IDFC Ultra Short Term Fund - Regular Plan - Growth*
7.94% 8.62% 8.96% 7.73% 10,798 12,818 15,359 23,618
Crisil Liquid Fund Index 6.79% 7.78% 8.23% 7.46% 10,683 12,522 14,855 22,954
1 Year T-Billl## 6.42% 7.54% 7.32% 6.28% 10,646 12,441 14,240 20,193
IDFC Ultra Short Term Fund - Direct Plan - Growth$
8.10% 8.79% NA 9.07% 10,814 12,877 NA 14,884
Crisil Liquid Fund Index Direct# 6.79% 7.78% NA 8.27% 10,683 12,522 NA 14,388
1 Year T-Bill## 6.42% 7.54% NA 7.27% 10,646 12,441 NA 13,794
The fund is being managed by Mr. Anurag Mittal (w.e.f. 09th November 2015)Performance based on NAV as on 31/07/2017. Past performance may or may not be sustained in future.Regular and Direct Plans have different expense structure. Direct Plan shall have a lower expense ratio excluding distribution expenses, commission expenses etc.For other funds managed by the fund manager, please refer page no. 33 - 35 & the respective fund pages#Benchmark Returns. ##Alternate Benchmark Returns. *Since Inception Regular Plan - Growth Jan 17, 2006. $Since Inception Direct Plan - Growth Jan 01, 2013.
Riskometer
Investors understand that their principal will be at Moderately Low Risk
This product is suitable for investors who are seeking*:
To generate short term stable returns with a low •risk strategy.Investments in good quality debt and money •market instruments such that the fund will offer a blend of liquidity with stability of returns.
*Investors should consult their financial advisers if in doubt about whether the product is suitable for them.
Name Rating % of NAV
Godrej Industries A1+ 2.00%
Hindustan Zinc A1+ 1.48%
Vedanta A1+ 1.48%
Ashok Leyland A1+ 1.48%
TATA Realty & Infrastructure A1+ 1.43%
Godrej Consumer Products A1+ 1.11%
Reliance Jio Infocomm A1+ 0.74%
Mahindra Rural Housing Finance A1+ 0.74%
Godrej Agrovet A1+ 0.74%
Trapti Trading & Invest Pvt A1+ 0.70%
TGS Investment & Trade Pvt A1+ 0.70%
Shapoorji Pallonji and Company Pvt A1+ 0.36%
State Government Bond 8.91%
8.39% Rajasthan UDAY BOND - 2018 SOV 5.04%
8.39% Rajasthan UDAY BOND - 2022 SOV 1.55%
8.39% Rajasthan Uday Bond - 2021 SOV 0.77%
7.76% Karnataka SDL - 2019 SOV 0.76%
8.39% Rajasthan UDAY BOND - 2020 SOV 0.61%
7.67% Tamilnadu UDAY BOND - 2023 SOV 0.15%
8.24% Tamilnadu UDAY BOND - 2028 SOV 0.01%
8.04% Tamilnadu UDAY BOND - 2029 SOV 0.01%
Treasury Bill 1.54%
91 Days Tbill (MD 17/08/2017) SOV 1.54%
Certificate of Deposit 0.38%
ICICI Bank A1+ 0.37%
IndusInd Bank A1+ 0.01%
Zero Coupon Bond 0.33%
Kotak Mahindra Prime AAA 0.33%
Government Bond 0.23%
8.15% - 2022 G-Sec SOV 0.08%
7.80% - 2020 G-Sec SOV 0.08%
7.16% - 2023 G-Sec SOV 0.08%
Net Cash and Cash Equivalent 8.44%
Grand Total 100.00%
Maturity Bucket Asset Quality
AA+12.17%
AA5.15%
AAA Equivalent82.68%

22
IDFC Money Manager Fund – Treasury PlanAn Open Ended Income Fund
31st July 2017
FUND FEATURES PORTFOLIO
About the Fund: The Fund aims to invest only in short maturity, highly rated debt and money market instruments and seeks to generate returns predominantly through accrual income.
Nature: Debt
Monthly Avg AUM: ` 2,062.77 Crores
Month end AUM: ` 2,121.44 Crores
Inception Date: 18 February 2003
Fund Manager: Mr. Anurag Mittal & Harshal Joshi (w.e.f. 15th May 2017)
Other Parameter:
Standard Deviation (Annualized) 0.81%
Modified Duration 379 days
Average Maturity 453 days
Yield to Maturity 6.90%
Expense Ratio
Regular 1.06%
Direct 0.50%
Benchmark: CRISIL Liquid Fund Index (w.e.f 23rd July, 2015)
SIP (Minimum Amount): ` 100/-
SIP Frequency: Monthly
SIP Dates (Monthly): Any day of the month, except 29th, 30th & 31st day of the month
Investment Objective: Refer Pg No from 40 to 41
Minimum Investment Amount: ` 100/- and any amount thereafter
Option Available: Growth, Dividend - Daily, Weekly, Monthly & Periodic
Exit Load: Nil
NAV (`)
Plan Option Freq NAV
Regular Plan Growth - 26.1036
Regular Plan Dividend Monthly 10.2546
Regular Plan Dividend Daily 10.0994
Regular Plan Dividend Weekly 10.1245
Regular Plan Dividend Periodic 12.5438
Direct Plan Growth - 26.8496
Direct Plan Dividend Monthly 10.1909
Direct Plan Dividend Daily 10.0994
Direct Plan Dividend Weekly 10.1023
Direct Plan Dividend Periodic 12.5582
Name Rating % of NAV
Corporate Bond 41.62%
HDFC AAA 5.74%
LIC Housing Finance AAA 5.00%
JM Financial Products AA 4.73%
Kotak Mahindra Prime AAA 3.55%
Tata Capital Financial Services AA+ 3.55%
*Welspun Renewables Energy Private AA(SO) 2.79%
Power Finance Corporation AAA 2.63%
HDB Financial Services AAA 2.44%
L&T Finance AA+ 2.36%
Shriram Transport Finance Company AA+ 2.36%
Sundaram BNP Paribas Home Finance AA+ 1.66%
Export Import Bank of India AAA 1.19%
L&T Infrastructure Finance Company AA+ 1.19%
Power Grid Corporation of India AAA 0.74%
Tata Housing Development Company AA 0.71%
NABARD AAA 0.71%
NHPC AAA 0.24%
Tata Capital Housing Finance AA+ 0.03%
Commercial Paper 21.64%
CESC A1+ 4.70%
ICICI Securities A1+ 3.50%
Shapoorji Pallonji and Company Pvt A1+ 2.99%
Hindustan Zinc A1+ 2.36%
Performance TableScheme Name CAGR Returns (%) Current Value of Investment of ` 10,000
1 Year 3 Years 5 YearsSince
Inception1 Year 3 Years 5 Years
SinceInception
IDFC Money Manager Fund - Treasury Plan - Regular Plan - Growth*
7.18% 8.00% 8.17% 6.86% 10,722 12,601 14,810 26,104
Crisil Liquid Fund Index# 6.79% 7.78% 8.23% 6.84% 10,683 12,522 14,855 26,031
1 Year T-Bill## 6.42% 7.54% 7.32% 5.95% 10,646 12,441 14,240 23,064
IDFC Money Manager Fund - Treasury Plan - Direct Plan - Growth$
7.79% 8.65% NA 8.88% 10,783 12,828 NA 14,764
Crisil Liquid Fund Index# 6.79% 7.78% NA 8.27% 10,683 12,522 NA 14,388
1 Year T-Bill## 6.42% 7.54% NA 7.27% 10,646 12,441 NA 13,794
The fund is being managed by Mr. Anurag Mittal & Harshal Joshi (w.e.f. 15th May 2017) Performance based on NAV as on 31/07/2017. Past performance may or may not be sustained in future.Regular and Direct Plans have different expense structure. Direct Plan shall have a lower expense ratio excluding distribution expenses, commission expenses etc.For other funds managed by the fund manager, please refer page no. 33 - 35 & the respective fund pages#Benchmark Returns. ##Alternate Benchmark Returns.*Since Inception Regular Plan - Growth Feb 18, 2003. $Since Inception Direct Plan - Growth Jan 01, 2013.
Riskometer
Investors understand that their principal will be at Moderately Low Risk
This product is suitable for investors who are seeking*:
To generate short term stable returns with a low •risk strategy.Investments in good quality debt and money •market instruments such that the fund will offer a blend of liquidity with stability of returns
*Investors should consult their financial advisers if in doubt about whether the product is suitable for them.
Name Rating % of NAV
NABARD A1+ 2.35%
Export Import Bank of India A1+ 2.30%
Tata Housing Development Company A1+ 1.17%
Afcons Infrastructure A1+ 1.15%
Power Finance Corporation A1+ 1.12%
State Government Bond 14.58%
8.39% Rajasthan UDAY BOND - 2018 SOV 5.48%
8.39% Rajasthan UDAY BOND - 2022 SOV 2.47%
8.60% Tamil Nadu SDL - 2023 SOV 1.76%
8.62% Tamil Nadu SDL - 2023 SOV 1.26%
8.21% Haryana UDAY BOND - 2022 SOV 1.23%
8.39% Rajasthan UDAY BOND - 2019 SOV 1.21%
7.38% Maharashtra Uday BOND - 2022 SOV 1.19%
Certificate of Deposit 7.99%
ICICI Bank A1+ 7.99%
Treasury Bill 4.70%
77 Days CMB - 2017 SOV 4.70%
Government Bond 0.73%
7.35% - 2024 G-Sec SOV 0.73%
Zero Coupon Bond 0.04%
Aditya Birla Finance AA+ 0.04%
Net Cash and Cash Equivalent 8.70%
Grand Total 100.00%
Maturity Bucket Asset Quality
AA+11.19%
AA8.23%
AAA Equivalent80.58%
*Corporate Guarantee from Tata Power
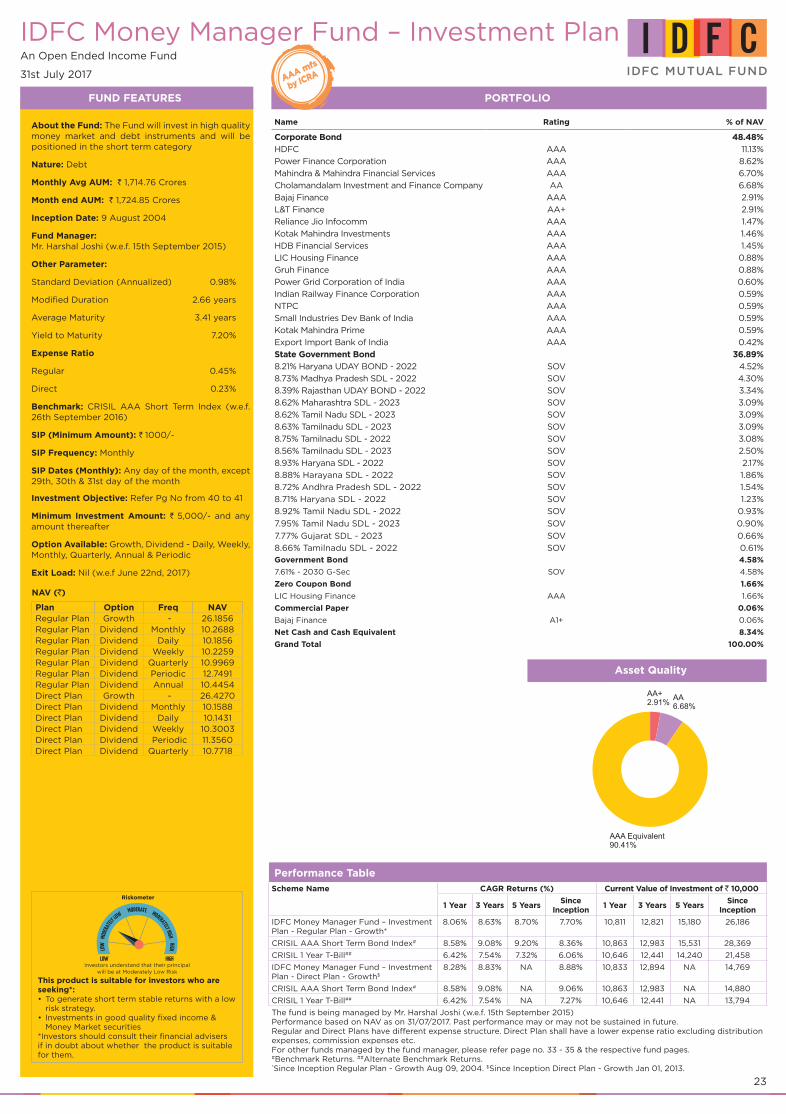
23
IDFC Money Manager Fund – Investment PlanAn Open Ended Income Fund
31st July 2017
FUND FEATURES PORTFOLIO
About the Fund: The Fund will invest in high quality money market and debt instruments and will be positioned in the short term category
Nature: Debt
Monthly Avg AUM: ` 1,714.76 Crores
Month end AUM: ` 1,724.85 Crores
Inception Date: 9 August 2004
Fund Manager: Mr. Harshal Joshi (w.e.f. 15th September 2015)
Other Parameter:
Standard Deviation (Annualized) 0.98%
Modified Duration 2.66 years
Average Maturity 3.41 years
Yield to Maturity 7.20%
Expense Ratio
Regular 0.45%
Direct 0.23%
Benchmark: CRISIL AAA Short Term Index (w.e.f. 26th September 2016)
SIP (Minimum Amount): ` 1000/-
SIP Frequency: Monthly
SIP Dates (Monthly): Any day of the month, except 29th, 30th & 31st day of the month
Investment Objective: Refer Pg No from 40 to 41
Minimum Investment Amount: ` 5,000/- and any amount thereafter
Option Available: Growth, Dividend - Daily, Weekly, Monthly, Quarterly, Annual & Periodic
Exit Load: Nil (w.e.f June 22nd, 2017)
NAV (`)
Plan Option Freq NAVRegular Plan Growth - 26.1856Regular Plan Dividend Monthly 10.2688Regular Plan Dividend Daily 10.1856Regular Plan Dividend Weekly 10.2259Regular Plan Dividend Quarterly 10.9969Regular Plan Dividend Periodic 12.7491Regular Plan Dividend Annual 10.4454Direct Plan Growth - 26.4270Direct Plan Dividend Monthly 10.1588Direct Plan Dividend Daily 10.1431Direct Plan Dividend Weekly 10.3003Direct Plan Dividend Periodic 11.3560Direct Plan Dividend Quarterly 10.7718
Name Rating % of NAV
Corporate Bond 48.48%
HDFC AAA 11.13%
Power Finance Corporation AAA 8.62%
Mahindra & Mahindra Financial Services AAA 6.70%
Cholamandalam Investment and Finance Company AA 6.68%
Bajaj Finance AAA 2.91%
L&T Finance AA+ 2.91%
Reliance Jio Infocomm AAA 1.47%
Kotak Mahindra Investments AAA 1.46%
HDB Financial Services AAA 1.45%
LIC Housing Finance AAA 0.88%
Gruh Finance AAA 0.88%
Power Grid Corporation of India AAA 0.60%
Indian Railway Finance Corporation AAA 0.59%
NTPC AAA 0.59%
Small Industries Dev Bank of India AAA 0.59%
Kotak Mahindra Prime AAA 0.59%
Export Import Bank of India AAA 0.42%
State Government Bond 36.89%
8.21% Haryana UDAY BOND - 2022 SOV 4.52%
8.73% Madhya Pradesh SDL - 2022 SOV 4.30%
8.39% Rajasthan UDAY BOND - 2022 SOV 3.34%
8.62% Maharashtra SDL - 2023 SOV 3.09%
8.62% Tamil Nadu SDL - 2023 SOV 3.09%
8.63% Tamilnadu SDL - 2023 SOV 3.09%
8.75% Tamilnadu SDL - 2022 SOV 3.08%
8.56% Tamilnadu SDL - 2023 SOV 2.50%
8.93% Haryana SDL - 2022 SOV 2.17%
8.88% Harayana SDL - 2022 SOV 1.86%
8.72% Andhra Pradesh SDL - 2022 SOV 1.54%
8.71% Haryana SDL - 2022 SOV 1.23%
8.92% Tamil Nadu SDL - 2022 SOV 0.93%
7.95% Tamil Nadu SDL - 2023 SOV 0.90%
7.77% Gujarat SDL - 2023 SOV 0.66%
8.66% Tamilnadu SDL - 2022 SOV 0.61%
Government Bond 4.58%
7.61% - 2030 G-Sec SOV 4.58%
Zero Coupon Bond 1.66%
LIC Housing Finance AAA 1.66%
Commercial Paper 0.06%
Bajaj Finance A1+ 0.06%
Net Cash and Cash Equivalent 8.34%
Grand Total 100.00%
Performance TableScheme Name CAGR Returns (%) Current Value of Investment of ` 10,000
1 Year 3 Years 5 YearsSince
Inception1 Year 3 Years 5 Years
SinceInception
IDFC Money Manager Fund – Investment Plan - Regular Plan - Growth*
8.06% 8.63% 8.70% 7.70% 10,811 12,821 15,180 26,186
CRISIL AAA Short Term Bond Index# 8.58% 9.08% 9.20% 8.36% 10,863 12,983 15,531 28,369
CRISIL 1 Year T-Bill## 6.42% 7.54% 7.32% 6.06% 10,646 12,441 14,240 21,458
IDFC Money Manager Fund – Investment Plan - Direct Plan - Growth$
8.28% 8.83% NA 8.88% 10,833 12,894 NA 14,769
CRISIL AAA Short Term Bond Index# 8.58% 9.08% NA 9.06% 10,863 12,983 NA 14,880
CRISIL 1 Year T-Bill## 6.42% 7.54% NA 7.27% 10,646 12,441 NA 13,794
The fund is being managed by Mr. Harshal Joshi (w.e.f. 15th September 2015)Performance based on NAV as on 31/07/2017. Past performance may or may not be sustained in future. Regular and Direct Plans have different expense structure. Direct Plan shall have a lower expense ratio excluding distribution expenses, commission expenses etc. For other funds managed by the fund manager, please refer page no. 33 - 35 & the respective fund pages. #Benchmark Returns. ##Alternate Benchmark Returns. *Since Inception Regular Plan - Growth Aug 09, 2004. $Since Inception Direct Plan - Growth Jan 01, 2013.
Riskometer
Investors understand that their principal will be at Moderately Low Risk
This product is suitable for investors who are seeking*:
To generate short term stable returns with a low •risk strategy.Investments in good quality fixed income & •Money Market securities
*Investors should consult their financial advisers if in doubt about whether the product is suitable for them.
Asset Quality
AA+2.91% AA
6.68%
AAA Equivalent90.41%
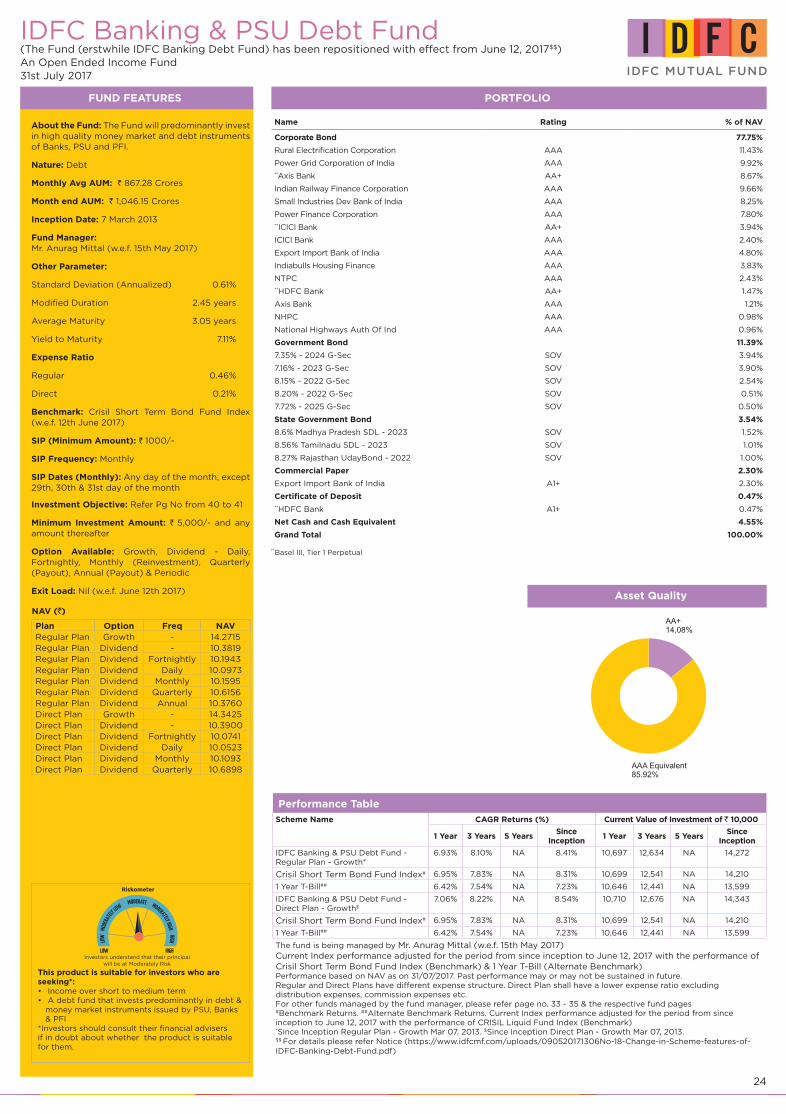
24
IDFC Banking & PSU Debt Fund (The Fund (erstwhile IDFC Banking Debt Fund) has been repositioned with effect from June 12, 2017$$)An Open Ended Income Fund31st July 2017
FUND FEATURES PORTFOLIO
About the Fund: The Fund will predominantly invest in high quality money market and debt instruments of Banks, PSU and PFI.
Nature: Debt
Monthly Avg AUM: ` 867.28 Crores
Month end AUM: ` 1,046.15 Crores
Inception Date: 7 March 2013
Fund Manager: Mr. Anurag Mittal (w.e.f. 15th May 2017)
Other Parameter:
Standard Deviation (Annualized) 0.61%
Modified Duration 2.45 years
Average Maturity 3.05 years
Yield to Maturity 7.11%
Expense Ratio
Regular 0.46%
Direct 0.21%
Benchmark: Crisil Short Term Bond Fund Index (w.e.f. 12th June 2017)
SIP (Minimum Amount): ` 1000/-
SIP Frequency: Monthly
SIP Dates (Monthly): Any day of the month, except 29th, 30th & 31st day of the month
Investment Objective: Refer Pg No from 40 to 41
Minimum Investment Amount: ` 5,000/- and any amount thereafter
Option Available: Growth, Dividend - Daily, Fortnightly, Monthly (Reinvestment), Quarterly (Payout), Annual (Payout) & Periodic
Exit Load: Nil (w.e.f. June 12th 2017)
NAV (`)
Plan Option Freq NAVRegular Plan Growth - 14.2715Regular Plan Dividend - 10.3819Regular Plan Dividend Fortnightly 10.1943Regular Plan Dividend Daily 10.0973Regular Plan Dividend Monthly 10.1595Regular Plan Dividend Quarterly 10.6156Regular Plan Dividend Annual 10.3760Direct Plan Growth - 14.3425Direct Plan Dividend - 10.3900Direct Plan Dividend Fortnightly 10.0741Direct Plan Dividend Daily 10.0523Direct Plan Dividend Monthly 10.1093Direct Plan Dividend Quarterly 10.6898
Name Rating % of NAV
Corporate Bond 77.75%
Rural Electrification Corporation AAA 11.43%
Power Grid Corporation of India AAA 9.92%**Axis Bank AA+ 8.67%
Indian Railway Finance Corporation AAA 9.66%
Small Industries Dev Bank of India AAA 8.25%
Power Finance Corporation AAA 7.80%**ICICI Bank AA+ 3.94%
ICICI Bank AAA 2.40%
Export Import Bank of India AAA 4.80%
Indiabulls Housing Finance AAA 3.83%
NTPC AAA 2.43%**HDFC Bank AA+ 1.47%
Axis Bank AAA 1.21%
NHPC AAA 0.98%
National Highways Auth Of Ind AAA 0.96%
Government Bond 11.39%
7.35% - 2024 G-Sec SOV 3.94%
7.16% - 2023 G-Sec SOV 3.90%
8.15% - 2022 G-Sec SOV 2.54%
8.20% - 2022 G-Sec SOV 0.51%
7.72% - 2025 G-Sec SOV 0.50%
State Government Bond 3.54%
8.6% Madhya Pradesh SDL - 2023 SOV 1.52%
8.56% Tamilnadu SDL - 2023 SOV 1.01%
8.27% Rajasthan UdayBond - 2022 SOV 1.00%
Commercial Paper 2.30%
Export Import Bank of India A1+ 2.30%
Certificate of Deposit 0.47%**HDFC Bank A1+ 0.47%
Net Cash and Cash Equivalent 4.55%
Grand Total 100.00%
Performance TableScheme Name CAGR Returns (%) Current Value of Investment of ` 10,000
1 Year 3 Years 5 YearsSince
Inception1 Year 3 Years 5 Years
SinceInception
IDFC Banking & PSU Debt Fund - Regular Plan - Growth*
6.93% 8.10% NA 8.41% 10,697 12,634 NA 14,272
Crisil Short Term Bond Fund Index# 6.95% 7.83% NA 8.31% 10,699 12,541 NA 14,210
1 Year T-Bill## 6.42% 7.54% NA 7.23% 10,646 12,441 NA 13,599
IDFC Banking & PSU Debt Fund - Direct Plan - Growth$
7.06% 8.22% NA 8.54% 10,710 12,676 NA 14,343
Crisil Short Term Bond Fund Index# 6.95% 7.83% NA 8.31% 10,699 12,541 NA 14,210
1 Year T-Bill## 6.42% 7.54% NA 7.23% 10,646 12,441 NA 13,599
The fund is being managed by Mr. Anurag Mittal (w.e.f. 15th May 2017)Current Index performance adjusted for the period from since inception to June 12, 2017 with the performance of Crisil Short Term Bond Fund Index (Benchmark) & 1 Year T-Bill (Alternate Benchmark)Performance based on NAV as on 31/07/2017. Past performance may or may not be sustained in future.Regular and Direct Plans have different expense structure. Direct Plan shall have a lower expense ratio excluding distribution expenses, commission expenses etc.For other funds managed by the fund manager, please refer page no. 33 - 35 & the respective fund pages#Benchmark Returns. ##Alternate Benchmark Returns. Current Index performance adjusted for the period from since inception to June 12, 2017 with the performance of CRISIL Liquid Fund Index (Benchmark) *Since Inception Regular Plan - Growth Mar 07, 2013. $Since Inception Direct Plan - Growth Mar 07, 2013.$$ For details please refer Notice (https://www.idfcmf.com/uploads/090520171306No-18-Change-in-Scheme-features-of-IDFC-Banking-Debt-Fund.pdf)
Riskometer
Investors understand that their principal will be at Moderately Risk
This product is suitable for investors who are seeking*:
Income over short to medium term• A debt fund that invests predominantly in debt & •money market instruments issued by PSU, Banks & PFI
*Investors should consult their financial advisers if in doubt about whether the product is suitable for them.
**Basel III, Tier 1 Perpetual
Asset Quality
AA+14.08%
AAA Equivalent85.92%

25
IDFC Super Saver Income Fund – Short TermAn Open Ended Income Fund
31st July 2017
FUND FEATURES PORTFOLIO
About the Fund: A Short Term Income Fund, the portfolio is mostly a mix of short duration debt and money market instruments. The average portfolio maturity will not ordinarily exceed around 2 years.
Nature: Debt
Monthly Avg AUM: ` 5,774.48 Crores
Month end AUM: ` 5,964.41 Crores
Inception Date: 14 December 2000
Fund Manager: Mr. Suyash Choudhary (Since 11th March 2011)
Other Parameter:
Standard Deviation (Annualized) 1.27%
Modified Duration 1.83 years
Average Maturity 2.16 years
Yield to Maturity 7.02%
Expense Ratio
Regular 0.72%
Direct 0.24%
Benchmark: CRISIL AAA Short Term Index
(w.e.f. 26th September 2016)
SIP (Minimum Amount): ` 1000/-
SIP Frequency: Monthly
SIP Dates (Monthly): Any day of the month, except 29th, 30th & 31st day of the month
Investment Objective: Refer Pg No from 40 to 41
Minimum Investment Amount: ` 5,000/- and any amount thereafter
Option Available: Growth, Dividend - Fortnightly (Payout & Reinvestment), Monthly & Periodic
Exit Load: Nil (w.e.f. 23rd May 2016)
NAV (`)
Plan Option Freq NAV
Regular Plan Growth - 34.2680
Regular Plan Dividend Monthly 10.1660
Regular Plan Dividend Fortnightly 10.3369
Regular Plan Dividend Periodic 12.7146
Direct Plan Growth - 35.3004
Direct Plan Dividend Monthly 10.3719
Direct Plan Dividend Fortnightly 10.2630
Direct Plan Dividend Periodic 12.7445
Name Rating % of NAV
Corporate Bond 95.10%
HDFC AAA 11.66%
Power Finance Corporation AAA 11.58%
Kotak Mahindra Prime AAA 10.29%
Power Grid Corporation of India AAA 8.30%
Bajaj Finance AAA 7.65%
NABARD AAA 7.43%
Rural Electrification Corporation AAA 6.78%
LIC Housing Finance AAA 6.35%
National Highways Auth Of Ind AAA 5.32%
Indian Railway Finance Corporation AAA 5.09%
UltraTech Cement AAA 4.29%
Small Industries Dev Bank of India AAA 3.42%
HDB Financial Services AAA 1.76%
Reliance Jio Infocomm AAA 1.73%
NLC India AAA 1.21%
NTPC AAA 0.85%
Export Import Bank of India AAA 0.85%
Mahindra & Mahindra Financial Services AA+ 0.51%
HDFC Bank AAA 0.03%
Net Cash and Cash Equivalent 4.90%
Grand Total 100.00%
Performance TableScheme Name CAGR Returns (%) Current Value of Investment of ` 10,000
1 Year 3 Years 5 YearsSince
Inception1 Year 3 Years 5 Years
SinceInception
IDFC Super Saver Income Fund – Short Term - Regular Plan - Growth*
7.68% 8.60% 8.59% 7.68% 10,772 12,811 15,101 34,268
CRISIL AAA Short Term Bond Index# 8.58% 9.08% 9.20% NA 10,863 12,983 15,531 NA
CRISIL 1 Year T-Bill## 6.42% 7.54% 7.32% 6.32% 10,646 12,441 14,240 27,721
IDFC Super Saver Income Fund – Short Term - Direct Plan - Growth$
8.26% 9.24% NA 9.22% 10,830 13,038 NA 14,976
CRISIL AAA Short Term Bond Index# 8.58% 9.08% NA 9.06% 10,863 12,983 NA 14,880
CRISIL 1 Year T-Bill## 6.42% 7.54% NA 7.27% 10,646 12,441 NA 13,794
The fund is being managed by Mr. Suyash Choudhary (Since 11th March 2011)Performance based on NAV as on 31/07/2017. Past performance may or may not be sustained in future.Regular and Direct Plans have different expense structure. Direct Plan shall have a lower expense ratio excluding distribution expenses, commission expenses etc.For other funds managed by the fund manager, please refer page no. 33 - 35 & the respective fund pages#Benchmark Returns. ##Alternate Benchmark Returns. *Since Inception Regular Plan - Growth Dec 14, 2000. $Since Inception Direct Plan - Growth Jan 01, 2013.
Riskometer
Investors understand that their principal will be at Moderately Low Risk
This product is suitable for investors who are seeking*:
To generate optimal returns over short to medium •term.Investments in good quality fixed income & •Money Market securities.
*Investors should consult their financial advisers if in doubt about whether the product is suitable for them.
Maturity Bucket Asset Quality
AA+0.51%
AAA Equivalent99.49%
% NAV
18.32
68.51
13.17
0 10 20 30 40 50 60 70 80
Upto 1 year
1-3 years
Above 3 years
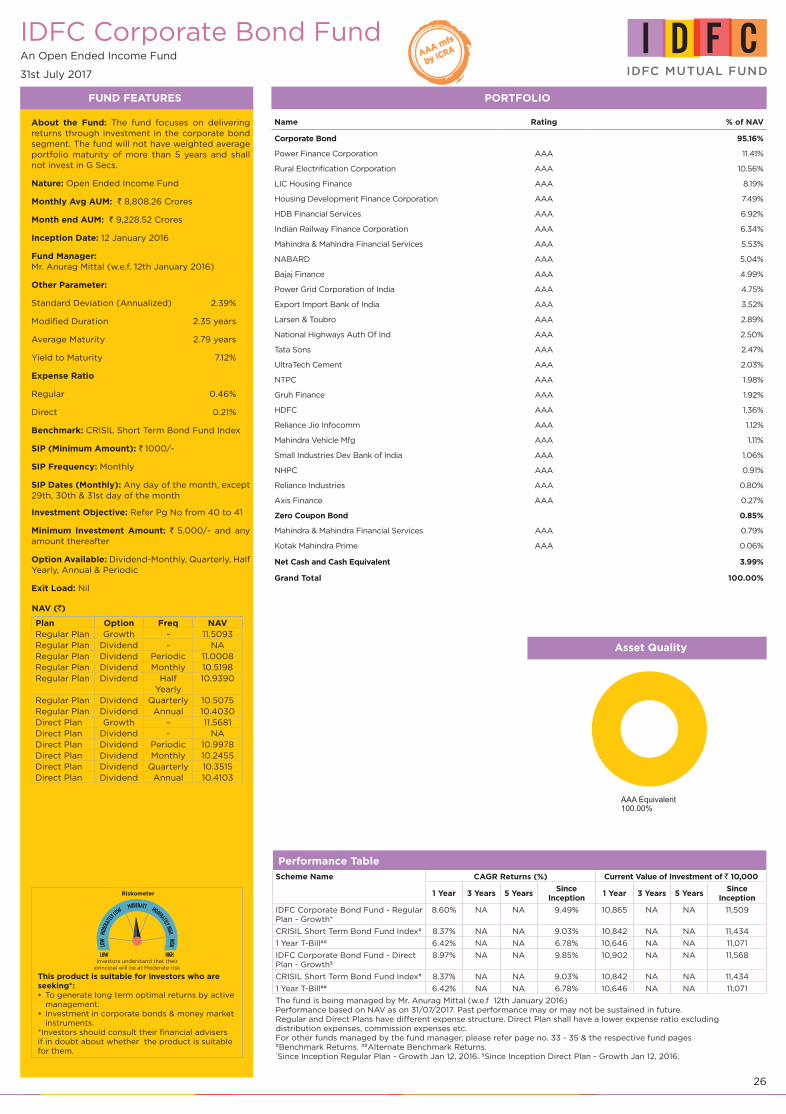
26
IDFC Corporate Bond FundAn Open Ended Income Fund
31st July 2017
FUND FEATURES PORTFOLIO
About the Fund: The fund focuses on delivering returns through investment in the corporate bond segment. The fund will not have weighted average portfolio maturity of more than 5 years and shall not invest in G Secs.
Nature: Open Ended Income Fund
Monthly Avg AUM: ` 8,808.26 Crores
Month end AUM: ` 9,228.52 Crores
Inception Date: 12 January 2016
Fund Manager: Mr. Anurag Mittal (w.e.f. 12th January 2016)
Other Parameter:
Standard Deviation (Annualized) 2.39%
Modified Duration 2.35 years
Average Maturity 2.79 years
Yield to Maturity 7.12%
Expense Ratio
Regular 0.46%
Direct 0.21%
Benchmark: CRISIL Short Term Bond Fund Index
SIP (Minimum Amount): ` 1000/-
SIP Frequency: Monthly
SIP Dates (Monthly): Any day of the month, except 29th, 30th & 31st day of the month
Investment Objective: Refer Pg No from 40 to 41
Minimum Investment Amount: ` 5,000/- and any amount thereafter
Option Available: Dividend-Monthly, Quarterly, Half Yearly, Annual & Periodic
Exit Load: Nil
NAV (`)
Plan Option Freq NAVRegular Plan Growth - 11.5093Regular Plan Dividend - NARegular Plan Dividend Periodic 11.0008Regular Plan Dividend Monthly 10.5198Regular Plan Dividend Half
Yearly10.9390
Regular Plan Dividend Quarterly 10.5075Regular Plan Dividend Annual 10.4030Direct Plan Growth - 11.5681Direct Plan Dividend - NADirect Plan Dividend Periodic 10.9978Direct Plan Dividend Monthly 10.2455Direct Plan Dividend Quarterly 10.3515Direct Plan Dividend Annual 10.4103
Name Rating % of NAV
Corporate Bond 95.16%
Power Finance Corporation AAA 11.41%
Rural Electrification Corporation AAA 10.56%
LIC Housing Finance AAA 8.19%
Housing Development Finance Corporation AAA 7.49%
HDB Financial Services AAA 6.92%
Indian Railway Finance Corporation AAA 6.34%
Mahindra & Mahindra Financial Services AAA 5.53%
NABARD AAA 5.04%
Bajaj Finance AAA 4.99%
Power Grid Corporation of India AAA 4.75%
Export Import Bank of India AAA 3.52%
Larsen & Toubro AAA 2.89%
National Highways Auth Of Ind AAA 2.50%
Tata Sons AAA 2.47%
UltraTech Cement AAA 2.03%
NTPC AAA 1.98%
Gruh Finance AAA 1.92%
HDFC AAA 1.36%
Reliance Jio Infocomm AAA 1.12%
Mahindra Vehicle Mfg AAA 1.11%
Small Industries Dev Bank of India AAA 1.06%
NHPC AAA 0.91%
Reliance Industries AAA 0.80%
Axis Finance AAA 0.27%
Zero Coupon Bond 0.85%
Mahindra & Mahindra Financial Services AAA 0.79%
Kotak Mahindra Prime AAA 0.06%
Net Cash and Cash Equivalent 3.99%
Grand Total 100.00%
Performance TableScheme Name CAGR Returns (%) Current Value of Investment of ` 10,000
1 Year 3 Years 5 YearsSince
Inception1 Year 3 Years 5 Years
SinceInception
IDFC Corporate Bond Fund - Regular Plan - Growth*
8.60% NA NA 9.49% 10,865 NA NA 11,509
CRISIL Short Term Bond Fund Index# 8.37% NA NA 9.03% 10,842 NA NA 11,434
1 Year T-Bill## 6.42% NA NA 6.78% 10,646 NA NA 11,071
IDFC Corporate Bond Fund - Direct Plan - Growth$
8.97% NA NA 9.85% 10,902 NA NA 11,568
CRISIL Short Term Bond Fund Index# 8.37% NA NA 9.03% 10,842 NA NA 11,434
1 Year T-Bill## 6.42% NA NA 6.78% 10,646 NA NA 11,071
The fund is being managed by Mr. Anurag Mittal (w.e.f 12th January 2016)Performance based on NAV as on 31/07/2017. Past performance may or may not be sustained in future.Regular and Direct Plans have different expense structure. Direct Plan shall have a lower expense ratio excluding distribution expenses, commission expenses etc.For other funds managed by the fund manager, please refer page no. 33 - 35 & the respective fund pages#Benchmark Returns. ##Alternate Benchmark Returns. *Since Inception Regular Plan - Growth Jan 12, 2016. $Since Inception Direct Plan - Growth Jan 12, 2016.
Riskometer
Investors understand that theirprincipal will be at Moderate risk
This product is suitable for investors who are seeking*:
To generate long term optimal returns by active •management.Investment in corporate bonds & money market •instruments.
*Investors should consult their financial advisers if in doubt about whether the product is suitable for them.
Asset Quality
AAA Equivalent100.00%

27
IDFC Credit Opportunities FundAn Open Ended Debt Fund
31st July 2017
FUND FEATURES PORTFOLIO
About the Fund: IDFC Credit opportunities fund aims to provide an optimal risk-reward profile to investors by focusing on companies with well-run management and evolving business prospects or good businesses with improving financial profile.
Nature: Debt
Monthly Avg AUM: ` 690.31 Crores
Month end AUM: ` 734.79 Crores
Inception Date: 03 March 2017
Fund Manager: Mr. Arvind Subramanian (w.e.f. 03rd March 2017) and Khushboo Sharma (w.e.f. 15th May 2017)
Other Parameter:
Modified Duration 2.64 years
Average Maturity 3.29 years
Yield to Maturity 7.84%
Expense Ratio
Regular 1.33%
Direct 0.29%
Benchmark: 80% CRISIL AA Medium Term Bond Index + 20% CRISIL AAA Short Term Bond Index
SIP (Minimum Amount): ` 1,000/-
SIP Frequency: Monthly
SIP Dates (Monthly): Any day of the month, except 29th, 30th & 31st day of the month
Investment Objective: Refer Pg No from 40 to 41
Minimum Investment Amount: ` 5,000/- and any amount thereafter
Option Available: Growth & Dividend (Payout, Reinvestment & Sweep facility)
Exit Load: 1% if redeemed/switched out within 365 days from the date of allotment
NAV (`)
Plan Option Freq NAV
Regular Plan Growth - 10.4125
Regular Plan Dividend Periodic 10.4125
Regular Plan Dividend Annual 10.4125
Regular Plan Dividend Half Yearly
10.4125
Regular Plan Dividend Quarterly 10.2104
Direct Plan Growth - 10.4536
Direct Plan Dividend Periodic 10.4537
Direct Plan Dividend Annual 10.4536
Direct Plan Dividend Half Yearly
10.4545
Direct Plan Dividend Quarterly 10.2108
Name Rating % of NAV
Corporate Bond 86.45%
Power Finance Corporation AAA 6.89%
Indiabulls Housing Finance AAA 6.23%
**Axis Bank AA+ 6.18%
Tata Housing Development Company AA 6.15%
Mahindra Rural Housing Finance AA+ 5.47%
**IndusInd Bank AA 4.88%
**HDFC Bank AA+ 4.87%
Afcons Infrastructure AA 4.83%
JM Financial Products AA 4.78%
Tata Power Company AA- 4.24%
Idea Cellular AA+ 4.06%
Hindalco Industries AA 3.66%
Vodafone Mobile Services AA 3.48%
L&T Housing Finance AA+ 3.42%
*Tata Power Renewable Energy AA(SO) 3.41%
**ICICI Bank AA+ 2.80%
Tata Motors AA+ 2.74%
Tata Steel AA 2.12%
*Welspun Renewables Energy Private AA(SO) 2.01%
Reliance Ports and Terminals AAA 1.42%
Rural Electrification Corporation AAA 1.41%
Reliance Jio Infocomm AAA 1.41%
Commercial Paper 4.59%
Shapoorji Pallonji and Company Pvt A1+ 4.59%
State Government Bond 3.58%
8.39% Rajasthan UDAY BOND - 2023 SOV 3.58%
Zero Coupon Bond 2.11%
Aditya Birla Fashion and Retail AA 2.11%
Net Cash and Cash Equivalent 3.27%
Grand Total 100.00%
Riskometer
Investors understand that their principal will be at Moderate risk
This product is suitable for investors who are seeking*:
To generate optimal returns over medium term.•To predominantly invest in a portfolio of •corporate debt securities across the credit spectrum.
*Investors should consult their financial advisers if in doubt about whether the product is suitable for them.
Asset Quality
**Basel III, Tier 1 Perpetual*Corporate Guarantee from Tata Power
AA+
AA
AA-
AAA Equivalent
29.54%
37.43%
4.24%
28.80%
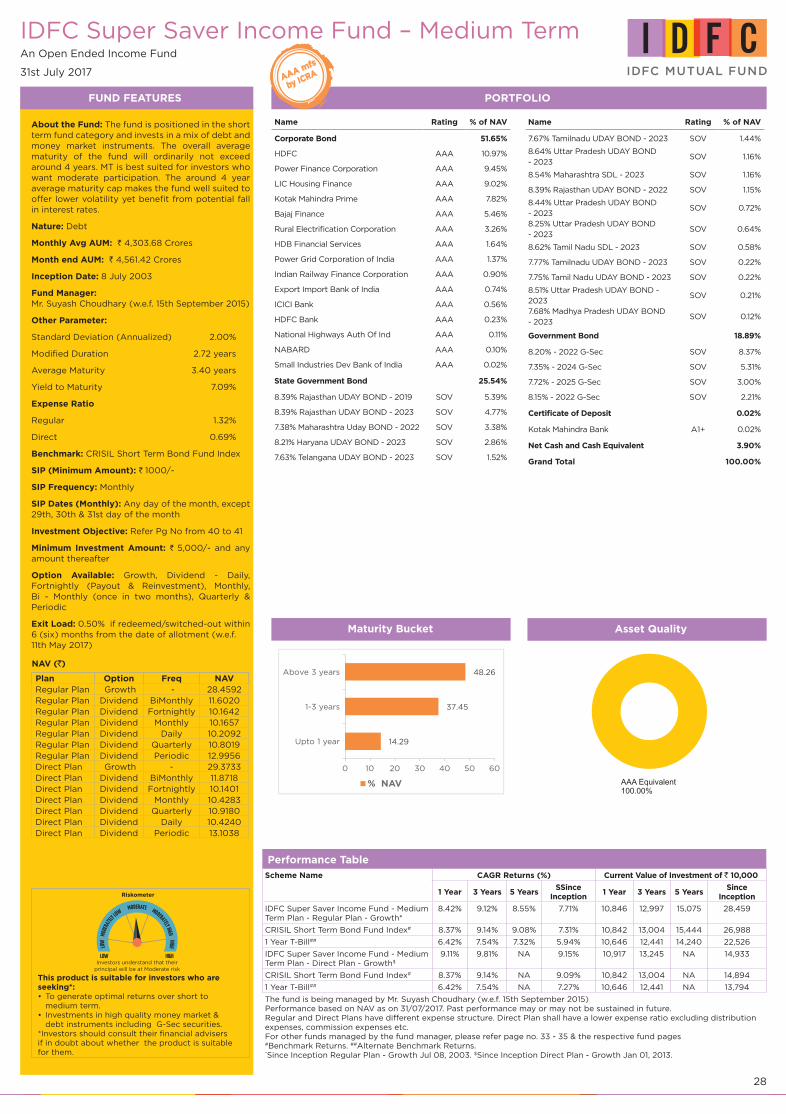
28
IDFC Super Saver Income Fund – Medium TermAn Open Ended Income Fund
31st July 2017
FUND FEATURES PORTFOLIO
About the Fund: The fund is positioned in the short term fund category and invests in a mix of debt and money market instruments. The overall average maturity of the fund will ordinarily not exceed around 4 years. MT is best suited for investors who want moderate participation. The around 4 year average maturity cap makes the fund well suited to offer lower volatility yet benefit from potential fall in interest rates.
Nature: Debt
Monthly Avg AUM: ` 4,303.68 Crores
Month end AUM: ` 4,561.42 Crores
Inception Date: 8 July 2003
Fund Manager: Mr. Suyash Choudhary (w.e.f. 15th September 2015)
Other Parameter:
Standard Deviation (Annualized) 2.00%
Modified Duration 2.72 years
Average Maturity 3.40 years
Yield to Maturity 7.09%
Expense Ratio
Regular 1.32%
Direct 0.69%
Benchmark: CRISIL Short Term Bond Fund Index
SIP (Minimum Amount): ` 1000/-
SIP Frequency: Monthly
SIP Dates (Monthly): Any day of the month, except 29th, 30th & 31st day of the month
Investment Objective: Refer Pg No from 40 to 41
Minimum Investment Amount: ` 5,000/- and any amount thereafter
Option Available: Growth, Dividend - Daily, Fortnightly (Payout & Reinvestment), Monthly, Bi - Monthly (once in two months), Quarterly & Periodic
Exit Load: 0.50% if redeemed/switched-out within 6 (six) months from the date of allotment (w.e.f. 11th May 2017)
NAV (`)
Plan Option Freq NAVRegular Plan Growth - 28.4592Regular Plan Dividend BiMonthly 11.6020Regular Plan Dividend Fortnightly 10.1642Regular Plan Dividend Monthly 10.1657Regular Plan Dividend Daily 10.2092Regular Plan Dividend Quarterly 10.8019Regular Plan Dividend Periodic 12.9956Direct Plan Growth - 29.3733Direct Plan Dividend BiMonthly 11.8718Direct Plan Dividend Fortnightly 10.1401Direct Plan Dividend Monthly 10.4283Direct Plan Dividend Quarterly 10.9180Direct Plan Dividend Daily 10.4240Direct Plan Dividend Periodic 13.1038
Name Rating % of NAV
Corporate Bond 51.65%
HDFC AAA 10.97%
Power Finance Corporation AAA 9.45%
LIC Housing Finance AAA 9.02%
Kotak Mahindra Prime AAA 7.82%
Bajaj Finance AAA 5.46%
Rural Electrification Corporation AAA 3.26%
HDB Financial Services AAA 1.64%
Power Grid Corporation of India AAA 1.37%
Indian Railway Finance Corporation AAA 0.90%
Export Import Bank of India AAA 0.74%
ICICI Bank AAA 0.56%
HDFC Bank AAA 0.23%
National Highways Auth Of Ind AAA 0.11%
NABARD AAA 0.10%
Small Industries Dev Bank of India AAA 0.02%
State Government Bond 25.54%
8.39% Rajasthan UDAY BOND - 2019 SOV 5.39%
8.39% Rajasthan UDAY BOND - 2023 SOV 4.77%
7.38% Maharashtra Uday BOND - 2022 SOV 3.38%
8.21% Haryana UDAY BOND - 2023 SOV 2.86%
7.63% Telangana UDAY BOND - 2023 SOV 1.52%
Performance TableScheme Name CAGR Returns (%) Current Value of Investment of ` 10,000
1 Year 3 Years 5 YearsSSince
Inception1 Year 3 Years 5 Years
SinceInception
IDFC Super Saver Income Fund - Medium Term Plan - Regular Plan - Growth*
8.42% 9.12% 8.55% 7.71% 10,846 12,997 15,075 28,459
CRISIL Short Term Bond Fund Index# 8.37% 9.14% 9.08% 7.31% 10,842 13,004 15,444 26,988
1 Year T-Bill## 6.42% 7.54% 7.32% 5.94% 10,646 12,441 14,240 22,526
IDFC Super Saver Income Fund - Medium Term Plan - Direct Plan - Growth$
9.11% 9.81% NA 9.15% 10,917 13,245 NA 14,933
CRISIL Short Term Bond Fund Index# 8.37% 9.14% NA 9.09% 10,842 13,004 NA 14,894
1 Year T-Bill## 6.42% 7.54% NA 7.27% 10,646 12,441 NA 13,794
The fund is being managed by Mr. Suyash Choudhary (w.e.f. 15th September 2015)Performance based on NAV as on 31/07/2017. Past performance may or may not be sustained in future.Regular and Direct Plans have different expense structure. Direct Plan shall have a lower expense ratio excluding distribution expenses, commission expenses etc.For other funds managed by the fund manager, please refer page no. 33 - 35 & the respective fund pages#Benchmark Returns. ##Alternate Benchmark Returns. *Since Inception Regular Plan - Growth Jul 08, 2003. $Since Inception Direct Plan - Growth Jan 01, 2013.
Name Rating % of NAV
7.67% Tamilnadu UDAY BOND - 2023 SOV 1.44%
8.64% Uttar Pradesh UDAY BOND - 2023
SOV 1.16%
8.54% Maharashtra SDL - 2023 SOV 1.16%
8.39% Rajasthan UDAY BOND - 2022 SOV 1.15%
8.44% Uttar Pradesh UDAY BOND - 2023
SOV 0.72%
8.25% Uttar Pradesh UDAY BOND - 2023
SOV 0.64%
8.62% Tamil Nadu SDL - 2023 SOV 0.58%
7.77% Tamilnadu UDAY BOND - 2023 SOV 0.22%
7.75% Tamil Nadu UDAY BOND - 2023 SOV 0.22%
8.51% Uttar Pradesh UDAY BOND - 2023
SOV 0.21%
7.68% Madhya Pradesh UDAY BOND - 2023
SOV 0.12%
Government Bond 18.89%
8.20% - 2022 G-Sec SOV 8.37%
7.35% - 2024 G-Sec SOV 5.31%
7.72% - 2025 G-Sec SOV 3.00%
8.15% - 2022 G-Sec SOV 2.21%
Certificate of Deposit 0.02%
Kotak Mahindra Bank A1+ 0.02%
Net Cash and Cash Equivalent 3.90%
Grand Total 100.00%
Riskometer
Investors understand that theirprincipal will be at Moderate risk
This product is suitable for investors who are seeking*:
To generate optimal returns over short to •medium term.Investments in high quality money market & •debt instruments including G-Sec securities.
*Investors should consult their financial advisers if in doubt about whether the product is suitable for them.
Maturity Bucket Asset Quality
AAA Equivalent100.00%
% NAV
14.29
37.45
48.26
0 10 20 30 40 50 60
Upto 1 year
1-3 years
Above 3 years
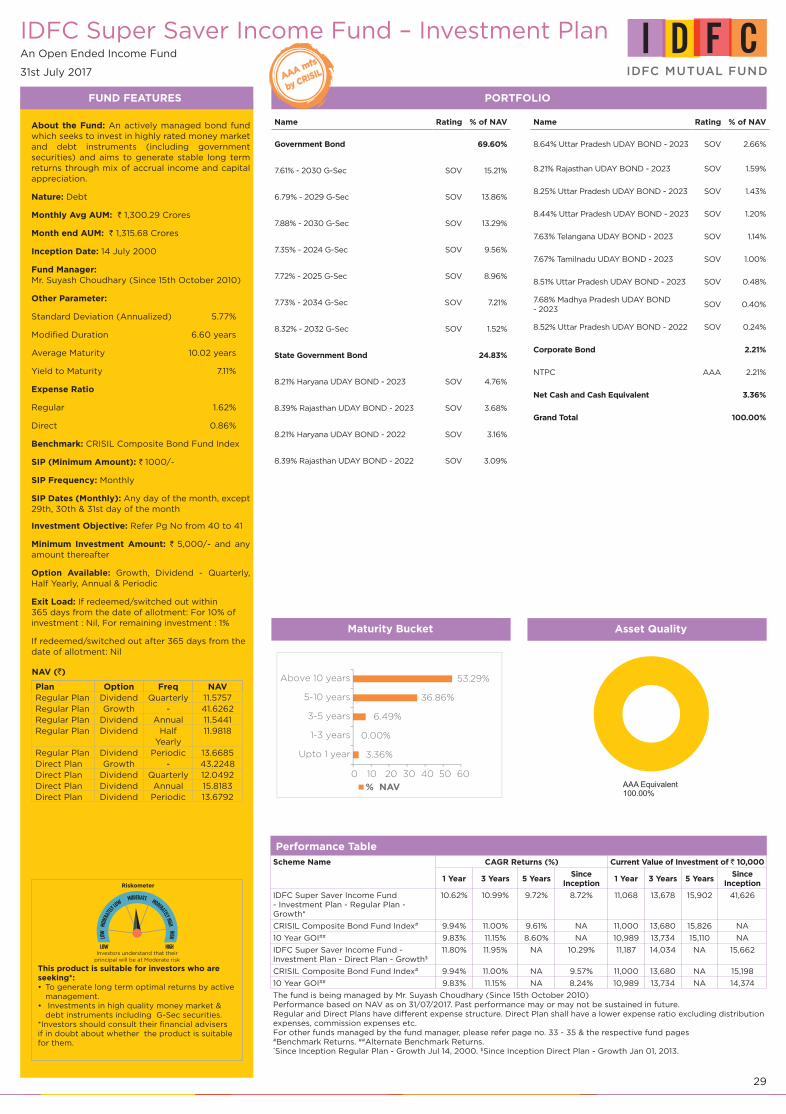
29
IDFC Super Saver Income Fund – Investment PlanAn Open Ended Income Fund
31st July 2017
FUND FEATURES PORTFOLIO
About the Fund: An actively managed bond fund which seeks to invest in highly rated money market and debt instruments (including government securities) and aims to generate stable long term returns through mix of accrual income and capital appreciation.
Nature: Debt
Monthly Avg AUM: ` 1,300.29 Crores
Month end AUM: ` 1,315.68 Crores
Inception Date: 14 July 2000
Fund Manager: Mr. Suyash Choudhary (Since 15th October 2010)
Other Parameter:
Standard Deviation (Annualized) 5.77%
Modified Duration 6.60 years
Average Maturity 10.02 years
Yield to Maturity 7.11%
Expense Ratio
Regular 1.62%
Direct 0.86%
Benchmark: CRISIL Composite Bond Fund Index
SIP (Minimum Amount): ` 1000/-
SIP Frequency: Monthly
SIP Dates (Monthly): Any day of the month, except 29th, 30th & 31st day of the month
Investment Objective: Refer Pg No from 40 to 41
Minimum Investment Amount: ` 5,000/- and any amount thereafter
Option Available: Growth, Dividend - Quarterly, Half Yearly, Annual & Periodic
Exit Load: If redeemed/switched out within 365 days from the date of allotment: For 10% of investment : Nil, For remaining investment : 1%
If redeemed/switched out after 365 days from the date of allotment: Nil
NAV (`)
Plan Option Freq NAVRegular Plan Dividend Quarterly 11.5757Regular Plan Growth - 41.6262Regular Plan Dividend Annual 11.5441Regular Plan Dividend Half
Yearly11.9818
Regular Plan Dividend Periodic 13.6685Direct Plan Growth - 43.2248Direct Plan Dividend Quarterly 12.0492Direct Plan Dividend Annual 15.8183Direct Plan Dividend Periodic 13.6792
Name Rating % of NAV
Government Bond 69.60%
7.61% - 2030 G-Sec SOV 15.21%
6.79% - 2029 G-Sec SOV 13.86%
7.88% - 2030 G-Sec SOV 13.29%
7.35% - 2024 G-Sec SOV 9.56%
7.72% - 2025 G-Sec SOV 8.96%
7.73% - 2034 G-Sec SOV 7.21%
8.32% - 2032 G-Sec SOV 1.52%
State Government Bond 24.83%
8.21% Haryana UDAY BOND - 2023 SOV 4.76%
8.39% Rajasthan UDAY BOND - 2023 SOV 3.68%
8.21% Haryana UDAY BOND - 2022 SOV 3.16%
8.39% Rajasthan UDAY BOND - 2022 SOV 3.09%
Performance TableScheme Name CAGR Returns (%) Current Value of Investment of ` 10,000
1 Year 3 Years 5 YearsSince
Inception1 Year 3 Years 5 Years
SinceInception
IDFC Super Saver Income Fund - Investment Plan - Regular Plan - Growth*
10.62% 10.99% 9.72% 8.72% 11,068 13,678 15,902 41,626
CRISIL Composite Bond Fund Index# 9.94% 11.00% 9.61% NA 11,000 13,680 15,826 NA
10 Year GOI## 9.83% 11.15% 8.60% NA 10,989 13,734 15,110 NA
IDFC Super Saver Income Fund - Investment Plan - Direct Plan - Growth$
11.80% 11.95% NA 10.29% 11,187 14,034 NA 15,662
CRISIL Composite Bond Fund Index# 9.94% 11.00% NA 9.57% 11,000 13,680 NA 15,198
10 Year GOI## 9.83% 11.15% NA 8.24% 10,989 13,734 NA 14,374
The fund is being managed by Mr. Suyash Choudhary (Since 15th October 2010)Performance based on NAV as on 31/07/2017. Past performance may or may not be sustained in future.Regular and Direct Plans have different expense structure. Direct Plan shall have a lower expense ratio excluding distribution expenses, commission expenses etc.For other funds managed by the fund manager, please refer page no. 33 - 35 & the respective fund pages#Benchmark Returns. ##Alternate Benchmark Returns. *Since Inception Regular Plan - Growth Jul 14, 2000. $Since Inception Direct Plan - Growth Jan 01, 2013.
Name Rating % of NAV
8.64% Uttar Pradesh UDAY BOND - 2023 SOV 2.66%
8.21% Rajasthan UDAY BOND - 2023 SOV 1.59%
8.25% Uttar Pradesh UDAY BOND - 2023 SOV 1.43%
8.44% Uttar Pradesh UDAY BOND - 2023 SOV 1.20%
7.63% Telangana UDAY BOND - 2023 SOV 1.14%
7.67% Tamilnadu UDAY BOND - 2023 SOV 1.00%
8.51% Uttar Pradesh UDAY BOND - 2023 SOV 0.48%
7.68% Madhya Pradesh UDAY BOND - 2023
SOV 0.40%
8.52% Uttar Pradesh UDAY BOND - 2022 SOV 0.24%
Corporate Bond 2.21%
NTPC AAA 2.21%
Net Cash and Cash Equivalent 3.36%
Grand Total 100.00%
Riskometer
Investors understand that theirprincipal will be at Moderate risk
This product is suitable for investors who are seeking*:
To generate long term optimal returns by active •management. Investments in high quality money market & •debt instruments including G-Sec securities.
*Investors should consult their financial advisers if in doubt about whether the product is suitable for them.
Maturity Bucket Asset Quality
AAA Equivalent100.00%
% NAV
3.36%
0.00%
6.49%
36.86%
53.29%
0 10 20 30 40 50 60
Upto 1 year
1-3 years
3-5 years
5-10 years
Above 10 years

30
IDFC Dynamic Bond FundAn Open Ended Income Fund
31st July 2017
FUND FEATURES PORTFOLIO
About the Fund: The fund is positioned in the income fund category to take exposure across the curve depending upon the fund manager’s underlying interest rate view where we employ the majority of the portfolio. It is a wide structure and conceptually can go anywhere on the curve. The fund plays the trade of the season which we think will sustain for a longer period of time.
Nature: Debt
Monthly Avg AUM: ` 4,287.92 Crores
Month end AUM: ` 4,323.75 Crores
Inception Date: 25 June 2002
Fund Manager: Mr. Suyash Choudhary (Since 15th October 2010)
Other Parameter:
Standard Deviation (Annualized) 5.78%
Modified Duration 6.71 years
Average Maturity 10.13 years
Yield to Maturity 7.11%
Expense Ratio
Regular 1.48%
Direct 0.69%
Benchmark: CRISIL Composite Bond Fund Index
SIP (Minimum Amount): ` 1000/-
SIP Frequency: Monthly
SIP Dates (Monthly): Any day of the month, except 29th, 30th & 31st day of the month
Investment Objective: Refer Pg No from 40 to 41
Minimum Investment Amount: ` 5,000/- and any amount thereafter
Option Available: Growth, Dividend - Quarterly (March, June, September & December), Half Yearly, Annual, Regular & Periodic
Exit Load: Nil (w.e.f. 17th October 2016)
NAV (`)
Plan Option Freq NAVRegular Plan Growth - 20.7568Regular Plan Dividend - 10.6469Regular Plan Dividend Quarterly 10.8966Regular Plan Dividend Annual 11.0137Regular Plan Dividend Half
Yearly10.8052
Regular Plan Dividend Periodic 13.5273Direct Plan Growth - 21.6265Direct Plan Dividend - 12.8366Direct Plan Dividend Quarterly 12.6557Direct Plan Dividend Annual 11.4919Direct Plan Dividend Half
Yearly10.9471
Direct Plan Dividend Periodic 13.9773
Name Rating % of NAV
Government Bond 70.97%
6.79% - 2029 G-Sec SOV 15.13%
7.88% - 2030 G-Sec SOV 14.29%
7.35% - 2024 G-Sec SOV 11.93%
7.61% - 2030 G-Sec SOV 10.76%
7.72% - 2025 G-Sec SOV 9.85%
7.73% - 2034 G-Sec SOV 8.16%
8.32% - 2032 G-Sec SOV 0.85%
State Government Bond 23.91%
8.21% Haryana UDAY BOND - 2023 SOV 5.19%
8.39% Rajasthan UDAY BOND - 2023 SOV 4.03%
8.21% Haryana UDAY BOND - 2022 SOV 3.23%
8.64% Uttar Pradesh UDAY BOND - 2023 SOV 2.87%
8.21% Rajasthan UDAY BOND - 2023 SOV 1.57%
8.25% Uttar Pradesh UDAY BOND - 2023 SOV 1.55%
Performance TableScheme Name CAGR Returns (%) Current Value of Investment of ` 10,000
1 Year 3 Years 5 YearsSince
Inception1 Year 3 Years 5 Years
SinceInception
IDFC Dynamic Bond Fund - Regular Plan - Growth*
10.88% 11.23% 9.91% 8.80% 11,094 13,766 16,041 20,757
CRISIL Composite Bond Fund Index# 9.94% 11.00% 9.61% 8.55% 11,000 13,680 15,826 20,349
10 Year GOI## 9.83% 11.15% 8.60% 6.34% 10,989 13,734 15,110 17,038
IDFC Dynamic Bond Fund - Direct - Plan - Growth$
11.83% 12.23% NA 10.56% 11,190 14,141 NA 15,838
CRISIL Composite Bond Fund Index# 9.94% 11.00% NA 9.57% 11,000 13,680 NA 15,198
10 Year GOI## 9.83% 11.15% NA 8.24% 10,989 13,734 NA 14,374
The fund is being managed by Mr. Suyash Choudhary (Since 15th October 2010)Performance based on NAV as on 31/07/2017. Past performance may or may not be sustained in future.Regular and Direct Plans have different expense structure. Direct Plan shall have a lower expense ratio excluding distribution expenses, commission expenses etc.For other funds managed by the fund manager, please refer page no. 33 - 35 & the respective fund pages#Benchmark Returns. ##Alternate Benchmark Returns. *Since Inception Regular Plan - Growth Dec 03, 2008. $Since Inception Direct Plan - Growth Jan 01, 2013.
Name Rating % of NAV
8.44% Uttar Pradesh UDAY BOND - 2023 SOV 1.25%
7.63% Telangana UDAY BOND - 2023 SOV 1.11%
7.67% Tamilnadu UDAY BOND - 2023 SOV 0.99%
8.39% Rajasthan UDAY BOND - 2022 SOV 0.75%
8.51% Uttar Pradesh UDAY BOND - 2023 SOV 0.55%
7.68% Madhya Pradesh UDAY BOND
- 2023SOV 0.42%
8.52% Uttar Pradesh UDAY BOND - 2022 SOV 0.28%
7.99% Uttar Pradesh SDL - 2026 SOV 0.06%
8.07% Rajasthan SDL - 2026 SOV 0.03%
7.98% Haryana SDL - 2026 SOV 0.02%
Corporate Bond 2.46%
NTPC AAA 2.46%
Net Cash and Cash Equivalent 2.67%
Grand Total 100.00%
Riskometer
Investors understand that theirprincipal will be at Moderate risk
This product is suitable for investors who are seeking*:
To generate long term optimal returns by active •management.Investments in high quality money market & •debt instruments including G-Sec securities.
*Investors should consult their financial advisers if in doubt about whether the product is suitable for them.
Maturity Bucket Asset Quality
AAA Equivalent100.00%
2.67
0.00
4.27
41.42
51.64
0 10 20 30 40 50 60
Upto 1 year
1-3 years
3-5 years
5-10 years
Above 10 years

31
PORTFOLIOName Rating % of NAV
Government Bond 95.93%
7.88% - 2030 G-Sec SOV 28.96%
7.61% - 2030 G-Sec SOV 16.19%
6.79% - 2029 G-Sec SOV 16.09%
7.73% - 2034 G-Sec SOV 13.44%
7.59% - 2029 G-Sec SOV 7.22%
7.50% - 2034 G-Sec SOV 5.13%
8.24% - 2033 G-Sec SOV 3.93%
7.35% - 2024 G-Sec SOV 3.53%
7.72% - 2025 G-Sec SOV 1.45%
State Government Bond 1.02%
8.21% Haryana UDAY BOND - 2022 SOV 0.41%
8.52% Uttar Pradesh UDAY BOND - 2022 SOV 0.31%
7.68% Madhya Pradesh UDAY BOND - 2023 SOV 0.30%
Net Cash and Cash Equivalent 3.04%
Grand Total 100.00%
FUND FEATURES
About the Fund: A dedicated gilt fund with an objective to generate optimal returns with high liquidity by investing in Government Securities.
Nature: Debt | Monthly Avg AUM: ` 100.59 Crores | Month end AUM: ` 101.48 Crores
Inception Date: 29 March 2004 | Fund Manager: Mr. Suyash Choudhary (Since 15th October 2010)
Other Parameter Asset Quality Expense Ratio
Standard Deviation (Annualized) 6.34% Sovereign 100.00% Regular 0.76%Modified Duration 8.03 years Direct 0.26%Average Maturity 13.06 yearsYield to Maturity 7.08%
Benchmark: I-Sec Composite Index | SIP (Minimum Amount): ` 100/- | SIP Frequency: Monthly | SIP Dates (Monthly): Any day of the month, except 29th, 30th & 31st day of the month | Investment Objective: Refer Pg No from 40 to 41 | Minimum Investment Amount: ` 100/- and any amount thereafter | Option Available: Growth, Dividend - Quarterly, Annual & Periodic | Exit Load: Nil (w.e.f. 11th December 2014). Yields for GSec/SDLs have been annualized wherever applicable.
NAV (`)
Plan Regular Plan Regular Plan Regular Plan Regular Plan Direct Plan Direct Plan Direct Plan Direct Plan
Option Growth Dividend Dividend Dividend Growth Dividend Dividend Dividend
Freq - Quarterly Annual Periodic - Quarterly Annual Periodic
NAV 30.3252 12.2248 11.6468 14.1697 31.0586 12.6110 12.9047 13.8343
Riskometer
Investors understand that theirprincipal will be at Moderate risk
This product is suitable for investors who are seeking*:
To generate optimal returns over •short to medium term.Investments in Government •Securities and Treasury Bills.
*Investors should consult their financial advisers if in doubt about whether the product is suitable for them.
Performance TableScheme Name CAGR Returns (%) Current Value of Investment of ` 10,000
1 Year 3 Years 5 Years Since Inception 1 Year 3 Years 5 Years Since InceptionIDFC Government Securities Fund – STP - Regular Plan - Growth*
9.24% 9.94% 10.36% 6.03% 10,929 13,293 16,373 24,647
I-Sec Si-BEX# 7.85% 8.68% 8.46% NA 10,789 12,839 15,010 NACRISIL 1 Year T-Bill## 6.42% 7.54% 7.32% 5.97% 10,646 12,441 14,240 24,429IDFC Government Securities Fund – STP - Direct Plan - Growth$ 9.38% 10.10% NA 10.43% 10,944 13,350 NA 15,753
I-Sec Si-BEX# 7.85% 8.68% NA 8.44% 10,789 12,839 NA 14,495CRISIL 1 Year T-Bill## 6.42% 7.54% NA 7.27% 10,646 12,441 NA 13,794The fund is being managed by Mr. Harshal Joshi (w.e.f. 15th May 2017). Performance based on NAV as on 31/07/2017. Past performance may or may not be sustained in future. Regular and Direct Plans have different expense structure. Direct Plan shall have a lower expense ratio excluding distribution expenses, commission expenses etc. For other funds managed by the fund manager, please refer page no. 33 - 35 & the respective fund pages. #Benchmark Returns. ##Alternate Benchmark Returns. *Since Inception Regular Plan - Growth Mar 09, 2002. $Since Inception Direct Plan - Growth Jan 01, 2013.
`
IDFC Government Securities Fund – Short Term PlanAn Open Ended Dedicated Gilt Fund
31st July 2017
FUND FEATURES
About the Fund: The fund is a mix of government bonds, state development loans (SDLs), treasury bills and/or cash management bills. The fund will predominantly invest at the shorter end of the sovereign yield curve.
Nature: Debt | Monthly Avg AUM: ` 135.15 Crores | Month end AUM: ` 168.91 CroresInception Date: 9 March 2002 | Fund Manager: Mr. Harshal Joshi (w.e.f. 15th May 2017)
Other Parameter Asset Quality Expense Ratio
Standard Deviation (Annualized) 2.04% Sovereign 100.00% Regular 0.39%
Modified Duration 2.38 years Direct 0.34%
Average Maturity 2.95 years
Yield to Maturity 6.94%
Benchmark: I - Sec Si Bex (w.e.f. 30th November 2015) | SIP (Minimum Amount): ` 1,000/- | SIP Frequency: Monthly | SIP Dates (Monthly): Any day of the month, except 29th, 30th & 31st day of the month | Investment Objective: Refer Pg No from 40 to 41 | Minimum Investment Amount: ` 5,000/- and any amount thereafter | Option Available: Growth, Dividend - Weekly, Monthly, Quarterly & Periodic | Exit Load: Nil. Yields for GSec/SDLs have been annualized wherever applicable.
NAV (`)
PlanRegular
Plan Regular
Plan Regular
Plan Regular
Plan Direct Plan
Direct Plan
Direct Plan
Direct Plan
Direct Plan
Option Growth Dividend Dividend Dividend Growth Dividend Dividend Dividend Dividend
Freq - Quarterly Annual Periodic - Quarterly Annual Periodic Weekly
NAV 24.6470 10.7864 - 13.2093 24.7734 11.0530 - 13.2215 15.4921
PORTFOLIO
Name Rating % of NAV
State Government Bond 71.55%
8.39% Rajasthan UDAY BOND - 2020 SOV 27.57%
8.71% TAMILNADU SDL - 2022 SOV 12.56%
8.21% Haryana UDAY BOND - 2022 SOV 9.23%
7.67% Tamilnadu UDAY BOND - 2023 SOV 7.43%
8.74% Karnataka SDL - 2022 SOV 6.29%
8.92% Tamil Nadu SDL - 2022 SOV 3.17%
7.77% Gujarat SDL - 2023 SOV 3.05%
8.68% Gujarat SDL - 2023 SOV 2.25%
Net Cash and Cash Equivalent 28.45%
Grand Total 100.00%
Riskometer
Investors understand that theirprincipal will be at Moderate risk
This product is suitable for investors who are seeking*:
To generate short to medium term •optimal returns. Investments in Government •Securities and Treasury Bills.
*Investors should consult their financial advisers if in doubt about whether the product is suitable for them.
IDFC Government Securities Fund – Provident Fund PlanAn Open Ended Dedicated Gilt Fund
31st July 2017
Maturity BucketUpto 1 year 1-3 years 3-5 years 5-10 years Above 10 years
28.45% 27.57% 31.25% 12.73% 0.00%
Maturity Bucket
% NAV
3.04%
0.00%
0.72%
5.28%
90.96%
0 10 20 30 40 50 60 70 80 90 100
Upto 1 year
1-3 years
3-5 years
5-10 years
Above 10 years

32
IDFC Government Securities Fund – Investment PlanAn Open Ended Dedicated Gilt Fund
31st July 2017
FUND FEATURES PORTFOLIO
About the Fund: A dedicated gilt fund with an objective to generate optimal returns with high liquidity by investing in Government Securities.
Nature: Debt
Monthly Avg AUM: ` 605.50 Crores
Month end AUM: ` 607.03 Crores
Inception Date: 9 March 2002
Fund Manager: Mr. Suyash Choudhary (Since 15th October 2010)
Other Parameter:
Standard Deviation (Annualized) 6.25%
Modified Duration 8.08 years
Average Maturity 13.09 years
Yield to Maturity 7.08%
Asset Quality
Sovereign 100.00%
Expense Ratio
Regular 1.41%
Direct 0.81%
Benchmark: I-Sec Composite Index
SIP (Minimum Amount): ` 1,000/-
SIP Frequency: Monthly
SIP Dates (Monthly): Any day of the month, except 29th, 30th & 31st day of the month
Investment Objective: Refer Pg No from 40 to 41
Minimum Investment Amount: ` 5,000/- and any amount thereafter
Option Available: Growth, Dividend - Quarterly, Half Yearly, Annual, Regular & Periodic
Exit Load: Nil (w.e.f. 15th July 2011)
NAV (`)
Plan Option Freq NAVRegular Plan Dividend - 10.7403Regular Plan Growth - 20.5965Regular Plan Dividend Quarterly 11.0929Regular Plan Dividend Annual 10.9328Regular Plan Dividend Half
Yearly11.2237
Regular Plan Dividend Periodic 13.8968Direct Plan Growth - 21.2138Direct Plan Dividend - 11.5878Direct Plan Dividend Quarterly 10.7594Direct Plan Dividend Annual 11.9718Direct Plan Dividend Periodic 13.9008
Name Rating % of NAV
Government Bond 97.46%
7.88% - 2030 G-Sec SOV 29.79%
6.79% - 2029 G-Sec SOV 17.94%
7.61% - 2030 G-Sec SOV 15.16%
7.73% - 2034 G-Sec SOV 13.55%
7.59% - 2029 G-Sec SOV 7.41%
8.24% - 2033 G-Sec SOV 4.81%
8.32% - 2032 G-Sec SOV 3.47%
7.35% - 2024 G-Sec SOV 3.32%
7.72% - 2025 G-Sec SOV 2.01%
State Government Bond 0.51%
Name Rating % of NAV
8.52% Uttar Pradesh UDAY BOND - 2022 SOV 0.29%
7.68% Madhya Pradesh UDAY BOND - 2023
SOV 0.20%
8.21% Haryana UDAY BOND - 2022 SOV 0.02%
Net Cash and Cash Equivalent 2.02%
Grand Total 100.00%
Riskometer
Investors understand that theirprincipal will be at Moderate risk
This product is suitable for investors who are seeking*:
To generate long term optimal returns. •Investments in Government Securities and •Treasury Bills.
*Investors should consult their financial advisers if in doubt about whether the product is suitable for them.
Performance TableScheme Name CAGR Returns (%) Current Value of Investment of ` 10,000
1 Year 3 Years 5 YearsSince
Inception1 Year 3 Years 5 Years
SinceInception
IDFC Government Securities Fund – IP - Regular Plan - Growth*
11.61% 11.73% 10.71% 8.70% 11,167 13,954 16,635 20,597
I-Sec Composite Index# 9.22% 11.05% 9.84% 8.47% 10,927 13,698 15,994 20,225
CRISIL 10 Year GOI## 9.83% 11.15% 8.60% 6.34% 10,989 13,734 15,110 17,038
IDFC Government Securities Fund – IP - Direct Plan - Growth$
12.18% 12.52% NA 11.02% 11,225 14,249 NA 16,143
I-Sec Composite Index# 9.22% 11.05% NA 9.70% 10,927 13,698 NA 15,282
CRISIL 10 Year GOI## 9.83% 11.15% NA 8.24% 10,989 13,734 NA 14,374
The fund is being managed by Mr. Suyash Choudhary (Since 15th October 2010)Performance based on NAV as on 31/07/2017. Past performance may or may not be sustained in future.Regular and Direct Plans have different expense structure. Direct Plan shall have a lower expense ratio excluding distribution expenses, commission expenses etc.For other funds managed by the fund manager, please refer page no. 33 - 35 & the respective fund pages#Benchmark Returns. ##Alternate Benchmark Returns. *Since Inception Regular Plan - Growth Dec 03, 2008. $Since Inception Direct Plan - Growth Jan 01, 2013.
IDFC Government Securities Fund – Provident Fund PlanAn Open Ended Dedicated Gilt Fund
31st July 2017
Performance Table
Scheme Name CAGR Returns (%) Current Value of Investment of ` 10,000
1 Year 3 Years 5 Years Since Inception 1 Year 3 Years 5 Years Since Inception
IDFC Government Securities Fund - PF Plan - Regular Plan - Growth* 12.48% 12.59% 11.21% 8.67% 11,255 14,277 17,015 30,325
I-Sec Composite Index# 9.22% 11.05% 9.84% 7.68% 10,927 13,698 15,994 26,838
10 Year GOI## 9.83% 11.15% 8.60% 5.83% 10,989 13,734 15,110 21,307
IDFC Government Securities Fund - PF Plan - Direct Plan - Growth$ 12.88% 13.12% NA 11.47% 11,295 14,479 NA 16,443
I-Sec Composite Index# 9.22% 11.05% NA 9.70% 10,927 13,698 NA 15,282
10 Year GOI## 9.83% 11.15% NA 8.24% 10,989 13,734 NA 14,374
The fund is being managed by Mr. Suyash Choudhary (Since 15th October 2010). Performance based on NAV as on 31/07/2017. Past performance may or may not be sustained in future. Regular and Direct Plans have different expense structure. Direct Plan shall have a lower expense ratio excluding distribution expenses, commission expenses etc. For other funds managed by the fund manager, please refer page no. 33 - 35 & the respective fund pages. #Benchmark Returns. ##Alternate Benchmark Returns. *Since Inception Regular Plan - Growth Mar 29, 2004. $Since Inception Direct Plan - Growth Jan 01, 2013.
Maturity Bucket Asset Quality
Sovereign100.00%
% NAV
2.02
0.00
0.31
5.53
92.14
0 10 2030405060708090100
Upto 1 year
1-3 years
3-5 years
5-10 years
Above 10 years
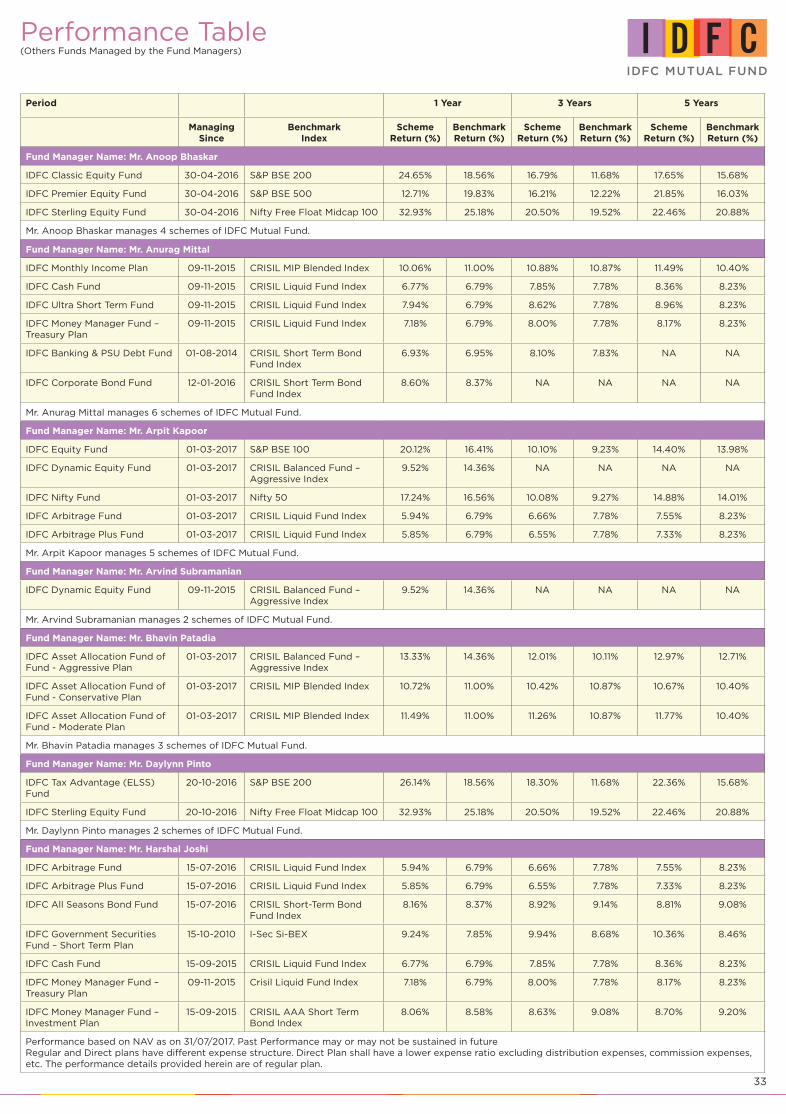
33
Period 1 Year 3 Years 5 Years
ManagingSince
BenchmarkIndex
SchemeReturn (%)
BenchmarkReturn (%)
SchemeReturn (%)
BenchmarkReturn (%)
SchemeReturn (%)
BenchmarkReturn (%)
Fund Manager Name: Mr. Anoop Bhaskar
IDFC Classic Equity Fund 30-04-2016 S&P BSE 200 24.65% 18.56% 16.79% 11.68% 17.65% 15.68%
IDFC Premier Equity Fund 30-04-2016 S&P BSE 500 12.71% 19.83% 16.21% 12.22% 21.85% 16.03%
IDFC Sterling Equity Fund 30-04-2016 Nifty Free Float Midcap 100 32.93% 25.18% 20.50% 19.52% 22.46% 20.88%
Mr. Anoop Bhaskar manages 4 schemes of IDFC Mutual Fund.
Fund Manager Name: Mr. Anurag Mittal
IDFC Monthly Income Plan 09-11-2015 CRISIL MIP Blended Index 10.06% 11.00% 10.88% 10.87% 11.49% 10.40%
IDFC Cash Fund 09-11-2015 CRISIL Liquid Fund Index 6.77% 6.79% 7.85% 7.78% 8.36% 8.23%
IDFC Ultra Short Term Fund 09-11-2015 CRISIL Liquid Fund Index 7.94% 6.79% 8.62% 7.78% 8.96% 8.23%
IDFC Money Manager Fund – Treasury Plan
09-11-2015 CRISIL Liquid Fund Index 7.18% 6.79% 8.00% 7.78% 8.17% 8.23%
IDFC Banking & PSU Debt Fund 01-08-2014 CRISIL Short Term Bond Fund Index
6.93% 6.95% 8.10% 7.83% NA NA
IDFC Corporate Bond Fund 12-01-2016 CRISIL Short Term Bond Fund Index
8.60% 8.37% NA NA NA NA
Mr. Anurag Mittal manages 6 schemes of IDFC Mutual Fund.
Fund Manager Name: Mr. Arpit Kapoor
IDFC Equity Fund 01-03-2017 S&P BSE 100 20.12% 16.41% 10.10% 9.23% 14.40% 13.98%
IDFC Dynamic Equity Fund 01-03-2017 CRISIL Balanced Fund – Aggressive Index
9.52% 14.36% NA NA NA NA
IDFC Nifty Fund 01-03-2017 Nifty 50 17.24% 16.56% 10.08% 9.27% 14.88% 14.01%
IDFC Arbitrage Fund 01-03-2017 CRISIL Liquid Fund Index 5.94% 6.79% 6.66% 7.78% 7.55% 8.23%
IDFC Arbitrage Plus Fund 01-03-2017 CRISIL Liquid Fund Index 5.85% 6.79% 6.55% 7.78% 7.33% 8.23%
Mr. Arpit Kapoor manages 5 schemes of IDFC Mutual Fund.
Fund Manager Name: Mr. Arvind Subramanian
IDFC Dynamic Equity Fund 09-11-2015 CRISIL Balanced Fund – Aggressive Index
9.52% 14.36% NA NA NA NA
Mr. Arvind Subramanian manages 2 schemes of IDFC Mutual Fund.
Fund Manager Name: Mr. Bhavin Patadia
IDFC Asset Allocation Fund of Fund - Aggressive Plan
01-03-2017 CRISIL Balanced Fund – Aggressive Index
13.33% 14.36% 12.01% 10.11% 12.97% 12.71%
IDFC Asset Allocation Fund of Fund - Conservative Plan
01-03-2017 CRISIL MIP Blended Index 10.72% 11.00% 10.42% 10.87% 10.67% 10.40%
IDFC Asset Allocation Fund of Fund - Moderate Plan
01-03-2017 CRISIL MIP Blended Index 11.49% 11.00% 11.26% 10.87% 11.77% 10.40%
Mr. Bhavin Patadia manages 3 schemes of IDFC Mutual Fund.
Fund Manager Name: Mr. Daylynn Pinto
IDFC Tax Advantage (ELSS) Fund
20-10-2016 S&P BSE 200 26.14% 18.56% 18.30% 11.68% 22.36% 15.68%
IDFC Sterling Equity Fund 20-10-2016 Nifty Free Float Midcap 100 32.93% 25.18% 20.50% 19.52% 22.46% 20.88%
Mr. Daylynn Pinto manages 2 schemes of IDFC Mutual Fund.
Fund Manager Name: Mr. Harshal Joshi
IDFC Arbitrage Fund 15-07-2016 CRISIL Liquid Fund Index 5.94% 6.79% 6.66% 7.78% 7.55% 8.23%
IDFC Arbitrage Plus Fund 15-07-2016 CRISIL Liquid Fund Index 5.85% 6.79% 6.55% 7.78% 7.33% 8.23%
IDFC All Seasons Bond Fund 15-07-2016 CRISIL Short-Term Bond Fund Index
8.16% 8.37% 8.92% 9.14% 8.81% 9.08%
IDFC Government Securities Fund – Short Term Plan
15-10-2010 I-Sec Si-BEX 9.24% 7.85% 9.94% 8.68% 10.36% 8.46%
IDFC Cash Fund 15-09-2015 CRISIL Liquid Fund Index 6.77% 6.79% 7.85% 7.78% 8.36% 8.23%
IDFC Money Manager Fund – Treasury Plan
09-11-2015 Crisil Liquid Fund Index 7.18% 6.79% 8.00% 7.78% 8.17% 8.23%
IDFC Money Manager Fund – Investment Plan
15-09-2015 CRISIL AAA Short Term Bond Index
8.06% 8.58% 8.63% 9.08% 8.70% 9.20%
Performance based on NAV as on 31/07/2017. Past Performance may or may not be sustained in futureRegular and Direct plans have different expense structure. Direct Plan shall have a lower expense ratio excluding distribution expenses, commission expenses, etc. The performance details provided herein are of regular plan.
Performance Table (Others Funds Managed by the Fund Managers)

34
Period 1 Year 3 Years 5 Years
ManagingSince
BenchmarkIndex
SchemeReturn (%)
BenchmarkReturn (%)
SchemeReturn (%)
BenchmarkReturn (%)
SchemeReturn (%)
BenchmarkReturn (%)
IDFC Yearly Series Interval Fund - Series II - Regular Plan - Growth
12-02-2013 CRISIL Short-Term Bond Fund Index
7.13% 8.37% 8.29% 9.14% NA NA
IDFC Yearly Series Interval Fund - Series II - Direct Plan - Growth
12-02-2013 CRISIL Short-Term Bond Fund Index
7.25% 8.37% 8.46% 9.14% NA NA
IDFC Fixed Term Plan - Series 27 - Growth
21-08-2013 CRISIL Short-Term Bond Fund Index
7.09% 8.37% 8.26% 9.14% NA NA
IDFC Fixed Term Plan - Series 27 - Direct Plan - Growth
21-08-2013 CRISIL Short-Term Bond Fund Index
7.19% 8.37% 8.37% 9.14% NA NA
IDFC Fixed Term Plan - Series ^66 - Growth
23-01-2014 CRISIL Composite Bond Fund Index
7.84% 9.94% 8.29% 10.14% NA NA
IDFC Fixed Term Plan - Series ^66 - Direct Plan - Growth
23-01-2014 CRISIL Composite Bond Fund Index
8.24% 9.94% 8.70% 10.14% NA NA
^IDFC Fixed Term Plan - Series 70 - Growth
07-02-2014 CRISIL Composite Bond Fund Index
7.71% 9.94% 8.20% 10.14% NA NA
^IDFC Fixed Term Plan - Series 70 - Direct Plan - Growth
07-02-2014 CRISIL Composite Bond Fund Index
8.06% 9.94% 8.61% 10.14% NA NA
^IDFC Fixed Term Plan - Series 74 - Growth
21-02-2014 CRISIL Composite Bond Fund Index
7.88% 9.94% 8.37% 10.14% NA NA
^IDFC Fixed Term Plan - Series 74 - Direct Plan - Growth
21-02-2014 CRISIL Composite Bond Fund Index
8.25% 9.94% 8.78% 10.14% NA NA
^IDFC Fixed Term Plan - Series 75 - Growth
26-02-2014 CRISIL Composite Bond Fund Index
7.88% 9.94% 8.36% 10.14% NA NA
^IDFC Fixed Term Plan - Series 75 - Direct Plan - Growth
26-02-2014 CRISIL Composite Bond Fund Index
8.23% 9.94% 8.75% 10.14% NA NA
^IDFC Fixed Term Plan - Series 77 - Growth
05-03-2014 CRISIL Composite Bond Fund Index
7.90% 9.94% 8.45% 10.14% NA NA
^IDFC Fixed Term Plan - Series 77 - Direct Plan - Growth
05-03-2014 CRISIL Composite Bond Fund Index
8.24% 9.94% 8.76% 10.14% NA NA
IDFC Fixed Term Plan - Series 78 - Growth
11-03-2014 CRISIL Short-Term Bond Fund Index
7.75% 8.37% 8.49% 9.14% NA NA
IDFC Fixed Term Plan - Series 78 - Direct Plan - Growth
11-03-2014 CRISIL Short-Term Bond Fund Index
7.96% 8.37% 8.69% 9.14% NA NA
^IDFC Fixed Term Plan - Series 79 - Growth
14-03-2014 CRISIL Composite Bond Fund Index
7.88% 9.94% 8.38% 10.14% NA NA
^IDFC Fixed Term Plan - Series 79 - Direct Plan - Growth
14-03-2014 CRISIL Composite Bond Fund Index
8.23% 9.94% 8.78% 10.14% NA NA
^^IDFC Fixed Term Plan - Series 84 - Growth
12-03-2014 CRISIL Composite Bond Fund Index
7.89% 9.94% 8.37% 10.07% NA NA
^^IDFC Fixed Term Plan - Series 84 - Direct Plan - Growth
12-03-2014 CRISIL Composite Bond Fund Index
8.24% 9.94% 8.68% 10.07% NA NA
^^IDFC Fixed Term Plan - Series 86 - Growth
19-03-2014 CRISIL Composite Bond Fund Index
7.85% 9.94% 8.29% 10.07% NA NA
^^IDFC Fixed Term Plan - Series 86 - Direct Plan - Growth
19-03-2014 CRISIL Composite Bond Fund Index
8.19% 9.94% 8.65% 10.07% NA NA
^^IDFC Fixed Term Plan - Series 88 - Growth
26-03-2014 CRISIL Composite Bond Fund Index
7.96% 9.94% 8.48% 10.07% NA NA
^^IDFC Fixed Term Plan - Series 88 - Direct Plan - Growth
26-03-2014 CRISIL Composite Bond Fund Index
8.30% 9.94% 8.77% 10.07% NA NA
^^^IDFC Fixed Term Plan - Series 91 - Growth
16-04-2014 CRISIL Composite Bond Fund Index
8.18% 9.94% 8.64% 10.15% NA NA
^^^IDFC Fixed Term Plan - Series 91 - Direct Plan - Growth
16-04-2014 CRISIL Composite Bond Fund Index
8.29% 9.94% 8.78% 10.15% NA NA
IDFC Fixed Term Plan - Series 97 - Growth
03-06-2014 CRISIL Short-Term Bond Fund Index
6.52% 8.37% 8.01% 9.14% NA NA
IDFC Fixed Term Plan - Series 97 - Direct Plan - Growth
03-06-2014 CRISIL Short-Term Bond Fund Index
7.07% 8.37% 8.34% 9.14% NA NA
IDFC Fixed Term Plan - Series 99 - Growth
12-06-2014 CRISIL Short-Term Bond Fund Index
7.05% 8.37% 8.15% 9.14% NA NA
IDFC Fixed Term Plan - Series 99 - Direct Plan - Growth
12-06-2014 CRISIL Short-Term Bond Fund Index
7.16% 8.37% 8.29% 9.14% NA NA
Performance based on NAV as on 31/07/2017. Past Performance may or may not be sustained in futureRegular and Direct plans have different expense structure. Direct Plan shall have a lower expense ratio excluding distribution expenses, commission expenses, etc. The performance details provided herein are of regular plan. ^ Current Index performance adjusted for the period from since inception to April 8, 2015 with the performance of Crisil Short Term Bond fund index (Benchmark) & 1 year T Bill Index (Alternate Benchmark). ^^ Current Index performance adjusted for the period from since inception to April 6, 2015 with th e performance of Crisil Short Term Bond fund index (Benchmark) & 1 year T Bill Index (Alternate Benchmark) . ^^^Current Index performance adjusted for the period from since inception to April 20, 2015 with the performance of Crisil Short Term Bond fund index (Benchmark) & 1 year T Bill Index (Alternate Benchmark)
Performance Table (Others Funds Managed by the Fund Managers)

35
Period 1 Year 3 Years 5 Years
ManagingSince
BenchmarkIndex
SchemeReturn (%)
BenchmarkReturn (%)
SchemeReturn (%)
BenchmarkReturn (%)
SchemeReturn (%)
BenchmarkReturn (%)
IDFC Fixed Term Plan - Series 108 - Growth
08-05-2015 CRISIL Composite Bond Fund Index
7.13% 9.94% NA NA NA NA
IDFC Fixed Term Plan - Series 108 - Direct Plan - Growth
08-05-2015 CRISIL Composite Bond Fund Index
8.22% 9.94% NA NA NA NA
Mr. Harshal Joshi manages 43 schemes of IDFC Mutual Fund.
Fund Manager Name: Mr. Rajendra Kumar Mishra
IDFC Infrastructure Fund 27-06-2013 Nifty Infrastructure 41.12% 14.57% 18.67% 2.44% 14.97% 7.68%
Mr. Rajendra Kumar Mishra manages 1 scheme of IDFC Mutual Fund.
Fund Manager Name: Mr. Sumit Agrawal
IDFC Equity Fund 01-03-2017 S&P BSE 100 20.12% 16.41% 10.10% 9.23% 14.40% 13.98%
IDFC Dynamic Equity Fund 01-03-2017 CRISIL Balanced Fund – Aggressive Index
9.52% 14.36% NA NA NA NA
IDFC Nifty Fund 01-03-2017 Nifty 50 17.24% 16.56% 10.08% 9.27% 14.88% 14.01%
IDFC Focused Equity Fund 20-10-2016 Nifty 50 32.72% 16.56% 13.94% 9.27% 15.38% 14.01%
IDFC Monthly Income Plan 20-10-2016 CRISIL MIP Blended Index 10.06% 11.00% 10.88% 10.87% 11.49% 10.40%
Mr. Sumit Agrawal manages 5 schemes of IDFC Mutual Fund.
Fund Manager Name: Mr. Suyash Choudhary
IDFC Super Saver Income Fund – Short Term
11-03-2011 CRISIL AAA Short Term Bond Index
7.68% 8.58% 8.60% 9.08% 8.59% 9.20%
IDFC Super Saver Income Fund – Medium Term
15-09-2015 CRISIL Short-Term Bond Fund Index
8.42% 8.37% 9.12% 9.14% 8.55% 9.08%
IDFC Super Saver Income Fund – Investment Plan
15-10-2010 CRISIL Composite Bond Fund Index
10.62% 9.94% 10.99% 11.00% 9.72% 9.61%
IDFC Dynamic Bond Fund 15-10-2010 CRISIL Composite Bond Fund Index
10.88% 9.94% 11.23% 11.00% 9.91% 9.61%
IDFC Government Securities Fund – Investment Plan
15-10-2010 I-Sec Composite Index 11.61% 9.22% 11.73% 11.05% 10.71% 9.84%
IDFC Government Securities Fund – Provident Fund Plan
15-10-2010 I-Sec Composite Index 12.48% 9.22% 12.59% 11.05% 11.21% 9.84%
Mr. Suyash Choudhary manages 7 schemes of IDFC Mutual Fund.
Fund Manager Name: Mr. Yogik Pitti
IDFC Arbitrage Fund 27-06-2013 CRISIL Liquid Fund Index 5.94% 6.79% 6.66% 7.78% 7.55% 8.23%
IDFC Arbitrage Plus Fund 27-06-2013 CRISIL Liquid Fund Index 5.85% 6.79% 6.55% 7.78% 7.33% 8.23%
Mr. Yogik Pitti manages 4 schemes of IDFC Mutual Fund.Performance based on NAV as on 31/07/2017. Past Performance may or may not be sustained in futureRegular and Direct plans have different expense structure. Direct Plan shall have a lower expense ratio excluding distribution expenses, commission expenses, etc. The performance details provided herein are of regular plan.
Performance Table (Others Funds Managed by the Fund Managers)
ICRA Credit Risk Rating
IDFC MMF-TP, IDFC MMF-IP, IDFC SSIF-ST, SSIF-MT, IDFC CBF : “Credit Risk Rating AAAmfs” - The Fund carries the lowest credit risk, similar to that associated with long-term debt obligations rated in the highest credit- quality category.
IDFC CASH FUND, IDFC USTF: “Credit Risk Rating A1+mfs” - The highest-credit-quality short-term rating assigned by ICRA to debt funds. Debt funds rated in this category carry the lowest credit risk in the short term and are similar to that of fixed income obligations of highest credit- quality category with maturity of upto one year. This rating should however, not be construed as an indication of the performance of the Mutual Fund scheme or of volatility in its returns.
Source: ICRA Ltd.
CRISIL Credit Quality Rating
IDFC SSIF-IP, IDFC DBF: “CRISIL AAA mfs” - Schemes with this rating are considered to have the highest degree of safety regarding timely receipt of payments from the investments that they have made. The rating of CRISIL is not an opinion on the Asset Management Company’s willingness or ability to make timely payments to the investor. The rating is also not an opinion on the stability of the NAV of the Fund, which could vary with market developments.
CRISIL Credit Quality Rating Methodology
CRISIL’s credit quality ratings are based on the analysis of the credit risk of securities held by the fund. CRISIL has developed a Credit Quality Matrix to evaluate fund’s overall level of protection against losses associated with credit default. The matrix is a set of credit factors and credit scores derived scientifically from CRISIL’s rating default and transition rates. For details on closed ended funds, please refer the website www.idfcmf.com
FITCH Credit Quality Rating
IDFC Cash fund: “IND A1+ mfs” - Schemes with this rating are considered to have very strong degree of safety regarding timely receipt of payments from the investments that they have made.

36
IDFC All Seasons Bond Fund - Regular Plan - Growth 1 Year 3 Years 5 Years 7 Years 10 Years Since InceptionSep 13, 2004
Total Amount Invested (`) 1,20,000 3,60,000 6,00,000 8,40,000 12,00,000 15,50,000
Total Value as on July 31, 2017 (`) 1,25,138 4,09,752 7,49,154 11,46,999 18,43,972 26,98,669
Fund Returns (%) 8.07 8.60 8.82 8.76 8.33 8.19
Total Value of CRISIL Short Term Bond Fund Index# 1,25,119 4,11,229 7,53,856 11,57,729 18,70,685 27,18,606
CRISIL Short Term Bond Fund Index Returns (%)# 8.04 8.85 9.07 9.02 8.60 8.30
Total Value of CRISIL 1 Year T-Bill Index## 1,23,836 4,00,261 7,21,002 10,89,025 17,06,800 24,12,029
CRISIL 1 Year T-Bill Index Returns (%)## 6.01 7.02 7.29 7.30 6.85 6.58
SIP PerformanceMonthly SIP of `10,000
IDFC Cash Fund - Regular Plan - Growth 1 Year 3 Years 5 Years 7 Years 10 Years Since InceptionJun 04, 2008
Total Amount Invested (`) 1,20,000 3,60,000 6,00,000 8,40,000 NA 11,00,000
Total Value as on July 31, 2017 (`) 1,24,278 4,02,631 7,33,101 11,27,606 NA 16,14,997
Fund Returns (%) 6.69 7.41 7.95 8.28 NA 8.15
Total Value of Crisil Liquid Fund Index# 1,24,326 4,02,411 7,32,412 11,20,867 NA 15,95,662
Crisil Liquid Fund Index Returns (%)# 6.77 7.37 7.91 8.11 NA 7.90
Total Value of CRISIL 1 Year T-Bill Index## 1,23,864 4,00,314 7,21,051 10,89,138 NA 15,24,259
CRISIL 1 Year T-Bill Index Returns (%)## 6.04 7.02 7.29 7.30 NA 6.94
IDFC Ultra Short Term Fund - Regular Plan - Growth 1 Year 3 Years 5 Years 7 Years 10 Years Since InceptionJan 17, 2006
Total Amount Invested (`) 1,20,000 3,60,000 6,00,000 8,40,000 12,00,000 13,90,000
Total Value as on July 31, 2017 (`) 1,24,982 4,08,566 7,47,365 11,55,510 18,69,959 23,00,415
Fund Returns (%) 7.83 8.40 8.72 8.97 8.59 8.35
Total Value of Crisil Liquid Fund Index# 1,24,320 4,02,389 7,32,386 11,20,812 17,97,998 22,15,737
Crisil Liquid Fund Index Returns (%)# 6.78 7.37 7.91 8.11 7.85 7.75
Total Value of CRISIL 1 Year T-Bill Index## 1,23,836 4,00,261 7,21,002 10,89,025 17,06,845 20,77,706
CRISIL 1 Year T-Bill Index Returns (%)## 6.01 7.02 7.29 7.30 6.85 6.70
IDFC Money Manager Fund - Investment Plan - Regular Plan - Growth
1 Year 3 Years 5 Years 7 Years 10 Years Since InceptionAug 09, 2004
Total Amount Invested (`) 1,20,000 3,60,000 6,00,000 8,40,000 12,00,000 15,60,000
Total Value as on July 31, 2017 (`) 1,25,003 4,08,909 7,45,726 11,46,947 18,57,372 27,31,255
Fund Returns (%) 7.86 8.46 8.64 8.76 8.46 8.22
Total Value of CRISIL AAA Short Term Index# 1,25,485 4,11,339 7,53,630 11,62,283 19,12,336 28,60,967
CRISIL AAA Short Term Index Returns (%)# 8.63 8.86 9.06 9.13 9.02 8.87
Total Value of CRISIL 1 Year T-Bill Index## 1,23,836 4,00,261 7,21,002 10,89,025 17,06,800 24,33,546
CRISIL 1 Year T-Bill Index Returns (%)## 6.01 7.02 7.29 7.30 6.85 6.57
IDFC Money Manager Fund - Treasury Plan - Regular Plan - Growth
1 Year 3 Years 5 Years 7 Years 10 Years Since InceptionFeb 18, 2003
Total Amount Invested (`) 1,20,000 3,60,000 6,00,000 8,40,000 12,00,000 17,40,000
Total Value as on July 31, 2017 (`) 1,24,493 4,04,571 7,34,741 11,22,889 18,02,119 30,70,073
Fund Returns (%) 7.05 7.74 8.04 8.16 7.89 7.44
Total Value of Crisil Liquid Fund Index# 1,24,320 4,02,389 7,32,386 11,20,812 17,97,985 30,75,350
Crisil Liquid Fund Index Returns (%)# 6.78 7.37 7.91 8.11 7.85 7.46
Total Value of CRISIL 1 Year T-Bill Index## 1,23,836 4,00,261 7,21,002 10,89,025 17,06,801 28,33,603
CRISIL 1 Year T-Bill Index Returns (%)## 6.01 7.02 7.29 7.30 6.85 6.42
IDFC Banking & PSU Debt Fund - Regular Plan - Growth 1 Year 3 Years 5 Years 7 Years 10 Years Since InceptionMar 07, 2013
Total Amount Invested (`) 1,20,000 3,60,000 NA NA NA 5,30,000
Total Value as on July 31, 2017 (`) 1,24,569 4,04,382 NA NA NA 6,33,906
Fund Returns (%) 7.17 7.71 NA NA NA 8.06
Total Value of Crisil Short Term Bond Fund Index# 1,24,522 4,02,998 NA NA NA 6,31,314
Crisil Short Term Bond Fund Index Returns (%)# 7.10 7.48 NA NA NA 7.87
Total Value of CRISIL 1 Year T-Bill Index## 1,23,836 4,00,261 NA NA NA 6,23,204
CRISIL 1 Year T-Bill Index Returns (%)## 6.01 7.02 NA NA NA 7.29
IDFC Super Saver Income Fund - Short Term - Regular Plan - Growth
1 Year 3 Years 5 Years 7 Years 10 Years Since InceptionDec 14, 2000
Total Amount Invested (`) 1,20,000 3,60,000 6,00,000 8,40,000 12,00,000 15,40,000
Total Value as on July 31, 2017 (`) 1,24,861 4,07,512 7,43,239 11,40,605 18,48,573 26,86,740
Fund Returns (%) 7.63 8.23 8.50 8.60 8.37 8.28
Total Value of CRISIL AAA Short Term Index# 1,25,485 4,11,339 7,53,630 11,62,283 19,12,336 28,04,405
CRISIL AAA Short Term Index Returns (%)# 8.63 8.86 9.06 9.13 9.02 8.89
Total Value of CRISIL 1 Year T-Bill Index## 1,23,836 4,00,261 7,21,002 10,89,025 17,06,800 23,90,619
CRISIL 1 Year T-Bill Index Returns (%)## 6.01 7.02 7.29 7.30 6.85 6.59
Past performance may or may not be sustained in future.Dividends are assumed to be reinvested and bonus is adjusted. Load is not taken into consideration. To illustrate the advantages of SIP investment, this is how your investment would have grown if you had invested say `10,000 systematically on the first business Day of every month over a period of time. Returns are calculated by using XIRR approach. XIRR helps in calculating return on investment given an initial and final value and a series of cash inflows and outflows with the correct allowance for the time impact of the transactions. Regular and Direct plans have different expense structure. Direct Plan shall have a lower expense ratio excluding distribution expenses, commision expenses etc. #Benchmark Returns. ##Alternate Benchmark Returns. Data as on July 31, 2017.

37
IDFC Corporate Bond Fund - Regular Plan - Growth 1 Year 3 Years 5 Years 7 Years 10 Years Since InceptionJan 12, 2016
Total Amount Invested (`) 1,20,000 NA NA NA NA 1,90,000
Total Value as on July 31, 2017 (`) 1,25,208 NA NA NA NA 2,04,335
Fund Returns (%) 8.19 NA NA NA NA 9.09
Total Value of CRISIL Short Term Bond Fund Index# 1,25,119 NA NA NA NA 2,03,660
CRISIL Short Term Bond Fund Index Returns (%)# 8.04 NA NA NA NA 8.66
Total Value of CRISIL 1 Year T-Bill Index## 1,23,836 NA NA NA NA 2,00,103
CRISIL 1 Year T-Bill Index Returns (%)## 6.01 NA NA NA NA 6.41
IDFC Super Saver Income Fund - Medium Term Plan - Regular Plan - Growth
1 Year 3 Years 5 Years 7 Years 10 Years Since InceptionJuly 08, 2003
Total Amount Invested (`) 1,20,000 3,60,000 6,00,000 8,40,000 12,00,000 16,90,000
Total Value as on July 31, 2017 (`) 1,25,067 4,10,429 7,46,800 11,45,283 18,85,189 31,67,796
Fund Returns (%) 7.96 8.71 8.69 8.72 8.75 8.45
Total Value of CRISIL Short Term Bond Fund Index# 1,25,119 4,11,229 7,53,856 11,57,729 18,70,685 30,86,399
CRISIL Short Term Bond Fund Index Returns (%)# 8.04 8.85 9.07 9.02 8.60 8.11
Total Value of CRISIL 1 Year T-Bill Index## 1,23,836 4,00,261 7,21,002 10,89,025 17,06,800 27,19,285
CRISIL 1 Year T-Bill Index Returns (%)## 6.01 7.02 7.29 7.30 6.85 6.46
IDFC Super Saver Income Fund - Investment Plan - Regular Plan - Growth
1 Year 3 Years 5 Years 7 Years 10 Years Since InceptionJul 14, 2000
Total Amount Invested (`) 1,20,000 3,60,000 6,00,000 8,40,000 12,00,000 20,40,000
Total Value as on July 31, 2017 (`) 1,25,913 4,19,203 7,70,419 11,89,133 19,27,892 44,08,579
Fund Returns (%) 9.31 10.16 9.94 9.77 9.17 8.44
Total Value of CRISIL Composite Bond Fund Index# 1,25,859 4,21,248 7,76,988 11,89,212 19,05,663 NA
CRISIL Composite Bond Fund Index Returns (%)# 9.22 10.49 10.29 9.77 8.95 NA
Total Value of CRISIL 10 Year Gilt Index## 1,25,140 4,20,237 7,62,916 11,49,337 17,97,743 NA
CRISIL 10 Year Gilt Index Returns (%)## 8.08 10.32 9.55 8.82 7.84 NA
IDFC Dynamic Bond Fund - Regular Plan - Growth 1 Year 3 Years 5 Years 7 Years 10 Years Since InceptionDec 03, 2008
Total Amount Invested (`) 1,20,000 3,60,000 6,00,000 8,40,000 NA 10,40,000
Total Value as on July 31, 2017 (`) 1,26,052 4,20,598 7,74,452 12,04,905 NA 15,98,799
Fund Returns (%) 9.53 10.38 10.15 10.14 NA 9.67
Total Value of CRISIL Composite Bond Fund Index# 1,25,859 4,21,248 7,76,988 11,89,212 NA 15,67,598
CRISIL Composite Bond Fund Index Returns (%)# 9.22 10.49 10.29 9.77 NA 9.23
Total Value of CRISIL 10 Year Gilt Index## 1,25,140 4,20,237 7,62,916 11,49,337 NA 14,84,643
CRISIL 10 Year Gilt Index Returns (%)## 8.08 10.32 9.55 8.82 NA 8.02
IDFC G Sec Fund - Investment Plan - Regular Plan - Growth 1 Year 3 Years 5 Years 7 Years 10 Years Since InceptionDec 03, 2008
Total Amount Invested (`) 1,20,000 3,60,000 6,00,000 8,40,000 NA 10,40,000
Total Value as on July 31, 2017 (`) 1,26,535 4,24,156 7,86,304 12,33,812 NA 16,39,103
Fund Returns (%) 10.30 10.96 10.77 10.80 NA 10.22
Total Value of I-Sec Composite Index# 1,25,247 4,20,189 7,77,402 11,99,359 NA 15,84,479
I-Sec Composite Index Returns (%)# 8.25 10.32 10.31 10.01 NA 9.47
Total Value of CRISIL 10 Year Gilt Index## 1,25,140 4,20,237 7,62,916 11,49,337 NA 14,84,643
CRISIL 10 Year Gilt Index Returns (%)## 8.08 10.32 9.55 8.82 NA 8.02
SIP PerformanceMonthly SIP of `10,000
IDFC G Sec Fund - PF Plan - Regular Plan - Growth 1 Year 3 Years 5 Years 7 Years 10 Years Since InceptionMar 29, 2004
Total Amount Invested (`) 1,20,000 3,60,000 6,00,000 8,40,000 12,00,000 16,10,000
Total Value as on July 31, 2017 (`) 1,27,082 4,29,559 8,00,408 12,56,656 20,70,332 32,70,211
Fund Returns (%) 11.18 11.83 11.48 11.32 10.52 9.97
Total Value of I-SEC Composite Index# 1,25,247 4,20,189 7,77,402 11,99,359 19,47,721 30,16,341
I-SEC Composite Index Returns (%)# 8.25 10.32 10.31 10.01 9.36 8.88
Total Value of CRISIL 10 Year Gilt Index## 1,25,140 4,20,237 7,62,916 11,49,337 17,97,743 26,93,528
CRISIL 10 Year Gilt Index Returns (%)## 8.08 10.32 9.55 8.82 7.84 7.33
IDFC G Sec Fund - Short Term Plan - Regular Plan - Growth 1 Year 3 Years 5 Years 7 Years 10 Years Since InceptionMar 09, 2002
Total Amount Invested (`) 1,20,000 3,60,000 6,00,000 8,40,000 12,00,000 18,50,000
Total Value as on July 31, 2017 (`) 1,26,002 4,15,656 7,73,304 11,84,656 18,45,091 32,42,182
Fund Returns (%) 9.45 9.57 10.09 9.66 8.34 6.90
Total Value of I-SEC Si-Bex# 1,24,717 4,08,376 7,43,368 11,36,495 18,33,262 NA
I-SEC Si-Bex Returns (%)# 7.41 8.37 8.51 8.50 8.21 NA
Total Value of CRISIL 1 Year T-Bill Index## 1,23,836 4,00,261 7,21,002 10,89,025 17,06,800 30,95,706
CRISIL 1 Year T-Bill Index Returns (%)## 6.01 7.02 7.29 7.30 6.85 6.35
Past performance may or may not be sustained in future.Dividends are assumed to be reinvested and bonus is adjusted. Load is not taken into consideration. To illustrate the advantages of SIP investment, this is how your investment would have grown if you had invested say `10,000 systematically on the first business Day of every month over a period of time. Returns are calculated by using XIRR approach. XIRR helps in calculating return on investment given an initial and final value and a series of cash inflows and outflows with the correct allowance for the time impact of the transactions. Regular and Direct plans have different expense structure. Direct Plan shall have a lower expense ratio excluding distribution expenses, commision expenses etc. #Benchmark Returns. ##Alternate Benchmark Returns. Data as on July 31, 2017.
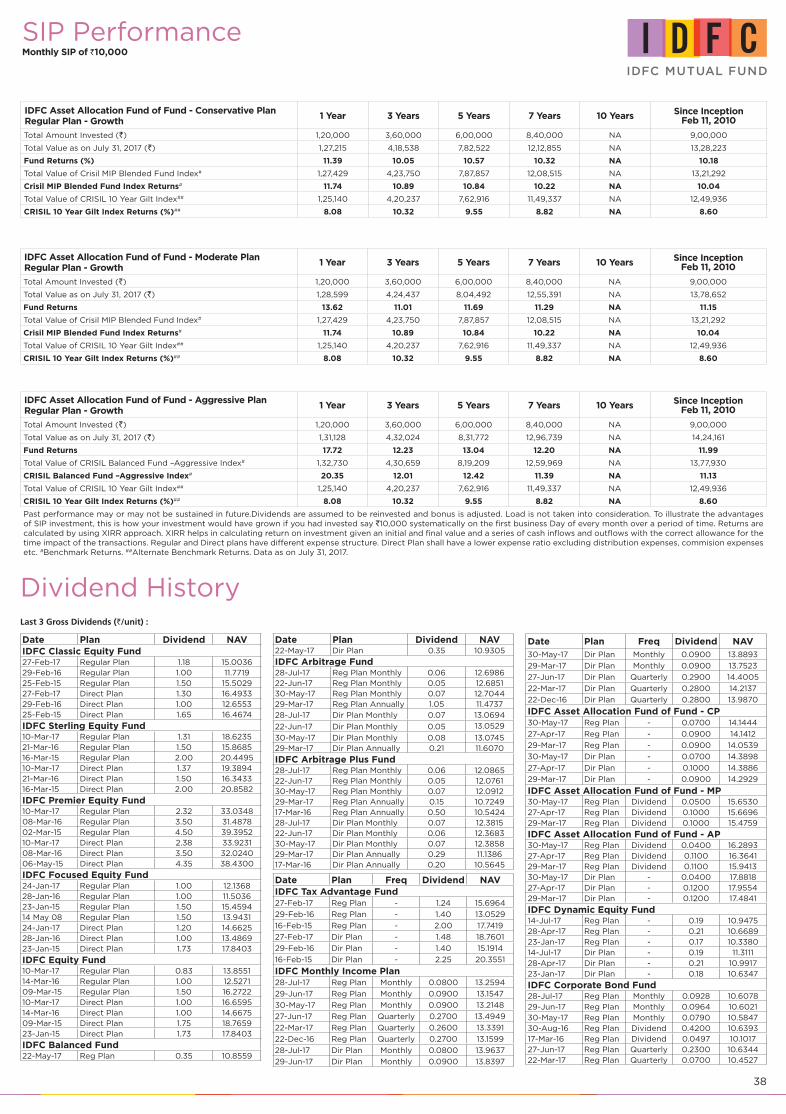
38
SIP PerformanceMonthly SIP of `10,000
IDFC Asset Allocation Fund of Fund - Conservative Plan Regular Plan - Growth
1 Year 3 Years 5 Years 7 Years 10 Years Since InceptionFeb 11, 2010
Total Amount Invested (`) 1,20,000 3,60,000 6,00,000 8,40,000 NA 9,00,000
Total Value as on July 31, 2017 (`) 1,27,215 4,18,538 7,82,522 12,12,855 NA 13,28,223
Fund Returns (%) 11.39 10.05 10.57 10.32 NA 10.18
Total Value of Crisil MIP Blended Fund Index# 1,27,429 4,23,750 7,87,857 12,08,515 NA 13,21,292
Crisil MIP Blended Fund Index Returns# 11.74 10.89 10.84 10.22 NA 10.04
Total Value of CRISIL 10 Year Gilt Index## 1,25,140 4,20,237 7,62,916 11,49,337 NA 12,49,936
CRISIL 10 Year Gilt Index Returns (%)## 8.08 10.32 9.55 8.82 NA 8.60
IDFC Asset Allocation Fund of Fund - Moderate Plan Regular Plan - Growth
1 Year 3 Years 5 Years 7 Years 10 Years Since InceptionFeb 11, 2010
Total Amount Invested (`) 1,20,000 3,60,000 6,00,000 8,40,000 NA 9,00,000
Total Value as on July 31, 2017 (`) 1,28,599 4,24,437 8,04,492 12,55,391 NA 13,78,652
Fund Returns 13.62 11.01 11.69 11.29 NA 11.15
Total Value of Crisil MIP Blended Fund Index# 1,27,429 4,23,750 7,87,857 12,08,515 NA 13,21,292
Crisil MIP Blended Fund Index Returns# 11.74 10.89 10.84 10.22 NA 10.04
Total Value of CRISIL 10 Year Gilt Index## 1,25,140 4,20,237 7,62,916 11,49,337 NA 12,49,936
CRISIL 10 Year Gilt Index Returns (%)## 8.08 10.32 9.55 8.82 NA 8.60
IDFC Asset Allocation Fund of Fund - Aggressive Plan Regular Plan - Growth
1 Year 3 Years 5 Years 7 Years 10 Years Since InceptionFeb 11, 2010
Total Amount Invested (`) 1,20,000 3,60,000 6,00,000 8,40,000 NA 9,00,000
Total Value as on July 31, 2017 (`) 1,31,128 4,32,024 8,31,772 12,96,739 NA 14,24,161
Fund Returns 17.72 12.23 13.04 12.20 NA 11.99
Total Value of CRISIL Balanced Fund –Aggressive Index# 1,32,730 4,30,659 8,19,209 12,59,969 NA 13,77,930
CRISIL Balanced Fund –Aggressive Index# 20.35 12.01 12.42 11.39 NA 11.13
Total Value of CRISIL 10 Year Gilt Index## 1,25,140 4,20,237 7,62,916 11,49,337 NA 12,49,936
CRISIL 10 Year Gilt Index Returns (%)## 8.08 10.32 9.55 8.82 NA 8.60
Past performance may or may not be sustained in future.Dividends are assumed to be reinvested and bonus is adjusted. Load is not taken into consideration. To illustrate the advantages of SIP investment, this is how your investment would have grown if you had invested say `10,000 systematically on the first business Day of every month over a period of time. Returns are calculated by using XIRR approach. XIRR helps in calculating return on investment given an initial and final value and a series of cash inflows and outflows with the correct allowance for the time impact of the transactions. Regular and Direct plans have different expense structure. Direct Plan shall have a lower expense ratio excluding distribution expenses, commision expenses etc. #Benchmark Returns. ##Alternate Benchmark Returns. Data as on July 31, 2017.
Last 3 Gross Dividends (`/unit) :
Dividend History
Date Plan Dividend NAVIDFC Classic Equity Fund27-Feb-17 Regular Plan 1.18 15.003629-Feb-16 Regular Plan 1.00 11.771925-Feb-15 Regular Plan 1.50 15.502927-Feb-17 Direct Plan 1.30 16.493329-Feb-16 Direct Plan 1.00 12.655325-Feb-15 Direct Plan 1.65 16.4674
IDFC Sterling Equity Fund10-Mar-17 Regular Plan 1.31 18.623521-Mar-16 Regular Plan 1.50 15.868516-Mar-15 Regular Plan 2.00 20.449510-Mar-17 Direct Plan 1.37 19.389421-Mar-16 Direct Plan 1.50 16.343316-Mar-15 Direct Plan 2.00 20.8582
IDFC Premier Equity Fund10-Mar-17 Regular Plan 2.32 33.034808-Mar-16 Regular Plan 3.50 31.487802-Mar-15 Regular Plan 4.50 39.395210-Mar-17 Direct Plan 2.38 33.923108-Mar-16 Direct Plan 3.50 32.024006-May-15 Direct Plan 4.35 38.4300
IDFC Focused Equity Fund24-Jan-17 Regular Plan 1.00 12.136828-Jan-16 Regular Plan 1.00 11.503623-Jan-15 Regular Plan 1.50 15.459414 May 08 Regular Plan 1.50 13.943124-Jan-17 Direct Plan 1.20 14.662528-Jan-16 Direct Plan 1.00 13.486923-Jan-15 Direct Plan 1.73 17.8403
IDFC Equity Fund10-Mar-17 Regular Plan 0.83 13.855114-Mar-16 Regular Plan 1.00 12.527109-Mar-15 Regular Plan 1.50 16.272210-Mar-17 Direct Plan 1.00 16.659514-Mar-16 Direct Plan 1.00 14.667509-Mar-15 Direct Plan 1.75 18.765923-Jan-15 Direct Plan 1.73 17.8403
IDFC Balanced Fund22-May-17 Reg Plan 0.35 10.8559
Date Plan Dividend NAV22-May-17 Dir Plan 0.35 10.9305
IDFC Arbitrage Fund28-Jul-17 Reg Plan Monthly 0.06 12.698622-Jun-17 Reg Plan Monthly 0.05 12.685130-May-17 Reg Plan Monthly 0.07 12.704429-Mar-17 Reg Plan Annually 1.05 11.4737
28-Jul-17 Dir Plan Monthly 0.07 13.0694
22-Jun-17 Dir Plan Monthly 0.05 13.0529
30-May-17 Dir Plan Monthly 0.08 13.074529-Mar-17 Dir Plan Annually 0.21 11.6070
IDFC Arbitrage Plus Fund28-Jul-17 Reg Plan Monthly 0.06 12.086522-Jun-17 Reg Plan Monthly 0.05 12.076130-May-17 Reg Plan Monthly 0.07 12.091229-Mar-17 Reg Plan Annually 0.15 10.724917-Mar-16 Reg Plan Annually 0.50 10.542428-Jul-17 Dir Plan Monthly 0.07 12.381522-Jun-17 Dir Plan Monthly 0.06 12.368330-May-17 Dir Plan Monthly 0.07 12.385829-Mar-17 Dir Plan Annually 0.29 11.138617-Mar-16 Dir Plan Annually 0.20 10.5645
Date Plan Freq Dividend NAVIDFC Tax Advantage Fund27-Feb-17 Reg Plan - 1.24 15.6964
29-Feb-16 Reg Plan - 1.40 13.0529
16-Feb-15 Reg Plan - 2.00 17.7419
27-Feb-17 Dir Plan - 1.48 18.7601
29-Feb-16 Dir Plan - 1.40 15.1914
16-Feb-15 Dir Plan - 2.25 20.3551
IDFC Monthly Income Plan28-Jul-17 Reg Plan Monthly 0.0800 13.2594
29-Jun-17 Reg Plan Monthly 0.0900 13.1547
30-May-17 Reg Plan Monthly 0.0900 13.2148
27-Jun-17 Reg Plan Quarterly 0.2700 13.4949
22-Mar-17 Reg Plan Quarterly 0.2600 13.3391
22-Dec-16 Reg Plan Quarterly 0.2700 13.1599
28-Jul-17 Dir Plan Monthly 0.0800 13.9637
29-Jun-17 Dir Plan Monthly 0.0900 13.8397
Date Plan Freq Dividend NAV30-May-17 Dir Plan Monthly 0.0900 13.8893
29-Mar-17 Dir Plan Monthly 0.0900 13.7523
27-Jun-17 Dir Plan Quarterly 0.2900 14.4005
22-Mar-17 Dir Plan Quarterly 0.2800 14.2137
22-Dec-16 Dir Plan Quarterly 0.2800 13.9870
IDFC Asset Allocation Fund of Fund - CP30-May-17 Reg Plan - 0.0700 14.1444
27-Apr-17 Reg Plan - 0.0900 14.1412
29-Mar-17 Reg Plan - 0.0900 14.0539
30-May-17 Dir Plan - 0.0700 14.3898
27-Apr-17 Dir Plan - 0.1000 14.3886
29-Mar-17 Dir Plan - 0.0900 14.2929
IDFC Asset Allocation Fund of Fund - MP30-May-17 Reg Plan Dividend 0.0500 15.653027-Apr-17 Reg Plan Dividend 0.1000 15.669629-Mar-17 Reg Plan Dividend 0.1000 15.4759
IDFC Asset Allocation Fund of Fund - AP30-May-17 Reg Plan Dividend 0.0400 16.289327-Apr-17 Reg Plan Dividend 0.1100 16.364129-Mar-17 Reg Plan Dividend 0.1100 15.941330-May-17 Dir Plan - 0.0400 17.881827-Apr-17 Dir Plan - 0.1200 17.955429-Mar-17 Dir Plan - 0.1200 17.4841
IDFC Dynamic Equity Fund14-Jul-17 Reg Plan - 0.19 10.947528-Apr-17 Reg Plan - 0.21 10.668923-Jan-17 Reg Plan - 0.17 10.338014-Jul-17 Dir Plan - 0.19 11.311128-Apr-17 Dir Plan - 0.21 10.991723-Jan-17 Dir Plan - 0.18 10.6347
IDFC Corporate Bond Fund28-Jul-17 Reg Plan Monthly 0.0928 10.6078
29-Jun-17 Reg Plan Monthly 0.0964 10.6021
30-May-17 Reg Plan Monthly 0.0790 10.584730-Aug-16 Reg Plan Dividend 0.4200 10.639317-Mar-16 Reg Plan Dividend 0.0497 10.101727-Jun-17 Reg Plan Quarterly 0.2300 10.634422-Mar-17 Reg Plan Quarterly 0.0700 10.4527
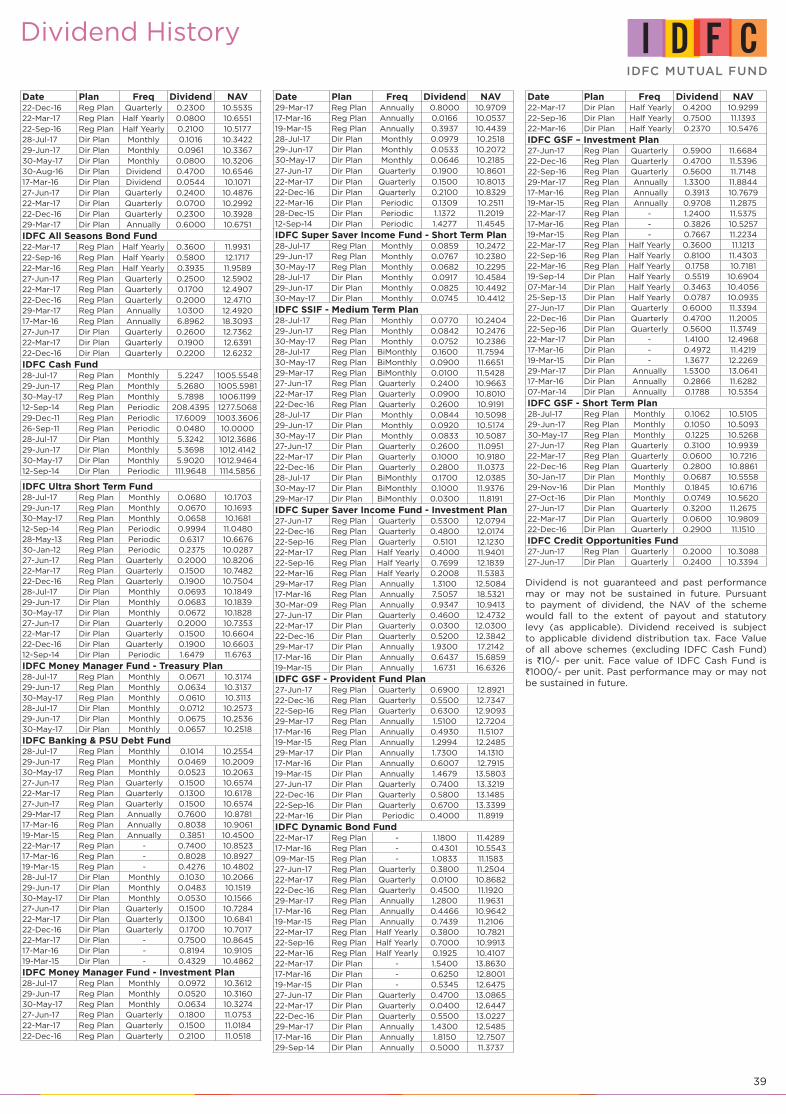
39
Dividend History
Date Plan Freq Dividend NAV22-Dec-16 Reg Plan Quarterly 0.2300 10.553522-Mar-17 Reg Plan Half Yearly 0.0800 10.655122-Sep-16 Reg Plan Half Yearly 0.2100 10.517728-Jul-17 Dir Plan Monthly 0.1016 10.342229-Jun-17 Dir Plan Monthly 0.0961 10.336730-May-17 Dir Plan Monthly 0.0800 10.320630-Aug-16 Dir Plan Dividend 0.4700 10.654617-Mar-16 Dir Plan Dividend 0.0544 10.107127-Jun-17 Dir Plan Quarterly 0.2400 10.487622-Mar-17 Dir Plan Quarterly 0.0700 10.299222-Dec-16 Dir Plan Quarterly 0.2300 10.392829-Mar-17 Dir Plan Annually 0.6000 10.6751
IDFC All Seasons Bond Fund22-Mar-17 Reg Plan Half Yearly 0.3600 11.993122-Sep-16 Reg Plan Half Yearly 0.5800 12.171722-Mar-16 Reg Plan Half Yearly 0.3935 11.958927-Jun-17 Reg Plan Quarterly 0.2500 12.590222-Mar-17 Reg Plan Quarterly 0.1700 12.490722-Dec-16 Reg Plan Quarterly 0.2000 12.471029-Mar-17 Reg Plan Annually 1.0300 12.492017-Mar-16 Reg Plan Annually 6.8962 18.309327-Jun-17 Dir Plan Quarterly 0.2600 12.736222-Mar-17 Dir Plan Quarterly 0.1900 12.639122-Dec-16 Dir Plan Quarterly 0.2200 12.6232
IDFC Cash Fund28-Jul-17 Reg Plan Monthly 5.2247 1005.554829-Jun-17 Reg Plan Monthly 5.2680 1005.598130-May-17 Reg Plan Monthly 5.7898 1006.119912-Sep-14 Reg Plan Periodic 208.4395 1277.506829-Dec-11 Reg Plan Periodic 17.6009 1003.360626-Sep-11 Reg Plan Periodic 0.0480 10.000028-Jul-17 Dir Plan Monthly 5.3242 1012.368629-Jun-17 Dir Plan Monthly 5.3698 1012.414230-May-17 Dir Plan Monthly 5.9020 1012.946412-Sep-14 Dir Plan Periodic 111.9648 1114.5856
IDFC Ultra Short Term Fund28-Jul-17 Reg Plan Monthly 0.0680 10.170329-Jun-17 Reg Plan Monthly 0.0670 10.169330-May-17 Reg Plan Monthly 0.0658 10.168112-Sep-14 Reg Plan Periodic 0.9994 11.048028-May-13 Reg Plan Periodic 0.6317 10.667630-Jan-12 Reg Plan Periodic 0.2375 10.028727-Jun-17 Reg Plan Quarterly 0.2000 10.820622-Mar-17 Reg Plan Quarterly 0.1500 10.748222-Dec-16 Reg Plan Quarterly 0.1900 10.750428-Jul-17 Dir Plan Monthly 0.0693 10.184929-Jun-17 Dir Plan Monthly 0.0683 10.183930-May-17 Dir Plan Monthly 0.0672 10.182827-Jun-17 Dir Plan Quarterly 0.2000 10.735322-Mar-17 Dir Plan Quarterly 0.1500 10.660422-Dec-16 Dir Plan Quarterly 0.1900 10.660312-Sep-14 Dir Plan Periodic 1.6479 11.6763
IDFC Money Manager Fund - Treasury Plan28-Jul-17 Reg Plan Monthly 0.0671 10.317429-Jun-17 Reg Plan Monthly 0.0634 10.313730-May-17 Reg Plan Monthly 0.0610 10.311328-Jul-17 Dir Plan Monthly 0.0712 10.257329-Jun-17 Dir Plan Monthly 0.0675 10.253630-May-17 Dir Plan Monthly 0.0657 10.2518
IDFC Banking & PSU Debt Fund28-Jul-17 Reg Plan Monthly 0.1014 10.255429-Jun-17 Reg Plan Monthly 0.0469 10.200930-May-17 Reg Plan Monthly 0.0523 10.206327-Jun-17 Reg Plan Quarterly 0.1500 10.657422-Mar-17 Reg Plan Quarterly 0.1300 10.617827-Jun-17 Reg Plan Quarterly 0.1500 10.657429-Mar-17 Reg Plan Annually 0.7600 10.878117-Mar-16 Reg Plan Annually 0.8038 10.906119-Mar-15 Reg Plan Annually 0.3851 10.450022-Mar-17 Reg Plan - 0.7400 10.852317-Mar-16 Reg Plan - 0.8028 10.892719-Mar-15 Reg Plan - 0.4276 10.480228-Jul-17 Dir Plan Monthly 0.1030 10.206629-Jun-17 Dir Plan Monthly 0.0483 10.151930-May-17 Dir Plan Monthly 0.0530 10.156627-Jun-17 Dir Plan Quarterly 0.1500 10.728422-Mar-17 Dir Plan Quarterly 0.1300 10.684122-Dec-16 Dir Plan Quarterly 0.1700 10.701722-Mar-17 Dir Plan - 0.7500 10.864517-Mar-16 Dir Plan - 0.8194 10.910519-Mar-15 Dir Plan - 0.4329 10.4862
IDFC Money Manager Fund - Investment Plan28-Jul-17 Reg Plan Monthly 0.0972 10.361229-Jun-17 Reg Plan Monthly 0.0520 10.316030-May-17 Reg Plan Monthly 0.0634 10.327427-Jun-17 Reg Plan Quarterly 0.1800 11.075322-Mar-17 Reg Plan Quarterly 0.1500 11.018422-Dec-16 Reg Plan Quarterly 0.2100 11.0518
Date Plan Freq Dividend NAV29-Mar-17 Reg Plan Annually 0.8000 10.970917-Mar-16 Reg Plan Annually 0.0166 10.053719-Mar-15 Reg Plan Annually 0.3937 10.443928-Jul-17 Dir Plan Monthly 0.0979 10.251829-Jun-17 Dir Plan Monthly 0.0533 10.207230-May-17 Dir Plan Monthly 0.0646 10.2185
27-Jun-17 Dir Plan Quarterly 0.1900 10.8601
22-Mar-17 Dir Plan Quarterly 0.1500 10.801322-Dec-16 Dir Plan Quarterly 0.2100 10.832922-Mar-16 Dir Plan Periodic 0.1309 10.251128-Dec-15 Dir Plan Periodic 1.1372 11.201912-Sep-14 Dir Plan Periodic 1.4277 11.4545
IDFC Super Saver Income Fund - Short Term Plan28-Jul-17 Reg Plan Monthly 0.0859 10.247229-Jun-17 Reg Plan Monthly 0.0767 10.238030-May-17 Reg Plan Monthly 0.0682 10.229528-Jul-17 Dir Plan Monthly 0.0917 10.458429-Jun-17 Dir Plan Monthly 0.0825 10.449230-May-17 Dir Plan Monthly 0.0745 10.4412
IDFC SSIF - Medium Term Plan28-Jul-17 Reg Plan Monthly 0.0770 10.240429-Jun-17 Reg Plan Monthly 0.0842 10.247630-May-17 Reg Plan Monthly 0.0752 10.238628-Jul-17 Reg Plan BiMonthly 0.1600 11.759430-May-17 Reg Plan BiMonthly 0.0900 11.665129-Mar-17 Reg Plan BiMonthly 0.0100 11.542827-Jun-17 Reg Plan Quarterly 0.2400 10.966322-Mar-17 Reg Plan Quarterly 0.0900 10.801022-Dec-16 Reg Plan Quarterly 0.2600 10.919128-Jul-17 Dir Plan Monthly 0.0844 10.509829-Jun-17 Dir Plan Monthly 0.0920 10.517430-May-17 Dir Plan Monthly 0.0833 10.508727-Jun-17 Dir Plan Quarterly 0.2600 11.095122-Mar-17 Dir Plan Quarterly 0.1000 10.918022-Dec-16 Dir Plan Quarterly 0.2800 11.037328-Jul-17 Dir Plan BiMonthly 0.1700 12.038530-May-17 Dir Plan BiMonthly 0.1000 11.937629-Mar-17 Dir Plan BiMonthly 0.0300 11.8191
IDFC Super Saver Income Fund - Investment Plan27-Jun-17 Reg Plan Quarterly 0.5300 12.079422-Dec-16 Reg Plan Quarterly 0.4800 12.017422-Sep-16 Reg Plan Quarterly 0.5101 12.123022-Mar-17 Reg Plan Half Yearly 0.4000 11.940122-Sep-16 Reg Plan Half Yearly 0.7699 12.183922-Mar-16 Reg Plan Half Yearly 0.2008 11.538329-Mar-17 Reg Plan Annually 1.3100 12.508417-Mar-16 Reg Plan Annually 7.5057 18.532130-Mar-09 Reg Plan Annually 0.9347 10.941327-Jun-17 Dir Plan Quarterly 0.4600 12.473222-Mar-17 Dir Plan Quarterly 0.0300 12.030022-Dec-16 Dir Plan Quarterly 0.5200 12.384229-Mar-17 Dir Plan Annually 1.9300 17.214217-Mar-16 Dir Plan Annually 0.6437 15.685919-Mar-15 Dir Plan Annually 1.6731 16.6326
IDFC GSF - Provident Fund Plan27-Jun-17 Reg Plan Quarterly 0.6900 12.892122-Dec-16 Reg Plan Quarterly 0.5500 12.734722-Sep-16 Reg Plan Quarterly 0.6300 12.909329-Mar-17 Reg Plan Annually 1.5100 12.720417-Mar-16 Reg Plan Annually 0.4930 11.510719-Mar-15 Reg Plan Annually 1.2994 12.248529-Mar-17 Dir Plan Annually 1.7300 14.131017-Mar-16 Dir Plan Annually 0.6007 12.791519-Mar-15 Dir Plan Annually 1.4679 13.580327-Jun-17 Dir Plan Quarterly 0.7400 13.321922-Dec-16 Dir Plan Quarterly 0.5800 13.148522-Sep-16 Dir Plan Quarterly 0.6700 13.339922-Mar-16 Dir Plan Periodic 0.4000 11.8919
IDFC Dynamic Bond Fund22-Mar-17 Reg Plan - 1.1800 11.428917-Mar-16 Reg Plan - 0.4301 10.554309-Mar-15 Reg Plan - 1.0833 11.158327-Jun-17 Reg Plan Quarterly 0.3800 11.250422-Mar-17 Reg Plan Quarterly 0.0100 10.868222-Dec-16 Reg Plan Quarterly 0.4500 11.192029-Mar-17 Reg Plan Annually 1.2800 11.963117-Mar-16 Reg Plan Annually 0.4466 10.964219-Mar-15 Reg Plan Annually 0.7439 11.210622-Mar-17 Reg Plan Half Yearly 0.3800 10.782122-Sep-16 Reg Plan Half Yearly 0.7000 10.991322-Mar-16 Reg Plan Half Yearly 0.1925 10.410722-Mar-17 Dir Plan - 1.5400 13.863017-Mar-16 Dir Plan - 0.6250 12.800119-Mar-15 Dir Plan - 0.5345 12.647527-Jun-17 Dir Plan Quarterly 0.4700 13.086522-Mar-17 Dir Plan Quarterly 0.0400 12.644722-Dec-16 Dir Plan Quarterly 0.5500 13.022729-Mar-17 Dir Plan Annually 1.4300 12.548517-Mar-16 Dir Plan Annually 1.8150 12.750729-Sep-14 Dir Plan Annually 0.5000 11.3737
Date Plan Freq Dividend NAV22-Mar-17 Dir Plan Half Yearly 0.4200 10.929922-Sep-16 Dir Plan Half Yearly 0.7500 11.139322-Mar-16 Dir Plan Half Yearly 0.2370 10.5476
IDFC GSF – Investment Plan27-Jun-17 Reg Plan Quarterly 0.5900 11.668422-Dec-16 Reg Plan Quarterly 0.4700 11.539622-Sep-16 Reg Plan Quarterly 0.5600 11.714829-Mar-17 Reg Plan Annually 1.3300 11.884417-Mar-16 Reg Plan Annually 0.3913 10.767919-Mar-15 Reg Plan Annually 0.9708 11.287522-Mar-17 Reg Plan - 1.2400 11.537517-Mar-16 Reg Plan - 0.3826 10.525719-Mar-15 Reg Plan - 0.7667 11.223422-Mar-17 Reg Plan Half Yearly 0.3600 11.121322-Sep-16 Reg Plan Half Yearly 0.8100 11.430322-Mar-16 Reg Plan Half Yearly 0.1758 10.718119-Sep-14 Dir Plan Half Yearly 0.5519 10.690407-Mar-14 Dir Plan Half Yearly 0.3463 10.405625-Sep-13 Dir Plan Half Yearly 0.0787 10.093527-Jun-17 Dir Plan Quarterly 0.6000 11.339422-Dec-16 Dir Plan Quarterly 0.4700 11.200522-Sep-16 Dir Plan Quarterly 0.5600 11.374922-Mar-17 Dir Plan - 1.4100 12.496817-Mar-16 Dir Plan - 0.4972 11.421919-Mar-15 Dir Plan - 1.3677 12.226929-Mar-17 Dir Plan Annually 1.5300 13.064117-Mar-16 Dir Plan Annually 0.2866 11.628207-Mar-14 Dir Plan Annually 0.1788 10.5354
IDFC GSF - Short Term Plan28-Jul-17 Reg Plan Monthly 0.1062 10.510529-Jun-17 Reg Plan Monthly 0.1050 10.509330-May-17 Reg Plan Monthly 0.1225 10.526827-Jun-17 Reg Plan Quarterly 0.3100 10.993922-Mar-17 Reg Plan Quarterly 0.0600 10.721622-Dec-16 Reg Plan Quarterly 0.2800 10.886130-Jan-17 Dir Plan Monthly 0.0687 10.555829-Nov-16 Dir Plan Monthly 0.1845 10.671627-Oct-16 Dir Plan Monthly 0.0749 10.562027-Jun-17 Dir Plan Quarterly 0.3200 11.267522-Mar-17 Dir Plan Quarterly 0.0600 10.980922-Dec-16 Dir Plan Quarterly 0.2900 11.1510
IDFC Credit Opportunities Fund27-Jun-17 Reg Plan Quarterly 0.2000 10.308827-Jun-17 Dir Plan Quarterly 0.2400 10.3394
Dividend is not guaranteed and past performance may or may not be sustained in future. Pursuant to payment of dividend, the NAV of the scheme would fall to the extent of payout and statutory levy (as applicable). Dividend received is subject to applicable dividend distribution tax. Face Value of all above schemes (excluding IDFC Cash Fund) is `10/- per unit. Face value of IDFC Cash Fund is `1000/- per unit. Past performance may or may not be sustained in future.

40
Total Experience of Fund Managers
Name Years Name Years
Mr. Anoop Bhaskar – Head Equity 23+ Mr. Harshal Joshi 9+
Mr. Anurag Mittal 10+ Ms. Khushboo Sharma 3+
Mr. Arpit Kapoor 12+ Mr. Rajendra Mishra 14+
Mr. Arvind Subramanian 7+ Mr. Sumit Agrawal 12+
Mr. Bhavin Patadia 8+ Mr. Suyash Choudhary - Head Fixed Income 16+
Mr. Daylynn Pinto 12+ Mr. Yogik Pitti 10+
How to read Factsheet
Fund ManagerAn employee of the asset management company such as a mutual fund or life insurer, who manages investments of the scheme. He is usually part of a larger team of fund managers and research analysts.
Application Amount for Fresh SubscriptionThis is the minimum investment amount for a new investor in a mutual fund scheme,
Minimum Additional AmountThis is the minimum investment amount for an existing investor in a mutual fund scheme.
Yield to MaturityThe Yield to Maturity or the YTM is the rate of return anticipated on a bond if held until maturity. YTM is expressed as an annual rate. The YTM factors in the bond’s current market price, par value, coupon interest rate and time to maturity.
SIPSIP or systematic investment plan works on the principle of making periodic investments of a fixed sum. It works similar to a recurring bank deposit. For instance, an investor may opt for an SIP that invests Rs 500 every 15th of the month in an equity fund for a period of three years.
NAVThe NAV or the net asset value is the total asset value per unit of the mutual fund after deducting all related and permissible expenses. The NAV is calculated at the end of every business day. It is the value at which the investor enters or exits the mutual fund.
BenchmarkA group of securities, usually a market index, whose performance is used as a standard or benchmark to measure investment performance of mutual funds, among other investments. Some typical benchmarks include the Nifty, Sensex, BSE200, BSE500, 10-Year Gsec.
Entry LoadA mutual fund may have a sales charge or load at the time of entry and/or exit to compensate the distributor/agent. Entry load is charged at the time an investor purchases the units of a mutual fund. The entry load is added to the prevailing NAV at the time of investment. For instance, if the NAV is `100 and the entry load is 1%, the investor will enter the fund at `101.
Note: SEBI, vide circular dated June 30, 2009 has abolished entry loan and mandated that the upfront commission to distributors will be paid by the investor directly to the distributor, based on his assessment of various factors including the services rendered by the distributor.
Exit LoadExit load is charged at the time an investor redeems the units of a mutual fund. The exit load is deducted from the prevailing NAV at the time of redemption. For instance, if the NAV is ` 100 and the exit load is 1%, the redemption price would be ` s99 per unit. Modified DurationModified duration is the price sensitivity and the percentage change in price for a unit change in yieldStandard DeviationStandard deviation is a statistical measure of the range of an investment’s performance. When a mutual fund has a high standard deviation, its means its range of performance is wide, implying greater volatility.Sharpe RatioThe Sharpe Ratio, named after its founder, the Nobel Laureate William Sharpe, is a measure of risk-adjusted returns. It is calculated using standard deviation and excess return to determine reward per unit of risk.BetaBeta is a measure of an investment’s volatility vis-a-vis the market. Beta of less than 1 means that the security will be less volatile than the market. A beta of greater than 1 implies that the security’s price will be more volatile than the market.AUMAUM or assets under management refers to the recent / updated cumulative market value of investments managed by a mutual fund or any investment firm.HoldingsThe holdings or the portfolio is a mutual fund’s latest or updated reported statement of investments/securities. These are usually displayed in terms of percentage to net assets or the rupee value or both. The objective is to give investors an idea of where their money is being invested by the fund manager.Nature of SchemeThe investment objective and underlying investments determine the nature of the mutual fund scheme. For instance, a mutual fund that aims at generating capital appreciation by investing in stock markets is an equity fund or growth fund. Likewise, a mutual fund that aims at capital preservation by investing in debt markets is a debt fund or income fund. Each of these categories may have sub-categories.Rating ProfileMutual funds invest in securities after evaluating their creditworthiness as disclosed by the ratings. A depiction of the mutual fund in various investments based on their ratings becomes the rating profile of the fund. Typically, this is a feature of debt funds.
Fund Manager Details
Investment Objective
IDFC Classic Equity Fund The investment objective of the Scheme is to seek to generate long term capital growth from a diversified portfolio of predominantly equity and equity related instruments. However, there is no assurance or guarantee that the objectives of the scheme will be realized.
IDFC Sterling Equity Fund The investment objective of the Scheme is to seek to generate capital appreciation from a diversified portfolio of equity and equity related instruments. The Scheme will predominantly invest in small and midcap equity and equity related instruments. Small and Midcap equity and equity related instruments will be the stocks included in the Nifty Free Float Midcap 100 or equity and equity related instruments of such companies which have a market capitalization lower than the highest components of Nifty Free Float Midcap 100. The Scheme may also invest in stocks other than mid cap stocks (i.e. in stocks, which have a market capitalisation of above the market capitalisation range of the defined small - midcap stocks) and derivatives. On defensive consideration, the Scheme may also invest in debt and money market instruments. In case of discontinuation / suspension of Nifty Free Float Midcap 100, the AMC reserves the right to modify the definition of Mid cap and Small cap companies. In case of such a modification, the interest of investors will be of paramount importance. There can be no assurance that the investment objective of the scheme will be realized.
IDFC Premier Equity Fund The Scheme shall seek to generate long-term capital growth from an actively managed portfolio of predominantly equity and equity related instruments. The Scheme portfolio would acquire, inter alia, small and medium size businesses with good long term potential, which are available at cheap valuations. Such securities would be identified through disciplined fundamental research keeping in view medium to long-term trends in the business environment. The Scheme shall endeavor to accumulate long-term investor wealth by opening subscriptions to units during periods when stocks are available at reasonable valuations. By doing so, the Fund managers would endeavor to prevent short-term money from flowing into the fund which can prove detrimental to the interests of long-term investors. As the scheme would be sold to investors with a long-term investment horizon, it is also expected that the portfolio would remain relatively more insulated to day to day redemption pressures. The fund will close subscription, once it has collected a predetermined “manageable” corpus (approximate amount), which will be decided by the fund manager of the scheme depending on the available investment opportunities in the stock market / if the fund manager is of the opinion that investment opportunities have diminished. Thus the fund manager will endeavour to ensure that there are sufficient assets available to meet the long-term objectives of the fund.
IDFC Focused Equity Fund The investment objective of the scheme is to seek to generate capital appreciation and/or provide income distribution from a portfolio of predominantly equity and equity related instruments. There is no assurance or guarantee that the objectives of the scheme will be realized.
IDFC Equity Fund The investment objective of the scheme is to seek to generate capital growth from a portfolio of predominantly equity and equity related instruments (including Equity Derivatives). The scheme may also invest in debt & money market instruments to generate reasonable income. However there is no assurance or guarantee that the objectives of the scheme will be realized.

41
Investment Objective
IDFC Nifty Fund The investment objective of the scheme is to replicate the Nifty 50 by investing in securities of the Nifty 50 in the same proportion / wightage. However, there is no assurance or guarantee that the objectives of the scheme will be realized and the scheme does not assure or guarantee any returns .
IDFC Infrastructure Fund The investment objective of the scheme is to seek to generate long-term capital growth through an active diversified portfolio of predominantly equity related instruments of companies that are participating in and benefiting from growth in Indian Infrastructure and infra structural related activities, However, there can be no assurance that the investment Objective of the scheme will be realized.
IDFC Tax Advantage (ELSS) Fund
The investment objective of the Scheme is to seek to generate long term capital growth from a diversified portfolio of predominantly equity and equity related securities. There can be no assurance that the investment objective of the scheme will be realised.
IDFC Arbitrage Fund The investment objective of the Scheme is to generate capital appreciation and income by predominantly investing in arbitrage opportunity in the cash and the derivative segments of the equity markets and the arbitrage opportunity available within the derivative segments and by investing the balance in debt and money market instruments. However there is no assurance that the investment objective of the scheme will be realized.
IDFC Arbitrage Plus Fund The investment objective of the Scheme is to generate income (absolute to low volatility returns) by taking advantage of opportunities in the cash and the derivative segments of the equity markets including the arbitrage opportunities available within the derivative segment, by using other derivative based strategies and by investing the balance in debtand money market instruments. However there is no assurance that the investment objective of the scheme will be realized.
IDFC Sensex Exchange Traded Fund
The fund seeks to provide returns that, before expenses, closely correspond to the total return of the underlying index, subject to tracking errors. There can be no assurance or guarantee that the investment objective of the Scheme would be achieved.
IDFC Nifty Exchange Traded Fund
The fund seeks to provide returns that, before expenses, closely correspond to the total return of the underlying index, subject to tracking errors. There can be no assurance or guarantee that the investment objective of the Scheme would be achieved.
IDFC Dynamic Equity Fund The primary objective of the scheme is to seek to generate long term capital appreciation with relatively lower volatility through systematic allocation of funds into equity and equity related instruments; and for defensive purposes in equity derivatives. The secondary objective of the scheme will be to generate in come and capital appreciation through investment in Debt & Money Market instruments. There is no assurance or guarantee that the objectives of the scheme will be realised.
IDFC Balanced Fund The Fund seeks to generate long term capital appreciation along with current income by investing in a mix of equity and equity related securities, debt securities and money market instruments. There is no assurance or guarantee that the objectives of the scheme will be realized.
IDFC Monthly Income Plan The primary objective of Scheme is to generate regular returns through investment primarily in debt securities. The secondary objective of the Scheme is to generate long-term capital appreciation by investing a portion of the Scheme’s assets in equity securities. Monthly Income is not assumed and the same is subject to availability of distributable surplus.
IDFC Asset Allocation Fund of Fund - Conservative Plan
The primary objective of Scheme is to generate capital appreciation through investment in different Mutual Funds schemes primarily local funds based on a defined asset allocation model. However, there can be no assurance that the investment objective of the scheme will be realized.
IDFC Asset Allocation Fund of Fund - Moderate Plan
The primary objective of Scheme is to generate capital appreciation through investment in different Mutual Funds schemes primarily local funds based on a defined asset allocation model. However, there can be no assurance that the investment objective of the scheme will be realized.
IDFC Asset Allocation Fund of Fund - Aggressive Plan
The primary objective of Scheme is to generate capital appreciation through investment in different Mutual Funds schemes primarily local funds based on a defined asset allocation model. However, there can be no assurance that the investment objective of the scheme will be realized.
IDFC All Seasons Bond Fund Seek to generate optimal returns with high liquidity by active management of the portfolio by investing predominantly in debt oriented mutual fund schemesand money market instruments. However, there can be no assurance that the investment objectives of the Scheme will be realized
IDFC Cash Fund IDFC - CF is an open-ended liquid fund with an objective to generate optimal returns with high liquidity by investing in high quality money market and debt instruments. However, there can be no assurance that the investment objectives of the scheme will be realized.
IDFC Ultra short Term Fund To offer an investment avenue for short term savings by looking to generate stable returns with a low risk strategy. The scheme will have a portfolio that is invested in good quality debt and money market instruments such that the fund will offer a blend of liquidity with stability of returns. There can be no assurance that the investment objective of the scheme will be realized.
IDFC Money Manager Fund - Treasury Plan
Seek to generate stable returns with a low risk strategy by creating a portfolio that is substantially invested in good quality floating rate debt or money market instruments, fixed rate debt or money market instruments swapped for floating returns and fixed rate debt and money market instruments. However, there can be no assurance that the investment objectives of the scheme will be realized.
IDFC Money Manager Fund - Investment Plan
Seek to generate stable returns with a low risk strategy by creating a portfolio that is substantially invested in good quality floating rate debt or money market instruments, fixed rate debt or money market instruments swapped for floating returns and fixed rate debt and money market instruments. However there is no assurance that the investment objective of the scheme will be realized.
IDFC Banking & PSU Debt Fund
The Scheme seeks to generate returns through investments in debt and money market instruments predominantly issued by entities such as Banks, Public Sector Undertakings (PSUs) and Public Financial Institutions(PFIs)
IDFC Super Saver Income Fund - Short Term Plan
The primary investment objective of the scheme is to seek to generate stable returns with a low-risk strategy by creating a portfolio that is invested in good quality fixed income & Money Market securities. However, there can be no assurance that the investment objectives of the scheme will be realized.
IDFC Corporate Bond Fund The Fund seeks to provide steady income and capital appreciation by investing primarily in corporate debt securities across maturities and ratings. However, there is no assurance or guarantee that the objectives of the scheme will be realised.
IDFC Credit Opportunities Fund
The Fund seeks to generate returns by predominantly investing in a portfolio of corporate debt securities across the credit spectrum within the investment grade. There is no assurance or guarantee that the objectives of the scheme will be realized.
IDFC Super Saver Income Fund - Medium Term Plan
The primary investment objective of the scheme is to seek to generate stable returns with a low-risk strategy by creating a portfolio that is invested in good quality fixed income & Money Market securities. However, there can be no assurance that the investment objectives of the scheme will be realized.
IDFC Super Saver Income Fund - Investment Plan
The primary investment objective of the scheme is to seek to generate stable returns with a low-risk strategy by creating a portfolio that is invested in good quality fixed income & Money Market securities. However, there can be no assurance that the investment objectives of the scheme will be realized.
IDFC Dynamic Bond Fund Seek to generate optimal returns with high liquidity by active management of the portfolio; by investing in high quality money market & debt instruments. However there can be no assurance that the investment objectives of the Scheme will be realized.
IDFC Government Securities Fund - Short Term Plan
IDFC – GSF -ST is an open ended dedicated gilt scheme with an objective to generate optimal returns with high liquidity by investing Government Securities. However there is no assurance that the investment objective of the scheme will be realized.
IDFC Government Securities Fund - Provident Fund Plan
Seek to generate optimal returns with high liquidity by investing in Government Securities. However there is no assurance that the investment objective of the scheme will be realized.
IDFC Government Securities Fund - Investment Plan
IDFC – GSF -IP is an open ended dedicated gilt scheme with an objective to generate optimal returns with high liquidity by investing Government Securities. However there is no assurance that the investment objective of the scheme will be realized.

42

WESTAhmedabad B Wing, 3rd Floor, Chandan House Opp Gruh Finance, Mithakhali Six Roads, Law Garden, Tel.:079-26460923/925
Ahmedabad 380006.Bhopal Plot No. 49, First Floor, Above Tata Capital Limited, M P Nagar, Zone II, Bhopal [M.P.] - 462011.Bhilai 26, Commercial Complex, Nehru Nagar (East), Bhilai, Chhattisgarh, Pin - 490020. Mobile No. 8871144134.Goa F -27 & F -28, 1st Floor, Alfran Plaza, M.G Road, Opp. Don Bosco High School, Panjim - Goa. 403001, Tel.: +91-
0832-6631022.Indore 405, 4th Floor, 21/ 1, D. M. Tower, Race Course Road, Indore - 452 001. Tel.: +91-731-4206927/ 4208048. Fax:
+91-731-4206923.Mumbai ‘One IndiaBulls Centre’ 6th Floor, Jupiter Mills Compound, 841, Senapati Bapat Marg, Elphinstone (W) Mumbai
– 400013. Tel No. 6628 9999Mumbai (Churchgate)
2nd Floor,Ramon House , H.T Parekh Marg, 169,Backbay reclamation, Opp.Aakash wani, Churchgate 400020. Tel.:+912266289999.
Mumbai (Ghatkopar) Mumbai(Thane)
Office No. 308, Zest Business Spaces, M. G. Road, Ghatkopar (East), (Maharashtra) Mumbai- 400077.
Shop No. 1, Konark Towers, Ghantali Devi Road, Thane (West) 400602.
Nagpur Fortune Business Centre, First Floor, 6, VasantVihar, W. H. C. Rd., Shankar Nagar, Nagpur - 440 010. Tel.: +91-712-6451428/ 2525657.
Nasik Shop No - 6, Rajvee Enclave, New Pandit Colony, Off Sharanpur Road, Nasik - 422002. Tel.: 0253-2314611. Mobile: 9823456183.
Pune 1st Floor, Dr. Herekar Park Building, Next to Kamala Nehru Park, Off. Bhandarkar Road, Pune - 411 004. Tel.: +91-20-66020965/ 4.
Raipur T-19,III Floor, Raheja Tower, Near Hotel Celebration, Jail Road, Raipur (C G) - 492001. Tel: 0771-6900699.Rajkot “Star Plaza”, 2nd Floor, Office No. 201, Phulchab Chowk, Rajkot - 360 001. Tel.: +91-281-6626012.Surat U 15/16, Jolly Plaza, Athvagate, Surat - 395 001. Tel.: +91-261-2475060, 2475070.Vadodara 301, 2nd Floor, Earth Complex, Opposite Vaccine Ground, Above Indian Overseas Bank, Old Padra Road,
Vadodara - 380015. Tel No.: 0265 - 2339623/2339624/2339325.NORTHAgra Office No. 307A, 3rd Floor, Block #38/4A, Sumriddhi Business Suites, Sanjay Place, Agra - 282 002. Tel.:+91-
562-4064889Amritsar 6-FUF, 4th Floor Central Mall, Mall Road, Amritsar - 143001. Tel.:+911835030393.Chandigarh SCO 2475 - 76, 1st Floor, Sector 22, Chandigarh - 160 022. Tel.: +91 17 2507 1918 /5071919, Fax: +91-172-5071918.Dehradun G-12 B NCR Plaza, Ground Floor, 24 A, 112/28, Ravindranath Tagore Marg, New Cantt Road, Dehradun-248001.
Mobile: 9897934555, 8171872220Jaipur 301-A, 3rd Floor, Ambition Tower, Agersen Circle, Malan Ka Chaurah, Subash Marg, C-Scheme, Jaipur - 302 001.
Tel. No. : +91-0141- 2360945, 2360947, 2360948Jalandhar 1st floor, Satnam Complex, BMC Chowk, G.T.Road, Jalandhar-144001. Punjab-India. Tel.: 01815018264.Kanpur Office No. 214-215, IInd Floor, KAN Chambers, 14/113, Civil Lines, Kanpur - 208 001. Tel.: +91-512-2331071,
2331119.Lucknow 1st floor, Aryan Business Park, Exchange Cottage, 90.M.G. Marg, Park Road, Lucknow-226001, Mob: 9792999940,
Tel.: 0522-4928100 - 106, 0522-6888012Ludhiana SCO 122, 2nd Floor, Feroze Gandhi Market, Ludhiana - 140 001. Tel.: +911615022155.New Delhi 4th Floor, NarainManzil, 23, Barakhamba Road, New Delhi - 110 001. Tel.: +91-11-47311301/ 02/ 03/ 04/ 05.Varanasi IDFC Asset Management Co. Ltd. 3rd Floor, Premise No. D-64/127, CH, Arihant Complex, Sigra Varanasi - 221010
(U.P). Phone No. 05422226527Gurgaon 117, 1st Floor, Vipul Agora, M. G. Road, Gurgaon - 122 001. Ph: 011-47311336.SOUTHBangalore 6th Floor, East Wing, Raheja Towers, #26 & 27, M. G. Road, Bangalore - 560 001. Tel.: +91-80-43079000/ 01/
02/ 03, Fax - +91-80-43079009.Chennai KRM Tower, 8th floor, No. 1, Harrington Road, Chetpet, Chennai - 600 031. Tel.: +91-44-45644201/ 202.Cochin 39/3993 B2, Gr. Floor, Vantage Point, VRM Rd, Ravipuram, Cochin - 682 016. Tel: +91-484-3012639/ 4029291,
Fax: +91-484-2358639.Coimbatore A Complex , No. 49, Father Randy Street, Azad Road, R. S. Puram, Coimbatore - 641 002. Hyderabad 6-3-885/7/C/2/S2, 2nd Floor, Amit Plaza, Somajiguda, Hyderabad - 500 082. Tel. No. : +91-40-42014646/47
Fax: +91-40-40037521.Madurai No.278, 1st Floor, Nadar Lane, North Perumal Maistry Street, Madurai - 625 001. Tel.: 0452-6455530.Mangalore Shop No 4, Ground Floor, Raj Towers, Balmatta Road, Mangalore – 575001. Tel. : +91 9845287279.Mysore CH 26, Shop No 1, 2nd Floor, 7th Main, 5th Cross ( Veta Building ) Saraswathipuram, Mysore - 570009.Trivandrum T.C.2/3262(6), 1st Floor, RS Complex, Opposite LIC Building, Pattom P O, Trivandrum - 695 004.
Tel. : 9809053381.Trichy N Abdulla No. 28, First Cross Extension, Anna Nagar, Tennur, Trichy – 620 017EASTBhubaneswar Rajdhani House, 1st Floor, 77 Kharvel Nagar, Janpath, Bhubaneswar - 751001. Phone : 0674 6444252 / 0674
2531048 / 0674 2531148.Guwahati 4E, 4th Floor, Ganapati Enclave, G. S. Road, Ulubari, Opp. Bora Service Station, Guwahati - 781 007. Mobile:
9207410763, 9207410764, 9207410765, 9207410766.Jamshedpur IDFC Mutual Fund, Room No.111, 1st Floor, Yashkamal Complex, Main Road, Bistupur, Jamshedpur-831001, Ph No.
0657-2230112/111/222, Mobile No. : 9431102883.Kolkata Oswal Chambers, 1st Floor, 2 Church Lane, Kolkata - 700 001. Tel.: +91-33-40171000/ 1005.Patna 406, Ashiana Hariniwas, New Dakbanglow Road, Patna - 800 001. Tel.: +91-612-6510353. Ranchi : 306, Shrilok
Complex, 4 H B Road, Ranchi-834001 Phone : 0651-2212592/9931156362.Durgapur (West Bengal)
6/2A, Suhatta, 6th Floor, City Centre, Durgapur - 713216. Phone No.: +91 8537867746.
Mutual Fund investments are subject to market risks, read all scheme related documents carefully.