Embed Size (px)
Citation preview
Section 3.0 Environmental Setting, Impacts, and Mitigation
Envision San José 2040 General Plan 672 Draft Program EIR City of San José June 2011
3.11 CULTURAL AND PALEONTOLOGICAL RESOURCES The following discussion evaluates existing cultural and paleontological resources and the environmental effects of implementation of the Envision San José 2040 General Plan. The analysis in this section is based in part on the following technical reports: • Cultural Resources Existing Setting, Envision San José 2040 General Plan, Santa Clara
County, California, Basin Research Associates, July 2009. • Cultural Resources Impacts, Envision San José 2040 General Plan, Santa Clara County,
California, Basin Research Associates, November 2010. • Paleontological Evaluation Report for the Envision San José 2040 General Plan, Santa
Clara County, California, C. Bruce Hanson, September 2010. Copies of these reports are included in the Technical Appendices to this Draft PEIR (Appendix J). 3.11.1 Existing Setting 3.11.1.1 Overview Cultural resources are evidence of past human occupation and activity and include both historical and archeological resources. These resources may be located above ground, underground or underwater, and have significance in the history, prehistory153, architecture or culture of the nation, State of California, or local or tribal communities. Examples of historic resources include buildings (e.g., houses, factories, churches, hotels); structures (e.g., bridges, dams); districts (i.e., a group of buildings or structures that have a common basis in history or architecture); sites (e.g., prehistoric or historic encampments); objects (e.g., statues, ships, marquees); and areas (e.g., historic mining towns, parks). Cultural resources may include homes, buildings or old roads of early settlers; structures with unique architecture; prehistoric village sites; historic or prehistoric artifacts or objects; rock inscriptions; human burial sites; and earthworks, such as canals or prehistoric mounds. Historical and archaeological resources are nonrenewable resources that often yield unique information about past societies and environments. Paleontological resources are fossils, the remains or traces of prehistoric life preserved in the geological record. They range from the well known and well publicized (such as mammoth and dinosaur bones) to scientifically important fossils (such as paleobotanical remains, trace fossils, and microfossils). Paleontological resources include the casts or impressions of ancient animals and plants, their trace remains (for example, burrows and trackways), microfossils (for example, fossil pollen and small crustaceans such as brine shrimp), and unmineralized remains (for example, bones of Ice Age mammals or trunks of trees). 3.11.1.2 Cultural Setting of the City of San José
Prehistoric Context and Native American People Native American occupation and use of the Santa Clara Valley extended over 5,000-8,000 years and possibly longer. The area’s favorable environment during the prehistoric period, including alluvial plains, foothills, many water courses and bay margins provided an abundance of wild food and other
153 Events of the past prior to written records are considered prehistory.
Section 3.0 Environmental Setting, Impacts, and Mitigation
Envision San José 2040 General Plan 673 Draft Program EIR City of San José June 2011
resources. Prehistoric sites recorded in the Santa Clara Valley include villages, temporary campsites, and non-habitation sites including stone tool and other manufacturing areas, quarries for tool stone procurement, cemeteries usually associated with large villages, isolated burial locations, rock art sites, bedrock mortars or other milling feature sites, and Native American trails. The Native American people who originally inhabited the Santa Clara Valley belong to a group known as the “Costanoan” or Ohlone, who broadly occupied the central California coast from the northern tip of the San Francisco Peninsula to Big Sur in the south and as far east as the Diablo Range. Around 1770 (the time of first Spanish contact), there were two Costanoan subgroups in the area – the Tamyen (Tamien) in the north along the Guadalupe River and the Mutsun in the south along San Felipe Creek and the San Benito River. There are an estimated 1,400 or more people of partial, local Native American descent who currently reside in the greater San Francisco Bay Area. The Costanoan/Ohlone people practiced a hunting, fishing and collecting economy focusing on the collection of seasonal plant and animal resources, including tidal and marine resources from San Francisco Bay. They traded with neighboring groups including the Yokuts to the east and exported shells, salt and cinnabar (mercury-bearing minerals) among other items. The customary way of living, or lifeway, of the Costanoan/Ohlone people disappeared by about 1810 due to disruption by introduced diseases, a declining birth rate and the impact of the California mission system established by the Spanish in the area in 1777.
Historic Era The City of San José has developed in the context of the major historical periods that have shaped this region of California: Spanish explorations and colonization beginning in the year 1769 (Spanish Period); subsequent Mexican rule after 1822 (Mexican Period); and later annexation to the United States and Statehood in 1850 (American Period). Spanish exploration and settlement of the San Francisco Bay Area began in the late 18th century. As English, Russian, and Dutch expansionists on the western shore of North America became more ambitious around 1770, the Spanish undertook a concerted effort to solidify their hold on Alta (Upper) California. Spanish explorers in the late 1760s and 1770s were the first Europeans to traverse the Santa Clara Valley. The first party under Gaspar de Portola and Father Juan Crespi arrived in the Alviso-San José area in the fall of 1769, followed by another party led by Pedro Fages the following year. Other explorers passed through or near the Santa Clara Valley with the exploration party of Juan Bautista de Anza and Father Pedro Font reaching the lower Guadalupe River in 1776. Settlement followed soon after with the founding of the original Pueblo de San José de Guadalupe on November 29, 1777 on the eastern bank of the Guadalupe River. San José was initially laid out north of the current Downtown, in an area bounded roughly by the Guadalupe River, and present-day North First Street, Hamline Street, and Hobson Street. The adobes of early San José were the nucleus of a Spanish agricultural colony. They were clustered around the old road to Monterey with outlying fields assigned to each family. The Hispanic population of San José climbed steadily between 1777 and 1820, producing food for the community as well as for soldiers at the San Francisco and Monterey Presidios. Ranching was a primary activity and livestock populations expanded so rapidly in the Santa Clara Valley that their numbers were reduced in the early 1800s as herds had become difficult to manage.
Section 3.0 Environmental Setting, Impacts, and Mitigation
Envision San José 2040 General Plan 674 Draft Program EIR City of San José June 2011
Mexico took over the government of California in 1821 from Spain and secularized the California missions in 1833. This resulted in a change in land ownership patterns in the Santa Clara Valley by dividing mission property into private land grants. The new Mexican colonial authorities permitted more foreigners to visit Alta California and removed many restrictions on commerce. After 1822, San José was a major center of hide and tallow trade as well as other agricultural products. Part of the increased output was derived from Native American labor, which was in some cases enslaved. Attracted by economic prospects, other Euro-American pioneers from the eastern United States began immigrating to the Santa Clara Valley during the Mexican period (1821-1846). San José officially fell into American hands in July 1846 during the Mexican-American War. California officially became a United States territory in 1848 and formally admitted as a state in 1850. The population of the Santa Clara Valley expanded as a result of the 1848 Gold Rush which brought a massive influx of immigrants to California from all parts of the world. The large cattle ranches common in the area during the Hispanic Period of 1769 to 1848 were converted to farming varied crops during the American Period. The community of San José underwent its first rapid growth during the period between 1846 and 1860; transforming from Mexican pueblo to an American town. Growth was fostered when San José became the state capital for a time from 1850-1851 and then slowed for the following 10 years. During this period the physical layout of the town using a standard grid pattern typical of other frontier settlements in the United States was set out. This included the one square mile area bounded by Julian, Reed, Eighth and Market Streets and the reservation of Washington Square (now San José State University) as a park or school grounds. After 1860, San José steadily expanded and urbanized. Agricultural activities surrounding San José shifted from cattle ranging to more advanced and specialized agricultural practices, including orchards. Also, with the arrival of the railroad and the advance of agriculture in the surrounding valley areas, a number of business, residential and religious buildings were constructed in San José. The need for expanding markets led to innovations in fruit preservation and shipping including drying fruit, canning fruit and shipping fresh fruit in refrigerated cars. By 1920, Santa Clara County had over 40 canneries and 30 packing houses, producing approximately 90 percent of California’s canned food. Economic activity associated with the New Almaden (mercury) mines also stimulated the growth of San José banks and offices and downtown development. The fruit industry had its drawbacks, however. One was the seasonal fluctuations that meant unemployment and transiency of city and county populations. For example, in 1920, factories in the region employed 17,333 workers during the peak season in August, and only 4,731 people during the winter lull. A number of rural neighborhoods, such as Alviso, developed around the perimeter of San José during this period. The agricultural and other industries of San José and Santa Clara County drew people to the area, with immigrants from Mexico, Europe and Asia and emigrants from other parts of the United States. In some cases, these immigrants settled in communities and neighborhoods that reinforced cultural ties. Other workers followed a migratory pattern during the year, moving throughout the western United States based upon the availability of seasonal agricultural work. In the early 20th century, the destruction caused by the earthquake of 1906 created an opportunity to revise the skyline of San José. Civic leaders and prominent businessmen adopted the new skyscraper style during the rebuilding of the central business district between 1906 and 1910. These tall structures served to usher in the 20th century for Downtown San José. The fast pace of new downtown construction continued during the prosperous 1920s. The construction of these new
Section 3.0 Environmental Setting, Impacts, and Mitigation
Envision San José 2040 General Plan 675 Draft Program EIR City of San José June 2011
buildings reiterated the primary role of Downtown as a commercial and financial center, although throughout the 20th century the functions of the district changed. By 1930 the auto had begun to impose its design requirements on San José. Downtown San José became the center of the automobile trade in Santa Clara County and brought business into the core. Ultimately, however, the increasing reliance on cars to come into town resulted in the decline of public transit that had been established earlier in the century. In addition, people with cars were no longer limited to the central business district for their trade but could travel to other commercial areas. Consequently, clusters of commercial businesses gradually began to locate along major arterials outside of Downtown San José. Within the Santa Clara Valley, the City of San José has historically served as a County seat, a primary governmental service, as well as a financial and social center. In recent decades, the central town and agrarian land use pattern has been gradually displaced by housing, commercial centers, and the development of research and development (R&D) and manufacturing facilities associated with the electronics industry within both the city and surrounding communities. The economic booms of the 1980s and 1990s dramatically altered the regional landscape from the orchards to industrial parks, commercial districts and housing subdivisions in the City of San José and surrounding cities. In the early 21st century, driving economic activities in San José and the built environment have continued to shift from manufacturing associated with the electronics industry towards service and innovation related businesses, including biotechnology, renewable energy, software development, and communications, which occupy office and research and development (R&D) buildings. Due to the large population of people residing in the area, retail and commercial establishments throughout the City as well as institutional employers (e.g., hospitals, government agencies) also employ a considerable portion of the local population. An overview of the overall historic context for the City of San José is described in the document Historical Overview and Context for the City of San José, by Archives & Architecture, Glory Anne Laffey, written in 1992. More recently, the City funded preparation of a Historic Context Statement on San José Modernism by PAST Consultants that emphasizes the historic patterns and trends in building architecture during the recent past, the time period 1935-1975. This later report was prepared in cooperation with the Preservation Action Council of San José (PAC-SJ). For a more detailed overview of prehistoric and historic settlement in the San José, refer to the cultural resources existing conditions report in Appendix J. 3.11.1.3 Geologic Setting of Fossil Bearing Sediments in the City of San José Paleontologic resources include fossils – the remains or traces of once-living organisms preserved in sediments or sedimentary rocks – and the geologic context in which they occur. By convention, paleontologic resources do not include human remains, artifacts (objects created by humans), or other evidence of past human activities which are the subjects of the field of archaeology. The City of San José lies at and near the southeast shore of San Francisco Bay in central California. Most of the City occupies a broad plain in the northern Santa Clara Valley approximately centered on the Guadalupe River and Coyote Creek. Parts of the city also extend onto the Santa Teresa Hills and foothills of the Santa Cruz Mountains in southern San José, and onto the foothills of the Diablo Range in eastern parts of the City.
Section 3.0 Environmental Setting, Impacts, and Mitigation
Envision San José 2040 General Plan 676 Draft Program EIR City of San José June 2011
Vertebrate and invertebrate fossils are found in geologic strata conducive to their preservation, typically sedimentary formations. The early history of the region is recorded and accessible in the rocks of adjacent hills, although the record has been deformed and scrambled by tectonic events and processes which were occurring even as the rock record was accumulating. More recent Holocene sediments over much of the Santa Clara Valley cover older sediments and sedimentary rock of the Pleistocene age, the time period that spanned from 1.8 million to about 10,000 years ago, which have a greater potential to contain fossils. The Holocene is the last 10,000 years or so of the Earth's history after the last major glacial period. Paleontologic sensitivity is defined as the potential for a geologic unit to produce scientifically significant fossils. This is determined by rock type, past history of the rock unit in producing significant fossils, and fossil localities that are recorded from that unit. Paleontologic sensitivity is derived from the fossil data collected from the entire geologic unit, not just from a specific survey. Potentially sensitive areas for the presence of paleontological resources within the City are identified on Figure 3.11-1 based on the underlying geologic formation. Areas with the highest sensitivity are those where geologic formations known to contain fossils are found close to the ground surface. For a description of fossil data used to assess paleontologic sensitivity of geologic formations, refer to the Paleontological Evaluation Report in Appendix J. Geologic units of Holocene age are generally not considered sensitive for paleontological resources; however, remains of a Rancholabrean Columbian mammoth (Mammuthus columbi) were found along the Guadalupe River in San José in 2005,154 in a strata identified as Holocene by published geologic maps.155 The mammoth remains may have been reworked from older deposits, or some strata identified as Holocene in the Santa Clara Valley are actually of Pleistocene age; in either case, Holocene materials in the Santa Clara Valley may have some level of sensitivity for paleontological resources (i.e., fossils may be encountered in areas mapped as Holocene geologic units).156 3.11.1.4 Regulatory Framework Development within the City of San José that may affect cultural resources and paleontological resources is regulated by various state and local agencies to reduce impacts to historical and archaeological resources. The National Historic Preservation Act of 1966 (as amended), the California Environmental Quality Act (CEQA) and the City of San José’s Historic Preservation Ordinance are the basic federal, state and local requirements governing the preservation of historic and archaeological resources of national, regional, state and/or local significance. Most local projects within the City of San José are reviewed under CEQA and the City’s Historic Preservation Ordinance prior to project approval. Projects applying for federal funding, including grants, have to comply with federal historic preservation requirements. Relevant laws, regulations and programs are described below.
154 University of California Museum of Paleontology. “Mammoth Discovery in San Jose–bones found near Guadalupe River levee, north of airport – June 9, 2005”. Accessed October 28, 2010. Available at: <http://www.ucmp.berkeley.edu/mammal/mammoth/index.html> 155 Wentworth, C.M., M.C. Blake, Jr., R.J. McLaughlin, and R.W. Graymer, compilers. 1999. Preliminary geologic map of the San Jose 30x60-minute quadrangle. (Open-file report 98-795). Available at: <http://pubs.usgs.gov/of/1998/of98-795/ > 156 City of Santa Clara. 2010. City of Santa Clara Draft 2010-2035 General Plan EIR.

Section 3.0 Environmental Setting, Impacts, and Mitigation
Envision San José 2040 General Plan 678 Draft Program EIR City of San José June 2011
Federal National Historic Preservation Act The National Historic Preservation Act (NHPA) established the National Register of Historic Places (National Register) to recognize resources associated with local, State, and national history and heritage. Structures and features must be at least 50 years old to be considered for listing on the National Register, barring exceptional circumstances. Criteria for listing on the National Register (see 36 CFR Part 63), are significance in American history, architecture, archaeology, engineering, and culture as present in districts, sites, buildings, structures, and objects that possess integrity of location, design, setting, materials, workmanship, feeling, and association, and that:
(A) are associated with events that have made a significant contribution to the broad
patterns of our history; (B) are associated with the lives of persons significant in our past; (C) embody the distinctive characteristics of a type, period, or method of construction;
represent the work of a master; possess high artistic values, represent a significant and distinguishable entity whose components may lack individual distinction; or,
(D) have yielded, or may be likely to yield, information important in prehistory or history. Criterion D is usually reserved for archaeological and paleontological resources.
Federal regulations for cultural resources are primarily governed by Section 106 of the NHPA which applies to actions taken by federal agencies. Both archaeological resources and historic buildings in the City of San José are subject to review if federal funds or a federal permit/license is involved. As a Certified Local Government (CLG), the City of San José is also afforded review and comment opportunities on federal undertakings within the city. Americans with Disabilities Act (ADA) The ADA requires that new buildings and facilities and altered portions of existing buildings and facilities be readily accessible for persons with disabilities. In the case of historic properties, the ADA provides for the application of certain alternative minimum accessibility standards if making a “qualified historic building” accessible would threaten or destroy the historic significance of that building or facility. Consultation with the State Historic Preservation Officer and the Advisory Council on Historic Preservation is required. Secretary of the Interior’s Standard for the Treatment of Historic Properties The U.S. Secretary of the Interior has established standards for the treatment of historic properties. The 1995 Secretary of the Interior’s Standard for the Treatment of Historic Properties outlines specific standards and guidelines for the preservation, rehabilitation, restoration, and reconstruction of historic properties. Preservation standards and guidelines apply to those buildings that require ongoing maintenance to sustain their historical authenticity. Rehabilitation standards and guidelines
Section 3.0 Environmental Setting, Impacts, and Mitigation
Envision San José 2040 General Plan 679 Draft Program EIR City of San José June 2011
involve the reuse of a historic structure or property while retaining features that maintain historic value. Restoration standards and guidelines are applicable to projects that remove portions of a building from another historic period in order to restore a property to its period of significance. Reconstruction standards and guidelines apply to new developments that replicate a historic period or setting based on documented evidence. Each set of standards provides specific recommendations for the proper treatment of specific building materials, as well as parts of building construction. CEQA references these Standards relative to consideration of the significance of project impacts, or lack thereof, on historic resources. Other Federal Laws, Regulations, and Programs Other federal laws and regulations pertinent to projects within the City include Section 4(f) of the U.S. Department of Transportation Act of 1966. Section 4(f) is national policy established as a part of the U.S. Department of Transportation Act of 1966 that stipulates that the Federal Highway Administration (FHWA) will not approve any program or project that requires the “use” of any publicly owned public park, recreation area, wildlife refuge or historic sites unless there is “no feasible and prudent alternative to the project and the project includes all possible planning to minimize harm to the project. Tax credits and charitable contributions for historic properties allowed under the Historic Rehabilitation Tax Credits Program and Preservation/Conservation Easement Charitable Contribution Deduction program are administered by the National Park Service and Internal Revenue Service, respectively.
State of California
California Public Resources Code Archaeological, paleontological, and historical sites are protected by a wide variety of State policies and regulations under the California Public Resources Code. Under the Public Resources Code, the State Historical Resources Commission is responsible for oversight of the California Register of Historical Resources (California Register) and designation of State Historical Landmarks and Historical Points of Interest. The Office of Historic Preservation (OHP) is responsible for the administration of federally and state mandated historical preservation programs in California and the California Heritage Fund. Key provisions of the Public Resources Code that provide protection to cultural and paleontological resources are outlined below. • California Public Resources Code Sections 5097.9–5097.991 provides protection to Native
American historical and cultural resources and sacred sites, and identifies the powers and duties of the Native American Heritage Commission (NAHC). It also requires notification of discoveries of Native American human remains and provides for treatment and disposition of human remains and associated grave goods.
• California Public Resources Code Sections 5097.98 provides that in the event of discovery or
recognition of any human remains in any location other than a dedicated cemetery, there shall be no further excavation until the coroner has determined that the remains are not subject to provisions of law concerning investigation of the circumstances, manner and cause of any death, and the recommendations concerning the treatment and disposition of the human remains have been made to the person responsible. The coroner shall make his or her
Section 3.0 Environmental Setting, Impacts, and Mitigation
Envision San José 2040 General Plan 680 Draft Program EIR City of San José June 2011
determination within two working days from the time the person responsible for the excavation, or his or her authorized representative, notifies the coroner of the discovery or recognition of the human remains. If the coroner determines that the remains are not subject to his or her authority and has reason to believe that they are those of a Native American, he or she shall contact, by telephone within 24 hours, the Native American Heritage Commission (NAHC).
• California Public Resources Code Section 5097.5 prohibits “knowing and willful”
excavation, removal, destruction, injury, and defacement of any paleontological feature on public lands (lands under State, county, city, district, or public authority jurisdiction, or the jurisdiction of a public corporation), except where the agency with jurisdiction has granted permission.
California Public Resources Code Section 30244 requires reasonable mitigation for impacts on paleontological resources that occur as a result of development on public lands. CEQA requirements in the Public Resources Code are discussed below. California Environmental Quality Act (CEQA) Under CEQA, public agencies must consider the effects of their actions on both “historical resources” and “unique archaeological resources” – a “. . . project that may cause a substantial adverse change in the significance of an historical resource is a project that may have a significant effect on the environment” (Public Resources Code, Section 21084.1). Historical Resources The CEQA Guidelines define a significant resource as any resource listed in or determined to be eligible for listing in the California Register of Historical Resources (California Register) [see Public Resources Code, Section 21084.1 and CEQA Guidelines Section 15064.5 (a) and (b)]. The California Register includes resources listed in or formally determined eligible for listing in the National Register, as well as some California State Landmarks and Points of Historical Interest. The California Register was created to identify resources deemed worthy of preservation on a State level and was modeled closely after the National Register. The criteria are nearly identical to those of the National Register which includes resources of local, State, and region or national levels of significance. The California Register automatically includes resources listed on the National Register. These listings are updated as resources are determined eligible and/or are officially listed. Current listings for Santa Clara County are maintained by the California Historical Resources Information System, Northwest Information Center, California State University Sonoma (CHRIS/NWIC). In addition to assessing whether historical resources potentially affected by a proposed project are listed or have been identified in a survey process, lead agencies have a responsibility to evaluate them against the California Register and CEQA criteria prior to making a finding as to a proposed project’s impacts on historical resources (Public Resources Code, Section 21084.1; CEQA Guidelines, Section 15064.5(a)(3)). In general, a historical resource is defined as any object, building, structure, site, area, place, record, or manuscript that is historically or archaeologically significant; or is significant in the architectural, engineering, scientific, economic, agricultural,

Section 3.0 Environmental Setting, Impacts, and Mitigation
Envision San José 2040 General Plan 681 Draft Program EIR City of San José June 2011
educational, social, political or cultural annals of California; and meets the criteria for listing on the California Register including the following: • Is associated with events that have made a significant contribution to the broad patterns of
California’s history and cultural heritage; • Is associated with the lives of persons important in our past; • Embodies the distinctive characteristics of a type, period, region, or method of construction,
or represents the work of an important creative individual, or possesses high artistic values; or
• Has yielded, or may be likely to yield, information important in prehistory or history. Properties of local significance that have been designated under a local preservation ordinance (local landmarks or landmark districts) or that have been identified in a local historical resources inventory may be eligible for listing in the California Register and are presumed to be “historical resources” for the purposes of CEQA unless a preponderance of evidence indicates otherwise (Public Resources Code, Section 5024.1; California Code of Regulations, Title 14, Section 4850). Unless a resource listed in a survey has been demolished, lost substantial integrity, or there is a preponderance of evidence indicating that it is otherwise not eligible for listing, a lead agency should consider the resource to be potentially eligible for the California Register. Integrity is defined as the retention of the resource’s physical identity that existed during its period of significance. Integrity is determined through considering the setting, design, workmanship, materials, location, feeling, and association of the resource. A resource that has lost its historic character or appearance may still have sufficient integrity for the California Register if it maintains the potential to yield significant scientific or historical information or specific data. For historic structures, CEQA Guidelines Section 15064.5(b)(3) indicates that following the Secretary of the Interior’s Standards for the Treatment of Historic Properties with Guidelines for Preserving, Rehabilitating, Restoring, and Reconstructing Historic Buildings, or the Secretary of the Interior’s Standards for Rehabilitation and Guidelines for Rehabilitating Historic Buildings (1995), mitigates impacts to a less than significant level. Archaeological Resources CEQA also requires lead agencies to consider whether projects will affect “unique archaeological resources” (Public Resources Code, Section 21083.2(g)) which are defined as an archaeological artifact, object, or site about which it can be clearly demonstrated that, without merely adding to the current body of knowledge, there is a high probability that it meets any of the following criteria: • Contains information needed to answer important scientific research questions and that there
is a demonstrable public interest in that information. • Has a special and particular quality such as being the oldest of its type or the best available
example of its type.
Section 3.0 Environmental Setting, Impacts, and Mitigation
Envision San José 2040 General Plan 682 Draft Program EIR City of San José June 2011
• Is directly associated with a scientifically recognized important prehistoric or historic event or person.
Treatment options for unique archaeological resources include preservation in place in an undisturbed state; excavation and curation or study in place without excavation and curation (if the study finds that the artifacts would not meet one or more of the criteria for defining a “unique archaeological resource”). Paleontological Resources Treatment of paleontological resources under CEQA is generally similar to treatment of cultural resources, requiring evaluation of resources in a project’s area of potential affect, assessment of potential impacts on significant or unique resources, and development of mitigation measures for potentially significant impacts, which may include monitoring combined with data recovery and/or avoidance. Native American Burials California law protects Native American burials, skeletal remains, and associated grave goods regardless of their antiquity and provides for the sensitive treatment and disposition of those remains (Section 7050.5(b) of the California Health and Safety Code). CEQA Guidelines section 15064.5(e) requires that excavation activities be stopped whenever human remains are uncovered and that the county coroner or medical examiner be contacted to assess the remains. If the county coroner or medical examiner determines that the remains are those of Native Americans, the NAHC must be contacted within 24 hours. The property owner is required to consult with the appropriate Native Americans identified by the NAHC as a “most likely descendant” to develop an agreement for the treatment and disposition of the remains. These requirements are also contained in the County Codes for the County of Santa Clara (Sections B6-19 and B6-20). Local and Tribal Intergovernmental Consultation (Senate Bill (SB) 18 - 2004) SB 18 is a process separate from CEQA that requires local governments to consult with federally and non-federally recognized Native American tribes prior to approving certain land use plans that include traditional tribal cultural places on both public and private lands. A cultural place is a landscape feature, site, or cultural resource that has some relationship to particular tribal religious heritage or is a historic or archaeological site of significance or potential significance. SB 18 places the responsibility of initiating consultation on local governments. The purpose of SB 18 is to provide time for tribal input early in the planning process. Besides City staff and tribal representatives, the process may also include applicants and consultants. SB 18 consultation applies to the adoption and amendment of both General and Specific Plans proposed on or after March 1, 2005 and consultation is a “government to government” interaction between tribal representatives and representatives of the local jurisdiction. The NAHC maintains lists of Native American individuals/groups organized by county for SB 18 Tribal Consultation. Tribal consultation concerning the proposed General Plan pursuant to SB 18 was initiated by the City in 2009 with applicable Santa Clara County tribal representatives identified by the NAHC.
Section 3.0 Environmental Setting, Impacts, and Mitigation
Envision San José 2040 General Plan 683 Draft Program EIR City of San José June 2011
California Historical Building Code The California Historical Building Code (CHBC) provides regulations for the preservation, restoration, rehabilitation, relocation, or reconstruction of buildings or structures designated as qualified historical buildings or properties by a local, state or federal jurisdiction. The CHBC intends to provide alternative solutions for the preservation of qualified historical buildings or properties, to provide access for persons with disabilities, to provide a cost-effective approach to preservation, and to provide for the reasonable safety of the occupants or users (California Code of Regulations, Title 24 Part 8). The CHBC defines “qualified historical building” as “any building, site, structure, object, district or collection of structures, and their associated sites, deemed of importance to the history, architecture or culture of an area by an appropriate local, state or federal governmental jurisdiction.” This includes designated buildings or properties on, or determined eligible for, national, state or local historical registers or official inventories including the National Register, the California Register, State Historical Landmarks, State Points of Historical Interest, and officially adopted city or county registers, inventories, or surveys of historical or architecturally significant sites, places or landmarks. Mills Act Property Tax Abatement Program State law provides local jurisdictions with the opportunity to develop a Mills Act Tax Abatement Program (Mills Act) that offers owners of historic properties the potential for property valuation reductions in return for proscribed rehabilitation, preservation work on their properties. The City of San José has a Mills Act program for City Landmarks (see City of San José, below).
City of San José San José 2020 General Plan Existing policies in the City of San José General Plan have been adopted for the purpose of avoiding or mitigating environmental effects resulting from planned development within the City. Relevant General Plan Policies that directly address reducing and avoiding impacts to cultural resources include the following: • Historic, Archaeological and Cultural Resources Policies #1-9 Municipal Code The City’s Historic Preservation Ordinance, contained in Chapter 13.48 of the San José Municipal Code, is designed to identify, protect, and encourage the preservation of significant resources and foster civic pride in the City’s cultural resources. Chapter 13.48 of the Municipal Code provides for the City to: establish a Historic Landmarks Commission, maintain a Historic Resources Inventory, preserve historic properties using a Landmark Designation process, require Historic Preservation Permits for alterations of properties designated as a Landmark or within a City historic district, and provide financial incentives through a Mills Act Historical Property Contract.
Section 3.0 Environmental Setting, Impacts, and Mitigation
Envision San José 2040 General Plan 684 Draft Program EIR City of San José June 2011
Section 13.48.020 of the Municipal Code defines structures of historical value based on three criteria: 1. Identification or association with persons, eras or events that have contributed to local,
regional, state or national history, heritage or culture in a distinctive, significant or important way;
2. Identification as, or association with, a distinctive, significant or important work or vestige: a. Of an architectural style, design or method of construction; b. Of a master architect, builder, artist or craftsman; c. Of high artistic merit; d. The totality of which comprises a distinctive, significant or important work or vestige whose component parts may lack the same attributes; e. That has yielded or is substantially likely to yield information of value about history, architecture, engineering, culture or aesthetics, or that provides for existing and future generations an example of the physical surroundings in which past generations lived or worked; or,
f. That the construction materials or engineering methods used in the proposed landmark are unusual or significant or uniquely effective.
3. The factor of age alone does not necessarily confer a special historical architectural, cultural
aesthetic or engineering significance, value or interest upon a structure or site, but it may have such effect if a more distinctive, significant or important example thereof no longer exists.
Under the Ordinance, individual properties or a group of structures can be designated as Landmarks, and a qualifying geographic area can be designated as a Historic District. These resources are listed on the City’s Historic Resources Inventory along with other structures (e.g., Structure of Merit, Identified Structure). The City’s Guidelines for Historic Reports provide that “A project will have a significant effect on historic resources if it would demolish, or substantially alter, a historical resource which is (1) either listed, or eligible for listing, on the National Register of Historic Places or the California Register or (2) designated as a City Landmark.”157 The City of San José also has recently modified its Neglected Vacant Buildings Ordinance (Chapter 17.38 of the Municipal Code) to require that the owners of all vacant or abandoned historic buildings or structures listed on the National Register, California Register, or City of San José Register of Historic Landmarks install and maintain an operating alarm system approved by the City’s Fire Marshal to prevent loss of historic resources through fire. Certified Local Government (CLG) The City of San José is a certified local government. Amendments to the National Historic Preservation Act of 1966, provided for the establishment of a CLG program which is a partnership among local governments, the State of California Office of Historic Preservation and the National Park Service. CLG requirements include enforcing appropriate state and local laws and regulations 157 City of San José. 2010. Revised Guidelines for Historic Reports – 2/26/10. Available at: <http://www.sanjoseca.gov/planning/historic/pdf/revised_historic_report_guidelines.pdf>
Section 3.0 Environmental Setting, Impacts, and Mitigation
Envision San José 2040 General Plan 685 Draft Program EIR City of San José June 2011
for the designation and protection of historic properties; establishing a historic preservation review commission by local ordinance; maintaining a system for the survey and inventory of historic properties; providing for public participation in the local preservation program; and, satisfactorily performing responsibilities delegated to it by the state. Each CLG must provide a yearly report of activities to the State Historic Preservation Officer. City Council Policies The City Council’s Development Policy on the Preservation of Historic Landmarks (as amended May 23, 2006) calls for preservation of candidate or designated landmark structures, sites, or districts wherever possible. Proposals to alter such structures, sites, or districts must include a thorough and comprehensive evaluation of the historic and architectural significance of the structure, site, or district and the economic and structural feasibility of preservation and/or adaptive reuse. The policy calls for every effort to be made to incorporate candidate or designated landmark structures into the future plans for a site and the surrounding area and to preserve the integrity of landmark districts. Historic Design Guidelines The City has prepared historic design guidelines that suggest various appropriate ways to address the restoration or rehabilitation of older/historic structures. In addition, one of the purposes of the guidelines is to raise awareness of certain design and contextual issues that could be considered in proposals for new development. Historic design guidelines available on the City’s website include Your Old House: Guide for Preserving San José Homes, Downtown San José Historic District Design Guidelines, Saint James Square Historic District Design Guidelines, and San José Downtown Historic Design Guidelines (Draft May 2004). These guidelines are not intended as a rigid set of rules; however, they establish a general framework for the City’s evaluation of applications involving historic preservation issues. City Preservation Incentives The City offers a number of historic preservation incentives with the goal of preservation and continuing use of historic buildings. The State Historic Building Code can be used as a reasonable alternative to the requirements of the regular codes and ordinances and is applicable for all San José historic resources. City Landmarks are eligible for use of the Mills Act/Historical Property Contract allowing a revised property tax assessment with a percentage of the savings to be used towards rehabilitation and/or maintenance. A City Landmark may also qualify for a Building Tax Exemption and/or one or more federal tax credits. 3.11.1.5 Identified Cultural Resources The City of San José’s historic buildings, structures, objects, archaeological sites and features, landscapes and neighborhoods are physical reminders of the ways in which early inhabitants and later citizens of San José used and developed the land. Many, but not all, of these resources have been identified, recorded and evaluated over the past 50 years although urban development and renewal has often resulted in both the deliberate and inadvertent removal of both archaeological sites and the built environment.
Section 3.0 Environmental Setting, Impacts, and Mitigation
Envision San José 2040 General Plan 686 Draft Program EIR City of San José June 2011
Historic Resources
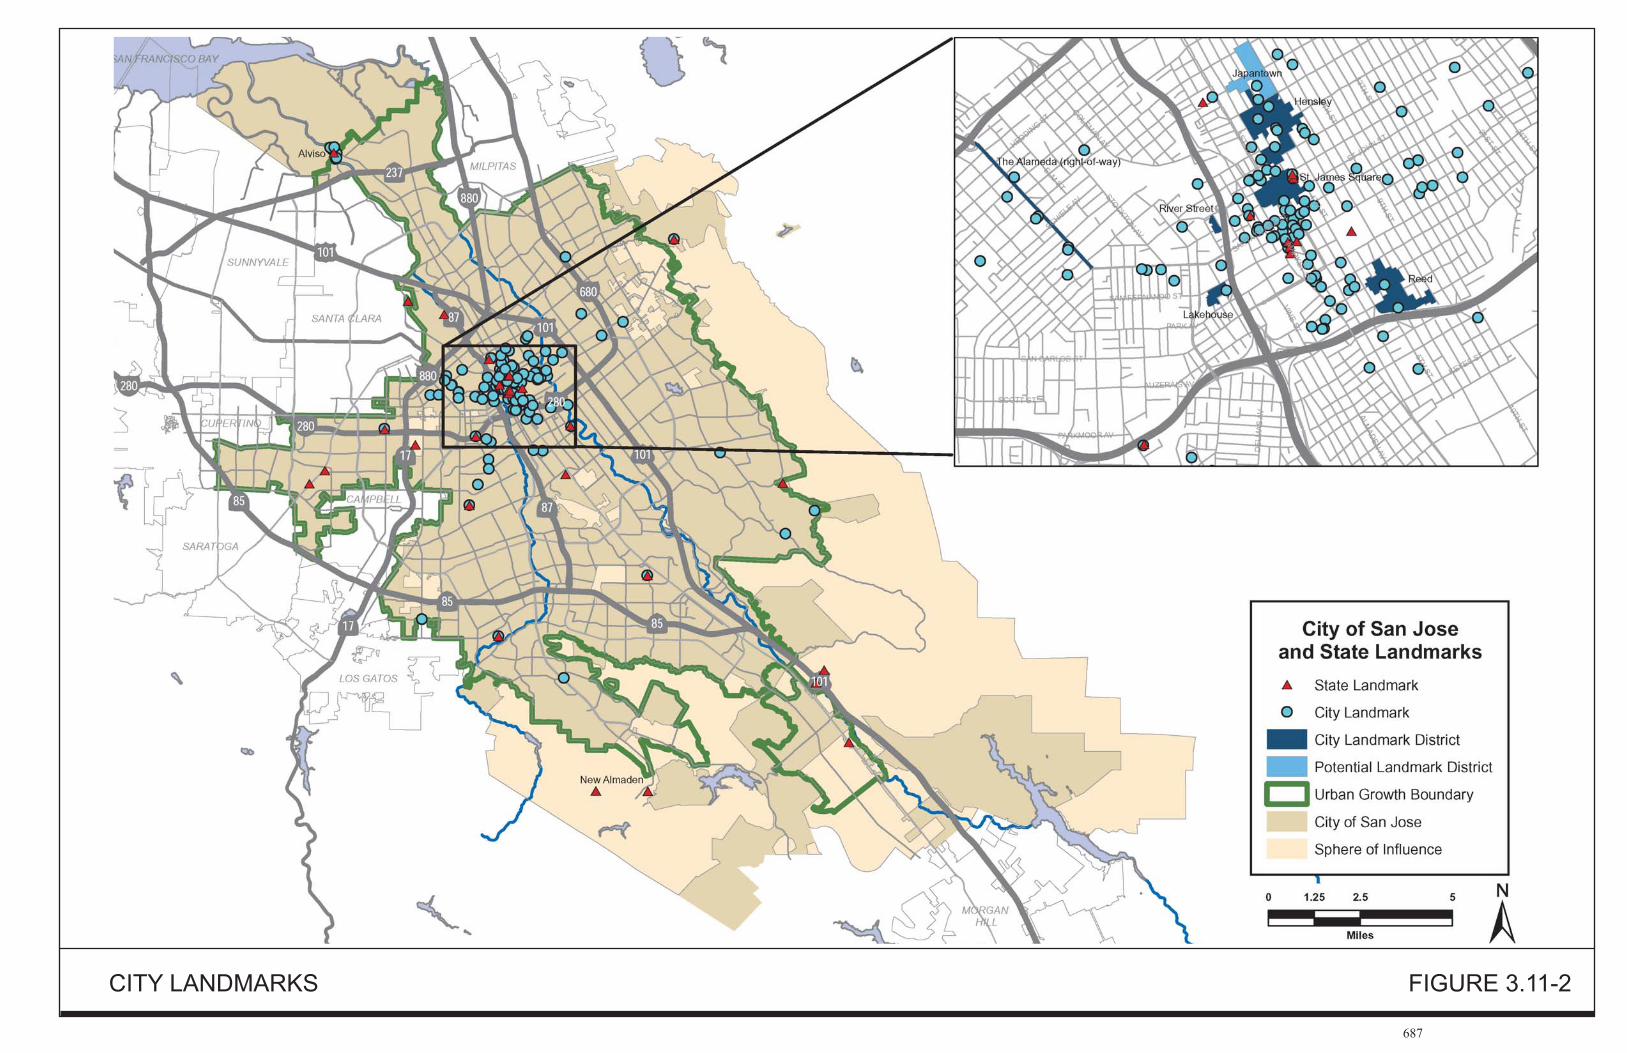
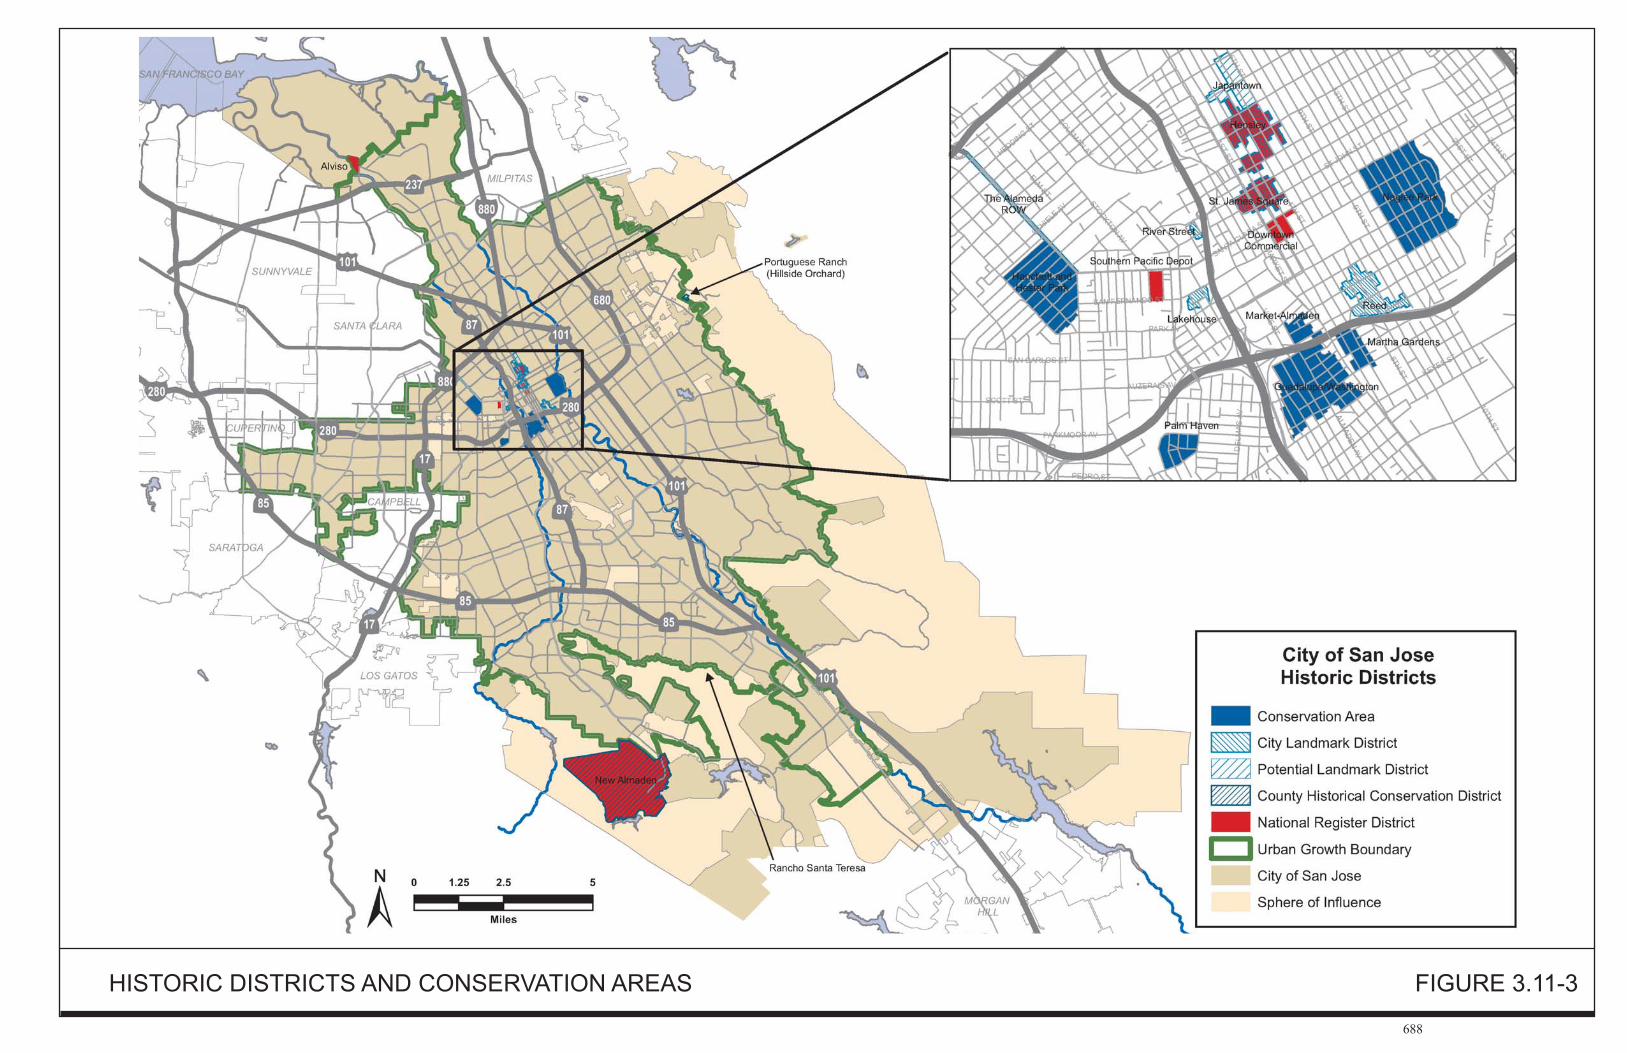
The City of San José has identified approximately 160 City Landmarks in its Historic Resources Inventory. Of these landmarks, 25 are National Register listed individual properties and/or districts, nine State of California Landmarks or part of a State Landmark, and four are State Points of Historical Interest (refer to List 5.1, Table 5.6 and Table 5.7 in Cultural Resources Existing Setting Report, Appendix J of this PEIR). City Landmarks are concentrated in the older, established areas of the City including the Downtown, Naglee Park, Hensley and Shasta-Hanchett areas in the Central/ Downtown Planning Area, the Willow Glen Planning Area, and at the City’s fringes in the Alviso, Almaden, Alum Rock and Edenvale Planning Areas. The locations of City Landmarks are shown on Figure 3.11-2. The City has also identified 21 historic districts and/or Conservation areas. These historic districts and Conservation Areas include buildings and sites listed on the National Register, State Historic Landmarks, and State Points of Historical Interest. City of San José Historic Districts and Conservation Areas are shown on Figure 3.11-3 and described briefly below. A potential historic district is shown on Figures 3.11-2 and 3.11-3 in the Japantown area. This area was identified as a possible historic district in a historic resources survey prepared in 2006.158 The City of San José initiated the process to designate a Japantown City Landmark District, which was later discontinued. Hensley Historic District (National Register/City District) The Hensley Historic District is part of the former estate of Major Samuel J. Hensley (d. 1866) which extended from N. First to Fourth Street and Empire Street to what became the railroad right-of-way. The irregularly shaped Hensley City Landmark District (HD89-51) is listed under the theme of Architecture and Shelter for the Horticulture period (1870-1918). The National Register listed Hensley Historic District consists of 279 properties with 207 contributing structures. The City Landmark District includes 24 additional properties located at the north and south ends of the National Register District. This district has the largest concentration of Victorian-era residences in the City of San José and is notable as a residential district with the most complete concentration of architectural styles popular between 1856 and 1918 in the City. Larger and more elaborate homes are found on N. Third Street with modest workingmen’s homes along N. Fifth Street built in Italianate, Stick-Eastlake, and Queen Anne styles. As it is listed on the National Register, the district is automatically included on the California Register. The Hensley Historic District is in the Central/Downtown Planning Area.
158 Carey and Company. San José Japantown Historic Context and Survey Phase II. October 10, 2006.

Section 3.0 Environmental Setting, Impacts, and Mitigation
Envision San José 2040 General Plan 689 Draft Program EIR City of San José June 2011
Port of Alviso National Register Historic District The Alviso (District), known as “Port of Alviso (San José),” is a listed National Register of Historic Places (National Register) district, but is not a designated City District. As a National Register property, this district is automatically included on the California Register. The district is bounded on the north by an arm of Alviso Slough, on the west by the Alviso Slough, the 1850 canal, and the Guadalupe River, on the south by Moffat Street, and, on the east by a line down the center of Gold Street to Catherine Street, west on Catherine to the center of the block between El Dorado and Gold, and then south to Moffat Street. Alviso was one of the earliest ports on the west coast of the United States and one of the earliest towns, incorporated in 1852, in Santa Clara County. It was expected to be a “great city” due to its location, but after it was bypassed by railroads, it was “almost totally deserted”. The Port of Alviso is also a State of California Point of Historical Interest (SHPI SCL-061); listed in the California History Plan and California Inventory of Historic Resources; and one contributor to the district, the former Old Union Warehouse, is one of the seven buildings/building clusters/sites of the Bay Side Canning Company and one of the 94 Chinese American State of California Ethnic Sites. San José Downtown Historic District (National Register) The San José Downtown Historic District (also known as the San José Commercial District), a National Register of Historic Places district, is located within the area between E. Santa Clara, S. First, Second, and S. Fourth Street (along E. Santa Clara) to E. San Fernando Street. Similar to Alviso, the Downtown Historic District is not a City Historic District. This area contains architecturally and historically significant buildings dating from the 1870s to the early 1940s and continues to serve as Santa Clara Valley’s mercantile and financial center. As a listed National Register property, the district is automatically included on the California Register. The San José Downtown Historic District is in the Central/Downtown Planning Area. Southern Pacific Depot (or Cahill Station Historic District) The Southern Pacific Depot is listed in the City Historic Resources Inventory as “Diridon Train Station” – at 65 Cahill Street. It includes the multi-level passenger and freight railroad depot, the depot building (1935), a Car Cleaners’ Shack, a Herder’s Shack, and a Compressor House (1910-1920 or 1930) as well as a wall and fence system, a water tower (probably 1935), underpass (1933), two butterfly sheds and tracks. The Southern Pacific Depot Historic District is in the Central/Downtown Planning Area. Cahill Station is also listed as a City Landmark Site. Saint James Square [or St. James Square] District The Saint James Square City Landmark District (HD84-36) is listed under the theme Social, Arts, and Recreation for the Early American Period (1846-1870). The park, the only public square in the Downtown Core Area, is surrounded by buildings significant for their civic design and uses from the 1860s through 1930s. The park, originally laid out in 1848 by Chester Lyman, occupies a two block area bounded by E. St. James Street on the north, E. St. John Street on the south, N. First Street on the west and N. Third Street on the east. The City Landmark District area includes the park, the block west to N. Market Street and part of the block east to N. Fourth Street and part of the block south between N. Second and N. Third Streets. In contrast, the smaller National Register of Historic Places District St. James Square (St. James Park) area consists of 10 contributors – the park and nine
Section 3.0 Environmental Setting, Impacts, and Mitigation
Envision San José 2040 General Plan 690 Draft Program EIR City of San José June 2011
buildings and two non-contributors on blocks opposite the park. As a listed National Register property, the district is automatically included on the California Register. The Saint James Square City Landmark District is in the Central/Downtown Planning Area. Lakehouse City Landmark Historic District The Lakehouse Historic District (City Landmark Historic District HD07-158) is generally bounded on the north by W. San Fernando Street, on the east by State Highway 87 and the VTA Light Rail right-of-way, on the west by Los Gatos Creek, and on the south by the rear property lines of lots on the north side of Park Avenue, and on the southeast by Sonoma Street and Lakehouse Avenue. This City District consists of mostly single-family residential properties constructed from 1885-1925. The district includes a unique concentration of single story, Queen Anne Style houses along with some Craftsman and Period Revival in and surrounding the 1891 Lake House Tract. No theme or period is listed for this City District. A smaller Lake House Historic District/Delmas Historic District), excluding properties on Gifford Avenue, was determined eligible for the National Register in 1999 due to a unique concentration of single story predominantly Queen Anne style houses built between 1892 and 1898. The Lakehouse City Landmark District is in the Central/Downtown Planning Area. Reed City Landmark Historic District Reed City Landmark Historic District [HD06-155 (no theme or period listed)], occupies an extremely irregular area on the south side of San José State University (SJSU) between E. San Salvador Street and I-280, S. Fourth and S. Ninth streets. The district is significant for residential development circa 1870-1935 as well as early modern multi-family residential architecture built after World War II as a result of the growth of San José State College/University. The southern portion of the Reed City District in the vicinity of Reed School, constructed in 1870 (later known as Lowell School on E. Reed between S. Sixth and Seventh Streets) retains 1870-1935 housing stock, especially along S. Sixth Street south of Reed Street. The Reed City Landmark District is in the Central/Downtown Planning Area. River Street City Landmark Historic District The River Street City Landmark Historic District HD96-107, listed under the theme of Architecture and Shelter for the Horticulture period (1870-1918), is located east of N. River Street with the Guadalupe River on the west, N. Almaden Boulevard and State Highway 87 on the east, W. Julian Street on the north, and the River Park and tennis courts on the south (parcels on the south side of W. St. John). This 1875-1925 workingman’s neighborhood, one of the largest concentrations of Italian immigrants in California, consists of mostly residences, but also includes the Torino Hotel, Almaden French Bakery, Prindiville Grocery, and a non-contributing machine shop in a variety of styles - Italianate, Greek Revival, Queen Anne, and Mediterranean Revival. Construction of the Guadalupe River Flood Control project resulted in the demolition of 21 buildings and the relocation of nine buildings. Most of the residences have been converted to commercial use. The River Street City Landmark District is in the Central/Downtown Planning Area. The Alameda ROW (Right-of-Way) City Landmark Historic District The Alameda ROW (Right-of-Way) City Landmark Site HS84-26 is listed under the theme of Communication and Transportation for the Spanish period (1777-1822). This district consists of an important transportation corridor which includes trees from Race Street to I-880; parcels adjacent are

Section 3.0 Environmental Setting, Impacts, and Mitigation
Envision San José 2040 General Plan 691 Draft Program EIR City of San José June 2011
excluded. The Alameda, part of the former Hispanic Period El Camino Real (The King’s Highway) was the best road in the region - though at times impassable - connecting the Pueblo de San José with Mission Santa Clara. The Alameda west of the Guadalupe River also served as a boundary line between Rancho Potrero de Santa Clara on the north and Rancho de los Coches on the south. In the 1850s the San José to San Francisco Stage ran along The Alameda. It was a toll road briefly between 1862-1868 and became a public road in 1871. Horse drawn trolleys ran along The Alameda in the 1870s, then electric trolleys in 1887, and later buses in 1938. “The Way of the Willows” along The Alameda is now bordered by 50 to 110 feet high sycamore trees with 23 to 45 inch diameters. A single “offshoot” of one of the original trees was still growing in front of 1860 The Alameda in 1982, although it no longer appears to be present. A single City of San José Heritage Tree, a large 64-inch valley oak is situated at 1570 The Alameda (HT-06-019). Many more Heritage Trees are located within “Garden Alameda” at 1510, 1520, 1550, 1570 and 1590 The Alameda. The Alameda ROW City Landmark District is in the Central/Downtown Planning Area. Other National Register Districts/Portions of National Register Districts in San José California Carnegie Libraries The East San José Carnegie Library, 1102 E. Santa Clara Street, is one of the California Carnegie Libraries, a listed National Register Multiple Property. Of the 144 Carnegie libraries built in California in 121 communities, 85 were still extant in 1989. Carnegie Libraries are important in their respective communities, eligible under Criterion A in the area of Social History for the association with library development in California during the years 1849-1921. This Classic Revival style building, built around 1907-1908, is also a City Landmark (HL77-10) under the theme of Government and Public Services for the Horticulture Period (1870-1918) and listed on the 1975 and 1979 Santa Clara County Heritage Resource Inventory. The East San José Carnegie Library is in the Central/Downtown Planning Area. United States Post Offices in California 1900-1941 The United States Post Office, 105 N. First Street, and part of the St. James Square Historic District [CA-SCl-466H (P-43-000467)] is one of 22 Significant United States Post Offices built in California 1900-1941. The central theme of the nomination consists of the evolution of Post Office as a building type during the first four decades of this century in California. This historic post office building is located in the Central/Downtown Planning Area. Santa Clara County Historical Conservation Districts (within City of San José SOI) New Almaden The New Almaden District (County District H1) is located 14 miles south of Downtown San José on Almaden Road. Mercury, also known as quicksilver, was produced at the New Almaden mines beginning in 1846, making it California’s first mining operation. The New Almaden area is listed on the City Historic Resources Inventory as a National Register District. The Spanishtown Site in New Almaden district is one of the 99 Mexican American State of California Ethnic Sites. The 1999 Santa Clara Heritage Resource Inventory lists 24 separate properties, mostly buildings, within the district. Components of County District H1 are listed on the City Inventory (21 on Almaden Road including Vichy Springs and another four on Bertram Road) as well as in the 1973 California History Plan and/or 1976 California Inventory of Historic Resources.
Section 3.0 Environmental Setting, Impacts, and Mitigation
Envision San José 2040 General Plan 692 Draft Program EIR City of San José June 2011
Portuguese Ranch The D’Artenay Portuguese Ranch (County District H2) is located south of Alum Rock Avenue and south of Mt. Hamilton Road with a southern boundary on Porter Lane southeast of Rolfe Court. This property appears to be listed on the City Historic Resources Inventory as the Hillside Orchard at 509 Porter Lane as an Identified Site/Structures (IS). Rancho Santa Teresa/Rancho Santa Teresa Historic District Most of the Rancho Santa Teresa Site/Rancho Santa Teresa Historic District (County District H4) at 298 Curie Drive is within the City of San José Sphere of Influence. Thirty-five (35) resources associated with the original Rancho Santa Teresa, a nearly 10,000-acre parcel granted to José Joaquin Bernal by the Mexican Government in 1834, have been identified within the district in an area roughly bounded by Santa Teresa County Park to the south, Hellyer Avenue to the north, Pearl Avenue to the west and Coyote Creek to the east. City of San José Conservation Districts Under the City’s Historic Preservation Ordinance, a Conservation Area is a geographically definable area of urban or rural character with identifiable attributes embodied by architecture, urban design, development patterns, setting, or geography; and history. Conservation Areas have a distinctive character and/or reflect significant development patterns associated with different eras of the City’s growth. Single-Family House Permits for changes to single-family homes and Development Permits for changes to multi-family residential and non-residential properties are reviewed for conformance with the City’s Your Old House Design Guidelines and the Secretary of the Interior’s Standards for Rehabilitation. Currently, there are six City-designated Conservation Areas within San José. Key features for each of these areas are noted below. Hanchett and Hester Park Conservation Area The Hanchett and Hester Park City Conservation Area consists of two adjacent neighborhoods that are generally bounded by Magnolia Street to the north, The Alameda to the east, Park Avenue to the west, and Mariposa Avenue to the south. Hanchett and Hester Park were designed by John McLaren (1846-1943), the designer of San Francisco’s Golden Gate Park. The mostly single-family residences date from approximately 1906 to 1935 and include Queen Anne, Craftsman Bungalow, and Spanish Mission Colonial Revival styles as well as several Prairie style in Hanchett Park. The Hanchett Park neighborhood retains some of the best mix of Prairie, Spanish Revival and, Craftsman residences in San José. In addition, Martin Avenue between Park Avenue and The Alameda includes City of San José Heritage Trees – 80 Mexican Fan Palms. Market-Almaden Conservation Area The Market-Almaden Conservation Area, surrounded by the Downtown Core, is located just west of S. Market Street and east of Almaden Avenue, between Balbach Street on the north and W. Reed Street and I-280 on the south. The area is characterized by mostly single-family residences of Victorians and Craftsman bungalows dating from the late 1800s and early 1900s.
Section 3.0 Environmental Setting, Impacts, and Mitigation
Envision San José 2040 General Plan 693 Draft Program EIR City of San José June 2011
Martha Gardens Conservation Area The Martha Gardens Conservation Area is generally bounded by I-280 on the north, Martha Street on the south, the alley between S. First and S. Second Streets on the west, and rear property lines of lots on the east side of S. Third Street on the east. The area includes vernacular and architect-designed single-family residences dating from the mid-1870s to around 1940, residences converted to boarding houses, and post-World War II multiple-unit residences. Naglee Park Conservation Area The Naglee Park Conservation Area is the former 140-acre estate of General Henry M. Naglee, a veteran of the Civil War (1861-1865). His heirs sold the estate under the guidance of T.S. Montgomery, San José’s leading real estate developer and three years after its subdivision in 1902, 1,503 residences had been built. This district is noted for fine early 20th century residences in an eclectic variety of architectural styles including bungalows and the Spanish Colonial Revival styles, many architect designed, and heritage trees. The grounds also included the Naglee House and the still extant Naglee Carriage House at 49 S. Fourteenth Street and another at 95 S. Fourteenth Street, both listed in the City Inventory as eligible for inclusion on the National Register. Palm Haven Conservation Area The Palm Haven Conservation Area is bounded by Riverside Drive on the west and north, Bird Avenue on the east, and Coe Avenue on the south. The area includes residences constructed from around 1910, the 1930s and 1940s which are noted for their excellence of design layout. Many of the residences were designed by architects. A gateway on the north side of the intersection of Plaza Drive and Coe Avenue leads into the subdivision. City of San José Heritage Trees (HG-06-008), mostly Mexican Fan Palms with some Canary Island Date Palms planted about 1913, line all the streets, are present within Palm Haven Park, and bisect the namesake Palm Haven Avenue median to the Park. Guadalupe/Washington Conservation Area The Guadalupe/Washington Conservation Area, south of Downtown San José and I-280, is characterized by streetscapes of mostly late 19th and early 20th century National, Queen Anne, Neoclassical, Craftsman, and Minimal Traditional cottages with a similarity of scale and setbacks, mature landscaping and other features.
Archaeological Resources The presence of significant subsurface prehistoric and historic archaeological resources within the City has been demonstrated by finds encountered during the development of housing, commercial, industrial, transportation and flood control projects over the past 80 years. Project related excavations have exposed many significant buried archaeological resources including major Native American villages along major water courses. Prehistoric and Historic era sites associated with Native Americans over the past 5,000 years in San José include habitation sites ranging from large villages to seasonal and temporary campsites and non-habitation sites including stone tool and other manufacturing areas, quarries for tool stone procurement, cemeteries usually associated with large villages, isolated burial locations, rock art
Section 3.0 Environmental Setting, Impacts, and Mitigation
Envision San José 2040 General Plan 694 Draft Program EIR City of San José June 2011
sites, bedrock mortars or other milling feature sites, and Native American trails. Most prehistoric archaeological sites have been found along or very near fresh water sources such as creeks and springs, in valleys near both permanent and seasonal water sources including the freshwater marshes once present throughout the valley, at the base of the hills, and along and adjacent to the major north/south Native American trails as well as at stone sources for tools in the foothills surrounding the valley. Historic Era archaeological resources associated with the Spanish, Mexican, and American Periods include the remains of historic buildings, wells, privies, trash deposits, transportation related features, residential, and commercial and industrial sites. Archaeological resources are usually associated with the development of the City of San José core and outlying agricultural and rural areas from the 1830s to the 1930s. The resources are linked with buildings from former agricultural, industrial, business and residential uses. It is probable that many potential resources including foundations, wells, privies, and trash deposits have been impacted and removed as a result of previous excavations for infrastructure improvements and other development activities over the past 100 years. 3.11.1.6 Cultural Resources Not Currently Identified in Inventories The City of San José is a large city that grew through of a series of annexations that incorporated small communities and large agricultural tracts and hillside areas. While the overall historic context and periods of historic significance of the City have been previously identified by Laffey and others, as time goes by and development and redevelopment removes examples of the City’s cultural past, the historic significance of some buildings, structures, objects and the cultural landscape may become more important. Buildings, neighborhoods, and cultural landscapes that once were much more common or recognizable within San José, such as rural enclaves or ethnic neighborhoods such as the Italian-immigrant community of Goosetown or Chinatown, are now either not extant, dominated by later urban development, or represented by isolated remnants of representative buildings and structures such as in the formerly rural areas of Alviso, Evergreen, and Almaden Valley. There also is a large amount of development in the “recent past” that is now over 50 years old, one of the criteria used in the assessment of historic significance.159 There is much that is not known, both in the way of individual structures or potential districts, because no comprehensive survey of the City has been undertaken.
159 When evaluating the possible significance of a historic resource, a resource less than fifty years old is usually considered ineligible for listing in the National Register unless it is of exceptional importance. In contrast, a resource that is less than fifty years old may be considered for listing in the California Register of Historical Resources if sufficient time has passed to understand its historical importance. The City of San Jose has no specific age criteria for City Landmark structures. As noted in Regulatory Framework in this section, a number of criteria are used to assess historic significance, and not just age.
Section 3.0 Environmental Setting, Impacts, and Mitigation
Envision San José 2040 General Plan 695 Draft Program EIR City of San José June 2011
3.11.2 Thresholds of Significance For the purposes of this PEIR, a cultural resources impact is significant if implementation of the proposed Envision San José 2040 General Plan would: • Cause a substantial adverse change is the significance of a historic resource as defined in
§15064.5 of the CEQA Guidelines; • Cause a substantial adverse change in the significance of an archaeological resource pursuant
to §15064.5 of the CEQA Guidelines; • Directly or indirectly destroy a unique paleontological resource on site or unique geologic
feature; or • Disturb any human remains, including those interred outside formal cemeteries. 3.11.3 Overview of Cultural Resources Impacts Known cultural resources that could be adversely effected by future development and redevelopment within the urbanized areas of San José are identified for the 13 Planning Areas and each of the planned growth areas (Villages, Employment Lands, and Specific Plan areas) in Appendix J (refer to Tables 6.1-6.13 in the Cultural Resources Impact Report). It is important to note that there are also other buildings, structures and resources in these areas that based upon either a visual basis or preliminary review may be eligible for a national, state or local historic register and therefore also be a significant resource under CEQA. Further evaluation and study would be necessary to determine whether a particular building, structure, place, neighborhood district, larger area or other resource is eligible for listing on federal, state or local registers or historic inventories. For example, windshield surveys of the built environment may identify buildings and structures that appear potentially eligible but individual background research is necessary to complete the identification and formal evaluation. An overview of known cultural resources and conditions for City Planning Areas is provided below. While this text only summarizes what is known, persons proposing to develop or purchase for development land in a particular area should review the more detailed surveys in Appendix J and on-file with the City of San José. Since future CEQA review will be based on this information as a starting point, City staff can refer to this in determining the scope of future environmental review. 3.11.3.1 Almaden Planning Area No cultural resources are known to be present in the one area designated as a Village (V71) in the Almaden Planning Area. The vacant lands and entitled parcels in this Planning Area are archaeologically sensitive, with several historic and prehistoric archaeological sites within or adjacent to these properties, which may be eligible for the California Register or the National Register. The site of a Spanish adobe is adjacent to a vacant property in the Almaden Planning Area, and a City Landmark, the [Ruben] Baker Ranch Buildings on Almaden Road, are present on a larger property categorized as a vacant site. 3.11.3.2 Alum Rock Planning Area Employment Lands in the Alum Rock Planning Area are archaeologically sensitive, and include recorded archaeological sites and historic architectural resources that may be eligible for the California Register or the National Register. A City of San José designated Structure of Merit is also located within the Employment Lands. Five of the 11 designated Villages and Corridors in this Planning Area are archaeologically sensitive, although no sites have been recorded. Architectural
Section 3.0 Environmental Setting, Impacts, and Mitigation
Envision San José 2040 General Plan 696 Draft Program EIR City of San José June 2011
resources include a City Landmark (Five Wounds Church) and Structures of Merit. The site of a Spanish adobe is located within one of the designated corridors. Vacant lands and entitled parcels are also archaeologically sensitive. Other architectural resources that may be eligible for the California Register or the National Register have been noted in the Alum Rock Planning Area. 3.11.3.3 Alviso Planning Area The Alviso Planning Area is archaeologically sensitive, with recorded prehistoric and historic archaeological sites, Spanish adobe locations, and architectural resources that have been determined eligible for the California Register or the National Register. The central Alviso village area is in a National Register District and the Port of Alviso on Guadalupe Slough is a State Landmark. Many of the architectural resources are contributing elements to the National Register district, as well as City of San José Landmarks and/or Contributing Structures. 3.11.3.4 Berryessa Planning Area Employment Lands in the Berryessa Planning Area include archaeologically sensitive areas, with recorded and reported sites that may be eligible for the California Register or the National Register. Architectural resources that may be eligible for listing on federal, state or local registers are also present in the Berryessa Planning Area. Villages and Corridors in this Planning Area include archaeologically sensitive areas (four of six), a reported site, and architectural resources that may be eligible for listing on the California Register or the National Register. The vacant lands and entitled parcels are archaeologically sensitive. The vacant lands include archaeological and architectural resources (e.g., farm or ranch buildings on larger vacant properties) that also may be eligible for the California Register or the National Register. 3.11.3.5 Cambrian/Pioneer Planning Area Five of the eight areas designated as Villages or Corridors in the Cambrian/Pioneer Planning Area are archaeologically sensitive. One area includes a site which is potentially eligible for the California Register or the National Register. Three areas include architectural resources which may also be eligible. Vacant lands and entitled parcels in the Cambrian/Pioneer Planning Area are archaeologically sensitive. Entitled parcels also include architectural resources which may be eligible for the California Register or the National Register. 3.11.3.6 Central/Downtown Planning Area The Downtown Core is archaeologically sensitive, with numerous recorded prehistoric and historic archaeological sites. Many of these have been listed on the California Register or the National Register. The area includes a number of City Landmarks, Structures of Merit, and Contributing Structures, as well as structures that are being considered for City Landmark status. National Register districts, City Landmark districts, and City Conservation areas are also located within or adjacent to the Downtown. Outside of Downtown, three of the four specific plan areas and five of the eight designated Villages and Corridors in the Central/Downtown Planning Area are archaeologically sensitive. Recorded archaeological sites are also present in several identified growth areas. As shown on Figures 3.11-2 and 3.11-3, there also are City of San José Landmarks, Structures of Merit, and Contributing
Section 3.0 Environmental Setting, Impacts, and Mitigation
Envision San José 2040 General Plan 697 Draft Program EIR City of San José June 2011
Structures and historic districts (e.g., The Alameda ROW) outside the Downtown but within the Central/Downtown Planning Area. 3.11.3.7 Coyote Planning Area The Employment Lands in the Coyote Planning Area are archaeologically sensitive, with several recorded sites and numerous architectural resources present. These archaeological and architectural resources may be eligible for the California Register or the National Register. 3.11.3.8 Edenvale Planning Area Employment Lands and a number of the designated Villages and Corridors in the Edenvale Planning Area are archaeologically sensitive. There are several known archaeological sites and architectural resources within growth areas which are eligible for the National Register or California Register. Vacant lands and entitled parcels in the Edenvale Planning Area are archaeologically sensitive, but include no known resources. 3.11.3.9 Evergreen Planning Area The Evergreen Planned Community/Specific Plan Area is archaeologically sensitive, but includes no known resources. The Evergreen Employment Lands are also archaeologically sensitive, and include archaeological sites which may be eligible for listing on the California Register or the National Register. Five of the six areas designated as Villages or Corridors in Evergreen are archaeologically sensitive. Three of these Villages and Corridors include archaeological sites which may be eligible for the California Register or the National Register. Vacant lands and entitled parcels are archaeologically sensitive with recorded prehistoric sites present. Historic architectural resources are also present on vacant lands and entitled parcels in this Planning Area. 3.11.3.10 North San José Planning Area The North San José Planning Area includes the Rincon South Planned Community/Specific Plan Area, the North San José Employment Lands, and a Village. These are all archaeologically sensitive, with recorded archaeological sites, prehistoric village sites and architectural resources present. Spanish adobe sites are located within North San José Employment Lands along with resources eligible for the California Register or the National Register. 3.11.3.11 South San José Planning Area The Communication Hill Specific Plan Area is archaeologically sensitive, and includes recorded sites and historic architectural resources, all of which are potentially eligible for the California Register or the National Register. Employment Lands along Monterey Road and Senter Road also are archaeologically sensitive, with potentially eligible archaeological and architectural resources. Known resources include a City Landmark and Structures of Merit, as well as Spanish adobe sites. Five of seven Villages and Corridors in the South San José Planning Area are archaeologically sensitive, with one also including recorded archaeological sites and the site of a Spanish adobe. Architectural resources that may be historically significant also have been noted at several locations (e.g., within Villages and Corridors VR8, VR10, C45).
Section 3.0 Environmental Setting, Impacts, and Mitigation
Envision San José 2040 General Plan 698 Draft Program EIR City of San José June 2011
3.11.3.12 West Valley Planning Area Seven of the nine areas designated as Villages or Corridors are archaeologically sensitive, with three having recorded archaeological sites present. The sites of Spanish adobes are present within two Corridors. Two State Landmarks are recorded in the Saratoga Avenue Corridor (C41). These archaeological and architectural resources are potentially eligible for the California Register or the National Register. Vacant lands within the West Valley Planning Area are archaeologically sensitive. Entitled parcels in the West Valley Planning Area are also archaeologically sensitive, including recorded archaeological sites and a prehistoric Native American village site. Vacant lands and entitled parcels within the West Valley Planning Area both include City Structures of Merit. 3.11.3.13 Willow Glen Planning Area Five of the seven areas designated as Villages or Corridors in the Willow Glen Planning Area are archaeologically sensitive, although there are no recorded archaeological sites. National Register eligible historic architectural resources are present within Bascom Avenue Corridor (C40). 3.11.4 Cultural and Paleontological Resources Impacts 3.11.4.1 Historical Architectural Resources The types of cultural resources that meet the definition of a historical resource under CEQA (Public Resources Code Section 21084.1 and Section 15064.5 of the CEQA Guidelines) include districts, sites, buildings, structures and objects that are significant for their traditional, cultural and/or historical associations. Generally a resource is considered to be historically significant by the City of San José if it is listed or meets the criteria for listing on the National Register, California Register, or as a City Landmark on the City’s Historic Resources Inventory. Under CEQA, physical demolition, destruction, relocation, or alteration of the resource or its immediate surroundings that changes the significance of an historical resource is considered a significant effect. New development and redevelopment allowed under the proposed Envision San José 2040 General Plan could result in significant impacts to historical architectural resources. New residential, commercial, industrial, institutional uses proposed within many of the Growth Areas described above as well as transportation and other related infrastructure improvements that would occur under the proposed General Plan, could result in the following types of impacts to significant historic architectural resources: • demolition; • relocation; • inappropriate or unsympathetic modification (e.g., use of incompatible materials, designs, or
construction techniques in a manner that alters character-defining features); or • inappropriate new construction that conflicts with or isolates historic buildings or structures,
such as those within a historic district. Activities that change the historic fabric or setting of a significant historic architectural resource such that the resource’s ability to convey its significance would be materially impaired160 would result in a significant impact.
160 Under CEQA, material impairment of a significant historical resource refers to when a project: 1) demolishes or
Section 3.0 Environmental Setting, Impacts, and Mitigation
Envision San José 2040 General Plan 699 Draft Program EIR City of San José June 2011
Deliberate and/or incremental deterioration of recorded and architectural properties eligible for the California Register or as a City Landmark due to inaction/neglect, lack of occupancy, or inappropriate uses could also affect historic properties over time.
Proposed General Plan Policies and Actions That Reduce or Avoid Adverse Impacts to Historical Architectural Resources
The proposed Envision San José 2040 General Plan includes updated land use policies that address the preservation of historic architectural resources. Revisions to existing policies clarify priorities for the preservation of City landmarks required as a part of the City’s development review process. Proposed General Plan Policies and Actions that provide program-level mitigation for historic architectural resources within the City are identified below. Landmarks and Districts
Policy LU-13.1 Preserve the integrity and fabric of candidate or designated Historic Districts.
Policy LU-13.2 Preserve candidate or designated landmark buildings, structures and historic objects, with first priority given to preserving and rehabilitating them for their historic use, second to preserving and rehabilitating them for a new use, or third to rehabilitation and relocation on-site. If the City concurs that no other option is feasible, candidate or designated landmark structures should be rehabilitated and relocated to a new site in an appropriate setting.
Policy LU-13.3 For landmark structures located within new development areas, incorporate the landmark structures within the new development as a means to create a sense of place, contribute to a vibrant economy, provide a connection to the past, and make more attractive employment, shopping, and residential areas.
Policy LU-13.4 Require public and private development projects to conform to the adopted City Council Policy on the Preservation of Historic Landmarks.
Policy LU-13.6 Modifications to candidate or designated landmark buildings or structures shall conform to the Secretary of the Interior’s Standards for Treatment of Historic Properties and/or appropriate State of California requirements regarding historic buildings and/or structures, including the California Historical Building Code.
Policy LU-13.7 New development, alterations, and rehabilitation/remodels within a designated or candidate Historic District shall be designed to be compatible with the character of the Historic District and conform to the Secretary of the Interior’s Standards for the Treatment of Historic Properties, appropriate State of California requirements regarding historic buildings and/or structures (including the California Historic Building Code) and to applicable historic design guidelines adopted by the City Council.
materially alters in an adverse manner those physical characteristics of an historical resource that convey its historical significance and that justify its inclusion in, or eligibility for, inclusion in the California Register of Historical Resources; or 2) demolishes or materially alters in an adverse manner those physical characteristics that account for its inclusion in a local register of historical resources pursuant to section 5020.1(g) of the Public Resources Code, unless the public agency reviewing the effects of the project establishes by a preponderance of evidence that the resource is not historically or culturally significant; or 3) demolishes or materially alters in an adverse manner those physical characteristics of a historical resource that convey its historical significance and that justify its eligibility for inclusion in the California Register of Historical Resources as determined by a lead agency for purposes of CEQA.
Section 3.0 Environmental Setting, Impacts, and Mitigation
Envision San José 2040 General Plan 700 Draft Program EIR City of San José June 2011
Policy LU-13.8 Require that new development, alterations, and rehabilitation/remodels adjacent to a designated or candidate landmark or Historic District be designed to be sensitive to the character of the nearby Historic District or landmark.
Policy LU-13.10 The City’s public works projects (street lights, street tree plantings, sidewalk design, etc.) shall promote, preserve, or enhance the historic character of Historic Districts.
Policy LU-13.13 Foster the rehabilitation of buildings, structures, areas, places, and districts of historic significance. Utilize incentives permitting flexibility as to the uses; transfer of development rights; tax relief for designated landmarks and districts; easements; alternative building code provisions for the reuse of historic structures; and financial incentives.
Policy LU-13.15 Implement City, State, and Federal historic preservation laws, regulations, and codes to ensure the adequate protection of historic resources.
Action LU-13.21
Implement strategic General Plan and zoning changes as indicated by federal, state or municipal “historic” or “conservation area” designations, in order to maintain neighborhood vitality and character and to preserve the integrity of historic structures located within those neighborhoods. To preserve predominantly single-family historic neighborhoods, rezone residential structures located in these areas to a single-family zoning designation.
Historic Structures of Lesser Significance
Policy LU-14.5 Continue and strengthen enforcement programs, such as those addressing vacant buildings, to promote the maintenance and survival of all classes of the city’s historic and cultural resources.
Site Development
Policy IP-10.3 In addition to the Site Development permit, an Historic Preservation permit is required for modifications to a designated Historic Landmark structure. This permit process fosters the implementation of the Historic Preservation goals and policies of the General Plan.
In addition to the policies listed above that call for implementation of measures to ensure the adequate protection of historic resources, the City recognizes that the significance of historic resources can shift over time as new information becomes available, the existing built environment ages, and patterns of human history and their importance emerges. As a large city, covering approximately 178 square miles and encompassing a mosaic of neighborhoods and key commercial, industrial, and institutional development with a history of innovation, identifying all of the possible historic resources within the city is an on-going challenge. Land use policies in the proposed General Plan address adding to the City’s Historic Resources Inventory, identifying new significant historic resources, and conserving existing single-family neighborhoods. In addition, the proposed General Plan calls for incorporating historic resources into the fabric of the new villages and corridors as being a primary strategy for new growth. While each village has a planned job and housing growth capacity, the distribution of redevelopment would be carefully defined through a Village Plan. Villages can also include single-family detached, historic structures, or other properties that are not intended to redevelop. The intent of specifically allowing inclusion of these areas is to ensure that the Village Plan for the area addresses potentially sensitive
Section 3.0 Environmental Setting, Impacts, and Mitigation
Envision San José 2040 General Plan 701 Draft Program EIR City of San José June 2011
interfaces between more and less intensive uses and explicitly reflects the importance of historic resources in that interface. Policies that would facilitate the identification and protection of the historic fabric and cultural landscape of San José through updates of the City’s Historic Resources Inventory, education, and outreach to the community are listed below. Landmarks and Districts
Policy LU-13.11 Maintain and update an inventory of historic resources in order to promote awareness of these community resources and as a tool to further their preservation. Give priority to identifying and establishing Historic Districts.
Policy LU-13.20 Explore funding options and techniques to proactively conduct additional historic surveys and to maintain and update the City’s Historic Resources Inventory. As funding allows, undertake comprehensive area-wide surveys of the city to identify potential Historic Districts, Cultural Landscapes at the City’s edge, and significant buildings and/or structures, including Traditional Cultural Properties.
Action LU-13.21 Implement strategic General Plan and zoning changes as indicated by federal, state or municipal “historic” or “conservation area” designations, in order to maintain neighborhood vitality and character and to preserve the integrity of historic structures located within those neighborhoods. To preserve predominantly single-family historic neighborhoods, rezone residential structures located in these areas to a single-family zoning designation.
Historic Structures of Lesser Significance
Policy LU-14.1 Preserve the integrity and enhance the fabric of areas or neighborhoods with a cohesive historic character as a means to maintain a connection between the various structures in the area.
Policy LU-14.3 New development, alterations, and rehabilitation/remodels in conservation areas should be designed to be compatible with the character of the Conservation Area. In particular, projects should respect character defining elements of the area that give the area its identity. These defining characteristics could vary from area to area and could include density, scale, architectural consistency, architectural variety, landscape, etc.
Public Awareness
Policy LU-15.1 Encourage widespread public participation in the identification and designation of historically or culturally significant buildings, structures, sites, areas, and/or places to update and maintain the City’s Historic Resources Inventory.
Policy LU-15.4 Educate/inform the public of the importance of San José’s strong historic connections to past industry. Preserve historical resources from agriculture to high-tech whenever possible, feasible, and appropriate to serve as a link between San José’s present and past.
Section 3.0 Environmental Setting, Impacts, and Mitigation
Envision San José 2040 General Plan 702 Draft Program EIR City of San José June 2011
Existing Regulations and Adopted Plans and Policies Existing local, state and federal regulations that would reduce or avoid impacts to historical resources include: • National Historic Preservation Act • Secretary of Interior’s Standards for the Treatment of Historic Properties • California Public Resources Code • CEQA • California Historic Building Code • City of San José City Council Policy – Preservation of Historic Landmarks • City Criteria for Local Significance in adopted Guidelines for Historic Reports • Municipal Code Chapter 13.48 Historic Preservation • Municipal Code Chapter 17.38 Maintenance of Vacant Buildings Discussion of Historical Architectural Resource Impacts Future development allowed under the proposed General Plan could impact, either directly or indirectly, historic resources, both those that are currently listed, and those that have yet to be identified and evaluated. Policies in the proposed General Plan call for continued updating of the City’s Historical Resources Inventory and buildings over or near 50 years of age will continue to be evaluated prior to demolition or substantial alteration on a case-by-case basis. Implementation of the proposed policies and existing regulations, including application of the California Historic Building Code, the City’s environmental and design review processes, will serve to reduce historic architectural resources impacts to a less than significant level. Impact CULT-1: New development and redevelopment allowed under the proposed General
Plan could result in a substantial adverse change in the significance of historic architectural resources. Implementation of proposed General Plan policies and existing regulations and programs would substantially reduce impacts to historically significant architectural resources. (Less Than Significant Impact)
3.11.4.2 Traditional Cultural Properties and Cultural Landscapes The National Register of Historic Places contains a wide range of historic property types, reflecting the diversity of the nation’s history and culture. Buildings, structures, and sites; groups of buildings, structures or sites forming historic districts; landscapes; and individual objects are all included in the Register if they meet the criteria specified in the National Register’s Criteria for Evaluation (36 CFR 60.4). Such properties reflect many kinds of significance in architecture, history, archeology, engineering, and culture.161 There are many definitions of the word “culture”; but in the National Register program the word is understood to mean the traditions, beliefs, practices, lifeways, arts, crafts, and social institutions of any community, be it a Native American tribe, a local ethnic group, or the people of the nation as a
161 U.S. Department of the Interior, National Park Service. National Register Bulletin Guidelines for Evaluating and Documenting Traditional Cultural Properties. Revised 1998. Available at: <http://www.nps.gov/history/nr/publications/bulletins/nrb38/ >

Section 3.0 Environmental Setting, Impacts, and Mitigation
Envision San José 2040 General Plan 703 Draft Program EIR City of San José June 2011
whole.162 The discussion of impacts to historic architectural resources in Section 3.11.4.1 above focuses on buildings and structures as resources due to their architecture and history; the discussion below addresses properties, not yet identified in the City of San José, that may be historically significant due to cultural features.
Traditional Cultural Properties A “Traditional Cultural Property” “. . . can be defined generally as one that is eligible for inclusion in the National Register because of its association with cultural practices or beliefs of a living community that (a) are rooted in that community’s history, and (b) are important in maintaining the continuing cultural identity of the community”. Within San José, a number of neighborhoods (e.g., Japantown, Chinatown, Alviso, Alum Rock) have or have had strong ties to local ethnic or immigrant communities. Currently there are no Traditional Cultural Properties identified within the City of San José. However, a potential for traditional cultural properties exists due to the patterns of growth and immigration within the City as well as patterns of prehistory.
Cultural Landscapes A “Cultural Landscape” is a geographic area, including both cultural and natural resources and the wildlife or domestic animals therein, associated with a historic event, activity, or person or exhibiting other cultural or aesthetic values. There are four general types of cultural landscapes, not mutually exclusive: historic sites, historic designed landscapes, historic vernacular landscapes, and ethnographic landscapes. No cultural landscapes have yet been identified within the City. Areas that could be considered historic cultural landscapes dating between 1850 and 1900/1920 and possibly later are rural or partially developed areas including Alviso, the Coyote Valley, and Almaden. Landscapes in these areas may best reflect the region’s historical land uses, such as settlement patterns, town development strategies, homesteading, mining practices, water conveyance and storage systems, transportation, and farming. The City also includes numerous historical parks, schools, cemeteries, and designated properties that postdate 1900/1920 and predate 1960 and exist mostly within the Urban Growth Boundary.
Proposed General Plan Policies and Actions
That Reduce or Avoid Impacts to Traditional Cultural Properties and Cultural Landscapes
The proposed Envision San José 2040 General Plan includes updated policies that address protection of historic resources. As discussed in Section 3.11.4.1 above, land use policies in the proposed General Plan, including LU-11.15, call for implementation of measures to ensure the adequate protection historic resources. Proposed General Plan policies and actions also address adding to the City’s Historic Resources Inventory and identifying new significant historic resources. In addition, the description of the use of Village Overlays in the proposed General Plan calls for incorporating historic resources into the fabric of the new villages and corridors. General Plan policies and actions that specifically address the identification of Cultural Landscapes and Traditional Cultural Properties are listed below.
162 Ibid.
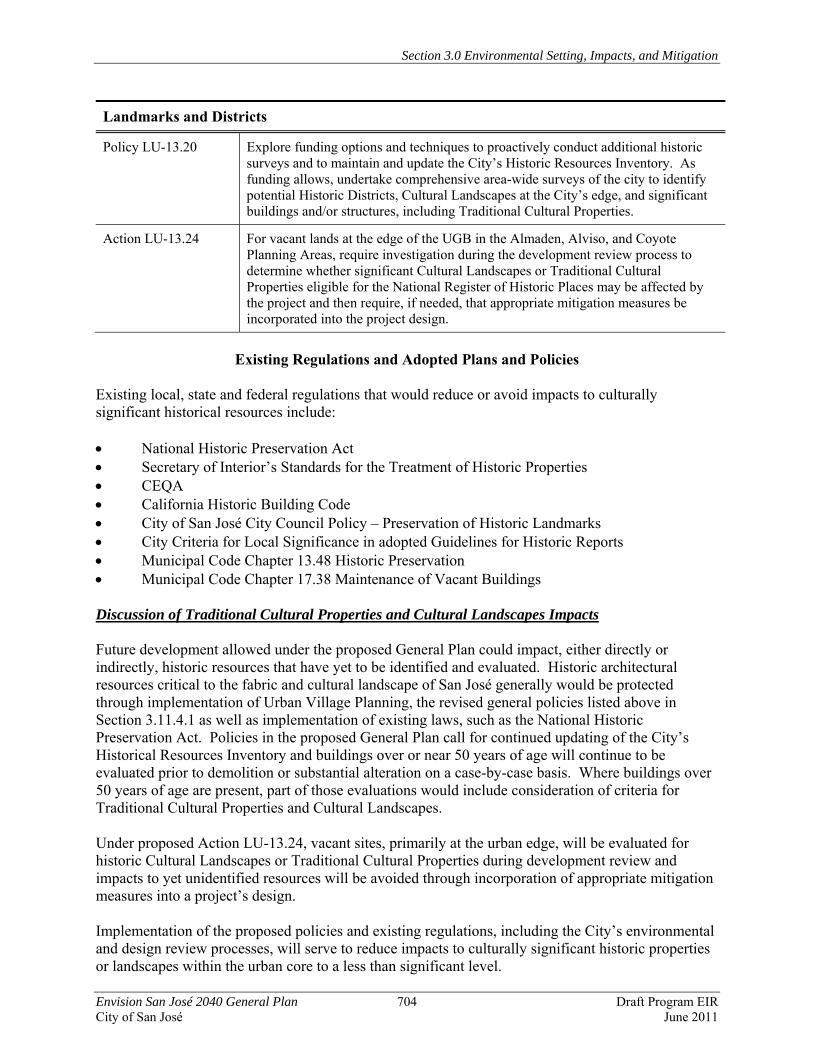
Section 3.0 Environmental Setting, Impacts, and Mitigation
Envision San José 2040 General Plan 704 Draft Program EIR City of San José June 2011
Landmarks and Districts
Policy LU-13.20 Explore funding options and techniques to proactively conduct additional historic surveys and to maintain and update the City’s Historic Resources Inventory. As funding allows, undertake comprehensive area-wide surveys of the city to identify potential Historic Districts, Cultural Landscapes at the City’s edge, and significant buildings and/or structures, including Traditional Cultural Properties.
Action LU-13.24 For vacant lands at the edge of the UGB in the Almaden, Alviso, and Coyote Planning Areas, require investigation during the development review process to determine whether significant Cultural Landscapes or Traditional Cultural Properties eligible for the National Register of Historic Places may be affected by the project and then require, if needed, that appropriate mitigation measures be incorporated into the project design.
Existing Regulations and Adopted Plans and Policies
Existing local, state and federal regulations that would reduce or avoid impacts to culturally significant historical resources include: • National Historic Preservation Act • Secretary of Interior’s Standards for the Treatment of Historic Properties • CEQA • California Historic Building Code • City of San José City Council Policy – Preservation of Historic Landmarks • City Criteria for Local Significance in adopted Guidelines for Historic Reports • Municipal Code Chapter 13.48 Historic Preservation • Municipal Code Chapter 17.38 Maintenance of Vacant Buildings Discussion of Traditional Cultural Properties and Cultural Landscapes Impacts Future development allowed under the proposed General Plan could impact, either directly or indirectly, historic resources that have yet to be identified and evaluated. Historic architectural resources critical to the fabric and cultural landscape of San José generally would be protected through implementation of Urban Village Planning, the revised general policies listed above in Section 3.11.4.1 as well as implementation of existing laws, such as the National Historic Preservation Act. Policies in the proposed General Plan call for continued updating of the City’s Historical Resources Inventory and buildings over or near 50 years of age will continue to be evaluated prior to demolition or substantial alteration on a case-by-case basis. Where buildings over 50 years of age are present, part of those evaluations would include consideration of criteria for Traditional Cultural Properties and Cultural Landscapes. Under proposed Action LU-13.24, vacant sites, primarily at the urban edge, will be evaluated for historic Cultural Landscapes or Traditional Cultural Properties during development review and impacts to yet unidentified resources will be avoided through incorporation of appropriate mitigation measures into a project’s design. Implementation of the proposed policies and existing regulations, including the City’s environmental and design review processes, will serve to reduce impacts to culturally significant historic properties or landscapes within the urban core to a less than significant level.
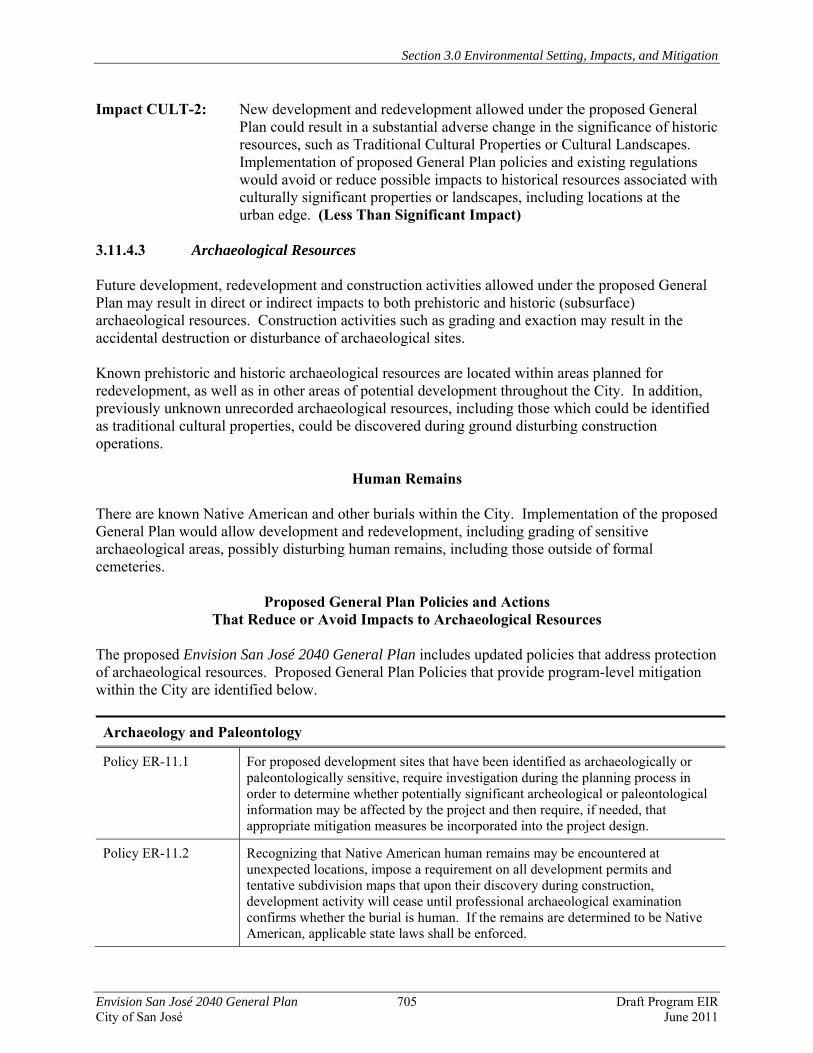
Section 3.0 Environmental Setting, Impacts, and Mitigation
Envision San José 2040 General Plan 705 Draft Program EIR City of San José June 2011
Impact CULT-2: New development and redevelopment allowed under the proposed General Plan could result in a substantial adverse change in the significance of historic resources, such as Traditional Cultural Properties or Cultural Landscapes. Implementation of proposed General Plan policies and existing regulations would avoid or reduce possible impacts to historical resources associated with culturally significant properties or landscapes, including locations at the urban edge. (Less Than Significant Impact)
3.11.4.3 Archaeological Resources Future development, redevelopment and construction activities allowed under the proposed General Plan may result in direct or indirect impacts to both prehistoric and historic (subsurface) archaeological resources. Construction activities such as grading and exaction may result in the accidental destruction or disturbance of archaeological sites. Known prehistoric and historic archaeological resources are located within areas planned for redevelopment, as well as in other areas of potential development throughout the City. In addition, previously unknown unrecorded archaeological resources, including those which could be identified as traditional cultural properties, could be discovered during ground disturbing construction operations.
Human Remains There are known Native American and other burials within the City. Implementation of the proposed General Plan would allow development and redevelopment, including grading of sensitive archaeological areas, possibly disturbing human remains, including those outside of formal cemeteries.
Proposed General Plan Policies and Actions That Reduce or Avoid Impacts to Archaeological Resources
The proposed Envision San José 2040 General Plan includes updated policies that address protection of archaeological resources. Proposed General Plan Policies that provide program-level mitigation within the City are identified below. Archaeology and Paleontology
Policy ER-11.1 For proposed development sites that have been identified as archaeologically or paleontologically sensitive, require investigation during the planning process in order to determine whether potentially significant archeological or paleontological information may be affected by the project and then require, if needed, that appropriate mitigation measures be incorporated into the project design.
Policy ER-11.2 Recognizing that Native American human remains may be encountered at unexpected locations, impose a requirement on all development permits and tentative subdivision maps that upon their discovery during construction, development activity will cease until professional archaeological examination confirms whether the burial is human. If the remains are determined to be Native American, applicable state laws shall be enforced.
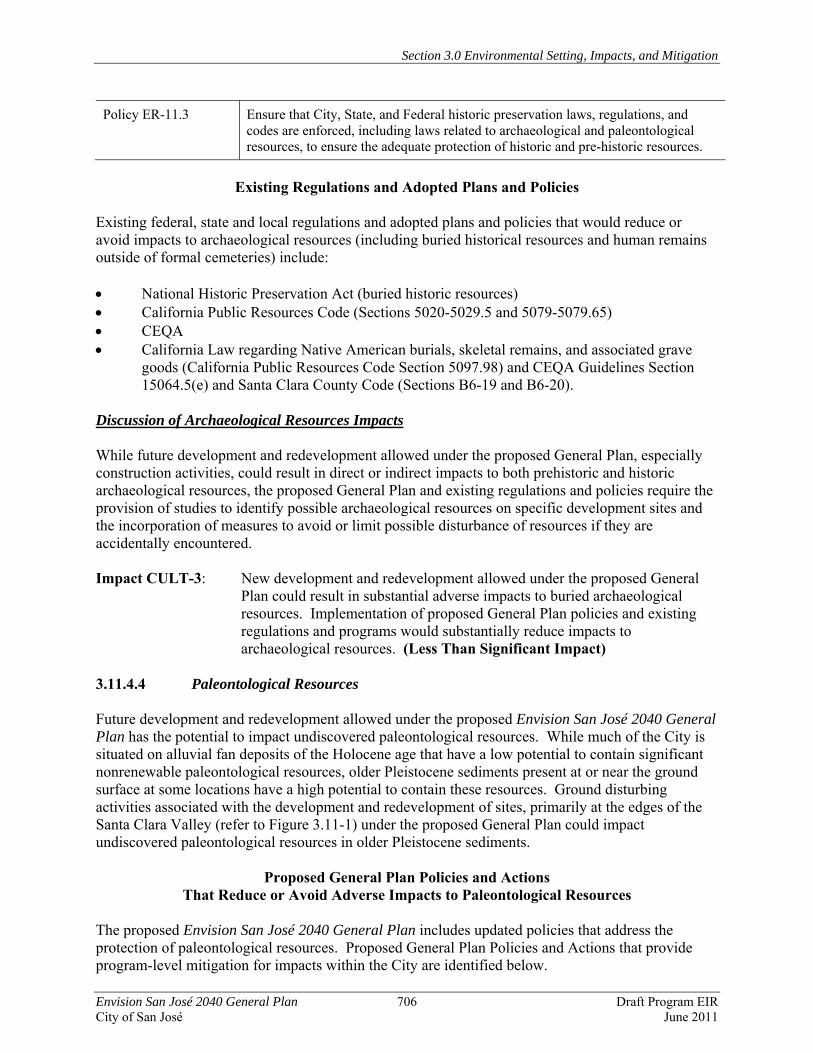
Section 3.0 Environmental Setting, Impacts, and Mitigation
Envision San José 2040 General Plan 706 Draft Program EIR City of San José June 2011
Policy ER-11.3 Ensure that City, State, and Federal historic preservation laws, regulations, and codes are enforced, including laws related to archaeological and paleontological resources, to ensure the adequate protection of historic and pre-historic resources.
Existing Regulations and Adopted Plans and Policies
Existing federal, state and local regulations and adopted plans and policies that would reduce or avoid impacts to archaeological resources (including buried historical resources and human remains outside of formal cemeteries) include: • National Historic Preservation Act (buried historic resources) • California Public Resources Code (Sections 5020-5029.5 and 5079-5079.65) • CEQA • California Law regarding Native American burials, skeletal remains, and associated grave
goods (California Public Resources Code Section 5097.98) and CEQA Guidelines Section 15064.5(e) and Santa Clara County Code (Sections B6-19 and B6-20).
Discussion of Archaeological Resources Impacts While future development and redevelopment allowed under the proposed General Plan, especially construction activities, could result in direct or indirect impacts to both prehistoric and historic archaeological resources, the proposed General Plan and existing regulations and policies require the provision of studies to identify possible archaeological resources on specific development sites and the incorporation of measures to avoid or limit possible disturbance of resources if they are accidentally encountered.
Impact CULT-3: New development and redevelopment allowed under the proposed General
Plan could result in substantial adverse impacts to buried archaeological resources. Implementation of proposed General Plan policies and existing regulations and programs would substantially reduce impacts to archaeological resources. (Less Than Significant Impact)
3.11.4.4 Paleontological Resources Future development and redevelopment allowed under the proposed Envision San José 2040 General Plan has the potential to impact undiscovered paleontological resources. While much of the City is situated on alluvial fan deposits of the Holocene age that have a low potential to contain significant nonrenewable paleontological resources, older Pleistocene sediments present at or near the ground surface at some locations have a high potential to contain these resources. Ground disturbing activities associated with the development and redevelopment of sites, primarily at the edges of the Santa Clara Valley (refer to Figure 3.11-1) under the proposed General Plan could impact undiscovered paleontological resources in older Pleistocene sediments.
Proposed General Plan Policies and Actions That Reduce or Avoid Adverse Impacts to Paleontological Resources
The proposed Envision San José 2040 General Plan includes updated policies that address the protection of paleontological resources. Proposed General Plan Policies and Actions that provide program-level mitigation for impacts within the City are identified below.

Section 3.0 Environmental Setting, Impacts, and Mitigation
Envision San José 2040 General Plan 707 Draft Program EIR City of San José June 2011
Archaeology and Paleontology
Policy ER-11.1 For proposed development sites that have been identified as archaeologically or paleontologically sensitive, require investigation during the planning process in order to determine whether potentially significant archeological or paleontological information may be affected by the project and then require, if needed, that appropriate mitigation measures be incorporated into the project design.
Policy ER-11.3 Ensure that City, State, and Federal historic preservation laws, regulations, and codes are enforced, including the California Historical Building Code and State laws related to archaeological resources, to ensure the adequate protection of historic and pre-historic resources.
Existing Regulations and Adopted Plans and Policies
Existing local, state and federal regulations and adopted plans and policies that would reduce or avoid impacts to paleontological resources in San José during construction include: • California Public Resources Code Section 30244 • CEQA Discussion of Paleontological Resources Impacts While future development and redevelopment allowed under the proposed General Plan, especially construction activities, could result in direct impacts to buried paleontological resources, the proposed General Plan and existing regulations necessitate the evaluation of possible paleontologic sensitivity of specific development sites and the incorporation of measures to avoid or limit possible disturbance of resources if they are accidentally encountered. Impact CULT-4: New development and redevelopment allowed under the proposed General
Plan could result in substantial adverse impacts to buried paleontological resources. Implementation of proposed General Plan policies and existing regulations and programs would substantially reduce impacts to paleontological resources. (Less Than Significant Impact)
3.11.4.5 Impacts of Rancho del Pueblo and iStar Residential Options As discussed in Section 2.2.8 in the Project Description, this PEIR also evaluates options for residential land use designations and anticipated future development on two properties; the Rancho del Pueblo Golf Course in the Alum Rock Planning Area and the iStar property in the Edenvale Planning Area (Residential Option Sites). Under these options one or both of these properties would be designated for residential uses instead of the industrial uses assumed on the iStar property and the park/open space on the existing Rancho del Pueblo Golf Course. Because these options also include modifications to other Growth Areas, adjusting the assumed dwelling units or jobs, the overall amount of development capacity assumed under the Preferred Scenario would not change citywide. A comparison and summary of cultural resources impacts for the residential options is shown in Table 3.11-1. Implementation of an updated General Plan that includes one or both of the residential options for the Rancho del Pueblo and iStar sites would have impacts similar to those from the proposed project.
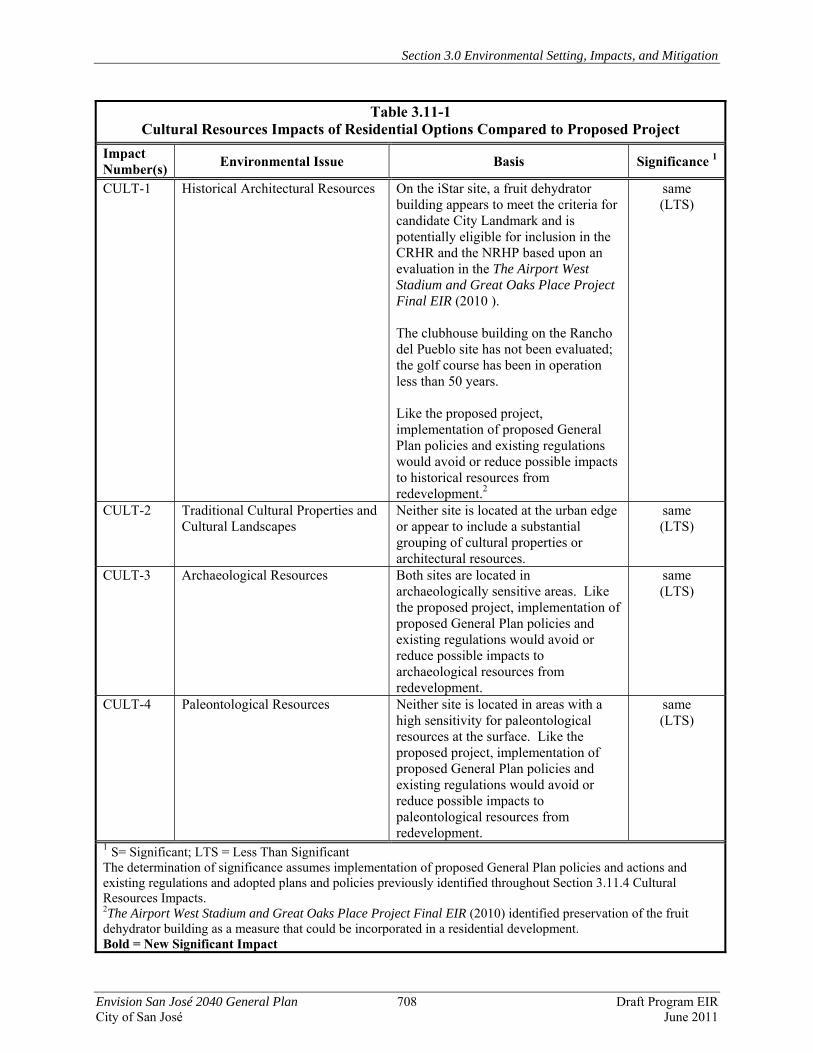
Section 3.0 Environmental Setting, Impacts, and Mitigation
Envision San José 2040 General Plan 708 Draft Program EIR City of San José June 2011
Table 3.11-1 Cultural Resources Impacts of Residential Options Compared to Proposed Project
Impact Number(s) Environmental Issue Basis Significance 1
CULT-1 Historical Architectural Resources
On the iStar site, a fruit dehydrator building appears to meet the criteria for candidate City Landmark and is potentially eligible for inclusion in the CRHR and the NRHP based upon an evaluation in the The Airport West Stadium and Great Oaks Place Project Final EIR (2010 ). The clubhouse building on the Rancho del Pueblo site has not been evaluated; the golf course has been in operation less than 50 years. Like the proposed project, implementation of proposed General Plan policies and existing regulations would avoid or reduce possible impacts to historical resources from redevelopment.2
same (LTS)
CULT-2
Traditional Cultural Properties and Cultural Landscapes
Neither site is located at the urban edge or appear to include a substantial grouping of cultural properties or architectural resources.
same (LTS)
CULT-3 Archaeological Resources Both sites are located in archaeologically sensitive areas. Like the proposed project, implementation of proposed General Plan policies and existing regulations would avoid or reduce possible impacts to archaeological resources from redevelopment.
same (LTS)
CULT-4 Paleontological Resources Neither site is located in areas with a high sensitivity for paleontological resources at the surface. Like the proposed project, implementation of proposed General Plan policies and existing regulations would avoid or reduce possible impacts to paleontological resources from redevelopment.
same (LTS)
1 S= Significant; LTS = Less Than Significant The determination of significance assumes implementation of proposed General Plan policies and actions and existing regulations and adopted plans and policies previously identified throughout Section 3.11.4 Cultural Resources Impacts. 2The Airport West Stadium and Great Oaks Place Project Final EIR (2010) identified preservation of the fruit dehydrator building as a measure that could be incorporated in a residential development. Bold = New Significant Impact

Section 3.0 Environmental Setting, Impacts, and Mitigation
Envision San José 2040 General Plan 709 Draft Program EIR City of San José June 2011
3.11.5 Mitigation and Avoidance Measures for Cultural Resources Impacts 3.11.5.1 Proposed General Plan No mitigation measures are required. 3.11.5.2 Rancho del Pueblo and iStar Residential Options No mitigation measures are required. 3.11.6 Significance Conclusions 3.11.6.1 Proposed General Plan Implementation of the proposed Envision San José 2040 General Plan in accordance with proposed policies and actions and existing regulations would result in less than significant impacts to historic resources, archaeological resources and paleontological resources and no additional mitigation measures are required. (Less Than Significant Impacts) 3.11.6.2 Rancho del Pueblo and iStar Residential Options Implementation of the proposed Envision San José 2040 General Plan with the Rancho del Pueblo and iStar Residential Options in accordance with proposed policies and actions and existing regulations would result in less than significant impacts to historic resources, archaeological resources and paleontological resources and no additional mitigation measures are required. (Less Than Significant Impacts)
Section 3.0 Environmental Setting, Impacts, and Mitigation
Envision San José 2040 General Plan 710 Draft Program EIR City of San José June 2011
3.12 AESTHETICS 3.12.1 Existing Setting 3.12.1.1 Visual Character and Setting The City of San José is located in the central and eastern portions of the Santa Clara Valley, between the foothills of the Santa Cruz Mountains to the west, the Santa Teresa Hills to the south and the Diablo Mountain Range to the east. Diked ponds, saltmarsh, the waters of San Francisco Bay and the adjacent cities of Milpitas and Santa Clara border the City to the north. The predominant visual character of San José is that of a gently sloping to flat valley bounded by mountains and the Bay. The Diablo Mountain Range extends east of San José in a series of ridges, small valleys and canyons. Lick Observatory is visible atop Mount Hamilton in the Diablo Mountain Range. The lower foothills of the Diablo Range support some development with grassland, woodland and shrub vegetation being visually prominent over much of the hillslopes. The Santa Cruz Mountains to the southwest also are comprised of a series of ridges, rising up to approximately 3,400 feet in elevation. Mt. Umunhum, the site of the former Almaden Air Force Station, is a visually prominent peak in the Santa Cruz Mountains, southwest of the City. Topographic landmarks and features within the City include Communications Hill, in the south central area of the City, the Silver Creek Hills in the southeast, and the Santa Teresa Hills in the southern portion of the City, adjacent to the Almaden and Coyote Planning Areas. Major waterways within the City that still support riparian woodland vegetation in some locations along their banks include the Guadalupe River, Coyote Creek, Los Gatos Creek, Silver Creek, and Penitencia Creek. As noted previously, baylands and saltmarsh border the Bay at the northern end of the City. The built environment dominates throughout San José with approximately 80 percent of the land within the City’s Urban Service Area (USA) currently developed.163 The City contains a mix of urban and suburban development of varying age. The densest development occurs in the Downtown area, with high-rise buildings visible from most freeways and from other vantage points in and adjacent to the City. Older, brick or wood structures also are part of the visual character in the Downtown area. Along with Downtown, multiple-storied office development is present in the North San José area along the North First Street and Zanker Road corridors. Outside of the Downtown and North San José areas, most of San José’s Urban Service Area supports suburban development, made up of single-family residences and residential-serving commercial areas with retail stores fronted by parking areas and landscaping. Larger, regional-serving commercial developments with large parking lots and parking structures, such as Valley Fair, Santana Row, Oakridge Shopping Center, Eastridge Shopping Center, and The Plant, are found at several locations throughout the City. Most of the development in San José (50 percent) outside of the Downtown is no more than 50 feet tall. Trees are planted throughout the City in residential and commercial areas, with substantial urban forest plantings in older portions of the City, such as the Rose Garden, Naglee Park, and along portions of the southern Monterey Road corridor. The City is crossed by a number of major and heavily traveled multi-lane roadways, including US 101, I-880, I-280, I-680, Highway 87, Highway 237, Capitol Expressway, Almaden Expressway, and 163 H.T. Harvey and Associates. Envision San José 2040 General Plan Update Biological Resources Report. August 2010.
Section 3.0 Environmental Setting, Impacts, and Mitigation
Envision San José 2040 General Plan 711 Draft Program EIR City of San José June 2011
Lawrence Expressway. Traffic and human activities are concentrated along these roadways. Schools, playing fields, cemeteries, golf courses, and parks that are open in character are also present throughout the City. The City is a mosaic of residential, commercial, industrial, and institutional development within a framework of transportation corridors and geographic features. Given the size and diversity of the City, key visual features of each of the City’s Planning Areas are described below.
Almaden Planning Area The Almaden Planning Area lies in the largely undeveloped southern quarter of the City, adjacent to the Santa Cruz Mountains (refer to Figure 2.2-4). The built environment is characterized by low to medium density residential development and commercial centers concentrated in the flatter portions of the Almaden Valley area. Historic buildings with a rural character are present in the area, with open fields, riparian corridors, and orchards interspersed with rural development in the areas outside the Urban Growth Boundary (UGB). Views of nearby hillside areas and riparian trees along watercourses are part of the visual setting.
Alum Rock Planning Area
The Alum Rock Planning Area is located east of Downtown and adjacent to the Diablo Mountain Range (refer to Figure 2.2-5). Like the Almaden Planning Area, Alum Rock includes land within and beyond the City’s UGB. Developed areas include housing, commercial, and industrial areas ranging in age and architectural styles from the early 1900s to present day. Housing and commercial areas are generally intensively developed, with commercial strip development along major roadways including Alum Rock/Santa Clara, Tully Road, Story Road and Capitol Expressway. Open space areas include Lake Cunningham Park and the Pleasant Hills Golf Course, as well as schools and parks. Development density is lower with more open space on lands near the USA to the east. Foothill areas to the east are steep, with a few roads providing access to the grassland and woodland areas on the slopes of the Diablan foothills.
Alviso Planning Area
The Alviso Planning Area is located adjacent to the southern tip of San Francisco Bay and is the northernmost Planning Area in San José (refer to Figure 2.2-6). The historic Alviso village area lies near the edge of the Baylands and UGB, set back from heavily trafficked State Route 237. The area is roughly bounded by two major streams, the Guadalupe River and Coyote Creek, which are generally directed within diked levees to the Bay. One to two-story industrial and office/R&D buildings primarily constructed in the last 10-15 years, are concentrated south of the Village area, and closer to State Route 237. Wetland areas are interspersed with development at the northern edges of Alviso, and major salt marsh and open salt pond areas are present in the San Francisco Bay itself. Large electrical transmission lines extend through the Alviso area from the north and east, many connected to a power plant and substation near SR 237. Large industrial-type facilities, including a wastewater treatment plant and several former and currently operating landfills, are present within the Planning Area and visible from recreational and developed areas. Views of hillside areas to the east and west are also visually prominent within the Alviso Planning Area.
Section 3.0 Environmental Setting, Impacts, and Mitigation
Envision San José 2040 General Plan 712 Draft Program EIR City of San José June 2011
Berryessa Planning Area The Berryessa Planning Area lies northeast of Downtown and adjacent to the Diablo Mountain Range (refer to Figure 2.2-7). Like the Alum Rock and Evergreen Planning Areas to the south, the Berryessa Planning Area includes both intensely developed areas and hillside areas outside the UGB that are relatively undeveloped and are a prominent visual feature from the valley floor. The built environment east of the old UPRR rail line is mostly single-family, low density residential subdivisions that stretch to the edge of the UGB adjacent to the foothills. Industrial and commercial concrete-tilt up structures are apparent near Oakland Road and along the west side of the UPRR line. Major thoroughfares, such as Oakland Road, are heavily traveled by cars and trucks within the predominantly industrial zone. Neighborhood serving commercial development clusters along Capitol Avenue. Open spaces are primarily schools, paths, and the eastern foothills.
Cambrian/Pioneer Planning Area
The Cambrian/Pioneer Planning Area is located in southwestern San José adjacent to the Santa Cruz Mountains (refer to Figure 2.2-8). For the most part, this area consists of modern single-family residences on gridded-streets with commercial buildings and shopping centers concentrated on heavily travelled arterial streets. Schools and parks that provide visual open space are scattered throughout, generally within the residential areas. Near the southwestern border of the Planning Area, the built environment transitions from suburban to rural in character at the base of the foothills.
Central/Downtown Planning Area
The Central/Downtown Planning Area encompasses Downtown and the surrounding area (Figure 2.2-9). This Planning Area is located near the geographic center of the intensely developed portions of the City and encompasses a diversity of building types, architectural styles, major transportation corridors (i.e., elevated freeways, light rail and heavy rail lines, arterial streets), and open space in urban parks and along the Guadalupe River and Coyote Creek. Modern high rise buildings punctuate the skyline, making the Downtown area visible from many areas of the City, especially from major roadways and highways. The Downtown includes a mix of modern and historic buildings. Historic institutional buildings are concentrated in the Downtown Planning Area, including the San José Art Museum and St. Joseph’s Cathedral near Plaza de Cesar Chavez, Diridon Station, three historic churches and the post office around St. James Park, and the visually prominent tower on the San José State University Campus. The historic buildings and districts are key components of the visual setting in the central area. Modern high- and mid-rise office buildings, the HP Pavilion (a large sports arena), and several high rise residential buildings clad with glass and metal are more recent additions to the built environment. Several urban parks punctuate Downtown including the Guadalupe River Park and Gardens which forms a major green spine to the built environment. Downtown is the site of civic events, parades, festivals, and public celebrations in public open space areas as well as in major theater venues, such as the historic California Theater, Montgomery Theater, San José Repertory Theatre, and Center for Performing Arts. Most of the major buildings Downtown are very large, including the convention center structures, and several mid- to high-rise hotels that cluster around the convention center. The City Hall high rise and the new massive Martin Luther King Jr. Main Library are adjacent to the San José State University campus which occupies 18 blocks just east of Downtown.
Section 3.0 Environmental Setting, Impacts, and Mitigation
Envision San José 2040 General Plan 713 Draft Program EIR City of San José June 2011
Within the Central/Downtown Planning Area, distinctive one- and two-story residential neighborhoods surround the Downtown Core. The Bascom/Forest, Rose Garden, Shasta Hanchett, Garden Alameda, St. Leo’s and Autumn/Montgomery neighborhoods are located west of SR 87. Much of the housing in these neighborhoods is over 50 years in age and tall, mature landscaping, including large planted oaks, palm trees, and redwoods, is found throughout the area. Along The Alameda, west of SR 87, the streetscape consists of a mix of modern and historic buildings used as offices and for commercial uses. Distinctive residential areas east of SR 87 include Victorian era homes and bungalows in the Hensley and Jackson Taylor neighborhoods. Industrial buildings and heavy rail lines also extend through the areas north of Downtown. Historic homes on large lots are located in the Naglee Park neighborhood, east of San José State University. An eclectic mix of residences from various eras and neighborhood serving commercial buildings are found east of Coyote Creek in the Five Wounds, Roosevelt Park, Olinder, and other long-established neighborhoods.
Coyote Planning Area The Coyote Planning Area is located at the southern edge of San José’s Sphere of Influence (refer to Figure 2.2-10). Key geographic features include hillside areas gently sloping to flat valley areas crossed by Coyote Creek and its tributaries. Hillside areas are covered by grass, shrubs and trees and valley floor areas are characterized by low density rural development and agricultural fields. The valley area also is crossed by US 101, a major north-south highway. Infrastructure, including electrical transmission lines and an electric power generating plant, as well as a golf course and portions of a landfill (Kirby Canyon Landfill) are visible from the major roadways in the area. The overall character of the north Coyote Planning Area is rural, with a low intensity of development. The Coyote Urban Reserve is more heavily developed, however, with extensive “ranchette” type subdivisions and urban streets. Quasi-industrial looking building complexes used primarily for agricultural related businesses are also relatively common in mid-Coyote Valley (which reaches as far south as Palm Avenue). The southern portion of Coyote Valley is designated as the Coyote Greenbelt. It is also characterized by a substantial number of small subdivisions and large agricultural-related operations. There are a significant amount of intensive agricultural operations cultivating various crops in the area.
Edenvale Planning Area
The Edenvale Planning Area is located in the southern portion of the City (refer to Figure 2.2-11). It is a large, diverse area that includes a range of residential, commercial and industrial buildings with a backdrop of grassy and wooded hillslopes in both the Silver Creek Hills and Santa Teresa Hills. Much of the Edenvale area has been developed in the last 20-40 years. Industrial areas, consisting of office buildings and large industrial buildings or warehouses, are concentrated in redevelopment areas on both sides of US 101. In the older industrial area, extensive industrial park development is characterized by one-and two-story buildings with large parking lots and perimeter landscaping. The oldest part of this Redevelopment Project is again being redeveloped into a mixed use project incorporating extensive commercial and high density residential uses in four- to six-story buildings in a highly urban context. East of US 101, campus-style industrial development in one- and two-story buildings is newer and interspersed with rural residential land uses and open areas. Serpentine hillsides border the industrial area to the east and the wooded riparian corridor of Coyote Creek provides a visual separation of the area to the west.
Section 3.0 Environmental Setting, Impacts, and Mitigation
Envision San José 2040 General Plan 714 Draft Program EIR City of San José June 2011
Most of the Planning Area is intensely developed with low density suburban residential subdivisions and commercial areas. Commercial buildings, including the regional Oakridge Shopping Center, are concentrated along Blossom Hill Road, Branham Lane and other major thoroughfares. Smaller local serving commercial strips are located within large areas of one and two-story single-family residences and apartment buildings. A large, undeveloped area, the Lester Property is located within the Edenvale Planning Area, north of Blossom Hill Road. This agricultural property is planned for low intensity park uses by State of California and the County of Santa Clara. Other open spaces include schools and parks scattered throughout the area, and on the hillsides above the 15 percent slope line near the southern boundary of the Planning Area.
Evergreen Planning Area
The Evergreen Planning Area is located in southeast San José (refer to Figure 2.2-12). This area of San José can generally be described as a developed suburban environment. The area is characterized by numerous single-family residential subdivisions, interspersed with commercial areas along major streets. Most of the buildings are one or two stories in height. As a result of the ongoing development, the amount of vacant/open space lands in the area has substantially decreased over the last 10-20 years. The 60-acre Montgomery Hill Park, as well as many smaller neighborhood parks and linear parks are also found in the Evergreen Planning Area along creeks. The predominant visual feature, however, are the rolling hillsides to the east. Other visually prominent features visible from Capitol Expressway include the large regional Eastridge shopping center and open runway areas of Reid-Hillview airport, north of the shopping center.
North San José Planning Area
The North San José Planning Area is located between Downtown and State Route 237 (refer to Figure 2.2-13). The visual context is predominantly urban, though there are a few as yet undeveloped and partially developed properties within the area. The predominant character of the visual and aesthetic environment is that of a modern industrial area. Older, heavy industrial uses are found in the southeasterly portion of the Planning Area and newer industrial parks extend along the North First Street and Zanker Road corridors. The older industrial development is generally characterized by single-story buildings, many of which include warehouses. There is less landscaping in older industrial areas than in newer industrial development, which have substantial building setbacks, with landscaping and parking next to streets. Residential land uses include mobile home parks on North First Street and Zanker Road, newer high density developments built north of Montague Expressway and south of SR 237, and older mixed density neighborhoods between the Guadalupe River and North Fourth Streets, south of US 101. The mobile home parks are set back from streets and screened by flood protection berms and are not visually prominent in the area. The newer, mid-rise residential structures above parking are located closer to major roadways and have perimeter landscaping. The neighborhood between North First Street and North Fourth Street is made up of a mix of industrial and commercial uses and a substantial number of hotels and motels. Some office uses and new, high-density housing are also
Section 3.0 Environmental Setting, Impacts, and Mitigation
Envision San José 2040 General Plan 715 Draft Program EIR City of San José June 2011
present south of US 101. Approximately 30 acres on the north side of River Oaks Parkway is still an active agricultural field. Mineta San José International Airport is located in the North San José Planning Area. The airport is bordered by commercial, office, and warehouse uses. West of the airport, buildings are generally one and two stories. Concentrated urban development east of the airport and SR 87 includes midrise office and hotel buildings. Most of the buildings in the Planning Area have been built within the last 35 to 40 years.
South Planning Area
The South San José Planning Area is located directly south of Downtown roughly between the SR 87 and US 101 (refer to Figure 2.2-14). Coyote Creek and associated open space areas (a golf course and park) extend through the Planning Area and Communications Hill is a prominent feature with a substantial number of new higher density residential development and two large churches. In contrast, the Monterey Road corridor and sections of Hillsdale Avenue are highly developed with a mix of urban uses ranging from concrete warehouses, light industrial and commercial buildings, motels and newer big-box retail. Residential uses include single-family neighborhoods and mobile home parks interspersed with industrial and commercial uses as well as extensive single-family and multiple family developments that are suburban in form in the eastern and southern portions of the Planning Area. Newer medium to high density residential development is visible from major roadways, stepping up the slopes of Communications Hill. The Santa Clara Valley Fairgrounds within this Planning Area includes sizable developed and vacant areas, although they are not visually prominent, obscured by peripheral buildings and trees.
West Valley Planning Area
The West Valley Planning Area is the westernmost area of San José (refer to Figure 2.2-15) and is bordered by urban development in the cities of Cupertino, Sunnyvale, Campbell and Santa Clara. Residential development is the prevailing land use in this area and is suburban in character, with some intense residential development near the major roadway and corridors of Stevens Creek Boulevard, Saratoga Avenue, and Winchester Boulevard. Visual open space in the Planning Area is primarily provided by school sites and parks within residential areas. Commercial development is concentrated along major roadway corridors in single-story strip commercial and larger shopping center developments with parking fronting roadways. The major shopping centers of Valley Fair, Santana Row, Westgate and El Paseo de Saratoga are located on major streets in this Planning Area. The multi-storied Valley Fair shopping center and Santana Row mixed use project have large parking structures and large commercial buildings with limited landscaping along major street frontages.
Willow Glen Planning Area
The Willow Glen Planning Area is located southwest of Downtown (refer to Figure 2.2-16). The visual context is urban and suburban, with neighborhood commercial and institutional areas surrounded by established residential neighborhoods. The character of commercial development in the central portion of the Planning Area along Lincoln Avenue and Willow Street is that of a small established downtown area with one- and two-story storefronts. Along Bascom Avenue, south of I-280, commercial development is located in shopping centers of various ages, generally with parking
Section 3.0 Environmental Setting, Impacts, and Mitigation
Envision San José 2040 General Plan 716 Draft Program EIR City of San José June 2011
areas fronting this major thoroughfare. Los Gatos Creek, a narrow wooded riparian corridor cuts across the northern portion of the Planning Area. Industrial buildings are primarily limited to an area near Los Gatos Creek and are not visually prominent. Two large institutional campuses, Valley Medical Center and San José City College, are located in the northwest portion of the Planning Area. In recent years, there have been extensive building programs on both sites, and large modern buildings are visible from roadways and neighborhoods in the immediate vicinity. Mature landscaping and an eclectic mix of architectural styles characterizes the built environment in the older residential areas in Willow Glen. Several parks and school sites provide visual open space in this central San José area. The more southerly half of the Planning Area contains more traditional one- and two-story single-family subdivisions and wide commercial streets with strip malls.
Open Hillsides Outside the Urban Service Area
(Calero and San Felipe Planning Areas, Coyote Planning Area)
Two of the Planning Areas located on the City’s southern edge, Calero and San Felipe, are located outside the City’s UGB. The San Felipe Planning Area includes Coyote Ridge, portions of the Silver Creek Hills and Anderson Reservoir near Morgan Hill. The area contains a number of natural waterways and hillslopes covered with grassland, scrub and woodland. The Calero Planning Area includes brush and tree covered rolling hills in the Santa Cruz Mountains with pockets of rural park and rural residential development. A portion of the Coyote Planning Area also includes open hillsides outside of the UGB. These Planning Areas provide a backdrop of scenic hillsides when viewed from US 101, Coyote, Edenvale and Evergreen Planning Areas (San Felipe) and from Monterey Road, Almaden Road and McKean Road and various County park trails (Calero). 3.12.1.2 Scenic Views As most of the City is relatively flat, prominent viewpoints (other than buildings) are limited. Exceptions are Communications Hill in south central San José, extensions of the Silver Creek Hills, and the Santa Teresa Hills. Views of the Santa Clara Valley and surrounding hillsides are visible from public roadways in these areas. Views are also available from regional park trails in the Santa Teresa Hills. Views of the hills contribute to a sense of place. They remind residents that they live in a valley, different than the hills and ocean-side communities of the region. Several existing and former landfills near the Bay, including the former Cargill landfill west of Gold Street, two active landfills on Los Esteros Road, and the Newby Island Landfill on the Alameda County border in Alviso, rise above the valley floor and bay margins. The former Cargill landfill site is being developed with four to six-story office and hotel uses, which will be visually prominent from nearby SR 237. Public roads on the property will also provide views of the Bay and hillsides. Views of the hillsides and prominent peaks bordering the City are not consistently visible from within the City. Buildings, trees, and infrastructure (i.e., utility lines, elevated roadways) obscure most viewpoints on the Valley floor. Views of the hills are available where roadways provide a break in the landscaped and built environment or are elevated, such as along segments of SR 85 and SR 87.
Section 3.0 Environmental Setting, Impacts, and Mitigation
Envision San José 2040 General Plan 717 Draft Program EIR City of San José June 2011
Designated Scenic Roads
The State of California Department of Transportation has a Scenic Highway Program under the Streets and Highways Code (Sections 260-263) that designates highways based upon how much of the natural landscape can be seen by travelers, the scenic quality of the landscape and the extent that development modifies traveler’s enjoyment of the view. There are no highways that are eligible for designation as scenic highways or have been officially designated within the City of San José.164 The County of Santa Clara also has designated scenic roads in unincorporated Santa Clara County, which includes areas within the City’s Sphere of Influence and/or visible from portions of the City. Development and signs along County scenic roads are regulated under the County Code (Chapter 3.30) to protect the visual character along these rural routes. County-designated scenic roads in the City’s Sphere of Influence and near the City limits include: Casa Loma Road, McKean Road, and Uvas Road in the hills above Calero Reservoir, Metcalf Road, Silver Creek Road, and San Felipe Road in the Silver Creek Hills and San Felipe Planning Area, Hicks Road in the Almaden Planning Area, and Sierra Road and Mt. Hamilton Road in the Alum Rock and Evergreen Planning Areas in the east foothills. The City of San José 2020 General Plan identifies several scenic resources within the City, including broad views of Santa Clara Valley, the hills and mountains surrounding the valley, the urban skyline, and the baylands. Thoroughfares providing visual access to San José’s scenic resources are designated as scenic routes on the City of San José’s Scenic Routes and Trails Routes Map. There are two types of scenic routes designated: Urban Throughways and Rural Scenic Corridors. Urban Throughways include I-680, I-880, US 101, SR 237, and SR 87. Rural scenic corridors include several of the roadways designated by the County of Santa Clara, including San Felipe Road, Mt. Hamilton Road, McKean Road, and segments of US 101. Under the existing General Plan, development along these throughways and corridors should be designed to preserve and enhance natural and man-made vistas. 3.12.1.3 Nighttime Light and Daytime Glare The built environment in San José includes indoor lighting visible through windows and outdoor lighting of signs, buildings, walkways, parking lots, and parking structures. Light from buildings and outdoor lighting can be a source of light pollution if allowed to spill over onto adjacent properties or if bright enough to change ambient conditions in the area. In San José, light levels are generally greater where commercial buildings and parking areas are illuminated. Outdoor lighting is also provided along public streets throughout the City. There are approximately 50,000 street lights throughout San José.165 Lick Observatory, 14 miles east of San José, is a major research facility serving astronomers from throughout the University of California system. Illumination of the night sky by electric lights throughout the Santa Clara Valley can interfere with astronomical observation at the Lick Observatory on Mt. Hamilton. Near riparian corridors and at the urban-wildland interface nighttime illumination can be disruptive to wildlife. 164 California Department of Transportation. “California Scenic Highway Program”. Accessed May 5, 2010. <http://www.dot.ca.gov/hq/LandArch/scenic_highways/scenic_hwy.htm>. 165 City of San Jose Department of Transportation. “Services/Streetlights”. Accessed May 6, 2010. <http://www.sanjoseca.gov/transportation/s_streetlights.htm>
Section 3.0 Environmental Setting, Impacts, and Mitigation
Envision San José 2040 General Plan 718 Draft Program EIR City of San José June 2011
Windows, architectural coatings, and other reflective surfaces can be a source of day-time glare that is visually intrusive or objectionable. Window and architectural coatings are generally available that limit the potential for excessive glare on contemporary buildings, however. 3.12.1.4 Regulatory Framework A summary of key local and state regulations and policies is presented below.
State of California Requirements for Open Space Elements in General Plans According to Government Code Sections 65560-65570, the preservation of open space land is necessary. Cities, counties, and the state at the earliest possible date are to make definite plans for the preservation of valuable open-space land and take positive action to carry out such plans by the adoption and strict administration of laws, ordinances, rules and regulations, such as an open space plans. Open space is recognized as having a range of uses including preserving natural resources and areas of outstanding scenic, historic and cultural value. In the San José area, open space in the Diablo Range, Santa Cruz Mountains, Baylands and along riparian corridors are key components of natural visual open space. No building permit may be issued, no subdivision map approved, and no open-space zoning ordinance adopted, unless the proposed construction, subdivision or ordinance is consistent with the local open-space plan (Section 65567).
County of Santa Clara
The Santa Clara County Code (Chapter 3.30) regulates development and signs along scenic roadways in unincorporated Santa Clara County that are visible from portions of the valley floor and/or are within the Sphere of Influence of San José.
City of San José
San José 2020 General Plan Existing policies in the City of San José General Plan have been adopted for the purpose of avoiding or mitigating environmental effects resulting from planned development within the City. Relevant General Plan Policies that directly address reducing and avoiding aesthetics impacts to the natural and built environment include the following: • Historic, Archaeological and Cultural Resources Policy: Policy #5 • Scenic Routes Policies #1-6, 8, and 9 • Urban Design Policies #1, 2, 7, 8, 16, 17, 22, and 24
Open space or hillside land use designations that limit or direct development in areas that provide a scenic backdrop to the built environment in the City include Public Park and Open Space, Private Open Space, and Non-Urban Hillside. Areas with a rural character fall under the Agriculture and South Almaden Valley Urban Reserve and Coyote Valley Urban Reserve designations.
Section 3.0 Environmental Setting, Impacts, and Mitigation
Envision San José 2040 General Plan 719 Draft Program EIR City of San José June 2011
Municipal Code The City’s Municipal Code includes several regulations associated with protection of the City’s visual character and control of light and glare. The City’s zoning ordinance includes one zone district, Open Space (OS) specifically established to provide for open space, including areas with scenic values. The regulations contained in the OS district section are designed to enhance the scenic and visual qualities of the land as well as to implement the open space and hillside policies of the San José 2020 General Plan (Section 20.20.010 Open Space and Agricultural zoning districts). Chapter 13.32 Tree Removal Controls, regulates the removal of trees on private property within the City. The purpose of these regulations are to promote the health, safety, and welfare of the city by controlling the removal of trees in the city, as trees enhance the scenic beauty of the city and provide other benefits. The zoning ordinance also includes development standards for zoning districts, which currently include standards for maximum building height and number of stories. The zoning ordinance also includes design standards regarding lighting (Title 20). Several sections of the Municipal Code (e.g., Section 23.04.250 and 20.40.540) include controls for lighting of signs and development adjacent to residential properties. These requirements call for floodlighting to have no glare and lighting facilities to be reflected away from residential use so that there will be no glare. City Design Guidelines and Design Review Process All new development is subject to a design review process that includes a review of architecture and site planning. Design review is based upon a series of guidelines prepared by the City’s Planning Division and adopted by the City Council to assist those persons involved in the design, construction, review and approval of development in San José. These guidelines seek to provide a common understanding of the minimum design standards the City expects of all new development based on development types, and locations. The design review process is used to evaluate projects for conformance with the adopted design guidelines and other relevant policies and ordinances, and for the inclusion of appropriate environmental mitigation. Specific design guidelines adopted by the City Council include those for: Residential, Industrial, Commercial, Downtown/Historic, Downtown Design Guidelines, Saint James Square Historic District Design Guidelines, and the Riparian Corridor Policy Study. City of San José Lighting Policy 4-2 This City Council policy addresses both energy efficiency and lighting type. It calls for dimmable, programmable lighting for new streetlights which would control the amount and color of light shining on streets and sidewalks. Light is to be directed downward and outward with minimal light trespassing upward. New and replacement streetlights also should protect the night sky by offering the ability to change the color of the light from full spectrum (appearing white or near white) in the early evening to a monochromatic light in the later hours of the night and early morning. At a minimum, full spectrum lights should be able to be dimmed by at least 50 percent in late night hours. Previous versions of the policy established the use of sodium vapor streetlights (low- and high-
Section 3.0 Environmental Setting, Impacts, and Mitigation
Envision San José 2040 General Plan 720 Draft Program EIR City of San José June 2011
pressure) to substantially reduce electricity use and to limit the effects of street lighting on the operation of Lick Observatory. City of San José Private Outdoor Lighting on Private Developments Policy 4-3 This City Council policy calls for private development to use energy-efficient outdoor lighting that is fully shielded and not directed skyward. Low-pressure sodium lighting is required unless a photometric study is done and the proposed lighting referred to Lick Observatory for review and comment. One of the purposes of this policy is to provide for the continued enjoyment of the night sky and for continuing operation of Lick Observatory, by reducing light pollution and sky glow.

Section 3.0 Environmental Setting, Impacts, and Mitigation
Envision San José 2040 General Plan 721 Draft Program EIR City of San José June 2011
3.12.2 Thresholds of Significance For the purposes of this PEIR, an aesthetics impact is significant if implementation of the proposed Envision San José 2040 General Plan would: • Have a substantial adverse effect on a scenic vista; • Substantially damage scenic resources, including but not limited to, trees, rock outcroppings,
and historic buildings within a state scenic highway; • Substantially degrade the existing visual character or quality of the City and its surroundings;
or; • Create a new source of substantial light or glare which would adversely affect day or
nighttime views in the area. The following discussion addresses the anticipated changes to the visual setting of the City based upon the proposed growth and development allowed under the General Plan. Impacts to a scenic vista or scenic resources could occur if either the resource is directly affected by development or a public view from a public vantage point is blocked. 3.12.3 Aesthetics Impacts 3.12.3.1 Impacts to Scenic Vistas Impacts to a scenic vista consist of modification of a scenic feature, such as hillside, woodland, or bayland areas, or scenic skyline or built environment. Scenic views from key public locations can also be blocked by new development. Effects on the built environment are addressed specifically in Section 3.12.3.2, below.
Impacts to Hillside Areas and Natural Scenic Features Under the proposed General Plan, development on slopes above the 15 percent slope line and elsewhere beyond the UGB will be extremely limited. With the exception of additional development on Communications Hill (which is near the center of the City), new development in hillside areas of the City that could affect scenic resources will continue to be limited. Communications Hill is centrally located in the City between the major roadways of SR 87 and Capitol Expressway and Monterey Road. It is an isolated hill within the Santa Clara Valley and extensive residential and institutional structures and utilities infrastructure are currently visible on Communications Hill from SR 87 and elsewhere in the area. Industrial development and a former quarry near the base of the hill are also visible from segments of Monterey Road. Build-out of the Communications Hill Specific Plan, as allowed under the General Plan, would introduce additional multiple story buildings on the top and sides of the hillslopes, including areas where new development areas will be visible from the east. Where slopes are too steep for development, grassland areas would remain. In the 1992 Final EIR prepared for the Communications Hill Specific Plan, impacts to visual and aesthetic resources were identified as significant and unavoidable. These impacts were identified, in part, as the result of development of new residences and construction of a water tank that are currently in place. Although the area surrounding and within the Specific Plan area is not a pristine area or part of an adjacent and connected mountain range, build-out of the Communications Hill

Section 3.0 Environmental Setting, Impacts, and Mitigation
Envision San José 2040 General Plan 722 Draft Program EIR City of San José June 2011
Specific Plan will introduce additional development on grassy hillsides visible from valley floor areas. Complete development of this area as allowed by the existing Specific Plan and the proposed General Plan would result in a significant impact to a scenic vista from portions of the central, eastern and southern areas of San José. Because development outside the existing UGB will continue to be limited under the proposed General Plan land use designations and policies, impacts from implementation of the proposed General Plan to scenic features, such as hillsides, are not anticipated to be substantial. There are no highways that are eligible for designation as scenic highways or have been officially designated within the City of San José by Caltrans and implementation of the proposed General Plan would not damage scenic resources visible from a state scenic highway.
Impacts to Scenic Views Throughout the City The proposed General Plan calls out gateways, freeways, and rural scenic corridors where preservation and enhancement of views of the natural and man-made environment are crucial. The designation of specific gateways is new while rural scenic corridors and views from urban thoroughfares, such as freeways, are identified in the City’s Focus on the Future San José 2020 General Plan. Proposed designated gateways and rural scenic corridors are shown on Figure 3.12-1. Panoramic views of hillside areas, including the foothills of the Diablo Range, Silver Creek Hills, Santa Teresa Hills, and foothills of the Santa Cruz Mountains, are key scenic features in the San José area. Other open space areas visible locally include areas of open fields off SR 85 in the Edenvale area and open fields, farmland and the wooded riparian corridor of Coyote Creek visible from roadways in the Coyote and Edenvale Planning Areas. Notable riparian corridors include segments of Penitencia Creek in the Alum Rock and Berryessa Planning Areas and Coyote Creek in the Central and South Planning Areas, upstream and downstream of Kelly Park. Views of the Baylands are generally local due to the flat topography of marsh and tidal wetland areas around San Francisco Bay. The man-made environment also is an important visual feature in the Santa Clara Valley. Tall structures in the Downtown and greater Central/Downtown Planning Area punctuate the skyline. Historic structures, along with modern designs represent important characteristics of the City’s built environment. These features are discussed in more detail in Section 3.12.3.2. Scenic vistas of the natural and man-made environment can be viewed from roadways and freeways and public trails throughout the City. Most of these views are intermittent, interrupted by street trees, tall buildings (especially those built close the roadways) and utility infrastructure. Development and redevelopment allowed under the proposed General Plan, especially along segments of major roadways that are either elevated, or are immediately adjacent to hillside areas could affect views of natural scenic vistas of hillside areas. Key roadways with views of hillside areas include: SR 237, Tasman Drive, Montague Expressway, Stevens Creek Boulevard, Santa Clara/Alum Rock, Story Road, I-280, Capitol Expressway, SR 87, SR 85, and portions of US 101. Where tall structures are constructed immediately adjacent to gateways and freeways, there is the possibility that important views could be partially obscured for motorists, bicyclists, and pedestrians.
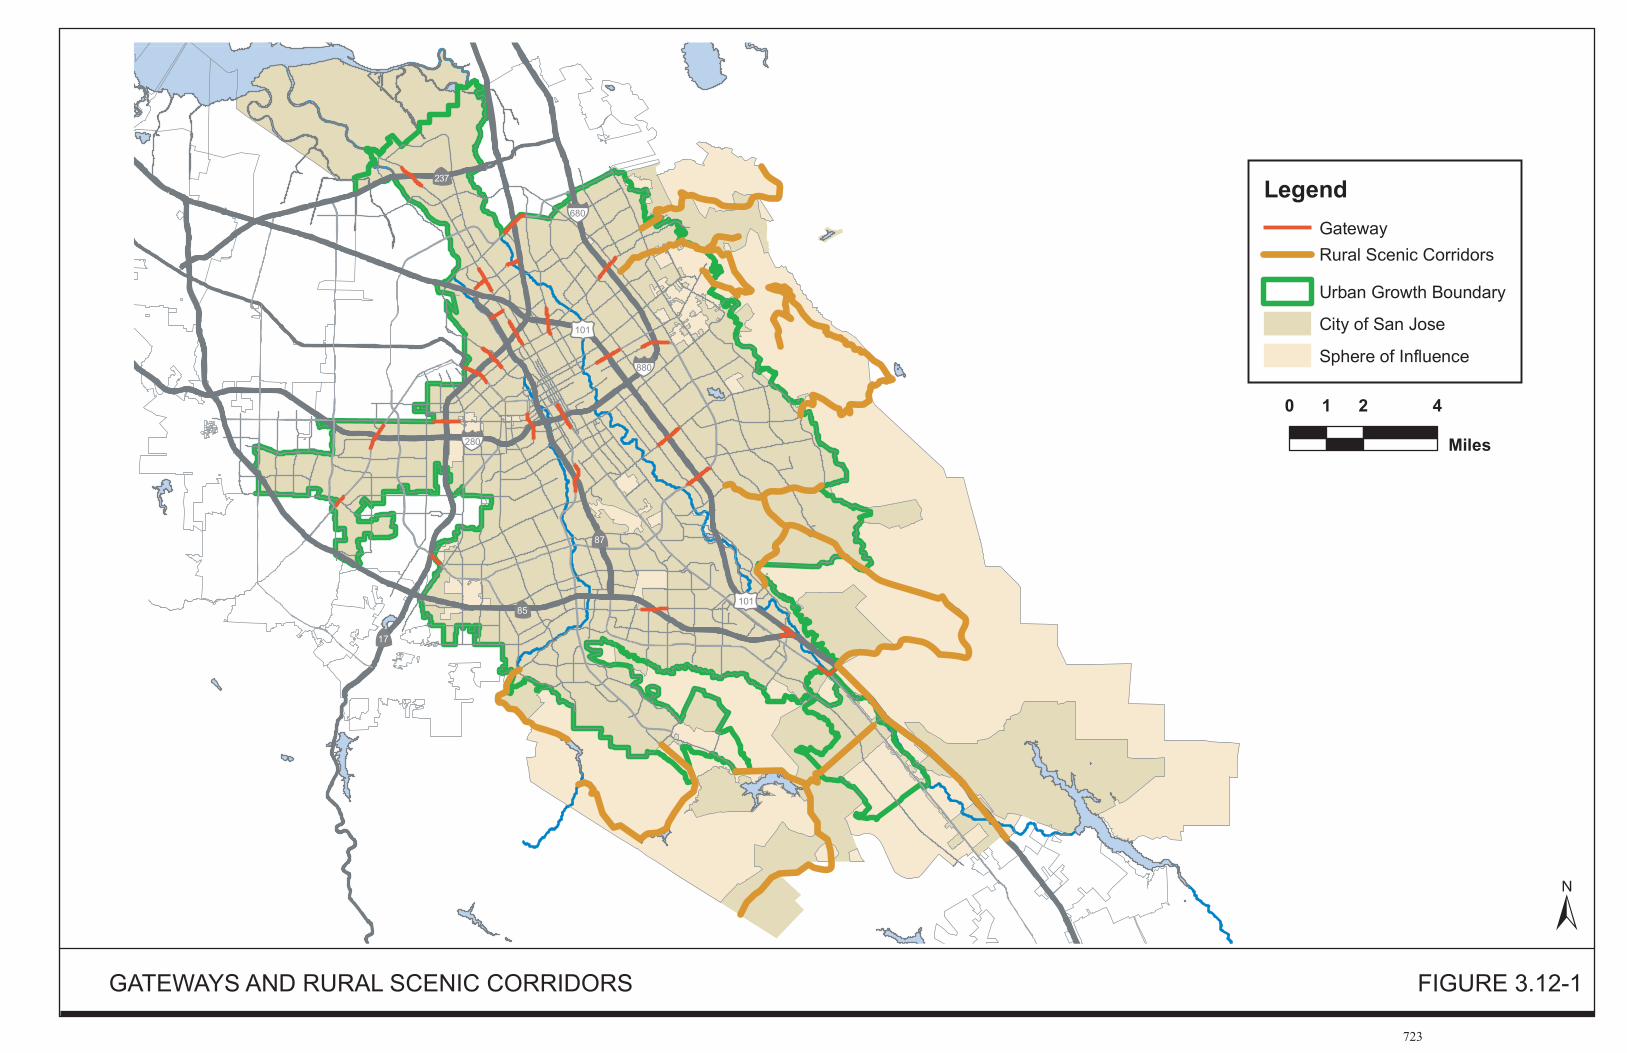
Section 3.0 Environmental Setting, Impacts, and Mitigation
Envision San José 2040 General Plan 724 Draft Program EIR City of San José June 2011
Development of the approved, but not yet built, Coyote Valley Research Park in the North Coyote Valley area would introduce large new buildings, up to eight stories in height, and parking lots and roads into a rural area of agricultural land, surrounded by hills. Tall buildings and landscaping at this location will partially block views of the Santa Teresa Hills, particularly from Monterey Road and Bailey Road (a Rural Scenic Corridor). The introduction of these uses was identified as a significant unavoidable visual and aesthetic quality impact in the 2000 Final EIR for the Coyote Valley Research Park and future development at this location would block scenic views from a public roadway designated as a Rural Scenic Corridor by the City.
Proposed General Plan Policies and Actions That Reduce or Avoid Adverse Aesthetics Impacts to Scenic Vistas
The proposed Envision San José 2040 General Plan includes updated community design and scenic corridor policies that address the character of the natural and built environment. Revisions to existing policies clarify that a consideration of natural features are required as a part of the City’s development review process. Proposed General Plan Policies and Actions that provide program-level mitigation for aesthetics impacts to natural scenic vistas or blocking views of natural scenic vistas are identified below. Attractive City
Policy CD-1.28 Locate utilities to be as visually unobtrusive as possible, by placing them underground or in buildings. When above-ground or outside placement is necessary, screen utilities with art or landscaping.
Access to Scenic Resources
Policy CD-9.1 Ensure that development within the designated Rural Scenic Corridors is designed to preserve and enhance attractive natural and man-made vistas.
Policy CD-9.2 Preserve the natural character of Rural Scenic Corridors by incorporating mature strands of trees, rock outcroppings, streams, lakes and reservoirs and other such natural features into project designs.
Policy CD-9.3 Ensure that development along designated Rural Scenic Corridors preserves significant views of the Valley and mountains, especially in, or adjacent to, Coyote Valley, the Diablo Range, the Silver Creek Hills, the Santa Teresa Ridge and the Santa Cruz Mountains.
Policy CD-9.6 Prohibit billboards adjacent to all Rural Scenic Routes.
Attractive Gateways
Policy CD-10.2 Require that new public and private development adjacent to Gateways and freeways (including 101, 880, 680, 280, 17, 85, 237, and 87), and Grand Boulevards consist of high-quality materials, and contribute to a positive image of San José.
Policy CD-10.3 Require that development visible from freeways (including 101, 880, 680, 280, 17, 85, 237, and 87) is designed to preserve and enhance attractive natural and man-made vistas.
Policy CD-10.4 Prohibit billboards at Gateway locations and along freeways (including 101, 880, 680, 280, 17, 85, 237, and 87) and Grand Boulevards within San José.
Section 3.0 Environmental Setting, Impacts, and Mitigation
Envision San José 2040 General Plan 725 Draft Program EIR City of San José June 2011
Hillside/Rural Preservation
Policy LU-17.2 Apply strong architectural, site, and grading design controls through a discretionary development review process of all types of hillside and rural residential development that require significant grading activities in order to protect the hillsides and to minimize potential adverse visual and environmental impacts.
Policy LU-17.3 Minimize grading on hillsides and design any necessary grading or recontouring to preserve the natural character of the hills and to minimize the removal of significant vegetation, especially native trees such as Valley Oaks.
Policy LU-17.4 Apply the following guidelines for development in hillside and rural residential areas in order to preserve and enhance the scenic and aesthetic qualities of the natural terrain:
a. Design development in a sensitive manner to highlight and complement the natural environment.
b. Use large lot sizes and varying setbacks in order to respect and preserve natural features of the land.
c. Adapt construction techniques and housing types to variable terrains. Use split pads and stepped foundations where appropriate, especially to minimize required grading, and discourage conventional, single flat-pad housing designs.
d. Consider privacy, livability, solar orientation and wind conditions when siting residential dwellings. Dwelling unit sites should take advantage of scenic views but should be located below hilltops to protect the aesthetics and ridgeline silhouette viewed from below, from public places, and from the valley floor.
e. Encourage preservation of existing trees, rock outcroppings and other significant features.
f. When grading or recontouring of the terrain is proposed, preserve the natural character of the hills and blend the alterations into the natural terrain.
g. Design streets to provide access and connectivity for area residents, and consider potential viewshed opportunity in siting development. Provide adequate access to safely accommodate potential traffic without significantly impacting local transportation routes. Consider and encourage reduced width and modified street sections to design streets for utility and to minimize grading.
h. Limit new structures or use of non-native vegetation in all new development projects to prevent adverse biological impacts and adverse visual impacts as viewed from the Valley floor or from adjacent public recreational areas. Design new structures to blend harmoniously with the natural setting. Agricultural crop production may be visible.
Policy LU-17.5 Apply the following guidelines to the design and construction of public and private right-of-way improvements in order to preserve and enhance the scenic and aesthetics qualities of hillside and rural areas:
a. Design streets in consideration of the natural topography and the landscape. Consider use of divided streets and grade separations.
b. Encourage the use of crushed gravel walks and vegetation lined swales, and only construct concrete sidewalks, curbs, and gutters when required by
Section 3.0 Environmental Setting, Impacts, and Mitigation
Envision San José 2040 General Plan 726 Draft Program EIR City of San José June 2011
topography or other regulations. c. Limit street lighting to intersections, and use low-intensity lighting
appropriate for these areas. d. Use finishes or colors that blend man-made materials within the public
right-of way with natural surroundings.
Policy LU-17.6 Avoid any new development along ridges and other major hillside areas (typically all properties that exceed 30% slope) that surround the valley floor to minimize visibility of development on these aesthetic resources.
Policy LU-17.9 Maintain design guidelines and policies adopted by the City to guide hillside development to promote aesthetics and enhance the rural character of hillside areas.
Urban Growth Boundary
Policy LU-19.6 Use the Urban Service Area (USA) boundary as a tool to preserve the non-urban character of development on lands outside of the Urban Growth Boundary. To this end, limit all new development on lands outside of the USA as follows.
a. Do not provide urban services to new development outside of the USA. b. Require that new development projects cause no significant increase for
public services or infrastructure and are non-urban in terms of 1. Waste water generation rates. 2. Traffic generation rates. 3. Extent of grading, vegetation removal, drainage modifications or other
alteration of the natural environment. 4. Noise or other nuisance potential. 5. Growth inducing potential. 6. Water consumption, excluding the environmentally beneficial use of
recycled water. c. Distinguish between urban and non-urban uses in terms of water usage by
limiting water consumption for new development to use of non-urban sources, including on-site well water, and rainfall catchment. Use of one type of urban water source, recycled water, may be allowed. Irrigation of Open Hillside areas with these water sources may be allowed provided that its use would not result in a substantial direct or indirect environmental impact upon sensitive habitat areas, special status species, geologic hazard avoidance or the visual environment.
Existing Regulations and Adopted Plans and Policies
Existing local regulations that would reduce or avoid aesthetics impacts include: • City of San José Municipal Code, Title 20 Zoning Ordinance • City of San José Municipal Code, Title 23 Sign Ordinance Discussion of Aesthetics Impacts to Scenic Vistas To be consistent with the proposed General Plan policies and existing regulations and adopted plans and policies noted above, development outside the UGB where hillsides can be viewed from scenic roadways will need to be carefully sited and designed. Allowed uses outside the UGB, such as retreat centers, golf courses, and cemeteries, will be required to include measures that avoid direct and indirect impacts to the visual mosaic of vegetation and topography found in hillside areas.
Section 3.0 Environmental Setting, Impacts, and Mitigation
Envision San José 2040 General Plan 727 Draft Program EIR City of San José June 2011
Properties most suitable for larger scale uses outside the UGB are located in previously disturbed or developed areas or areas lower on hillsides or other sites that are not visually prominent. The analysis in this PEIR assumes that future projects in the City of San José in hillside areas outside of the UGB will avoid or reduce impacts to scenic vistas to a less than significant level in project design (including specific location within a site), consistent with the policies for protecting scenic resources in the proposed General Plan. In the event a future project proposes features that would directly or indirectly affect scenic views, additional environmental review and detailed evaluation of resources and mitigation measures will be required prior to approval or implementation. Impact AES-1: New development and redevelopment allowed under the proposed General
Plan generally would occur on the valley floor and would not adversely affect scenic hillside resources. Where small-scale or larger-scale development (such as a retreat center, golf course or cemetery) does occur in hillside areas, implementation of the proposed policies and existing regulations and adopted plans would substantially reduce impacts to scenic resources on hillsides through careful siting and design. New development and redevelopment allowed under the proposed General Plan also would alter views from key roadways that serve as gateways to the City or currently provide substantial views of the natural environment within or adjacent to the City. Implementation of the proposed General Plan policies generally would avoid or substantially reduce impacts to natural scenic views from key gateways and roadways within the City. Build out of the Communications Hill Specific Plan area and the North Coyote Planning Area in conformance with previously approved entitlements, however, would alter or block views of grassy or wooded hillsides through the construction of new, multiple-storied development, which would result in a significant aesthetic impact at these locations. (Significant Impact)
3.12.3.2 Impacts from Changes to the Built Environment Much of the development that would occur under the proposed General Plan would be redevelopment of parcels in areas of the City that are already developed, and infill of urban lots. Development generally would intensify along corridors and in village areas and the height and mass of development in these areas could increase. Development allowed under the General Plan has the potential to alter the visual character of areas of the City, and to change the aesthetic character of the built environment. The changes in visual character from the development planned in the 13 Planning Areas of the City where growth is proposed are discussed briefly below.
Almaden Planning Area Future development within the Almaden Planning Area would be limited. There would be some residential infill of vacant lots, which would be in character with surrounding existing uses. Intensification with mixed uses is proposed in a single village area (V71 as shown on Figure 2.2-4) at a location near the toe of the foothills but still on the relatively flat Valley floor. This village area could support multiple story commercial and residential buildings. Due to the limited area of intensification, views of nearby hillside areas and the visual character of the Almaden Planning Area would not change substantially.
Section 3.0 Environmental Setting, Impacts, and Mitigation
Envision San José 2040 General Plan 728 Draft Program EIR City of San José June 2011
Alum Rock Planning Area
The Alum Rock Planning Area is located east of Downtown and adjacent to the Diablo Mountain Range (refer to Figure 2.2-5). Development and redevelopment in the Alum Rock Planning Area would primarily occur in urbanized commercial areas along major roadways including Alum Rock Avenue, McKee Road, Story Road, Tully Road, Capitol Avenue, and to a lesser extent, Capitol Expressway. Taller structures close to roadways could modify views of hillside areas as seen from those roadways that are not already lined with street trees and multi-story buildings. Although much of the development in the area is less than 50 years old, in some areas, new development could be adjacent to historic structures within established neighborhoods (i.e., along the Alum Rock Avenue corridor). Views of the foothills from streets that run east/west (i.e., McKee Road and Alum Rock Avenue) will continue to include the eastern foothills. Intensification along streets that run north/south (i.e., White Road and Capitol Avenue) will be more intermittent. The overall visual character of the area, especially on major streets, will be more urban.
Alviso Planning Area
The Alviso Planning Area is located adjacent to the southern tip of San Francisco Bay and is the northernmost Planning Area in San José (refer to Figure 2.2-6). As previously described, the historic Alviso village area lies near the edge of the baylands and UGB, set back from heavily trafficked State Route 237. Growth is planned on the WPCP Buffer Lands near Zanker Road, which would be visible from SR 237. Views of the Alviso Planning Area in the immediate vicinity of SR 237 currently are industrial in character, with existing industrial buildings, electrical transmission lines, electrical substations, and a power plant visible from the roadway. There would be an increase in the intensity of development near segments of the roadway and gateway areas.
Berryessa Planning Area The Berryessa Planning Area lies northeast of Downtown and adjacent to the Diablo Mountain Range (refer to Figure 2.2-7). Development and redevelopment is planned in several village areas primarily along Capitol Avenue and the LRT line. Substantial growth is planned for the East Gish and the Berryessa International Business Park employment areas, the Berryessa Planned Community, and on the Flea Market property (which is also a planned BART station). While the mass and scale of buildings would increase in the areas west of I-680, this is not anticipated to result in an adverse change to the visual quality of the area since the area already supports a mixture of industrial and commercial buildings, including large concrete-tilt up structures. East of I-680 residential neighborhoods that are suburban in character dominate the built environment. Proposed village areas could introduce a local change in scale and design at several locations, but the existing development on those sites is commercial which is already a different character and scale from the residential neighborhoods.
Cambrian/Pioneer Planning Area
The Cambrian/Pioneer Planning Area is located in southwestern San José adjacent to the Santa Cruz Mountains (refer to Figure 2.2-8). The Planning Area is predominantly single-family residential, but is divided by SR 85 and several major streets including Camden Avenue, Hillsdale Avenue, Branham Lane, and Blossom Hill Road. Growth areas and villages are proposed in commercial areas bordered
Section 3.0 Environmental Setting, Impacts, and Mitigation
Envision San José 2040 General Plan 729 Draft Program EIR City of San José June 2011
by one and two story single-family residences. Development and redevelopment would be concentrated along major roadways, such as Blossom Hill Road, Camden Avenue and Hillsdale Avenue. With intensification of these areas, the transition from suburban to commercial and mixed use could present a greater contrast in building scale and type.
Central/Downtown Planning Area
The Central/Downtown Planning Area encompasses Downtown and the surrounding area (Figure 2.2-9). This Planning Area has developed and redeveloped generally in a vertical manner, with new buildings that are taller and more massive than in the past. Under the proposed General Plan, redevelopment would continue to add to the mix of modern and historic buildings within the intersecting, concentrated transportation grid. The Downtown skyline itself is a visual feature visible from many areas of the City. New structures could modify views of existing landmarks, such as the historic Bank of America building, the De Anza Hotel, the HP Pavilion, Fairmont Hotel, City Hall, and the San José State University Campus. Growth areas along The Alameda/Santa Clara Street west and east of core areas of Downtown are bordered by distinctive residential neighborhoods and the introduction of new buildings along this commercial corridor could change the visual character of the building environment at the interface between this “Grand Boulevard” and surrounding residential areas, including the Bascom/Forest, Rose Garden, Shasta Hanchett, Garden Alameda, St. Leo’s and Autumn Montgomery neighborhoods located west of SR 87 and the Naglee Park, Five Wounds, Roosevelt Park, Olinder, and other long-established neighborhoods east of Seventh Street.
Coyote Planning Area The Coyote Planning Area is located at the southern edge of San José’s Sphere of Influence (refer to Figure 2.2-10). Development allowed in the North Coyote Valley area would substantially change the overall visual character of the area from open farmland and fields to a modern industrial office campus development. Structures would extend the built environment southward, when viewed from US 101, Monterey Road or the Santa Teresa Road gateways to the City. Currently, the existing Metcalf Energy facility and PG&E electrical substation are visible from these roadways, while the IBM Campus on Bailey Road is not. Development would not generally conflict with the visual quality of the existing built environment, which primarily consists of electrical generation and transmission infrastructure. Development of the approved, but not yet built, Coyote Valley Research Park in the North Coyote Valley area would introduce large new buildings, up to eight stories in height, and parking lots and roads into a rural area of agricultural land, surrounded by hills. Tall buildings and landscaping at this location will partially block views of the Santa Teresa Hills, particularly from Monterey Road and Bailey Road (a Rural Scenic Corridor). As previously discussed, the introduction of these uses was identified as a significant unavoidable visual and aesthetic quality impact in the 2000 Final EIR for the Coyote Valley Research Park166 and planned future development at this location would block scenic views from a public roadway designated as Rural Scenic Corridor by the City.
166 City of San Jose. Coyote Valley Research Park Rezoning Final EIR. 2000.
Section 3.0 Environmental Setting, Impacts, and Mitigation
Envision San José 2040 General Plan 730 Draft Program EIR City of San José June 2011
Edenvale Planning Area
The Edenvale Planning Area is located in the southern portion of the City (refer to Figure 2.2-11). Under the proposed General Plan, development and redevelopment will occur along the commercial corridor of Blossom Hill Road, at several locations along Monterey Road and Santa Teresa Boulevard, and within the Edenvale Employment Land Areas. Intensification in the vicinity of Blossom Hill Road and Santa Teresa Boulevard, would result in a transition from suburban to commercial and mixed use, and a greater contrast in building scale and type. Several large vacant parcels could be developed in the area, with the County-owned Lester property north of Blossom Hill Road remaining as open space. In the existing Edenvale industrial areas, the visual character of the built environment would change as new forms of industrial development would replace or be located adjacent to one- and two-story buildings with large parking lots. Currently, the New Edenvale area is generally screened by the Coyote Creek corridor and hillslopes and is not visually prominent from gateway areas.
Evergreen Planning Area
The Evergreen Planning Area is located in southeast San José (refer to Figure 2.2-12). Changes to the built environment could occur in several Village and Corridor areas and within the Evergreen Planned Community and Employment Land Areas and on vacant land within the Planning Area. Villages and Corridors on Capitol Expressway, Tully Road and San Felipe Road could be redeveloped with mixed uses of a different building type than surrounding uses. The Evergreen Campus Industrial Area, at the edge of the City’s urban envelope, would allow for development of previously approved industrial buildings on vacant land. Existing buildings in the area are one- and two-story residential structures along with several schools and parks. The proposed General Plan includes a Village designation that could allow more jobs and housing to be integrated into the existing community. While industrial buildings are anticipated to be set back from existing roadways and adjacent residential development, they will be noticeable when first built. Once the landscaping (including street trees) is mature, this campus industrial area will be less visually prominent.
North San José Planning Area
The North San José Planning Area is located between Downtown and State Route 237 (refer to Figure 2.2-10). As previously described, the visual context of North San José is predominantly urban, though there are a few as yet undeveloped and partially developed properties within the area. While development and redevelopment could introduce new building forms and uses, the predominant character of the visual and aesthetic environment would remain that of a modern, industrial area. As intensification occurs, the campus-like landscape plantings along the major corridors may shift to more densely urban forms. The character of the area around the San José International Airport is anticipated to continue to change along Coleman Avenue, with more commercial development closer to the roadway as the former FMC site and adjacent properties are redeveloped.
South San José Planning Area
The South San José Planning Area is located directly south of Downtown roughly between the SR 87 and US 101 (refer to Figure 2.2-14). A wide range of development and redevelopment could occur
Section 3.0 Environmental Setting, Impacts, and Mitigation
Envision San José 2040 General Plan 731 Draft Program EIR City of San José June 2011
within this Planning Area. The Employment Land Areas roughly along Monterey Road and Senter Roads could be redeveloped with a range of uses and building types. Currently these areas include a mix of buildings ranging from concrete warehouses, light industrial and commercial buildings, motels and newer big-box retail structures. The introduction of new building types and forms generally would not adversely affect the visual quality of these areas. Villages and Corridors are proposed adjacent to Capitol Expressway, Almaden Expressway and Tully Road and existing residential development. The Santa Clara County Fairgrounds on Tully Road includes sizable developed and vacant areas, although they are not generally visible from surrounding roadways. Intensification and redevelopment of these Villages and Corridors could result in a contrast in building scale and type where they abut existing residential neighborhoods. As discussed previously, build out of the Communications Hill Specific Plan would introduce new urban forms on a prominent hillside. With the exception of Communications Hill, the remainder of the Planning Area is flat and not visually prominent.
West Valley Planning Area
The West Valley Planning Area is the westernmost area of San José (refer to Figure 2.2-15) and is bordered by urban development in the cities of Cupertino, Sunnyvale, Campbell and Santa Clara. Redevelopment and development would be concentrated along the commercial corridors of Stevens Creek Boulevard, Winchester Boulevard, Saratoga Avenue, and De Anza Boulevard. Two village areas also are located along Bollinger Avenue at Lawrence Expressway and at Miller Avenue. Along these corridors and at the two village locations, the mass and scale of commercial and mixed use buildings could increase as building forms change. Views of the built environment, as well as nearby hillsides, along the Grand Boulevards in the West Valley Planning Area, could be modified by the development and redevelopment allowed under the proposed General Plan.
Willow Glen Planning Area
The Willow Glen Planning Area is located southwest of Downtown (refer to Figure 2.2-16). Growth areas include several separate corridors along Bascom Avenue, Southwest Expressway, and Hillsdale Avenue (also within the Cambrian/Pioneer Planning Area). The three Villages within the Willow Glen Planning Area are located at Meridian Avenue and Hamilton Avenue, Meridian Avenue and Foxworthy Avenue, and Lincoln Avenue and Hillsdale Avenue (also within the Almaden Planning Area). The growth areas border residential areas and several schools and currently include strip commercial and office buildings and multiple story residential buildings of varying ages and architectural styles. Along Bascom Avenue large modern buildings on the institutional campuses of Valley Medical Center and San José City College and a new City of San José Community Center are visible from roadways and neighborhoods in the immediate vicinity. The most recent buildings constructed are anticipated to remain through the horizon year of the proposed General Plan and there is additional construction planned at the Valley Medical Center facility. Intensification and redevelopment of village and corridor areas could result in a contrast in building scale and type where they are adjacent to existing residential neighborhoods.
Non-Urban Hillsides Outside the Urban Service Area (Calero and San Felipe Planning Areas)
Two of the Planning Areas located on the City’s southern edge, Calero and San Felipe, are located outside the City’s UGB. The San Felipe Planning Area includes Coyote Ridge, portions of the Silver
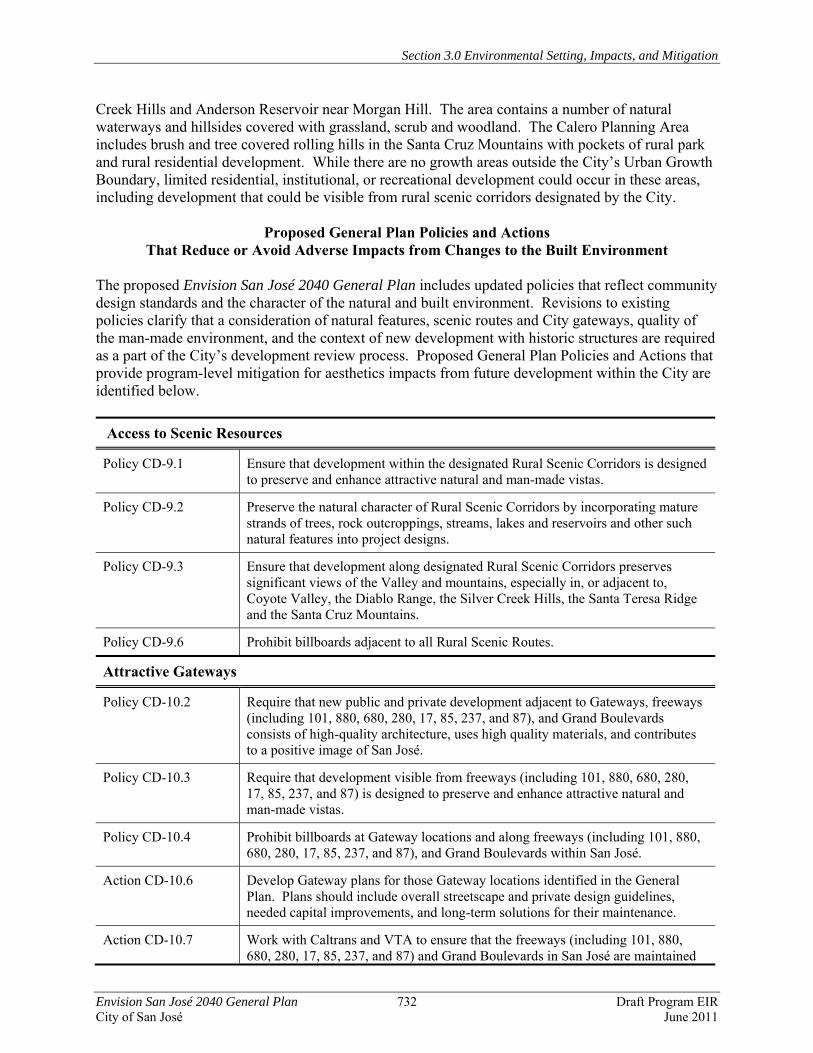
Section 3.0 Environmental Setting, Impacts, and Mitigation
Envision San José 2040 General Plan 732 Draft Program EIR City of San José June 2011
Creek Hills and Anderson Reservoir near Morgan Hill. The area contains a number of natural waterways and hillsides covered with grassland, scrub and woodland. The Calero Planning Area includes brush and tree covered rolling hills in the Santa Cruz Mountains with pockets of rural park and rural residential development. While there are no growth areas outside the City’s Urban Growth Boundary, limited residential, institutional, or recreational development could occur in these areas, including development that could be visible from rural scenic corridors designated by the City.
Proposed General Plan Policies and Actions That Reduce or Avoid Adverse Impacts from Changes to the Built Environment
The proposed Envision San José 2040 General Plan includes updated policies that reflect community design standards and the character of the natural and built environment. Revisions to existing policies clarify that a consideration of natural features, scenic routes and City gateways, quality of the man-made environment, and the context of new development with historic structures are required as a part of the City’s development review process. Proposed General Plan Policies and Actions that provide program-level mitigation for aesthetics impacts from future development within the City are identified below. Access to Scenic Resources
Policy CD-9.1 Ensure that development within the designated Rural Scenic Corridors is designed to preserve and enhance attractive natural and man-made vistas.
Policy CD-9.2 Preserve the natural character of Rural Scenic Corridors by incorporating mature strands of trees, rock outcroppings, streams, lakes and reservoirs and other such natural features into project designs.
Policy CD-9.3 Ensure that development along designated Rural Scenic Corridors preserves significant views of the Valley and mountains, especially in, or adjacent to, Coyote Valley, the Diablo Range, the Silver Creek Hills, the Santa Teresa Ridge and the Santa Cruz Mountains.
Policy CD-9.6 Prohibit billboards adjacent to all Rural Scenic Routes.
Attractive Gateways
Policy CD-10.2 Require that new public and private development adjacent to Gateways, freeways (including 101, 880, 680, 280, 17, 85, 237, and 87), and Grand Boulevards consists of high-quality architecture, uses high quality materials, and contributes to a positive image of San José.
Policy CD-10.3 Require that development visible from freeways (including 101, 880, 680, 280, 17, 85, 237, and 87) is designed to preserve and enhance attractive natural and man-made vistas.
Policy CD-10.4 Prohibit billboards at Gateway locations and along freeways (including 101, 880, 680, 280, 17, 85, 237, and 87), and Grand Boulevards within San José.
Action CD-10.6 Develop Gateway plans for those Gateway locations identified in the General Plan. Plans should include overall streetscape and private design guidelines, needed capital improvements, and long-term solutions for their maintenance.
Action CD-10.7 Work with Caltrans and VTA to ensure that the freeways (including 101, 880, 680, 280, 17, 85, 237, and 87) and Grand Boulevards in San José are maintained
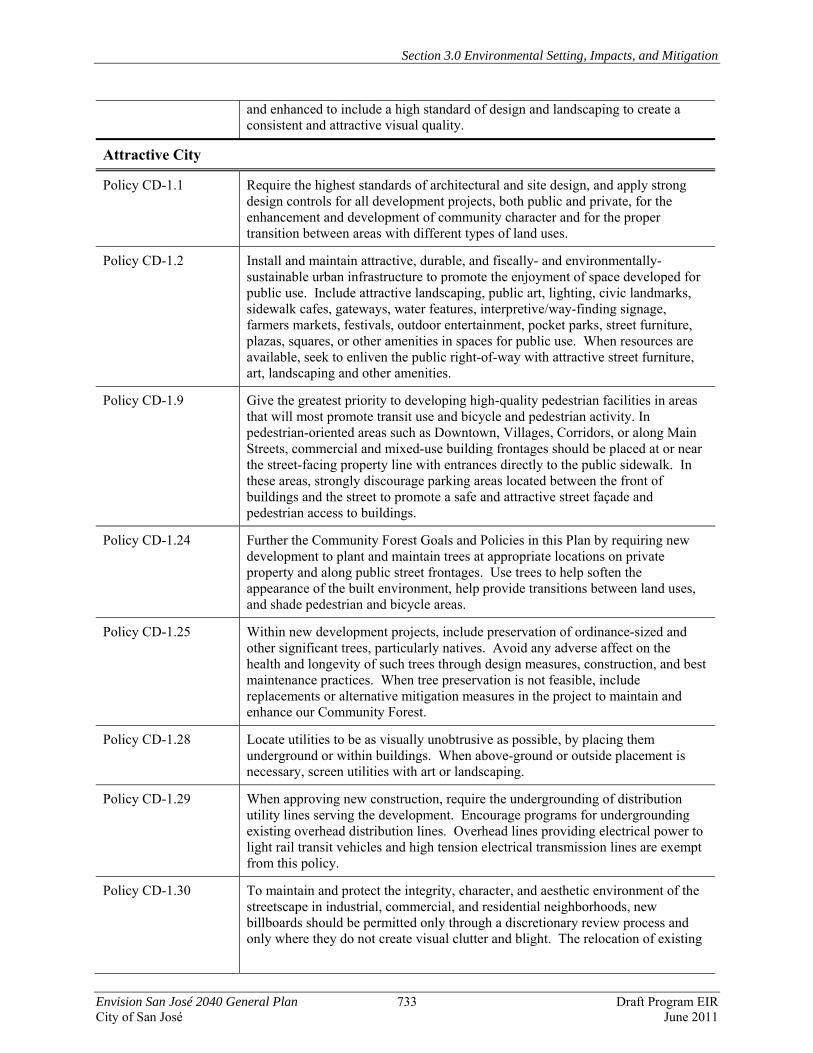
Section 3.0 Environmental Setting, Impacts, and Mitigation
Envision San José 2040 General Plan 733 Draft Program EIR City of San José June 2011
and enhanced to include a high standard of design and landscaping to create a consistent and attractive visual quality.
Attractive City
Policy CD-1.1 Require the highest standards of architectural and site design, and apply strong design controls for all development projects, both public and private, for the enhancement and development of community character and for the proper transition between areas with different types of land uses.
Policy CD-1.2 Install and maintain attractive, durable, and fiscally- and environmentally- sustainable urban infrastructure to promote the enjoyment of space developed for public use. Include attractive landscaping, public art, lighting, civic landmarks, sidewalk cafes, gateways, water features, interpretive/way-finding signage, farmers markets, festivals, outdoor entertainment, pocket parks, street furniture, plazas, squares, or other amenities in spaces for public use. When resources are available, seek to enliven the public right-of-way with attractive street furniture, art, landscaping and other amenities.
Policy CD-1.9 Give the greatest priority to developing high-quality pedestrian facilities in areas that will most promote transit use and bicycle and pedestrian activity. In pedestrian-oriented areas such as Downtown, Villages, Corridors, or along Main Streets, commercial and mixed-use building frontages should be placed at or near the street-facing property line with entrances directly to the public sidewalk. In these areas, strongly discourage parking areas located between the front of buildings and the street to promote a safe and attractive street façade and pedestrian access to buildings.
Policy CD-1.24 Further the Community Forest Goals and Policies in this Plan by requiring new development to plant and maintain trees at appropriate locations on private property and along public street frontages. Use trees to help soften the appearance of the built environment, help provide transitions between land uses, and shade pedestrian and bicycle areas.
Policy CD-1.25 Within new development projects, include preservation of ordinance-sized and other significant trees, particularly natives. Avoid any adverse affect on the health and longevity of such trees through design measures, construction, and best maintenance practices. When tree preservation is not feasible, include replacements or alternative mitigation measures in the project to maintain and enhance our Community Forest.
Policy CD-1.28 Locate utilities to be as visually unobtrusive as possible, by placing them underground or within buildings. When above-ground or outside placement is necessary, screen utilities with art or landscaping.
Policy CD-1.29 When approving new construction, require the undergrounding of distribution utility lines serving the development. Encourage programs for undergrounding existing overhead distribution lines. Overhead lines providing electrical power to light rail transit vehicles and high tension electrical transmission lines are exempt from this policy.
Policy CD-1.30 To maintain and protect the integrity, character, and aesthetic environment of the streetscape in industrial, commercial, and residential neighborhoods, new billboards should be permitted only through a discretionary review process and only where they do not create visual clutter and blight. The relocation of existing
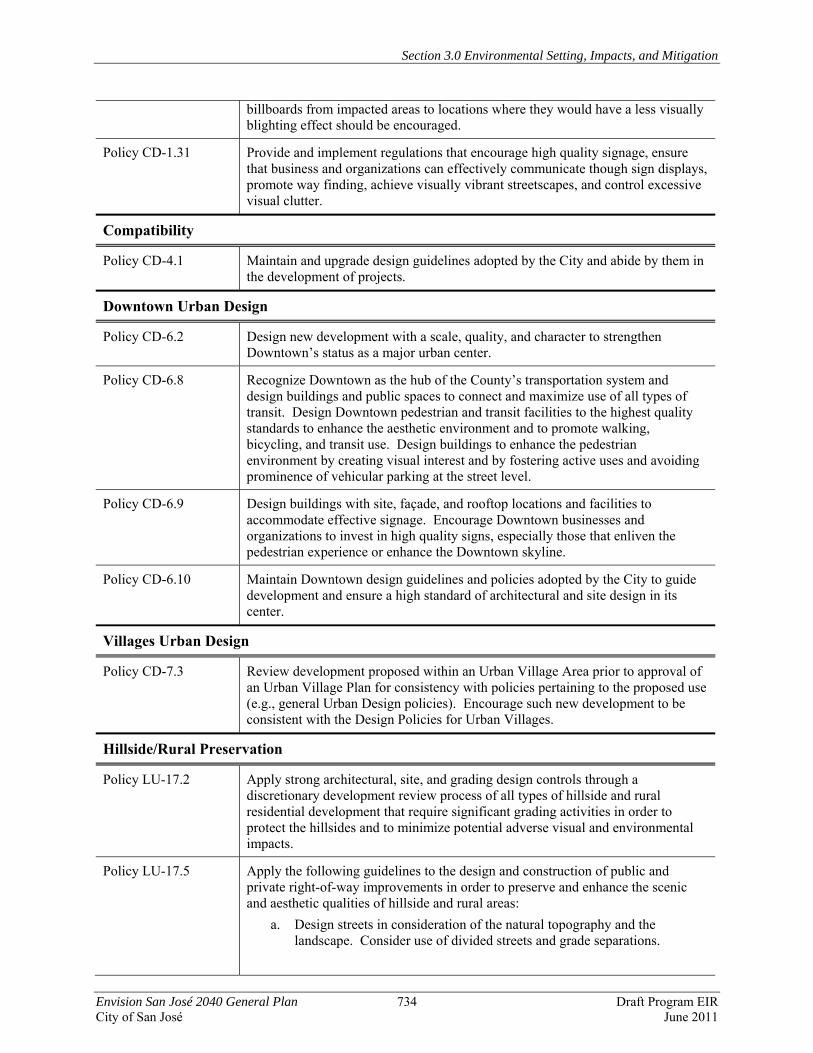
Section 3.0 Environmental Setting, Impacts, and Mitigation
Envision San José 2040 General Plan 734 Draft Program EIR City of San José June 2011
billboards from impacted areas to locations where they would have a less visually blighting effect should be encouraged.
Policy CD-1.31 Provide and implement regulations that encourage high quality signage, ensure that business and organizations can effectively communicate though sign displays, promote way finding, achieve visually vibrant streetscapes, and control excessive visual clutter.
Compatibility
Policy CD-4.1 Maintain and upgrade design guidelines adopted by the City and abide by them in the development of projects.
Downtown Urban Design
Policy CD-6.2 Design new development with a scale, quality, and character to strengthen Downtown’s status as a major urban center.
Policy CD-6.8 Recognize Downtown as the hub of the County’s transportation system and design buildings and public spaces to connect and maximize use of all types of transit. Design Downtown pedestrian and transit facilities to the highest quality standards to enhance the aesthetic environment and to promote walking, bicycling, and transit use. Design buildings to enhance the pedestrian environment by creating visual interest and by fostering active uses and avoiding prominence of vehicular parking at the street level.
Policy CD-6.9 Design buildings with site, façade, and rooftop locations and facilities to accommodate effective signage. Encourage Downtown businesses and organizations to invest in high quality signs, especially those that enliven the pedestrian experience or enhance the Downtown skyline.
Policy CD-6.10 Maintain Downtown design guidelines and policies adopted by the City to guide development and ensure a high standard of architectural and site design in its center.
Villages Urban Design
Policy CD-7.3 Review development proposed within an Urban Village Area prior to approval of an Urban Village Plan for consistency with policies pertaining to the proposed use (e.g., general Urban Design policies). Encourage such new development to be consistent with the Design Policies for Urban Villages.
Hillside/Rural Preservation
Policy LU-17.2 Apply strong architectural, site, and grading design controls through a discretionary development review process of all types of hillside and rural residential development that require significant grading activities in order to protect the hillsides and to minimize potential adverse visual and environmental impacts.
Policy LU-17.5 Apply the following guidelines to the design and construction of public and private right-of-way improvements in order to preserve and enhance the scenic and aesthetic qualities of hillside and rural areas:
a. Design streets in consideration of the natural topography and the landscape. Consider use of divided streets and grade separations.
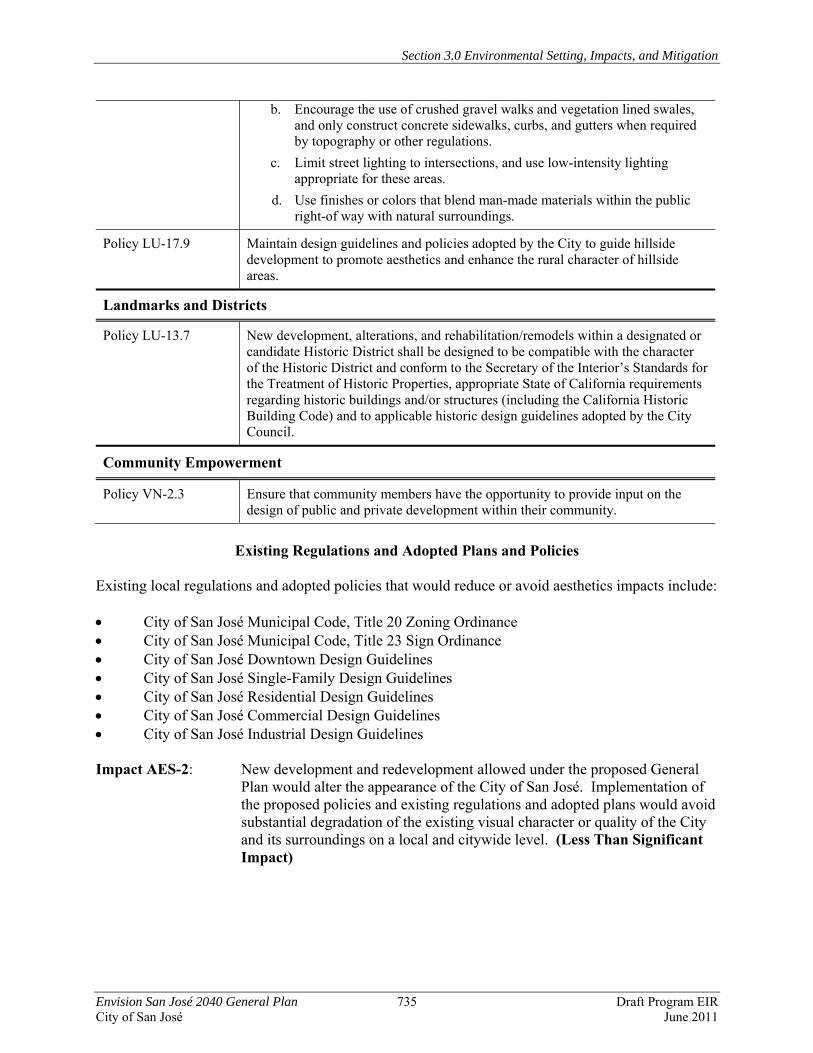
Section 3.0 Environmental Setting, Impacts, and Mitigation
Envision San José 2040 General Plan 735 Draft Program EIR City of San José June 2011
b. Encourage the use of crushed gravel walks and vegetation lined swales, and only construct concrete sidewalks, curbs, and gutters when required by topography or other regulations.
c. Limit street lighting to intersections, and use low-intensity lighting appropriate for these areas.
d. Use finishes or colors that blend man-made materials within the public right-of way with natural surroundings.
Policy LU-17.9 Maintain design guidelines and policies adopted by the City to guide hillside development to promote aesthetics and enhance the rural character of hillside areas.
Landmarks and Districts
Policy LU-13.7 New development, alterations, and rehabilitation/remodels within a designated or candidate Historic District shall be designed to be compatible with the character of the Historic District and conform to the Secretary of the Interior’s Standards for the Treatment of Historic Properties, appropriate State of California requirements regarding historic buildings and/or structures (including the California Historic Building Code) and to applicable historic design guidelines adopted by the City Council.
Community Empowerment
Policy VN-2.3 Ensure that community members have the opportunity to provide input on the design of public and private development within their community.
Existing Regulations and Adopted Plans and Policies
Existing local regulations and adopted policies that would reduce or avoid aesthetics impacts include: • City of San José Municipal Code, Title 20 Zoning Ordinance • City of San José Municipal Code, Title 23 Sign Ordinance • City of San José Downtown Design Guidelines • City of San José Single-Family Design Guidelines • City of San José Residential Design Guidelines • City of San José Commercial Design Guidelines • City of San José Industrial Design Guidelines Impact AES-2: New development and redevelopment allowed under the proposed General
Plan would alter the appearance of the City of San José. Implementation of the proposed policies and existing regulations and adopted plans would avoid substantial degradation of the existing visual character or quality of the City and its surroundings on a local and citywide level. (Less Than Significant Impact)
Section 3.0 Environmental Setting, Impacts, and Mitigation
Envision San José 2040 General Plan 736 Draft Program EIR City of San José June 2011
3.12.3.3 Nighttime Light and Daytime Glare The proposed General Plan allows for a greater mix of uses, including location of residential uses closer to businesses that are industrial or commercial operations. New development and redevelopment under the proposed Envision San José 2040 General Plan has the potential to create additional light or glare in the City. Sources of light and glare include external housing lights, street-lights, parking lot lights, security lights, vehicular headlights, internal building lights, and reflective building surfaces and windows. Most development will go through a design review process, prior to issuance of building permits, and will be reviewed for consistency with the City’s Design Guidelines. New lighting will be installed in accordance with the City Council’s adopted Lighting Policy 4-2 and Private Outdoor Lighting Policy 4.3, to control the amount and color of light shining on streets and sidewalks. New lighting will be installed to also protect the night sky. The City’s light and glare will be reduced and managed consistent with regulations and adopted policies.
Proposed General Plan Policies and Actions That Reduce or Avoid Adverse Impacts From Light and Glare
The proposed Envision San José 2040 General Plan includes updated policies that address community design standards and the character of the natural and built environment. Proposed General Plan Policies and Actions that provide program-level mitigation for aesthetics impacts related to nighttime lighting and daytime glare are identified below. Access to Scenic Routes
Policy CD-9.1 Ensure that development within the designated Rural Scenic Corridors is designed to preserve and enhance attractive natural and man-made vistas.
Compatibility
Policy CD-4.1 Maintain and upgrade design guidelines adopted by the City and abide by them in the development of projects.
Downtown Urban Design
Policy CD-6.10 Maintain Downtown design guidelines and policies adopted by the City to guide development and ensure a high standard of architectural and site design in its center.
Hillside/Rural Preservation
Policy LU-17.5 Apply the following guidelines to the design and construction of public and private right-of-way improvements in order to preserve and enhance the scenic and aesthetic qualities of hillside and rural areas:
a. Design streets in consideration of the natural topography and the landscape. Consider use of divided streets and grade separations.
b. Encourage the use of crushed gravel walks and vegetation lined swales, and only construct concrete sidewalks, curbs, and gutters when required by topography or other regulations.
c. Limit street lighting to intersections, and use low-intensity lighting appropriate for these areas.
Section 3.0 Environmental Setting, Impacts, and Mitigation
Envision San José 2040 General Plan 737 Draft Program EIR City of San José June 2011
d. Use finishes or colors that blend man-made materials within the public right-of way with natural surroundings.
Policy LU-17.6 Avoid any new development along ridges and other major hillside areas (typically all properties that exceed 30% slope) that surround the valley floor to minimize visibility of development on these aesthetic resources.
Existing Regulations and Adopted Plans and Policies
Existing local regulations that would reduce or avoid aesthetics impacts related to light and glare include: • City of San José Municipal Code, Title 20 Zoning Ordinance • City of San José Downtown Design Guidelines • City of San José Single-Family Design Guidelines • City of San José Residential Design Guidelines • City of San José Commercial Design Guidelines • City of San José Industrial Design Guidelines • City Council Lighting Policy 4-2 • City Council Private Outdoor Lighting Policy 4-3 Impact AES-3: New development and redevelopment allowed under the proposed Envision
San José 2040 General Plan could be new sources of nighttime light and daytime glare. Implementation of the proposed General Plan policies and existing regulations and adopted plans would avoid substantial light and glare impacts. (Less Than Significant Impact)
3.12.3.4 Impacts of Rancho del Pueblo and iStar Residential Options As discussed in Section 2.2.8 in the Project Description, this PEIR also evaluates options for residential land use designations and anticipated future development on two properties; the Rancho del Pueblo Golf Course in the Alum Rock Planning Area and the iStar property in the Edenvale Planning Area (Residential Option Sites). Under these options one or both of these properties would be designated for residential uses instead of the industrial uses assumed on the iStar property and the park/open space on the existing Rancho del Pueblo Golf Course. Because these options also include modifications to other Growth Areas, adjusting the assumed dwelling units or jobs, the overall amount of development capacity assumed under the Preferred Scenario would not change citywide. A comparison and summary of aesthetics impacts for the residential options is shown in Table 3.12-1. Implementation of an updated General Plan that includes one or both of the residential options for the Rancho del Pueblo and iStar sites would have impacts similar to those from the proposed project.
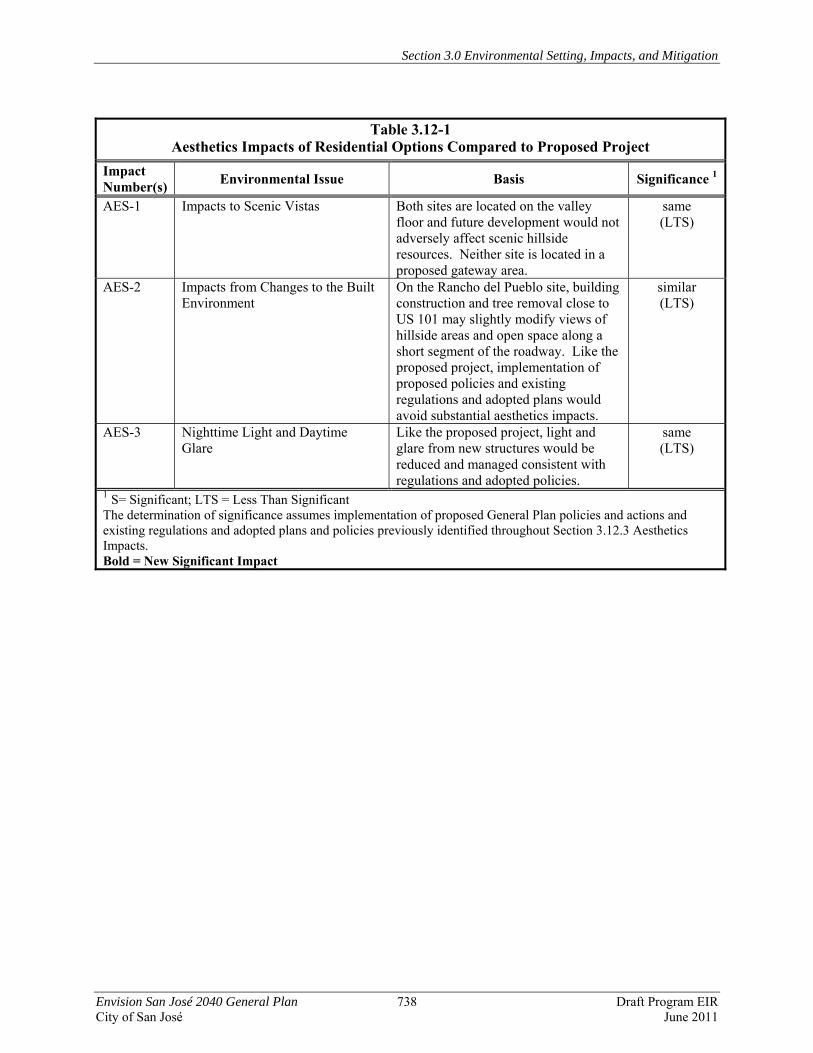
Section 3.0 Environmental Setting, Impacts, and Mitigation
Envision San José 2040 General Plan 738 Draft Program EIR City of San José June 2011
Table 3.12-1
Aesthetics Impacts of Residential Options Compared to Proposed Project Impact Number(s) Environmental Issue Basis Significance 1
AES-1 Impacts to Scenic Vistas
Both sites are located on the valley floor and future development would not adversely affect scenic hillside resources. Neither site is located in a proposed gateway area.
same (LTS)
AES-2
Impacts from Changes to the Built Environment
On the Rancho del Pueblo site, building construction and tree removal close to US 101 may slightly modify views of hillside areas and open space along a short segment of the roadway. Like the proposed project, implementation of proposed policies and existing regulations and adopted plans would avoid substantial aesthetics impacts.
similar (LTS)
AES-3 Nighttime Light and Daytime Glare
Like the proposed project, light and glare from new structures would be reduced and managed consistent with regulations and adopted policies.
same (LTS)
1 S= Significant; LTS = Less Than Significant The determination of significance assumes implementation of proposed General Plan policies and actions and existing regulations and adopted plans and policies previously identified throughout Section 3.12.3 Aesthetics Impacts. Bold = New Significant Impact
Section 3.0 Environmental Setting, Impacts, and Mitigation
Envision San José 2040 General Plan 739 Draft Program EIR City of San José June 2011
3.12.4 Mitigation and Avoidance Measures for Aesthetics Impacts 3.12.4.1 Proposed General Plan
Aesthetics Impacts to Scenic Vistas As disclosed in the 1992 Final EIR for the Communications Hill Specific Plan, development of urban uses on the visually prominent hillside of Communications Hill would result in a significant impact. While grassy hillslopes would remain and future buildings would be reviewed for quality of design, including building colors that blend into the hillside to the extent feasible, the introduction of additional, multi-story urban development at this location would remain a significant and unavoidable visual impact. Planned development in the North Coyote Planning Area, specifically the Coyote Valley Research Park, would block views of hillsides from several designated Rural Scenic Corridors. As identified in the 2000 Final EIR for the Coyote Valley Research Park, although the planned development includes extensive landscaping, there are no measures that would fully eliminate the visual impact of converting over 300 rural acres to urban uses and multi-story urban development at this location would remain a significant and unavoidable visual (aesthetic) impact. (Significant Unavoidable Impact) 3.12.4.2 Rancho del Pueblo and iStar Residential Options
Aesthetics Impacts to Scenic Vistas Mitigation and avoidance measures for the Communications Hill Specific Plan and North Coyote Valley Planning Area would be the same as those for the proposed General Plan. (Significant Unavoidable Impact) 3.12.5 Significance Conclusions 3.12.5.1 Proposed General Plan Implementation of the proposed Envision San José 2040 General Plan in accordance with proposed policies and actions would result in less than significant aesthetics impacts, except for build-out of the Communications Hill Specific Plan Area and the North Coyote Valley Area. (Significant Unavoidable Impact) 3.12.5.2 Rancho del Pueblo and iStar Residential Options The significance conclusions for the Rancho del Pueblo and iStar Residential Options would be the same as the proposed project. (Significant Unavoidable Impact)
Section 3.0 Environmental Setting, Impacts, and Mitigation
Envision San José 2040 General Plan 740 Draft Program EIR City of San José June 2011
3.13 ENERGY This section summarizes information on energy use within the City of San José and provides an evaluation of the effects the proposed Envision San José 2040 General Plan would have on energy use. This section was prepared pursuant to CEQA Guidelines Section 15126.4 (a)(1)(c) and Appendix F which requires that EIRs include a discussion of the potential energy impacts of proposed projects with particular emphasis on avoiding or reducing inefficient, wasteful, and unnecessary consumption of energy. 3.13.1 Overview Energy consumption is analyzed in an EIR because of the environmental impacts associated with its production and usage. Such impacts include the depletion of nonrenewable resources (e.g., oil, natural gas, coal, etc.) and emission of pollutants during both the production and consumption phases. Energy use is typically quantified using the British Thermal Unit (BTU). The BTU is the amount of energy that is required to raise the temperature of one pound of water by one degree Fahrenheit. As points of reference, the approximate amount of energy contained in a gallon of gasoline, a cubic foot of natural gas, and a kilowatt hour (kWh) of electricity are 123,000 BTUs, 1,000 BTUs, and 3,400 BTUs, respectively. Natural gas usage is expressed in therms. A therm is equal to 100,000 BTU. Electrical energy is expressed in units of kilowatt hours (kWh),167 megawatt hours (MWh = 1,000 kWh), gigawatt hours (GWh = one million kWh), or terawatt hours (TWh = one billion kWh). One kWh is equal to the amount of energy expended by 1,000 watts (the typical electricity that is consumed by a 1,000 watt hand-held hair dryer) over the period of an hour. 3.13.2 Existing Setting 3.13.2.1 Electrical Power and Natural Gas Pacific Gas and Electric Company (PG&E) transmits and delivers electricity and natural gas to residents and businesses in the City of San José and provides natural gas and electric service to approximately 15 million people throughout a 70,000 square-mile service area in northern and central California. PG&E’s operations are regulated by the California Public Utilities Commission.168 Electricity and natural gas supplies, including those supplied to San José by PG&E, are also regulated by the California Energy Commission (CEC).
Electricity Use and Supply The California Independent System Operator (ISO), a non-profit public benefit corporation, operates most of California’s high-voltage wholesale power grid and is responsible for balancing the demand for electricity with an equal supply on a daily and long-term basis. In 2008, the state’s total electricity system generation (in-state and imported power) was approximately 306,580 GWh.169
167 Under the International System of Units (SI), one kWh is equivalent to 3.6 megajoules, which is the amount of energy converted if work is done at an average rate of one thousand watts for one hour. 168 Pacific Gas and Electric Company Profile. Available at:< http://www.pge.com/about/company/profile/ > 169 California Energy Commission. 2009 Integrated Energy Policy Report. CEC-100-2009-003-CMF. December 2009. Page 45.
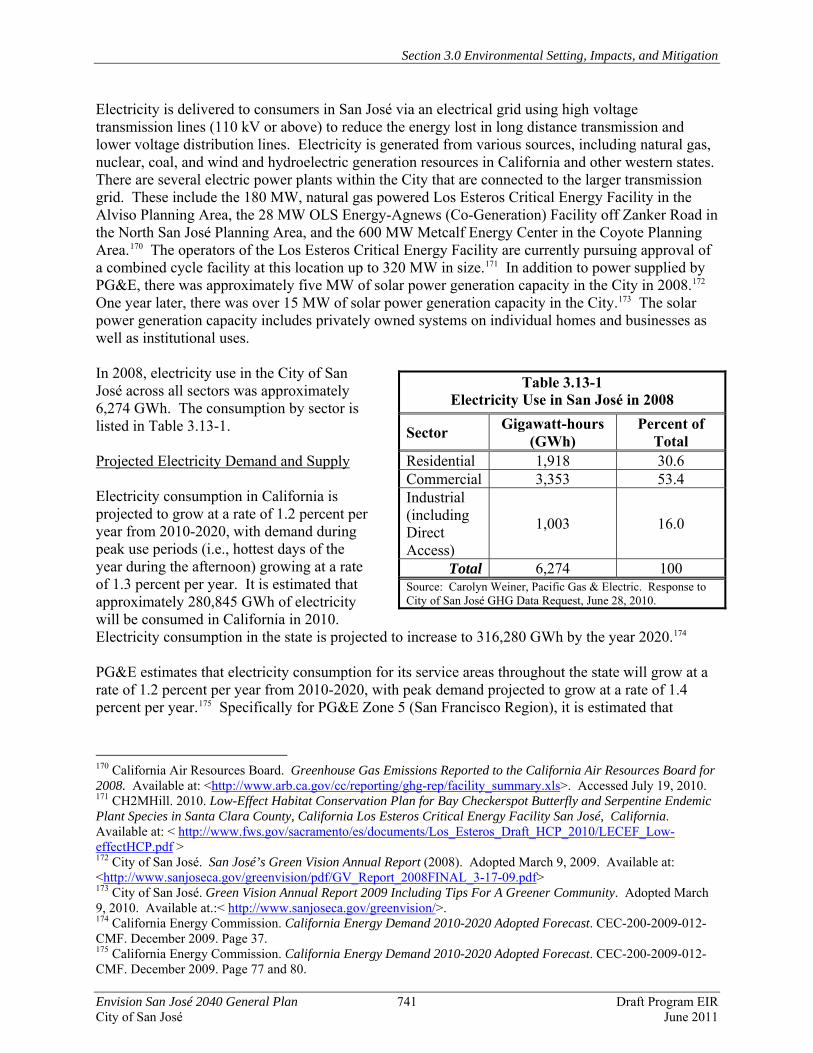
Section 3.0 Environmental Setting, Impacts, and Mitigation
Envision San José 2040 General Plan 741 Draft Program EIR City of San José June 2011
Electricity is delivered to consumers in San José via an electrical grid using high voltage transmission lines (110 kV or above) to reduce the energy lost in long distance transmission and lower voltage distribution lines. Electricity is generated from various sources, including natural gas, nuclear, coal, and wind and hydroelectric generation resources in California and other western states. There are several electric power plants within the City that are connected to the larger transmission grid. These include the 180 MW, natural gas powered Los Esteros Critical Energy Facility in the Alviso Planning Area, the 28 MW OLS Energy-Agnews (Co-Generation) Facility off Zanker Road in the North San José Planning Area, and the 600 MW Metcalf Energy Center in the Coyote Planning Area.170 The operators of the Los Esteros Critical Energy Facility are currently pursuing approval of a combined cycle facility at this location up to 320 MW in size.171 In addition to power supplied by PG&E, there was approximately five MW of solar power generation capacity in the City in 2008.172 One year later, there was over 15 MW of solar power generation capacity in the City.173 The solar power generation capacity includes privately owned systems on individual homes and businesses as well as institutional uses. In 2008, electricity use in the City of San José across all sectors was approximately 6,274 GWh. The consumption by sector is listed in Table 3.13-1. Projected Electricity Demand and Supply Electricity consumption in California is projected to grow at a rate of 1.2 percent per year from 2010-2020, with demand during peak use periods (i.e., hottest days of the year during the afternoon) growing at a rate of 1.3 percent per year. It is estimated that approximately 280,845 GWh of electricity will be consumed in California in 2010. Electricity consumption in the state is projected to increase to 316,280 GWh by the year 2020.174 PG&E estimates that electricity consumption for its service areas throughout the state will grow at a rate of 1.2 percent per year from 2010-2020, with peak demand projected to grow at a rate of 1.4 percent per year.175 Specifically for PG&E Zone 5 (San Francisco Region), it is estimated that
170 California Air Resources Board. Greenhouse Gas Emissions Reported to the California Air Resources Board for 2008. Available at: <http://www.arb.ca.gov/cc/reporting/ghg-rep/facility_summary.xls>. Accessed July 19, 2010. 171 CH2MHill. 2010. Low-Effect Habitat Conservation Plan for Bay Checkerspot Butterfly and Serpentine Endemic Plant Species in Santa Clara County, California Los Esteros Critical Energy Facility San José, California. Available at: < http://www.fws.gov/sacramento/es/documents/Los_Esteros_Draft_HCP_2010/LECEF_Low-effectHCP.pdf > 172 City of San José. San José’s Green Vision Annual Report (2008). Adopted March 9, 2009. Available at: <http://www.sanjoseca.gov/greenvision/pdf/GV_Report_2008FINAL_3-17-09.pdf> 173 City of San José. Green Vision Annual Report 2009 Including Tips For A Greener Community. Adopted March 9, 2010. Available at.:< http://www.sanjoseca.gov/greenvision/>. 174 California Energy Commission. California Energy Demand 2010-2020 Adopted Forecast. CEC-200-2009-012-CMF. December 2009. Page 37. 175 California Energy Commission. California Energy Demand 2010-2020 Adopted Forecast. CEC-200-2009-012-CMF. December 2009. Page 77 and 80.
Table 3.13-1 Electricity Use in San José in 2008
Sector Gigawatt-hours (GWh)
Percent of Total
Residential 1,918 30.6 Commercial 3,353 53.4 Industrial (including Direct Access)
1,003 16.0
Total 6,274 100 Source: Carolyn Weiner, Pacific Gas & Electric. Response to City of San José GHG Data Request, June 28, 2010.
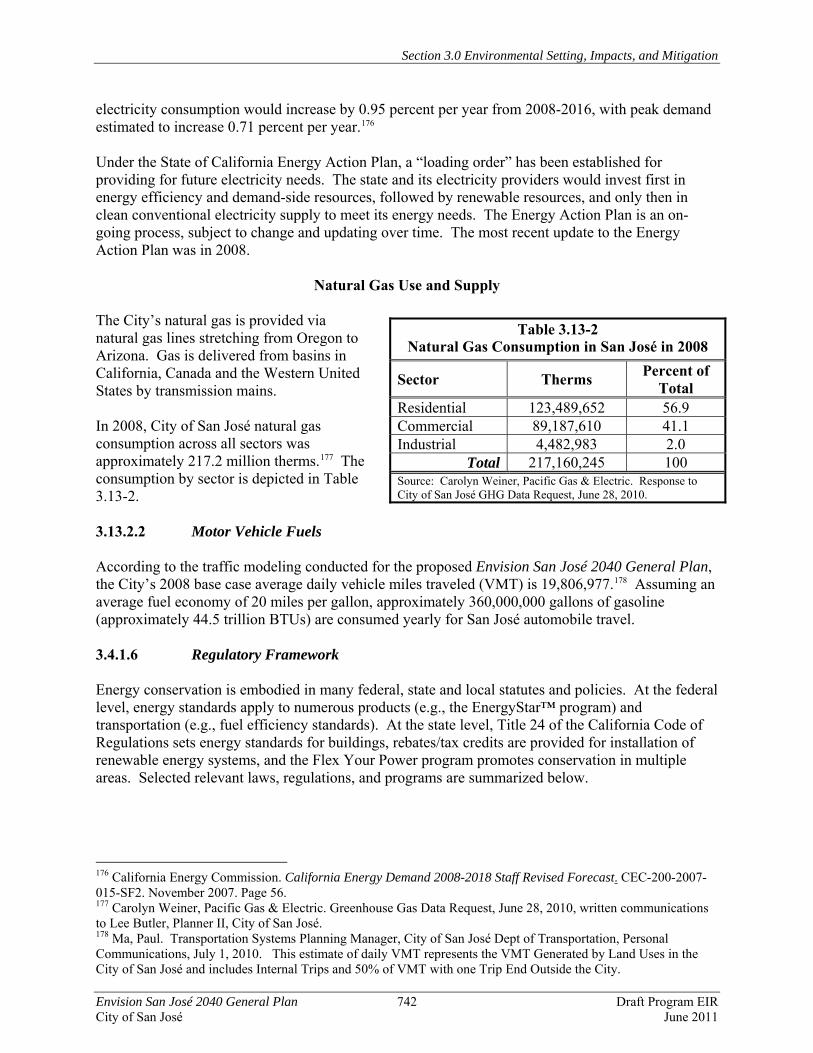
Section 3.0 Environmental Setting, Impacts, and Mitigation
Envision San José 2040 General Plan 742 Draft Program EIR City of San José June 2011
electricity consumption would increase by 0.95 percent per year from 2008-2016, with peak demand estimated to increase 0.71 percent per year.176 Under the State of California Energy Action Plan, a “loading order” has been established for providing for future electricity needs. The state and its electricity providers would invest first in energy efficiency and demand-side resources, followed by renewable resources, and only then in clean conventional electricity supply to meet its energy needs. The Energy Action Plan is an on-going process, subject to change and updating over time. The most recent update to the Energy Action Plan was in 2008.
Natural Gas Use and Supply
The City’s natural gas is provided via natural gas lines stretching from Oregon to Arizona. Gas is delivered from basins in California, Canada and the Western United States by transmission mains. In 2008, City of San José natural gas consumption across all sectors was approximately 217.2 million therms.177 The consumption by sector is depicted in Table 3.13-2. 3.13.2.2 Motor Vehicle Fuels According to the traffic modeling conducted for the proposed Envision San José 2040 General Plan, the City’s 2008 base case average daily vehicle miles traveled (VMT) is 19,806,977.178 Assuming an average fuel economy of 20 miles per gallon, approximately 360,000,000 gallons of gasoline (approximately 44.5 trillion BTUs) are consumed yearly for San José automobile travel. 3.4.1.6 Regulatory Framework Energy conservation is embodied in many federal, state and local statutes and policies. At the federal level, energy standards apply to numerous products (e.g., the EnergyStar™ program) and transportation (e.g., fuel efficiency standards). At the state level, Title 24 of the California Code of Regulations sets energy standards for buildings, rebates/tax credits are provided for installation of renewable energy systems, and the Flex Your Power program promotes conservation in multiple areas. Selected relevant laws, regulations, and programs are summarized below.
176 California Energy Commission. California Energy Demand 2008-2018 Staff Revised Forecast. CEC-200-2007-015-SF2. November 2007. Page 56. 177 Carolyn Weiner, Pacific Gas & Electric. Greenhouse Gas Data Request, June 28, 2010, written communications to Lee Butler, Planner II, City of San José. 178 Ma, Paul. Transportation Systems Planning Manager, City of San José Dept of Transportation, Personal Communications, July 1, 2010. This estimate of daily VMT represents the VMT Generated by Land Uses in the City of San José and includes Internal Trips and 50% of VMT with one Trip End Outside the City.
Table 3.13-2 Natural Gas Consumption in San José in 2008
Sector Therms Percent of Total
Residential 123,489,652 56.9 Commercial 89,187,610 41.1 Industrial 4,482,983 2.0
Total 217,160,245 100 Source: Carolyn Weiner, Pacific Gas & Electric. Response to City of San José GHG Data Request, June 28, 2010.
Section 3.0 Environmental Setting, Impacts, and Mitigation
Envision San José 2040 General Plan 743 Draft Program EIR City of San José June 2011
Federal The National Energy Policy The National Energy Policy, established in 2001 by the National Energy Policy Development Group (NEPDG), is designed to help the private sector and state and local governments promote dependable, affordable, and environmentally sound production and distribution of energy for the future. Key issues addressed by the energy policy are energy conservation, repair and expansion of energy infrastructure, and ways of increasing energy supplies while protecting the environment.
State of California California 2007 Energy Action Plan Update The 2007 update to the 2005 Energy Action Plan II is the State’s principal energy planning and policy document.179 The updated document examines the state’s ongoing actions in the context of global climate change and describes a coordinated implementation plan for state energy policies, and identifies specific action areas to ensure that California’s energy resources are adequate, affordable, technologically advanced, and environmentally sound. In accordance with this plan, the first-priority actions to address California’s increasing energy demands are energy efficiency and demand response (i.e., reduction of customer energy usage during peak periods to address system reliability and support the best use of energy infrastructure). Additional priorities include the use of renewable sources of power and distributed generation (i.e., the use of relatively small power plants near or at centers of high demand). To the extent that these actions are unable to satisfy the increasing energy demand and transmission capacity needs, clean and efficient fossil-fired generation is supported. Renewable Portfolio Standard Program In 2002, with the adoption of SB 1078, California established its Renewable Portfolio Standard (RPS) program, with the goal of increasing the percentage of renewable energy in the State’s electricity mix by at least one to 20 percent per year by 2017. The adoption of SB 107 subsequently accelerated that goal to 2010 for electrical corporations, and under Executive Order S-14-08 the target for all retail electricity sellers increases to 33 percent by 2020. The Renewable Portfolio Standard was developed to provide a flexible, market-driven policy to ensure that the public benefits of wind, solar, biomass, and geothermal energy continue to be realized as electricity markets become more competitive. The policy aims to ensure that a minimum amount of renewable energy is included in the portfolio of electricity resources serving a state or county, putting the energy industry on a path toward increasing sustainability. The CPUC and CEC are jointly responsible for implementing the RPS program. Legislation establishing the RPS created no obligation for local land authorities. However, in order to meet the requirements of this legislation, additional renewable energy projects and transmission line connections will be necessary and local land use planning processes can facilitate or hinder the ability of energy providers to establish these additional facilities. 179 California Energy Commission, 2007 Integrated Energy Policy Report, Commission Final Report, adopted December 5, 2007. Publication # CEC-100-2007-008-CMF. Available at: <http://www.energy.ca.gov/energy_action_plan/index.html>
Section 3.0 Environmental Setting, Impacts, and Mitigation
Envision San José 2040 General Plan 744 Draft Program EIR City of San José June 2011
Building Energy Efficiency Standards (Title 24) The Energy Efficiency Standards for Residential and Nonresidential Buildings, as specified in Title 24, Part 6, of the California Code of Regulations (CCR), were established in 1978 in response to a legislative mandate to reduce California’s energy consumption. The standards are updated periodically to allow consideration and possible incorporation of new energy efficiency technologies and methods. The current version of the standards was adopted on April 23, 2008 and took effect August 1, 2009. Compliance with these standards is mandatory at the time new building permits are issued by City and County governments. California Green Building Standards Code In January 2010, the State of California adopted the California Green Building Standards Code (CALGreen) that establishes mandatory green building standards for new construction (new buildings and expansions) in California.180 The code covers five categories: planning and design, energy efficiency, water efficiency and conservation, material conservation and resource efficiency, and indoor environmental quality. These standards include a mandatory set of minimum guidelines, as well as more rigorous voluntary measures, for new construction projects to achieve specific green building performance levels. Local communities may institute more stringent versions of the code if they choose. The code will go into effect as part of a local jurisdiction’s building code on January 1, 2011. California Utility Efficiency Programs (Senate Bill 1037 and Assembly Bill 2021) As discussed previously, the CPUC and CEC adopted an Energy Action Plan that prioritized resources for meeting California’s future energy needs, with energy efficiency identified as the highest priority. Since then, this policy goal has been codified into state statues as SB 1037 and AB 2021 through legislation that requires electric utilities to meet their resource needs first with energy efficiency.181 California Utility Efficiency Programs also have set new targets for statewide annual energy demand reductions. Achieving the State’s energy efficiency targets will require coordinated efforts from the State, the federal government, energy companies, and customers. The California Air Resources Board (ARB) will work with CEC and CPUC to facilitate these partnerships. California Assembly Bill 32 – Global Warming Solutions Act of 2006 Assembly Bill 32 (AB32) requires California to reduce its total GHG emissions to 1990 levels by 2020, which represents approximately a 30 percent decrease from current levels. In September 2007, ARB approved a list of nine Discrete Early Actions to reduce GHG emissions. CARB’s Discrete Early Actions include maximizing energy efficient building and appliance standards, pursuing additional efficiency efforts, including new technologies and new policy and implementation mechanisms, and pursuing comparable investment in energy efficiency by all retail providers of electricity in California (including both investor-owned and publicly-owned utilities). In December 2008, the ARB approved the Climate Change Scoping Plan. The Scoping Plan proposes a comprehensive set of actions designed to reduce California’s dependence on oil, diversify energy
180 Exceptions include new federal buildings and construction on Tribal Lands. 181 SB 1037 (Kehoe, Chapter 366, Statutes of 2005) and AB 2021 (Levine, Chapter 734, Statutes of 2006) directs electricity corporations subject to the CPUC’s authority and publicly-owned electricity utilities to first meet their unmet resource needs through all available energy efficiency and demand response resources that are cost-effective, reliable, and feasible.
Section 3.0 Environmental Setting, Impacts, and Mitigation
Envision San José 2040 General Plan 745 Draft Program EIR City of San José June 2011
sources, save energy, and enhance public health while creating new jobs and enhancing the growth in California’s economy. The ARB is currently working on additional regulations to implement the Scoping Plan. Senate Bill 375 – Redesigning Communities to Reduce Greenhouse Gases SB 375 encourages housing and transportation planning on a regional scale, in a manner designed to reduce vehicle use and associated greenhouse gas emissions. It requires the California Air Resources Board (ARB) to set regional targets for the purpose of reducing greenhouse gas emissions from passenger vehicles for 2020 and 2035. The targets apply to the regions in the State covered by the 18 metropolitan planning organizations (MPOs), including the Metropolitan Transportation Commission (MTC) in the San Francisco Bay Area and a reduction of regional vehicle use and greenhouse gas emissions would be accompanied by a reduction in energy use.
City of San José San José 2020 General Plan Existing strategies, goals, and policies in the City of San José General Plan have been adopted for the purpose of avoiding or mitigating environmental effects resulting from planned development within the City. Relevant General Plan Strategies, Goals, and Policies that directly address reducing energy use include the following.
Sustainable City Strategy
The Sustainable City Strategy is a statement of the City’s commitment to becoming an environmentally and economically sustainable city. Programs promoted under this strategy include recycling, waste disposal, water conservation, transportation demand management and energy efficiency. The Sustainable City Strategy is intended to support these efforts by ensuring that development is designed and built in a manner consistent with the efficient use of resources and environmental protection.
Energy Goal and Policies
The City’s Energy Goal is to foster development, which by its location and design, reduces the use of non-renewable energy resources in transportation, buildings and urban services (utilities), and expands the use of renewable energy resources. Applicable Energy Policies include: • Energy Policies #1-7
The following Transportation policies and programs included in the General Plan would also foster the reduction of energy use for transportation: • Transportation, Pedestrian Facilities Policies #17, 19, and 23 • Transportation, Transportation Systems Management/Transportation Demand Management
Policy #28 • Transportation, Bicycling Policies #51, 53
Section 3.0 Environmental Setting, Impacts, and Mitigation
Envision San José 2040 General Plan 746 Draft Program EIR City of San José June 2011
Municipal Code The City’s Municipal Code includes regulations associated with energy efficiency and energy use. City regulations include a Green Building Ordinance (Chapter 17.84) to foster practices to minimize the use and waste of energy, water and other resources in the City of San José, Water Efficient Landscape Standards for New and Rehabilitated Landscaping (Chapter 15.10), requirements for Transportation Demand Programs for employers with more than 100 employees (Chapter 11.105), a Construction and Demolition Diversion Deposit Program that fosters recycling of construction and demolition materials (Chapter 9.10), and a wood burning ordinance, which includes prohibitions on appliance types and fuel (Chapter 9.10). City Council Policies The City’s Environmentally Preferable Procurement Policy (Council Policy 4-6) calls for purchasing vehicles with best available fuel efficiency and other measures that directly or indirectly reduce energy use. Energy Efficiency Programs The City of San José is a partner, along with Pacific Gas & Electric Company and Ecology Action, in the Silicon Valley Energy Watch (SVEW) program. This program is designed to assist municipal governments, non profits, small businesses, community organizations, professionals, and residents Santa Clara County take advantage of cost-saving, energy-efficient technologies. The program offers free energy audits, targeted retrofits, technical assistance, education, and training.
Section 3.0 Environmental Setting, Impacts, and Mitigation
Envision San José 2040 General Plan 747 Draft Program EIR City of San José June 2011
3.13.3 Thresholds of Significance Implementation of the proposed Envision San José 2040 General Plan would have a significant impact if it would: • Fail to include means for avoiding or reducing, wasteful and/or unnecessary consumption of
energy. 3.13.4 Energy Impacts Although future growth within San José will be accommodated through infill development within the City’s UGB, implementation of the General Plan will nonetheless result in the consumption of additional energy. Multiple aspects of the General Plan have energy implications, including land use, housing, transportation, and water usage. 3.13.4.1 Energy Use in the Built Environment Given current use rates per residential unit and per square foot for the various non-residential land use types (commercial, industrial, and public/quasi-public) planned under the Envision San José 2040 General Plan, electric energy usage is forecast to increase from approximately 6,274,000 MWh to 13,700,400 MWh and natural gas usage to increase from approximately 217 million therms to 840 million therms in 2035.182 Electricity and natural gas is anticipated to continue to be provided by PG&E through 2035. These projections represent a “business-as-usual” projection and do not reflect implementation of new CalGreen building standards or City Green Vision programs. While it is the responsibility of PG&E and state agencies to plan for new electrical and natural gas infrastructure based upon projected population growth and demand, the proposed General Plan includes a number of policies and actions designed to reduce projected increases in demand for electricity and natural gas. Based upon the goals and policies in the proposed General Plan, through a combination of energy conservation, design that reduces energy demand, retrofitting of existing structures to improve energy efficiency, and installation of alternative energy generation at sites throughout the City, energy demand is not anticipated to be as great as that projected under business-as-usual conditions. Most new residential development would be multi-family housing which has a reduced energy demand per household. For these reasons, it is not anticipated that growth allowed under the proposed General Plan would contribute to an exceedance of demand projected regionally by PG&E and adopted by the California Energy Commission through approximately 2020. As noted above, the proposed General Plan includes policies to address energy consumption in the built environment in conjunction with the City’s Green Building program and Green Vision through the implementation of sustainably-oriented goals and policies. The City’s Green Vision can also positively affect energy supply and consumption by encouraging behaviors that promote increased energy efficiency and the use and expansion of (local) renewable energy resources.
182 Sierra Research. Greenhouse Gas Emissions Estimates. September 2010 (refer to Appendix I in this EIR).
Section 3.0 Environmental Setting, Impacts, and Mitigation
Envision San José 2040 General Plan 748 Draft Program EIR City of San José June 2011
Proposed General Plan Policies That Reduce or Avoid Adverse Energy Impacts Associated with the Built Environment
Goals and policies throughout the Envision San José 2040 General Plan encourage reduced energy use. The Envision San José 2040 General Plan includes updated energy conservation policies that seek to conserve energy. Generation of energy using renewable sources is also called for in the City’s Green Vision. Proposed General Plan Policies that provide program-level mitigation for energy impacts from the built environment are identified below. Green Building Policy Leadership
Policy MS-1.1 Continue to demonstrate leadership in the development and implementation of green building policies and practices. Ensure that all projects are consistent with or exceed the City’s Green Building Ordinance and City Council Policies as well as State and/or regional policies which require that projects incorporate various green building principles into their design and construction.
Energy Conservation and Renewable Energy Use
Policy MS-2.2 Encourage maximized use of on-site generation of renewable energy for all new and existing buildings.
Policy MS-2.3 Encourage consideration of solar orientation, (e.g., building placement, landscaping, design and construction techniques) for new construction to minimize energy consumption.
Action MS-2.8 Develop policies which promote energy reduction for energy-intensive industries. For facilities such as data centers, which have high energy demand and indirect greenhouse gas emissions, require evaluation of operational energy efficiency and inclusion of operational design measures as part of development review consistent with benchmarks such as those in EPA’s EnergyStar Program for new data centers.
Action MS-2.11 Require new development to incorporate green building practices, including those required by the Green Building Ordinance. Specifically target reduced energy use through construction techniques (e.g., design of building envelopes and systems to maximize energy performance), through architectural design (e.g. design to maximize cross ventilation and interior daylight) and through site design techniques (e.g. orienting buildings on sites to maximize the effectiveness of passive solar design).
Water Conservation and Quality
Policy MS-3.1 Require water-efficient landscaping, which conforms to the State’s Model Water Efficient Landscape Ordinance, for all new commercial, institutional, industrial, and developer-installed residential development unless for recreation or other area functions.
Waste Diversion
Policy MS-5.5 Maximize recycling and composting from all residents, businesses, and institutions in the City.
Section 3.0 Environmental Setting, Impacts, and Mitigation
Envision San José 2040 General Plan 749 Draft Program EIR City of San José June 2011
Waste Reduction
Policy MS-6.5 Reduce the amount of waste disposed in landfills through waste prevention, reuse, and recycling of materials at venues, facilities, and special events.
Policy MS-6.8 Maximize reuse, recycling, and composting citywide.
Reduce Consumption and Increase Efficiency
Policy MS-14.3 Consistent with the California Public Utilities Commission’s California Long Term Energy Efficiency Strategic Plan, as revised and when technological advances make it feasible, require all new residential and commercial construction to be designed for zero net energy use.
Policy MS-14.4
Implement the City’s Green Building Policies (see Green Building Section) so that new construction and rehabilitation of existing buildings fully implements industry best practices, including the use of optimized energy systems, selection of materials and resources, water efficiency, sustainable site selection, and passive solar building design and planting of trees and other landscape materials to reduce energy consumption.
Policy MS-14.5 Consistent with State and Federal policies and best practices, require energy efficiency audits and retrofits prior to or at the same time as consideration of solar electric improvements.
Action MS-14.6 Replace 100% of the City’s traffic signals and streetlights with smart, zero emission lighting by 2022.
Renewable Energy
Action MS-15.9 Train City code enforcement and development review staff in state-of-the-art Heating, Ventilation, and Air Conditioning (HVAC) and insulation industry standards, best practices, and resources to ensure buildings are constructed in compliance with those industry standards and best practices.
Responsible Management of Water Supply
Policy MS-17.2 Ensure that development within San José is planned and built in a manner consistent with sustainable use of current and future water supplies by encouraging sustainable development practices, including low-impact development, water-efficient development and green building techniques. Support the location of new development within the vicinity of the recycled water system and promote expansion of the SBWR system to areas planned for new development. Residential development outside of the Urban Service Area can be approved only at minimal levels and only allowed to use non-recycled water at urban intensities. For residential development outside of the Urban Service Area, restrict water usage to well water, rainwater collection or other similar sustainable practice. Non-residential development may use the same sources and potentially make use of recycled water, provided that its use will not result in conflicts with other General Plan policies, including geologic or habitat impacts. To maximize the efficient and environmentally beneficial use of water, outside of the Urban Service Area, limit water consumption for new development so that it does not diminish the water supply available for projected development within San Jose’s urbanized areas.
Section 3.0 Environmental Setting, Impacts, and Mitigation
Envision San José 2040 General Plan 750 Draft Program EIR City of San José June 2011
Water Conservation
Policy MS-18.2 Require new development outside of the City’s Urban Service Area to incorporate measures to minimize water consumption.
Policy MS-18.4 Retrofit existing development to improve water conservation.
Policy MS-18.5 Reduce citywide per capita water consumption by 25% by 2040 from a baseline established using the 2010 Urban Water Management Plans of water retailers in San José.
Policy MS-18.6 Achieve by 2040, 50 million gallons per day of water conservation savings in San José, by reducing water use and increasing water use efficiency.
Policy MS-18.7 Use the 2008 Water Conservation Plan as the data source to determine San José’s baseline water conservation savings level.
Water Recycling
Policy MS-19.1 Require new development to contribute to the cost-effective expansion of the recycled water system in proportion to the extent that it receives benefit from the development of a sustainable local water supply.
Policy MS-19.4 Require the use of recycled water wherever feasible and cost-effective to serve existing and new development.
Infrastructure Management
Policy IN-2.1 Utilize the City’s Infrastructure Management System Program to identify the most efficient use of available resources to maintain its infrastructure and minimize the need to replace it.
Policy IN-5.3 Use solid waste reduction techniques, including source reduction, reuse, recycling, source separation, composting, energy recovery and transformation of solid wastes to extend the life span of existing landfills and to reduce the need for future landfill facilities and to achieve the City’s Zero Waste goals.
Sustainable Parks and Recreation
Policy PR-6.5 Design and maintain park and recreation facilities to minimize water, energy and chemical (e.g., pesticides and fertilizer) use. Incorporate native and/or drought-resistant vegetation and ground cover where appropriate.
Action PR-6.9 Obtain applicable LEED Certification (or its equivalent) for new and existing parks and recreation facilities, as dictated by applicable City policies.
Other Policies and Actions
The General Plan also includes policies that encourage, but do not directly require, energy efficiency measures that could reduce energy use in the built environment. These policies include: • Green Building Policy Leadership Policies: MS-1.3, and MS-1.7 • Energy Conservation and Renewable Energy Use Policies: MS-2.1 and MS-2.7 • Water Conservation and Quality Policies: MS-3.2, MS-3.3, and MS-3.4 • Waste Reduction Policy: MS-6.12

Section 3.0 Environmental Setting, Impacts, and Mitigation
Envision San José 2040 General Plan 751 Draft Program EIR City of San José June 2011
• Environmental Stewardship Policies: MS-8.2, MS-8.3, and MS-8.7 • Responsible Management of Water Supply Policy: MS-17.1 • Water Conservation Policies and Actions: MS-18.1, MS-18.2, MS-18.3, MS-18.12, MS-8.13,
and MS-18.16 • Water Recycling Policy: MS-19.3
Existing Regulations and Adopted Plans and Policies Existing federal, state and local laws, regulations, and programs that would reduce energy use and increase the energy efficiency of development allowed under the Envision San José 2040 General Plan include: • National Energy Policy • Federal EnergyStarTM Program • California Building Energy Efficiency Standards (Title 24 California Code of Regulations) • AB 32 Climate Change Scoping Plan and associated programs of the California Energy
Commission and California Public Utilities Commission • City of San José Building Codes (including CALGreen) and Green Building regulations • City of San José Water Efficient Landscape Standards for New and Rehabilitated
Landscaping Discussion of Energy Impacts Associated with the Built Environment On-site generation of renewable energy at existing and future development sites is strongly encouraged within the City through implementation of the City’s Green Vision Goals, General Plan policies, and Greenhouse Gas Reduction Strategy. With implementation of these goals, policies, and strategies, the amount of energy produced within the City is anticipated to increase in the future. Local energy sources for residential, commercial, industrial, and institutional uses may include solar electric, solar water, solid oxide fuel cells, micro-wind turbines or other innovative technologies. Increased energy efficiency that lowers overall demand, including peak energy demands in the built environment is also anticipated as a result of new technologies and energy efficiency requirements and incentives at the national, state, and local level. Impact ENER-1: New development and redevelopment allowed under the proposed General
Plan would result in an increase in energy use in the built environment of San José. Implementation of proposed General Plan policies and existing regulations and adopted plans and policies would reduce possible energy consumption and new development would not consume energy in a manner that is wasteful, inefficient, or unnecessary. (Less Than Significant Impact)
Secondary Energy Impacts
Development allowed under the proposed General Plan may require construction of utility system improvements to provide adequate natural gas and electricity. Both gas and electric utility facilities are operated as an integrated system and while there is an extensive network of existing gas and electric transmission and distribution facilities in San José, in some cases there may not be sufficient
Section 3.0 Environmental Setting, Impacts, and Mitigation
Envision San José 2040 General Plan 752 Draft Program EIR City of San José June 2011
capacity for new, additional utility uses (i.e., utility loads). 183 Needed improvements could range from on-site to off-site installations of pipelines, power lines and/or electric substations. New distribution lines (such as gas pipelines or electric power lines) serving new or expanded development within the City’s UGB may need to be installed within existing street rights-of-way and should generally be underground. In addition to adding new distribution lines, the range of electric system improvements needed to accommodate new development may include upgrading existing electric substation and transmission line equipment, expanding existing substations to their ultimate build-out capacity, and building new substations and interconnecting transmission lines. Comparable upgrades or additions needed to accommodate additional load on the natural gas systems could include facilities such as regulator stations, odorizer stations, and valve lots. It is anticipated that where required, electric substations would be upgraded or new substations built near proposed uses that would generate increased demand. Environmental effects of these improvements could include noise from transformer “hum” if near sensitive receptors and physical effects to trees or habitats where a substation or associated transmission or distribution lines were installed. Siting of natural gas transmission lines [i.e., pressurized lines of 60 pounds per inch (psi) of pressure or more] would need to be in conformance with federal and state regulations while new development approved by the City would need to be set back from these lines in conformance with City Council policy (refer to Section 3.8 Hazardous Materials and Hazards). To the extent future electrical and natural gas infrastructure can be installed on previously developed sites away from residential uses, substantial environmental impacts would be reduced. Options for separating infrastructure from the development it serves, including residential development, are less feasible than in the past, however, and will be more problematic in the future. Where infrastructure facilities are proposed on previously undeveloped land, their impacts would be similar to the identified impacts of increased urbanization within the City that is proposed by the General Plan. To the extent proposed facilities conform to the policies of the General Plan, such impacts would be minimized or avoided. The City has provided information to Pacific Gas and Electric on the proposed General Plan and will continue to coordinate with their Service Planning and Distribution Planning Departments on utility needs, including methods for minimizing land use impacts to residential and other sensitive receptors. 3.13.4.2 Energy Use Associated with Transportation Implementation of the Envision San José 2040 General Plan is forecast to result in roughly 35 million total daily vehicle miles traveled per year by 2035 if travel is carried out in a “business-as-usual” mode.184 Assuming an average fuel economy of 35 mpg in 2035, approximately 9.9 million gallons of gasoline would be consumed daily for San José-associated automobile travel. As discussed in Section 3.2 Transportation, VMT per service population in this “business-as-usual” mode is forecast to increase by approximately 10 percent (from 14.6 to 16.1 VMT/SP) under the Envision San José 2040 General Plan compared to existing City travel patterns. A shift in travel mode share is predicted as alternative transportation options (public transit, biking, and walking) become more viable and convenient through implementation of the General Plan’s mix of new land uses and expansion of various infrastructure elements. Estimated energy savings associated with a 10 percent VMT reduction from additional predicted travel mode shifts (associated 183 Alfred Poon. Land Rights Protection, Southern Area, Pacific Gas and Electric, written communication to Andrew Crabtree, City of San José, November 23, 2010. 184 This estimate of daily VMT represents the VMT Generated by Land Uses in the City of San José and includes Internal Trips and 50% of VMT with one Trip End Outside the City.
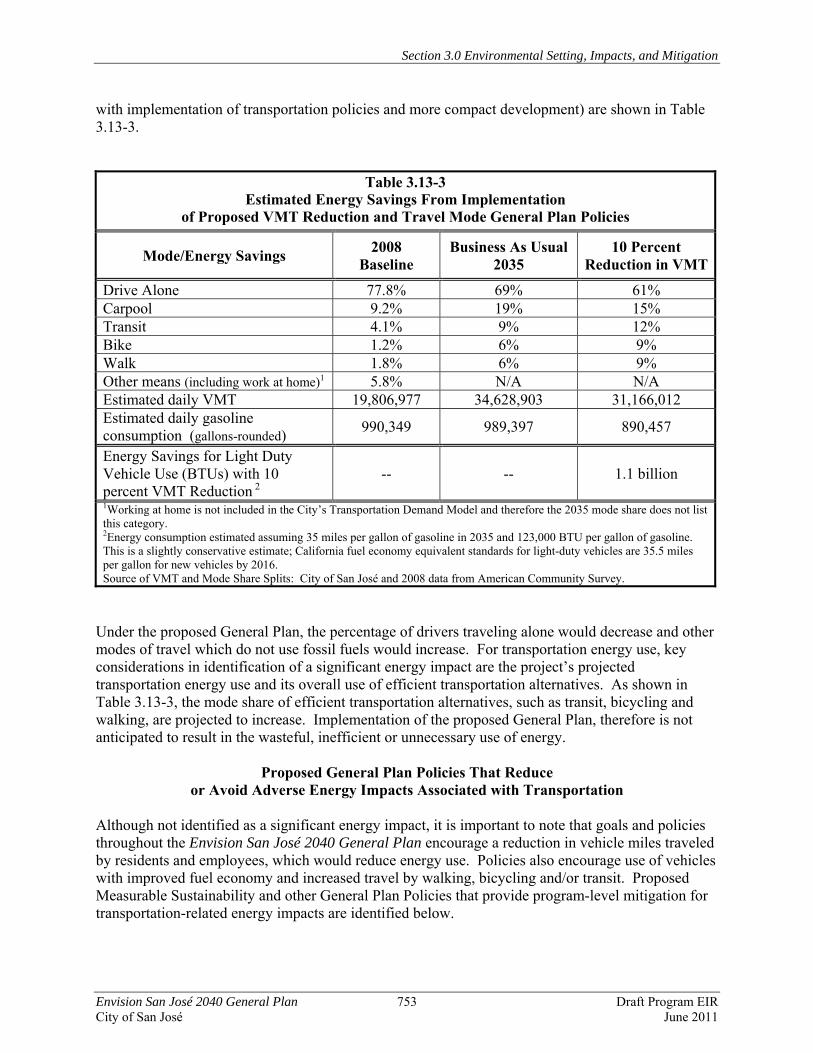
Section 3.0 Environmental Setting, Impacts, and Mitigation
Envision San José 2040 General Plan 753 Draft Program EIR City of San José June 2011
with implementation of transportation policies and more compact development) are shown in Table 3.13-3.
Table 3.13-3 Estimated Energy Savings From Implementation
of Proposed VMT Reduction and Travel Mode General Plan Policies
Mode/Energy Savings 2008 Baseline
Business As Usual 2035
10 Percent Reduction in VMT
Drive Alone 77.8% 69% 61% Carpool 9.2% 19% 15% Transit 4.1% 9% 12% Bike 1.2% 6% 9% Walk 1.8% 6% 9% Other means (including work at home)1 5.8% N/A N/A Estimated daily VMT 19,806,977 34,628,903 31,166,012 Estimated daily gasoline consumption (gallons-rounded) 990,349 989,397 890,457
Energy Savings for Light Duty Vehicle Use (BTUs) with 10 percent VMT Reduction 2
-- -- 1.1 billion
1Working at home is not included in the City’s Transportation Demand Model and therefore the 2035 mode share does not list this category. 2Energy consumption estimated assuming 35 miles per gallon of gasoline in 2035 and 123,000 BTU per gallon of gasoline. This is a slightly conservative estimate; California fuel economy equivalent standards for light-duty vehicles are 35.5 miles per gallon for new vehicles by 2016. Source of VMT and Mode Share Splits: City of San José and 2008 data from American Community Survey.
Under the proposed General Plan, the percentage of drivers traveling alone would decrease and other modes of travel which do not use fossil fuels would increase. For transportation energy use, key considerations in identification of a significant energy impact are the project’s projected transportation energy use and its overall use of efficient transportation alternatives. As shown in Table 3.13-3, the mode share of efficient transportation alternatives, such as transit, bicycling and walking, are projected to increase. Implementation of the proposed General Plan, therefore is not anticipated to result in the wasteful, inefficient or unnecessary use of energy.
Proposed General Plan Policies That Reduce or Avoid Adverse Energy Impacts Associated with Transportation
Although not identified as a significant energy impact, it is important to note that goals and policies throughout the Envision San José 2040 General Plan encourage a reduction in vehicle miles traveled by residents and employees, which would reduce energy use. Policies also encourage use of vehicles with improved fuel economy and increased travel by walking, bicycling and/or transit. Proposed Measurable Sustainability and other General Plan Policies that provide program-level mitigation for transportation-related energy impacts are identified below.

Section 3.0 Environmental Setting, Impacts, and Mitigation
Envision San José 2040 General Plan 754 Draft Program EIR City of San José June 2011
Land Use and Employment
Policy IE-1.3 As part of the intensification of commercial, Village, Industrial Park and Employment Center job growth areas, create complete, mixed-employment areas that include business support uses, public and private amenities, child care, restaurants and retail goods and services that serve employees of these businesses and nearby businesses.
Air Pollutant Emission Reduction
Policy MS-10.5 In order to reduce vehicle miles traveled and traffic congestion, new development within 2,000 feet of an existing or planned transit station will be required to encourage the use of public transit and minimize the dependence on the automobile through the application of site design guidelines and transit incentives.
Action MS-10.12 Increase the City’s alternative fuel vehicle fleet with the co-benefit of reducing local air emissions. Implement the City’s Environmentally Preferable Procurement Policy (Council Policy 4-6) and Pollution Prevention Policy (Council Policy 4-5) in a manner that reduces air emissions from municipal operations. Support policies that reduce vehicle use by City employees.
Reduce Consumption and Increase Efficiency
Policy MS-14.1 Promote job and housing growth in areas served by public transit and that have community amenities within a 20-minute walking distance.
Policy MS-14.2 Enhance existing neighborhoods by adding a mix of uses that facilitate biking, walking, or transit ridership through improved access to shopping, employment, community services, and gathering places.
Action MS-14.6 Replace 100% of the City’s traffic signals and streetlights with smart, zero emission lighting by 2022.
Contribute to a Healthful Community
Policy PR-2.6 All new residential developments over 200 units in size should be located within 1/3 mile walking distance of an existing or new park, trail, open space or recreational school grounds open to the public after normal school hours or shall include one or more of these elements in the project design.
Maintenance of an Equitable Park System
Policy PR-3.2 Provide access to an existing or future neighborhood park, a community park, recreational school grounds, a regional park, open space lands, and/or a major City trail within a 1/3 mile radius of all San José residents by either acquiring lands within 1/3 mile or providing safe connections to existing recreation facilities outside of the 1/3 mile radius. This is consistent with the United Nation’s Urban Environmental Accords, as adopted by the City for recreation open space.
Sustainable Parks and Recreation
Policy PR-6.4 Consistent with the Green Vision, complete San José’s trail network and where feasible develop interconnected trails with bike lanes to facilitate bicycle commuting and recreational uses.
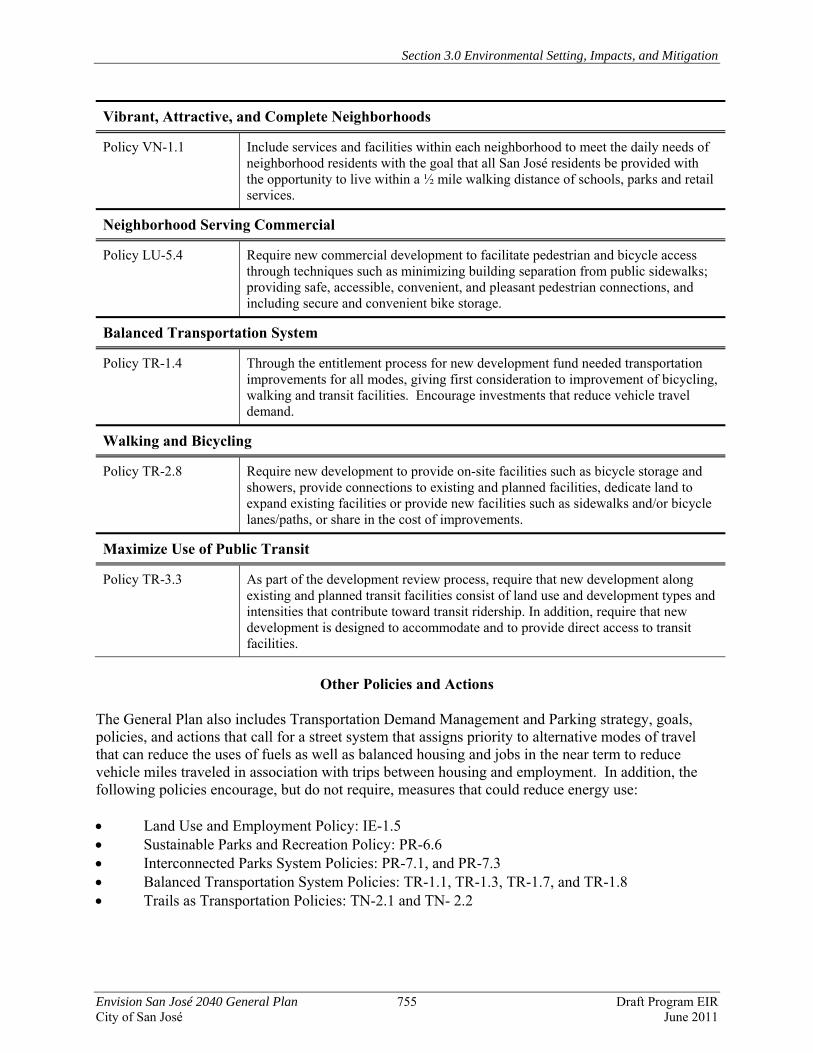
Section 3.0 Environmental Setting, Impacts, and Mitigation
Envision San José 2040 General Plan 755 Draft Program EIR City of San José June 2011
Vibrant, Attractive, and Complete Neighborhoods
Policy VN-1.1 Include services and facilities within each neighborhood to meet the daily needs of neighborhood residents with the goal that all San José residents be provided with the opportunity to live within a ½ mile walking distance of schools, parks and retail services.
Neighborhood Serving Commercial
Policy LU-5.4 Require new commercial development to facilitate pedestrian and bicycle access through techniques such as minimizing building separation from public sidewalks; providing safe, accessible, convenient, and pleasant pedestrian connections, and including secure and convenient bike storage.
Balanced Transportation System
Policy TR-1.4 Through the entitlement process for new development fund needed transportation improvements for all modes, giving first consideration to improvement of bicycling, walking and transit facilities. Encourage investments that reduce vehicle travel demand.
Walking and Bicycling
Policy TR-2.8 Require new development to provide on-site facilities such as bicycle storage and showers, provide connections to existing and planned facilities, dedicate land to expand existing facilities or provide new facilities such as sidewalks and/or bicycle lanes/paths, or share in the cost of improvements.
Maximize Use of Public Transit
Policy TR-3.3 As part of the development review process, require that new development along existing and planned transit facilities consist of land use and development types and intensities that contribute toward transit ridership. In addition, require that new development is designed to accommodate and to provide direct access to transit facilities.
Other Policies and Actions
The General Plan also includes Transportation Demand Management and Parking strategy, goals, policies, and actions that call for a street system that assigns priority to alternative modes of travel that can reduce the uses of fuels as well as balanced housing and jobs in the near term to reduce vehicle miles traveled in association with trips between housing and employment. In addition, the following policies encourage, but do not require, measures that could reduce energy use: • Land Use and Employment Policy: IE-1.5 • Sustainable Parks and Recreation Policy: PR-6.6 • Interconnected Parks System Policies: PR-7.1, and PR-7.3 • Balanced Transportation System Policies: TR-1.1, TR-1.3, TR-1.7, and TR-1.8 • Trails as Transportation Policies: TN-2.1 and TN- 2.2
Section 3.0 Environmental Setting, Impacts, and Mitigation
Envision San José 2040 General Plan 756 Draft Program EIR City of San José June 2011
Existing Regulations and Adopted Plans and Policies Existing state laws and regulations that could reduce energy use associated with transportation or vehicle miles traveled per service population for future development allowed under the Envision San José 2040 General Plan include: • AB 32 Climate Change Scoping Plan and associated programs of the California ARB • California Senate Bill 375 – Redesigning Communities to Reduce Greenhouse Gases
Discussion of Energy Use Impacts Associated with Transportation Adding more jobs than employed residents in the City could increase the lengths of regional commute trips. The construction of housing near future jobs as a part of the Urban Village concept would counter this increase somewhat; however, as discussed in Section 3.4 Air Quality, vehicle miles traveled per capita is projected to increase over existing conditions even assuming a 20 percent reduction in VMT citywide. Impacts from increased VMT per capita and VMT per Service Population are described in Section 3.4 Air Quality and Section 3.2 Transportation. Compared to existing conditions, implementation of the proposed General Plan is projected to increase the overall use of efficient transportation alternatives and would not result in a substantial increase in the use of transportation fuels by light duty vehicles. Impact ENER-2: New development and redevelopment allowed under the proposed General
Plan would result in an increase in energy use associated with transportation. Implementation of proposed General Plan policies and existing regulations and programs would increase the overall use of efficient transportation alternatives and would not result in a substantial increase in the use of transportation fuels by light duty vehicles. (Less Than Significant Impact)
3.13.4.3 Energy Use Associated with Redevelopment and New Construction By 2035, the Plan provides capacity for an additional 120,000 dwelling units (primarily in multiple-family buildings) and 170 million square feet of commercial, industrial and institutional development to be constructed within the City of San José.185 With the exception of vacant sites, some demolition of existing structures and pavement will be required to accommodate this development. Energy use associated with redevelopment and new construction will include fuels and electrical power for construction equipment, fuels for construction worker travel to and from construction sites, and energy used for the transport and fabrication of construction materials. Energy will also be used to demolish, transport and dispose of demolition materials.
Proposed General Plan Policies That Reduce or Avoid Adverse Energy Impacts From Demolition and Construction
Goals and policies throughout the Envision San José 2040 General Plan encourage reduced energy use during demolition and construction. The Envision San José 2040 General Plan includes updated solid waste policies that seek to reduce energy loss resulting from the disposal of construction and
185 Baty, John, Project Manager – General Plan Update, City of San José, Personal Communication, August 18, 2010 and project description for the proposed General Plan.
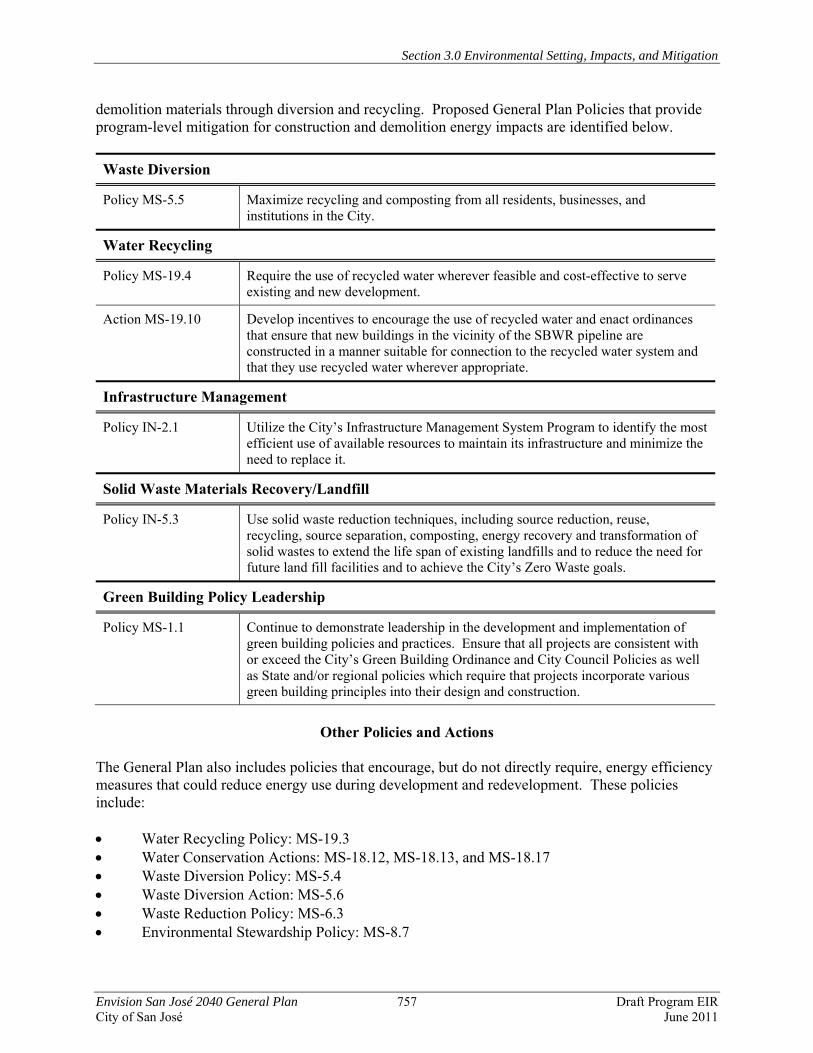
Section 3.0 Environmental Setting, Impacts, and Mitigation
Envision San José 2040 General Plan 757 Draft Program EIR City of San José June 2011
demolition materials through diversion and recycling. Proposed General Plan Policies that provide program-level mitigation for construction and demolition energy impacts are identified below. Waste Diversion
Policy MS-5.5 Maximize recycling and composting from all residents, businesses, and institutions in the City.
Water Recycling
Policy MS-19.4 Require the use of recycled water wherever feasible and cost-effective to serve existing and new development.
Action MS-19.10 Develop incentives to encourage the use of recycled water and enact ordinances that ensure that new buildings in the vicinity of the SBWR pipeline are constructed in a manner suitable for connection to the recycled water system and that they use recycled water wherever appropriate.
Infrastructure Management
Policy IN-2.1 Utilize the City’s Infrastructure Management System Program to identify the most efficient use of available resources to maintain its infrastructure and minimize the need to replace it.
Solid Waste Materials Recovery/Landfill
Policy IN-5.3 Use solid waste reduction techniques, including source reduction, reuse, recycling, source separation, composting, energy recovery and transformation of solid wastes to extend the life span of existing landfills and to reduce the need for future land fill facilities and to achieve the City’s Zero Waste goals.
Green Building Policy Leadership
Policy MS-1.1 Continue to demonstrate leadership in the development and implementation of green building policies and practices. Ensure that all projects are consistent with or exceed the City’s Green Building Ordinance and City Council Policies as well as State and/or regional policies which require that projects incorporate various green building principles into their design and construction.
Other Policies and Actions
The General Plan also includes policies that encourage, but do not directly require, energy efficiency measures that could reduce energy use during development and redevelopment. These policies include: • Water Recycling Policy: MS-19.3 • Water Conservation Actions: MS-18.12, MS-18.13, and MS-18.17 • Waste Diversion Policy: MS-5.4 • Waste Diversion Action: MS-5.6 • Waste Reduction Policy: MS-6.3 • Environmental Stewardship Policy: MS-8.7
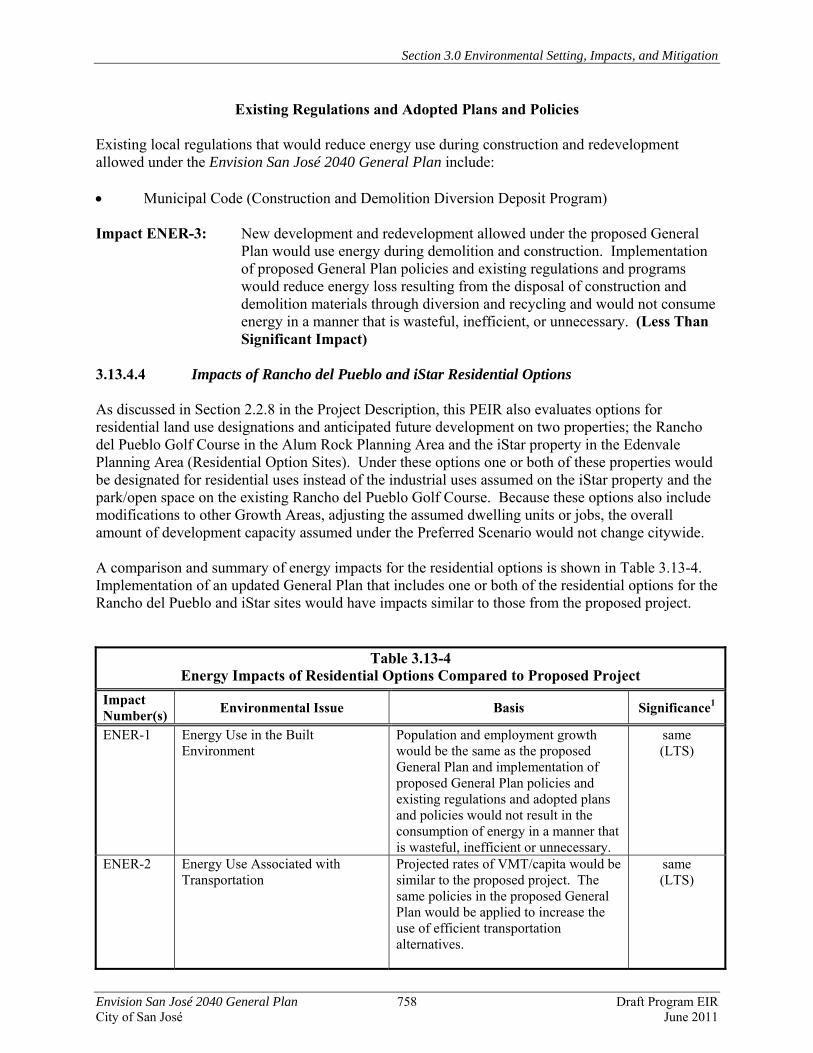
Section 3.0 Environmental Setting, Impacts, and Mitigation
Envision San José 2040 General Plan 758 Draft Program EIR City of San José June 2011
Existing Regulations and Adopted Plans and Policies Existing local regulations that would reduce energy use during construction and redevelopment allowed under the Envision San José 2040 General Plan include: • Municipal Code (Construction and Demolition Diversion Deposit Program) Impact ENER-3: New development and redevelopment allowed under the proposed General
Plan would use energy during demolition and construction. Implementation of proposed General Plan policies and existing regulations and programs would reduce energy loss resulting from the disposal of construction and demolition materials through diversion and recycling and would not consume energy in a manner that is wasteful, inefficient, or unnecessary. (Less Than Significant Impact)
3.13.4.4 Impacts of Rancho del Pueblo and iStar Residential Options As discussed in Section 2.2.8 in the Project Description, this PEIR also evaluates options for residential land use designations and anticipated future development on two properties; the Rancho del Pueblo Golf Course in the Alum Rock Planning Area and the iStar property in the Edenvale Planning Area (Residential Option Sites). Under these options one or both of these properties would be designated for residential uses instead of the industrial uses assumed on the iStar property and the park/open space on the existing Rancho del Pueblo Golf Course. Because these options also include modifications to other Growth Areas, adjusting the assumed dwelling units or jobs, the overall amount of development capacity assumed under the Preferred Scenario would not change citywide. A comparison and summary of energy impacts for the residential options is shown in Table 3.13-4. Implementation of an updated General Plan that includes one or both of the residential options for the Rancho del Pueblo and iStar sites would have impacts similar to those from the proposed project.
Table 3.13-4 Energy Impacts of Residential Options Compared to Proposed Project
Impact Number(s) Environmental Issue Basis Significance1
ENER-1 Energy Use in the Built Environment
Population and employment growth would be the same as the proposed General Plan and implementation of proposed General Plan policies and existing regulations and adopted plans and policies would not result in the consumption of energy in a manner that is wasteful, inefficient or unnecessary.
same (LTS)
ENER-2 Energy Use Associated with Transportation
Projected rates of VMT/capita would be similar to the proposed project. The same policies in the proposed General Plan would be applied to increase the use of efficient transportation alternatives.
same (LTS)

Section 3.0 Environmental Setting, Impacts, and Mitigation
Envision San José 2040 General Plan 759 Draft Program EIR City of San José June 2011
Table 3.13-4 Energy Impacts of Residential Options Compared to Proposed Project
Impact Number(s) Environmental Issue Basis Significance1
ENER-3 Energy Use Associated with Redevelopment and New Construction
Like the proposed project, the iStar site would be developed with urban uses. The Rancho del Pueblo site would only be redeveloped under the residential option(s). Like the proposed project, implementation of proposed General Plan policies and existing regulations and adopted plans and policies would reduce energy loss resulting from the disposal of construction and demolition materials through diversion and recycling and would not consume energy in a manner that is wasteful, inefficient or unnecessary.
same (LTS)
1 S= Significant; LTS = Less Than Significant The determination of significance assumes implementation of proposed General Plan policies and actions and existing regulations and adopted plans and policies previously identified throughout Section 3.13.4 Energy Impacts. Bold = New Significant Impact
Section 3.0 Environmental Setting, Impacts, and Mitigation
Envision San José 2040 General Plan 760 Draft Program EIR City of San José June 2011
3.13.5 Mitigation and Avoidance Measures 3.13.5.1 Proposed General Plan No mitigation measures are required. 3.13.5.2 Rancho del Pueblo and iStar Residential Options No mitigation measures are required. 3.13.6 Significance Conclusions 3.13.6.1 Proposed General Plan While the substantial new residential, commercial, and industrial development allowed under the proposed Envision San José 2040 General Plan would result in increased overall consumption of energy compared to existing levels, the new development would not consume energy in a manner that is wasteful, inefficient, or unnecessary. Policies in the General Plan will serve to reduce growth in energy consumption. New construction will be required to meet Title 24 building energy efficiency standards, including the new CALGreen requirements, and ultimately new residential and commercial development in the City after 2020 and 2030, respectively, will be designed for zero net energy use. In addition, the City’s Greenhouse Gas Reduction Strategy (discussed in Section 3.15 Greenhouse Gas Emissions) focuses on efforts to increase energy conservation and efficiency as a means of reducing greenhouse gas emissions from existing and future development and overall use of efficient transportation alternatives is projected to increase. Based on the above discussion, implementation of the Envision San José 2040 General Plan would not result in significant energy impacts associated with the built environment or transportation. (Less Than Significant Impacts) 3.13.6.1 Rancho del Pueblo and iStar Residential Options Like the proposed project discussed above, implementation of the Envision San José 2040 General Plan with the Rancho del Pueblo and iStar Residential Options would not result in significant energy impacts associated with the built environment or transportation. (Less Than Significant Impacts)
Section 3.0 Environmental Setting, Impacts, and Mitigation
Envision San José 2040 General Plan 761 Draft Program EIR City of San José June 2011
3.14 POPULATION AND HOUSING The following section is based upon information in the Projections of Jobs, Population and Households for the City of San José analysis prepared by the Center for Continuing Study of the California Economy (CCSCE) in 2008, and information available from the U.S. Census Bureau, the American Community Survey (ACS), the California Department of Finance (DOF), the California Employment Development Department, and the Association of Bay Area Governments (ABAG). 3.14.1 Introduction This section describes existing levels of and trends in population, employment, and housing in the City of San José and Santa Clara County, including the balance between jobs and housing. It identifies growth assumptions and analyzes projected population, employment, and housing growth in relation to near-term regional and long-term housing goals and planned build-out of the City under the proposed Envision San José 2040 General Plan. Changes in population, housing, and employment in and of themselves are generally characterized as social and economic effects, not physical effects on the environment. CEQA provides that economic or social effects are not considered significant effects on the environment unless the social and/or economic effects are connected to physical environmental effects. A social or economic change related to a physical change may be considered in determining whether the physical change is significant (CEQA Guidelines Section 15382). The direction for treatment of economic and social effects is stated in Section 15131(a) of the CEQA Guidelines:
Economic or social effects of a project shall not be treated as significant effects on the environment. An EIR may trace a chain of cause and effect from a proposed decision on a project through anticipated economic or social changes resulting from the project to physical changes caused in turn by the economic or social changes. The intermediate economic or social changes need not be analyzed in any detail greater than necessary to trace the chain of cause and effect. The focus of the analysis shall be on physical changes.
While increased population and changes to demographics resulting from new development do not necessarily cause direct adverse physical environmental effects, indirect physical environmental effects such as increased vehicle trips and associated increases in air pollutant emissions could occur. Likewise, increasing the number of jobs in a region is not necessarily a significant impact. Like housing, employment-generating land uses may increase demand for services, such as water and waste disposal. It has become very apparent in the Bay Area that it is the physical relationship between the location of housing and jobs, as well as the built character of residential and non-residential development themselves, that significantly contribute to several of the primary impacts of concern in this region, particularly air pollution and the excessive consumption of energy and land resulting from an inefficient sprawling land-use pattern. Physical environmental effects, associated with the increase in population and employment, are discussed in the applicable sections of this PEIR.
Section 3.0 Environmental Setting, Impacts, and Mitigation
Envision San José 2040 General Plan 762 Draft Program EIR City of San José June 2011
3.14.2 Existing Setting 3.14.2.1 Population Santa Clara County is the sixth most populous County in the State of California, with a current population of approximately 1.8 million persons. In January 2008, the City had a population of approximately 985,307 residents, representing 54 percent of the total population in Santa Clara County.186 The population of San José increased by 2.2 percent in 2008 and 1.6 percent in 2009.187 ABAG’s Projections 2007 show that the population in both the County and the City of San José has continued to grow, though at a slower rate than in the 1990’s due to the “dot-com” bust/recession that occurred in the early 2000’s. Santa Clara County had an average household size of 2.9 persons in 2000, while the average household in the City of San José was larger with 3.2 people. There was a gradual increase in household size in the City from 1990 to 2000 (from 3.1 to 3.2 persons per household). As with household size, the median age of the population increased from 29.5 in 1990 to 32.6 in 2000, reflecting the aging trend that is taking place throughout the Bay Area and the country overall.188
Population Growth Rates
The total population in San José has increased dramatically during the last fifty years, especially during the 1950s, 1960s, and 1970s. This was due to an aggressive annexation program that grew San José’s physical land area from 14 square miles in 1950 to 170 square miles by 1970 coupled with the region’s growing economy. Although the rate of growth has slowed since the 1970s, the City is still experiencing substantial growth. The City added an average of 12,795 residents per year since 2000, an increase of 14.3 percent since 2000, for a total population of 1,023,083 at the beginning of 2010.189 Population growth in San José since 1950 is shown in Figure 3.14-1. Rapid population growth is expected to continue for Santa Clara County and for the City into the future. Santa Clara County’s population is projected by ABAG to increase to 2.4 million by 2035, representing growth of 33 percent over the existing population.190 This will be significantly faster than the Bay region’s projected growth of 27 percent over the same period.
186 State of California, Department of Finance, E-1 population Estimates for Cities, Counties and the State with Annual Percent Change — January 1, 2008 and 2009. Sacramento, California. May 2009. 187 State of California, Department of Finance. E-1 Population Estimates for Cities, Counties and the State with Annual Percent Change — January 1, 2009 and 2010. Sacramento, California. May 2010. 188 US Census 2000 and US Census 1990 information. Available at: <http://www.bayareacensus.ca.gov/cities/SanJose.htm>. 189 State of California, Department of Finance. E-4 Population Estimates for Cities, Counties and the State, 2001-2010, with 2000 Benchmark. Sacramento, California, May 2010. 190 Association of Bay Area Governments (ABAG). Projections and Priorities 2009.
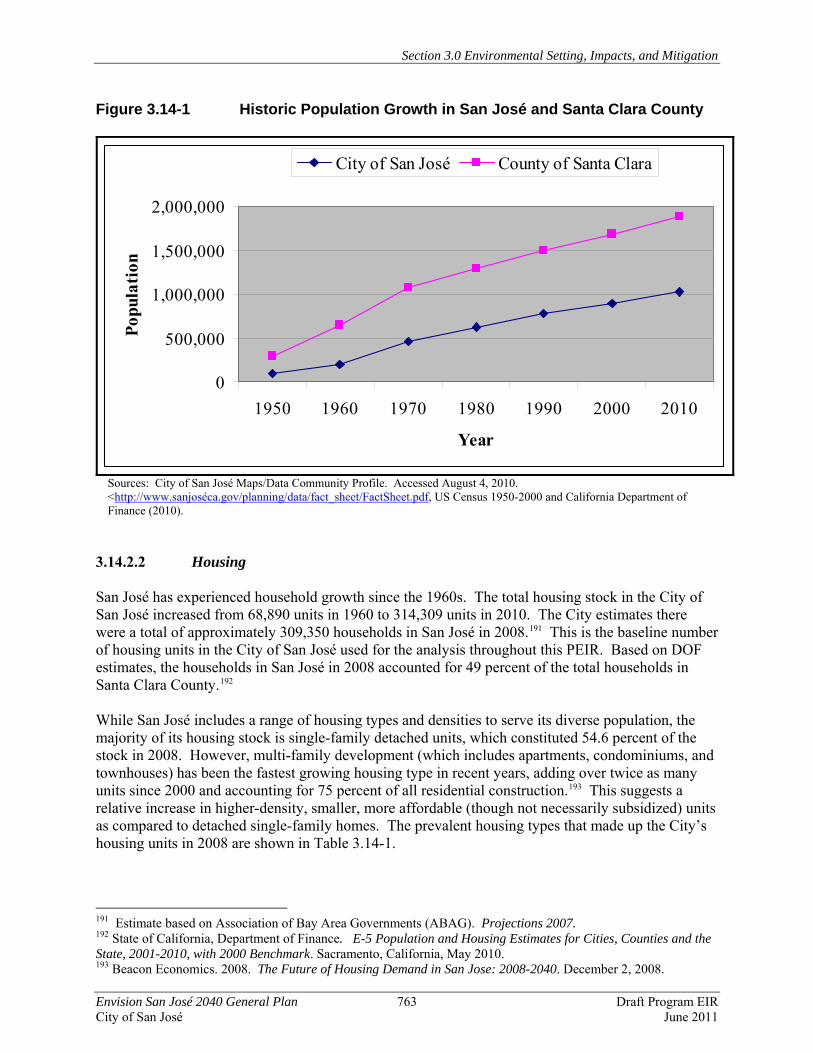
Section 3.0 Environmental Setting, Impacts, and Mitigation
Envision San José 2040 General Plan 763 Draft Program EIR City of San José June 2011
Figure 3.14-1 Historic Population Growth in San José and Santa Clara County
0
500,000
1,000,000
1,500,000
2,000,000
1950 1960 1970 1980 1990 2000 2010
Year
Popu
latio
n
City of San José County of Santa Clara
Sources: City of San José Maps/Data Community Profile. Accessed August 4, 2010. <http://www.sanjoséca.gov/planning/data/fact_sheet/FactSheet.pdf, US Census 1950-2000 and California Department of Finance (2010).
3.14.2.2 Housing San José has experienced household growth since the 1960s. The total housing stock in the City of San José increased from 68,890 units in 1960 to 314,309 units in 2010. The City estimates there were a total of approximately 309,350 households in San José in 2008.191 This is the baseline number of housing units in the City of San José used for the analysis throughout this PEIR. Based on DOF estimates, the households in San José in 2008 accounted for 49 percent of the total households in Santa Clara County.192 While San José includes a range of housing types and densities to serve its diverse population, the majority of its housing stock is single-family detached units, which constituted 54.6 percent of the stock in 2008. However, multi-family development (which includes apartments, condominiums, and townhouses) has been the fastest growing housing type in recent years, adding over twice as many units since 2000 and accounting for 75 percent of all residential construction.193 This suggests a relative increase in higher-density, smaller, more affordable (though not necessarily subsidized) units as compared to detached single-family homes. The prevalent housing types that made up the City’s housing units in 2008 are shown in Table 3.14-1.
191 Estimate based on Association of Bay Area Governments (ABAG). Projections 2007. 192 State of California, Department of Finance. E-5 Population and Housing Estimates for Cities, Counties and the State, 2001-2010, with 2000 Benchmark. Sacramento, California, May 2010. 193 Beacon Economics. 2008. The Future of Housing Demand in San Jose: 2008-2040. December 2, 2008.
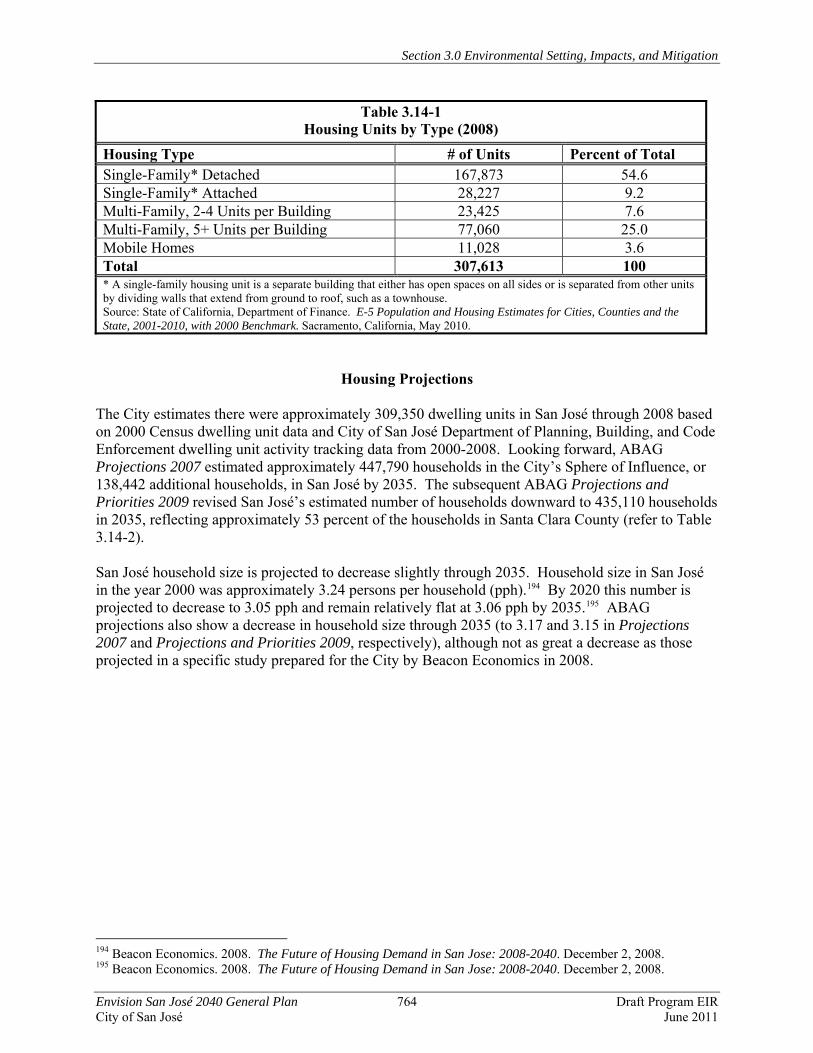
Section 3.0 Environmental Setting, Impacts, and Mitigation
Envision San José 2040 General Plan 764 Draft Program EIR City of San José June 2011
Table 3.14-1 Housing Units by Type (2008)
Housing Type # of Units Percent of Total Single-Family* Detached 167,873 54.6 Single-Family* Attached 28,227 9.2 Multi-Family, 2-4 Units per Building 23,425 7.6 Multi-Family, 5+ Units per Building 77,060 25.0 Mobile Homes 11,028 3.6 Total 307,613 100 * A single-family housing unit is a separate building that either has open spaces on all sides or is separated from other units by dividing walls that extend from ground to roof, such as a townhouse. Source: State of California, Department of Finance. E-5 Population and Housing Estimates for Cities, Counties and the State, 2001-2010, with 2000 Benchmark. Sacramento, California, May 2010.
Housing Projections The City estimates there were approximately 309,350 dwelling units in San José through 2008 based on 2000 Census dwelling unit data and City of San José Department of Planning, Building, and Code Enforcement dwelling unit activity tracking data from 2000-2008. Looking forward, ABAG Projections 2007 estimated approximately 447,790 households in the City’s Sphere of Influence, or 138,442 additional households, in San José by 2035. The subsequent ABAG Projections and Priorities 2009 revised San José’s estimated number of households downward to 435,110 households in 2035, reflecting approximately 53 percent of the households in Santa Clara County (refer to Table 3.14-2). San José household size is projected to decrease slightly through 2035. Household size in San José in the year 2000 was approximately 3.24 persons per household (pph).194 By 2020 this number is projected to decrease to 3.05 pph and remain relatively flat at 3.06 pph by 2035.195 ABAG projections also show a decrease in household size through 2035 (to 3.17 and 3.15 in Projections 2007 and Projections and Priorities 2009, respectively), although not as great a decrease as those projected in a specific study prepared for the City by Beacon Economics in 2008.
194 Beacon Economics. 2008. The Future of Housing Demand in San Jose: 2008-2040. December 2, 2008. 195 Beacon Economics. 2008. The Future of Housing Demand in San Jose: 2008-2040. December 2, 2008.
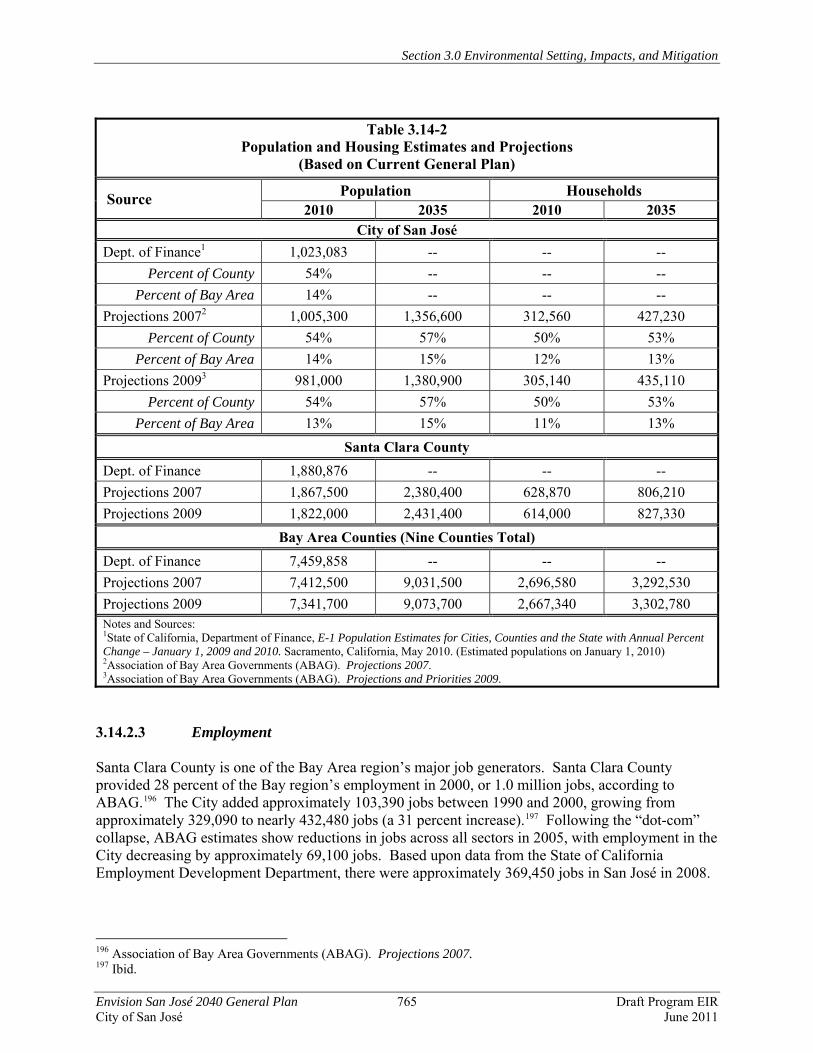
Section 3.0 Environmental Setting, Impacts, and Mitigation
Envision San José 2040 General Plan 765 Draft Program EIR City of San José June 2011
Table 3.14-2
Population and Housing Estimates and Projections (Based on Current General Plan)
Source Population Households 2010 2035 2010 2035
City of San José Dept. of Finance1 1,023,083 -- -- --
Percent of County 54% -- -- -- Percent of Bay Area 14% -- -- --
Projections 20072 1,005,300 1,356,600 312,560 427,230 Percent of County 54% 57% 50% 53%
Percent of Bay Area 14% 15% 12% 13% Projections 20093 981,000 1,380,900 305,140 435,110
Percent of County 54% 57% 50% 53% Percent of Bay Area 13% 15% 11% 13%
Santa Clara County Dept. of Finance 1,880,876 -- -- -- Projections 2007 1,867,500 2,380,400 628,870 806,210 Projections 2009 1,822,000 2,431,400 614,000 827,330
Bay Area Counties (Nine Counties Total) Dept. of Finance 7,459,858 -- -- -- Projections 2007 7,412,500 9,031,500 2,696,580 3,292,530 Projections 2009 7,341,700 9,073,700 2,667,340 3,302,780 Notes and Sources: 1State of California, Department of Finance, E-1 Population Estimates for Cities, Counties and the State with Annual Percent Change – January 1, 2009 and 2010. Sacramento, California, May 2010. (Estimated populations on January 1, 2010) 2Association of Bay Area Governments (ABAG). Projections 2007. 3Association of Bay Area Governments (ABAG). Projections and Priorities 2009.
3.14.2.3 Employment Santa Clara County is one of the Bay Area region’s major job generators. Santa Clara County provided 28 percent of the Bay region’s employment in 2000, or 1.0 million jobs, according to ABAG.196 The City added approximately 103,390 jobs between 1990 and 2000, growing from approximately 329,090 to nearly 432,480 jobs (a 31 percent increase).197 Following the “dot-com” collapse, ABAG estimates show reductions in jobs across all sectors in 2005, with employment in the City decreasing by approximately 69,100 jobs. Based upon data from the State of California Employment Development Department, there were approximately 369,450 jobs in San José in 2008.
196 Association of Bay Area Governments (ABAG). Projections 2007. 197 Ibid.
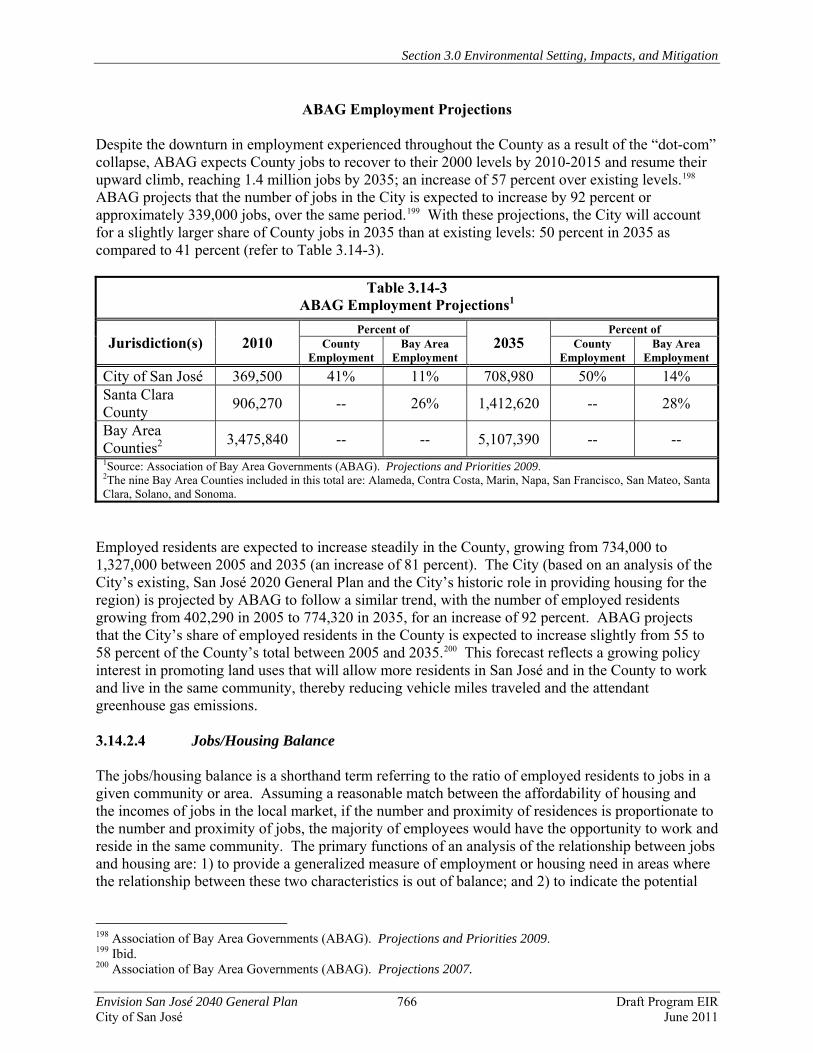
Section 3.0 Environmental Setting, Impacts, and Mitigation
Envision San José 2040 General Plan 766 Draft Program EIR City of San José June 2011
ABAG Employment Projections Despite the downturn in employment experienced throughout the County as a result of the “dot-com” collapse, ABAG expects County jobs to recover to their 2000 levels by 2010-2015 and resume their upward climb, reaching 1.4 million jobs by 2035; an increase of 57 percent over existing levels.198 ABAG projects that the number of jobs in the City is expected to increase by 92 percent or approximately 339,000 jobs, over the same period.199 With these projections, the City will account for a slightly larger share of County jobs in 2035 than at existing levels: 50 percent in 2035 as compared to 41 percent (refer to Table 3.14-3).
Table 3.14-3 ABAG Employment Projections1
Jurisdiction(s) 2010 Percent of
2035 Percent of
County Employment
Bay Area Employment
County Employment
Bay Area Employment
City of San José 369,500 41% 11% 708,980 50% 14% Santa Clara County 906,270 -- 26% 1,412,620 -- 28%
Bay Area Counties2 3,475,840 -- -- 5,107,390 -- -- 1Source: Association of Bay Area Governments (ABAG). Projections and Priorities 2009. 2The nine Bay Area Counties included in this total are: Alameda, Contra Costa, Marin, Napa, San Francisco, San Mateo, Santa Clara, Solano, and Sonoma.
Employed residents are expected to increase steadily in the County, growing from 734,000 to 1,327,000 between 2005 and 2035 (an increase of 81 percent). The City (based on an analysis of the City’s existing, San José 2020 General Plan and the City’s historic role in providing housing for the region) is projected by ABAG to follow a similar trend, with the number of employed residents growing from 402,290 in 2005 to 774,320 in 2035, for an increase of 92 percent. ABAG projects that the City’s share of employed residents in the County is expected to increase slightly from 55 to 58 percent of the County’s total between 2005 and 2035.200 This forecast reflects a growing policy interest in promoting land uses that will allow more residents in San José and in the County to work and live in the same community, thereby reducing vehicle miles traveled and the attendant greenhouse gas emissions. 3.14.2.4 Jobs/Housing Balance The jobs/housing balance is a shorthand term referring to the ratio of employed residents to jobs in a given community or area. Assuming a reasonable match between the affordability of housing and the incomes of jobs in the local market, if the number and proximity of residences is proportionate to the number and proximity of jobs, the majority of employees would have the opportunity to work and reside in the same community. The primary functions of an analysis of the relationship between jobs and housing are: 1) to provide a generalized measure of employment or housing need in areas where the relationship between these two characteristics is out of balance; and 2) to indicate the potential
198 Association of Bay Area Governments (ABAG). Projections and Priorities 2009. 199 Ibid. 200 Association of Bay Area Governments (ABAG). Projections 2007.
Section 3.0 Environmental Setting, Impacts, and Mitigation
Envision San José 2040 General Plan 767 Draft Program EIR City of San José June 2011
severity and trending direction of such conditions on traffic flows, air quality, energy consumption, and housing affordability. A well balanced ratio of jobs and housing can minimize the number of vehicle miles traveled (VMT) in commuting to jobs. Reducing VMT could result in lower levels of air pollutant emissions (including lower greenhouse gas emissions) and less congestion on area roadways and intersections by reducing the need for commuters to travel long distances between work and home. Paradoxically, a balanced ratio of jobs and housing could result in increased VMT by dispersing vehicle travel in such a way as to facilitate a greater overall utilization of existing roadways, while concentrating jobs in a single location may force more commuters to divert from congested roadways to alternative modes of transportation, such as the regional transit system. Prediction of such a phenomenon is substantiated by observation of actual conditions. Urbanized areas with high transit use and low automobile dependency consistently are employment centers with a disproportionate share of the region’s job supply located in a concentrated area highly accessible by transit. An important consideration in evaluating the jobs/housing balance is whether housing in the community is affordable to local employees. A community can also have a balance between jobs and housing, but with a housing stock that is not affordable to its workers. Even if a community has a statistical balance between jobs and housing, sizeable levels of in-commuting and out-commuting may occur, especially where employment opportunities do not match the skills and educational characteristics of the local labor force. The availability of an adequate housing supply that is suitable for those holding jobs in the community can reduce the length of commutes between residences and work sites by creating opportunities for employees to live in proximity to where they work. The key relationship in a jobs/housing balance is between the aggregate numbers of jobs and of employed residents within a community. Of the City’s 985,307 residents in 2008, an estimated 480,000 are employed, representing 48 percent of the County’s overall labor force. The City had an estimated 369,450 jobs, comprising 41 percent of total jobs in the County.201 The City estimates the current ratio of jobs to employed residents in San José is 0.8 to 1.202 San José is unique among large cities within the U.S. in having a jobs to employed residents ratio of less than 1.0, as all other large cities function as regional job centers. Like those other cities, the transit and roadway systems in Santa Clara County have been designed to support a concentration of employment in San José, as well as the more prevalent southeast to northwest commute pattern. 3.14.2.5 Regulatory Framework
State State Housing Element Law As stated in a recent court opinion203 addressing the City of Pleasanton’s obligation to plan for adequate housing within its borders, local governments have authority over land use and planning decisions within their jurisdiction, but also “have a responsibility to use the powers vested in them to
201 Association of Bay Area Governments (ABAG). Projections and Priorities 2009. 202 Based upon data obtained from State of California Employment Development Department and Department of Finance. 203 Urban Habitat Program v. City of Pleasanton, No RG06-293831 (Cal. Super. Mar. 12, 2010). Available at http://www.publicadvocates.org/ourwork/housing/index.html#urban. Accessed April 2010.
Section 3.0 Environmental Setting, Impacts, and Mitigation
Envision San José 2040 General Plan 768 Draft Program EIR City of San José June 2011
facilitate” new housing construction that “make(s) adequate provision for the housing needs of all economic segments of the community” [Govt. Code Section 65580, subd.(d)]. The scope of that responsibility is spelled out in detail in the State’s Housing Element Law (Govt. Code Sections 65580-65589.8). The intent of the Housing Element Law is to ensure that cities and counties recognize their responsibilities to help attain state and regional housing goals, and to prepare and implement housing elements that, in combination with federal and state programs, will facilitate the provision of decent, safe housing and a suitable living environment affordable for every Californian (Govt. Code Sections 65580 and 65581). In order to attain the state housing goal, cities must make sufficient suitable land available for residential development, as documented in an inventory, to accommodate their share of regional housing needs. Projected regional housing needs are allocated to each city and county within the Bay Area by ABAG through a process that begins with a statewide determination of the housing needs for all of California. A city is required under the Housing Element Law to: 1) zone adequate lands to accommodate its Regional Housing Needs Allocation (RHNA); 2) produce an inventory of sites that can accommodate its share of the regional housing need; 3) identify governmental and non-governmental constraints to residential development; 4) develop strategies and work plan to mitigate or eliminate those constraints; and 5) adopt a housing element that is to be updated on a regular recurring basis.
Local
General Plan Housing Element The City of San José recently updated and adopted its Housing Element to comply with State law, and was the first city in Santa Clara County to have its Housing Element certified by the State Department of Housing and Community Development. San José’s Housing Element, which focuses on the regional housing needs for the period between January 1, 2007 and June 30, 2014, includes all of the mandatory sections as identified above, including an inventory of land parcels that could accommodate its RHNA as set by ABAG. It also addresses how the City can facilitate development of new homes consistent with affordability requirements while planning for neighborhoods with parks, schools, and access to transportation, jobs, shopping, and other services. City of San José Housing Policies and Programs Housing policy goals for the City as outlined in The Mayor’s Task Force on Housing’s Final Report are as follows: • Increase the supply of affordable housing, preserve the housing stock, and reduce the cost of
developing affordable housing. • Utilize available resources to address priority needs for housing. • Increase the funds available for the preservation and development of affordable housing. • Disperse low-income housing throughout the City, to avoid concentration of low-income
households and to encourage racial and economic integration. • Encourage greater involvement of the public and private sector to increase and preserve the
stock of affordable housing in San José. To address these goals, the City of San José has developed a wide range of programs designed to encourage the revitalization of neighborhoods, provide affordable housing, encourage higher density

Section 3.0 Environmental Setting, Impacts, and Mitigation
Envision San José 2040 General Plan 769 Draft Program EIR City of San José June 2011
housing near transit corridors, and provide assistance to homeless shelter service providers.204 Affordable housing programs are administered through the City’s Department of Housing, and are aligned with City policies as well as state and federal requirements. In addition to the Housing Element, the Housing Department also develops and updates the 5-Year Investment Plan for housing as well as the federal Consolidated Plan. An approved Consolidated Plan is required for local jurisdictions to receive federal funding from the Department of Housing and Urban Development (HUD). Policies in the plans and City programs address the production of housing affordable to income level, the acquisition and rehabilitation of existing market-rate housing to provide new affordable housing opportunities and preserve affordable housing stock, ending homelessness, and providing assistance to local employees (e.g., the Teacher Housing Program and Teach Here, Live Here Program). Other initiatives and housing incentives employed by the City include the Extremely-Low Income Initiative (financing for extremely-low income housing) and provisions for flexibility for affordable housing developments under the City’s density bonus policy in the General Plan. The Housing Opportunity Study (HOS) undertaken by the City identified vacant or underutilized sites suitable for high-density residential or mixed residential/commercial developments with a focus on the City’s six Transit-Oriented Development Corridors. In conformance with state law, the City also has inclusionary housing policies that require the provision of affordable housing by developers of housing within redevelopment areas. These policies in aggregate reflect the City’s vision of creating housing opportunities for all income levels.
204 City of San Jose Department of Housing. City Policies. Available at: <www.sjhousing.org/policy/citypo.html>
Section 3.0 Environmental Setting, Impacts, and Mitigation
Envision San José 2040 General Plan 770 Draft Program EIR City of San José June 2011
3.14.3 Thresholds of Significance For the purposes of this PEIR, a population and housing impact is considered significant if implementation of the proposed Envision San José 2040 General Plan would: • Induce substantial population growth in an area, either directly (for example, by proposing
new homes and businesses) or indirectly (for example, through extension of roads or other infrastructure).
• Displace substantial numbers of existing housing or people, necessitating the construction of replacement housing elsewhere.
3.14.4 Population and Housing Impacts 3.14.4.1 Proposed Envision San José 2040 General Plan Projections The proposed Envision San José 2040 General Plan seeks to create capacity for 120,000 net new dwelling units in San José by 2035. At an average projected household size of 3.06 persons per household, the 120,000 dwelling units would increase the population of San José by approximately 367,200 persons205, or 37 percent by 2035. Under the proposed General Plan, capacity for an additional 470,000 jobs by 2035 will be added to the approximately 369,450 jobs in 2008 for a total of 839,450 jobs. The projected population and job growth is based on new General Plan land use designations and policies that would be adopted as part of the proposed General Plan. Growth is proposed to occur in planning horizons (phases), focused on the cohesive transformation of growth areas into complete Urban Villages that focus growth in compact scale development to use land more efficiently. Development allowed in each planning horizon will be predicated on achievement of General Plan goals for improvement of the City’s Jobs/Housing Balance, fiscal stability, and the provision of adequate infrastructure (refer to Implementation Policies IP-3.5, 3.7, and 3.8). Priority for new residential growth is given to areas near Downtown, along existing and planned transit corridors and adjacent to transit stations. Planning growth at these locations is intended to link future residential development with existing infrastructure and focus it in areas that can support intensification in a manner that meets the multiple sustainability goals of the City’s General Plan.
Relationship to ABAG Projections The Preferred Scenario under the Envision San José 2040 General Plan was not known when ABAG developed its most recent projections in 2007 and 2009. ABAG’s 2007 and 2009 projections are higher than the proposed General Plan capacity for population growth and lower than its capacity for job growth (Table 3.14-4).
205 Assumes that all dwelling units are occupied (i.e., no vacancy).
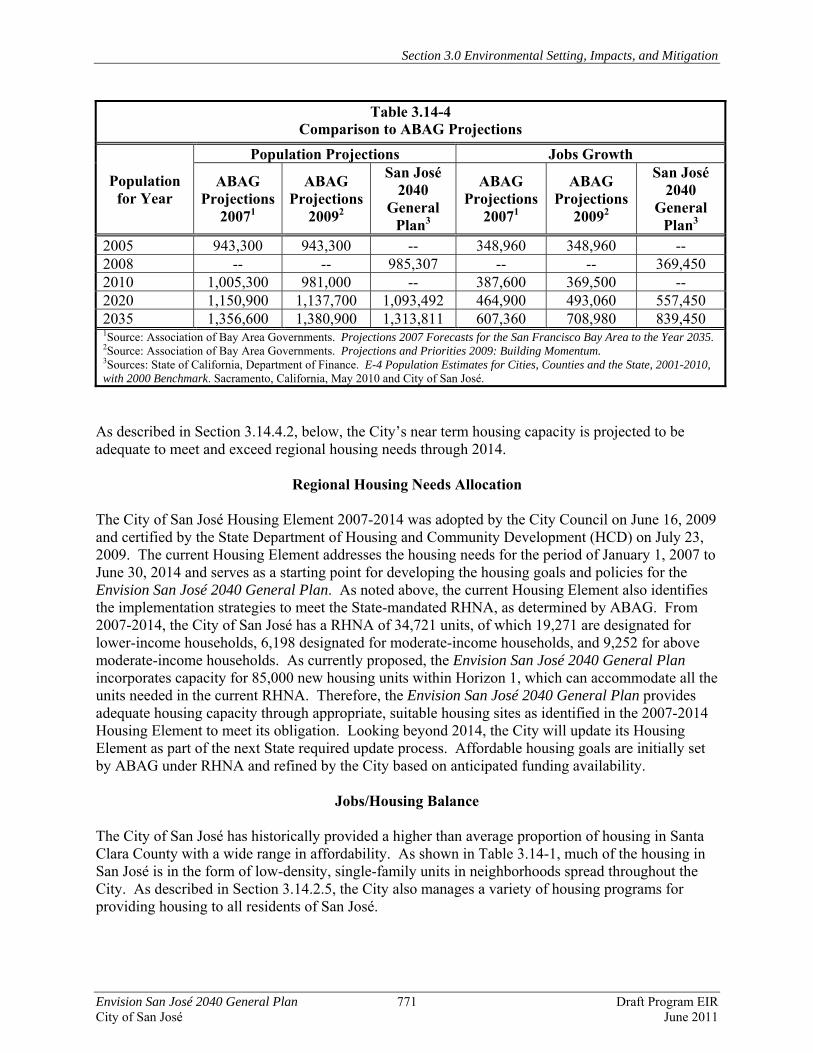
Section 3.0 Environmental Setting, Impacts, and Mitigation
Envision San José 2040 General Plan 771 Draft Program EIR City of San José June 2011
Table 3.14-4 Comparison to ABAG Projections
Population for Year
Population Projections Jobs Growth
ABAG Projections
20071
ABAG Projections
20092
San José 2040
General Plan3
ABAG Projections
20071
ABAG Projections
20092
San José 2040
General Plan3
2005 943,300 943,300 -- 348,960 348,960 -- 2008 -- -- 985,307 -- -- 369,450 2010 1,005,300 981,000 -- 387,600 369,500 -- 2020 1,150,900 1,137,700 1,093,492 464,900 493,060 557,450 2035 1,356,600 1,380,900 1,313,811 607,360 708,980 839,450 1Source: Association of Bay Area Governments. Projections 2007 Forecasts for the San Francisco Bay Area to the Year 2035. 2Source: Association of Bay Area Governments. Projections and Priorities 2009: Building Momentum. 3Sources: State of California, Department of Finance. E-4 Population Estimates for Cities, Counties and the State, 2001-2010, with 2000 Benchmark. Sacramento, California, May 2010 and City of San José.
As described in Section 3.14.4.2, below, the City’s near term housing capacity is projected to be adequate to meet and exceed regional housing needs through 2014.
Regional Housing Needs Allocation The City of San José Housing Element 2007-2014 was adopted by the City Council on June 16, 2009 and certified by the State Department of Housing and Community Development (HCD) on July 23, 2009. The current Housing Element addresses the housing needs for the period of January 1, 2007 to June 30, 2014 and serves as a starting point for developing the housing goals and policies for the Envision San José 2040 General Plan. As noted above, the current Housing Element also identifies the implementation strategies to meet the State-mandated RHNA, as determined by ABAG. From 2007-2014, the City of San José has a RHNA of 34,721 units, of which 19,271 are designated for lower-income households, 6,198 designated for moderate-income households, and 9,252 for above moderate-income households. As currently proposed, the Envision San José 2040 General Plan incorporates capacity for 85,000 new housing units within Horizon 1, which can accommodate all the units needed in the current RHNA. Therefore, the Envision San José 2040 General Plan provides adequate housing capacity through appropriate, suitable housing sites as identified in the 2007-2014 Housing Element to meet its obligation. Looking beyond 2014, the City will update its Housing Element as part of the next State required update process. Affordable housing goals are initially set by ABAG under RHNA and refined by the City based on anticipated funding availability.
Jobs/Housing Balance The City of San José has historically provided a higher than average proportion of housing in Santa Clara County with a wide range in affordability. As shown in Table 3.14-1, much of the housing in San José is in the form of low-density, single-family units in neighborhoods spread throughout the City. As described in Section 3.14.2.5, the City also manages a variety of housing programs for providing housing to all residents of San José.

Section 3.0 Environmental Setting, Impacts, and Mitigation
Envision San José 2040 General Plan 772 Draft Program EIR City of San José June 2011
The proposed Envision San José 2040 General Plan would accommodate approximately 328,504 net new residents206 in 120,000 new dwelling units and 470,000 new jobs by 2035. As previously mentioned, average household size has been decreasing in San José over the last ten years and is expected to continue that decline resulting in new housing units contributing less to the total population than in previous years. An estimated 98 percent of new housing would be multiple family units, with an emphasis on location near transit and mixed uses. The City of San José has an estimated 1.55 employed residents per household.207 Build-out of the proposed General Plan growth capacity, taking into account existing development (as of 2008) and planned jobs and population anticipated in 2035, translates to a job per employed resident ratio of 1.3 to 1 or 839,450 jobs divided by 665,493 employed residents. This would be an increase in the existing ratio of jobs per employed resident of 0.8 (Table 3.14-5) and corresponds to the City’s goal of developing as a regional employment center in the future.
Table 3.14-5 Jobs/Housing Balance
Jobs Population
Households/Dwelling
Units
Employed Residents
Jobs per Employed Resident
Existing 2008 369,450 985,307 309,350 460,443 0.8 Net New General Plan 470,000 328,504 120,000 -- -- City at 2035 839,450 1,313,811 429,350 665,493 1.3 Source: Envision San José 2040 General Plan and U.S. Census, American Community Survey, 2008.
3.14.4.2 Induce Substantial Population Growth Under current conditions, San José’s jobs/housing imbalance results in a substantial number of residents driving to locations outside the City to get to work. The staging of the Horizons proposed by this General Plan will monitor the City’s progress in correcting that imbalance and minimize the likelihood that substantial housing development will occur before employment uses, making the current imbalance worse. At some future date, the planned housing in this General Plan could be completed while jobs (industrial and commercial land uses) continue to come on-line. Locating a large new employment use or adopting plans for a substantial new quantity of employment-intensive land uses beyond the needs of the local workforce can have the secondary effect of inducing population growth as new out-of-area workers are attracted to the job opportunities and seek to move closer to the new jobs, creating additional demand for new housing. During the initial planning horizons, job growth will improve the City’s jobs/housing balance and population growth would accommodate the RHNA housing goals set by ABAG through at least 2014 and likely much farther into the future. The General Plan during the later planning horizons, however, is “job-rich”. This means that it provides for more employment capacity than housing capacity and if fully achieved will lead to insufficient housing opportunities within San José for future San José workers. This is reflected in the jobs per employed resident ratio discussed above. The proposed Envision San José 2040 General Plan job growth (470,000 new jobs by the end of Horizon 5) will require substantial residential development elsewhere in the region to provide 206 Based upon a projected 3.06 residents per dwelling unit in 2035. 207 City of San José and U.S. Census, American Community Survey, 2008
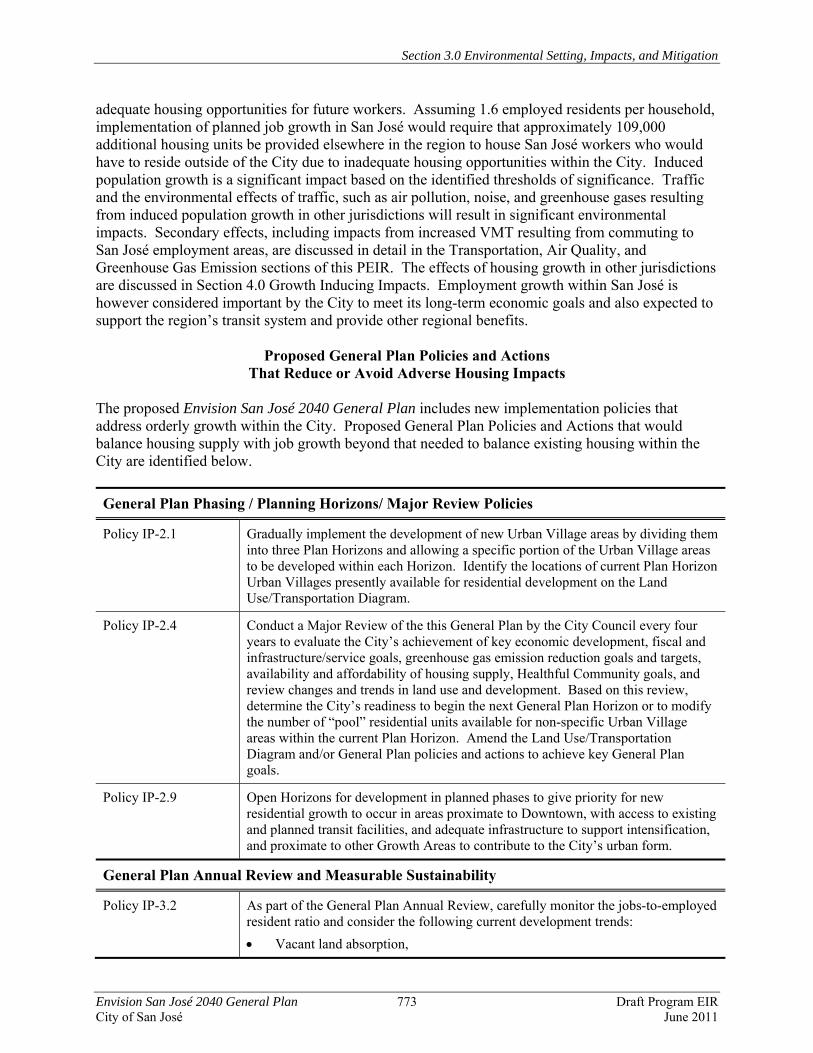
Section 3.0 Environmental Setting, Impacts, and Mitigation
Envision San José 2040 General Plan 773 Draft Program EIR City of San José June 2011
adequate housing opportunities for future workers. Assuming 1.6 employed residents per household, implementation of planned job growth in San José would require that approximately 109,000 additional housing units be provided elsewhere in the region to house San José workers who would have to reside outside of the City due to inadequate housing opportunities within the City. Induced population growth is a significant impact based on the identified thresholds of significance. Traffic and the environmental effects of traffic, such as air pollution, noise, and greenhouse gases resulting from induced population growth in other jurisdictions will result in significant environmental impacts. Secondary effects, including impacts from increased VMT resulting from commuting to San José employment areas, are discussed in detail in the Transportation, Air Quality, and Greenhouse Gas Emission sections of this PEIR. The effects of housing growth in other jurisdictions are discussed in Section 4.0 Growth Inducing Impacts. Employment growth within San José is however considered important by the City to meet its long-term economic goals and also expected to support the region’s transit system and provide other regional benefits.
Proposed General Plan Policies and Actions That Reduce or Avoid Adverse Housing Impacts
The proposed Envision San José 2040 General Plan includes new implementation policies that address orderly growth within the City. Proposed General Plan Policies and Actions that would balance housing supply with job growth beyond that needed to balance existing housing within the City are identified below. General Plan Phasing / Planning Horizons/ Major Review Policies
Policy IP-2.1 Gradually implement the development of new Urban Village areas by dividing them into three Plan Horizons and allowing a specific portion of the Urban Village areas to be developed within each Horizon. Identify the locations of current Plan Horizon Urban Villages presently available for residential development on the Land Use/Transportation Diagram.
Policy IP-2.4 Conduct a Major Review of the this General Plan by the City Council every four years to evaluate the City’s achievement of key economic development, fiscal and infrastructure/service goals, greenhouse gas emission reduction goals and targets, availability and affordability of housing supply, Healthful Community goals, and review changes and trends in land use and development. Based on this review, determine the City’s readiness to begin the next General Plan Horizon or to modify the number of “pool” residential units available for non-specific Urban Village areas within the current Plan Horizon. Amend the Land Use/Transportation Diagram and/or General Plan policies and actions to achieve key General Plan goals.
Policy IP-2.9 Open Horizons for development in planned phases to give priority for new residential growth to occur in areas proximate to Downtown, with access to existing and planned transit facilities, and adequate infrastructure to support intensification, and proximate to other Growth Areas to contribute to the City’s urban form.
General Plan Annual Review and Measurable Sustainability
Policy IP-3.2 As part of the General Plan Annual Review, carefully monitor the jobs-to-employed resident ratio and consider the following current development trends: • Vacant land absorption,
Section 3.0 Environmental Setting, Impacts, and Mitigation
Envision San José 2040 General Plan 774 Draft Program EIR City of San José June 2011
• Amount of residential and economic development, • Amount and value of non-residential construction, • Number and types of housing units authorized by building permit, and
development activity level in zonings, development permits, annexations and building permits,
• Status and current capacity of major infrastructure systems which are addressed in General Plan Level of Service policies (transportation, sanitary sewers and sewage treatment),
• Transit-ridership statistics and other measures of peak-hour diversion from single occupant vehicles,
• Status and implementation of Green Vision, General Plan policies, and other greenhouse gas reduction strategy measures, including greenhouse gas emission reductions compared to baseline and/or business-as-usual, and
• Levels of police, fire, parks and library services being provided by the City.
Housing Development
Policy IP-19.1 Through a Major General Plan Review or, as needed, through the Annual General Plan review process, evaluate the Plan’s consistency with housing development goals as determined by the State and regional agencies and take actions as necessary to address their requirements.
In addition to those listed above, the proposed General Plan includes a range of policies designed to minimize air pollutant emissions and VMT by single drivers. These policies are listed in Sections 3.2 Transportation, 3.4 Air Quality, and 3.15 Greenhouse Gas Emissions. Impact PH-1: New development and redevelopment allowed under the proposed General
Plan would not induce growth beyond that anticipated in ABAG projections for the San Francisco Bay Area in the near term. The anticipated level of job growth by 2035 will outpace housing development within the City, resulting in a new jobs/housing imbalance. The proposed Envision San José 2040 General Plan job growth could require substantial residential development elsewhere in the region to provide adequate housing opportunities for future workers. Traffic and the environmental effects of traffic, such as air pollution, noise, and greenhouse gases resulting from induced population growth in other jurisdictions will result in significant environmental impacts. (Significant Impact)
3.14.4.3 Displace Housing Units or People Under the proposed Envision San José 2040 General Plan housing growth and redevelopment would be focused in existing commercial, industrial and vacant areas within the City’s Urban Growth Boundary. Nearly all existing housing units could be retained. The proposed Envision San José 2040 General Plan would accommodate employment growth in ways (i.e., intensification of currently planned employment lands) that would not displace substantial amounts of existing housing or people, nor would the construction of planned infrastructure or public facilities necessary to serve future growth require substantial displacement of existing housing units or people. Therefore, the proposed Envision San José 2040 General Plan would have a limited and less than significant impact in terms of housing or population displacement.

Section 3.0 Environmental Setting, Impacts, and Mitigation
Envision San José 2040 General Plan 775 Draft Program EIR City of San José June 2011
Impact PH-2: New development and redevelopment allowed under the proposed General Plan would occur primarily in existing commercial and industrial areas and not displace substantial amounts of existing housing or people. (Less Than Significant Impact)
3.14.4.4 Impacts of Rancho del Pueblo and iStar Residential Options As discussed in Section 2.2.8 in the Project Description, this PEIR also evaluates options for residential land use designations and anticipated future development on two properties; the Rancho del Pueblo Golf Course in the Alum Rock Planning Area and the iStar property in the Edenvale Planning Area (Residential Option Sites). Under these options one or both of these properties would be designated for residential uses instead of the industrial uses assumed on the iStar property and the park/open space on the existing Rancho del Pueblo Golf Course. Because these options also include modifications to other Growth Areas, adjusting the assumed dwelling units or jobs, the overall amount of development capacity assumed under the Preferred Scenario would not change citywide. A comparison and summary of population and housing impacts for the residential options is shown in Table 3.14-6. Implementation of an updated General Plan that includes one or both of the residential options for the Rancho del Pueblo and iStar sites would have impacts similar to those from the proposed project.
Table 3.14-6 Population and Housing Impacts of Residential Options
Compared to Proposed Project Impact Number(s) Environmental Issue Basis Significance 1
PH-1 Induce Substantial Population Growth
The overall amount of development capacity assumed would be the same as the proposed General Plan. Like the proposed project, the anticipated level of job growth by 2035 will outpace housing development within the City, resulting in a new jobs/housing imbalance.
same (S)
PH-2
Displace Housing Units or People The iStar property has one residence and the Rancho del Pueblo property is non-residential. Like the proposed project, new development and redevelopment in San José would occur primarily in existing commercial and industrial areas and not displace substantial amounts of existing housing or people.
same (LTS)
1 S= Significant; LTS = Less Than Significant The determination of significance assumes implementation of proposed General Plan policies and actions and existing regulations and adopted plans and policies previously identified throughout Section 3.14.4 Population and Housing Impacts. Bold = New Significant Impact
Section 3.0 Environmental Setting, Impacts, and Mitigation
Envision San José 2040 General Plan 776 Draft Program EIR City of San José June 2011
3.14.5 Mitigation and Avoidance Measures for Population and Housing Impacts
3.14.5.1 Proposed General Plan
Induce Substantial Population Growth As discussed in detail in the Transportation, Air Quality, and Greenhouse Gas Emissions sections of this PEIR, the proposed shift in the City’s jobs/housing imbalance from jobs deficient within the City to more jobs than employed residents will contribute to air pollutant emissions (including greenhouse gas emissions) and congestion on area freeways, roadways and intersections. While the City proposes to implement measures to reduce VMT and associated air pollutant emissions, (such as multi-modal infrastructure improvements and transit pass subsidies), there is no assurance that these measures would reduce air emissions and transportation congestion impacts to a less than significant level. Residential development outside San José, especially outside of Santa Clara County and southern Alameda County, could result in growth inducing impacts that are not reduced to a less than significant level. (Significant Unavoidable Impact) 3.14.5.2 Rancho del Pueblo and iStar Residential Options
Induce Substantial Population Growth Like the proposed General Plan discussed above, there is no assurance that measures to reduce VMT and associated air pollutant emissions would reduce air emissions and transportation congestion impacts to a less than significant level. Residential development outside San José, especially outside of Santa Clara County and southern Alameda County, could result in growth inducing impacts that are not reduced to a less than significant level. (Significant Unavoidable Impact) 3.14.6 Significance Conclusions 3.14.6.1 Proposed General Plan Implementation of the proposed General Plan would not displace substantial amounts of existing housing or people. Since the proposed project could induce substantial population growth at other locations by 2035, the impact of growth inducement is significant. As discussed in detail in Transportation, Air Quality, and Greenhouse Gas Emissions sections of this PEIR, the City’s jobs/housing imbalance may also contribute to air pollutant emissions (including greenhouse gas emissions) and congestion on area freeways, roadways and intersections, based on current travel assumptions as reflected in the City’s Transportation Demand Model. Although a number of policies are proposed that would assist the City in identifying methods to reduce automobile travel, there is no assurance that effective measures can or will be implemented. Therefore, the identified population and housing impact related to the jobs/housing balance and induced growth is significant and unavoidable. (Significant Unavoidable Impact)

Section 3.0 Environmental Setting, Impacts, and Mitigation
Envision San José 2040 General Plan 777 Draft Program EIR City of San José June 2011
3.14.6.2 Rancho del Pueblo and iStar Residential Options Like the proposed project discussed above, implementation of the Envision San José 2040 General Plan with the Rancho del Pueblo and iStar Residential Options would not displace substantial amounts of existing housing or people and the identified population and housing impact related to the jobs/housing balance and induced growth is significant and unavoidable. (Significant Unavoidable Impact)
Section 3.0 Environmental Setting, Impacts, and Mitigation
Envision San José 2040 General Plan 778 Draft Program EIR City of San José June 2011
3.15 GREENHOUSE GAS EMISSIONS The following discussion evaluates greenhouse gas (GHG) emissions resulting from implementation of the Envision San José 2040 General Plan. The analysis in this section is based in part on the following technical report and amendment: • Technical Report Greenhouse Gas Inventories, City of San José, Sierra Research, November
2010. • Amendment to Technical Report: Greenhouse Gas Inventories for Scenarios 7 and 7A, City
of San José, Sierra Research, March 2011. A copy of this report and the amendment for proposed project (Scenario 7) and residential options (Scenario 7A), along with the City’s summary of its Greenhouse Gas Reduction Strategy, is included in the Technical Appendices to this Draft PEIR (Appendix K). 3.15.1 Greenhouse Gas Emissions and Global Climate Change This section provides a general discussion of global climate change and focuses on emissions from human activities that alter the chemical composition of the atmosphere. The underlying causes behind climate change, federal and state governmental programs and regulations aimed at limiting the magnitude of climate change, forecasts of the City’s future GHG emissions within the context of California’s climate change goals, and measures the City could undertake to limit its contribution to greenhouse gas emissions are identified. Climate change impacts to the City of San José, both its built and natural environment, are discussed in each relevant section throughout this PEIR. For example, the effects of warming temperatures on smog formation are discussed in Section 3.4 Air Quality, increased risk of flooding due to climate change in Section 3.7 Hydrology and Water Quality, the effects of sea level rise on salt marsh habitats in Section 3.5 Biological Resources, and climate change implications for long-term water supplies in Section 3.10 Utilities and Service Systems. 3.15.2 Existing Setting 3.15.2.1 Climate Science Overview Unlike emissions of criteria and toxic air pollutants, which have local or regional impacts, emissions of GHGs have a broader, global impact. Global warming is a process whereby GHGs accumulating in the atmosphere contribute to an increase in the temperature of the earth’s atmosphere. The principal GHGs contributing to global warming are carbon dioxide (CO2), methane (CH4), nitrous oxide (N2O), and fluorinated compounds. The primary GHGs of concern and their climate change potential are summarized in Table 3.15-1. These gases allow visible and ultraviolet light from the sun to pass through the atmosphere, but they prevent heat from escaping back out into space, a process known as the ‘greenhouse effect.’ Human-caused emissions of these GHGs in excess of natural ambient concentrations are responsible for intensifying the greenhouse effect and have led to an alteration of the balance of energy transfers between the atmosphere, space, land, and the oceans and a trend of unnatural warming of the earth’s climate. According to the Intergovernmental Panel in Climate Change (IPCC), it is extremely unlikely that global climate change of the past 50 years can be explained without the contribution from human activities.

Section 3.0 Environmental Setting, Impacts, and Mitigation
Envision San José 2040 General Plan 779 Draft Program EIR City of San José June 2011
The global atmospheric concentration of carbon dioxide has increased from a pre-industrial value of approximately 280 ppm to 379 ppm in 2005. Previous scientific assessments assumed that limiting global temperature rise to 2-3°C above pre-industrial levels would require stabilizing greenhouse gas concentrations in the range of 450-550 parts per million (ppm) of carbon dioxide-equivalent (CO2e). Now the science indicates that a temperature rise of 2°C would not prevent dangerous interference with the climate system. Recent scientific assessments suggest that global temperature rise should be kept below 2°C by stabilizing greenhouse gas concentrations below 350 ppm CO2e, a significant reduction from the current level of 385 ppm CO2e.208
Table 3.15-1 Examples of Greenhouse Gases
Gas Sources Global
Warming Potential1
Carbon dioxide (CO2) Fossil fuel combustion in stationary and point sources; emission sources includes burning of oil, coal, gas.
1
Methane (CH4)
Incomplete combustion in forest fires, landfills, and leaks in natural gas and petroleum systems, agricultural activities, coal mining, wastewater treatment, and certain industrial processes.
21
Nitrous oxide (N2O)
Fossil fuel combustion in stationary and point sources; other emission sources include agricultural soil management, animal manure management, sewage treatment, adipic acid production, and nitric acid production.
310
Chlorofluorocarbons (CFC) and Hydro-chlorofluorocarbons (HCFC)
Agents used in production of foam insulation; other sources include air conditioners, refrigerators, and solvents in cleaners.
140-11,700
Sulfur hexafluoride (SF6)
Electric insulation in high voltage equipment that transmits and distributes electricity, including circuit breakers, gas-insulated substations, and other switchgear used in the transmission system to manage the high voltages carried between generating stations and customer load centers.
23,900
Perfluorocarbons (PFC’s) Primary aluminum production and semiconductor manufacturing.
6,500 - 9,200
1The concept of a global warming potential (GWP) was developed to compare the ability of each greenhouse gas to trap heat in the atmosphere relative to another gas. The definition of a GWP for a particular greenhouse gas is the ratio of heat trapped by one unit mass of the greenhouse gas to that of one unit mass of CO2 over a specified time period. Sources: U.S. EPA. High Global Warming Potential Gases. Available at: <http://www.epa.gov/highgwp/scientific.html> U.S. EPA. Inventory of U.S. Greenhouse Gas Emissions and Sinks: 1990 – 2008. Available at: < http://epa.gov/climatechange/emissions/downloads10/US-GHG-Inventory-2010_Report.pdf >
208 Bay Area Air Quality Management District (BAAQMD). CEQA Air Quality Guidelines. May 2011. Available at: <http://www.baaqmd.gov/~/media/Files/Planning%20and%20Research/ CEQA/BAAQMD%20CEQA% 20Guidelines_May%202011_5_3_11.ashx>
Section 3.0 Environmental Setting, Impacts, and Mitigation
Envision San José 2040 General Plan 780 Draft Program EIR City of San José June 2011
CO2e is a measurement used to account for the fact that different GHGs have different potential to retain infrared radiation in the atmosphere and contribute to the greenhouse effect. This potential, known as the global warming potential (GWP) of a GHG, is dependent on the lifetime, or persistence, of the gas molecule in the atmosphere. For example, one ton of CH4 has the same contribution to the greenhouse effect as approximately 21 tons of CO2 (refer to Table 3.15-1). Therefore, CH4 is a much more potent GHG than CO2. Expressing emissions in CO2e takes the contributions of all GHG emissions to the greenhouse effect and converts them to a single unit equivalent to the effect that would occur if only CO2 were being emitted. 3.15.2.2 Statewide and Regional Emissions Inventories
California Emissions Inventory The California GHG inventory compiles statewide anthropogenic GHG emissions and sinks.209 Emissions of GHGs contributing to global climate change are attributable in large part to human activities associated with the transportation, utility, industrial/manufacturing, residential, commercial and agricultural sectors. Combustion of fossil fuel in the transportation sector was the single largest source of California’s GHG emissions between 2000-2008, accounting for 36.5 percent of total GHG emissions in the state (Figure 3.15-1). This sector was followed by the electric power generation sector including both in-state and out-of-state sources (24 percent) and the industrial sector (21 percent). California’s gross emissions of greenhouse gas increased 4.3 percent from 458 million metric tons (MMT) of CO2e in 2000 to 477.7 million in 2008, with a maximum of 483.9 million in 2004. During the same period, California’s population grew by 11.8 percent from 34.1 to 38.1 million people and GHG emissions per person decreased from 13.4 to 12.5 metric tons of CO2e per person. In 2008, due in part to fuel prices, there was a slight decrease in vehicle miles travelled on California highways. Emissions from electric power generation varied with hydrologic conditions and the amount hydropower that was produced in-state or imported. There was no clear overall trend for industrial emissions over the period and emissions from the commercial and residential sectors have remained about the same over the 2000-2008 period.210
209 California Air Resources Board. California Greenhouse Gas Inventory for 2000-2008. May 12, 2010. Available at: < http://www.arb.ca.gov/cc/inventory/data/data.htm>. 210 California Air Resources Board. Trends in California Greenhouse Gas Emissions for 2000 to 2008 – by Category as Defined in the Scoping Plan. May 28, 2010. Available at: <http://www.arb.ca.gov/cc/inventory/data/tables/ghg_inventory_trends_00-08_2010-05-12.pdf>

Section 3.0 Environmental Setting, Impacts, and Mitigation
Envision San José 2040 General Plan 781 Draft Program EIR City of San José June 2011
California's Greenhouse Gas Emissions (2000-2008 Average)
Transportation38%
Electric Power23%
Commercial and Residential
9%
Industrial21%
High Global Warming Potential
2%Agriculture
6%Recycling and Waste
1%
Figure 3.15-1 California Greenhouse Gas Emissions By Sector (2000-2008)
Bay Area Emissions Inventory
The BAAQMD has also prepared an emission inventory of GHG contributing to climate change. Their Greenhouse Gas Source Inventory estimates direct and indirect emissions from sources within BAAQMD’s jurisdiction. The latest version of the inventory, updated in 2010, provides information on 2007 emissions.211 In 2007, there were an estimated 95.8 million metric tons of GHG emissions associated with the nine Bay Area counties. Like the statewide inventory, transportation is one of the largest sources of GHG emissions, at 36.4 percent (refer to Figure 3.15-1 and Figure 3.15-2). Industrial and commercial uses emitted a similar amount of GHG (36.4 percent) followed by electricity generation (15.9 percent) and residential uses (7.1 percent). BAAQMD’s inventory also provides a breakdown of GHG emissions by County. In Santa Clara County, approximately 42 percent of emissions were associated with transportation, 25 percent with industrial and commercial processes and operations, 19 percent with electricity use or generation, 8.5 percent with residential fuel use and the remainder from offroad equipment and agricultural operations. Emissions from Santa Clara County made up 19.6 percent of GHG emissions from the
211 BAAQMD. “Greenhouse Gases”. Available at: <http://www.baaqmd.gov/Divisions/Planning-and-Research/Emission-Inventory-and-Air-Quality-Related/Emission-Inventory/Greenhouse-Gases.aspx>
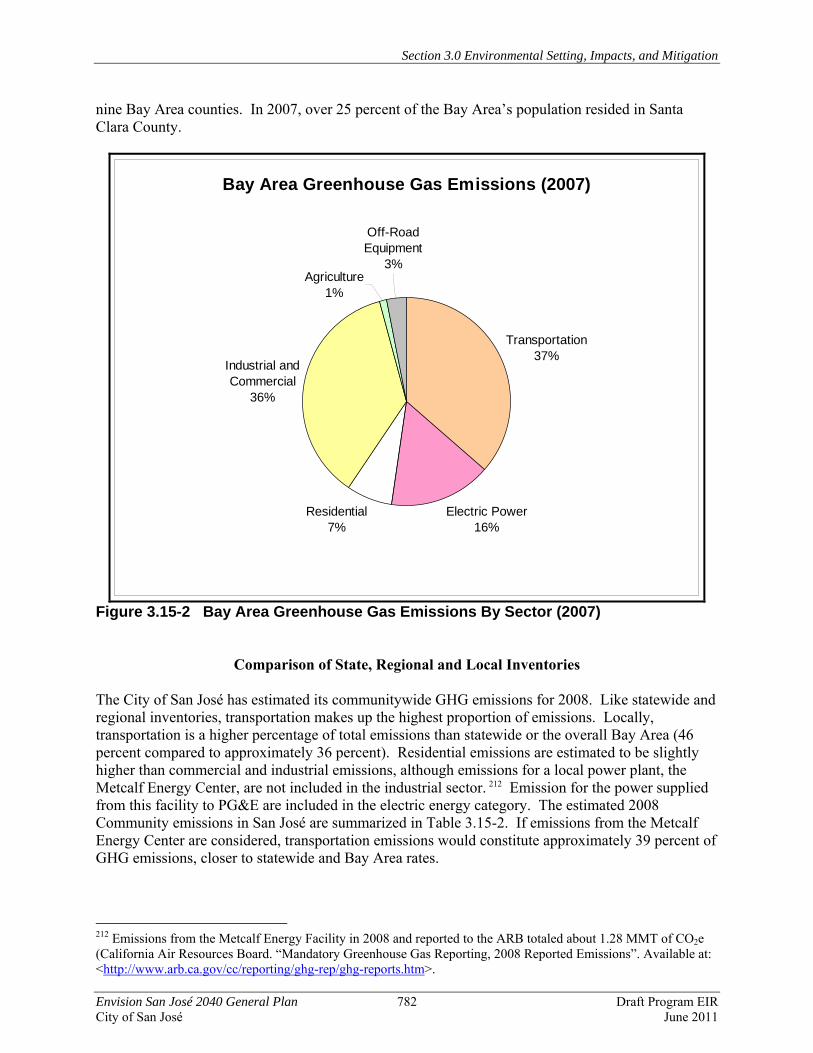
Section 3.0 Environmental Setting, Impacts, and Mitigation
Envision San José 2040 General Plan 782 Draft Program EIR City of San José June 2011
nine Bay Area counties. In 2007, over 25 percent of the Bay Area’s population resided in Santa Clara County.
Bay Area Greenhouse Gas Emissions (2007)
Transportation37%
Electric Power16%
Residential7%
Industrial and Commercial
36%
Off-Road Equipment
3%Agriculture
1%
Figure 3.15-2 Bay Area Greenhouse Gas Emissions By Sector (2007)
Comparison of State, Regional and Local Inventories
The City of San José has estimated its communitywide GHG emissions for 2008. Like statewide and regional inventories, transportation makes up the highest proportion of emissions. Locally, transportation is a higher percentage of total emissions than statewide or the overall Bay Area (46 percent compared to approximately 36 percent). Residential emissions are estimated to be slightly higher than commercial and industrial emissions, although emissions for a local power plant, the Metcalf Energy Center, are not included in the industrial sector. 212 Emission for the power supplied from this facility to PG&E are included in the electric energy category. The estimated 2008 Community emissions in San José are summarized in Table 3.15-2. If emissions from the Metcalf Energy Center are considered, transportation emissions would constitute approximately 39 percent of GHG emissions, closer to statewide and Bay Area rates.
212 Emissions from the Metcalf Energy Facility in 2008 and reported to the ARB totaled about 1.28 MMT of CO2e (California Air Resources Board. “Mandatory Greenhouse Gas Reporting, 2008 Reported Emissions”. Available at: <http://www.arb.ca.gov/cc/reporting/ghg-rep/ghg-reports.htm>.
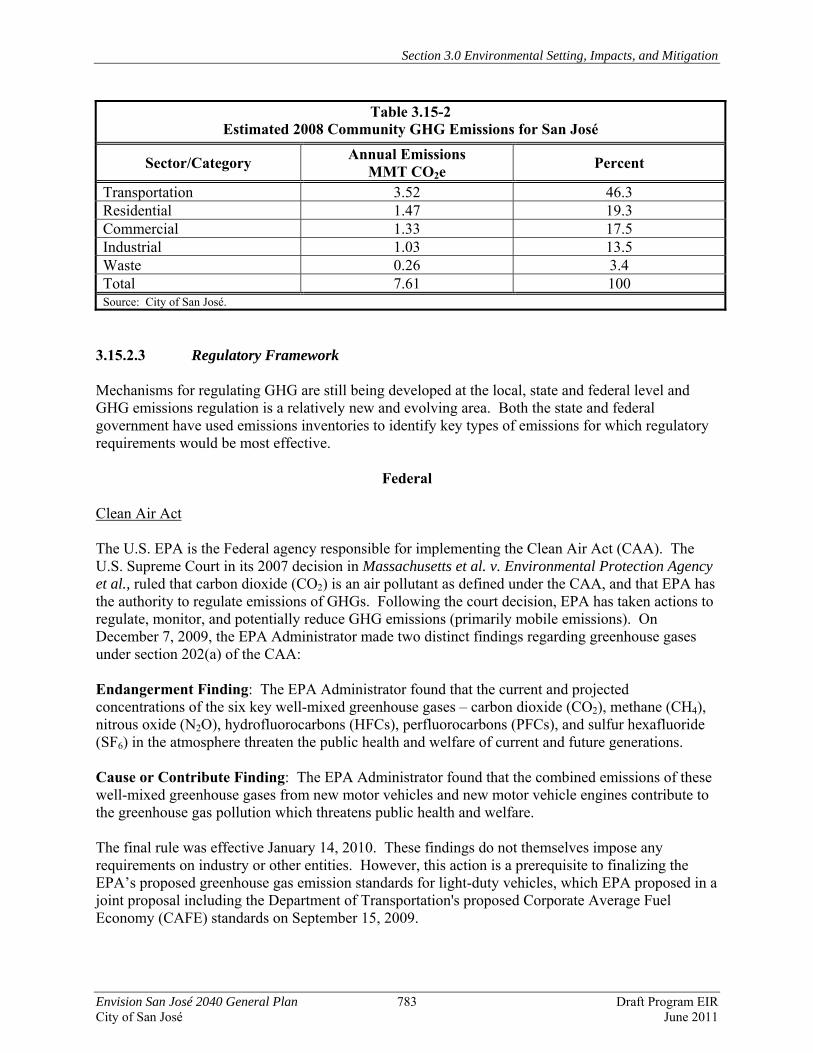
Section 3.0 Environmental Setting, Impacts, and Mitigation
Envision San José 2040 General Plan 783 Draft Program EIR City of San José June 2011
Table 3.15-2 Estimated 2008 Community GHG Emissions for San José
Sector/Category Annual Emissions MMT CO2e Percent
Transportation 3.52 46.3 Residential 1.47 19.3 Commercial 1.33 17.5 Industrial 1.03 13.5 Waste 0.26 3.4 Total 7.61 100 Source: City of San José.
3.15.2.3 Regulatory Framework Mechanisms for regulating GHG are still being developed at the local, state and federal level and GHG emissions regulation is a relatively new and evolving area. Both the state and federal government have used emissions inventories to identify key types of emissions for which regulatory requirements would be most effective.
Federal
Clean Air Act The U.S. EPA is the Federal agency responsible for implementing the Clean Air Act (CAA). The U.S. Supreme Court in its 2007 decision in Massachusetts et al. v. Environmental Protection Agency et al., ruled that carbon dioxide (CO2) is an air pollutant as defined under the CAA, and that EPA has the authority to regulate emissions of GHGs. Following the court decision, EPA has taken actions to regulate, monitor, and potentially reduce GHG emissions (primarily mobile emissions). On December 7, 2009, the EPA Administrator made two distinct findings regarding greenhouse gases under section 202(a) of the CAA: Endangerment Finding: The EPA Administrator found that the current and projected concentrations of the six key well-mixed greenhouse gases – carbon dioxide (CO2), methane (CH4), nitrous oxide (N2O), hydrofluorocarbons (HFCs), perfluorocarbons (PFCs), and sulfur hexafluoride (SF6) in the atmosphere threaten the public health and welfare of current and future generations. Cause or Contribute Finding: The EPA Administrator found that the combined emissions of these well-mixed greenhouse gases from new motor vehicles and new motor vehicle engines contribute to the greenhouse gas pollution which threatens public health and welfare. The final rule was effective January 14, 2010. These findings do not themselves impose any requirements on industry or other entities. However, this action is a prerequisite to finalizing the EPA’s proposed greenhouse gas emission standards for light-duty vehicles, which EPA proposed in a joint proposal including the Department of Transportation's proposed Corporate Average Fuel Economy (CAFE) standards on September 15, 2009.
Section 3.0 Environmental Setting, Impacts, and Mitigation
Envision San José 2040 General Plan 784 Draft Program EIR City of San José June 2011
Regulation of emissions from stationary-sources under the CAA comes in three forms, air quality standards, technology standards, and permits for new and modified sources. In November 2010, the U.S. EPA issued guidance for state and local permitting programs. Under this guidance, control measures required as a part permitting will focus on the largest industrial sources, those emitting nearly 70 percent of the greenhouse gas emissions from stationary sources. States and/or local regulatory agencies (i.e., BAAQMD) will review permit applications and require Best Available Control Technology (BACT) for large industrial sources such as power plants using existing methodologies for determining feasibility. This guidance will apply to permits issued on or after January 2, 2011.
State of California
California has been on the leading edge of creating legislation to mitigate both GHG emissions and the impacts of climate change. To date, several concrete steps have been taken to reduce GHG emissions in the state, while specific impact mitigation strategies (i.e., a GHG emissions cap-and-trade program) have been recommended but not fully developed or adopted. California Global Warming Solutions Act Under the California Global Warming Solution Act, also known as Assembly Bill 32 (AB 32), the California Air Resources Board (CARB) has: • Established a statewide GHG emissions cap for 2020, based on 1990 emissions. • Adopted mandatory reporting rules for significant sources of GHG. • Adopted a comprehensive plan, known as the Climate Change Scoping Plan, that identifies
how emission reductions will be achieved from significant GHG sources via regulations, market mechanisms and other actions.
CARB is in the process of adopting regulations to achieve the maximum technologically feasible and cost-effective reductions in GHG, including provisions for using both market mechanisms and alternative compliance mechanisms. Prior to imposing any mandates or authorizing market mechanisms, CARB must evaluate several factors, including but not limited to impacts on California’s economy, the environment and public health; equity between regulated entities; electricity reliability, conformance with other environmental laws and ensure that the rules do not disproportionately impact low-income communities. The Climate Change Scoping Plan (Scoping Plan) adopted in December 2008, is the State’s comprehensive plan to achieve GHG reductions in California. The Scoping Plan has a range of GHG reduction actions which include direct regulations, alternative compliance mechanisms, monetary and non-monetary incentives, voluntary actions, and market-based mechanisms such as a cap-and-trade system California will implement to achieve a reduction of 169 MMT CO2e emissions, or approximately 28 percent from the state’s projected 2020 emission level of 596 MMT of CO2e under a business-as-usual scenario, so that the state can return to 1990 emission levels, as required by AB 32. Implementation of one of the components of the Scoping Plan, the Cap-and-Trade Program, may be delayed pending further environmental review. 213
213 A San Francisco Superior Court order under Association of Irritated Residents et al. v. CARB (March 2010) requires the California Air Resources Board to complete additional environmental review before implementing the Cap-and-Trade Program outlined in the Climate Change Scoping Plan.
Section 3.0 Environmental Setting, Impacts, and Mitigation
Envision San José 2040 General Plan 785 Draft Program EIR City of San José June 2011
Many of the measures identified in the Scoping Plan will be implemented by state government or at a statewide-level. Under the plan, local and regional government will need to implement changes to local land use patterns and improved transportation systems to further reduce total statewide GHG emissions by 2020. Executive Order S-3-05 Governor Arnold Schwarzenegger issued Executive Order S-3-05 (EO S-3-05) in 2005 establishing the following near-term, mid-term, and long-term GHG emission reduction targets for California: • by 2010, reduce GHG emissions to 2000 levels; • by 2020, reduce GHG emissions to 1990 levels; • by 2050, reduce GHG emissions to 80 percent below 1990 levels. The long-term 2050 target represents the level scientists believe is necessary to reach atmospheric GHG concentrations (below 350 ppm CO2e) that will stabilize climate change. Senate Bill 375 – Redesigning Communities to Reduce Greenhouse Gases Senate Bill 375 (SB 375), signed into law in September 2008, builds on AB 32 by requiring CARB to develop regional GHG reduction targets to be achieved from the automobile and light truck sectors for 2020 and 2035; these regional targets will help achieve the goals of AB 32 and the Scoping Plan through changed land use patterns and improved transportation systems. Subsequently, metropolitan planning organizations (for the Bay Area, the Metropolitan Transportation Commission (MTC) in partnership with the Association of Bay Area Governments) will be required to create so-called ‘sustainable community strategies’ to meet the target emissions reductions as part of the Regional Transportation Plan for that region. San José’s proposed General Plan has a direct relationship to SB 375 in that the City’s future mix and distribution of land uses will influence vehicle miles traveled (VMT) within and to/from the City. Passenger vehicles are the largest single source of GHG emissions in California, accounting for approximately 28 percent of the state’s total between 2000 and 2008.214 Reducing GHG from passenger vehicles relies upon a ‘three-legged stool’ of strategies: driving less, using less fuel per mile, and using fuel with a lower carbon-intensity. The City can only directly influence one ‘leg’ of the stool – VMT due to land use patterns. The other two ‘legs’ (vehicle fuel efficiency standards and the carbon-intensity of fuels) are the purview of state and/or federal agencies. The targets for the MTC in the San Francisco Bay Area adopted in September 2010 by the CARB are a seven (7) percent reduction in greenhouse gases per capita from passenger vehicles by 2020 compared to emissions in 2005. The target for 2035 is a 15 percent reduction per capita from passenger vehicles when compared to emissions in 2005. The emission reduction targets are for those associated with land use and transportation strategies, only. Emission reductions due to the California Low Carbon Fuel Standards or Pavley emission control standards are not included in the targets.
214 California Air Resources Board. California Greenhouse Gas Inventory for 2000-2008. May 12, 2010. Available at: < http://www.arb.ca.gov/cc/inventory/data/data.htm>.

Section 3.0 Environmental Setting, Impacts, and Mitigation
Envision San José 2040 General Plan 786 Draft Program EIR City of San José June 2011
Low Carbon Fuel Standard (LCFS) California’s LCFS requires fuel providers to reduce the carbon intensity of transportation fuels sold in the state, dramatically expanding the market for alternative fuels. By 2020, the LCFS will reduce carbon content in all passenger vehicle fuels sold in California by 10 percent. The LCFS was established by Executive Order S-01-07 in 2007. Clean Car Standards – Pavley Regulations CARB has adopted amendments to the “Pavley” regulations that are designed to reduce greenhouse gas (GHG) emissions in new passenger vehicles. It is expected that the Pavley regulations will reduce GHG emissions from new California passenger vehicles by approximately 22 percent in 2012 and approximately 30 percent in 2016, all while improving fuel efficiency and reducing motorists’ costs.215 Renewables Portfolio Standard for Energy Generation California’s Renewables Portfolio Standard (RPS) is one of the most ambitious renewable energy standards in the country. The RPS program required electric corporations to increase procurement from eligible renewable energy resources by at least one percent of their retail sales annually, until they reached 20 percent in 2010. In 2008 then Governor Schwarzenegger established a 33% state renewable goal by 2020 in Executive Order S-14-08. On April 12, 2011, California Governor Jerry Brown signed Senate Bill 2X into law, requiring that 33 percent of the state’s electric generation come from renewable sources by 2020. Under S.B. 2X, all electricity suppliers must meet a 20 percent renewables target by Dec. 31, 2013, a 25 percent target by the end of 2016, and achieve the 33 percent criterion by the end of 2020. S.B. 2X applies to all electricity retailers in the state – investor-owned utilities, municipal utilities and independent sellers. The California Public Utilities Commission (CPUC) and the California Energy Commission (CEC) jointly implement the RPS program. To the extent that several types of renewable energy sources (e.g., hydropower, wind and solar) have limited GHG emissions from power generation compared to energy generated through combustion processes, implementation of this standard would reduce GHG emissions from electric power generation. California Environmental Quality Act (CEQA) Under recent modifications to the CEQA Guidelines (March 2010), public agencies must consider the effects of greenhouse gas emissions and identify mitigation for greenhouse gas emissions or the effects of greenhouse gas emissions, including but not limited to the effects associated with transportation or energy consumption.
215 CARB. “Clean Car Standards - Pavley, Assembly Bill 1493”. Accessed September 15, 2010. <http://www.arb.ca.gov/cc/ccms/ccms.htm>.
Section 3.0 Environmental Setting, Impacts, and Mitigation
Envision San José 2040 General Plan 787 Draft Program EIR City of San José June 2011
Regional
Bay Area Air Quality Management District (BAAQMD) BAAQMD is the regional, government agency that regulates sources of air pollution within the nine San Francisco Bay Area Counties. Several key activities of BAAQMD related to greenhouse gas emissions are described below. Regional Clean Air Plans: BAAQMD and other agencies prepare clean air plans as required under the State and Federal Clean Air Acts. The Bay Area 20210 Clean Air Plan (CAP) provides a comprehensive plan to improve Bay Area air quality and protect public health through implementation of a control strategy designed to reduce emissions and decrease ambient concentrations of harmful pollutants. The most recent CAP also includes measures designed to reduce GHG emissions. BAAQMD CEQA Air Quality Guidelines: The BAAQMD CEQA Air Quality Guidelines are intended to serve as a guide for those who prepare or evaluate air quality impact analyses for projects and plans in the San Francisco Bay Area. The Guidelines include information on legal requirements, BAAQMD rules, plans and procedures, methods of analyzing air quality impacts, thresholds of significance, mitigation measures, and background air quality information. In June 2010, the Air District's Board of Directors adopted their CEQA thresholds of significance and an update of their CEQA Guidelines. The updated CEQA Guidelines review and describe assessment methodologies, and mitigation strategies for criteria pollutants, air toxics, odors, and greenhouse gas emissions. The adopted thresholds for Plan-level CEQA review employ either a GHG efficiency-based metric or a GHG Reduction Strategy option. If a Plan would result in operational-related greenhouse gas emissions of 6.6 metric tons (MT) per Service Population (residents + employees) per year of carbon dioxide equivalents or more, it would make a cumulatively considerable contribution to greenhouse gas emissions and result in a cumulatively significant impact to global climate change. The BAAQMD CEQA Air Quality Guidelines also outline a methodology for estimating greenhouse gases and components of a Greenhouse Gas Reduction Strategy that once adopted, can be employed in lieu of greenhouse gas analyses for individual projects where the project is consistent with an adopted GHG Reduction Strategy.
City of San José Municipal Code The City’s Municipal Code includes regulations for energy efficiency and energy use. City regulations include a Green Building Ordinance (Chapter 17.84) to foster practices to minimize the use and waste of energy, water and other resources in the City of San José, Water Efficient Landscape Standards for New And Rehabilitated Landscaping (Chapter 15.10), requirements for Transportation Demand Programs for employers with more than 100 employees (Chapter 11.105), a Construction and Demolition Diversion Deposit Program that fosters recycling of construction and demolition materials (Chapter 9.10), and a wood burning ordinance, which includes prohibitions on appliance types and fuel (Chapter 9.10). Implementation of these regulations reduces GHG emissions during and after site development and redevelopment.

Section 3.0 Environmental Setting, Impacts, and Mitigation
Envision San José 2040 General Plan 788 Draft Program EIR City of San José June 2011
Green Vision The City of San José’s Green Vision is a comprehensive 15-year plan to create jobs, preserve the environment, and improve quality of life in the community. Key goals in the Green Vision that could substantially reduce GHG emissions if implemented in whole or in part include reducing per capita energy use by 50 percent, increasing the amount of electric power received from clean renewable sources to 100 percent, build or retrofit buildings with green features, divert 100 percent of the waste from our landfill and convert waste to energy, recycle or beneficially reuse 100 percent of wastewater (100 million gallons per day), ensure that 100 percent of public fleet vehicles run on alternative fuels, plant 100,000 new trees and replace 100 percent of City streetlights with smart, zero emission lighting, and create 100 miles of interconnected trails that will allow residents to travel more easily by bicycle or on foot. On January 12, 2010, the City Council adopted the following revised greenhouse gas reduction targets for incorporation into the General Plan:
2015: GHG emissions 15% below 2005 levels 2020: GHG emissions 20% below 2005 levels 2030: GHG emissions 35% below 2005 levels 2040: GHG emissions 65% below 2005 levels 2050: GHG emissions 80% below 2005 levels
These targets were based upon a comparison to the Kyoto protocol standard216 and adopted by the California Air Resources Board through AB 32, the state’s 2006 Climate Action legislation.217 Estimated community-wide emissions for San José in 2008, the closest date for which the City has an estimate, were 7.61 MMT CO2e. A 15 percent reduction below 2008 levels would be about 6.5 MMT CO2e per year. An 80 percent reduction below 2008 levels would be about 1.5 MMT CO2e per year. City Council Policies The City’s Environmentally Preferable Procurement Policy (Council Policy 4-6) calls for purchasing vehicles with best available fuel efficiency and other measures that directly or indirectly reduce greenhouse gas emission. Other City Council policies for reducing energy and water use would in turn reduce GHG emissions. The Private Sector Green Building Policy (City Council Policy 6-32) establishes baseline green building standards for private sector new construction and provides a framework for the implementation of these standards. The green building standards required by this 216 The Kyoto Protocol is an international agreement linked to the United Nations Framework Convention on Climate Change. The major feature of the Kyoto Protocol is that it sets binding targets for 37 industrialized countries and the European community for reducing GHG emissions. 217 The Kyoto protocols and AB 32 include a comparison of GHG emissions to 1990 levels. However, as California began developing the local government implementation protocol, it was acknowledged that municipalities were having difficulty gathering verifiable data back to 1990. California’s Climate Change Scoping Plan, adopted in December 2008, recommended local governments reduce GHG emissions 15% below current levels by 2020 to achieve AB 32 reductions goals. The targets for community-wide GHG emissions are intended to be both aggressive and achievable given operational and budget constraints, and will meet or exceed AB 32 recommendations (Source: City of San José. “Greenhouse Gas Emission Targets”. Available at: <http://www.sanjoseca.gov/planning/gp_update/documents/GreenhouseGasEmissionsReductionTargets_Factsheet_000.pdf >.

Section 3.0 Environmental Setting, Impacts, and Mitigation
Envision San José 2040 General Plan 789 Draft Program EIR City of San José June 2011
policy are intended to advance greenhouse gas reduction and other sustainability strategies outlined in the City’s Green Vision. Energy Efficiency Programs The City of San José is a partner, along with Pacific Gas & Electric Company, and Ecology Action in the Silicon Valley Energy Watch (SVEW) program. This program assists municipal governments, non profits, small businesses, community organizations, professionals, and residents Santa Clara County take advantage of cost-saving, energy-efficient technologies. The program offers free energy audits, targeted retrofits, technical assistance, education, and training. Reductions in energy use reduce GHG emissions associated with electricity generation or natural gas use.
Section 3.0 Environmental Setting, Impacts, and Mitigation
Envision San José 2040 General Plan 790 Draft Program EIR City of San José June 2011
3.15.3 Thresholds of Significance Implementation of the proposed Envision San José 2040 General Plan would have a significant greenhouse gas emissions impact if it would: • Generate greenhouse gas emissions, either directly or indirectly, that may have a significant
impact on the environment. • Conflict with an applicable plan, policy or regulation adopted for the purpose of reducing the
emissions of greenhouse gases. Applying the above general significance criteria quantitatively according to BAAQMD guidance, the proposed General Plan would result in a cumulatively considerable contribution of greenhouse gases leading to global climate change if: • 2020 Mid-term Target. GHG emissions in 2020 would exceed 6.6 MT CO2e/SP/yr
(residents + employees), thereby exceeding the average carbon-efficiency necessary to achieve AB 32 target emission levels.
• 2035 Long-term Target. GHG emissions in 2035 would exceed 3.3 MT CO2e/SP/yr (residents + employees), thereby failing to maintain a trajectory to achieve Executive Order S-3-05 emissions levels in 2050.
3.15.4 Greenhouse Gas Emission Impacts The City’s Greenhouse Gas Reduction Strategy is embedded in its policies and programs that are designed to help the City sustain its natural resources, grow efficiently, and meet state legal requirements for greenhouse gas (GHG) emissions reduction. This Strategy is outlined in Appendix 8 of the proposed General Plan, which is also included in Appendix K of this PEIR. Although future growth within San José will be accommodated through infill development within the City’s UGB, implementation of the proposed General Plan will nonetheless result in new greenhouse gas emissions. Multiple aspects of the proposed General Plan have greenhouse gas implications, including land use, housing, transportation, water usage, solid waste generation and recycling, and reuse of historic buildings. GHG emissions everywhere contribute, on a cumulative basis, to the significant adverse environmental impacts of global climate change. No single land use project, even at the scale of a comprehensive General Plan guiding development for the next 25 years, could generate sufficient GHG emissions on its own to noticeably change the global average temperature. The combination of GHG emissions from past, present, and future projects in San José, Santa Clara County, across California, the nation and around the world, contribute cumulatively to the phenomenon of global climate change and its associated environmental impacts. Therefore, the following analysis focuses on whether the City’s forecast GHG emissions represent a cumulatively considerable contribution to climate change or whether the City’s future land use mix and form will be consistent with statewide efforts to curb GHG emissions and avoid the worst-case anticipated climate change impacts. Under CEQA Guidelines Section 15064.4, the determination of the significance of impacts from greenhouse gas emissions should be based to the extent possible on scientific and factual data. The analysis should describe, calculate or estimate the amount of greenhouse gas emissions resulting from a project.

Section 3.0 Environmental Setting, Impacts, and Mitigation
Envision San José 2040 General Plan 791 Draft Program EIR City of San José June 2011
CEQA requires “adequacy, completeness, and a good faith effort at full disclosure” rather than perfection, and the following analysis of the General Plan’s future GHG emissions is based on the information and modeling methodologies currently available. Calculating and estimating emissions from energy use with precision is difficult. The modeling used depends upon numerous assumptions, and it is limited by the quantity and quality of available data. With this in mind, it is useful to think of any specific number generated by the model as an approximation, rather than an exact value. It should be acknowledged that the state of the art in terms of emissions modeling will continue to improve over time, and the City will refine GHG estimates for the City of San José in future reports that are part of implementing its Greenhouse Gas Reduction Strategy and Green Vision. 3.15.4.1 Methodology
As specifically allowed under recent amendments to the CEQA Guidelines, the City of San José has chosen to rely upon a quantitative GHG emissions threshold of significance established by BAAQMD for evaluating ‘Plan-level’ or comprehensive long-term planning initiatives such as a General Plan or Specific Plan. The following discussion is based on BAAQMD’s ‘Plan-level’ GHG significance thresholds. A GHG-efficiency metric (e.g., emissions per unit) enables comparison of a proposed General Plan to its alternatives and to determine if the proposed General Plan meets statewide emission reduction goals. The ‘service population’ (SP) approach considers efficiency in terms of the GHG emissions compared to the sum of the number of jobs and the number of residents at a point in time. The SP metric also allows comparison of the GHG efficiency of General Plan alternatives that vary residential and non-residential development totals. The existing (2008) and projected SP (residents + jobs) in 2020 and 2035 are shown in Table 3.15-3.
Evaluating 2020 GHG Emissions The basis of the SP-based GHG efficiency metric developed by BAAQMD as part of their recent BAAQMD CEQA Guidelines update is outlined below. This efficiency metric was derived from statewide emissions estimates and would accommodate statewide projected population and employment growth while allowing for consistency with AB 32 goals which mandate achieving 1990 GHG emissions levels by 2020 (see Table 3.15-4 below for assumptions used to determine the efficiency metric based on AB 32 goal for 2020).
Table 3.15-3 Projected Service Population (Residents +
Jobs) in the City of San José
2008 2020 2035 Existing 1,354,757 -- -- Envision San José 2040 General Plan
-- 1,650,942 2,153,261
Sources: State of California, Department of Finance. E-4 Population Estimates for Cities, Counties and the State, 2001-2010, with 2000 Benchmark. Sacramento, California, May 2010 (for 2008 population) and City of San José.
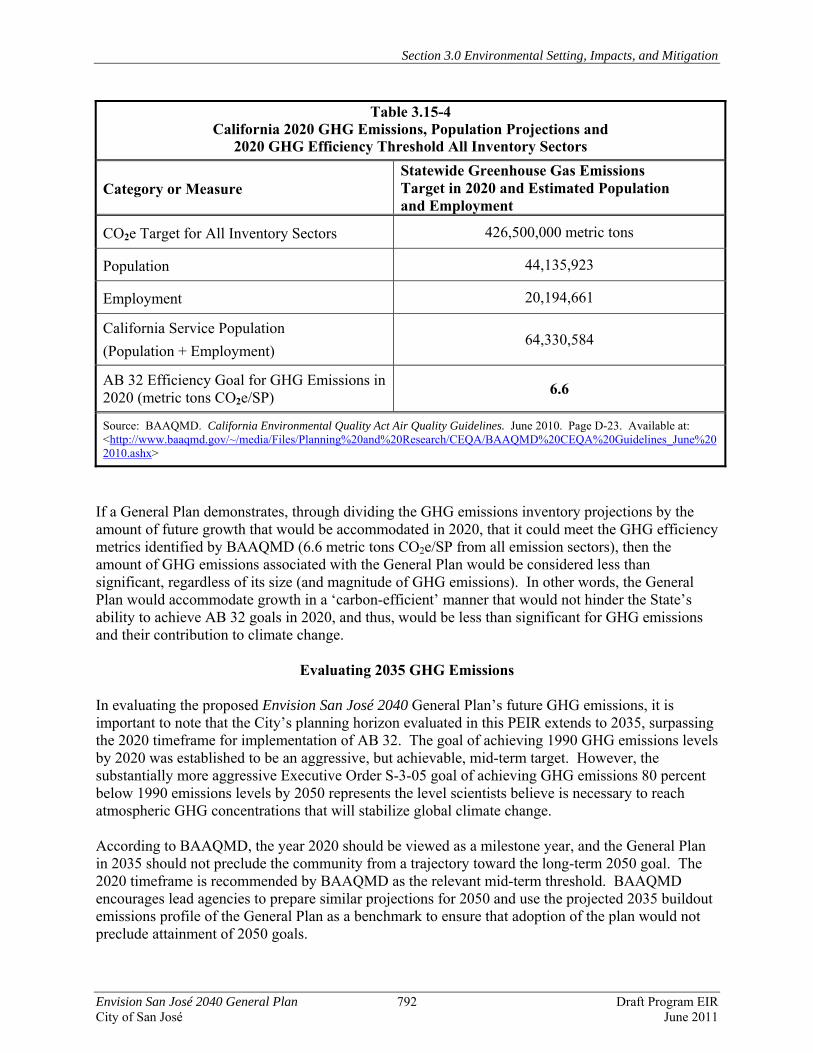
Section 3.0 Environmental Setting, Impacts, and Mitigation
Envision San José 2040 General Plan 792 Draft Program EIR City of San José June 2011
Table 3.15-4 California 2020 GHG Emissions, Population Projections and
2020 GHG Efficiency Threshold All Inventory Sectors
Category or Measure Statewide Greenhouse Gas Emissions Target in 2020 and Estimated Population and Employment
CO2e Target for All Inventory Sectors 426,500,000 metric tons
Population 44,135,923
Employment 20,194,661
California Service Population (Population + Employment)
64,330,584
AB 32 Efficiency Goal for GHG Emissions in 2020 (metric tons CO2e/SP) 6.6
Source: BAAQMD. California Environmental Quality Act Air Quality Guidelines. June 2010. Page D-23. Available at: <http://www.baaqmd.gov/~/media/Files/Planning%20and%20Research/CEQA/BAAQMD%20CEQA%20Guidelines_June%202010.ashx>
If a General Plan demonstrates, through dividing the GHG emissions inventory projections by the amount of future growth that would be accommodated in 2020, that it could meet the GHG efficiency metrics identified by BAAQMD (6.6 metric tons CO2e/SP from all emission sectors), then the amount of GHG emissions associated with the General Plan would be considered less than significant, regardless of its size (and magnitude of GHG emissions). In other words, the General Plan would accommodate growth in a ‘carbon-efficient’ manner that would not hinder the State’s ability to achieve AB 32 goals in 2020, and thus, would be less than significant for GHG emissions and their contribution to climate change.
Evaluating 2035 GHG Emissions In evaluating the proposed Envision San José 2040 General Plan’s future GHG emissions, it is important to note that the City’s planning horizon evaluated in this PEIR extends to 2035, surpassing the 2020 timeframe for implementation of AB 32. The goal of achieving 1990 GHG emissions levels by 2020 was established to be an aggressive, but achievable, mid-term target. However, the substantially more aggressive Executive Order S-3-05 goal of achieving GHG emissions 80 percent below 1990 emissions levels by 2050 represents the level scientists believe is necessary to reach atmospheric GHG concentrations that will stabilize global climate change. According to BAAQMD, the year 2020 should be viewed as a milestone year, and the General Plan in 2035 should not preclude the community from a trajectory toward the long-term 2050 goal. The 2020 timeframe is recommended by BAAQMD as the relevant mid-term threshold. BAAQMD encourages lead agencies to prepare similar projections for 2050 and use the projected 2035 buildout emissions profile of the General Plan as a benchmark to ensure that adoption of the plan would not preclude attainment of 2050 goals.
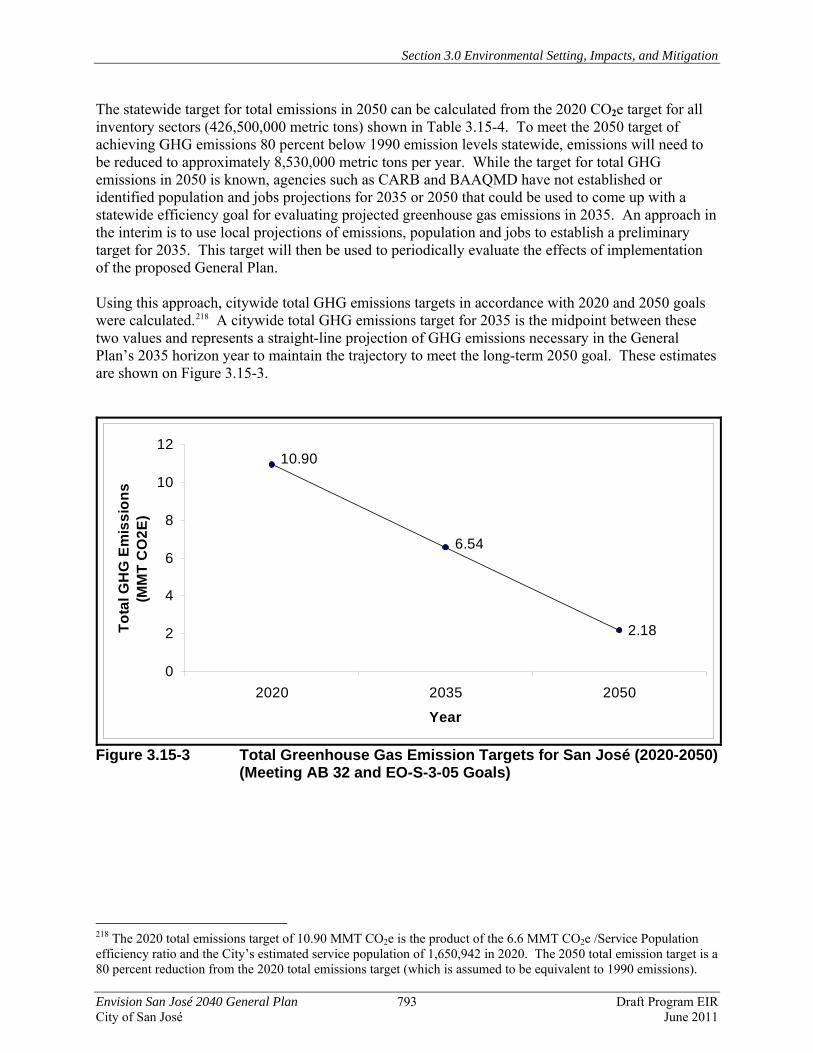
Section 3.0 Environmental Setting, Impacts, and Mitigation
Envision San José 2040 General Plan 793 Draft Program EIR City of San José June 2011
The statewide target for total emissions in 2050 can be calculated from the 2020 CO2e target for all inventory sectors (426,500,000 metric tons) shown in Table 3.15-4. To meet the 2050 target of achieving GHG emissions 80 percent below 1990 emission levels statewide, emissions will need to be reduced to approximately 8,530,000 metric tons per year. While the target for total GHG emissions in 2050 is known, agencies such as CARB and BAAQMD have not established or identified population and jobs projections for 2035 or 2050 that could be used to come up with a statewide efficiency goal for evaluating projected greenhouse gas emissions in 2035. An approach in the interim is to use local projections of emissions, population and jobs to establish a preliminary target for 2035. This target will then be used to periodically evaluate the effects of implementation of the proposed General Plan. Using this approach, citywide total GHG emissions targets in accordance with 2020 and 2050 goals were calculated.218 A citywide total GHG emissions target for 2035 is the midpoint between these two values and represents a straight-line projection of GHG emissions necessary in the General Plan’s 2035 horizon year to maintain the trajectory to meet the long-term 2050 goal. These estimates are shown on Figure 3.15-3.
2.18
10.90
6.54
0
2
4
6
8
10
12
2020 2035 2050
Year
Tota
l GH
G E
mis
sion
s (M
MT
CO
2E)
Figure 3.15-3 Total Greenhouse Gas Emission Targets for San José (2020-2050)
(Meeting AB 32 and EO-S-3-05 Goals)
218 The 2020 total emissions target of 10.90 MMT CO2e is the product of the 6.6 MMT CO2e /Service Population efficiency ratio and the City’s estimated service population of 1,650,942 in 2020. The 2050 total emission target is a 80 percent reduction from the 2020 total emissions target (which is assumed to be equivalent to 1990 emissions).
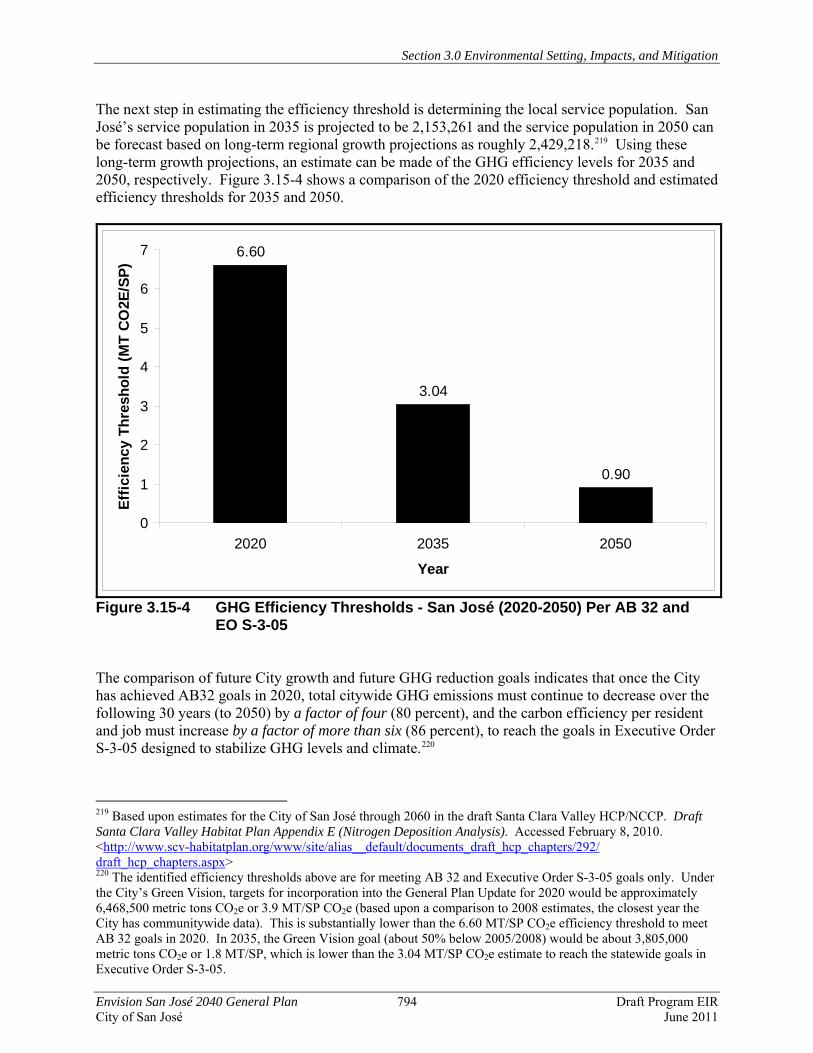
Section 3.0 Environmental Setting, Impacts, and Mitigation
Envision San José 2040 General Plan 794 Draft Program EIR City of San José June 2011
The next step in estimating the efficiency threshold is determining the local service population. San José’s service population in 2035 is projected to be 2,153,261 and the service population in 2050 can be forecast based on long-term regional growth projections as roughly 2,429,218.219 Using these long-term growth projections, an estimate can be made of the GHG efficiency levels for 2035 and 2050, respectively. Figure 3.15-4 shows a comparison of the 2020 efficiency threshold and estimated efficiency thresholds for 2035 and 2050.
6.60
3.04
0.90
0
1
2
3
4
5
6
7
2020 2035 2050
Year
Effic
ienc
y Th
resh
old
(MT
CO
2E/S
P)
Figure 3.15-4 GHG Efficiency Thresholds - San José (2020-2050) Per AB 32 and
EO S-3-05 The comparison of future City growth and future GHG reduction goals indicates that once the City has achieved AB32 goals in 2020, total citywide GHG emissions must continue to decrease over the following 30 years (to 2050) by a factor of four (80 percent), and the carbon efficiency per resident and job must increase by a factor of more than six (86 percent), to reach the goals in Executive Order S-3-05 designed to stabilize GHG levels and climate.220
219 Based upon estimates for the City of San José through 2060 in the draft Santa Clara Valley HCP/NCCP. Draft Santa Clara Valley Habitat Plan Appendix E (Nitrogen Deposition Analysis). Accessed February 8, 2010. <http://www.scv-habitatplan.org/www/site/alias__default/documents_draft_hcp_chapters/292/ draft_hcp_chapters.aspx> 220 The identified efficiency thresholds above are for meeting AB 32 and Executive Order S-3-05 goals only. Under the City’s Green Vision, targets for incorporation into the General Plan Update for 2020 would be approximately 6,468,500 metric tons CO2e or 3.9 MT/SP CO2e (based upon a comparison to 2008 estimates, the closest year the City has communitywide data). This is substantially lower than the 6.60 MT/SP CO2e efficiency threshold to meet AB 32 goals in 2020. In 2035, the Green Vision goal (about 50% below 2005/2008) would be about 3,805,000 metric tons CO2e or 1.8 MT/SP, which is lower than the 3.04 MT/SP CO2e estimate to reach the statewide goals in Executive Order S-3-05.
Section 3.0 Environmental Setting, Impacts, and Mitigation
Envision San José 2040 General Plan 795 Draft Program EIR City of San José June 2011
It is important to note that it may be appropriate to revise the efficiency thresholds for 2035 and 2050 either upward or downward as more and better information on statewide population and economic growth becomes available. The efficiency thresholds identified above represent a good faith effort at estimating efficiencies that will be required to meet the goals in Executive Order S-3-05.
Comparing Projected Emissions to Future Goals (vs. Existing Conditions)
In the following analysis, future GHG emissions are evaluated in terms of the requirements of AB 32 and EO S-3-05. Accordingly, the GHG emissions attributable to existing and future sources within San José are being compared to desired future levels of emissions. This is a significant departure from the traditional impacts analysis under CEQA, as recently discussed and confirmed by the California Supreme Court in Communities for a Better Environment v. So. Coast Air Quality. The normal approach is to establish an existing environmental baseline condition and identify the incremental change (i.e., additional vehicle trips, additional pollutant emissions, increased noise, etc.) associated with the project being studied, and measure that change against an established significance threshold. Typically, if the resulting environmental change, determined by comparing the ‘project’ condition against existing conditions, exceeds the applicable threshold, a significant impact is reported. In essence, under CEQA, a project’s impacts are based on the magnitude of change from existing conditions. However, the Plan-level GHG emissions per service population methodology adopted by BAAQMD for assessing a comprehensive General Plan’s contribution to future GHG emissions involves a fundamentally different analysis in that a Plan’s emissions are compared to desired future levels, in 2020 and 2035 (based on a straight-line projection to 2050). In this analytical approach, the City’s existing GHG emissions are of secondary importance. The primary focus is a comparison of the City’s future GHG emissions against future statewide ‘carbon-efficiency’ targets. The City’s existing GHG emissions become relevant in identifying how ‘carbon-efficient’ the City is at the moment, and how much more carbon-efficient the City may need to become over time. In this analysis, determining the significance of the General Plan’s forecast GHG emissions (e.g., whether they are cumulatively considerable or not), and if significant, the magnitude of GHG emissions reduction necessary to reduce the impact, depends on the comparison of future conditions (2020 and 2035 GHG emissions under the proposed General Plan) and whether they would: 1) exceed the AB32 emissions goal; and 2) be on a trajectory to meet EO S-3-05 emissions levels, respectively. Greenhouse gas emissions impact analysis therefore presents an atypical circumstance under CEQA. At the same time the City and the State as a whole anticipate substantial new population and employment growth, statewide aggregate emissions must be reduced substantially from existing levels. Therefore, maintaining current GHG emissions levels (i.e., no net change from existing conditions) is insufficient to meet state mandates; rather the ‘environment’ in terms of atmospheric concentrations of GHG must improve compared to baseline conditions. Normally, a project that maintained the status quo would be judged under CEQA to have no adverse impact, however, in this case the expectation is that General Plans and other long-term comprehensive planning efforts will serve to actually improve existing environmental conditions by causing a net reduction in emissions by 2020 and continuing to substantially reduce GHG emissions into the future to meet 2050 goals.
Projected GHG Emissions
The best estimates of future GHG emissions under the proposed General Plan have been made taking into account current and reasonably foreseeable technological advances (i.e., vehicle efficiency
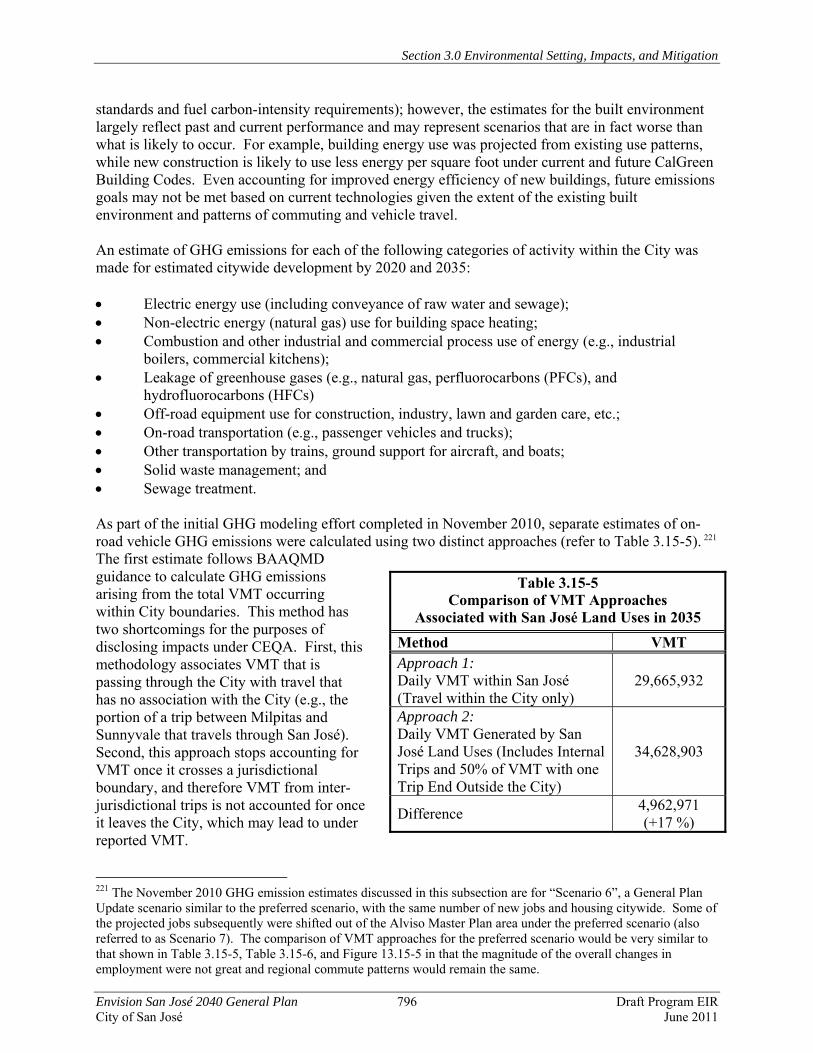
Section 3.0 Environmental Setting, Impacts, and Mitigation
Envision San José 2040 General Plan 796 Draft Program EIR City of San José June 2011
standards and fuel carbon-intensity requirements); however, the estimates for the built environment largely reflect past and current performance and may represent scenarios that are in fact worse than what is likely to occur. For example, building energy use was projected from existing use patterns, while new construction is likely to use less energy per square foot under current and future CalGreen Building Codes. Even accounting for improved energy efficiency of new buildings, future emissions goals may not be met based on current technologies given the extent of the existing built environment and patterns of commuting and vehicle travel. An estimate of GHG emissions for each of the following categories of activity within the City was made for estimated citywide development by 2020 and 2035: • Electric energy use (including conveyance of raw water and sewage); • Non-electric energy (natural gas) use for building space heating; • Combustion and other industrial and commercial process use of energy (e.g., industrial
boilers, commercial kitchens); • Leakage of greenhouse gases (e.g., natural gas, perfluorocarbons (PFCs), and
hydrofluorocarbons (HFCs) • Off-road equipment use for construction, industry, lawn and garden care, etc.; • On-road transportation (e.g., passenger vehicles and trucks); • Other transportation by trains, ground support for aircraft, and boats; • Solid waste management; and • Sewage treatment. As part of the initial GHG modeling effort completed in November 2010, separate estimates of on-road vehicle GHG emissions were calculated using two distinct approaches (refer to Table 3.15-5). 221 The first estimate follows BAAQMD guidance to calculate GHG emissions arising from the total VMT occurring within City boundaries. This method has two shortcomings for the purposes of disclosing impacts under CEQA. First, this methodology associates VMT that is passing through the City with travel that has no association with the City (e.g., the portion of a trip between Milpitas and Sunnyvale that travels through San José). Second, this approach stops accounting for VMT once it crosses a jurisdictional boundary, and therefore VMT from inter-jurisdictional trips is not accounted for once it leaves the City, which may lead to under reported VMT. 221 The November 2010 GHG emission estimates discussed in this subsection are for “Scenario 6”, a General Plan Update scenario similar to the preferred scenario, with the same number of new jobs and housing citywide. Some of the projected jobs subsequently were shifted out of the Alviso Master Plan area under the preferred scenario (also referred to as Scenario 7). The comparison of VMT approaches for the preferred scenario would be very similar to that shown in Table 3.15-5, Table 3.15-6, and Figure 13.15-5 in that the magnitude of the overall changes in employment were not great and regional commute patterns would remain the same.
Table 3.15-5 Comparison of VMT Approaches
Associated with San José Land Uses in 2035 Method VMT Approach 1: Daily VMT within San José (Travel within the City only)
29,665,932
Approach 2: Daily VMT Generated by San José Land Uses (Includes Internal Trips and 50% of VMT with one Trip End Outside the City)
34,628,903
Difference 4,962,971 (+17 %)

Section 3.0 Environmental Setting, Impacts, and Mitigation
Envision San José 2040 General Plan 797 Draft Program EIR City of San José June 2011
The second approach used to estimate on-road vehicle GHG emissions is based on VMT generated by City land uses, both within and outside the City boundary. Emissions estimated on the basis of City-Generated VMT provide a better representation of the on-road vehicle activity over which an individual city has jurisdictional responsibility in that it reflects the VMT associated with the land uses in the City. For purposes of CEQA, City-generated VMT provides a more direct estimate of the impacts attributable to the project. As discussed in Section 3.2 Transportation, VMT was estimated and allocated to the City of San José using the following methodology:
• Internal-internal: All daily trips made entirely within the San José City limits (trips traveling from San José to San José).
• One-half of internal-external: One-half of daily trips with an origin within San José City
limits and a destination outside of San José (trips traveling from San José to other locations). This assumes that San José shares half the responsibility for VMT from trips traveling to other municipalities.
• One-half of external-internal: One-half of daily trips with an origin outside of San José
City limits and destination within San José (trips traveling from other locations to San José). Similar to internal-external trips, San José shares half of the responsibility for VMT from trips traveling from other jurisdictions.
• External-external: Trips that travel through the City (trips traveling from other locations to
other locations), with no origin or destination within San José, are not included in Approach 2. These are trips that are not directly influenced by land use decisions in the City of San José.
VMT estimated using the latter approach (City-Generated) was roughly 17 percent higher than using the former approach (within City travel), and was the basis for the Mobile Sources emissions included in the emissions inventories discussed below. It must be kept in mind this methodology attributes one half (50 percent) of the inter-jurisdictional (internal-external trips, not pass-through) VMT to San José, and the remaining 50 percent of the inter-jurisdictional VMT emissions assigned to other jurisdictions are nonetheless occurring in the environment and contributing to climate change. Table 3.15-6 discloses the total VMT associated with the proposed General Plan occurring in the environment, including the 50 percent VMT (which have associated GHG emissions) assumed to be the responsibility of other jurisdictions sharing inter-jurisdictional trips with San José.
Table 3.15-6 Envision San José 2040 General Plan Total Estimated VMT
Associated with San José Land Uses in 2035 Method VMT Daily VMT Generated by San José (Includes Internal Trips and 50% of VMT with one Trip End Outside City)
34,628,903
50% of VMT with one Trip End Outside City (Non-San José Responsibility)
21,495,006
Total Environmental VMT from implementation of the Envision San José 2040 General Plan
56,123,908

Section 3.0 Environmental Setting, Impacts, and Mitigation
Envision San José 2040 General Plan 798 Draft Program EIR City of San José June 2011
For informational purposes, the proportion of total VMT that consists of internal trips versus internal-external trips is shown in Figure 3.15-5, below.
42,990,010
24,608,508
13,133,898
7,502,723
0
10
20
30
40
50
60
2008 2035
Year
Vehi
cle
Mile
s Tr
avel
led
(mill
ions
)
Internal - External Trips I-E Internal Trips I-I
Figure 3.15-5 Total Estimated VMT Associated with Land Uses Based upon the assumptions used in the transportation model, the relative amount of VMT for travel within the City (e.g., internalization of trips), would not substantially change. 3.15.4.2 Projected Total San José GHG Emissions in 2020 Modeling based on proposed General Plan growth for 2020 suggests the City will emit approximately 10.3 MMT, or approximately 600 metric tons of CO2e annually below the AB 32 emission level target based on service population. The largest contributing category is mobile sources, which are primarily on-road vehicles. Mobile sources also include off-road vehicles and equipment such as trains and construction and lawn/garden equipment. The second largest category that generates GHG emissions includes a diverse range of electricity use, combustion and other processes used throughout the City by industrial and commercial facilities. This varied set of sources, as defined in the BAAQMD inventory for Santa Clara County, includes: commercial cooking (e.g., restaurants, cafes), ozone depleting substance substitutes (e.g., hydrofluorocarbons (HFCs) and perfluorocarbons (PFCs), natural gas distribution, reciprocating engines (e.g., emergency generator engines), combustion gas turbines (i.e., not used for electric energy generation to the grid), major and minor natural gas combustion sources, and combustion by other fuels (i.e., again, not for electric energy generation to the grid). The third largest source of GHG emissions is residential energy use, including both electric energy and natural gas consumption. Dividing the total emissions by the City’s 2020 service population yields an average carbon-efficiency of 6.2 MT/SP, or roughly six percent below the efficiency standard of 6.6 MT/SP necessary to achieve statewide AB 32 goals. However, it is important to note that in this case the estimates of the City’s future GHG emissions largely reflect past and current performance and may
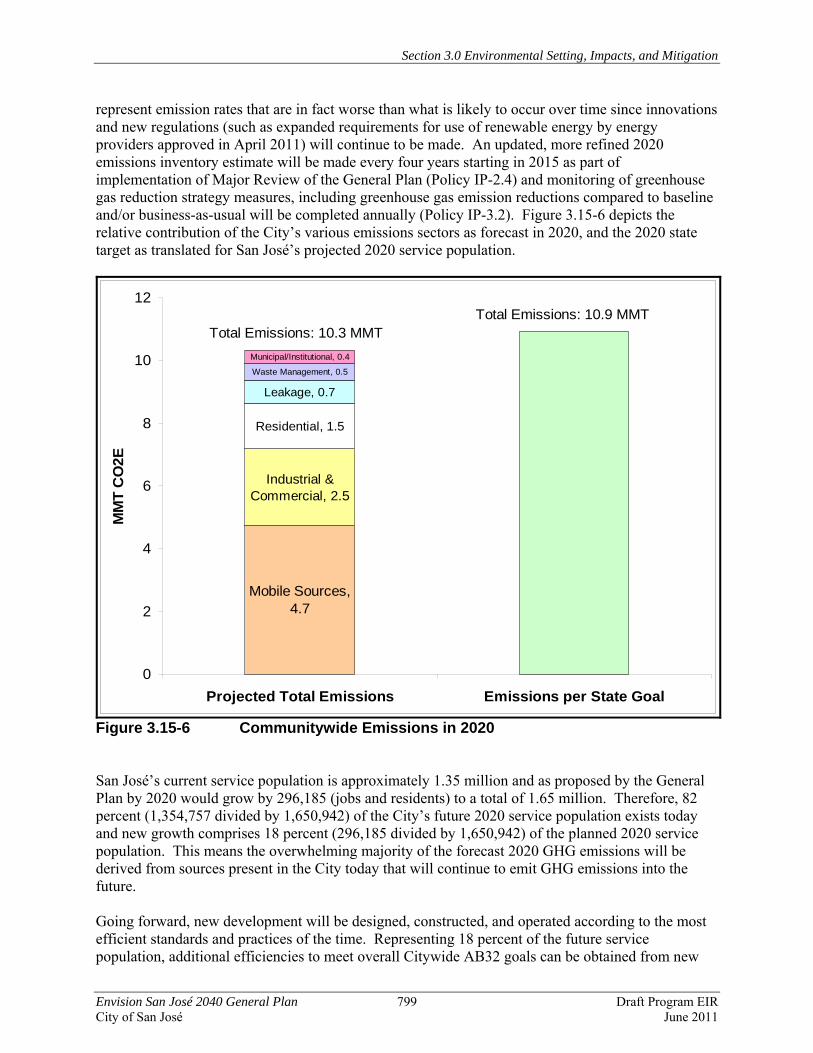
Section 3.0 Environmental Setting, Impacts, and Mitigation
Envision San José 2040 General Plan 799 Draft Program EIR City of San José June 2011
represent emission rates that are in fact worse than what is likely to occur over time since innovations and new regulations (such as expanded requirements for use of renewable energy by energy providers approved in April 2011) will continue to be made. An updated, more refined 2020 emissions inventory estimate will be made every four years starting in 2015 as part of implementation of Major Review of the General Plan (Policy IP-2.4) and monitoring of greenhouse gas reduction strategy measures, including greenhouse gas emission reductions compared to baseline and/or business-as-usual will be completed annually (Policy IP-3.2). Figure 3.15-6 depicts the relative contribution of the City’s various emissions sectors as forecast in 2020, and the 2020 state target as translated for San José’s projected 2020 service population.
Mobile Sources, 4.7
Residential, 1.5
Municipal/Institutional, 0.4
Industrial & Commercial, 2.5
Leakage, 0.7
Waste Management, 0.5
0
2
4
6
8
10
12
Projected Total Emissions Emissions per State Goal
MM
T C
O2E
Total Emissions: 10.3 MMTTotal Emissions: 10.9 MMT
Figure 3.15-6 Communitywide Emissions in 2020 San José’s current service population is approximately 1.35 million and as proposed by the General Plan by 2020 would grow by 296,185 (jobs and residents) to a total of 1.65 million. Therefore, 82 percent (1,354,757 divided by 1,650,942) of the City’s future 2020 service population exists today and new growth comprises 18 percent (296,185 divided by 1,650,942) of the planned 2020 service population. This means the overwhelming majority of the forecast 2020 GHG emissions will be derived from sources present in the City today that will continue to emit GHG emissions into the future. Going forward, new development will be designed, constructed, and operated according to the most efficient standards and practices of the time. Representing 18 percent of the future service population, additional efficiencies to meet overall Citywide AB32 goals can be obtained from new
Section 3.0 Environmental Setting, Impacts, and Mitigation
Envision San José 2040 General Plan 800 Draft Program EIR City of San José June 2011
development (residential, commercial, industrial and institutional) occurring in the City between 2010 and 2020. Larger emission reductions to meet the 2020 target may also accrue from making the existing service population more ‘carbon-efficient’ and making existing homes and businesses more carbon-efficient. San José’s service population in 2020 is projected to be approximately 1,650,942, consisting of 1,047,115 residents and 471,670 jobs (refer to Table 3.15-3). Therefore, to be as efficient as necessary to meet AB 32 goals, the City’s gross aggregate GHG emissions should not exceed 10.9 MMT, determined by multiplying the service population by the efficiency standard. (1,650,942 SP X 6.6 MT COe2/SP/yr = 10.9 MMT). The projected communitywide emissions in 2020 would be below this standard since projected annual emissions are 10.3 MMT.
Proposed General Plan Policies That Reduce or Avoid Impacts
From GHG Emissions by 2020 The City’s Greenhouse Gas Reduction Strategy is embedded in its policies and programs that are designed to help the City sustain its natural resources, grow efficiently, and meet state legal requirements for greenhouse gas (GHG) emissions reduction. Multiple policies and actions in the proposed General Plan have greenhouse gas implications, including land use, housing, transportation, water usage, solid waste generation and recycling, and reuse of historic buildings. The City’s Green Vision, as reflected in these policies, also has a monitoring component that allows for adaptation and adjustment of City programs and initiatives related to sustainability and associated reductions in greenhouse gas emissions. Proposed General Plan Policies that will reduce greenhouse gas emissions from transportation and the built environment in San José are listed in Table K-1 in Appendix K of this PEIR. Greenhouse Gas Reduction Strategy The Envision San José 2040 General Plan includes a range of policies and actions that are known to reduce GHG emissions. It also provides for and commits the City to the implementation of an integrated Greenhouse Gas Reduction Strategy that contains overall performance criteria against which the City’s future actions can be evaluated (refer to Appendix K). More specific performance criteria than the policies in the General Plan will be included in a GHG Reduction City Council Policy proposed to be initially considered for adoption by December 2011 to assist in interpreting and implementing the City’s strategy. Other policies, such as Green Building Policies, may also be developed or incorporated in the Council Policy to ensure that new development and redevelopment incorporates design and operational characteristics in conformance with the strategy. Implementation of the Greenhouse Gas Reduction Strategy will be an ongoing adaptive management process, whereby opportunities to reduce GHG emissions will be evaluated and selected based on a variety of factors, including available technology, relative cost, and policy preferences, among others. For new compact development, which is located near transit and contains a mix of uses that promote walkability and bicycle transport, City transportation staff estimates that GHG emissions from mobile sources could be reduced by approximately 10 percent compared to business as usual due to increased use of alternative travel modes, including bicycle, transit, and pedestrian travel. Other measures directed toward reducing GHG emissions from energy use in the existing residential, commercial, industrial and municipal sectors (such as increased use of renewable energy sources,
Section 3.0 Environmental Setting, Impacts, and Mitigation
Envision San José 2040 General Plan 801 Draft Program EIR City of San José June 2011
installation of solar hot water systems) would have variable effects compared to business as usual by 2020 (refer to comparison Table K-1 in Appendix K). Impact GHG-1: The City’s projected 2020 GHG emissions will be below the average carbon-
efficiency standard necessary to meet statewide 2020 goals as established by AB 32. Implementation of the proposed General Plan through 2020 would not constitute a cumulatively considerable contribution to global climate change. (Less Than Significant Impact)
3.15.4.3 Projected Total San José GHG Emissions in 2035 San José’s service population in 2035 is projected to be approximately 2,153,261, consisting of 1,313,811 residents and 839,450 jobs. As explained above, EO S-3-05 established a goal to reduce GHG emissions to 80 percent below 1990 levels by 2050, so halfway to that goal in 2035 would be 40 percent below 1990 levels. Therefore, to be as efficient as necessary to maintain a trajectory to meet mandated 2050 levels, the City’s 2035 GHG target is 6.54 MMT, 40 percent below the 2020 target of 10.9 MMT (refer to Figure 3.15-3). This can also be calculated by multiplying the service population by the interpolated 2035 efficiency standard (2,153,261 SP X 3.04 MT CO2e/SP/yr = 6.54 MMT). Modeling based on proposed General Plan growth for 2035 suggests the City will emit approximately 14.4 MMT CO2e, or 7.9 MMT more than emission levels necessary to maintain a trajectory toward 2050 state goals. Dividing the total emissions by the City’s 2035 service population yields an average carbon-efficiency of 6.7 MT/SP, roughly 2.2 times the interpolated 2035 statewide efficiency standard of 3.04 MT CO2e /SP necessary to maintain a trajectory to achieve the state’s 2050 goals. Figure 3.15-7 shows the relative contribution of the City’s various emissions sectors, and the emission reduction necessary to maintain a trajectory to meet the 2050 state target, as translated for San José’s projected 2035 service population. As with the 2020 inventory, the largest contributing category in 2035 is mobile sources, followed by industrial and commercial facilities, and residential energy use.
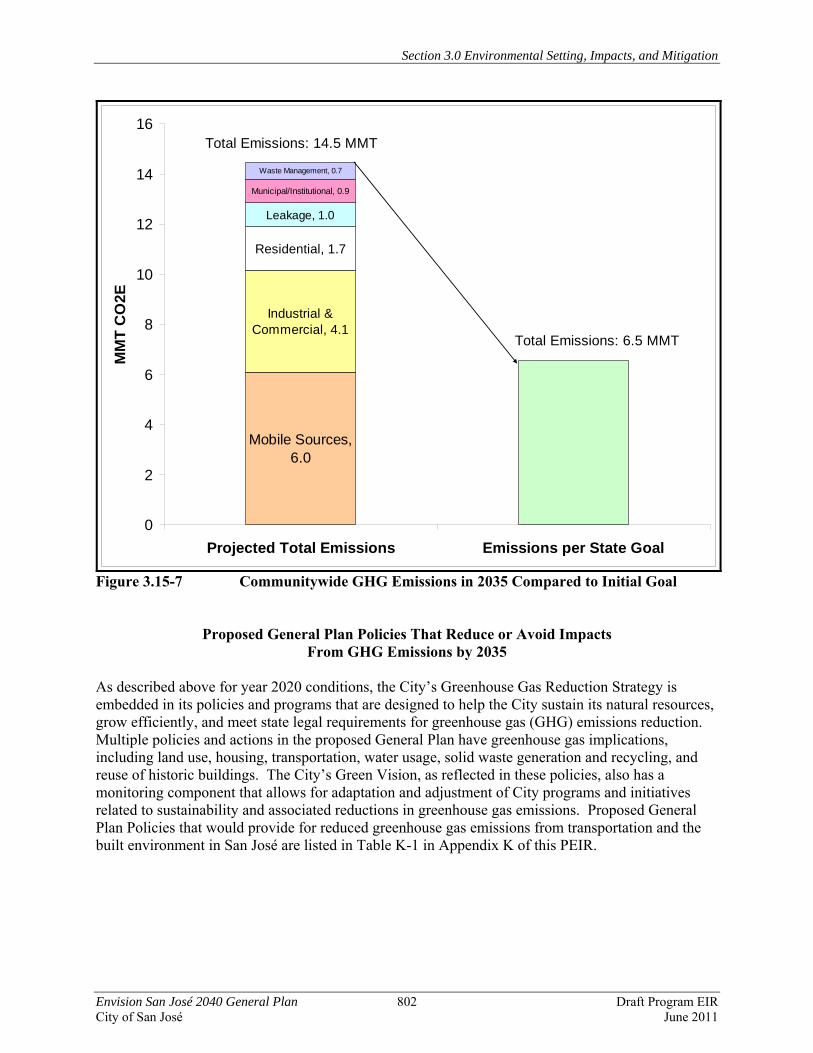
Section 3.0 Environmental Setting, Impacts, and Mitigation
Envision San José 2040 General Plan 802 Draft Program EIR City of San José June 2011
Industrial & Commercial, 4.1
Residential, 1.7
Leakage, 1.0
Mobile Sources, 6.0
Municipal/Institutional, 0.9
Waste Management, 0.7
0
2
4
6
8
10
12
14
16
Projected Total Emissions Emissions per State Goal
MM
T C
O2E
Total Emissions: 6.5 MMT
Total Emissions: 14.5 MMT
Figure 3.15-7 Communitywide GHG Emissions in 2035 Compared to Initial Goal
Proposed General Plan Policies That Reduce or Avoid Impacts
From GHG Emissions by 2035 As described above for year 2020 conditions, the City’s Greenhouse Gas Reduction Strategy is embedded in its policies and programs that are designed to help the City sustain its natural resources, grow efficiently, and meet state legal requirements for greenhouse gas (GHG) emissions reduction. Multiple policies and actions in the proposed General Plan have greenhouse gas implications, including land use, housing, transportation, water usage, solid waste generation and recycling, and reuse of historic buildings. The City’s Green Vision, as reflected in these policies, also has a monitoring component that allows for adaptation and adjustment of City programs and initiatives related to sustainability and associated reductions in greenhouse gas emissions. Proposed General Plan Policies that would provide for reduced greenhouse gas emissions from transportation and the built environment in San José are listed in Table K-1 in Appendix K of this PEIR.
Section 3.0 Environmental Setting, Impacts, and Mitigation
Envision San José 2040 General Plan 803 Draft Program EIR City of San José June 2011
Existing Regulations and Adopted Plans and Policies Existing federal, state and local laws, regulations, and programs that would reduce greenhouse gas emissions through increased energy efficiency, emission controls or reduced vehicle travel include: • National Energy Policy • Federal EnergyStarTM Program • California Building Energy Efficiency Standards (Title 24 California Code of Regulations • AB 32 Climate Change Scoping Plan and associated programs of the California Energy
Commission and California Public Utilities Commission • City of San José Building Codes (including CALGreen) and Green Building regulations • City of San José Water Efficient Landscape Standards for New And Rehabilitated
Landscaping • AB 32 Climate Change Scoping Plan and associated regulatory programs of the California
ARB222 • California Senate Bill 375 – Redesigning Communities to Reduce Greenhouse Gases Discussion of San José GHG Emissions Impacts in 2035 In applying the state’s future carbon-efficiency goals to the City’s projected service population in 2035, the City’s identifies a target for GHG emissions for 2035. To reduce GHG emissions in the mid-term (through 2020 to meet AB 32 targets) and to move toward bridging the gap between estimated 2035 GHG emissions and what is considered necessary to meet 2050 goals for the State of California, the General Plan includes a program-level Greenhouse Gas Reduction Strategy that provides the framework for implementing measures within the City’s purview and control. The Greenhouse Gas Reduction Strategy consists of a phased approach to build upon existing GHG emission inventories and projects, refine and improve reduction strategies, and confirm that the City is on track to first meet targets per AB 32 and then move progressively towards meeting the more aggressive goal of a 40 percent reduction in 2035 GHG emissions compared to a 1990 baseline. Measures are identified in this inaugural version of the Greenhouse Gas Reduction Strategy, such as beneficially re-using 100 percent of the City’s wastewater, and reductions in Vehicle Miles Traveled (VMT) from a more compact development pattern, could result in GHG emission reductions of approximately 1.2 MMT beyond the business-as-usual emissions estimated for 2035 (refer to Table 3.15-7). The emission reductions identified at this time, however, are well below those needed to meet the 3.04 MT CO2e/SP efficiency metric. As noted previously, given that much of built environment currently in place will likely remain in 2035, “retrofit” measures beyond the efficiencies of proposed new compact and transit oriented development will be needed.
222 As previously noted, a San Francisco Superior Court order under Association of Irritated Residents et al. v. CARB (March 2010) requires the California Air Resources Board to complete additional environmental review before implementing the Cap-and-Trade Program outlined in the Climate Change Scoping Plan.
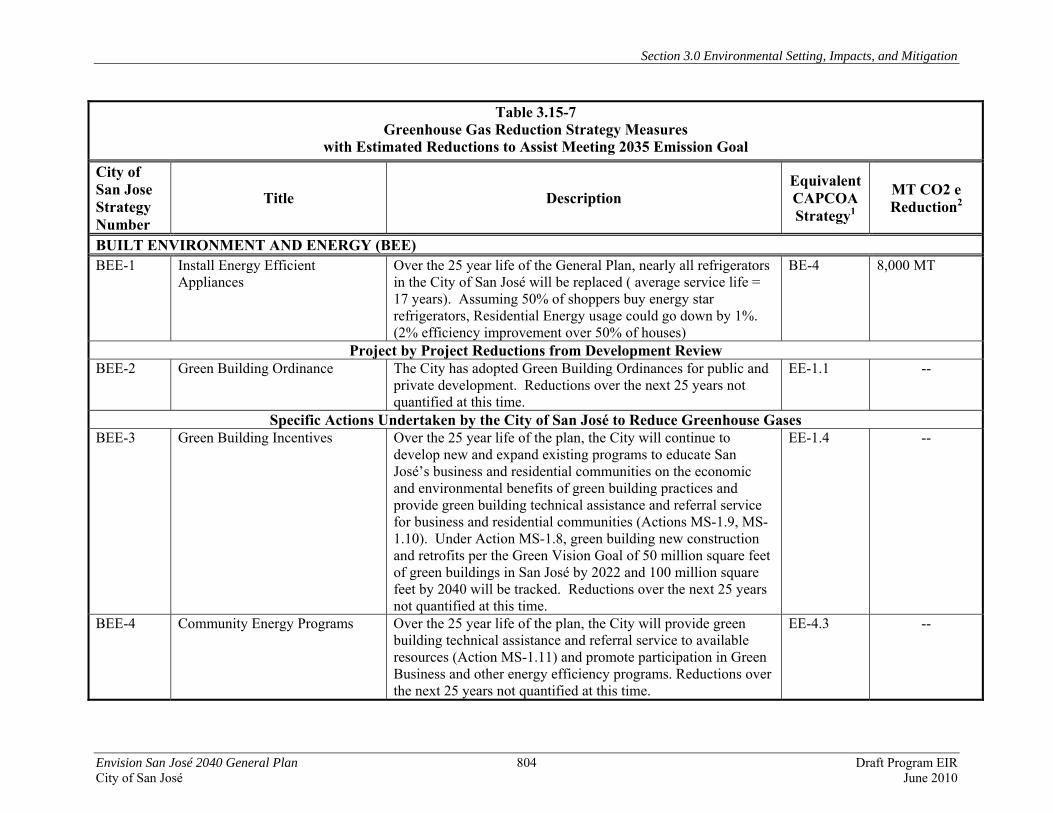
Section 3.0 Environmental Setting, Impacts, and Mitigation
Envision San José 2040 General Plan 804 Draft Program EIR City of San José June 2010
Table 3.15-7 Greenhouse Gas Reduction Strategy Measures
with Estimated Reductions to Assist Meeting 2035 Emission Goal
City of San Jose Strategy Number
Title Description Equivalent CAPCOA Strategy1
MT CO2 e Reduction2
BUILT ENVIRONMENT AND ENERGY (BEE) BEE-1
Install Energy Efficient Appliances
Over the 25 year life of the General Plan, nearly all refrigerators in the City of San José will be replaced ( average service life = 17 years). Assuming 50% of shoppers buy energy star refrigerators, Residential Energy usage could go down by 1%. (2% efficiency improvement over 50% of houses)
BE-4 8,000 MT
Project by Project Reductions from Development ReviewBEE-2 Green Building Ordinance
The City has adopted Green Building Ordinances for public and private development. Reductions over the next 25 years not quantified at this time.
EE-1.1
--
Specific Actions Undertaken by the City of San José to Reduce Greenhouse GasesBEE-3 Green Building Incentives Over the 25 year life of the plan, the City will continue to
develop new and expand existing programs to educate San José’s business and residential communities on the economic and environmental benefits of green building practices and provide green building technical assistance and referral service for business and residential communities (Actions MS-1.9, MS-1.10). Under Action MS-1.8, green building new construction and retrofits per the Green Vision Goal of 50 million square feet of green buildings in San José by 2022 and 100 million square feet by 2040 will be tracked. Reductions over the next 25 years not quantified at this time.
EE-1.4 --
BEE-4 Community Energy Programs Over the 25 year life of the plan, the City will provide green building technical assistance and referral service to available resources (Action MS-1.11) and promote participation in Green Business and other energy efficiency programs. Reductions over the next 25 years not quantified at this time.
EE-4.3 --
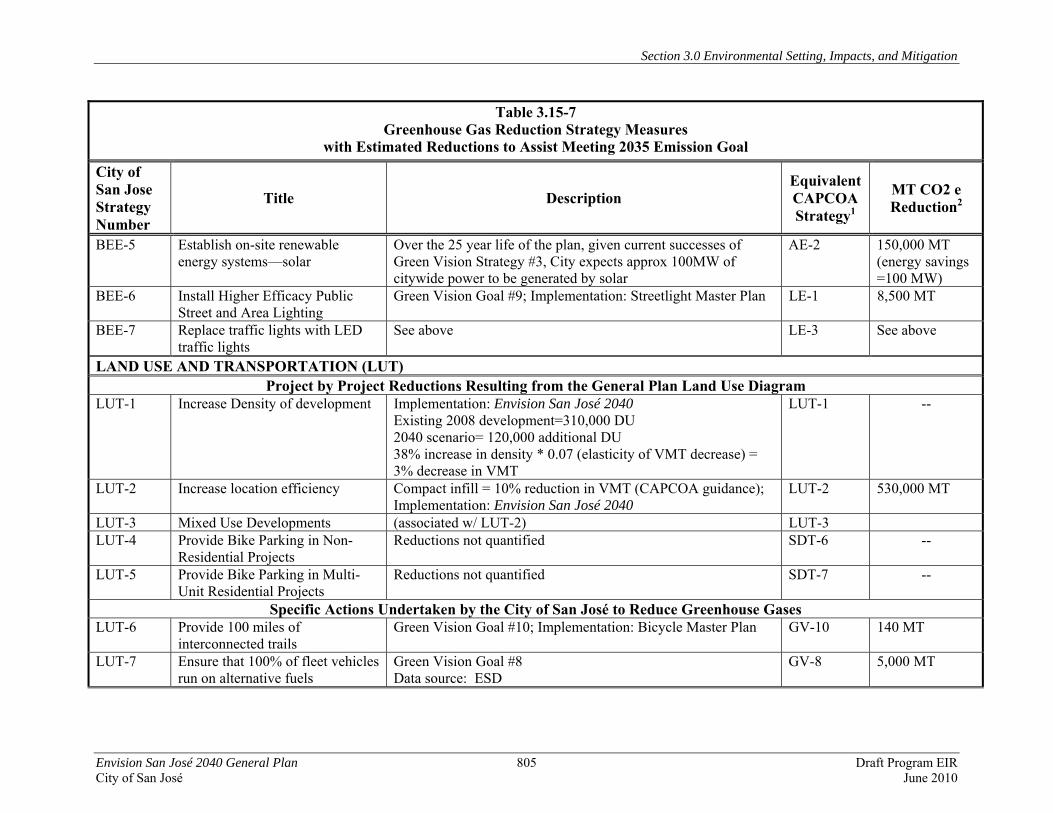
Section 3.0 Environmental Setting, Impacts, and Mitigation
Envision San José 2040 General Plan 805 Draft Program EIR City of San José June 2010
Table 3.15-7 Greenhouse Gas Reduction Strategy Measures
with Estimated Reductions to Assist Meeting 2035 Emission Goal
City of San Jose Strategy Number
Title Description Equivalent CAPCOA Strategy1
MT CO2 e Reduction2
BEE-5 Establish on-site renewable energy systems—solar
Over the 25 year life of the plan, given current successes of Green Vision Strategy #3, City expects approx 100MW of citywide power to be generated by solar
AE-2 150,000 MT (energy savings =100 MW)
BEE-6 Install Higher Efficacy Public Street and Area Lighting
Green Vision Goal #9; Implementation: Streetlight Master Plan LE-1 8,500 MT
BEE-7 Replace traffic lights with LED traffic lights
See above LE-3 See above
LAND USE AND TRANSPORTATION (LUT) Project by Project Reductions Resulting from the General Plan Land Use Diagram
LUT-1 Increase Density of development Implementation: Envision San José 2040 Existing 2008 development=310,000 DU 2040 scenario= 120,000 additional DU 38% increase in density * 0.07 (elasticity of VMT decrease) = 3% decrease in VMT
LUT-1 --
LUT-2 Increase location efficiency Compact infill = 10% reduction in VMT (CAPCOA guidance); Implementation: Envision San José 2040
LUT-2 530,000 MT
LUT-3 Mixed Use Developments (associated w/ LUT-2) LUT-3 LUT-4 Provide Bike Parking in Non-
Residential Projects Reductions not quantified SDT-6 --
LUT-5 Provide Bike Parking in Multi-Unit Residential Projects
Reductions not quantified SDT-7 --
Specific Actions Undertaken by the City of San José to Reduce Greenhouse GasesLUT-6 Provide 100 miles of
interconnected trails Green Vision Goal #10; Implementation: Bicycle Master Plan GV-10 140 MT
LUT-7 Ensure that 100% of fleet vehicles run on alternative fuels
Green Vision Goal #8 Data source: ESD
GV-8 5,000 MT
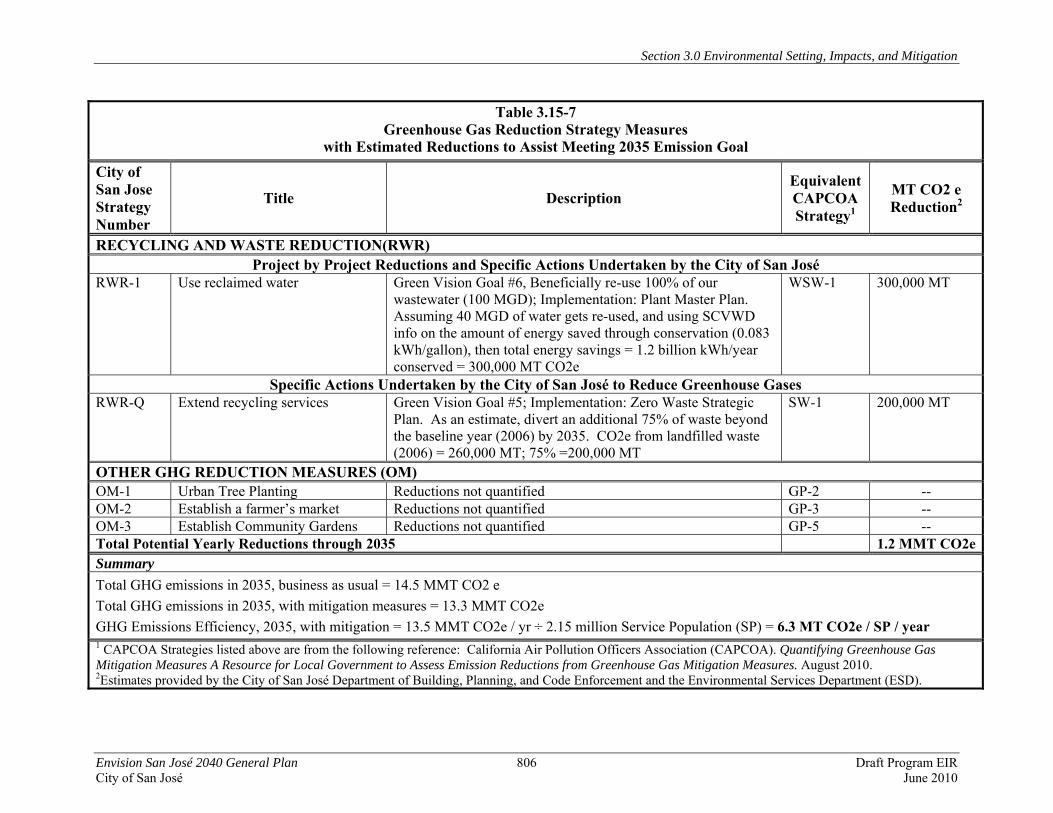
Section 3.0 Environmental Setting, Impacts, and Mitigation
Envision San José 2040 General Plan 806 Draft Program EIR City of San José June 2010
Table 3.15-7 Greenhouse Gas Reduction Strategy Measures
with Estimated Reductions to Assist Meeting 2035 Emission Goal
City of San Jose Strategy Number
Title Description Equivalent CAPCOA Strategy1
MT CO2 e Reduction2
RECYCLING AND WASTE REDUCTION(RWR) Project by Project Reductions and Specific Actions Undertaken by the City of San José
RWR-1 Use reclaimed water Green Vision Goal #6, Beneficially re-use 100% of our wastewater (100 MGD); Implementation: Plant Master Plan. Assuming 40 MGD of water gets re-used, and using SCVWD info on the amount of energy saved through conservation (0.083 kWh/gallon), then total energy savings = 1.2 billion kWh/year conserved = 300,000 MT CO2e
WSW-1 300,000 MT
Specific Actions Undertaken by the City of San José to Reduce Greenhouse GasesRWR-Q Extend recycling services Green Vision Goal #5; Implementation: Zero Waste Strategic
Plan. As an estimate, divert an additional 75% of waste beyond the baseline year (2006) by 2035. CO2e from landfilled waste (2006) = 260,000 MT; 75% =200,000 MT
SW-1 200,000 MT
OTHER GHG REDUCTION MEASURES (OM) OM-1 Urban Tree Planting Reductions not quantified GP-2 -- OM-2 Establish a farmer’s market Reductions not quantified GP-3 -- OM-3 Establish Community Gardens Reductions not quantified GP-5 -- Total Potential Yearly Reductions through 2035 1.2 MMT CO2eSummary Total GHG emissions in 2035, business as usual = 14.5 MMT CO2 e Total GHG emissions in 2035, with mitigation measures = 13.3 MMT CO2e GHG Emissions Efficiency, 2035, with mitigation = 13.5 MMT CO2e / yr ÷ 2.15 million Service Population (SP) = 6.3 MT CO2e / SP / year 1 CAPCOA Strategies listed above are from the following reference: California Air Pollution Officers Association (CAPCOA). Quantifying Greenhouse Gas Mitigation Measures A Resource for Local Government to Assess Emission Reductions from Greenhouse Gas Mitigation Measures. August 2010. 2Estimates provided by the City of San José Department of Building, Planning, and Code Enforcement and the Environmental Services Department (ESD).
Section 3.0 Environmental Setting, Impacts, and Mitigation
Envision San José 2040 General Plan 807 Draft Program EIR City of San José June 2011
Achieving the substantial emissions reductions needed beyond 2020 will require an aggressive multiple-pronged approach that includes policy decisions at the federal and state level and new and substantially advanced technologies that cannot be anticipated or predicted with any accuracy at this time. Policy and regulatory decisions by other agencies (such as the California ARB, PUC and California Energy Commission) and technological advances are outside the City’s control, and therefore cannot be relied upon as feasible mitigation strategies. Given the uncertainties about the feasibility of achieving the needed 2035 emissions reductions, the City’s contribution to greenhouse gas emissions and climate change for the 2035 timeframe is conservatively determined to be cumulatively considerable. Impact GHG-2: The City’s projected 2035 GHG emissions, without further reductions, would
constitute a cumulatively considerable contribution to global climate change by exceeding the average carbon-efficiency standard necessary to maintain a trajectory to meet statewide 2050 goals as established by Executive Order S-3-05. (Significant Impact)
3.15.5 Consistency with Plans and Programs 3.15.5.1 California Senate Bill 375 – Redesigning Communities to Reduce Greenhouse
Gases Under the requirements of SB 375, the MTC in partnership with ABAG will develop a Sustainable Community Strategy to achieve the Bay Area’s regional GHG reduction target, a process expected to continue through early 2013. The targets for the MTC in the San Francisco Bay Area adopted in September 2010 by CARB include a seven (7) percent reduction in greenhouse gases per capita from passenger vehicles by 2020 compared to emissions in 2005. The adopted target for 2035 is a 15 percent reduction per capita from passenger vehicles when compared to emissions in 2005. The emission reduction targets are for those associated with land use and transportation strategies, only. MTC anticipates that the adopted targets may be achieved through a more focused growth strategy and greater reliance on road pricing and other strategies. MTC recognizes that to achieve the 15 percent reduction target by 2035, more aggressive actions, such as road pricing (toll lanes), may be required.223 Given the current timing and schedule of SB 375 implementation and continued refinement of models for regional emission estimates in the Bay Area, it is not currently possible to fully evaluate the effectiveness of San José’s General Plan in terms of achieving its share of the seven to 15 percent passenger vehicle-related GHG emissions reductions required of the Bay Area’s future sustainable community strategy. As discussed in the Transportation section of this PEIR, however, future travel modeling results indicate that the General Plan’s land use mix and distribution, under a “business as usual” scenario, are not more ‘carbon-efficient’ than existing conditions in that modeled vehicle trips and VMT per ‘service population’ would increase in 2020 and 2035 compared to the City’s existing conditions. As discussed in Section 3.4 Air Quality, VMT per capita is projected to increase for a number of reasons. The proposed General Plan puts an emphasis on job growth to improve the City’s 223 California Air Resources Board. Staff Report Proposed Regional Greenhouse Gas Emission Reduction Targets For Automobiles and Light Trucks Pursuant To Senate Bill 375. August 9, 2010. Available at: <http://arb.ca.gov/cc/sb375/staffreport_sb375080910.pdf >
Section 3.0 Environmental Setting, Impacts, and Mitigation
Envision San José 2040 General Plan 808 Draft Program EIR City of San José June 2011
jobs/housing balance for fiscal stability reasons, which accounts for some of the increase in VMT that is greater than population growth alone. Because ultimately the planned population and employed residents would not provide an adequate labor force to satisfy the growth in jobs, workers would need to travel from residences in other cities and counties. The imported workers would travel much longer distances than those workers who currently reside in the City. The City used a conservative technical approach for the transportation demand model runs used to estimate VMT. To maintain the ABAG Projections regional totals (i.e., controls) in the model analysis, workers that could not be accommodated by housing in San José were assumed to reside outside of Santa Clara County. Using this approach, imported workers would travel longer distances than if they were assumed to live in neighboring cities within Santa Clara County. Longer projected trip lengths contribute to the projected increase in VMT per capita. Countering this modeled increase in VMT per capita is the planned compact development within the City’s UGB (as shown on the City’s proposed Land Use and Transportation Diagram) as well as a range of new and updated General Plan policies that provide for expanded use of transportation options, such as public transit, bicycling, and walking. CARB has identified a list of policy types that support implementation of emission reduction targets called for under SB 375. Policies in the proposed General Plan that are consistent with these sample policies are listed in Table 3.15-8.
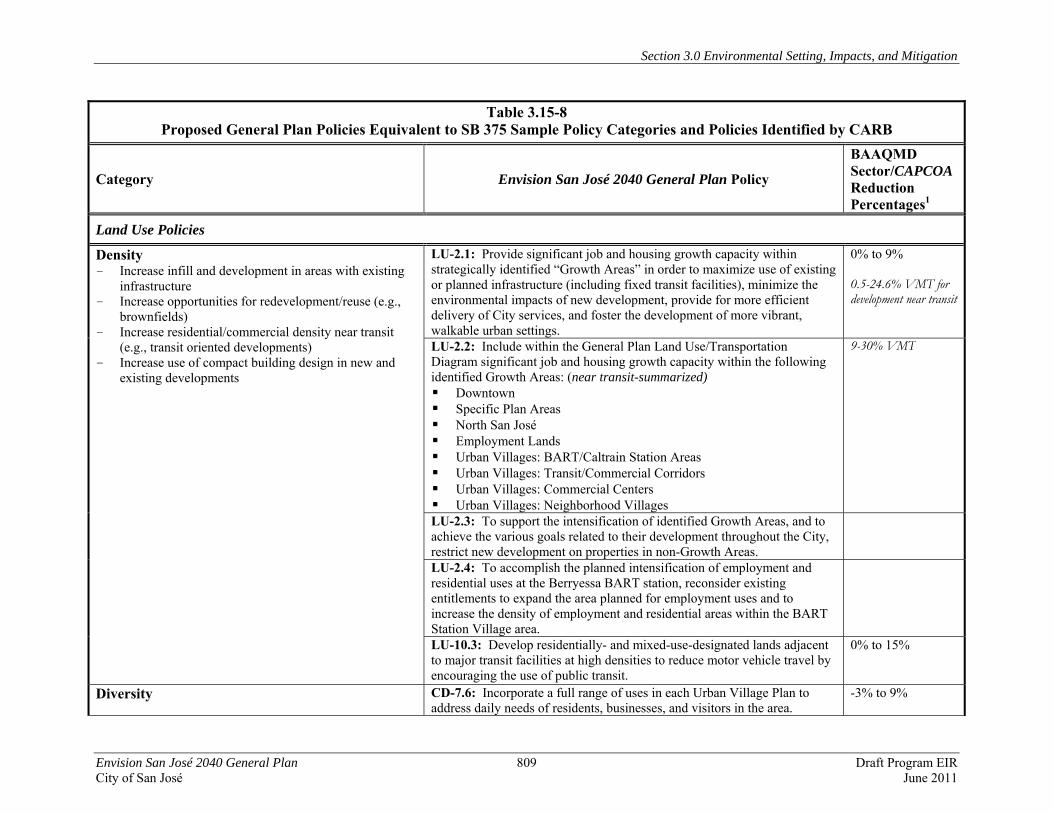
Section 3.0 Environmental Setting, Impacts, and Mitigation
Envision San José 2040 General Plan 809 Draft Program EIR City of San José June 2011
Table 3.15-8 Proposed General Plan Policies Equivalent to SB 375 Sample Policy Categories and Policies Identified by CARB
Category Envision San José 2040 General Plan Policy
BAAQMD Sector/CAPCOA Reduction Percentages1
Land Use Policies
Density - Increase infill and development in areas with existing
infrastructure - Increase opportunities for redevelopment/reuse (e.g.,
brownfields) - Increase residential/commercial density near transit
(e.g., transit oriented developments) - Increase use of compact building design in new and
existing developments
LU-2.1: Provide significant job and housing growth capacity within strategically identified “Growth Areas” in order to maximize use of existing or planned infrastructure (including fixed transit facilities), minimize the environmental impacts of new development, provide for more efficient delivery of City services, and foster the development of more vibrant, walkable urban settings.
0% to 9% 0.5-24.6% VMT for development near transit
LU-2.2: Include within the General Plan Land Use/Transportation Diagram significant job and housing growth capacity within the following identified Growth Areas: (near transit-summarized) Downtown Specific Plan Areas North San José Employment Lands Urban Villages: BART/Caltrain Station Areas Urban Villages: Transit/Commercial Corridors Urban Villages: Commercial Centers
Urban Villages: Neighborhood Villages
9-30% VMT
LU-2.3: To support the intensification of identified Growth Areas, and to achieve the various goals related to their development throughout the City, restrict new development on properties in non-Growth Areas.
LU-2.4: To accomplish the planned intensification of employment and residential uses at the Berryessa BART station, reconsider existing entitlements to expand the area planned for employment uses and to increase the density of employment and residential areas within the BART Station Village area.
LU-10.3: Develop residentially- and mixed-use-designated lands adjacent to major transit facilities at high densities to reduce motor vehicle travel by encouraging the use of public transit.
0% to 15%
Diversity CD-7.6: Incorporate a full range of uses in each Urban Village Plan to address daily needs of residents, businesses, and visitors in the area.
-3% to 9%
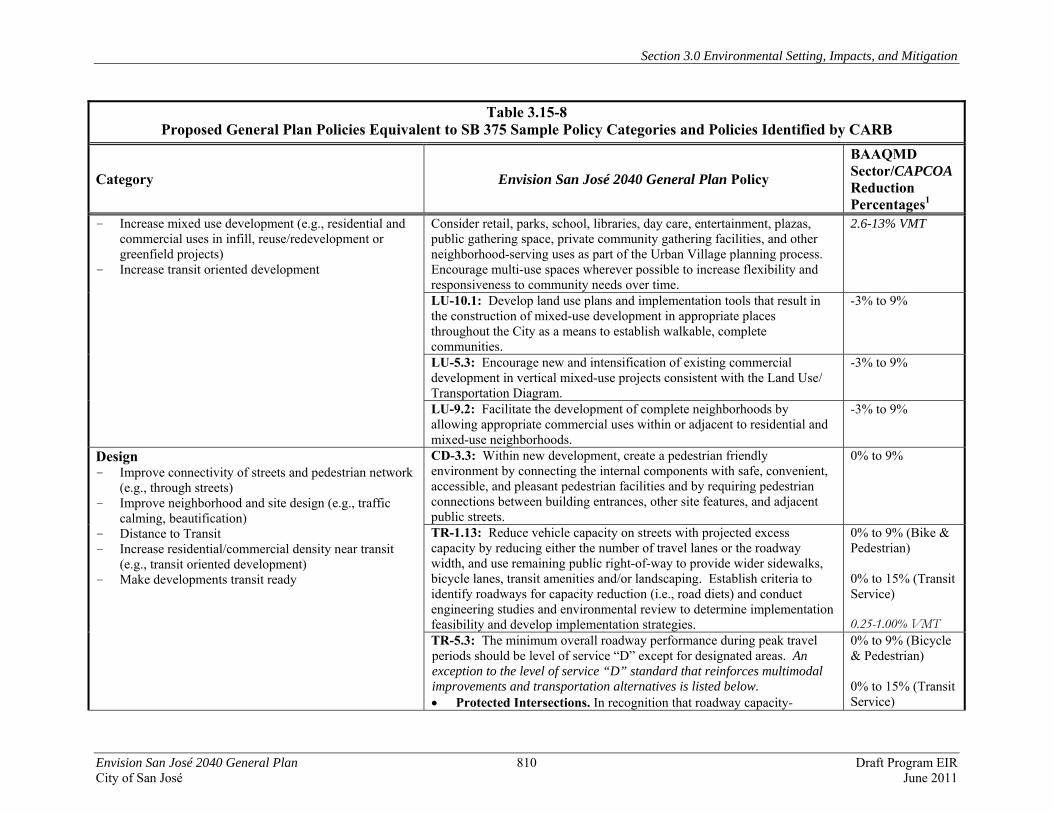
Section 3.0 Environmental Setting, Impacts, and Mitigation
Envision San José 2040 General Plan 810 Draft Program EIR City of San José June 2011
Table 3.15-8 Proposed General Plan Policies Equivalent to SB 375 Sample Policy Categories and Policies Identified by CARB
Category Envision San José 2040 General Plan Policy
BAAQMD Sector/CAPCOA Reduction Percentages1
- Increase mixed use development (e.g., residential and commercial uses in infill, reuse/redevelopment or greenfield projects)
- Increase transit oriented development
Consider retail, parks, school, libraries, day care, entertainment, plazas, public gathering space, private community gathering facilities, and other neighborhood-serving uses as part of the Urban Village planning process. Encourage multi-use spaces wherever possible to increase flexibility and responsiveness to community needs over time.
2.6-13% VMT
LU-10.1: Develop land use plans and implementation tools that result in the construction of mixed-use development in appropriate places throughout the City as a means to establish walkable, complete communities.
-3% to 9%
LU-5.3: Encourage new and intensification of existing commercial development in vertical mixed-use projects consistent with the Land Use/ Transportation Diagram.
-3% to 9%
LU-9.2: Facilitate the development of complete neighborhoods by allowing appropriate commercial uses within or adjacent to residential and mixed-use neighborhoods.
-3% to 9%
Design - Improve connectivity of streets and pedestrian network
(e.g., through streets) - Improve neighborhood and site design (e.g., traffic
calming, beautification) - Distance to Transit - Increase residential/commercial density near transit
(e.g., transit oriented development) - Make developments transit ready
CD-3.3: Within new development, create a pedestrian friendly environment by connecting the internal components with safe, convenient, accessible, and pleasant pedestrian facilities and by requiring pedestrian connections between building entrances, other site features, and adjacent public streets.
0% to 9%
TR-1.13: Reduce vehicle capacity on streets with projected excess capacity by reducing either the number of travel lanes or the roadway width, and use remaining public right-of-way to provide wider sidewalks, bicycle lanes, transit amenities and/or landscaping. Establish criteria to identify roadways for capacity reduction (i.e., road diets) and conduct engineering studies and environmental review to determine implementation feasibility and develop implementation strategies.
0% to 9% (Bike & Pedestrian) 0% to 15% (Transit Service) 0.25-1.00% VMT
TR-5.3: The minimum overall roadway performance during peak travel periods should be level of service “D” except for designated areas. An exception to the level of service “D” standard that reinforces multimodal improvements and transportation alternatives is listed below. • Protected Intersections. In recognition that roadway capacity-
0% to 9% (Bicycle & Pedestrian) 0% to 15% (Transit Service)
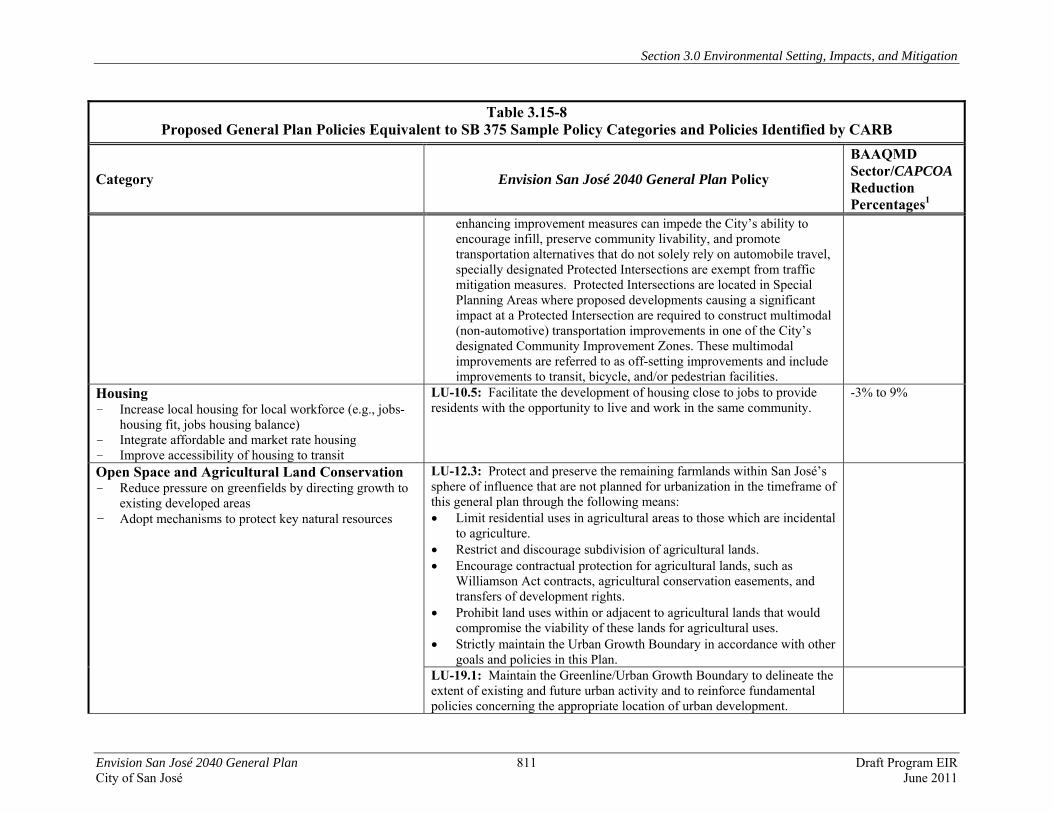
Section 3.0 Environmental Setting, Impacts, and Mitigation
Envision San José 2040 General Plan 811 Draft Program EIR City of San José June 2011
Table 3.15-8 Proposed General Plan Policies Equivalent to SB 375 Sample Policy Categories and Policies Identified by CARB
Category Envision San José 2040 General Plan Policy
BAAQMD Sector/CAPCOA Reduction Percentages1
enhancing improvement measures can impede the City’s ability to encourage infill, preserve community livability, and promote transportation alternatives that do not solely rely on automobile travel, specially designated Protected Intersections are exempt from traffic mitigation measures. Protected Intersections are located in Special Planning Areas where proposed developments causing a significant impact at a Protected Intersection are required to construct multimodal (non-automotive) transportation improvements in one of the City’s designated Community Improvement Zones. These multimodal improvements are referred to as off-setting improvements and include improvements to transit, bicycle, and/or pedestrian facilities.
Housing - Increase local housing for local workforce (e.g., jobs-
housing fit, jobs housing balance) - Integrate affordable and market rate housing - Improve accessibility of housing to transit
LU-10.5: Facilitate the development of housing close to jobs to provide residents with the opportunity to live and work in the same community.
-3% to 9%
Open Space and Agricultural Land Conservation - Reduce pressure on greenfields by directing growth to
existing developed areas - Adopt mechanisms to protect key natural resources
LU-12.3: Protect and preserve the remaining farmlands within San José’s sphere of influence that are not planned for urbanization in the timeframe of this general plan through the following means: • Limit residential uses in agricultural areas to those which are incidental
to agriculture. • Restrict and discourage subdivision of agricultural lands. • Encourage contractual protection for agricultural lands, such as
Williamson Act contracts, agricultural conservation easements, and transfers of development rights.
• Prohibit land uses within or adjacent to agricultural lands that would compromise the viability of these lands for agricultural uses.
• Strictly maintain the Urban Growth Boundary in accordance with other goals and policies in this Plan.
LU-19.1: Maintain the Greenline/Urban Growth Boundary to delineate the extent of existing and future urban activity and to reinforce fundamental policies concerning the appropriate location of urban development.
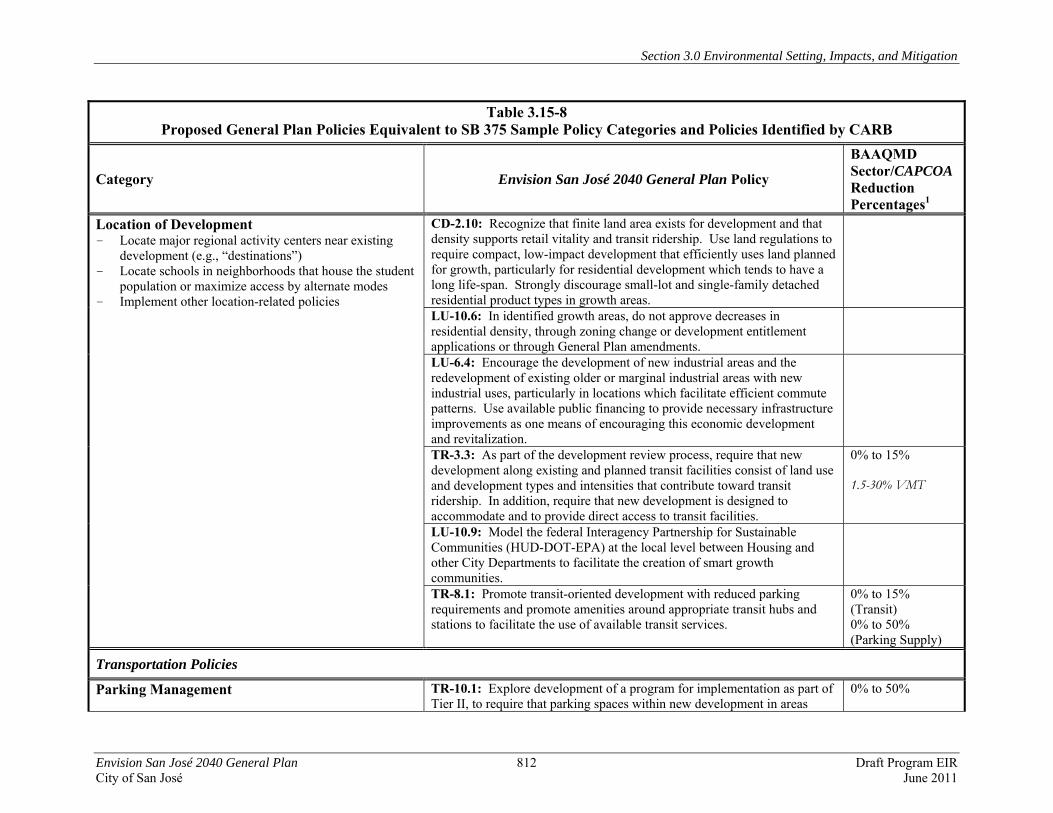
Section 3.0 Environmental Setting, Impacts, and Mitigation
Envision San José 2040 General Plan 812 Draft Program EIR City of San José June 2011
Table 3.15-8 Proposed General Plan Policies Equivalent to SB 375 Sample Policy Categories and Policies Identified by CARB
Category Envision San José 2040 General Plan Policy
BAAQMD Sector/CAPCOA Reduction Percentages1
Location of Development - Locate major regional activity centers near existing
development (e.g., “destinations”) - Locate schools in neighborhoods that house the student
population or maximize access by alternate modes - Implement other location-related policies
CD-2.10: Recognize that finite land area exists for development and that density supports retail vitality and transit ridership. Use land regulations to require compact, low-impact development that efficiently uses land planned for growth, particularly for residential development which tends to have a long life-span. Strongly discourage small-lot and single-family detached residential product types in growth areas.
LU-10.6: In identified growth areas, do not approve decreases in residential density, through zoning change or development entitlement applications or through General Plan amendments.
LU-6.4: Encourage the development of new industrial areas and the redevelopment of existing older or marginal industrial areas with new industrial uses, particularly in locations which facilitate efficient commute patterns. Use available public financing to provide necessary infrastructure improvements as one means of encouraging this economic development and revitalization.
TR-3.3: As part of the development review process, require that new development along existing and planned transit facilities consist of land use and development types and intensities that contribute toward transit ridership. In addition, require that new development is designed to accommodate and to provide direct access to transit facilities.
0% to 15% 1.5-30% VMT
LU-10.9: Model the federal Interagency Partnership for Sustainable Communities (HUD-DOT-EPA) at the local level between Housing and other City Departments to facilitate the creation of smart growth communities.
TR-8.1: Promote transit-oriented development with reduced parking requirements and promote amenities around appropriate transit hubs and stations to facilitate the use of available transit services.
0% to 15% (Transit) 0% to 50% (Parking Supply)
Transportation Policies
Parking Management TR-10.1: Explore development of a program for implementation as part of Tier II, to require that parking spaces within new development in areas
0% to 50%
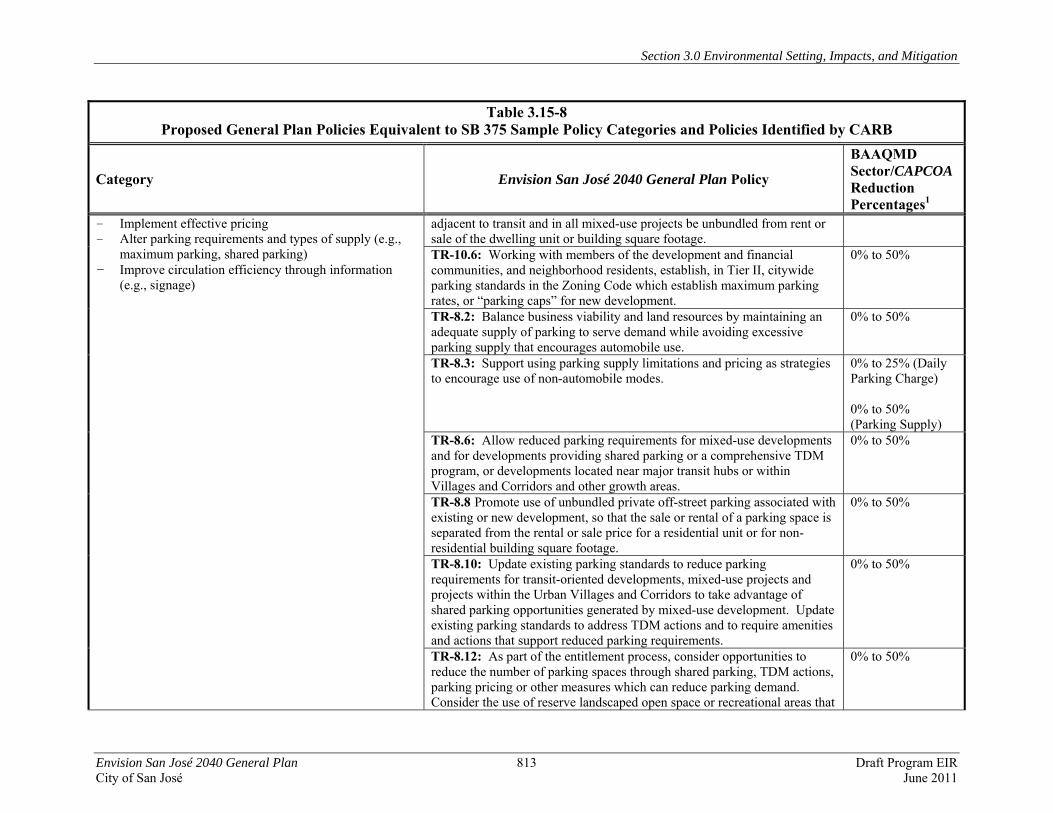
Section 3.0 Environmental Setting, Impacts, and Mitigation
Envision San José 2040 General Plan 813 Draft Program EIR City of San José June 2011
Table 3.15-8 Proposed General Plan Policies Equivalent to SB 375 Sample Policy Categories and Policies Identified by CARB
Category Envision San José 2040 General Plan Policy
BAAQMD Sector/CAPCOA Reduction Percentages1
- Implement effective pricing - Alter parking requirements and types of supply (e.g.,
maximum parking, shared parking) - Improve circulation efficiency through information
(e.g., signage)
adjacent to transit and in all mixed-use projects be unbundled from rent or sale of the dwelling unit or building square footage. TR-10.6: Working with members of the development and financial communities, and neighborhood residents, establish, in Tier II, citywide parking standards in the Zoning Code which establish maximum parking rates, or “parking caps” for new development.
0% to 50%
TR-8.2: Balance business viability and land resources by maintaining an adequate supply of parking to serve demand while avoiding excessive parking supply that encourages automobile use.
0% to 50%
TR-8.3: Support using parking supply limitations and pricing as strategies to encourage use of non-automobile modes.
0% to 25% (Daily Parking Charge) 0% to 50% (Parking Supply)
TR-8.6: Allow reduced parking requirements for mixed-use developments and for developments providing shared parking or a comprehensive TDM program, or developments located near major transit hubs or within Villages and Corridors and other growth areas.
0% to 50%
TR-8.8 Promote use of unbundled private off-street parking associated with existing or new development, so that the sale or rental of a parking space is separated from the rental or sale price for a residential unit or for non-residential building square footage.
0% to 50%
TR-8.10: Update existing parking standards to reduce parking requirements for transit-oriented developments, mixed-use projects and projects within the Urban Villages and Corridors to take advantage of shared parking opportunities generated by mixed-use development. Update existing parking standards to address TDM actions and to require amenities and actions that support reduced parking requirements.
0% to 50%
TR-8.12: As part of the entitlement process, consider opportunities to reduce the number of parking spaces through shared parking, TDM actions, parking pricing or other measures which can reduce parking demand. Consider the use of reserve landscaped open space or recreational areas that
0% to 50%
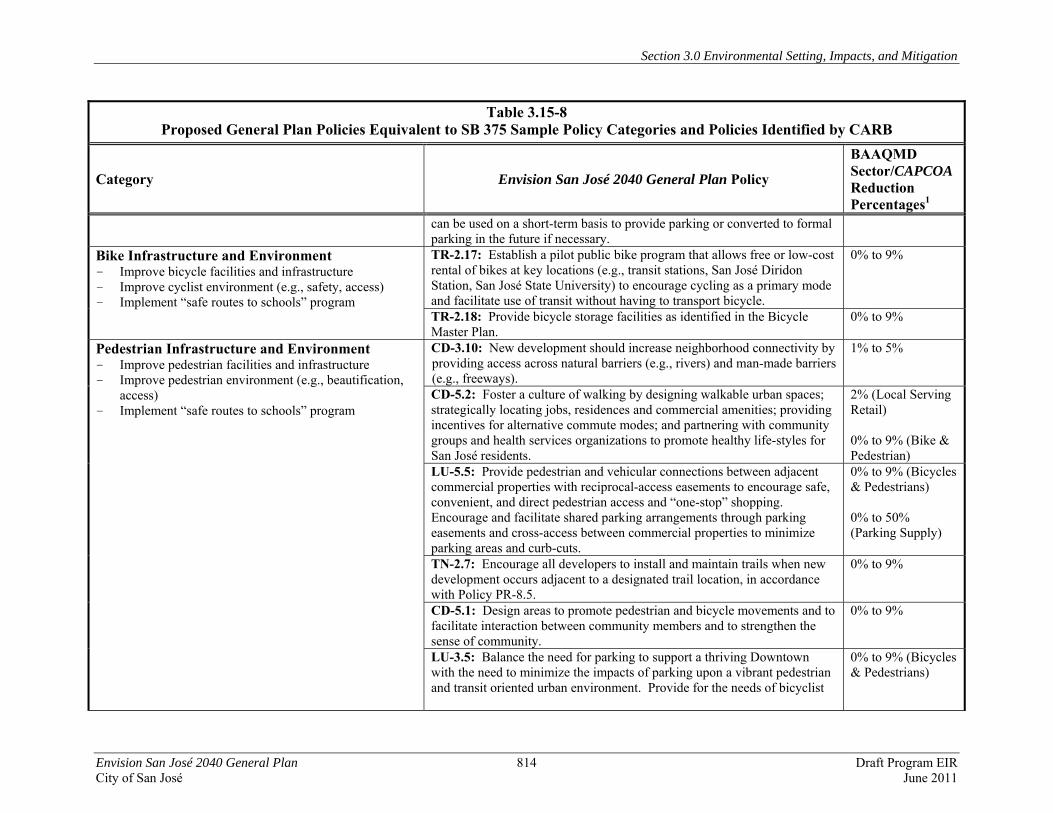
Section 3.0 Environmental Setting, Impacts, and Mitigation
Envision San José 2040 General Plan 814 Draft Program EIR City of San José June 2011
Table 3.15-8 Proposed General Plan Policies Equivalent to SB 375 Sample Policy Categories and Policies Identified by CARB
Category Envision San José 2040 General Plan Policy
BAAQMD Sector/CAPCOA Reduction Percentages1
can be used on a short-term basis to provide parking or converted to formal parking in the future if necessary.
Bike Infrastructure and Environment - Improve bicycle facilities and infrastructure - Improve cyclist environment (e.g., safety, access) - Implement “safe routes to schools” program
TR-2.17: Establish a pilot public bike program that allows free or low-cost rental of bikes at key locations (e.g., transit stations, San José Diridon Station, San José State University) to encourage cycling as a primary mode and facilitate use of transit without having to transport bicycle.
0% to 9%
TR-2.18: Provide bicycle storage facilities as identified in the Bicycle Master Plan.
0% to 9%
Pedestrian Infrastructure and Environment - Improve pedestrian facilities and infrastructure - Improve pedestrian environment (e.g., beautification,
access) - Implement “safe routes to schools” program
CD-3.10: New development should increase neighborhood connectivity by providing access across natural barriers (e.g., rivers) and man-made barriers (e.g., freeways).
1% to 5%
CD-5.2: Foster a culture of walking by designing walkable urban spaces; strategically locating jobs, residences and commercial amenities; providing incentives for alternative commute modes; and partnering with community groups and health services organizations to promote healthy life-styles for San José residents.
2% (Local Serving Retail) 0% to 9% (Bike & Pedestrian)
LU-5.5: Provide pedestrian and vehicular connections between adjacent commercial properties with reciprocal-access easements to encourage safe, convenient, and direct pedestrian access and “one-stop” shopping. Encourage and facilitate shared parking arrangements through parking easements and cross-access between commercial properties to minimize parking areas and curb-cuts.
0% to 9% (Bicycles & Pedestrians) 0% to 50% (Parking Supply)
TN-2.7: Encourage all developers to install and maintain trails when new development occurs adjacent to a designated trail location, in accordance with Policy PR-8.5.
0% to 9%
CD-5.1: Design areas to promote pedestrian and bicycle movements and to facilitate interaction between community members and to strengthen the sense of community.
0% to 9%
LU-3.5: Balance the need for parking to support a thriving Downtown with the need to minimize the impacts of parking upon a vibrant pedestrian and transit oriented urban environment. Provide for the needs of bicyclist
0% to 9% (Bicycles & Pedestrians)
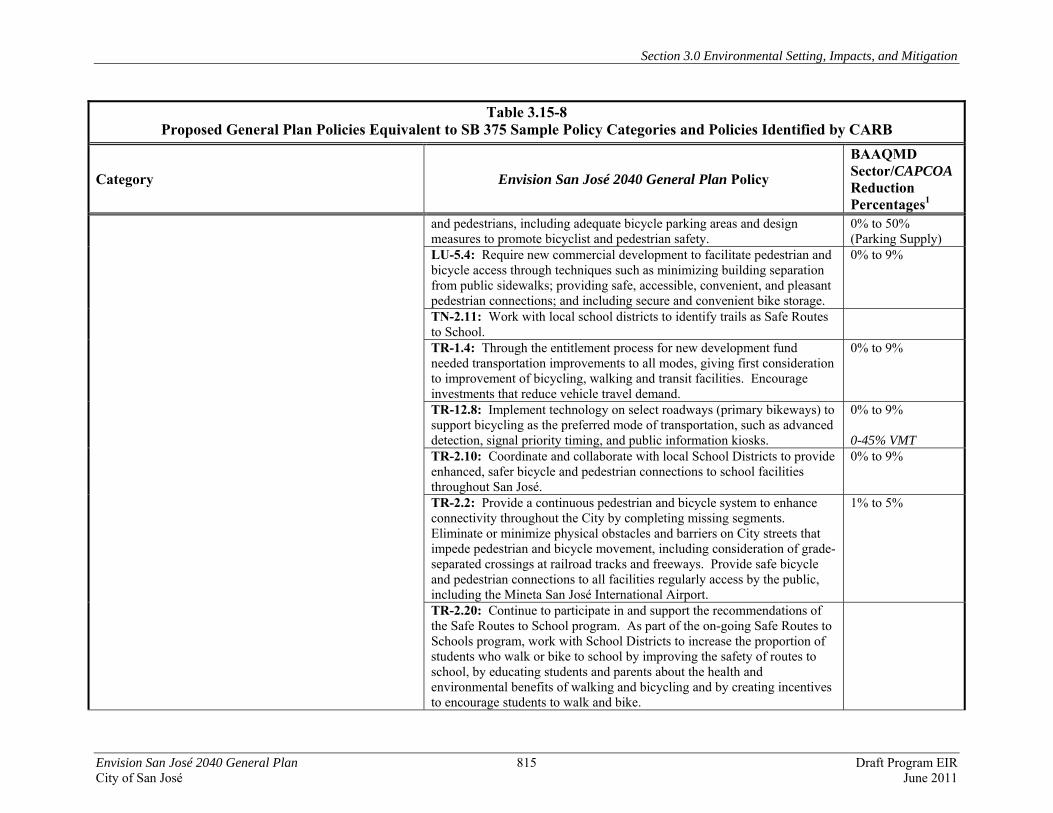
Section 3.0 Environmental Setting, Impacts, and Mitigation
Envision San José 2040 General Plan 815 Draft Program EIR City of San José June 2011
Table 3.15-8 Proposed General Plan Policies Equivalent to SB 375 Sample Policy Categories and Policies Identified by CARB
Category Envision San José 2040 General Plan Policy
BAAQMD Sector/CAPCOA Reduction Percentages1
and pedestrians, including adequate bicycle parking areas and design measures to promote bicyclist and pedestrian safety.
0% to 50% (Parking Supply)
LU-5.4: Require new commercial development to facilitate pedestrian and bicycle access through techniques such as minimizing building separation from public sidewalks; providing safe, accessible, convenient, and pleasant pedestrian connections; and including secure and convenient bike storage.
0% to 9%
TN-2.11: Work with local school districts to identify trails as Safe Routes to School.
TR-1.4: Through the entitlement process for new development fund needed transportation improvements to all modes, giving first consideration to improvement of bicycling, walking and transit facilities. Encourage investments that reduce vehicle travel demand.
0% to 9%
TR-12.8: Implement technology on select roadways (primary bikeways) to support bicycling as the preferred mode of transportation, such as advanced detection, signal priority timing, and public information kiosks.
0% to 9% 0-45% VMT
TR-2.10: Coordinate and collaborate with local School Districts to provide enhanced, safer bicycle and pedestrian connections to school facilities throughout San José.
0% to 9%
TR-2.2: Provide a continuous pedestrian and bicycle system to enhance connectivity throughout the City by completing missing segments. Eliminate or minimize physical obstacles and barriers on City streets that impede pedestrian and bicycle movement, including consideration of grade-separated crossings at railroad tracks and freeways. Provide safe bicycle and pedestrian connections to all facilities regularly access by the public, including the Mineta San José International Airport.
1% to 5%
TR-2.20: Continue to participate in and support the recommendations of the Safe Routes to School program. As part of the on-going Safe Routes to Schools program, work with School Districts to increase the proportion of students who walk or bike to school by improving the safety of routes to school, by educating students and parents about the health and environmental benefits of walking and bicycling and by creating incentives to encourage students to walk and bike.
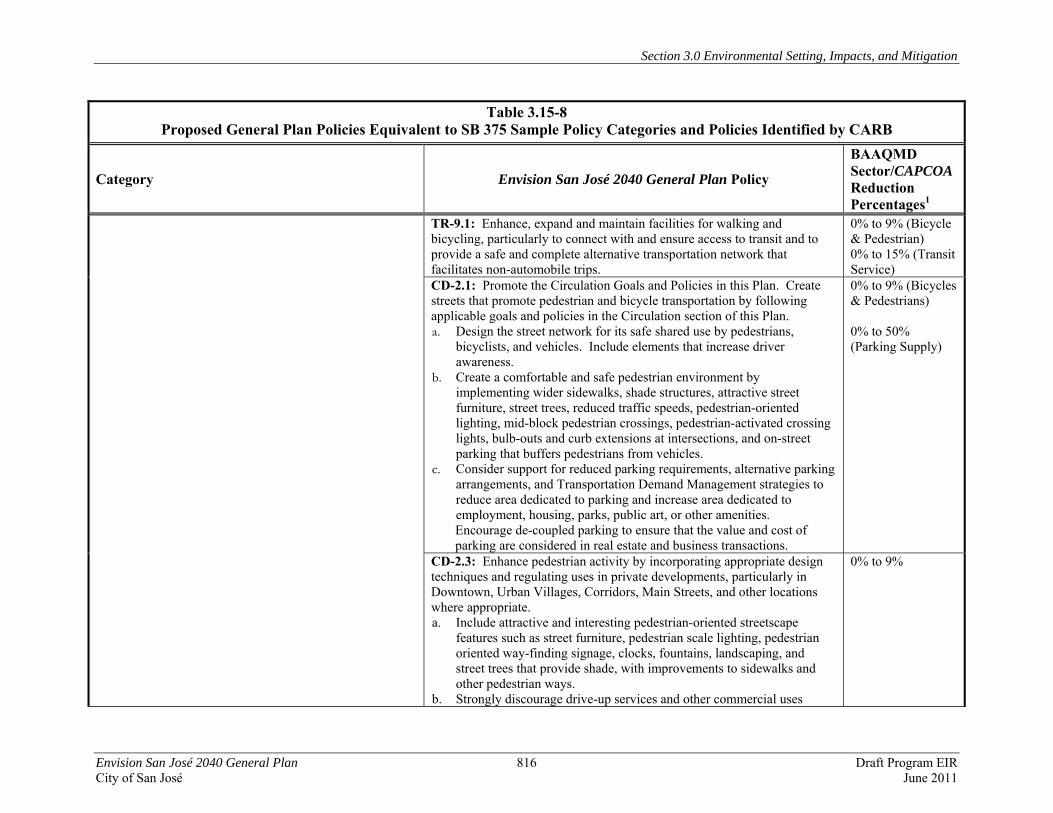
Section 3.0 Environmental Setting, Impacts, and Mitigation
Envision San José 2040 General Plan 816 Draft Program EIR City of San José June 2011
Table 3.15-8 Proposed General Plan Policies Equivalent to SB 375 Sample Policy Categories and Policies Identified by CARB
Category Envision San José 2040 General Plan Policy
BAAQMD Sector/CAPCOA Reduction Percentages1
TR-9.1: Enhance, expand and maintain facilities for walking and bicycling, particularly to connect with and ensure access to transit and to provide a safe and complete alternative transportation network that facilitates non-automobile trips.
0% to 9% (Bicycle & Pedestrian) 0% to 15% (Transit Service)
CD-2.1: Promote the Circulation Goals and Policies in this Plan. Create streets that promote pedestrian and bicycle transportation by following applicable goals and policies in the Circulation section of this Plan. a. Design the street network for its safe shared use by pedestrians,
bicyclists, and vehicles. Include elements that increase driver awareness.
b. Create a comfortable and safe pedestrian environment by implementing wider sidewalks, shade structures, attractive street furniture, street trees, reduced traffic speeds, pedestrian-oriented lighting, mid-block pedestrian crossings, pedestrian-activated crossing lights, bulb-outs and curb extensions at intersections, and on-street parking that buffers pedestrians from vehicles.
c. Consider support for reduced parking requirements, alternative parking arrangements, and Transportation Demand Management strategies to reduce area dedicated to parking and increase area dedicated to employment, housing, parks, public art, or other amenities. Encourage de-coupled parking to ensure that the value and cost of parking are considered in real estate and business transactions.
0% to 9% (Bicycles & Pedestrians) 0% to 50% (Parking Supply)
CD-2.3: Enhance pedestrian activity by incorporating appropriate design techniques and regulating uses in private developments, particularly in Downtown, Urban Villages, Corridors, Main Streets, and other locations where appropriate. a. Include attractive and interesting pedestrian-oriented streetscape
features such as street furniture, pedestrian scale lighting, pedestrian oriented way-finding signage, clocks, fountains, landscaping, and street trees that provide shade, with improvements to sidewalks and other pedestrian ways.
b. Strongly discourage drive-up services and other commercial uses
0% to 9%

Section 3.0 Environmental Setting, Impacts, and Mitigation
Envision San José 2040 General Plan 817 Draft Program EIR City of San José June 2011
Table 3.15-8 Proposed General Plan Policies Equivalent to SB 375 Sample Policy Categories and Policies Identified by CARB
Category Envision San José 2040 General Plan Policy
BAAQMD Sector/CAPCOA Reduction Percentages1
oriented to occupants of vehicles in pedestrian-oriented areas. Uses that serve the vehicle, such as car washes and service stations, may be considered appropriate in these areas when they do not disrupt pedestrian flow, are not concentrated in one area, do not break up the building mass of the streetscape, are consistent with other policies in this Plan, and are compatible with the planned uses of the area.
c. Provide pedestrian connections as outlined in the Urban Design Connections Goal and Policies.
d. Locate retail and other active uses at the street level. e. Create easily identifiable and accessible building entrances located on
street frontages or paseos. f. Accommodate the physical needs of elderly populations and persons
with disabilities. g. Integrate existing or proposed transit stops into project designs. CD-3.4: Encourage pedestrian cross-access connections between adjacent properties and require pedestrian and bicycle connections to streets and other public spaces, with particular attention and priority given to providing convenient access to transit facilities. Provide pedestrian and vehicular connections with cross-access easements within and between new and existing developments to encourage walking and minimize interruptions by parking areas and curb cuts.
0% to 9%
LU-10.10: Achieve 75% of residents who can access 25% of their retail/service needs within a 20-minute walk and 50% of residents who can access 50% of their retail/service needs within a 20-minute walk.
2%
LU-5.2: To facilitate pedestrian access to a variety of commercial establishments and services that meet the daily needs of residents and employees, locate neighborhood-serving commercial uses throughout the city, including identified growth areas and areas where there is existing or future demand for such uses.
2%
Interconnectivity Among Alternative Modes - Improve linkages between modes of travel
TN-2.2: Provide direct, safe and convenient bicycle and pedestrian connections between the trail system and adjacent neighborhoods, schools, employment areas and shopping areas.
0% to 9%
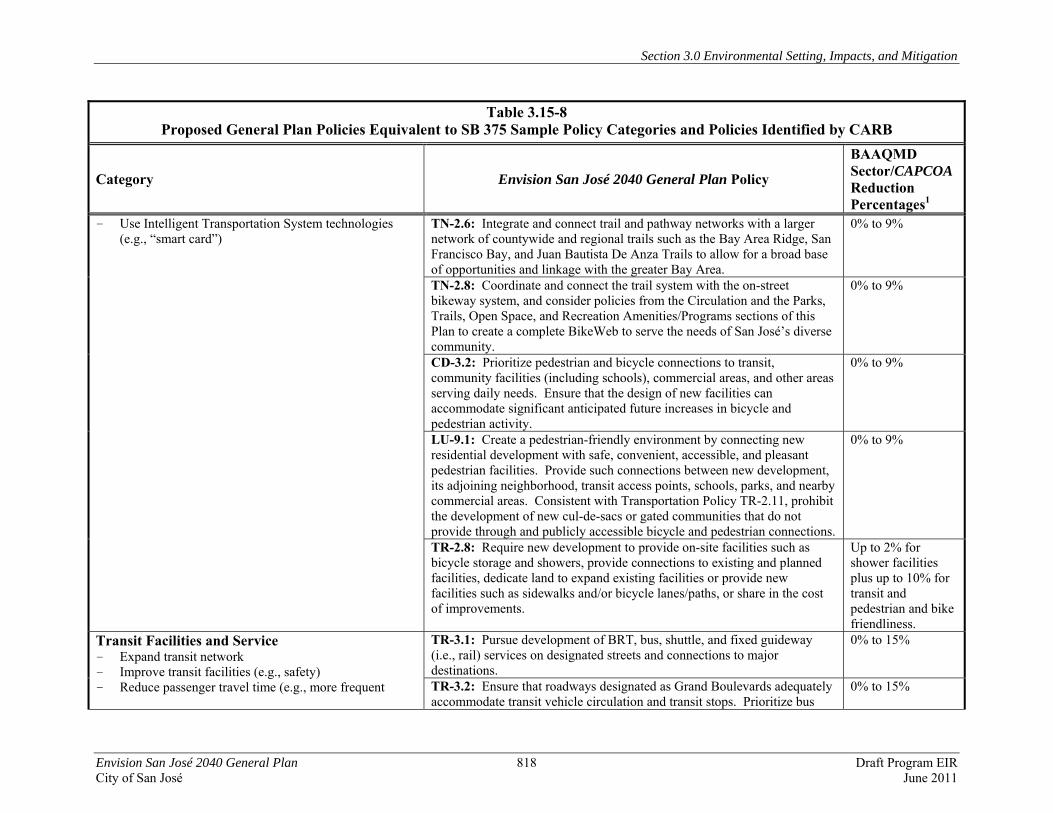
Section 3.0 Environmental Setting, Impacts, and Mitigation
Envision San José 2040 General Plan 818 Draft Program EIR City of San José June 2011
Table 3.15-8 Proposed General Plan Policies Equivalent to SB 375 Sample Policy Categories and Policies Identified by CARB
Category Envision San José 2040 General Plan Policy
BAAQMD Sector/CAPCOA Reduction Percentages1
- Use Intelligent Transportation System technologies (e.g., “smart card”)
TN-2.6: Integrate and connect trail and pathway networks with a larger network of countywide and regional trails such as the Bay Area Ridge, San Francisco Bay, and Juan Bautista De Anza Trails to allow for a broad base of opportunities and linkage with the greater Bay Area.
0% to 9%
TN-2.8: Coordinate and connect the trail system with the on-street bikeway system, and consider policies from the Circulation and the Parks, Trails, Open Space, and Recreation Amenities/Programs sections of this Plan to create a complete BikeWeb to serve the needs of San José’s diverse community.
0% to 9%
CD-3.2: Prioritize pedestrian and bicycle connections to transit, community facilities (including schools), commercial areas, and other areas serving daily needs. Ensure that the design of new facilities can accommodate significant anticipated future increases in bicycle and pedestrian activity.
0% to 9%
LU-9.1: Create a pedestrian-friendly environment by connecting new residential development with safe, convenient, accessible, and pleasant pedestrian facilities. Provide such connections between new development, its adjoining neighborhood, transit access points, schools, parks, and nearby commercial areas. Consistent with Transportation Policy TR-2.11, prohibit the development of new cul-de-sacs or gated communities that do not provide through and publicly accessible bicycle and pedestrian connections.
0% to 9%
TR-2.8: Require new development to provide on-site facilities such as bicycle storage and showers, provide connections to existing and planned facilities, dedicate land to expand existing facilities or provide new facilities such as sidewalks and/or bicycle lanes/paths, or share in the cost of improvements.
Up to 2% for shower facilities plus up to 10% for transit and pedestrian and bike friendliness.
Transit Facilities and Service - Expand transit network - Improve transit facilities (e.g., safety) - Reduce passenger travel time (e.g., more frequent
TR-3.1: Pursue development of BRT, bus, shuttle, and fixed guideway (i.e., rail) services on designated streets and connections to major destinations.
0% to 15%
TR-3.2: Ensure that roadways designated as Grand Boulevards adequately accommodate transit vehicle circulation and transit stops. Prioritize bus
0% to 15%
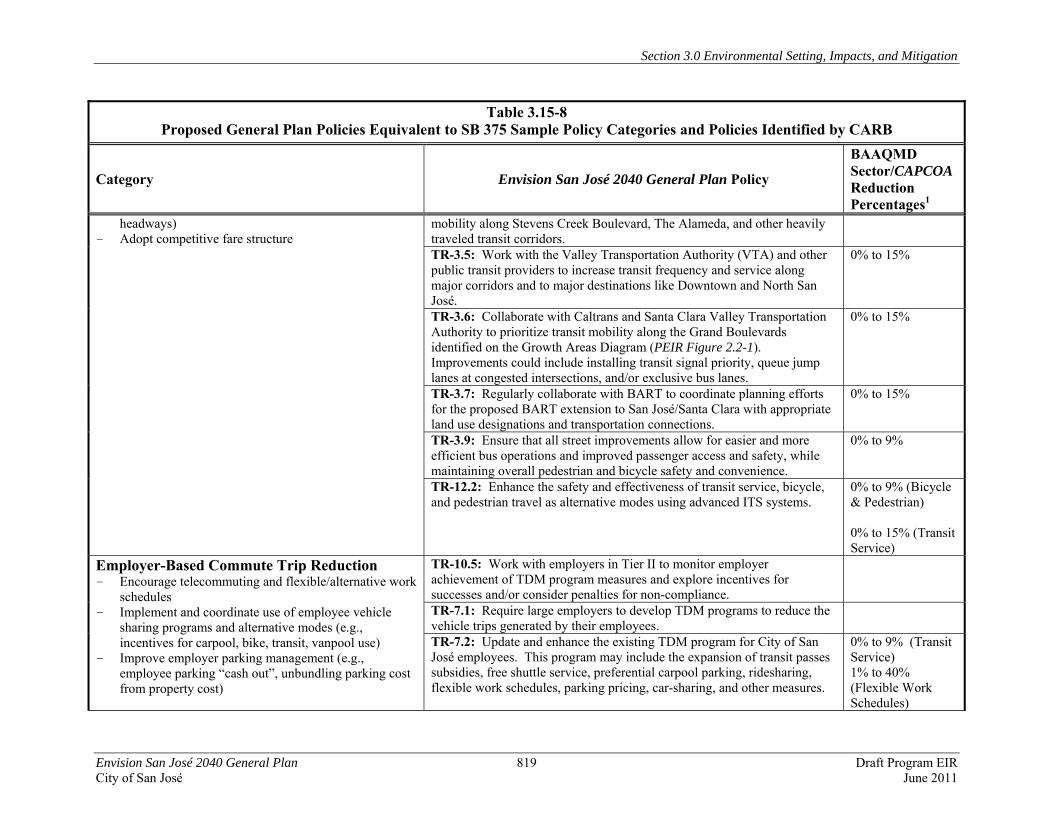
Section 3.0 Environmental Setting, Impacts, and Mitigation
Envision San José 2040 General Plan 819 Draft Program EIR City of San José June 2011
Table 3.15-8 Proposed General Plan Policies Equivalent to SB 375 Sample Policy Categories and Policies Identified by CARB
Category Envision San José 2040 General Plan Policy
BAAQMD Sector/CAPCOA Reduction Percentages1
headways) - Adopt competitive fare structure
mobility along Stevens Creek Boulevard, The Alameda, and other heavily traveled transit corridors. TR-3.5: Work with the Valley Transportation Authority (VTA) and other public transit providers to increase transit frequency and service along major corridors and to major destinations like Downtown and North San José.
0% to 15%
TR-3.6: Collaborate with Caltrans and Santa Clara Valley Transportation Authority to prioritize transit mobility along the Grand Boulevards identified on the Growth Areas Diagram (PEIR Figure 2.2-1). Improvements could include installing transit signal priority, queue jump lanes at congested intersections, and/or exclusive bus lanes.
0% to 15%
TR-3.7: Regularly collaborate with BART to coordinate planning efforts for the proposed BART extension to San José/Santa Clara with appropriate land use designations and transportation connections.
0% to 15%
TR-3.9: Ensure that all street improvements allow for easier and more efficient bus operations and improved passenger access and safety, while maintaining overall pedestrian and bicycle safety and convenience.
0% to 9%
TR-12.2: Enhance the safety and effectiveness of transit service, bicycle, and pedestrian travel as alternative modes using advanced ITS systems.
0% to 9% (Bicycle & Pedestrian) 0% to 15% (Transit Service)
Employer-Based Commute Trip Reduction - Encourage telecommuting and flexible/alternative work
schedules - Implement and coordinate use of employee vehicle
sharing programs and alternative modes (e.g., incentives for carpool, bike, transit, vanpool use)
- Improve employer parking management (e.g., employee parking “cash out”, unbundling parking cost from property cost)
TR-10.5: Work with employers in Tier II to monitor employer achievement of TDM program measures and explore incentives for successes and/or consider penalties for non-compliance.
TR-7.1: Require large employers to develop TDM programs to reduce the vehicle trips generated by their employees.
TR-7.2: Update and enhance the existing TDM program for City of San José employees. This program may include the expansion of transit passes subsidies, free shuttle service, preferential carpool parking, ridesharing, flexible work schedules, parking pricing, car-sharing, and other measures.
0% to 9% (Transit Service) 1% to 40% (Flexible Work Schedules)
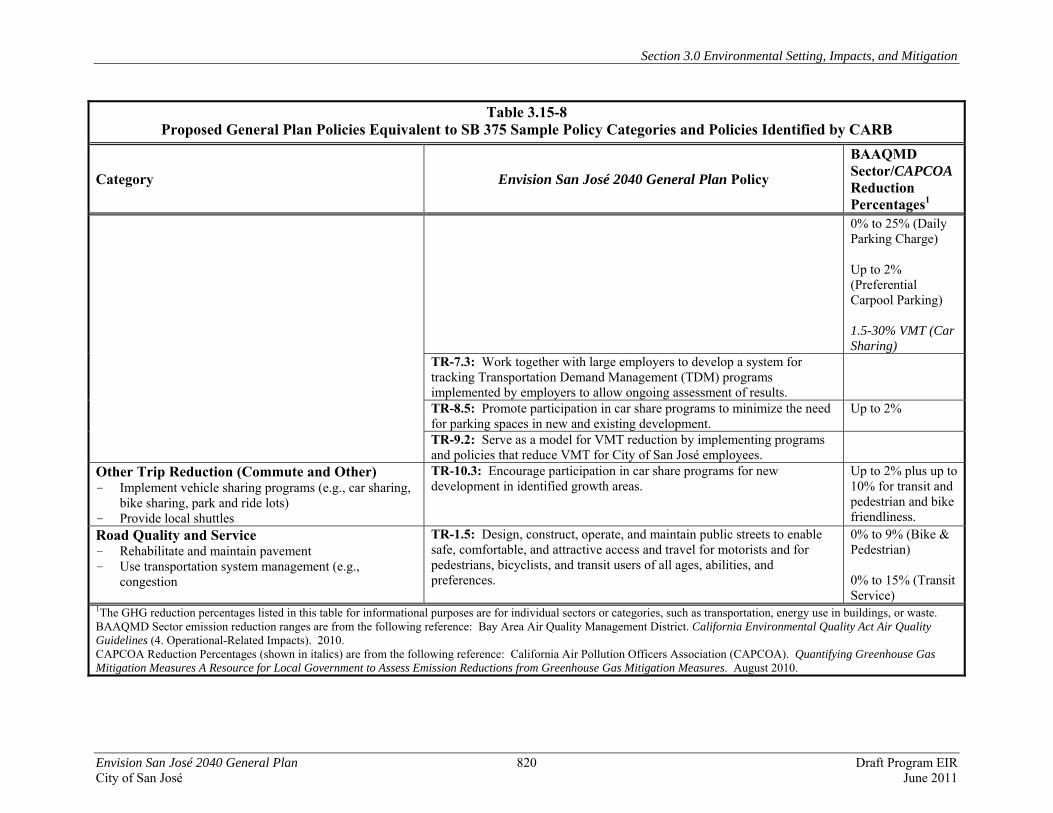
Section 3.0 Environmental Setting, Impacts, and Mitigation
Envision San José 2040 General Plan 820 Draft Program EIR City of San José June 2011
Table 3.15-8 Proposed General Plan Policies Equivalent to SB 375 Sample Policy Categories and Policies Identified by CARB
Category Envision San José 2040 General Plan Policy
BAAQMD Sector/CAPCOA Reduction Percentages1
0% to 25% (Daily Parking Charge) Up to 2% (Preferential Carpool Parking) 1.5-30% VMT (Car Sharing)
TR-7.3: Work together with large employers to develop a system for tracking Transportation Demand Management (TDM) programs implemented by employers to allow ongoing assessment of results.
TR-8.5: Promote participation in car share programs to minimize the need for parking spaces in new and existing development.
Up to 2%
TR-9.2: Serve as a model for VMT reduction by implementing programs and policies that reduce VMT for City of San José employees.
Other Trip Reduction (Commute and Other) - Implement vehicle sharing programs (e.g., car sharing,
bike sharing, park and ride lots) - Provide local shuttles
TR-10.3: Encourage participation in car share programs for new development in identified growth areas.
Up to 2% plus up to 10% for transit and pedestrian and bike friendliness.
Road Quality and Service - Rehabilitate and maintain pavement - Use transportation system management (e.g.,
congestion
TR-1.5: Design, construct, operate, and maintain public streets to enable safe, comfortable, and attractive access and travel for motorists and for pedestrians, bicyclists, and transit users of all ages, abilities, and preferences.
0% to 9% (Bike & Pedestrian) 0% to 15% (Transit Service)
1The GHG reduction percentages listed in this table for informational purposes are for individual sectors or categories, such as transportation, energy use in buildings, or waste. BAAQMD Sector emission reduction ranges are from the following reference: Bay Area Air Quality Management District. California Environmental Quality Act Air Quality Guidelines (4. Operational-Related Impacts). 2010. CAPCOA Reduction Percentages (shown in italics) are from the following reference: California Air Pollution Officers Association (CAPCOA). Quantifying Greenhouse Gas Mitigation Measures A Resource for Local Government to Assess Emission Reductions from Greenhouse Gas Mitigation Measures. August 2010.
Section 3.0 Environmental Setting, Impacts, and Mitigation
Envision San José 2040 General Plan 821 Draft Program EIR City of San José June 2011
3.15.5.2 Comparison of Envision San José 2040 General Plan Policies to State of California Climate Change Scoping Plan Measures
Key elements for reducing greenhouse gas emissions in California to 1990 levels by 2020 identified in the State’s Climate Change Scoping Plan include: • Expanding and strengthening existing energy efficiency programs as well as building and
appliance standards; • Achieving a statewide renewables energy mix of 33 percent; • Developing a California cap-and-trade program that links with other Western Climate
Initiative partner programs to create a regional market system; • Establishing targets for transportation-related greenhouse gas emissions for regions
throughout California and pursuing policies and incentives to achieve those targets; • Adopting and implementing measures pursuant to existing State laws and policies, including
California’s clean car standards, goods movement measures, and the Low Carbon Fuel Standard; and
• Creating targeted fees, including a public goods charge on water use, fees on high global warming potential gases, and a fee to fund the administrative costs of the State’s long-term commitment to AB 32 implementation.
While the Scoping Plan focuses on measures and regulations undertaken at a statewide level, implementation of measures at the local level are also important. Table K-1 in Appendix K of this PEIR identifies measures in the California Scoping Plan to reduce greenhouse gases and the associated proposed General Plan policies that correspond or fit within each measure category. The table also identifies, where possible, the percentage of sector reductions associated with the policy in accordance with the values found in the BAAQMD CEQA Guidelines mitigation measures list. Several measures identified in the Climate Change Scoping Plan that will be regulated at a statewide rather than a local level, such as the proposed California Cap-and-Trade Program,224 the statewide renewable energy mix, and California Light-Duty Vehicle Greenhouse Gas Standards, are not discussed further in this section because they are outside the City’s control. The proposed General Plan includes a range of policies and actions designed to improve sustainability of the City and reduce per capita and per service population emissions of GHGs. Proposed policies and programs that address energy efficiency, use of alternative modes of travel, reducing VMT, waste reduction, and water use efficiency are consistent with elements of the Climate Change Scoping Plan. 3.15.5.3 Alignment with the Focus Regional Blueprint (ABAG/BAAQMD/BCDC/MTC) The proposed General Plan incorporates sustainable planning principles, including strategies identified in the multi-agency Focus regional Blueprint program. Focus is a partnership of four regional agencies; MTC, ABAG, BAAQMD, and BCDC. Key strategies identified under the Focus program related to the reduction of GHG emissions include: • Encourage infill and the efficient use of land capacity within the community; • Provide for compact, complete, resource-efficient communities near existing or planned
transit and other infrastructure;
224 A San Francisco Superior Court order under Association of Irritated Residents et al. v. CARB (March 2010) requires the California Air Resources Board to complete additional environmental review before implementing the Cap-and-Trade Program outlined in the Climate Change Scoping Plan.
Section 3.0 Environmental Setting, Impacts, and Mitigation
Envision San José 2040 General Plan 822 Draft Program EIR City of San José June 2011
• Provide opportunities for people to live near their jobs and work near their homes; • Encourage a mix of land uses with jobs, housing, retail, schools, parks, recreation, and
services in proximity; • Locate development in areas served and likely to be served by frequent passenger rail, bus,
and/or ferry service; • Include measures designed to reduce the number and length of auto trips and facilitate
walking and biking. The proposed Envision San José 2040 General Plan would integrate land uses and transportation modes within the City with the aim of reducing and eliminating vehicle trips and associated GHG emissions within the City. At build-out, the jobs/housing balance within the City is projected to be 1.3, very slightly jobs-rich, which would fiscally benefit San José which is currently jobs-poor (0.8 jobs per employed resident in 2008). It is anticipated that overall the planned compact growth and measures to facilitate walking, bicycling, and transit would also help to reduce vehicle miles traveled and vehicle trips within the region as a whole. An exception would be where new employees resided outside of Santa Clara County, which could increase trip lengths. In consultation with local agencies, including the City of San José, approximately 120 Priority Development Areas that have infill development opportunity have been identified under the Focus program. Priority Development Areas in San José include Central and North San José, Communications Hill, Evergreen, and the Cottle Transit Village in Edenvale. Targeted growth near existing or planned fixed transit or bus service in Villages, Corridors and Employment Lands is proposed in these areas of San José. 3.15.5.4 Impacts of Rancho del Pueblo and iStar Residential Options As discussed in Section 2.2.8 in the Project Description, this PEIR also evaluates options for residential land use designations and anticipated future development on two properties; the Rancho del Pueblo Golf Course in the Alum Rock Planning Area and the iStar property in the Edenvale Planning Area (Residential Option Sites). Under these options one or both of these properties would be designated for residential uses instead of the industrial uses assumed on the iStar property and the park/open space on the existing Rancho del Pueblo Golf Course. Because these options also include modifications to other Growth Areas, adjusting the assumed dwelling units or jobs, the overall amount of development capacity assumed under the Preferred Scenario would not change citywide. A summary of environmental impacts for the residential options is shown in Table 3.15-9. Implementation of an updated General Plan that includes one or both of the residential options for the Rancho del Pueblo and iStar site would result in the same overall city-wide greenhouse gas emissions and carbon efficiency ratios in 2020 and 2035 as the proposed project. GHG emissions, therefore, would be the same as the proposed project.
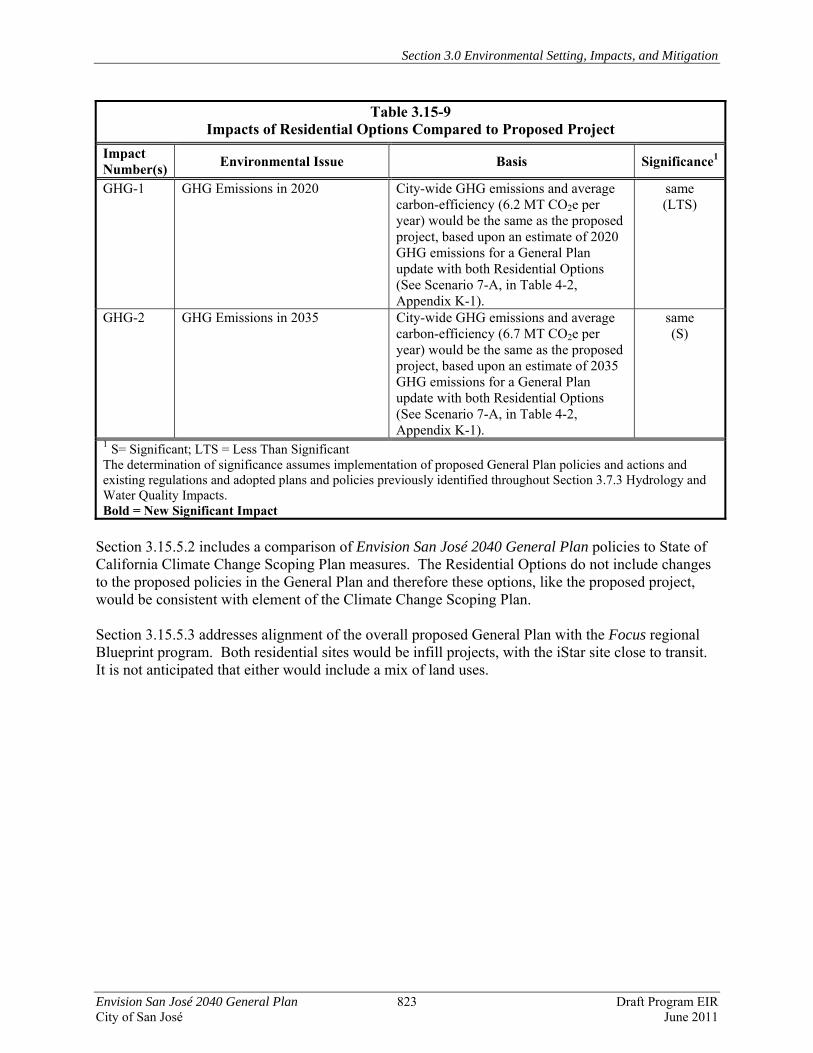
Section 3.0 Environmental Setting, Impacts, and Mitigation
Envision San José 2040 General Plan 823 Draft Program EIR City of San José June 2011
Table 3.15-9 Impacts of Residential Options Compared to Proposed Project
Impact Number(s) Environmental Issue Basis Significance1
GHG-1 GHG Emissions in 2020
City-wide GHG emissions and average carbon-efficiency (6.2 MT CO2e per year) would be the same as the proposed project, based upon an estimate of 2020 GHG emissions for a General Plan update with both Residential Options (See Scenario 7-A, in Table 4-2, Appendix K-1).
same (LTS)
GHG-2 GHG Emissions in 2035 City-wide GHG emissions and average carbon-efficiency (6.7 MT CO2e per year) would be the same as the proposed project, based upon an estimate of 2035 GHG emissions for a General Plan update with both Residential Options (See Scenario 7-A, in Table 4-2, Appendix K-1).
same (S)
1 S= Significant; LTS = Less Than Significant The determination of significance assumes implementation of proposed General Plan policies and actions and existing regulations and adopted plans and policies previously identified throughout Section 3.7.3 Hydrology and Water Quality Impacts. Bold = New Significant Impact
Section 3.15.5.2 includes a comparison of Envision San José 2040 General Plan policies to State of California Climate Change Scoping Plan measures. The Residential Options do not include changes to the proposed policies in the General Plan and therefore these options, like the proposed project, would be consistent with element of the Climate Change Scoping Plan. Section 3.15.5.3 addresses alignment of the overall proposed General Plan with the Focus regional Blueprint program. Both residential sites would be infill projects, with the iStar site close to transit. It is not anticipated that either would include a mix of land uses.
Section 3.0 Environmental Setting, Impacts, and Mitigation
Envision San José 2040 General Plan 824 Draft Program EIR City of San José June 2011
3.15.6 Mitigation and Avoidance Measures for Greenhouse Gas Emissions Impacts 3.15.6.1 Proposed General Plan
San José GHG Emissions in 2035 The General Plan includes a program-level Greenhouse Gas Reduction Strategy that provides the framework for implementing measures within the City’s purview and control. The Greenhouse Gas Reduction Strategy consists of a phased approach to update GHG emission inventories and projections, refine and improve reduction strategies, and confirm that the City is on track to first meet targets per AB 32 and then move progressively towards meeting the more aggressive goal of an 80 percent reduction in GHG emissions by 2050 (or 40 percent by 2035) compared to a 1990 baseline. Measures are identified in this inaugural version of the Greenhouse Gas Reduction Strategy that could result in GHG emission reductions of approximately 1.2 MMT beyond the business-as-usual emissions estimated for 2035. The emission reductions identified at this time are not large enough to meet the identified 3.04 MT CO2e/SP efficiency metric. As noted previously, given that much of built environment currently in place will likely remain in 2035, “retrofit” measures beyond the efficiencies of proposed new compact and transit oriented development will be needed. Achieving the substantial emission reductions called for in the 2035 emission target of approximately 3.0 MT CO2e/SP will require new and substantially advanced technologies that cannot be identified at this time as well as policy decisions and implementation of emission control regulations at the federal, state, and regional level regarding transportation, energy efficiency, and industrial emission controls. Citywide 2035 GHG emissions are projected to exceed the efficiency standard for 2035 developed in order to be on a trajectory to meet EO S-3-05 emissions levels and long-term 2050 climate change reduction goals for the State of California. Achieving the substantial emissions reductions beyond 2020 will require a multiple-pronged approach that includes policy decisions at the federal and state level and new and substantially advanced technologies that cannot be anticipated or predicted with any accuracy at this time. Policy and regulatory decisions by other agencies and technological advances are outside the City’s control, and therefore cannot be relied upon as feasible mitigation strategies. Given the uncertainties about the feasibility of achieving the needed 2035 emissions reductions, the City’s contribution to greenhouse gas emissions and climate change for the 2035 timeframe is conservatively determined to be cumulatively considerable. (Significant Unavoidable Impact) 3.15.6.2 Rancho del Pueblo and iStar Residential Options
San José GHG Emissions in 2035 Impacts and mitigation measures would be the same those described above for the proposed General Plan. (Significant Unavoidable Impact)
Section 3.0 Environmental Setting, Impacts, and Mitigation
Envision San José 2040 General Plan 825 Draft Program EIR City of San José June 2011
3.15.7 Significance Conclusions 3.15.7.1 Proposed General Plan The City’s estimated 2020 GHG emissions are projected to be below the average carbon-efficiency standard necessary to meet statewide 2020 goals as established by AB 32 and implementation of the Envision San José 2040 General Plan through 2020 would not constitute a cumulatively considerable contribution to global climate change. (Less Than Significant Impact) Implementation the proposed Envision San José 2040 General Plan in accordance with proposed policies and actions would clearly reduce greenhouse gas emissions compared to business as usual conditions. While the City’s proposed Greenhouse Gas Reduction Strategy includes adaptive management measures to incorporate additional GHG reduction measures in the future, there are uncertainties about the feasibility of achieving the sizable emissions reductions needed to meet California’s long-term goal of an 80 percent reduction in GHG emissions compared to 1990 levels. The City’s projected 2035 GHG emissions, without further substantial reductions, would constitute a cumulatively considerable contribution to global climate change by exceeding the average carbon-efficiency standard necessary to maintain a trajectory to meet statewide 2050 goals as established by Executive Order S-3-05 and remain significant and unavoidable. (Significant Unavoidable Impact) 3.15.7.2 Rancho del Pueblo and iStar Residential Options The significance conclusions for the Rancho del Pueblo and iStar Residential Options would be the same those described above for the proposed project. (Significant Unavoidable Impact)