Embed Size (px)
Citation preview

3.2 S-DWH Information Systems Architecture
The Information Systems connect the business to the infrastructures, in our context this is represented
by a conceptual organization of the effective S-DWH which is able to support tactical demands.
In the layered architecture, in terms of data system, we identify:
- the staging data are usually of temporary nature, and its contents can be erased, or archived,
after the DW has been loaded successfully;
- the operational data is a database designed to integrate data from multiple sources for
additional operations on the data. The data is then passed back to operational systems for
further operations and to the data warehouse for reporting;
- the Data Warehouse is the central repository of data which is created by integrating data from
one or more disparate sources and store current as well as historical data;
- data marts are kept in the access layer and are used to get data out to the users. Data marts
are derived from the primary information of a data warehouse, and are usually oriented to
specific business lines.
Figure 3 - Information Systems Architecture
The Metadata Management of metadata used and produced in all different layers of the warehouse
are specifically defined in the Metadata framework 1 and the Micro data linking2 . This is used for
description, identification and retrieval of information and links the various layers of the S-DWH, which
occurs through the mapping of different metadata description schemes; It contains all statistical
actions, all classifiers that are in use, input and output variables, selected data sources, descriptions of
output tables, questionnaires and so on. All these meta-objects are collected during design phase into
one metadata repository. It configures a metadata-driven system well-suited also for supporting the
management of actions or IT modules, in generic workflows.
In order to suggest a possible path towards process optimization and cost reduction, in this chapter
we will introduce a data model and a possible simple description of a generic workflow, which links
the business model with the information system in the S-DWH.
1 Lundell L.G. (2012) Metadata Framework for Statistical Data Warehousing, ver. 1.0. Deliverable 1.1 2 Ennok M et al. (2013) On Micro data linking and data warehousing in production of business statistics, ver. 1.1. Deliverable 1.4
Data Mart
ICT - Survey
…
SBS - Survey
ETrade - Survey
DATA MINING
Staging Data Operational Data Data Warehouse Data Mart
Data WarehouseData Mart
Data Mart
REPORTS
ADMIN
EDITING
operational
information
Interpretation and
Analysis Layer
Access
Layer
Integration
Layer
Source
Layer
operational
information
ANALYSIS
ANALYSIS

3.2.1 S-DWH is a metadata-driven system
The over-arching Metadata Management of a S-DWH as metadata-driven system supports Data
Management within the statistical program of an NSI, and it is therefore vital to thoroughly manage
the metadata. To address this we refer to the metadata chapter where metadata are organized in six
main categories. The main six categories are:
- active metadata, metadata stored and organized in a way that it enables operational use,
manual or automated;
- passive metadata, any metadata that are not active;
- formalised metadata, metadata stored and organised according to standardised codes, lists
and hierarchies;
- free-form metadata, metadata that contain descriptive information using formats ranging
from completely free-form to partly formalised;
- reference metadata, metadata that describe the content and quality of the data in order to
help the user understand and evaluate them (conceptually);
- structural metadata, metadata that help the user find, identify, access and utilise the data
(physically).
Metadata in each of these categories belong to a specific type, or subset of metadata. The five subsets
are:
- statistical metadata, data about statistical data e.g. variable definition, register description,
code list;
- process metadata, metadata that describe the expected or actual outcome of one or more
processes using evaluable and operational metrics;
- quality metadata, any kind of metadata that contribute to the description or interpretation of
the quality of data;
- technical metadata, metadata that describe or define the physical storage or location of data;
- authorization metadata are administrative data that are used by programmes, systems or
subsystems to manage user’s access to data.
In the S-DWH, one of the key factors is consolidation of multiple databases into a single database and
identifying redundant columns of data for consolidation or elimination. This involves coherence of
statistical metadata and in particular on managed variables. Statistical actions should collect unique
input variables, not just rows and columns of tables in a questionnaire. Each input variable should be
collected and processed once in each period of time. This should be done so that the outcome, input
variable in warehouse, could be used for producing various different outputs. This variable triggers
changes in almost all phases of statistical production process. So, samples, questionnaires, processing
rules, imputation methods, data sources, etc., must be designed and built in compliance with
standardized input variables, not according to the needs of one specific statistical action.
The variable based on statistical production system reduces the administrative burden, lowers the cost
of data collection and processing and enables to produce richer statistical output faster. Of course, this
is true in boundaries of standardized design. This means that a coherent approach can be used if
statisticians plan their actions following a logical hierarchy of the variables estimation in a common
frame. What the IT must support is then an adequate environment for designing this strategy.
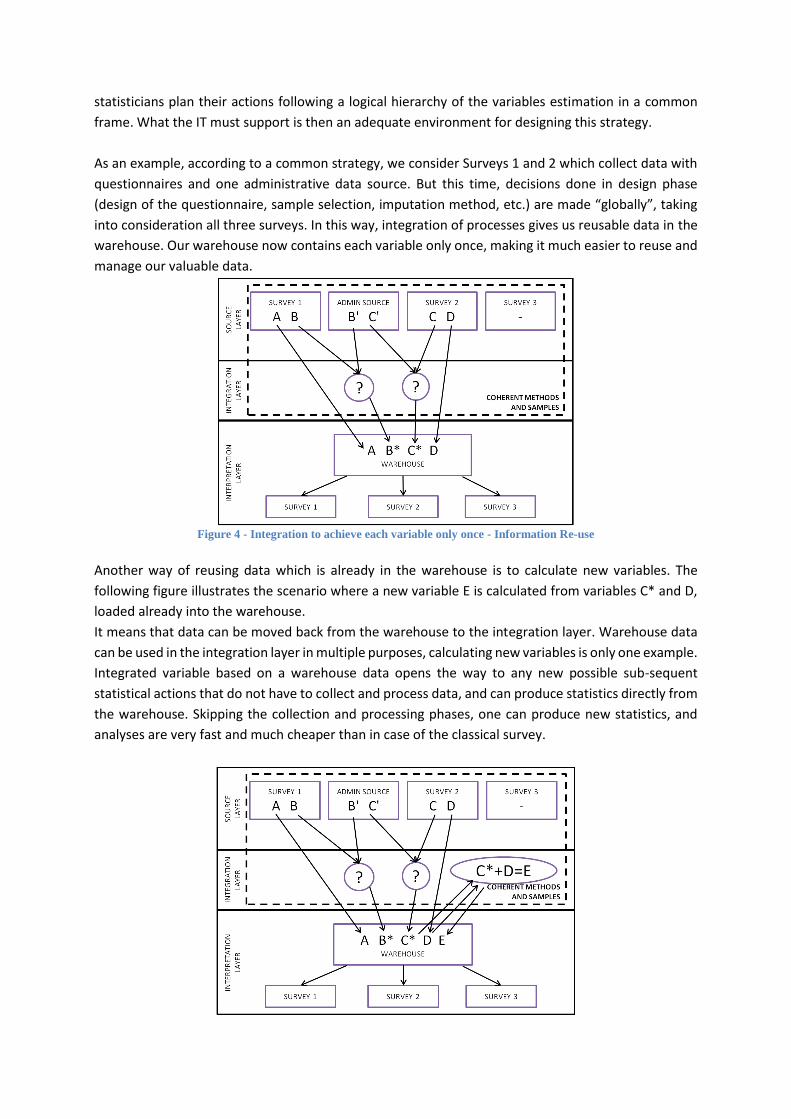
As an example, according to a common strategy, we consider Surveys 1 and 2 which collect data with
questionnaires and one administrative data source. But this time, decisions done in design phase
(design of the questionnaire, sample selection, imputation method, etc.) are made “globally”, taking
into consideration all three surveys. In this way, integration of processes gives us reusable data in the
warehouse. Our warehouse now contains each variable only once, making it much easier to reuse and
manage our valuable data.
Figure 4 - Integration to achieve each variable only once - Information Re-use
Another way of reusing data which is already in the warehouse is to calculate new variables. The
following figure illustrates the scenario where a new variable E is calculated from variables C* and D,
loaded already into the warehouse.
It means that data can be moved back from the warehouse to the integration layer. Warehouse data
can be used in the integration layer in multiple purposes, calculating new variables is only one example.
Integrated variable based on a warehouse data opens the way to any new possible sub-sequent
statistical actions that do not have to collect and process data, and can produce statistics directly from
the warehouse. Skipping the collection and processing phases, one can produce new statistics, and
analyses are very fast and much cheaper than in case of the classical survey.
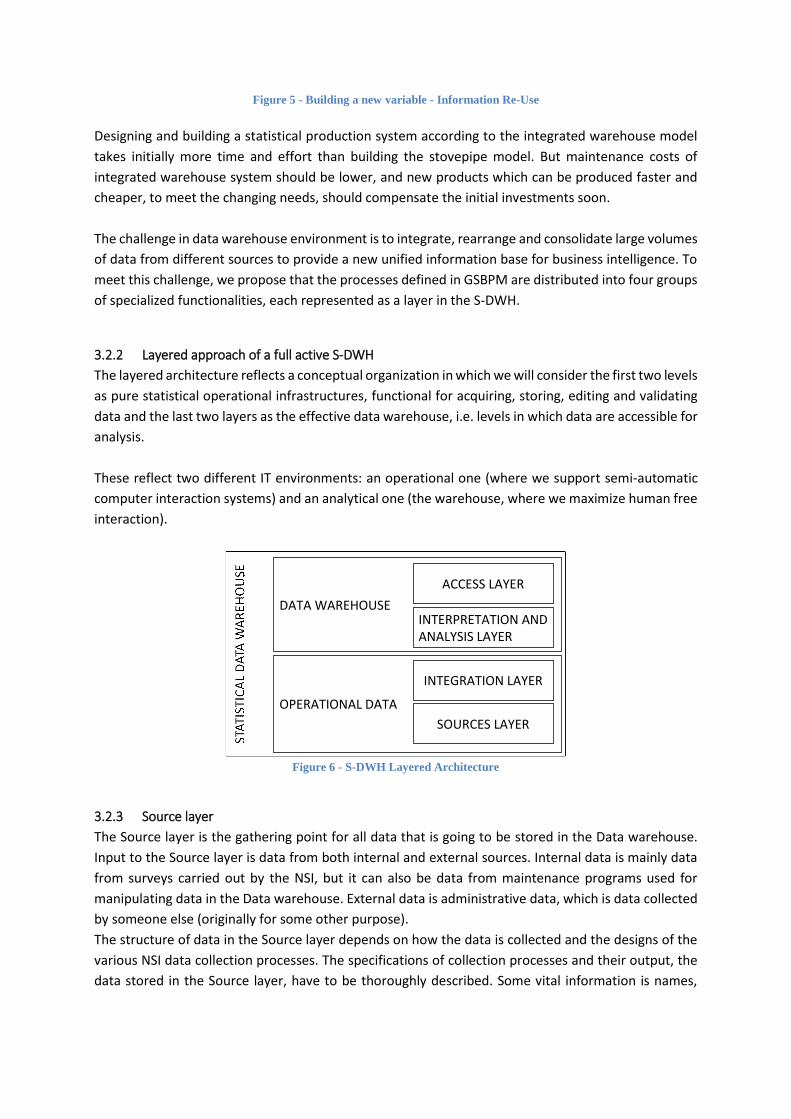
Figure 5 - Building a new variable - Information Re-Use
Designing and building a statistical production system according to the integrated warehouse model
takes initially more time and effort than building the stovepipe model. But maintenance costs of
integrated warehouse system should be lower, and new products which can be produced faster and
cheaper, to meet the changing needs, should compensate the initial investments soon.
The challenge in data warehouse environment is to integrate, rearrange and consolidate large volumes
of data from different sources to provide a new unified information base for business intelligence. To
meet this challenge, we propose that the processes defined in GSBPM are distributed into four groups
of specialized functionalities, each represented as a layer in the S-DWH.
3.2.2 Layered approach of a full active S-DWH
The layered architecture reflects a conceptual organization in which we will consider the first two levels
as pure statistical operational infrastructures, functional for acquiring, storing, editing and validating
data and the last two layers as the effective data warehouse, i.e. levels in which data are accessible for
analysis.
These reflect two different IT environments: an operational one (where we support semi-automatic
computer interaction systems) and an analytical one (the warehouse, where we maximize human free
interaction).
Figure 6 - S-DWH Layered Architecture
3.2.3 Source layer
The Source layer is the gathering point for all data that is going to be stored in the Data warehouse.
Input to the Source layer is data from both internal and external sources. Internal data is mainly data
from surveys carried out by the NSI, but it can also be data from maintenance programs used for
manipulating data in the Data warehouse. External data is administrative data, which is data collected
by someone else (originally for some other purpose).
The structure of data in the Source layer depends on how the data is collected and the designs of the
various NSI data collection processes. The specifications of collection processes and their output, the
data stored in the Source layer, have to be thoroughly described. Some vital information is names,
SOURCES LAYER
INTEGRATION LAYER
INTERPRETATION AND ANALYSIS LAYER
ACCESS LAYER
DATA WAREHOUSE
OPERATIONAL DATA

meaning, definition and description, of any collected variable. Also the collection process itself must
be described, for example the source of a collected item, when it was collected and how.
When data are entering in the source layer from an external source, or administrative archive, data
and relative metadata must be checked in terms of completeness and coherence.
From a data structure point of view, external data are stored with the same data structure as they
arrive. The integration toward the integration layer should be then implemented by mapping of the
source variable with the target variable, i.e. the internal variable to the S-DWH.
The mapping is a graphic or conceptual representation of information to represent some relationships
within the data, i.e. the process of creating data element mappings between two distinct data models.
The common and original practice of mapping is the interpretation of an administrative archive in
terms of S-DWH definition and meaning.
Data mapping involves combining data residing in different sources and providing users with a unified
view of these data. These systems are formally defined as a triple <T,S,M> where T is the target
schema, S is the heterogeneous set of source schemas, and M is the mapping that maps queries
between the source and the target schemas.
Metadata of source layer
ADMIN DATA
Data mapping
Figure 1 - Data Mapping

Queries over the data mapping system also assert the data linking between elements in the sources
and the business register units.
None of the internal sources need mapping since the data collection process is defined in a S-DWH
during the design phase by using internal definitions.
Metadata of source layer
ADMIN DATA
TARGET SCHEMA ADMIN DATA
Data mapping
Figure 2 - Data Mapping Example
Figure 3 - Source Layer Overview

3.2.4 Integration layer
From the Source layer, data is loaded into the Integration layer. This represents an operational system
used to process the day-to-day transactions of an organization. These systems are designed to
efficiently process and maintain transactional integrity. The process of translating data from source
systems and transform it into useful content in the data warehouse is commonly called ETL. In the
Extract step, data is moved from the Source layer and made accessible in the Integration layer for
further processing.
The Transformation step involves all the operational activities usually associated with the typical
statistical production process. Examples of activities carried out during the transformation are:
- Find, and if possible, correct the incorrect data;
- Transform data to formats matching standard formats in the data warehouse;
- Classify and code;
- Derive new values;
- Combine data from multiple sources;
- Clean data, that is for example correct misspellings, remove duplicates and handle missing
values;
To accomplish the different tasks in the transformation of new data to useful output, data already in
the data warehouse is used to support the work. Examples of such usage are using existing data
together with new ones to derive a new value or using old data as a base for imputation.
Each variable in the data warehouse may be used for several different purposes in any number of
specified outputs. As soon as a variable is processed in the Integration layer in a way that it is useful in
the context of data warehouse output, it has to be loaded into the Interpretation layer and the Access
layer.
The Integration layer is an area for processing data: this is implemented by operators specialized in ETL
functionalities. Since the focus for the Integration layer is on processing rather than search and
analysis, data in the Integration layer should be stored in generalized normalized structure, optimized
for OLTP (Online transaction processing, is a class of information systems that facilitate and manage
transaction-oriented applications, typically for data entry and retrieval transaction processing), where
all data are stored in similar data structure independently from the domain or topic and each fact is
stored only in one point in order to make easier maintenance of consistent data.
Figure 4 - OLTP Online Transaction Processing

It is well known that these databases are very powerful when it comes to data manipulation as
inserting, updating and deleting, but are very ineffective when we need to analyse and deal with a
large amount of data. Another constraint in the use of OLTP is their complexity. Users must have great
expertise to manipulate them and it is not easy to understand all the intricacy.
During the several ETL processes, a variable will likely appear in several versions. Every time a value is
corrected or changed for some reason, the old value should not be erased but a new version of that
variable should be stored. That is a mechanism used to ensure that all items in the database can be
followed over time.
Figure 5 - Integration layer Overview
3.2.5 Interpretation and Data Analysis layer
This layer contains all collected data processed and structured to be optimized for analysis, as well as
the base for output planned by the NSI. The Interpretation layer is specially designed for statistical
experts and is built to support data manipulation of big complex search operations. Typical activities
in the Interpretation layer are hypothesis testing, data mining and design of new statistical strategies,
as well as designing data cubes functional to the Access layer.
Its underlying data model is not specific to a particular reporting or analytic requirement. Instead of
focusing on a process-oriented design, the repository design is modelled based on data inter-
relationships that are fundamental to the organization across processes.

Data warehousing became an important strategy to integrate heterogeneous information sources in
organizations, and to enable their analysis and quality. Although data warehouses are built on
relational database technology, the design of a data warehouse database differs substantially from the
design of an online transaction processing system (OLTP) database.
The Interpretation layer will contain micro data, elementary observed facts, aggregations and
calculated values. It will contain all data at the finest granular level in order to be able to cover all
possible queries and joins. A fine granularity is also a condition used to manage changes of required
output over time.
Besides the actual data warehouse content, the Interpretation layer may contain temporary data
structures and databases created and used by the different ongoing analysis projects carried out by
statistics specialists. The ETL process in integration level continuously creates metadata regarding the
variables and the process itself that is stored as a part of the data warehouse.
In a relational database, fact tables of the Interpretation layer should be organized in dimensional
structure to support data analysis in an intuitive and efficient way. Dimensional models are generally
structured with fact tables and their belonging dimensions. Facts are generally numeric, and
dimensions are the reference information that gives context to the facts. For example, a sales trade
transaction can be broken up into facts, such as the number of products moved and the price paid for
the products, and into dimensions, such as order date, customer name and product number.
A key advantage of a dimensional approach is that the data warehouse is easy to use and operations
on data are very quick. In general, dimensional structures are easy to understand for business users,
because the structures are divided into measurements/facts and context/dimensions related to the
organization’s business processes.
A dimension is sometimes referred to as an axis for analysis. Time and Location are the classic basic
dimensions. A dimension is a structural attribute of a cube that consists in a list of elements, all of
which are of a similar type in the user's perception of the data. For example, all months, quarters,
years, etc., make up a time dimension; likewise all cities, regions, countries, etc., make up a geography
dimension.
A dimension table is one of the sets of companion tables for a fact table and normally contains
attributes or (fields) used to constrain and group data when performing data warehousing queries.
Dimensions correspond to the "branches" of a star schema.
Figure 6 - Star Schema

The positions of the dimensions are organised according to a series of cascading one to many
relationships. This way of organizing data is comparable to a logical tree, where each member has only
one parent but a variable number of children. For example the positions of the Time dimension might
be months, but also days, periods or years.
Figure 7 - Time Dimension
A dimension can have an hierarchy, which is classified into levels. All the positions for a level
correspond to a unique classification. For example, in a "Time" dimension, level one stands for days,
level two for months and level three for years. The dimensions can be balanced, unbalanced or ragged.
In balanced hierarchies, the branches of the hierarchy all descend to the same level, with each
member's parent being at the level immediately above the member. In unbalanced hierarchies, not all
the branches of the hierarchy reach to the same level but each member's parent does belong to the
level immediately above it.
Figure 8 - Unbalanced Hierarchies
In ragged hierarchies, the parent member of at least one member of the dimension is not in the level
immediately above the member. Like unbalanced hierarchies, the branches of the hierarchies can
descend to different levels. Usually, unbalanced and ragged hierarchies must be transformed into
balanced hierarchies.
Figure 9 – Ragged Dimension

A fact table consists of measurements, metrics or facts of a statistical topic. The fact table in the S-DWH
is organized in a dimensional model, built on a star-like schema, with dimensions surrounding it. In the
S- S-DWH, the fact table is defined at the finer level of granularity with information organized in
columns distinguished in dimensions, classifications and measures. Dimensions are the descriptions of
the fact table. Typically dimensions are nouns like date, class of employ, territory, NACE, etc. and could
have hierarchy on it, for example, the date dimension could contain data such as year, month and
weekday.
The definition of a star schema would be implemented by dynamic ad hoc queries from the integration
layer by the proper metadata, in order to generally implement data transposition query. With a
dynamic approach, any expert user should define its own analysis context starting from the already
existing data mart and virtual or temporary environment derived from the data structure of the
integration layer. This method allows users to automatically build permanent or temporary data marts
according to their needs, leaving them free to test any possible new strategy.
3.2.6 Access layer
The Access layer is the layer for the final presentation, dissemination and delivery of information. This
layer is used by a wide range of users and computer instruments. The data is optimized to effectively
present and compile data. Data may be presented in data cubes and different formats specialized to
support different tools and software. Generally the data structure is optimized for MOLAP
(Multidimensional Online Analytical Processing). It uses specific analytical tools on a multidimensional
data model or ROLAP, Relational Online Analytical Processing, as well as specific analytical tools on a
Figure 10 - Interpretation and Data Analysis Layer Overview

relational dimensional data model which is easy to understand and does not require pre-computation
and storage for the information.
Figure 11 - Access layer Overview
Multidimensional structure is defined as “a variation of the relational model that uses
multidimensional structures to organize data and express the relationships between data”. The
structure is broken into cubes and the cubes are able to store and access data within the confines of
each cube. “Each cell within a multidimensional structure contains aggregated data related to
elements along each of its dimensions”. Even when data is manipulated it remains easy to access and
continues to constitute a compact database format. The data still remains interrelated.
Multidimensional structure is quite popular for analytical databases that use online analytical
processing (OLAP) applications. Analytical databases use these because of their ability to deliver
answers to complex business queries swiftly. Data can be viewed from different angles, which gives a
broader perspective of a problem unlike other models. Some Data Mart might need to be refreshed
from the Data Warehouse daily, whereas user groups might need to be refreshed only monthly.
Each Data Mart can contain different combinations of tables, columns and rows from the Statistical
Data Warehouse. For example, a statistician or user group that doesn't require a lot of historical data
might only need transactions from the current calendar year in the database. The analysts might need
to see all details about data, whereas data such as "salary" or "address" might not be appropriate for
a Data Mart that focuses on Trade.
Three basic types of data marts are dependent, independent, and hybrid. The categorization is based
primarily on the data source that feeds the data mart. Dependent data marts draw data from a central
data warehouse that has already been created. Independent data marts, in contrast, are standalone

systems built by drawing data directly from operational or external sources of data or both. Hybrid
data marts can draw data from operational systems or data warehouses.
The Data Mart in the ideal information system architecture of a full active S-DWH, are dependent data
marts: data in a data warehouse is aggregated, restructured and summarized when it passes into the
dependent data mart. The architecture of a dependent data mart is as follows.
Figure 12 - Dependent versus Independent Data Marts
There are benefits of building a dependent data mart:
Performance: when performance of a data warehouse becomes an issue, building one or two dependent data marts can solve the problem, because the data processing is performed outside the data warehouse.
Security: by putting data outside data warehouse in dependent data marts, each department owns their data and has complete control over their data.