Embed Size (px)
Citation preview
NatCen Social Research
British Social Attitudes 33 | Work 1
WorkAttitudes and experiences of work in a changing labour marketThe labour market has seen various changes since the 1980s, with greater numbers now in employment, and a higher proportion of graduates in the population as a whole. The UK is still recovering from the financial crisis of 2008 and the recession that followed. Against this backdrop of a shifting labour market, our chapter asks how attitudes to work, and experiences of it, have changed.
More have good quality jobs, though job security remains elusive for some71% of workers have a ‘good’ job (one with at least 4 positive attributes such as being interesting, helping others and/or society, and offering chances for advancement), compared with 62% in 2005 and 57% in 1989.
65%
Think they have job security
92%
Think job security is important
While 92% of people think that job security is either important, or very important, only around two-thirds of workers (65%) agree they actually have this in their job.
Jobs are valued beyond their financial benefits
49% 62%
20152005
62% of respondents say they would enjoy having a job even if they didn’t need the money, up from 49% in 2005.
Social class and education make a difference to financial motivations to work; 63% of those in professional or managerial occupations disagree a job is solely about the money earned, while the same is true for only 34% of those in routine or semi-routine occupations.
37%
28%
2015
1989
Stress at work has increased37% of workers experience stress “always” or “often”, compared with 28% in 1989. Professional and managerial workers, and those aged 35-44 are most likely to feel stressed.
NatCen Social Research
British Social Attitudes 33 | Work 2
Author
Stephen McKay, University of LincolnIan Simpson, Senior Researcher, NatCen Social Research
IntroductionFor many people under the age of 65, work is a central feature of life. The quality of a person’s job can have an important bearing on their health and life chances (Coats and Lehki, 2008). Jobs associated with better health and wellbeing include those with more autonomy, security and good financial rewards (Bryson et al., 2011). In recent years, academic and popular attention has focused on two changes in the labour market that have raised concerns about the prevalence of poor quality jobs and the negative impact of the changing nature of some jobs. First is the possibility that the labour market is ‘polarising’, meaning that there are more good jobs, and more bad jobs, with a hollowing out of middling jobs in between (Goos and Manning, 2007). Second is the notion of ‘work intensification’ – the idea that, despite higher living standards, more is now demanded of workers in terms of shorter deadlines, a faster pace of work, potentially greater monitoring of individuals, and overall a higher level of stress (Green, 2007). This may overlap with issues of polarisation if only some groups of workers are facing such harsher working conditions.
Questions and concerns about the quality of a person’s job may seem less vital at a time when the real pressure is on having a job at all. As we write, the UK continues to slowly emerge from a deep and prolonged period of recession. Many jobs were lost at the start of that recession, but fewer than would have been expected given the reduction in the overall level of economic activity (McKay and Smith, 2015). A longer-term perspective reveals that employment levels are actually higher now than in the 1980s. But the recession has a broader impact than employment rates alone. Wage growth has remained very slow, trailing behind changes in prices in many years after the recession. By 2015 (when the latest survey took place), wages had started to rise, and employment continued on a strong upward path. Despite this, levels of optimism about the recovery and any growth in living standards have, if anything, tended to stall.
How do these theories about the changing nature of work and labour market trends relate to people’s attitudes to and experiences of work? This chapter uses long-term data on work orientation and perceptions of job quality to explore a number of related questions. We begin by asking how attitudes to work have changed over the longer-term, and whether there’s any evidence of the impact of the recession. We then examine the extent to which people have the type of jobs that they want, and assess whether jobs are polarising (with evidence of both more good jobs and more bad jobs over time). Finally we look at how stressed workers are feeling and how much control or autonomy they have in their jobs, to shed light on whether work has intensified over time. Throughout, we consider whether different subgroups (using a range of socio-demographic background characteristics) have particular work attitudes and experiences.
NatCen Social Research
British Social Attitudes 33 | Work 3
Our chapter draws on data from a module of questions on Work Orientation, included in the survey as part of the International Social Survey Programme (ISSP). The questions have been fielded four times, in 1989, 1997, 2005 and 2015, allowing us to examine long-term trends in people’s attitudes towards, and experiences of, work. The timing of the two most recent readings limits the potential of the data to reveal short-term responses to the recession - 2005 being before it occurred, and 2015 being a relatively optimistic moment of the recovery from the recession. We will however reflect on whether there are any signs of a lasting impact of the recession on attitudes to work.
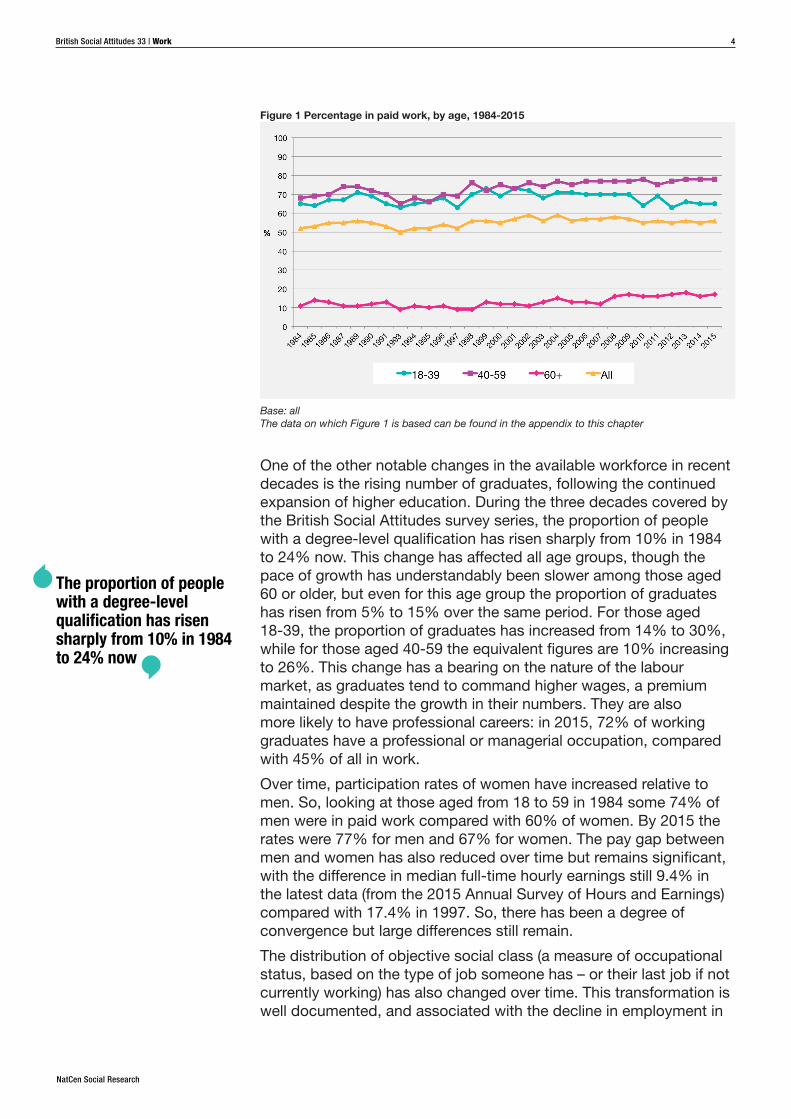
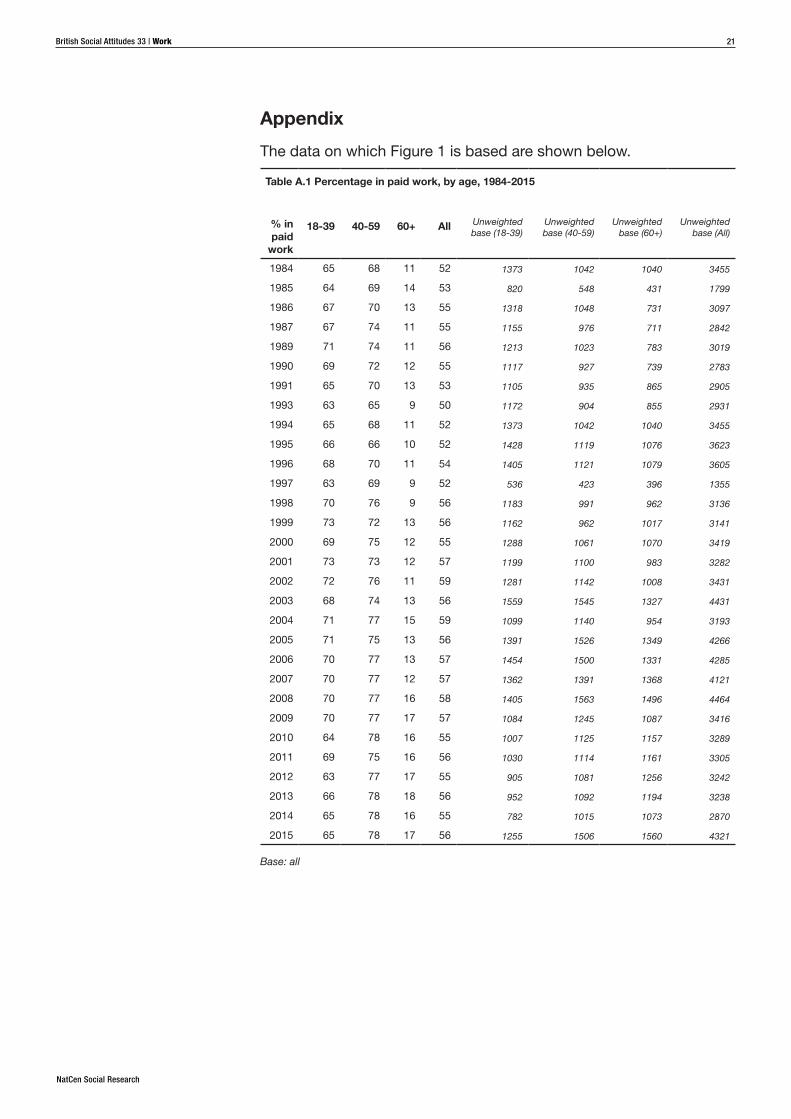
Setting the scene: labour market trendsWe start by reviewing some overarching trends in the labour market. In 2015, 56% of people overall are in work - a rather higher proportion than in the early 1980s and mid-1990s (see Figure 1), with actual numbers in work reaching record levels (ONS, 2016). While the recession of the early 1990s was rather less severe than that of the most recent global financial crash (Faccini and Hackworth, 2010), its effect on rates of employment was rather greater. In contrast, since 2008/09, the overall proportion in work has been fairly consistent, with rates stable for those aged 40-59, and increasing somewhat for those aged 60 or older (rates are now around four percentage points higher than the years prior to the crisis).
It is younger people who have faced the greatest challenges in remaining in, or securing, paid work. In 2015, 65% of people aged under 40 were in paid work, compared with 78% of those aged 40-59. For the under 40s, this is a level similar to most years since 2010, lower than the 70% figure seen in most years in the preceding decade. The figure also illustrates the differential experiences of younger and older workers. The employment rates of these groups had been converging in the early 2000s, but since then a gap has opened up which shows no sign of closing. This may be due to employers restricting recruitment during the recession and the subsequent slow recovery, particularly affecting those new to the labour market.
It is younger people who have faced the greatest challenges in remaining in, or securing, paid work
NatCen Social Research
British Social Attitudes 33 | Work 4
Figure 1 Percentage in paid work, by age, 1984-2015
Base: allThe data on which Figure 1 is based can be found in the appendix to this chapter
One of the other notable changes in the available workforce in recent decades is the rising number of graduates, following the continued expansion of higher education. During the three decades covered by the British Social Attitudes survey series, the proportion of people with a degree-level qualification has risen sharply from 10% in 1984 to 24% now. This change has affected all age groups, though the pace of growth has understandably been slower among those aged 60 or older, but even for this age group the proportion of graduates has risen from 5% to 15% over the same period. For those aged 18-39, the proportion of graduates has increased from 14% to 30%, while for those aged 40-59 the equivalent figures are 10% increasing to 26%. This change has a bearing on the nature of the labour market, as graduates tend to command higher wages, a premium maintained despite the growth in their numbers. They are also more likely to have professional careers: in 2015, 72% of working graduates have a professional or managerial occupation, compared with 45% of all in work.
Over time, participation rates of women have increased relative to men. So, looking at those aged from 18 to 59 in 1984 some 74% of men were in paid work compared with 60% of women. By 2015 the rates were 77% for men and 67% for women. The pay gap between men and women has also reduced over time but remains significant, with the difference in median full-time hourly earnings still 9.4% in the latest data (from the 2015 Annual Survey of Hours and Earnings) compared with 17.4% in 1997. So, there has been a degree of convergence but large differences still remain.
The distribution of objective social class (a measure of occupational status, based on the type of job someone has – or their last job if not currently working) has also changed over time. This transformation is well documented, and associated with the decline in employment in
The proportion of people with a degree-level qualification has risen sharply from 10% in 1984 to 24% now
NatCen Social Research
British Social Attitudes 33 | Work 5
the British manufacturing industry over the last few decades (Lindsay, 2003). Latest data from ONS show that in 2016, 22% of people in work are in semi-routine or routine jobs.1
These four key socio-demographic variables - age, sex, education and social class - are themselves associated with people’s experience of, or relationship with, the labour market. They are related not just to employment rates, but also the types of jobs, level of pay, hours worked and so on, that people have (see ONS, 2016 for recent labour market analyses). In the rest of the chapter, we therefore note where these characteristics are related to attitudes towards, and experiences of, paid work.
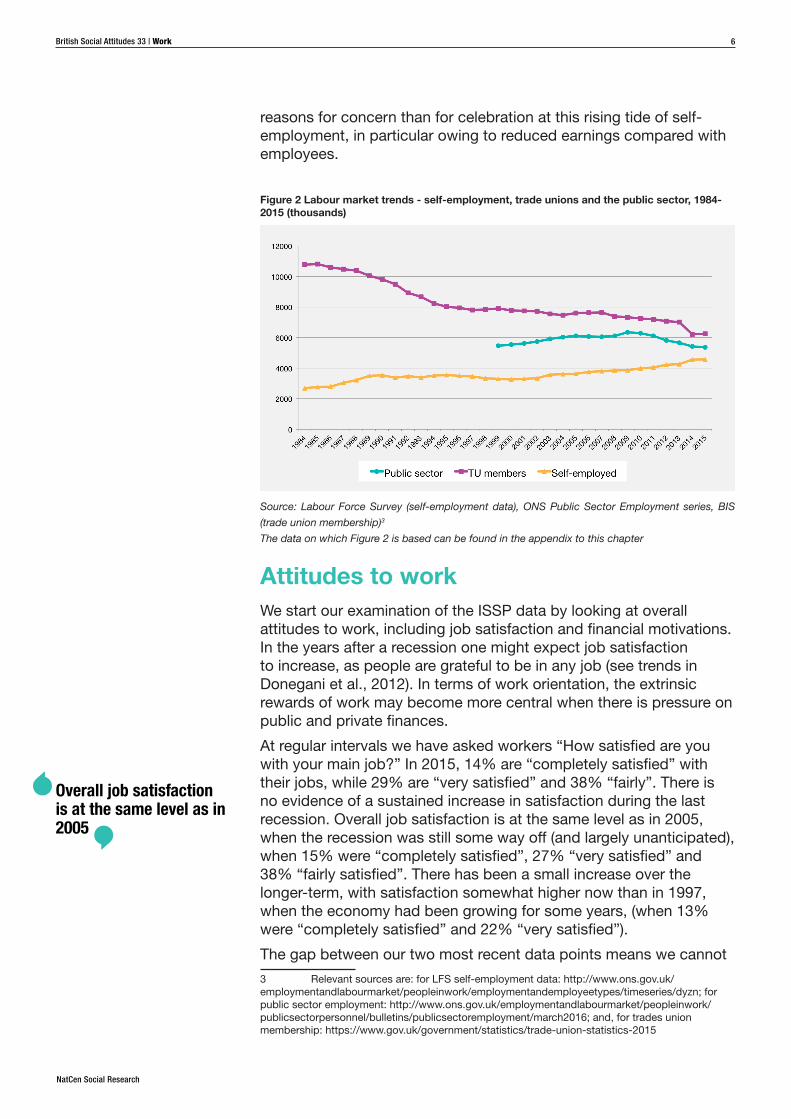
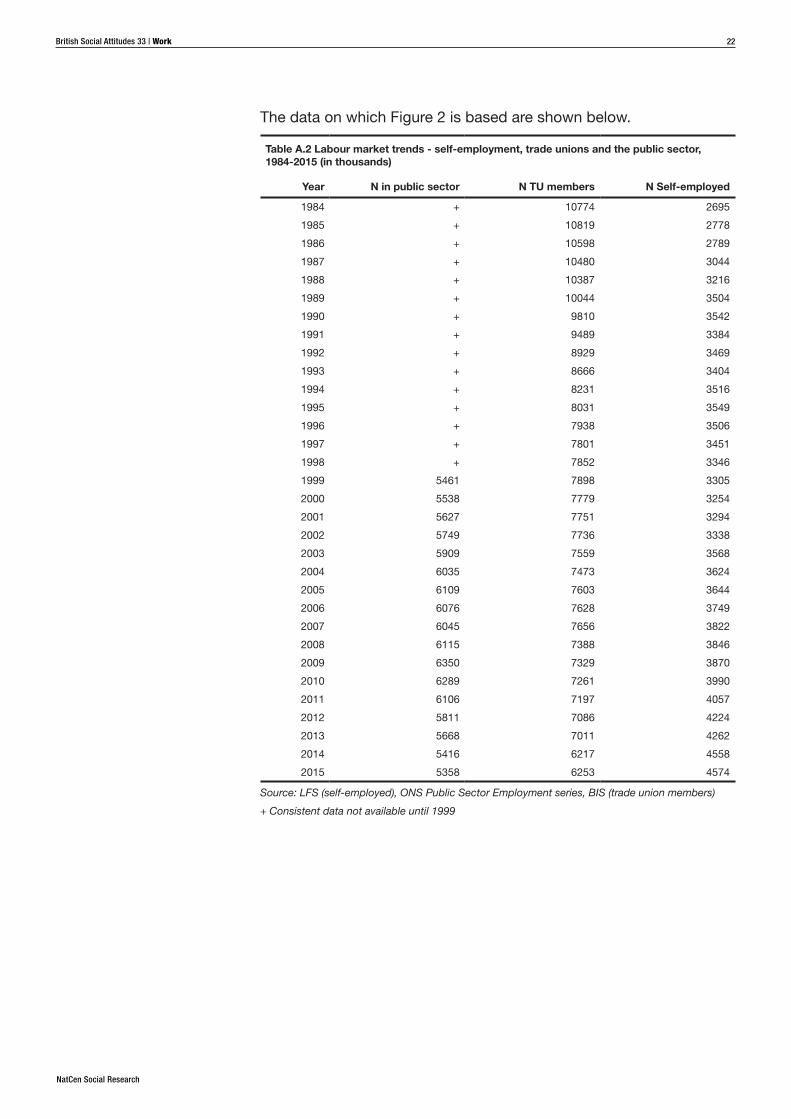
Figure 2 shows some other key trends in the labour market over time (using other data sources). First, the proportion that are members of a trade union is in long-term decline. In 1984 close to 11 million workers were members of trade unions, but this has dropped to a little over 6 million by 2015. This trend may help to explain changes in income inequality, which in turn is driven by changes in wages (and in social security benefits). Conditions in the lower half of the income distribution seem to be strongly linked to the decline of unionisation for lower-skilled jobs (Holmes and Mayhew, 2012). However the declines in union coverage were most marked during the late 1980s and early 1990s, when inequality was increasing, and since the late 1980s reductions in coverage have occurred but at a more gradual rate.
Conversely, the proportion working in the public sector increased between 1999 (when consistent data was first available) and 2009, rising from 5.4 million jobs to 6.3 million. Since then numbers have decreased to 5.4 million, the lowest since 1999.2
Last, we note that self-employment has been rising over the last 15 or so years, and now represents 4.5 million workers. While employment did not fall proportionately in the years after the 2008 financial crisis, many of the new jobs created (at least for a time) tended to be part-time or self-employed (Rowlingson and McKay, 2015). Self-employment may be portrayed positively as a sign of flexibility and an entrepreneurial spirit. However, some people may feel compelled to enter self-employment if more standard employment is not available, and often the self-employed find it harder to access pensions and other key benefits of employment. In a detailed analysis, D’Arcy and Gardiner (2014) tended to find more
1 This figure is based on NS-SEC (Socio-Economic Classification) and the data are available at www.ons.gov.uk/employmentandlabourmarket/peopleinwork/employmentandemployeetypes/datasets/. This is backed up by analysis of BSA data over time: in the 1989 survey, 25% were in the highest social class, while 37% were in the lowest social class. By 2015 the proportions have reversed: 43% are now in the highest social class while 22% are in the lowest class. Percentages are based on all those who have ever had a paid job. This excludes a small proportion of respondents who have never worked. The 1989 figures are based on a recoding of the Goldthorpe-Heath 5-category class scheme, while 2015 figures are based on a 5 category version of SEG (Socio-Economic Group) (as this results in categories which are conceptually similar over time). See footnote 5 for more detail on social class analysis in the rest of the chapter.2 This ONS series allows for changes in the treatment of different groups as being in the public sector, for details see: http://www.ons.gov.uk/employmentandlabourmarket/peopleinwork/publicsectorpersonnel/bulletins/publicsectoremployment/december2015
Self-employment now represents 4.5 million workers
NatCen Social Research
British Social Attitudes 33 | Work 6
reasons for concern than for celebration at this rising tide of self-employment, in particular owing to reduced earnings compared with employees.
Figure 2 Labour market trends - self-employment, trade unions and the public sector, 1984-2015 (thousands)
Source: Labour Force Survey (self-employment data), ONS Public Sector Employment series, BIS (trade union membership)3 The data on which Figure 2 is based can be found in the appendix to this chapter
Attitudes to workWe start our examination of the ISSP data by looking at overall attitudes to work, including job satisfaction and financial motivations. In the years after a recession one might expect job satisfaction to increase, as people are grateful to be in any job (see trends in Donegani et al., 2012). In terms of work orientation, the extrinsic rewards of work may become more central when there is pressure on public and private finances.
At regular intervals we have asked workers “How satisfied are you with your main job?” In 2015, 14% are “completely satisfied” with their jobs, while 29% are “very satisfied” and 38% “fairly”. There is no evidence of a sustained increase in satisfaction during the last recession. Overall job satisfaction is at the same level as in 2005, when the recession was still some way off (and largely unanticipated), when 15% were “completely satisfied”, 27% “very satisfied” and 38% “fairly satisfied”. There has been a small increase over the longer-term, with satisfaction somewhat higher now than in 1997, when the economy had been growing for some years, (when 13% were “completely satisfied” and 22% “very satisfied”).
The gap between our two most recent data points means we cannot
3 Relevant sources are: for LFS self-employment data: http://www.ons.gov.uk/employmentandlabourmarket/peopleinwork/employmentandemployeetypes/timeseries/dyzn; for public sector employment: http://www.ons.gov.uk/employmentandlabourmarket/peopleinwork/publicsectorpersonnel/bulletins/publicsectoremployment/march2016; and, for trades union membership: https://www.gov.uk/government/statistics/trade-union-statistics-2015
Overall job satisfaction is at the same level as in 2005
NatCen Social Research
British Social Attitudes 33 | Work 7
rule out a (short-lived) increase in the years immediately following the 2008 financial crisis. Indeed there is evidence of that from other sources; McManus and Perry writing in our 29th Report (2012) found job satisfaction had increased in the first few years after the crisis, albeit using a different measure.
What of our assumption that the experience of recession might have strengthened financial motivations to work? We asked all respondents (not just those in work) how far they agree or disagree with the following statements:
I would enjoy having a paid job even if I did not need the money
A job is just a way of earning money - no more
Is work all about the money? It seems not. A majority say they would enjoy working even if they didn’t need the money - and this proportion has been slowly increasing over time (see Table 1). In 2015, 62% of people say they would enjoy having a job even if they didn’t need the money, up from 49% in each of 2005 and 1997, and 54% in 1989. Twice as many in 2015, compared with 1989, strongly agree that they would enjoy having employment even if their financial circumstances did not require it.
Similarly, around half disagree that “a job is just a way of earning money”, and nothing more (with smaller proportions agreeing), and on this measure there has been little change over time. Taken together, this somewhat weak financial motivation to work is reinforced by findings later in the chapter which show that people in work do not rate having a high income as being especially important, particularly when compared with greater job security and having an interesting job.
Table 1 Financial motivation to work, 1989-2015
1989 1997 2005 2015
Would enjoy having a job even if
didn’t need the money
% Strongly agree 7 6 9 14
% Agree 47 42 40 48
A job is just a way of earning money
- no more
% Disagree 39 35 35 34
% Strongly disagree 13 11 12 15
Unweighted base 1516 1080 913 1793
Base: all
Slightly more of those in professional occupations, and graduates, say they would work even if they did not need the income, but differences are relatively small. However, on the second question
62% of people say they would enjoy having a job even if they didn’t need the money
NatCen Social Research
British Social Attitudes 33 | Work 8
(which is the far stronger statement about a job being solely about money) there are large differences by social class and education. In 2015, 63% of those in professional or managerial occupations disagree that a job is solely about the money earned compared with only 34% of those in routine or semi-routine occupations (and 49% overall). There has been little change on this since 2005. A similar pattern is evident for education, with 65% of graduates disagreeing that a job is only about earning money, compared with 48% of those with O level/GCSE qualifications and just 35% of those with no qualifications. There are only small, or no differences in financial motivation by age and by sex.
What people want - and get - from their jobs
We turn now to look at people’s views about which different attributes they think are important in a job, and - for those in work - which of these they have in their employment. A number of these questions have been consistently asked since our survey began, which permits analysis of changes in the nature of people’s relationship with the labour market over time. First, we gave respondents a list of different job attributes, and asked them to say how important they personally thought each one was:
Job security
High income
Good opportunities for advancement
An interesting job
A job that allows someone to work independently
A job that allows someone to help other people
A job that is useful to society
A job that allows someone to decide their times or days of work
A job that involves personal contact with other people
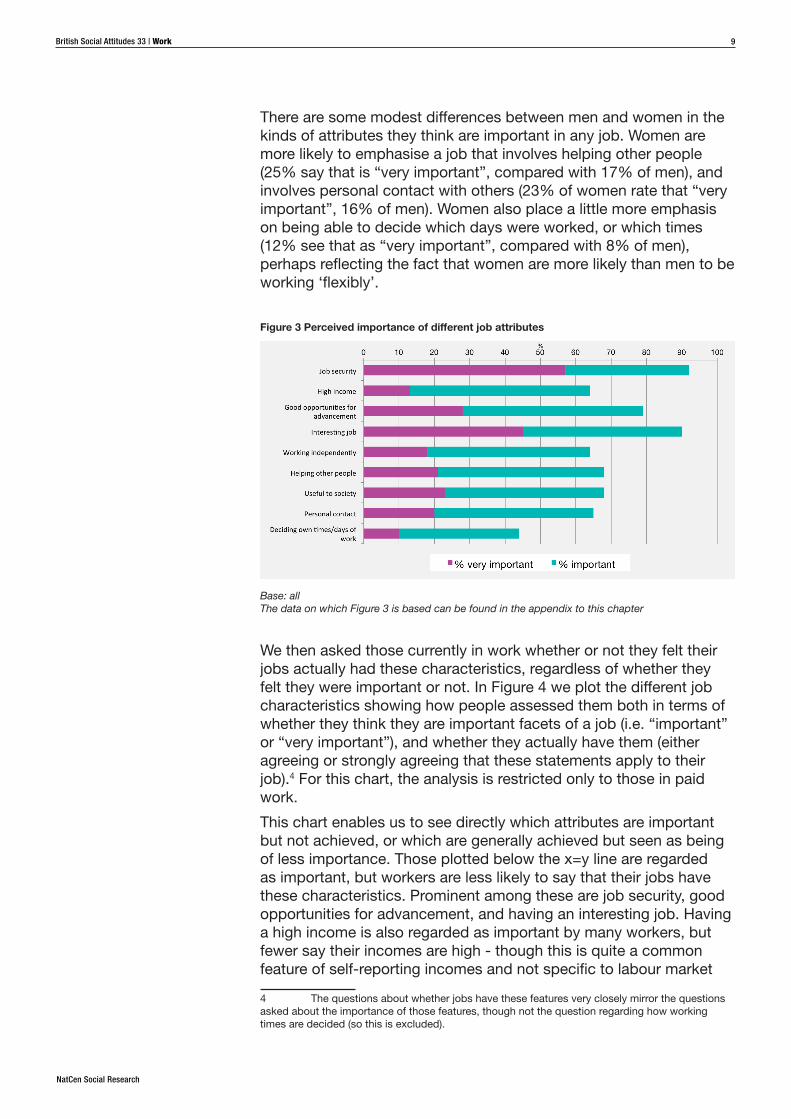
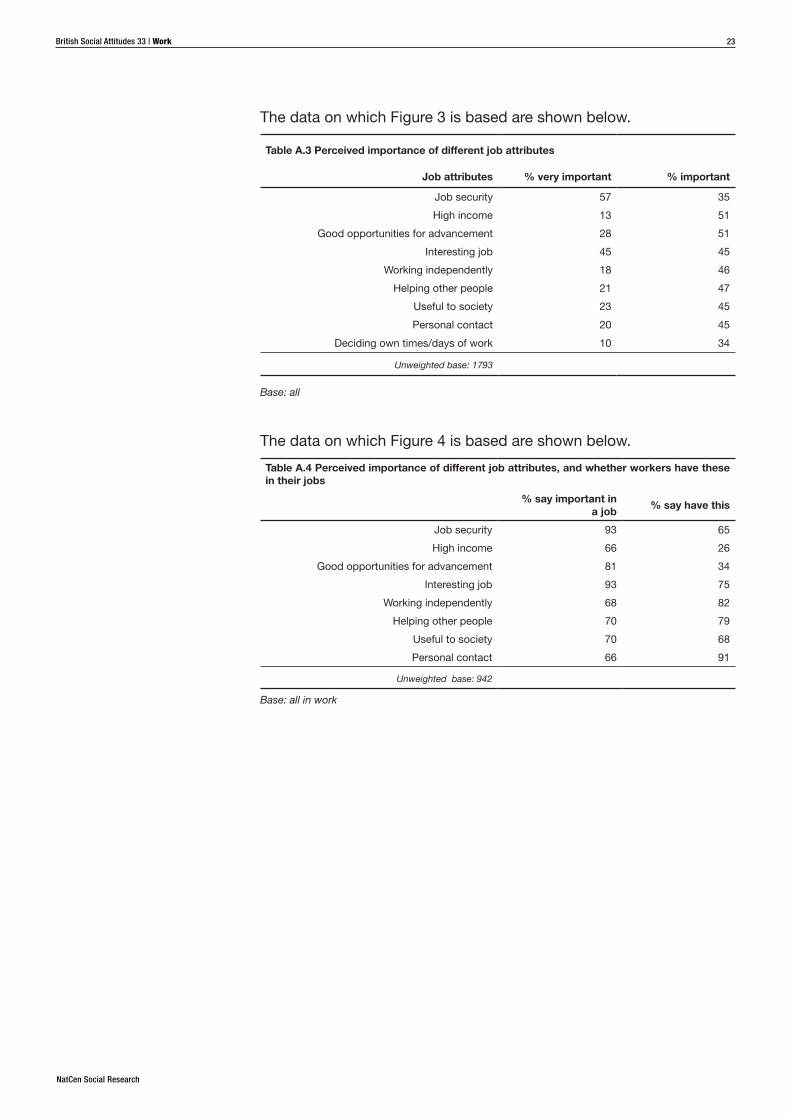
Figure 3 shows features of jobs regarded as important to varying degrees by respondents, ranked in order of importance. Clearly people regard many features of jobs as being “important”, or indeed “very important”. Job security is regarded as important by almost all (92%), while a majority say it is “very important” (57%), the only attribute for which this was true. Next most highly rated in terms of significance is having an interesting job, which 45% regard as “very important”, while a further 45% say that it is “important”. Other features rated particularly important are: having good opportunities for advancement, and having a job that is helpful to others and/or useful to society. One feature that relatively few (13%) see as “very important” is having a high income, although half (51%) do think this is at least “important”.
65% of graduates disagree that a job is only about earning money, compared with just 35% of those with no qualifications
Job security is regarded as important by almost all (92%)
NatCen Social Research
British Social Attitudes 33 | Work 9
There are some modest differences between men and women in the kinds of attributes they think are important in any job. Women are more likely to emphasise a job that involves helping other people (25% say that is “very important”, compared with 17% of men), and involves personal contact with others (23% of women rate that “very important”, 16% of men). Women also place a little more emphasis on being able to decide which days were worked, or which times (12% see that as “very important”, compared with 8% of men), perhaps reflecting the fact that women are more likely than men to be working ‘flexibly’.
Figure 3 Perceived importance of different job attributes
Base: allThe data on which Figure 3 is based can be found in the appendix to this chapter
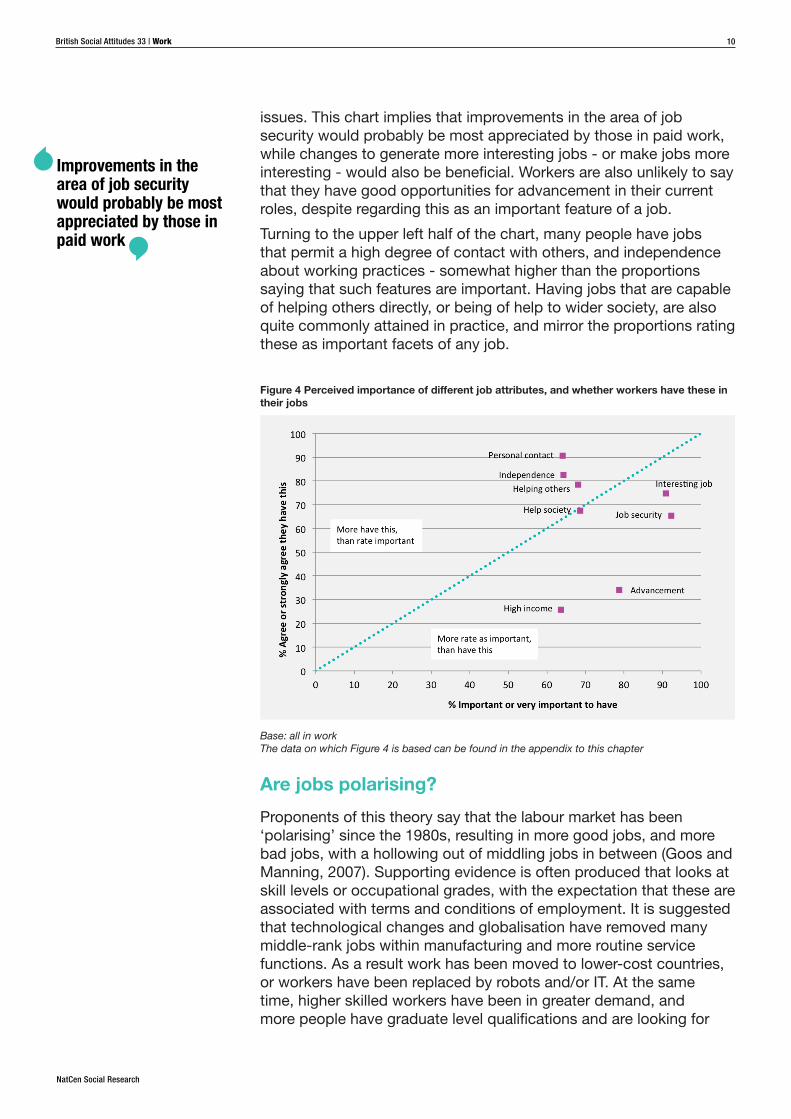
We then asked those currently in work whether or not they felt their jobs actually had these characteristics, regardless of whether they felt they were important or not. In Figure 4 we plot the different job characteristics showing how people assessed them both in terms of whether they think they are important facets of a job (i.e. “important” or “very important”), and whether they actually have them (either agreeing or strongly agreeing that these statements apply to their job).4 For this chart, the analysis is restricted only to those in paid work.
This chart enables us to see directly which attributes are important but not achieved, or which are generally achieved but seen as being of less importance. Those plotted below the x=y line are regarded as important, but workers are less likely to say that their jobs have these characteristics. Prominent among these are job security, good opportunities for advancement, and having an interesting job. Having a high income is also regarded as important by many workers, but fewer say their incomes are high - though this is quite a common feature of self-reporting incomes and not specific to labour market
4 The questions about whether jobs have these features very closely mirror the questions asked about the importance of those features, though not the question regarding how working times are decided (so this is excluded).
NatCen Social Research
British Social Attitudes 33 | Work 10
issues. This chart implies that improvements in the area of job security would probably be most appreciated by those in paid work, while changes to generate more interesting jobs - or make jobs more interesting - would also be beneficial. Workers are also unlikely to say that they have good opportunities for advancement in their current roles, despite regarding this as an important feature of a job.
Turning to the upper left half of the chart, many people have jobs that permit a high degree of contact with others, and independence about working practices - somewhat higher than the proportions saying that such features are important. Having jobs that are capable of helping others directly, or being of help to wider society, are also quite commonly attained in practice, and mirror the proportions rating these as important facets of any job.
Figure 4 Perceived importance of different job attributes, and whether workers have these in their jobs
Base: all in workThe data on which Figure 4 is based can be found in the appendix to this chapter
Are jobs polarising?
Proponents of this theory say that the labour market has been ‘polarising’ since the 1980s, resulting in more good jobs, and more bad jobs, with a hollowing out of middling jobs in between (Goos and Manning, 2007). Supporting evidence is often produced that looks at skill levels or occupational grades, with the expectation that these are associated with terms and conditions of employment. It is suggested that technological changes and globalisation have removed many middle-rank jobs within manufacturing and more routine service functions. As a result work has been moved to lower-cost countries, or workers have been replaced by robots and/or IT. At the same time, higher skilled workers have been in greater demand, and more people have graduate level qualifications and are looking for
Improvements in the area of job security would probably be most appreciated by those in paid work
NatCen Social Research
British Social Attitudes 33 | Work 11
such roles. Meanwhile, there seems to have been a growth in lower level service jobs, partly to meet the needs of the more highly paid. However, this view is not universally accepted (Anderson, 2009), or is accepted with regard to occupations perhaps but not to other labour market features (Plunkett and Paulo Pessoa, 2013). Our data provide an opportunity to investigate some longer-term evidence on this point, especially the lived experience of jobs of different kinds.
In order to assess whether jobs are polarising, we need to consider how the quality of jobs has changed over time. We measure the quality of jobs using the same seven characteristics reported above. These questions were included in a number of surveys separated by almost thirty years, and cover job security, high incomes, opportunities for advancement, whether jobs help people, or are useful to society, whether they are interesting, and allow for independence. We want to see to what extent the responses change over time - and for which groups they have changed the most.
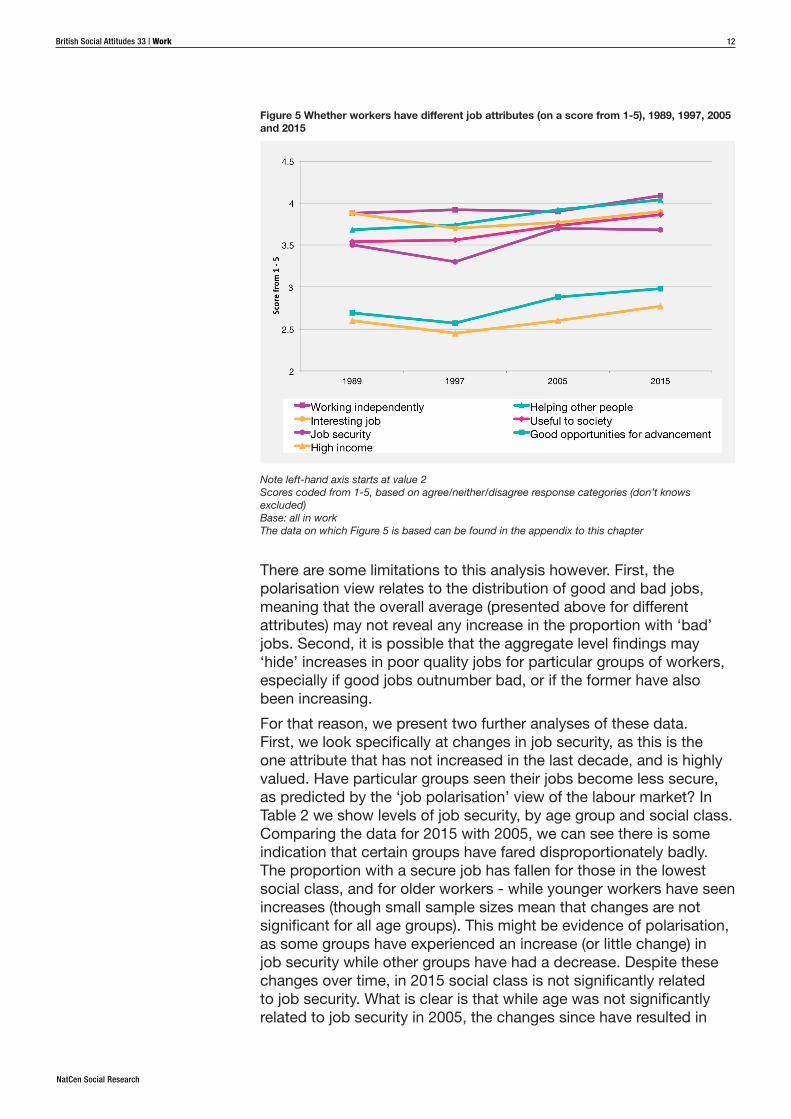
We present these data in two different ways. First, we created an ‘average’ score for each attribute. To do this we recoded the responses so that those who agree they have the attribute are given a higher value, while those who disagree have a lower value, on a scale of one to five. This approach takes into account changes across all response categories: positive, neutral and negative. This is useful because in order to look for evidence of more bad jobs (as well as more good), if we focus only on the proportion who say they have a particular job attribute, it could give a misleading implication about the proportion who do not. For example, if the proportion who say they have a high income has increased, that does not necessarily imply a decrease in the proportion who do not (it could be that both have increased, with a reduction in the neutral middle category).
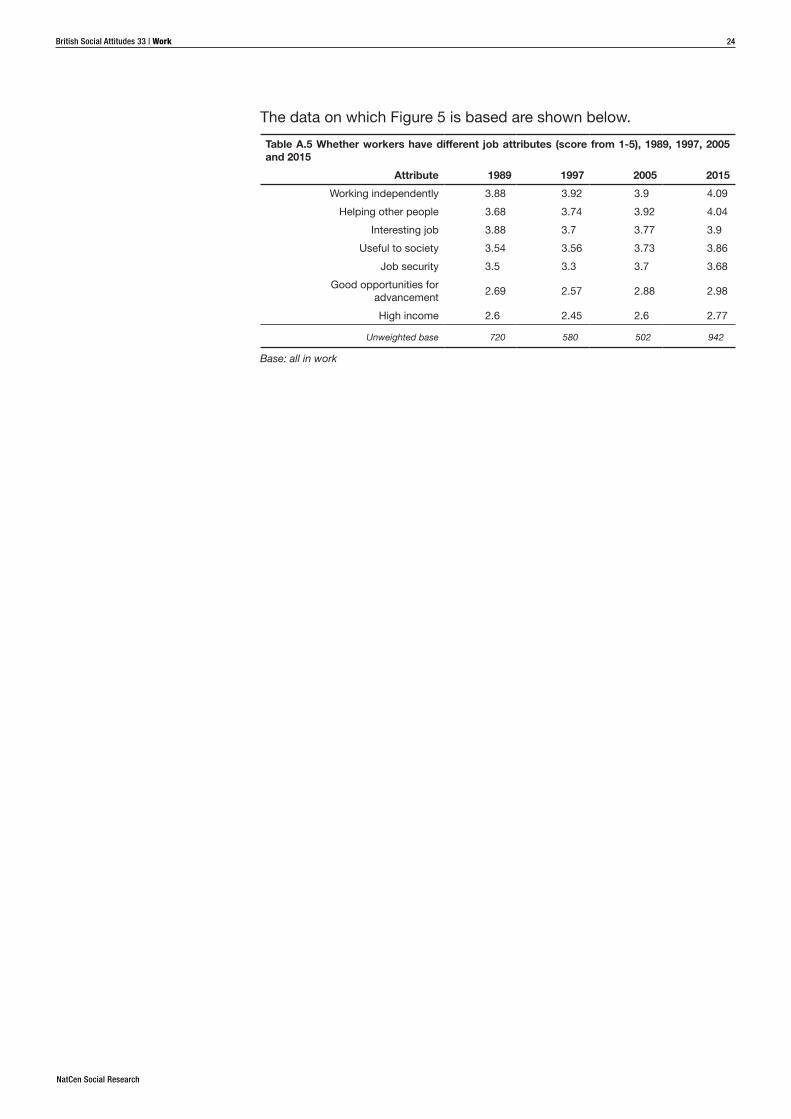
We plot how these aspects have changed over time in Figure 5. After taking account of positive, negative and neutral responses to the questions (by using our score), it is clear that for most individual job attributes, workers are more likely now than in previous years to report having them. They are more likely to say that their jobs are interesting, or useful to society, or have a high income, and so on, in 2015 compared with previous survey years. The one exception is job security, where there has been no increase in the last decade, but even so, those in work are more likely to say that their job is secure in 2015 than they were in either 1997 or 1989.
For most individual job attributes, workers are more likely now than in previous years to report having them
NatCen Social Research
British Social Attitudes 33 | Work 12
Figure 5 Whether workers have different job attributes (on a score from 1-5), 1989, 1997, 2005 and 2015
Note left-hand axis starts at value 2Scores coded from 1-5, based on agree/neither/disagree response categories (don’t knows excluded)Base: all in workThe data on which Figure 5 is based can be found in the appendix to this chapter
There are some limitations to this analysis however. First, the polarisation view relates to the distribution of good and bad jobs, meaning that the overall average (presented above for different attributes) may not reveal any increase in the proportion with ‘bad’ jobs. Second, it is possible that the aggregate level findings may ‘hide’ increases in poor quality jobs for particular groups of workers, especially if good jobs outnumber bad, or if the former have also been increasing.
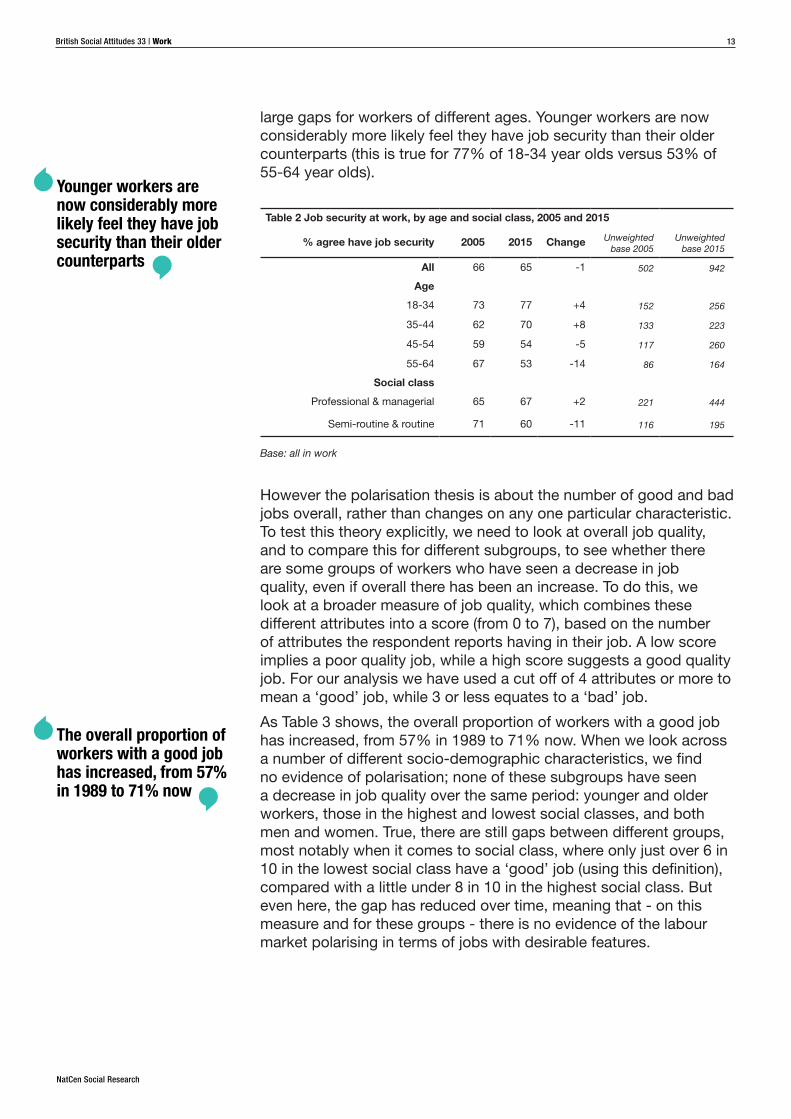
For that reason, we present two further analyses of these data. First, we look specifically at changes in job security, as this is the one attribute that has not increased in the last decade, and is highly valued. Have particular groups seen their jobs become less secure, as predicted by the ‘job polarisation’ view of the labour market? In Table 2 we show levels of job security, by age group and social class. Comparing the data for 2015 with 2005, we can see there is some indication that certain groups have fared disproportionately badly. The proportion with a secure job has fallen for those in the lowest social class, and for older workers - while younger workers have seen increases (though small sample sizes mean that changes are not significant for all age groups). This might be evidence of polarisation, as some groups have experienced an increase (or little change) in job security while other groups have had a decrease. Despite these changes over time, in 2015 social class is not significantly related to job security. What is clear is that while age was not significantly related to job security in 2005, the changes since have resulted in
NatCen Social Research
British Social Attitudes 33 | Work 13
large gaps for workers of different ages. Younger workers are now considerably more likely feel they have job security than their older counterparts (this is true for 77% of 18-34 year olds versus 53% of 55-64 year olds).
Table 2 Job security at work, by age and social class, 2005 and 2015
% agree have job security 2005 2015 Change Unweighted base 2005
Unweighted base 2015
All 66 65 -1 502 942
Age
18-34 73 77 +4 152 256
35-44 62 70 +8 133 223
45-54 59 54 -5 117 260
55-64 67 53 -14 86 164
Social class
Professional & managerial 65 67 +2 221 444
Semi-routine & routine 71 60 -11 116 195
Base: all in work
However the polarisation thesis is about the number of good and bad jobs overall, rather than changes on any one particular characteristic. To test this theory explicitly, we need to look at overall job quality, and to compare this for different subgroups, to see whether there are some groups of workers who have seen a decrease in job quality, even if overall there has been an increase. To do this, we look at a broader measure of job quality, which combines these different attributes into a score (from 0 to 7), based on the number of attributes the respondent reports having in their job. A low score implies a poor quality job, while a high score suggests a good quality job. For our analysis we have used a cut off of 4 attributes or more to mean a ‘good’ job, while 3 or less equates to a ‘bad’ job.
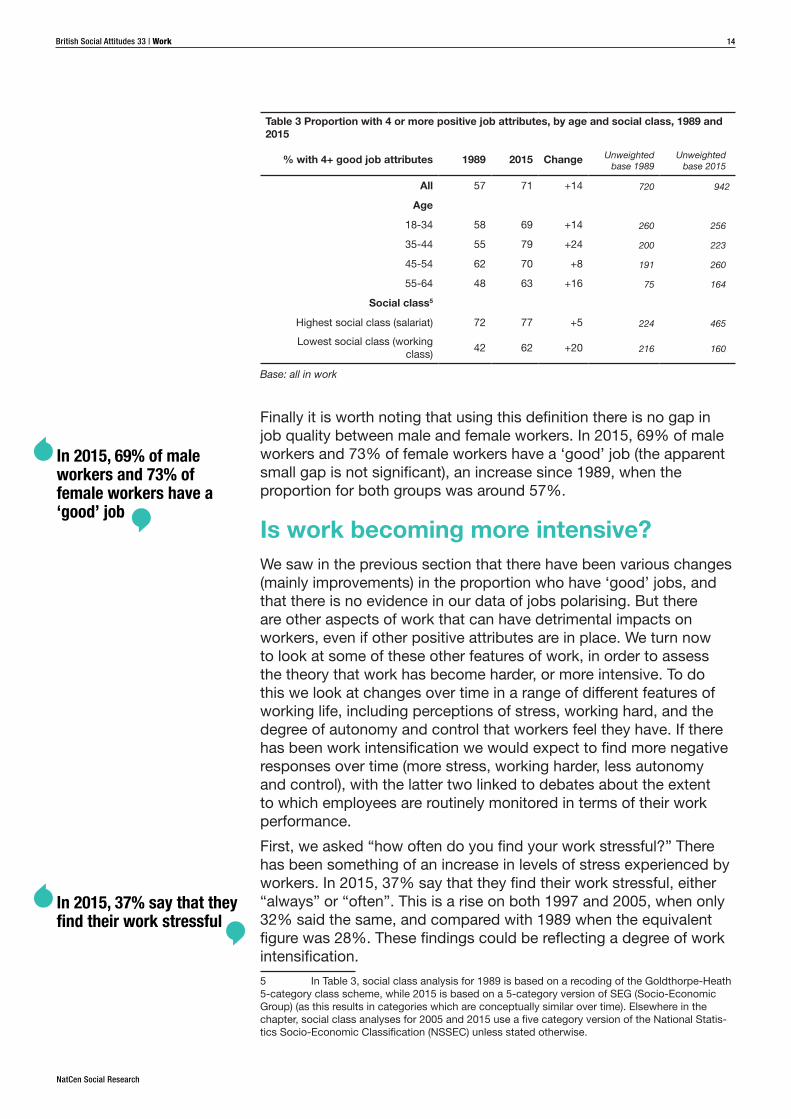
As Table 3 shows, the overall proportion of workers with a good job has increased, from 57% in 1989 to 71% now. When we look across a number of different socio-demographic characteristics, we find no evidence of polarisation; none of these subgroups have seen a decrease in job quality over the same period: younger and older workers, those in the highest and lowest social classes, and both men and women. True, there are still gaps between different groups, most notably when it comes to social class, where only just over 6 in 10 in the lowest social class have a ‘good’ job (using this definition), compared with a little under 8 in 10 in the highest social class. But even here, the gap has reduced over time, meaning that - on this measure and for these groups - there is no evidence of the labour market polarising in terms of jobs with desirable features.
Younger workers are now considerably more likely feel they have job security than their older counterparts
The overall proportion of workers with a good job has increased, from 57% in 1989 to 71% now
NatCen Social Research
British Social Attitudes 33 | Work 14
Table 3 Proportion with 4 or more positive job attributes, by age and social class, 1989 and 2015
% with 4+ good job attributes 1989 2015 Change Unweighted base 1989
Unweighted base 2015
All 57 71 +14 720 942
Age
18-34 58 69 +14 260 256
35-44 55 79 +24 200 223
45-54 62 70 +8 191 260
55-64 48 63 +16 75 164
Social class5
Highest social class (salariat) 72 77 +5 224 465
Lowest social class (working class)
42 62 +20 216 160
Base: all in work
Finally it is worth noting that using this definition there is no gap in job quality between male and female workers. In 2015, 69% of male workers and 73% of female workers have a ‘good’ job (the apparent small gap is not significant), an increase since 1989, when the proportion for both groups was around 57%.
Is work becoming more intensive?We saw in the previous section that there have been various changes (mainly improvements) in the proportion who have ‘good’ jobs, and that there is no evidence in our data of jobs polarising. But there are other aspects of work that can have detrimental impacts on workers, even if other positive attributes are in place. We turn now to look at some of these other features of work, in order to assess the theory that work has become harder, or more intensive. To do this we look at changes over time in a range of different features of working life, including perceptions of stress, working hard, and the degree of autonomy and control that workers feel they have. If there has been work intensification we would expect to find more negative responses over time (more stress, working harder, less autonomy and control), with the latter two linked to debates about the extent to which employees are routinely monitored in terms of their work performance.
First, we asked “how often do you find your work stressful?” There has been something of an increase in levels of stress experienced by workers. In 2015, 37% say that they find their work stressful, either “always” or “often”. This is a rise on both 1997 and 2005, when only 32% said the same, and compared with 1989 when the equivalent figure was 28%. These findings could be reflecting a degree of work intensification.
5 In Table 3, social class analysis for 1989 is based on a recoding of the Goldthorpe-Heath 5-category class scheme, while 2015 is based on a 5-category version of SEG (Socio-Economic Group) (as this results in categories which are conceptually similar over time). Elsewhere in the chapter, social class analyses for 2005 and 2015 use a five category version of the National Statis-tics Socio-Economic Classification (NSSEC) unless stated otherwise.
In 2015, 69% of male workers and 73% of female workers have a ‘good’ job
In 2015, 37% say that they find their work stressful
NatCen Social Research
British Social Attitudes 33 | Work 15
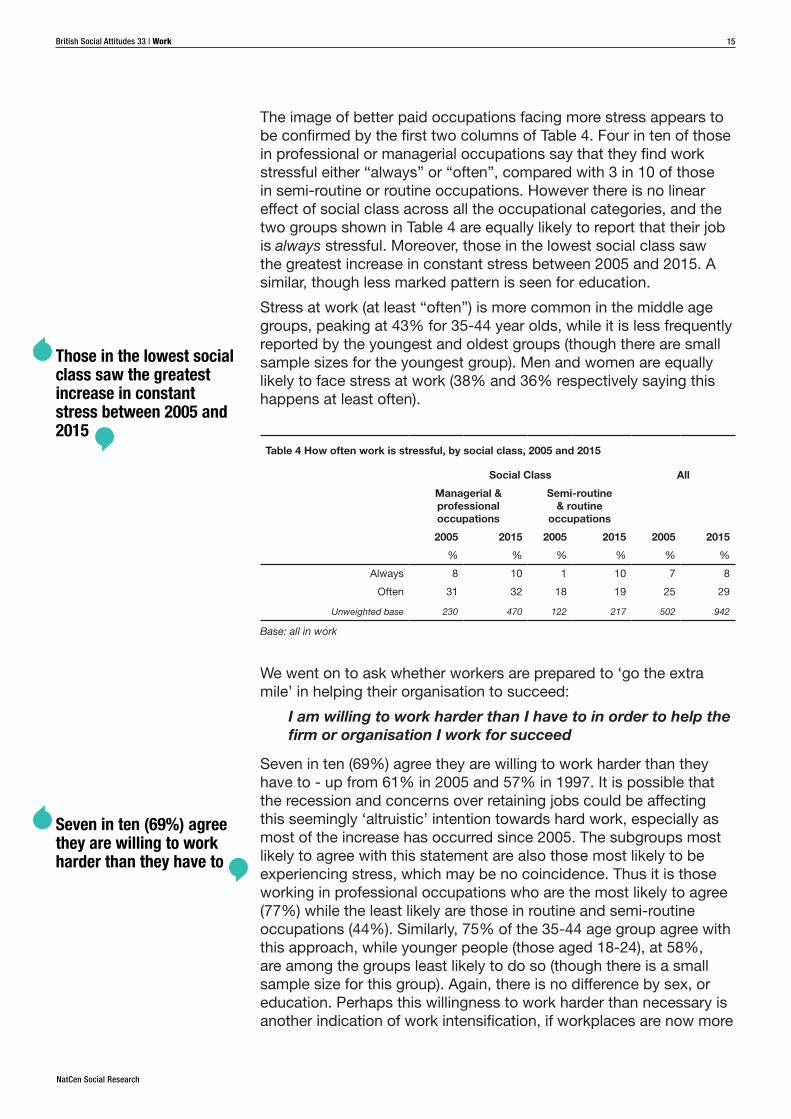
The image of better paid occupations facing more stress appears to be confirmed by the first two columns of Table 4. Four in ten of those in professional or managerial occupations say that they find work stressful either “always” or “often”, compared with 3 in 10 of those in semi-routine or routine occupations. However there is no linear effect of social class across all the occupational categories, and the two groups shown in Table 4 are equally likely to report that their job is always stressful. Moreover, those in the lowest social class saw the greatest increase in constant stress between 2005 and 2015. A similar, though less marked pattern is seen for education.
Stress at work (at least “often”) is more common in the middle age groups, peaking at 43% for 35-44 year olds, while it is less frequently reported by the youngest and oldest groups (though there are small sample sizes for the youngest group). Men and women are equally likely to face stress at work (38% and 36% respectively saying this happens at least often).
Table 4 How often work is stressful, by social class, 2005 and 2015
Social Class All
Managerial & professional occupations
Semi-routine & routine
occupations
2005 2015 2005 2015 2005 2015
% % % % % %
Always 8 10 1 10 7 8
Often 31 32 18 19 25 29
Unweighted base 230 470 122 217 502 942
Base: all in work
We went on to ask whether workers are prepared to ‘go the extra mile’ in helping their organisation to succeed:
I am willing to work harder than I have to in order to help the firm or organisation I work for succeed
Seven in ten (69%) agree they are willing to work harder than they have to - up from 61% in 2005 and 57% in 1997. It is possible that the recession and concerns over retaining jobs could be affecting this seemingly ‘altruistic’ intention towards hard work, especially as most of the increase has occurred since 2005. The subgroups most likely to agree with this statement are also those most likely to be experiencing stress, which may be no coincidence. Thus it is those working in professional occupations who are the most likely to agree (77%) while the least likely are those in routine and semi-routine occupations (44%). Similarly, 75% of the 35-44 age group agree with this approach, while younger people (those aged 18-24), at 58%, are among the groups least likely to do so (though there is a small sample size for this group). Again, there is no difference by sex, or education. Perhaps this willingness to work harder than necessary is another indication of work intensification, if workplaces are now more
Those in the lowest social class saw the greatest increase in constant stress between 2005 and 2015
Seven in ten (69%) agree they are willing to work harder than they have to
NatCen Social Research
British Social Attitudes 33 | Work 16
likely to have a culture of harder work and, being present for long hours.
If the signs are that work is intensifying, might that imply that workers’ conditions have worsened when it comes to questions of control and flexibility in the work environment and over the working day? These are both elements that some have linked to the intensification debate. Or do perceptions of legal rights pertaining to flexible working patterns and other working conditions mean that this area is relatively protected?
We posed three different questions on this subject, the first of which asked workers to say which of the following three statements “best describes how your working hours are decided”:
Starting and finishing times are decided by my employer and I cannot change them on my own
I can decide the time I start and finish work within certain limits
I am entirely free to decide when I start and finish work
In 2015, a slight majority (54%) have no control over their working hours, with start and finish times decided by the employer. Around a third (35%) choose the second statement (meaning they have control within limits), with only 9% having complete freedom to decide their working times. There has been no improvement in workers’ ability to determine their starting and finishing times - these figures are little different to findings from 2005 and 1997.
The second question asks about more occasional flexibility - how difficult it would be “to take an hour or two off during working hours, to take care of personal or family matters?” For most workers, this is something they can do without too much difficulty. Two-thirds (65%) say it would be “not too difficult” or “not difficult at all” to take an hour or two off work. However, while only a small minority - close to 1 in 6 (16%) - say it would be “very difficult” to take off an hour or two, this is up slightly from 1 in 10 (10%) in 2005.
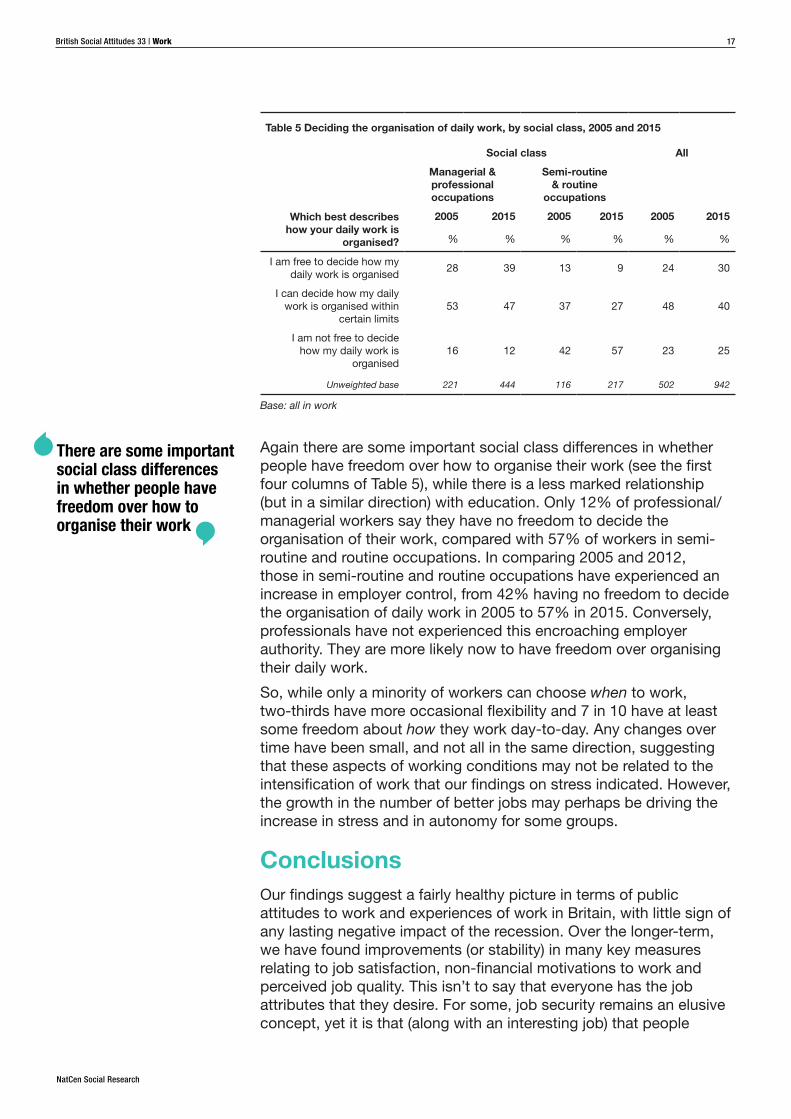
Our third question is about the level of control workers feel they have over organising their daily work. The right-hand column in Table 5 reveals that most workers feel they have a say in this. Three in ten report being completely free to decide how to organise their daily work, while a further 4 in 10 can do so within certain limits. Taking both categories together there has been little change since 2005, but there has been an increase in the first (having complete day-to-day autonomy).
Two-thirds (65%) say it would be “not too difficult” or “not difficult at all” to take an hour or two off work
NatCen Social Research
British Social Attitudes 33 | Work 17
Table 5 Deciding the organisation of daily work, by social class, 2005 and 2015
Social class All
Managerial & professional occupations
Semi-routine & routine
occupations
Which best describes how your daily work is
organised?
2005 2015 2005 2015 2005 2015
% % % % % %
I am free to decide how my daily work is organised
28 39 13 9 24 30
I can decide how my daily work is organised within
certain limits53 47 37 27 48 40
I am not free to decide how my daily work is
organised16 12 42 57 23 25
Unweighted base 221 444 116 217 502 942
Base: all in work
Again there are some important social class differences in whether people have freedom over how to organise their work (see the first four columns of Table 5), while there is a less marked relationship (but in a similar direction) with education. Only 12% of professional/managerial workers say they have no freedom to decide the organisation of their work, compared with 57% of workers in semi-routine and routine occupations. In comparing 2005 and 2012, those in semi-routine and routine occupations have experienced an increase in employer control, from 42% having no freedom to decide the organisation of daily work in 2005 to 57% in 2015. Conversely, professionals have not experienced this encroaching employer authority. They are more likely now to have freedom over organising their daily work.
So, while only a minority of workers can choose when to work, two-thirds have more occasional flexibility and 7 in 10 have at least some freedom about how they work day-to-day. Any changes over time have been small, and not all in the same direction, suggesting that these aspects of working conditions may not be related to the intensification of work that our findings on stress indicated. However, the growth in the number of better jobs may perhaps be driving the increase in stress and in autonomy for some groups.
ConclusionsOur findings suggest a fairly healthy picture in terms of public attitudes to work and experiences of work in Britain, with little sign of any lasting negative impact of the recession. Over the longer-term, we have found improvements (or stability) in many key measures relating to job satisfaction, non-financial motivations to work and perceived job quality. This isn’t to say that everyone has the job attributes that they desire. For some, job security remains an elusive concept, yet it is that (along with an interesting job) that people
There are some important social class differences in whether people have freedom over how to organise their work
NatCen Social Research
British Social Attitudes 33 | Work 18
most value. In many cases workers are also unable to access their desired levels of opportunity for advancement, or to have the kind of interesting job they would like.
The idea that jobs are polarising is not supported by our data. Indeed, the findings refute the view that the proportion with ‘bad’ jobs are growing at all, while it is clear that the percentage with ‘good’ jobs is rising. This is true across each of the socio-demographic subgroups we examined, with improvements (or at least stability) for workers regardless of their age, sex or social class. Even so, certain subgroups are faring worse than others. In particular, those in the lowest social class are much less likely to have a job with 4 or more positive attributes than their counterparts in the highest social class, and we have seen that this group are encountering worse terms and conditions in other areas, such as the organisation of the day-to-day content of their jobs. Older workers are another group who have poorer experiences in some areas of working life, such as having less job security than younger workers. So while there is not evidence of polarisation, there are some clues that lower status workers and older workers are not enjoying all the favourable employment terms that other groups are experiencing.
Lastly, and fitting the discourses around intensification of work, people are now facing more stress at work. More are also now prepared to work beyond what is strictly necessary - a trend that may be linked to concerns about retaining their jobs in an environment where it is getting tougher to move to better or even just comparable jobs. Moreover, while many of these patterns are common to both men and women, some outcomes (such as experiencing stress) are quite strongly correlated with social class and age.
Indeed throughout much of the chapter two themes have emerged. On the one hand, the importance of social class, education and age in understanding people’s working experiences, and on the other, the weaker relationship (if any) with sex. This isn’t to say that there are no differences in men and women’s relationship with the labour market - women still earn less than men, and significantly fewer are in paid work. But our evidence suggests that sex isn’t central to these particular attitudes and experiences of work, and how they have been changing in recent years. This perhaps chimes with findings from our 29th Report chapter which found evidence that “the employment experiences of men and women have been converging in recent years” (McManus and Perry, 2012).
We end with a thought about policy implications. On the basis of our analysis, one area that remains of particular concern is that of job insecurity. There has been no perceived increase in job security between 2005 and 2015, and yet this is one of the most desired features of jobs. Some particular policy reforms relating to this (such as to zero-hours contracts) were indeed debated between the political parties during the 2015 General Election campaign, but insecurity goes much beyond that relatively small element of the labour market. This therefore represents a potential area for action for our representatives at Westminster.
For some, job security remains an elusive concept, yet it is that (along with an interesting job) that people most value
People are now facing more stress at work
NatCen Social Research
British Social Attitudes 33 | Work 19
References
Anderson, P. (2009), Intermediate occupations and the conceptual and empirical limitations of the hourglass economy thesis, Work, Employment & Society, 23(1): 169-180
Bryson, A., Green, F., Bridges, S. and Craig, R. (2011), ‘Wellbeing, health and work’, in Craig, R. and Mindell J. (eds.), Health Survey for England – 2010: Respiratory Health, Leeds: NHS Information Centre
Coats, D. and Lehki, R. (2008), ‘Good Work’: Job Quality in a Changing Economy, London: The Work Foundation
D’Arcy, C. and Gardiner, L. (2014), Just the job – or a working compromise? The changing nature of self-employment in the UK, London: Resolution Foundation
Donegani C. P., McKay, S. and Moro, D. (2012), ‘A dimming of the ‘warm glow’? Are non-profit workers in the UK still more satisfied with their jobs than other workers?’ in Bryson, A. (ed.), Advances in the Economic Analysis of Participatory and Labor-Managed Firms, 13: 313-32
Faccini, R. and Hackworth, C. (2010), ‘Changes in output, employment and wages during recessions in the United Kingdom’ in Bank of England Quarterly Bulletin, 1: 43-50
Goos, M. and Manning, A. (2007), ‘Lousy and lovely jobs: The rising polarization of work in Britain’ in The review of economics and statistics, 89(1): 118-133
Green, F. (2006), Demanding Work. The Paradox of Job Quality in the Affluent Economy, Woodstock: Princeton University Press
Holmes, C. and Mayhew, K. (2012), The changing shape of the UK job market and its implications for the bottom half of earners, London: Resolution Foundation
Lindsay, C. (2003). A century of labour market change: 1900 to 2000. Labour Market Trends, 111(3): 133-44, available at: www.ons.gov.uk/ons/rel/lms/labour-market-trends--discontinued-/volume-111--no--3/a-century-of-labour-market-change--1900-to-2000.pdf
McKay, S. and Smith, R. (2015), The labour market before and after the recession, in Foster, L., Brunton, A., Deeming, C. and Haux, T. (eds.), In Defence of Welfare II, Bristol: The Policy Press
McManus, S. and Perry, J. (2012), “Work and wellbeing: Hard work? Employment, work-life balance, and wellbeing in a changing economy” in Park, A., Clery, E., Curtice, J., Phillips, M. and Utting, D. (eds.), British Social Attitudes: the 29th Report, London: NatCen Social Research, available at: www.natcen.ac.uk/bsa29
ONS (2016) UK Labour Market: May 2016, available at: www.ons.gov.uk/employmentandlabourmarket/peopleinwork/employmentandemployeetypes/bulletins/uklabourmarket/may2016
NatCen Social Research
British Social Attitudes 33 | Work 20
Plunkett, J. and Paulo Pessoa, J. (2013) A Polarising Crisis? The changing shape of the UK and US labour markets from 2008 to 2012, London: Resolution Foundation
Rowlingson, K. and McKay, S. (2015), Financial Inclusion Annual Monitoring Report 2015, University of Birmingham research report for the Friends Provident Foundation, available at: www.birmingham.ac.uk/Documents/college-social-sciences/social-policy/CHASM/annual-reports/chasm-financial-inclusion-monitoring-report-2015.pdf
Acknowledgements
NatCen Social Research is grateful to the Economic and Social Research Council (grant reference ES/L002795/1) for their financial support which enabled us to ask the questions reported in this chapter. The views expressed are those of the authors alone.
NatCen Social Research
British Social Attitudes 33 | Work 21
Appendix
The data on which Figure 1 is based are shown below.
Table A.1 Percentage in paid work, by age, 1984-2015
% in paid
work
18-39 40-59 60+ All Unweighted base (18-39)
Unweighted base (40-59)
Unweighted base (60+)
Unweighted base (All)
1984 65 68 11 52 1373 1042 1040 3455
1985 64 69 14 53 820 548 431 1799
1986 67 70 13 55 1318 1048 731 3097
1987 67 74 11 55 1155 976 711 2842
1989 71 74 11 56 1213 1023 783 3019
1990 69 72 12 55 1117 927 739 2783
1991 65 70 13 53 1105 935 865 2905
1993 63 65 9 50 1172 904 855 2931
1994 65 68 11 52 1373 1042 1040 3455
1995 66 66 10 52 1428 1119 1076 3623
1996 68 70 11 54 1405 1121 1079 3605
1997 63 69 9 52 536 423 396 1355
1998 70 76 9 56 1183 991 962 3136
1999 73 72 13 56 1162 962 1017 3141
2000 69 75 12 55 1288 1061 1070 3419
2001 73 73 12 57 1199 1100 983 3282
2002 72 76 11 59 1281 1142 1008 3431
2003 68 74 13 56 1559 1545 1327 4431
2004 71 77 15 59 1099 1140 954 3193
2005 71 75 13 56 1391 1526 1349 4266
2006 70 77 13 57 1454 1500 1331 4285
2007 70 77 12 57 1362 1391 1368 4121
2008 70 77 16 58 1405 1563 1496 4464
2009 70 77 17 57 1084 1245 1087 3416
2010 64 78 16 55 1007 1125 1157 3289
2011 69 75 16 56 1030 1114 1161 3305
2012 63 77 17 55 905 1081 1256 3242
2013 66 78 18 56 952 1092 1194 3238
2014 65 78 16 55 782 1015 1073 2870
2015 65 78 17 56 1255 1506 1560 4321
Base: all
NatCen Social Research
British Social Attitudes 33 | Work 22
The data on which Figure 2 is based are shown below.
Table A.2 Labour market trends - self-employment, trade unions and the public sector, 1984-2015 (in thousands)
Year N in public sector N TU members N Self-employed
1984 + 10774 2695
1985 + 10819 2778
1986 + 10598 2789
1987 + 10480 3044
1988 + 10387 3216
1989 + 10044 3504
1990 + 9810 3542
1991 + 9489 3384
1992 + 8929 3469
1993 + 8666 3404
1994 + 8231 3516
1995 + 8031 3549
1996 + 7938 3506
1997 + 7801 3451
1998 + 7852 3346
1999 5461 7898 3305
2000 5538 7779 3254
2001 5627 7751 3294
2002 5749 7736 3338
2003 5909 7559 3568
2004 6035 7473 3624
2005 6109 7603 3644
2006 6076 7628 3749
2007 6045 7656 3822
2008 6115 7388 3846
2009 6350 7329 3870
2010 6289 7261 3990
2011 6106 7197 4057
2012 5811 7086 4224
2013 5668 7011 4262
2014 5416 6217 4558
2015 5358 6253 4574
Source: LFS (self-employed), ONS Public Sector Employment series, BIS (trade union members) + Consistent data not available until 1999
NatCen Social Research
British Social Attitudes 33 | Work 23
The data on which Figure 3 is based are shown below.
Table A.3 Perceived importance of different job attributes
Job attributes % very important % important
Job security 57 35
High income 13 51
Good opportunities for advancement 28 51
Interesting job 45 45
Working independently 18 46
Helping other people 21 47
Useful to society 23 45
Personal contact 20 45
Deciding own times/days of work 10 34
Unweighted base: 1793
Base: all
The data on which Figure 4 is based are shown below.
Table A.4 Perceived importance of different job attributes, and whether workers have these in their jobs
% say important in a job
% say have this
Job security 93 65
High income 66 26
Good opportunities for advancement 81 34
Interesting job 93 75
Working independently 68 82
Helping other people 70 79
Useful to society 70 68
Personal contact 66 91
Unweighted base: 942
Base: all in work
NatCen Social Research
British Social Attitudes 33 | Work 24
The data on which Figure 5 is based are shown below.
Table A.5 Whether workers have different job attributes (score from 1-5), 1989, 1997, 2005 and 2015
Attribute 1989 1997 2005 2015
Working independently 3.88 3.92 3.9 4.09
Helping other people 3.68 3.74 3.92 4.04
Interesting job 3.88 3.7 3.77 3.9
Useful to society 3.54 3.56 3.73 3.86
Job security 3.5 3.3 3.7 3.68
Good opportunities for advancement
2.69 2.57 2.88 2.98
High income 2.6 2.45 2.6 2.77
Unweighted base 720 580 502 942
Base: all in work