Embed Size (px)
Citation preview
345-B Nowlin Lane • Chattanooga, TN 37421
www.thed ix iegroup.com
CORPORATEHEADQUARTERS
104 Nowlin Lane, Suite 101Chattanooga, Tennessee 37421www.thedixiegroup.com
INVESTOR CONTACTGary A. Harmon,
Vice President and ChiefFinancial Officer
The Dixie Group, Inc.2208 South Hamilton StreetDalton, Georgia 30721(706) 876-5851
INDEPENDENTREGISTERED PUBLIC
ACCOUNTANTSErnst & Young LLP55 Ivan Allen Jr. Blvd.
Suite 1000Atlanta, Georgia 30308
LEGAL COUNSELMiller & Martin PLLC1000 Volunteer Building832 Georgia Avenue
Chattanooga, Tennessee 37402
STOCK TRANSFER AGENTComputershare Investor
Services, LLCPost Office Box 43078Providence, Rhode Island
02940-3078
ANNUAL MEETINGThe annual Meetingof Shareholders of
The Dixie Group, Inc. willbe held at 8:00 A.M. CDT,on April 30, 2008, at
The Marriott Grand Hotel,Point Clear, Alabama
FORM 10-K ANDOTHER INFORMATION
A copy of the Company’s AnnualReport on Form 10-K for thefiscal year ended December 29,2007, is included with thisreport. The Dixie Groupmaintains a website,
www.thedixiegroup.com, whereadditional information about theCompany may be obtained.Information is also availableupon request to the Companyat: Post Office Box 25107Chattanooga, Tennessee37422-5107 or contactStarr Klein, Secretary, at(423) 510-7005.
STOCK LISTINGThe Dixie Group’s Common
Stock is listed on theNASDAQ Global Marketunder the symbol DXYN
CO R POR AT E I N FORMAT I ON
was a year of challenge for the carpet industry. The well-publicized slowdown in housing starts,dramatically declining sales of new and existing housing units, and sub-prime credit worries all
combined to deliver a significant blow to carpet and rug manufacturers. For 2007, overall industry salesdeclined 8%, with a drop of 13.1% in residential carpet sales offset only slightly by a modest 1.6% increase incommercial carpet sales. This overall decline continued negative trends that began in 2006, affecting both unitsand dollars. By year-end, industry sales volumes were well below their high point in 2005. Despite thesedifficulties, the industry is well capitalized and generally quite profitable. The question is, how do we bestrespond in this environment?The industry's response to the slowdown has been to simplify and retrench, which is consistent with their
predominant business model. At The Dixie Group, we have taken a different approach, one dictated by ourconcentration in the high end of the residential and commercial markets and by our belief that continueddevelopment of new and differentiated products and investments in our infrastructure will better position us totake advantage of the market's inevitable upturn.Our approach has allowed us to capture market share. Although there is no doubt that industry weakness
has had a negative impact on our business, we have grown much faster than the industry. Our revenue increasedduring the two-year period ended in 2007, and over the last five years, the compound annual growth rate ofour carpet business has been 9.2%, significantly higher than the 2.1% compound annual growth rate reportedfor the same period by the industry as a whole.Last year our carpet sales declined only 2.8%. While our residential sales were down 9.1%, our commercial
carpet sales rose 10.5%. A closer look at those numbers reveals that over 95% of our total carpet sales declineresulted from lower sales of residential carpet to one large home center customer.Our segment of the market demands innovative styling and the highest manufacturing quality, and these
demands do not vanish during an economic downturn. Accordingly, much of our focus in 2007 was devotedto enhancing our operational performance while investing for the future. We significantly strengthened ourmanufacturing leadership and are moving toward a new level in operating performance. Improved quality,service and efficiencies are reflected in higher operating margins. While the industry reduced product offeringsand capacity, we pursued significant growth initiatives, developed new products and invested in our facilities.We believe our efforts will pay off.Our new products have been well received by our customers, and we have increased our share of the markets
we serve. On the residential side, we developed a number of exciting new nylon products in order to enhanceour position as a styling trendsetter and market leader in high-end residential markets. Dixie Home's Lifestylescollection has been redesigned with more patterned products to position the entire collection at higher pricepoints. We also entered the wool carpet market to strengthen Masland's and Fabrica's presence in the highestprice points of the marketplace.On the commercial side, our new modular/carpet tile products, introduced in late 2006, continued to gain
momentum throughout 2007 and are now achieving consistent growth and profitability. Placement with
L E T T E R TO SH A R EHO LD E R S
104 Nowlin Lane, Suite 101Chattanooga, Tennessee 37421
104 Nowlin Lane, Suite 101Chattanooga, Tennessee 37421
2007
Daniel K. Frierson (1) (3)
Chairman of the Board
J. Don Brock, Ph.D. (1) (4)
Chairman of the Board andChief Executive Officer,
Astec Industries, Inc.
Paul K. Frierson (3)
Retired Vice Presidentand President,
Candlewick Yarns
Walter W. Hubbard (2) (4)
Retired President andChief Executive Officer,Honeywell Nylon, Inc.
Lowry F. Kline (1) (2) (4)
Chairman, Coca-ColaEnterprises, Inc.
John W. Murrey, III (2) (4)
Assistant Professor,Appalachian School of Law
(1)Member of Executive Committee(2) Member of Compensation
Committee(3) Member of Retirement Plans
Committee(4) Member of Audit Committee
D I R E C TOR S AND O F F I C E R S
D i r e c t o r s
Daniel K. FriersonChairman of the Board
and Chief Executive Officer
Gary A. HarmonVice President and
Chief Financial Officer
David E. PolleyVice President, Marketing
Paul B. ComiskeyVice President and
President, Dixie Home
Kenneth L. DempseyVice President and President,
Masland Contract
D. Kennedy Frierson, Jr.Vice President and President,
Masland Residential
Craig S. LapeereVice President and President,
Fabrica International
Terry W. ClarkVice President, Manufacturing
W. Derek DavisVice President, Human Resources
Jon A. FaulknerVice President, Planning
and Development
D. Eugene LasaterController
Starr T. KleinSecretary
O f f i c e r s
retailers of our Dixie Home and Office collection of Stainmaster® commercial carpets has exceeded ourexpectations. Importantly, this collection of commercial carpets was the very first in the industry to carry theStainmaster® brand and it is beginning to grow consistently.Capital expenditure investments totaled $16.7 million in 2007, almost $4.0 million higher than our
depreciation and amortization. We also repurchased 157,407 shares of our Common Stock for $1.6 million,or an average price of $9.91 per share. With the merger of our only remaining defined benefit retirement planinto a multi-employer plan late last year, we no longer sponsor any defined benefit retirement plans. Thus,despite the economic downturn, we strengthened our balance sheet, grew stockholders' equity to $142.1million and reduced total debt to $88.6 million, or 38.4% of total capitalization.Severe weakness in the housing industry and tough credit conditions likely will persist in 2008 and continue
to affect demand for residential carpet products throughout the year. Indeed, we've seen evidence of softnessin our sales since the start of 2008. Nevertheless, we are optimistic about the opportunities that we see aheadof us. We are particularly encouraged by:• Dixie's consistently favorable sales comparisons versus the industry;• Positive market reception of new products and growth initiatives;• Higher gross margins as a percent of sales;• Profitability of our modular/carpet tile products;• Improved operational performance in quality, manufacturing, distribution and material utilization;• Higher average selling prices and better product mix; and• Manufacturing capacity that can accommodate over 40% growth without requiring major infrastructureexpenditures. As conditions improve and business grows, we expect to cover more of the fixed costsassociated with the investments we have made.In summary, we have focused on the future. We have continued aggressively to develop new products and
capture market share. We believe we will be uniquely positioned to benefit from improvement in the industryas it occurs.We would like to express our appreciation to our shareholders and our Board of Directors for their
continued support and confidence and to our associates for their hard work and dedication.
Sincerely,
Daniel K. FriersonChairman and Chief Executive Officer
March 10, 2008
104 Nowlin Lane, Suite 101Chattanooga, Tennessee 37421
104 Nowlin Lane, Suite 101Chattanooga, Tennessee 37421
L E T T E R TO SH A R EHO LD E R S
CORPORATEHEADQUARTERS
104 Nowlin Lane, Suite 101Chattanooga, Tennessee 37421www.thedixiegroup.com
INVESTOR CONTACTGary A. Harmon,
Vice President and ChiefFinancial Officer
The Dixie Group, Inc.2208 South Hamilton StreetDalton, Georgia 30721(706) 876-5851
INDEPENDENTREGISTERED PUBLIC
ACCOUNTANTSErnst & Young LLP55 Ivan Allen Jr. Blvd.
Suite 1000Atlanta, Georgia 30308
LEGAL COUNSELMiller & Martin PLLC1000 Volunteer Building832 Georgia Avenue
Chattanooga, Tennessee 37402
STOCK TRANSFER AGENTComputershare Investor
Services, LLCPost Office Box 43078Providence, Rhode Island
02940-3078
ANNUAL MEETINGThe annual Meetingof Shareholders of
The Dixie Group, Inc. willbe held at 8:00 A.M. CDT,on April 30, 2008, at
The Marriott Grand Hotel,Point Clear, Alabama
FORM 10-K ANDOTHER INFORMATION
A copy of the Company’s AnnualReport on Form 10-K for thefiscal year ended December 29,2007, is included with thisreport. The Dixie Groupmaintains a website,
www.thedixiegroup.com, whereadditional information about theCompany may be obtained.Information is also availableupon request to the Companyat: Post Office Box 25107Chattanooga, Tennessee37422-5107 or contactStarr Klein, Secretary, at(423) 510-7005.
STOCK LISTINGThe Dixie Group’s Common
Stock is listed on theNASDAQ Global Marketunder the symbol DXYN
CO R POR AT E I N FORMAT I ON
was a year of challenge for the carpet industry. The well-publicized slowdown in housing starts,dramatically declining sales of new and existing housing units, and sub-prime credit worries all
combined to deliver a significant blow to carpet and rug manufacturers. For 2007, overall industry salesdeclined 8%, with a drop of 13.1% in residential carpet sales offset only slightly by a modest 1.6% increase incommercial carpet sales. This overall decline continued negative trends that began in 2006, affecting both unitsand dollars. By year-end, industry sales volumes were well below their high point in 2005. Despite thesedifficulties, the industry is well capitalized and generally quite profitable. The question is, how do we bestrespond in this environment?The industry's response to the slowdown has been to simplify and retrench, which is consistent with their
predominant business model. At The Dixie Group, we have taken a different approach, one dictated by ourconcentration in the high end of the residential and commercial markets and by our belief that continueddevelopment of new and differentiated products and investments in our infrastructure will better position us totake advantage of the market's inevitable upturn.Our approach has allowed us to capture market share. Although there is no doubt that industry weakness
has had a negative impact on our business, we have grown much faster than the industry. Our revenue increasedduring the two-year period ended in 2007, and over the last five years, the compound annual growth rate ofour carpet business has been 9.2%, significantly higher than the 2.1% compound annual growth rate reportedfor the same period by the industry as a whole.Last year our carpet sales declined only 2.8%. While our residential sales were down 9.1%, our commercial
carpet sales rose 10.5%. A closer look at those numbers reveals that over 95% of our total carpet sales declineresulted from lower sales of residential carpet to one large home center customer.Our segment of the market demands innovative styling and the highest manufacturing quality, and these
demands do not vanish during an economic downturn. Accordingly, much of our focus in 2007 was devotedto enhancing our operational performance while investing for the future. We significantly strengthened ourmanufacturing leadership and are moving toward a new level in operating performance. Improved quality,service and efficiencies are reflected in higher operating margins. While the industry reduced product offeringsand capacity, we pursued significant growth initiatives, developed new products and invested in our facilities.We believe our efforts will pay off.Our new products have been well received by our customers, and we have increased our share of the markets
we serve. On the residential side, we developed a number of exciting new nylon products in order to enhanceour position as a styling trendsetter and market leader in high-end residential markets. Dixie Home's Lifestylescollection has been redesigned with more patterned products to position the entire collection at higher pricepoints. We also entered the wool carpet market to strengthen Masland's and Fabrica's presence in the highestprice points of the marketplace.On the commercial side, our new modular/carpet tile products, introduced in late 2006, continued to gain
momentum throughout 2007 and are now achieving consistent growth and profitability. Placement with
L E T T E R TO SH A R EHO LD E R S
104 Nowlin Lane, Suite 101Chattanooga, Tennessee 37421
104 Nowlin Lane, Suite 101Chattanooga, Tennessee 37421
2007
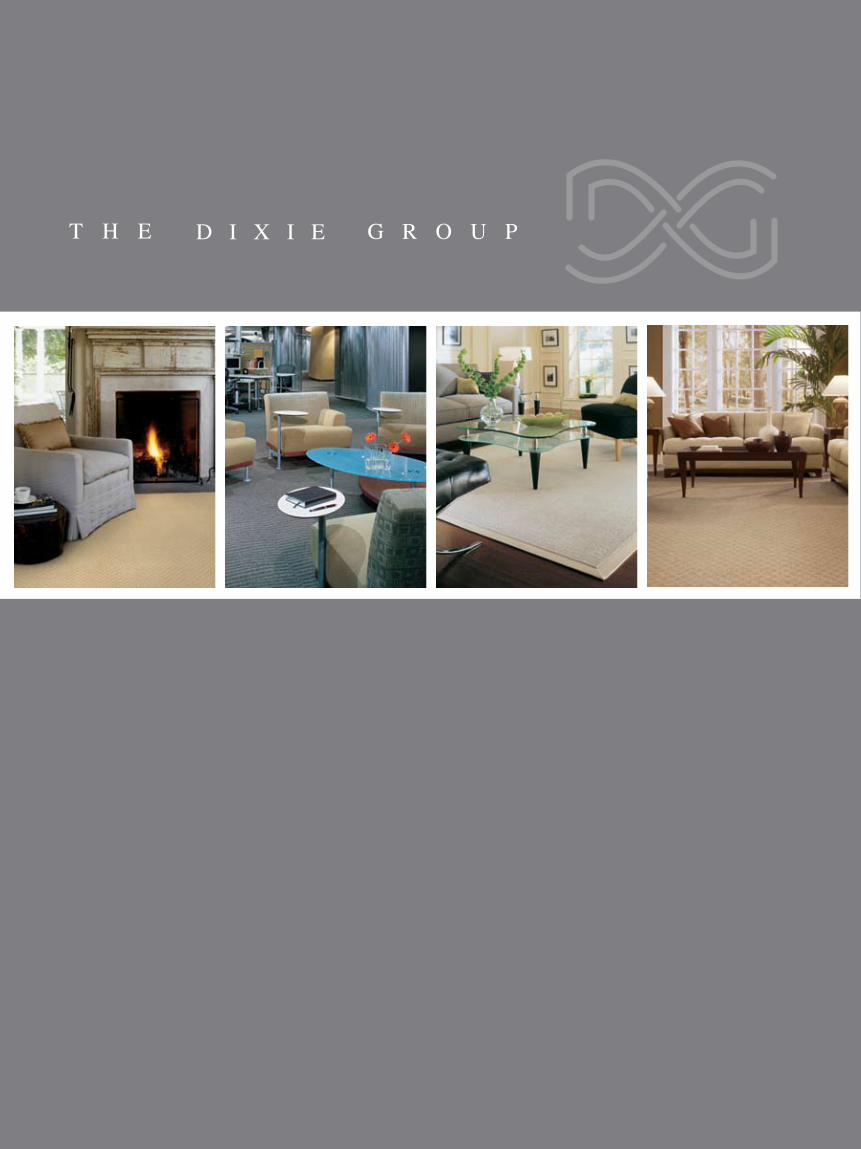
One of America’s fastest growing floor covering companies, The Dixie Group
is an experienced, financially sound manufacturer of carpet and rugs for the soft floor
covering industry. The various Dixie Group brands represent distinct market segments and
a broad range of price points catering to the discriminating customer. Each is recognized
for styling, quality, and relative value.
The Dixie Group is committed to providing our shareholders with outstanding
long-term value. We strive to ensure our customers’ success by providing them with
extraordinary products and unmatched service.
We are proud to share information on The Dixie Group and its exceptional companies with current and potential shareholders, associates and customers.
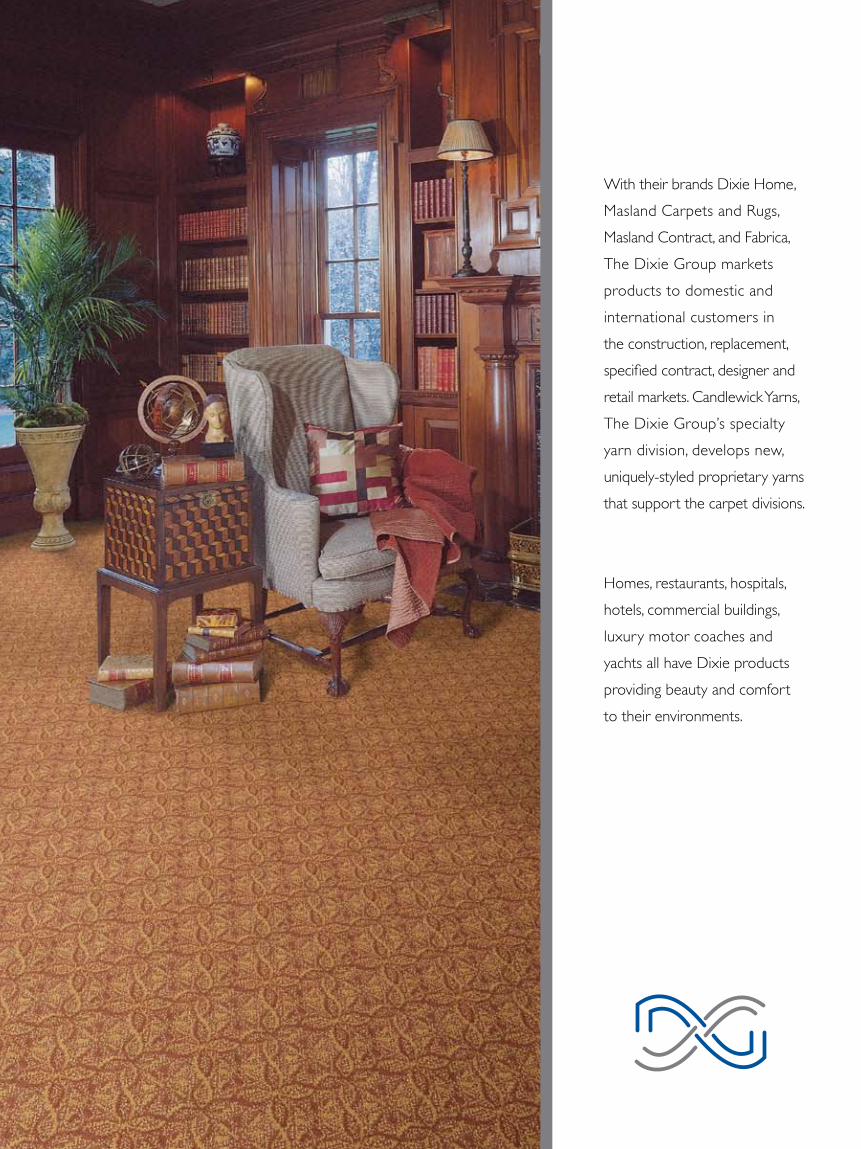
With their brands Dixie Home,
Masland Carpets and Rugs,
Masland Contract, and Fabrica,
The Dixie Group markets
products to domestic and
international customers in
the construction, replacement,
specified contract, designer and
retail markets. Candlewick Yarns,
The Dixie Group’s specialty
yarn division, develops new,
uniquely-styled proprietary yarns
that support the carpet divisions.
Homes, restaurants, hospitals,
hotels, commercial buildings,
luxury motor coaches and
yachts all have Dixie products
providing beauty and comfort
to their environments.

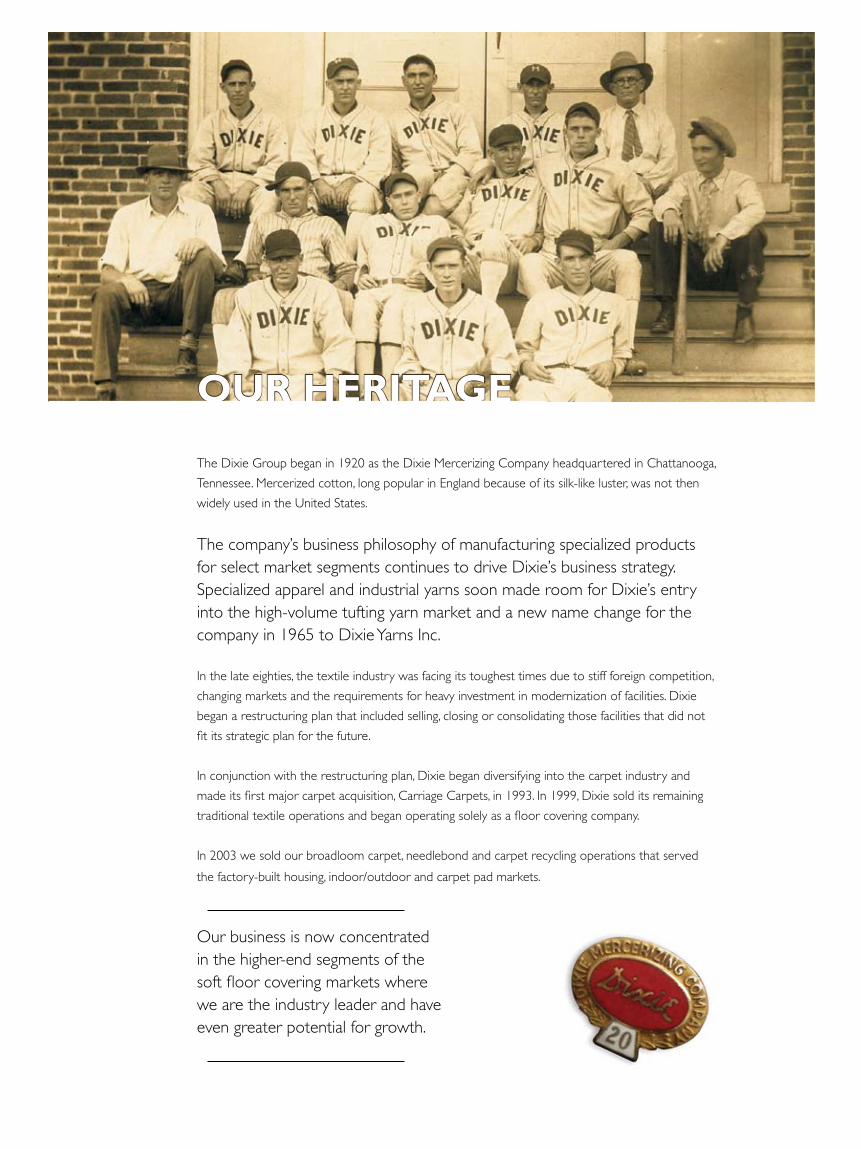
The Dixie Group began in 1920 as the Dixie Mercerizing Company headquartered in Chattanooga,
Tennessee. Mercerized cotton, long popular in England because of its silk-like luster, was not then
widely used in the United States.
The company’s business philosophy of manufacturing specialized products for select market segments continues to drive Dixie’s business strategy. Specialized apparel and industrial yarns soon made room for Dixie’s entry into the high-volume tufting yarn market and a new name change for the company in 1965 to Dixie Yarns Inc.
In the late eighties, the textile industry was facing its toughest times due to stiff foreign competition,
changing markets and the requirements for heavy investment in modernization of facilities. Dixie
began a restructuring plan that included selling, closing or consolidating those facilities that did not
fit its strategic plan for the future.
In conjunction with the restructuring plan, Dixie began diversifying into the carpet industry and
made its first major carpet acquisition, Carriage Carpets, in 1993. In 1999, Dixie sold its remaining
traditional textile operations and began operating solely as a floor covering company.
In 2003 we sold our broadloom carpet, needlebond and carpet recycling operations that served
the factory-built housing, indoor/outdoor and carpet pad markets.
Our business is now concentrated in the higher-end segments of the soft floor covering markets where we are the industry leader and have even greater potential for growth.
Our Heritage
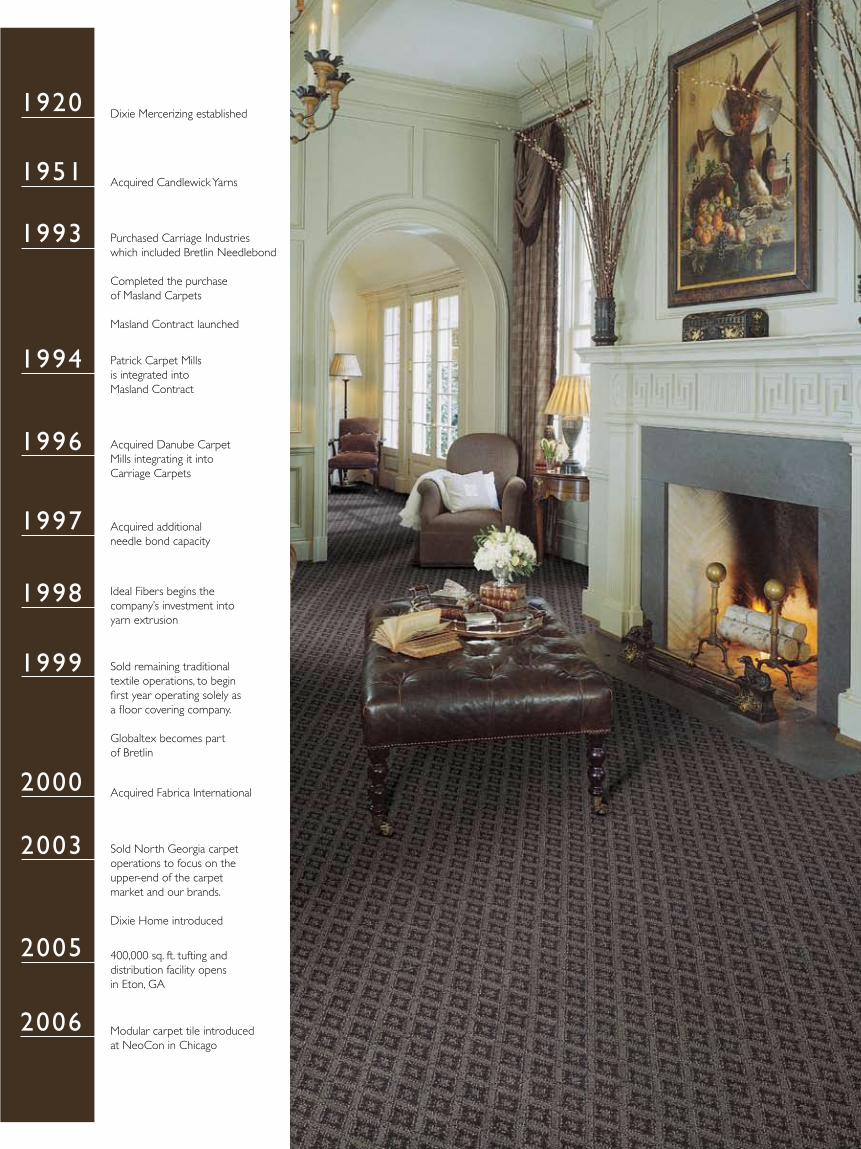
Dixie Mercerizing established
Acquired Candlewick Yarns
Purchased Carriage Industries which included Bretlin Needlebond
Completed the purchase of Masland Carpets
Masland Contract launched
Patrick Carpet Mills is integrated into Masland Contract
Acquired Danube Carpet Mills integrating it into Carriage Carpets
Acquired additional needle bond capacity
Ideal Fibers begins the company’s investment into yarn extrusion
Sold remaining traditional textile operations, to begin first year operating solely as a floor covering company.
Globaltex becomes part of Bretlin
Acquired Fabrica International
1920
1951
1993
1994
1996
1997
1998
1999
2000
2003 Sold North Georgia carpet operations to focus on the upper-end of the carpet market and our brands.
Dixie Home introduced
2005
2006
400,000 sq. ft. tufting and distribution facility opens in Eton, GA
Modular carpet tile introduced at NeoCon in Chicago
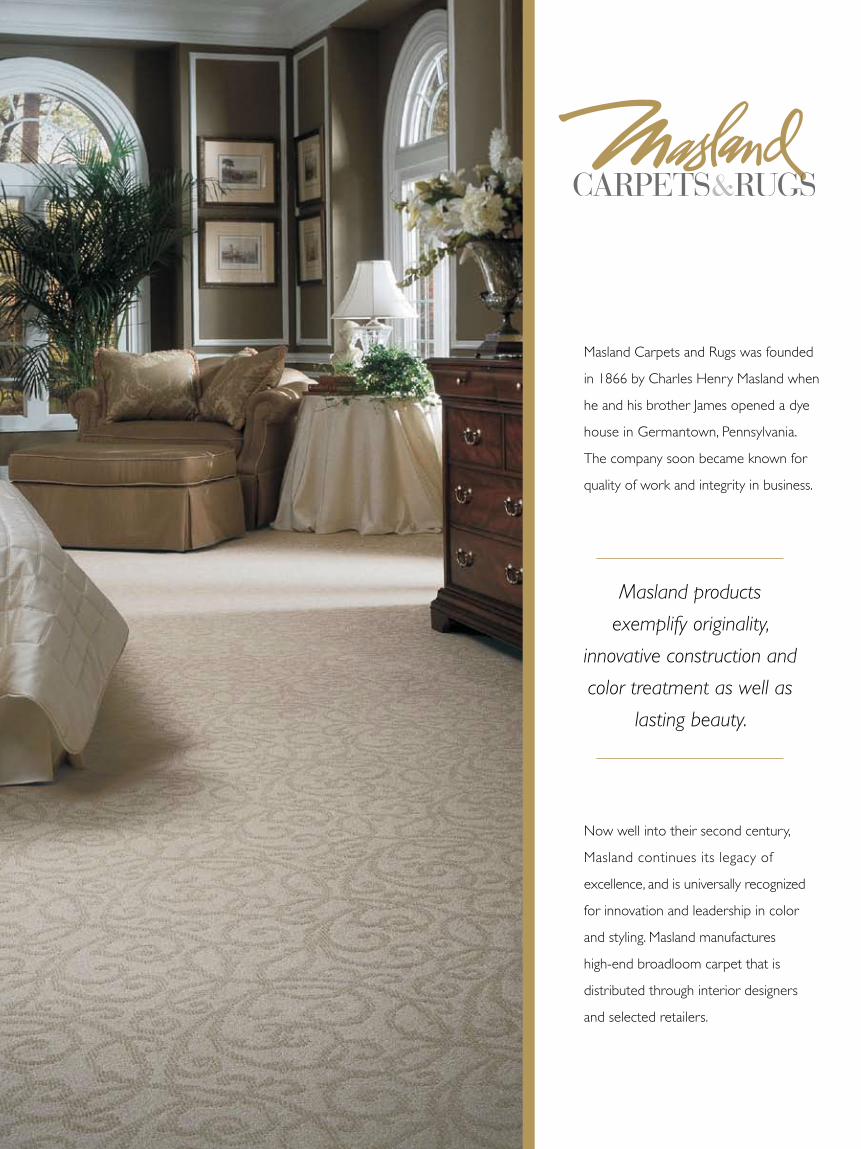
Masland Carpets and Rugs was founded
in 1866 by Charles Henry Masland when
he and his brother James opened a dye
house in Germantown, Pennsylvania.
The company soon became known for
quality of work and integrity in business.
Now well into their second century,
Masland continues its legacy of
excellence, and is universally recognized
for innovation and leadership in color
and styling. Masland manufactures
high-end broadloom carpet that is
distributed through interior designers
and selected retailers.
Masland products
exemplify originality,
innovative construction and
color treatment as well as
lasting beauty.


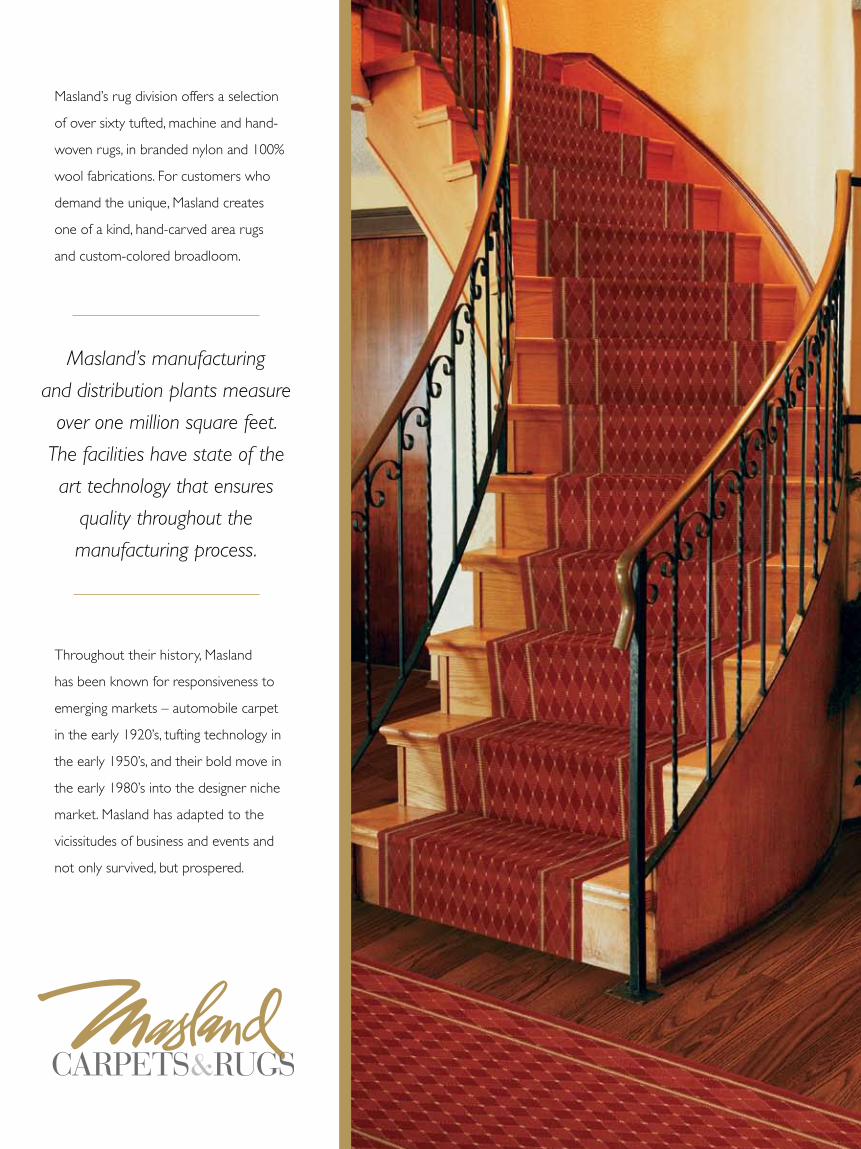
Masland’s manufacturing
and distribution plants measure
over one million square feet.
The facilities have state of the
art technology that ensures
quality throughout the
manufacturing process.
Masland’s rug division offers a selection
of over sixty tufted, machine and hand-
woven rugs, in branded nylon and 100%
wool fabrications. For customers who
demand the unique, Masland creates
one of a kind, hand-carved area rugs
and custom-colored broadloom.
Throughout their history, Masland
has been known for responsiveness to
emerging markets – automobile carpet
in the early 1920’s, tufting technology in
the early 1950’s, and their bold move in
the early 1980’s into the designer niche
market. Masland has adapted to the
vicissitudes of business and events and
not only survived, but prospered.

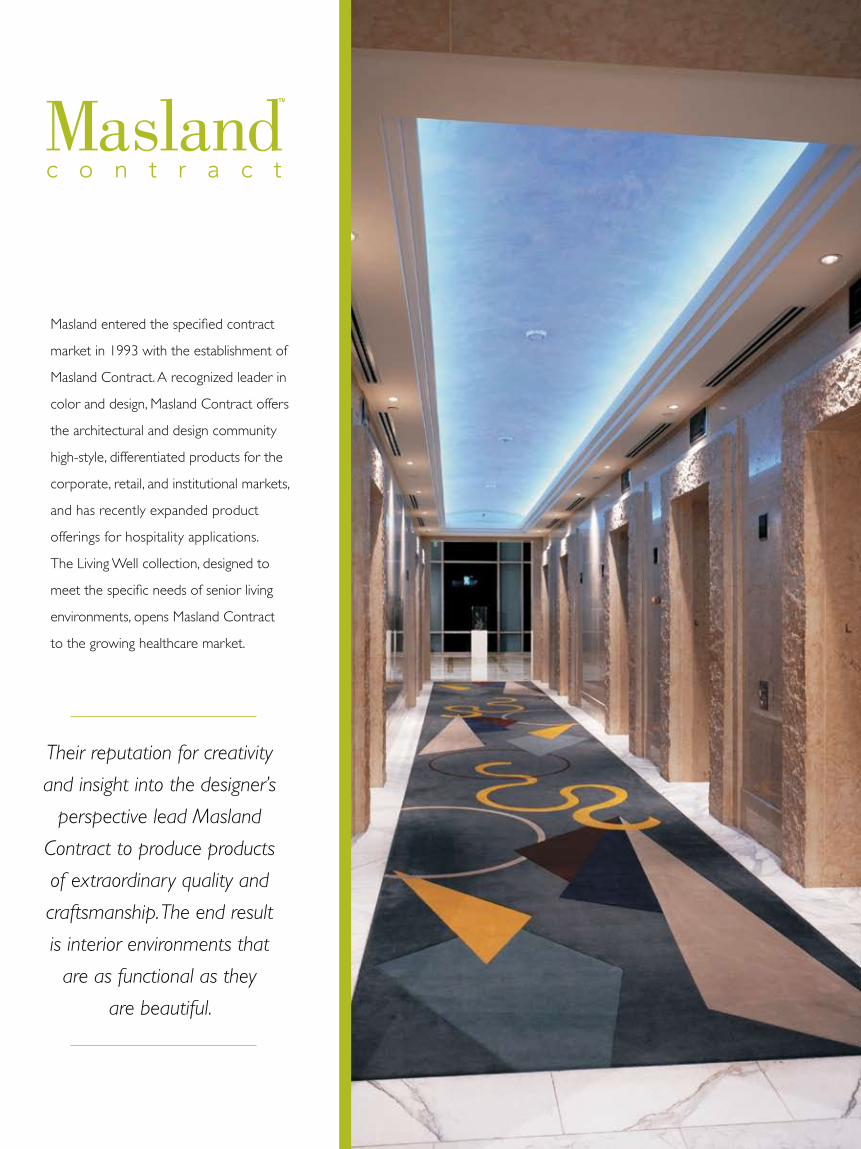
Masland entered the specified contract
market in 1993 with the establishment of
Masland Contract. A recognized leader in
color and design, Masland Contract offers
the architectural and design community
high-style, differentiated products for the
corporate, retail, and institutional markets,
and has recently expanded product
offerings for hospitality applications.
The Living Well collection, designed to
meet the specific needs of senior living
environments, opens Masland Contract
to the growing healthcare market.
Their reputation for creativity
and insight into the designer’s
perspective lead Masland
Contract to produce products
of extraordinary quality and
craftsmanship. The end result
is interior environments that
are as functional as they
are beautiful.
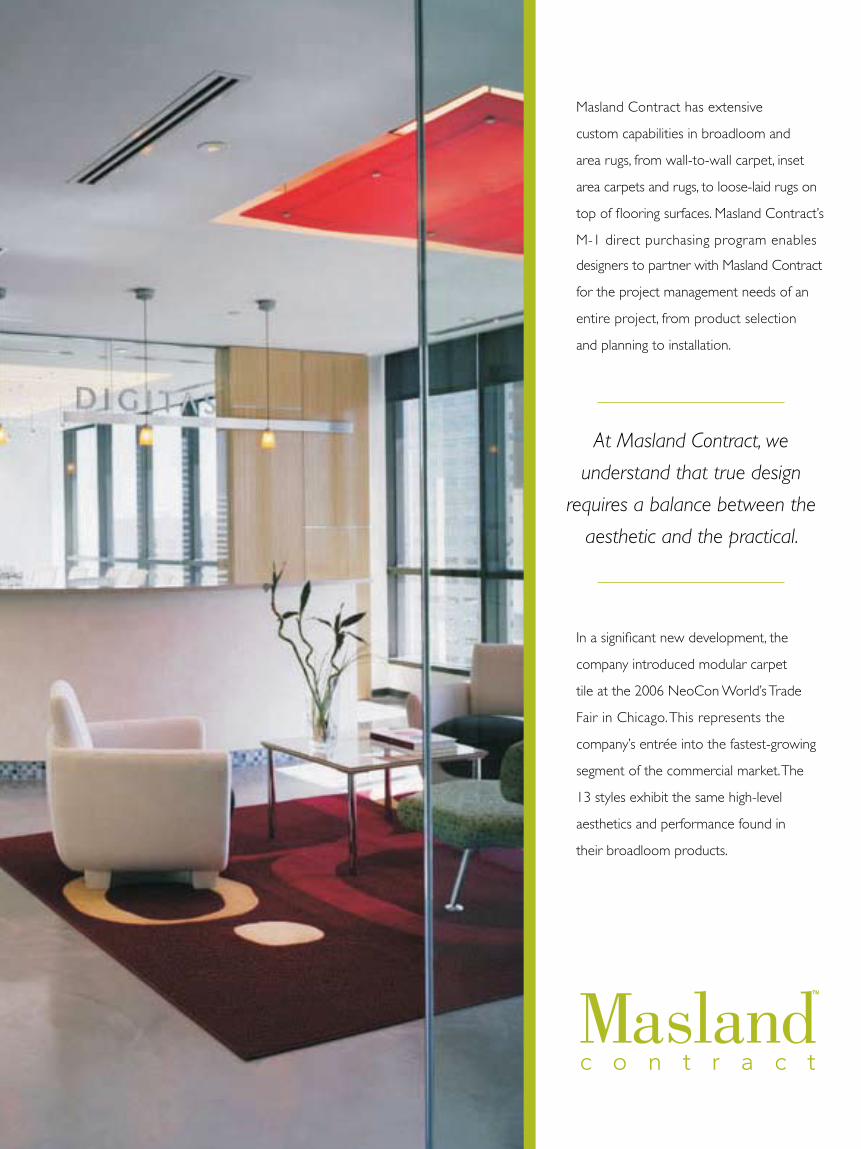
Masland Contract has extensive
custom capabilities in broadloom and
area rugs, from wall-to-wall carpet, inset
area carpets and rugs, to loose-laid rugs on
top of flooring surfaces. Masland Contract’s
M-1 direct purchasing program enables
designers to partner with Masland Contract
for the project management needs of an
entire project, from product selection
and planning to installation.
In a significant new development, the
company introduced modular carpet
tile at the 2006 NeoCon World’s Trade
Fair in Chicago. This represents the
company’s entrée into the fastest-growing
segment of the commercial market. The
13 styles exhibit the same high-level
aesthetics and performance found in
their broadloom products.
At Masland Contract, we
understand that true design
requires a balance between the
aesthetic and the practical.

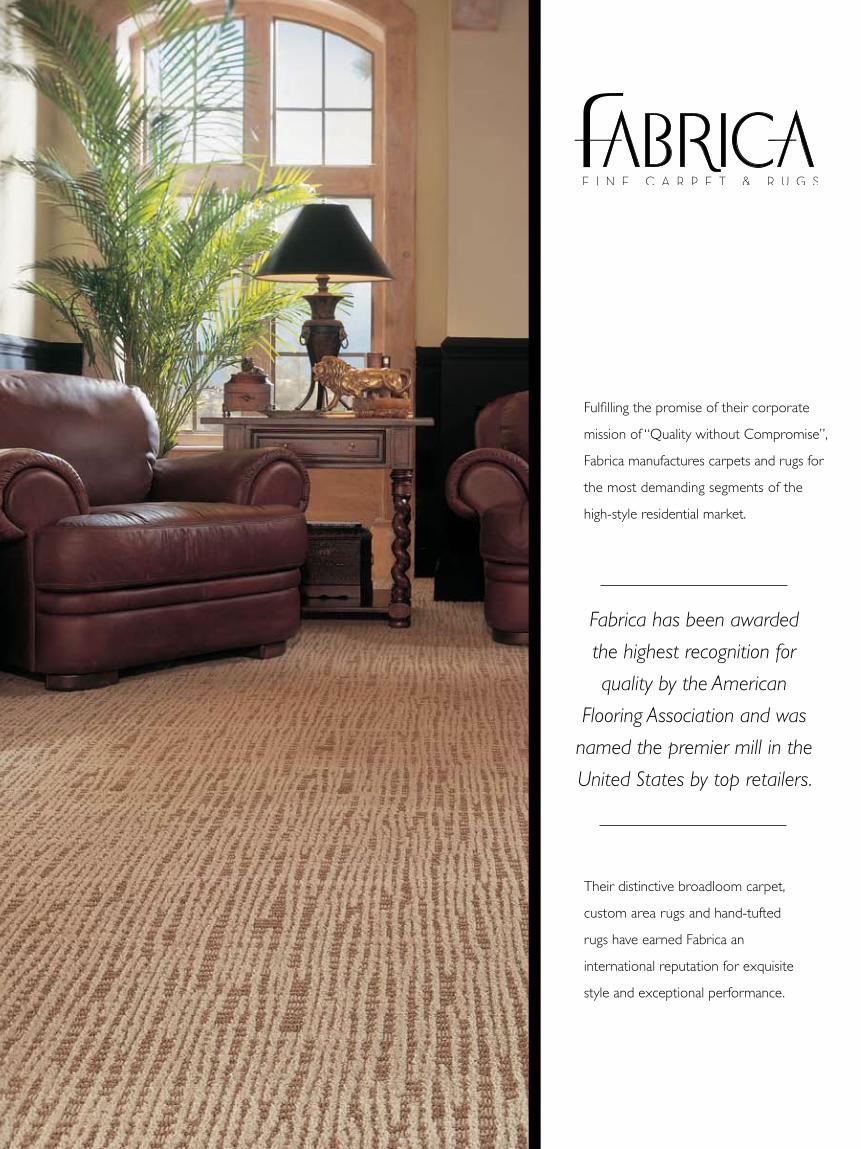
Fulfilling the promise of their corporate
mission of “Quality without Compromise”,
Fabrica manufactures carpets and rugs for
the most demanding segments of the
high-style residential market.
Their distinctive broadloom carpet,
custom area rugs and hand-tufted
rugs have earned Fabrica an
international reputation for exquisite
style and exceptional performance.
Fabrica has been awarded
the highest recognition for
quality by the American
Flooring Association and was
named the premier mill in the
United States by top retailers.


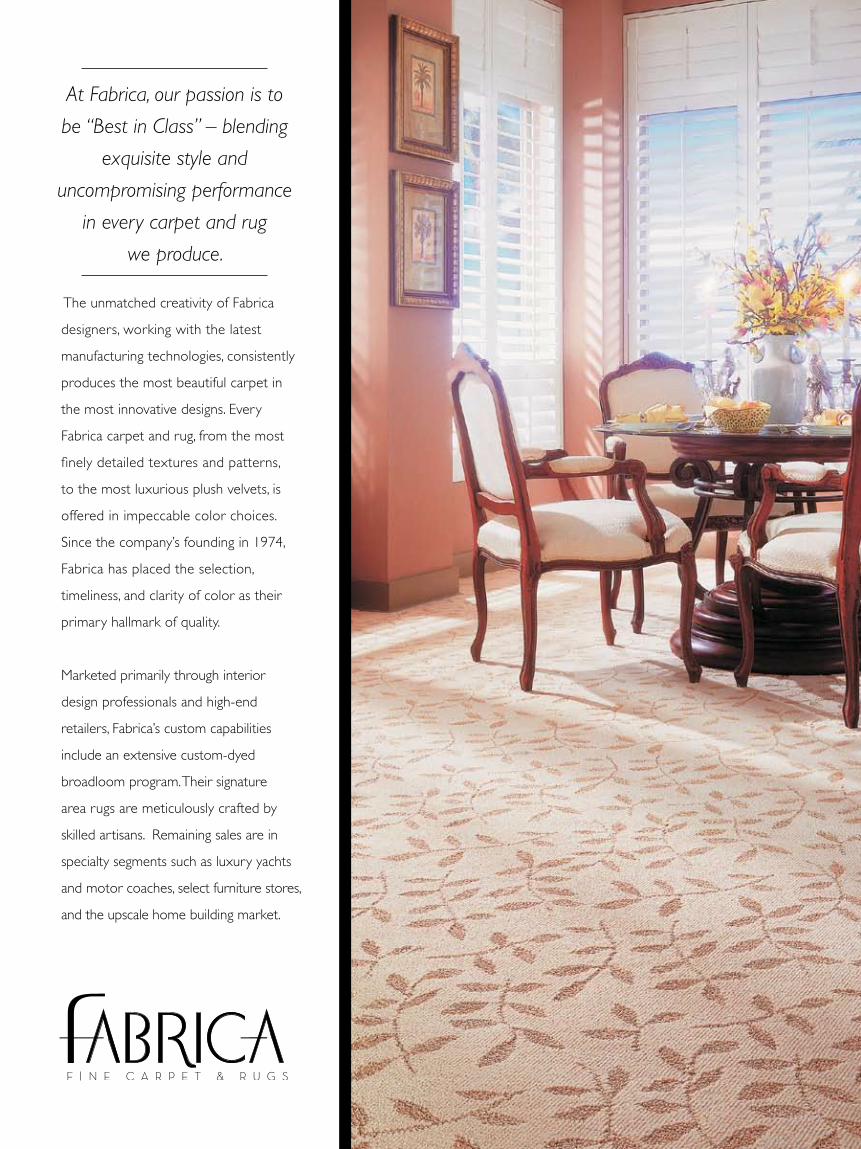
The unmatched creativity of Fabrica
designers, working with the latest
manufacturing technologies, consistently
produces the most beautiful carpet in
the most innovative designs. Every
Fabrica carpet and rug, from the most
finely detailed textures and patterns,
to the most luxurious plush velvets, is
offered in impeccable color choices.
Since the company’s founding in 1974,
Fabrica has placed the selection,
timeliness, and clarity of color as their
primary hallmark of quality.
Marketed primarily through interior
design professionals and high-end
retailers, Fabrica’s custom capabilities
include an extensive custom-dyed
broadloom program. Their signature
area rugs are meticulously crafted by
skilled artisans. Remaining sales are in
specialty segments such as luxury yachts
and motor coaches, select furniture stores,
and the upscale home building market.
At Fabrica, our passion is to
be “Best in Class” – blending
exquisite style and
uncompromising performance
in every carpet and rug
we produce.

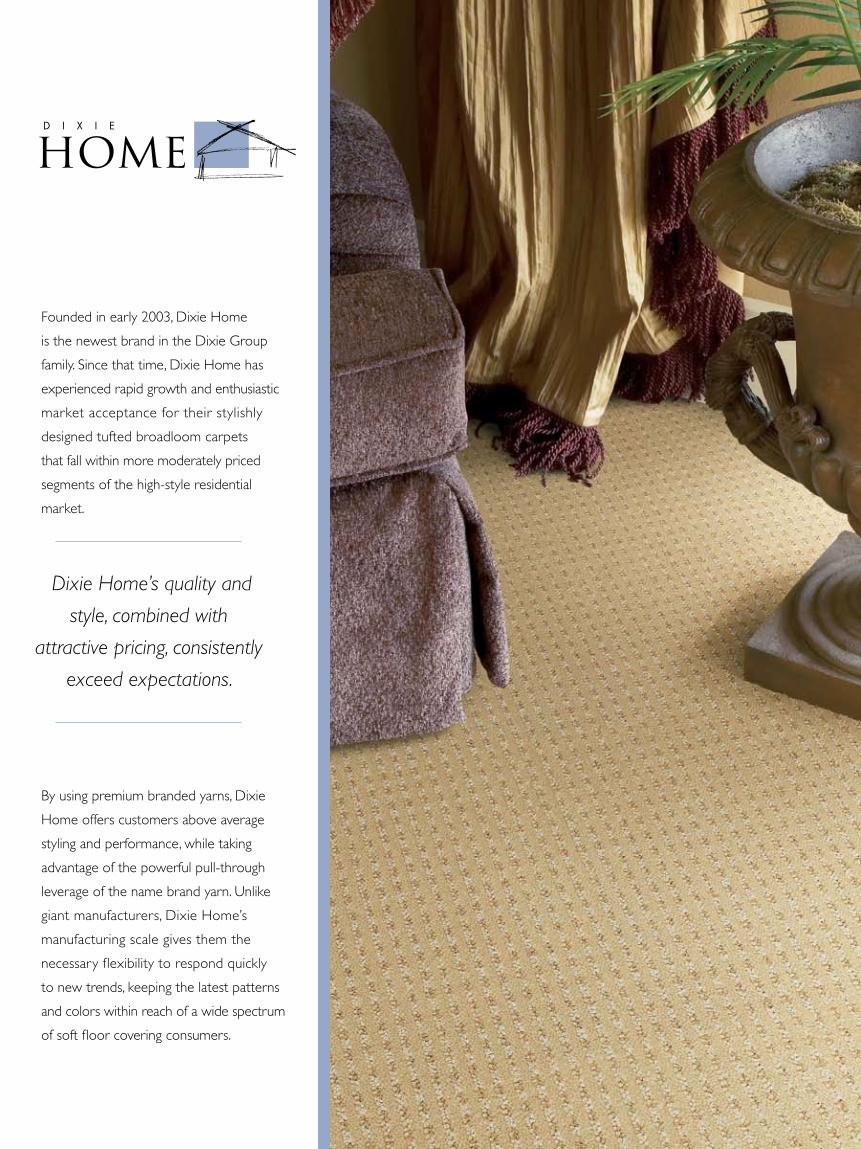
Founded in early 2003, Dixie Home
is the newest brand in the Dixie Group
family. Since that time, Dixie Home has
experienced rapid growth and enthusiastic
market acceptance for their stylishly
designed tufted broadloom carpets
that fall within more moderately priced
segments of the high-style residential
market.
By using premium branded yarns, Dixie
Home offers customers above average
styling and performance, while taking
advantage of the powerful pull-through
leverage of the name brand yarn. Unlike
giant manufacturers, Dixie Home’s
manufacturing scale gives them the
necessary flexibility to respond quickly
to new trends, keeping the latest patterns
and colors within reach of a wide spectrum
of soft floor covering consumers.
Dixie Home’s quality and
style, combined with
attractive pricing, consistently
exceed expectations.
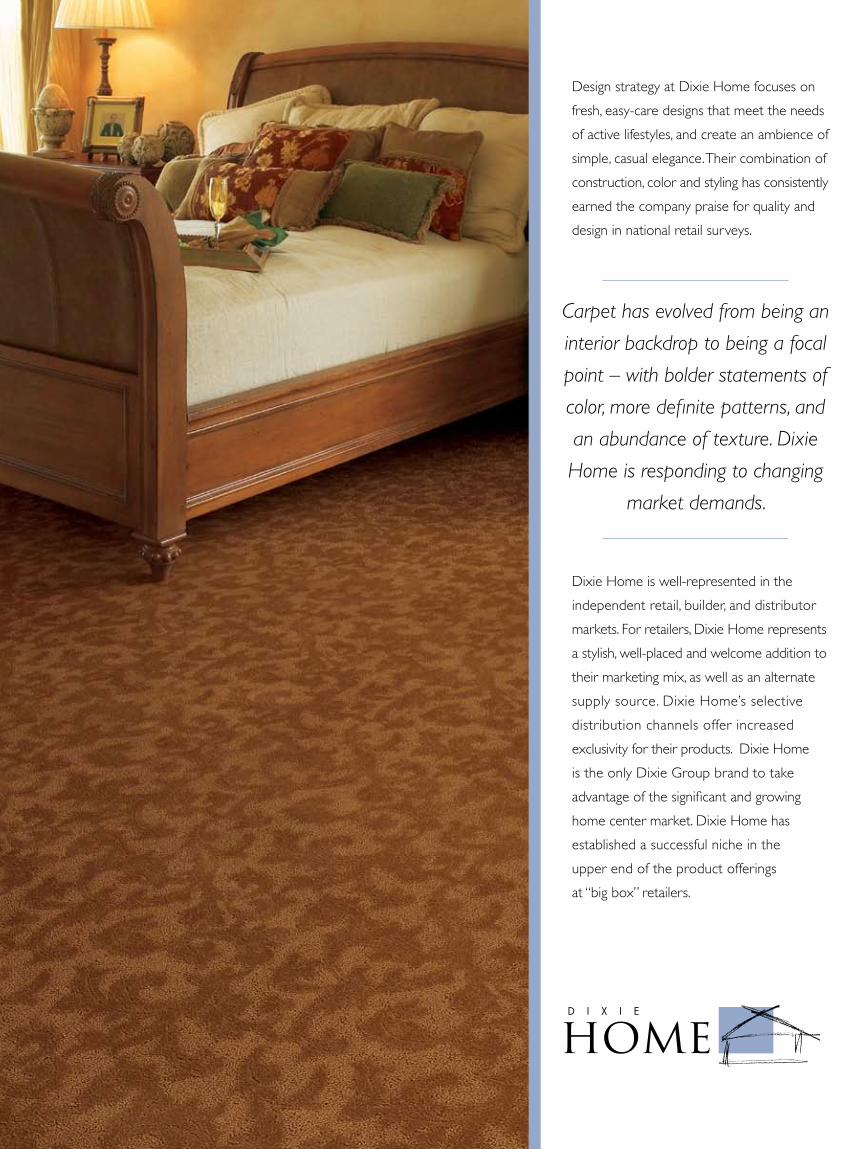
Design strategy at Dixie Home focuses on
fresh, easy-care designs that meet the needs
of active lifestyles, and create an ambience of
simple, casual elegance. Their combination of
construction, color and styling has consistently
earned the company praise for quality and
design in national retail surveys.
Dixie Home is well-represented in the
independent retail, builder, and distributor
markets. For retailers, Dixie Home represents
a stylish, well-placed and welcome addition to
their marketing mix, as well as an alternate
supply source. Dixie Home’s selective
distribution channels offer increased
exclusivity for their products. Dixie Home
is the only Dixie Group brand to take
advantage of the significant and growing
home center market. Dixie Home has
established a successful niche in the
upper end of the product offerings
at “big box” retailers.
Carpet has evolved from being an
interior backdrop to being a focal
point – with bolder statements of
color, more definite patterns, and
an abundance of texture. Dixie
Home is responding to changing
market demands.


HEALTH & SAFETY
The Dixie Group is firmly dedicated to maintaining a healthy and safe workplace. We continuously monitor our work practices to be certain they are as safe as possible. We continue to invest in modernized facilities and in programs that help provide a safe environment. We are proud of our people, our plants and our equipment. Our associates share our pride, acknowledging that a clean and safe operation is essential for the accident-free production of superior floor covering products.
VISION & VALUES
At the Dixie Group, our people are our most important resource and our primary source of competitive advantage.
• We will provide opportunities for individual growth and development.
• We will hold ourselves to the highest standards of honesty and integrity in working with our associates, customers, suppliers and communities.
• We are obsessed with making our customers more successful.
• We will never be satisfied with where we are today. We will act aggressively in the relentless pursuit of our vision.
OUR PEOPLE
This value is instilled in everyone who joins the company and is continuously reemphasized throughout their tenure. Our leadership training program, Leadership Legacy, demonstrates Dixie’s ongoing commitment to developing leaders at every level of the company.
Since our founding in 1920, generations of enthusiastic and devoted employees have helped make The Dixie Group the success it is today. While we take great pride in our accomplishments, we believe the ultimate success of any company is measured in the fulfillment and growth of its people.
“The products a company makes are not as important as the people a company
helps build.”
At Dixie, our vision is to Lead, Win and Have Fun!
Dan FriersonDixie Group Chairman
ENVIRONMENTAL STATEMENT
The Dixie Group believes environmental responsibility must be on equal footing with design. The company’s three main areas for improved environmental performance are: conserving energy, managing waste, and recycling.
Dixie regularly monitors environmental progress by conducting comprehensive environmental audits at each of our facilities to be certain we are using energy wisely and in compliance with all regulations.
• Consumption of water, electricity and natural gas used in the dyeing and finishing processes has been significantly reduced - in some areas, energy use is down by over 25% since 1999.
Dixie has adopted multiple programs and practices that demonstrate our commitment to reducing waste and disposing remaining waste responsibly and safely.
• By substituting recyclable paper CAD illustrations for material samples in the preliminary sampling process, Masland Contract eliminates over 30,000 pounds of yarn waste per year. A self addressed postage paid label accompanies all sample orders so customers can return their sample for recycling.
• Rewinding short ends of yarn saves over 330,000 pounds of yarn each year that would otherwise end up outside the recyclable chain.
• Over 100,000 pounds of carpet waste are diverted from landfills each year and reprocessed into other products.
The health and safety of the indoor environment is also important to Dixie’s overall environmental planning.
• All Dixie Group products pass the Carpet and Rug Institute’s Green Label Indoor Air Quality Testing Program for carpet.
• Masland Contract products contribute to LEED points for Indoor Environmental Quality.
Environmental health and safety remains among our top priorities in our planning for existing and new products, processes, and services. We encourage our communities, families, and associates to conserve the earth’s natural resources and better protect the environment in their daily lives.
UNITED STATES SECURITIES AND EXCHANGE COMMISSION
Washington, D.C. 20549
FORM 10-K (Mark One)
ANNUAL REPORT PURSUANT TO SECTION 13 OR 15(d) OF THE SECURITIES EXCHANGE ACT OF 1934
For the fiscal year ended December 29, 2007 OR
TRANSITION REPORT PURSUANT TO SECTION 13 OR 15(d) OF THE SECURITIES EXCHANGE ACT OF 1934 For the transition period from _________ to ________.
Commission File Number 0-2585
The Dixie Group, Inc. (Exact name of registrant as specified in its charter)
Tennessee 62-0183370 (State or other jurisdiction of incorporation or organization)
(I.R.S. Employer Identification No.)
104 Nowlin Lane, Suite 101 Chattanooga, TN 37421
(Address of principal executive offices)
(423) 510-7000 (Registrant's telephone number, including area code)
Securities registered pursuant to Section 12(b) of the Act:
None
Securities registered pursuant to Section 12(g) of the Act: Title of each class Name of each exchange on which registered
Common Stock, $3.00 Par Value None
Indicate by check mark if the registrant is a well-known seasoned issuer, as defined in Rule 405 of the Securities Act. Yes No
Indicate by check mark if the registrant is not required to file reports pursuant to Section 13 or 15(d) of the Act. Yes No
Indicate by check mark whether the registrant (1) has filed all reports required to be filed by Section 13 or 15(d) of the Securities Exchange Act of 1934 during the preceding 12 months (or for such shorter period that the registrant was required to file such reports), and (2) has been subject to such filing requirements for the past 90 days. Yes No
Indicate by check mark if disclosure of delinquent filer pursuant to Item 405 of Regulation S-K is not contained herein, and will not be contained to the best of the registrant's knowledge, in definitive proxy or information statements incorporated by reference in Part III of the Form 10-K or any amendment to the Form 10-K.
Indicate by check mark whether the registrant is a large accelerated filer, or a non-accelerated filer. See definition of "accelerated filer and large accelerated filer" in Rule 12b-2 of the Exchange Act. (Check one):
Large accelerated filer Accelerated filer Non-accelerated filer
Indicate by check mark whether the registrant is a shell company (as defined in Rule 12b-2 of the Act). Yes No
The aggregate market value of the Common Stock held by non-affiliates of the registrant on June 29, 2007 (the last business day of the registrant's most recently completed fiscal second quarter) was approximately $125,800,000. The aggregate market value was computed by reference to the closing price of the Common Stock on such date. In making this calculation, the registrant has assumed, without admitting for any purpose, that all executive officers, directors, and holders of more than 10% of a class of outstanding Common Stock, and no other persons, are affiliates. No market exists for the shares of Class B Common Stock, which is neither registered under Section 12 of the Act nor subject to Section 15(d) of the Act.
Indicate the number of shares outstanding of each of the registrant's classes of Common Stock as of the latest practicable date.
Class Outstanding as of February 8, 2008 Common Stock, $3.00 Par Value 12,060,884 shares
Class B Common Stock, $3.00 Par Value 835,908 shares Class C Common Stock, $3.00 Par Value 0 shares
DOCUMENTS INCORPORATED BY REFERENCE
Specified portions of the following document are incorporated by reference: Proxy Statement of the registrant for annual meeting of shareholders to be held April 30, 2008 (Part III).
1
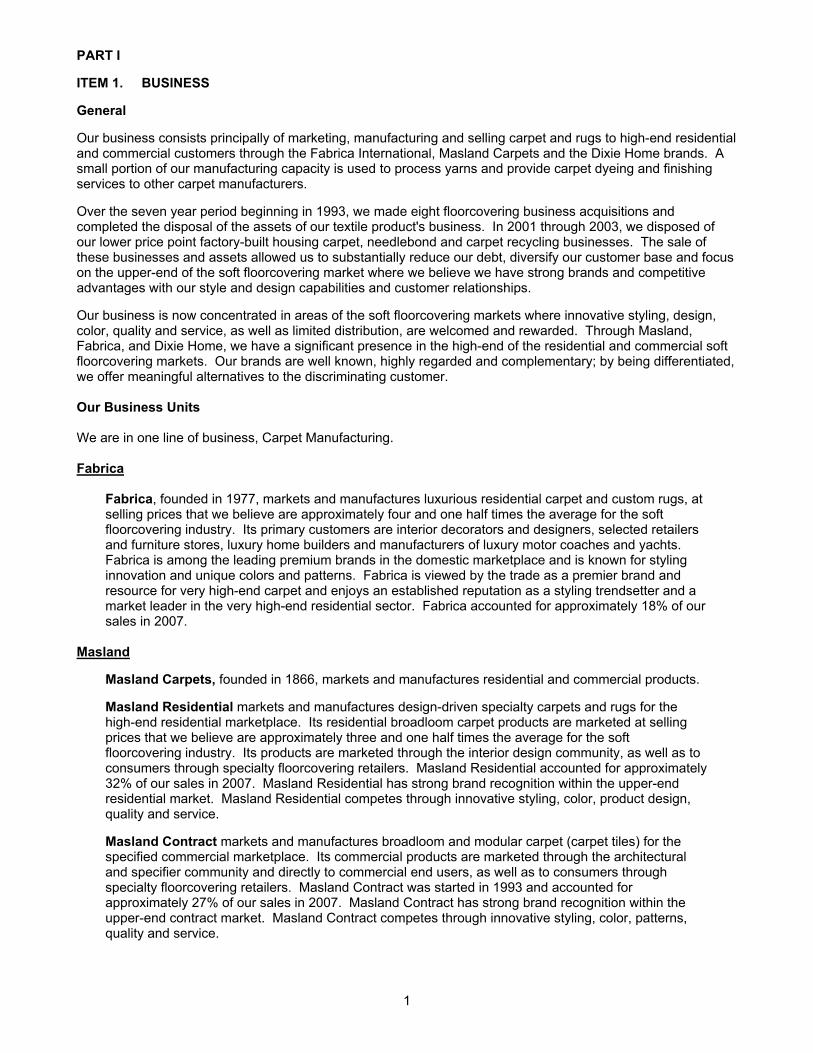
PART I ITEM 1. BUSINESS General Our business consists principally of marketing, manufacturing and selling carpet and rugs to high-end residential and commercial customers through the Fabrica International, Masland Carpets and the Dixie Home brands. A small portion of our manufacturing capacity is used to process yarns and provide carpet dyeing and finishing services to other carpet manufacturers. Over the seven year period beginning in 1993, we made eight floorcovering business acquisitions and completed the disposal of the assets of our textile product's business. In 2001 through 2003, we disposed of our lower price point factory-built housing carpet, needlebond and carpet recycling businesses. The sale of these businesses and assets allowed us to substantially reduce our debt, diversify our customer base and focus on the upper-end of the soft floorcovering market where we believe we have strong brands and competitive advantages with our style and design capabilities and customer relationships. Our business is now concentrated in areas of the soft floorcovering markets where innovative styling, design, color, quality and service, as well as limited distribution, are welcomed and rewarded. Through Masland, Fabrica, and Dixie Home, we have a significant presence in the high-end of the residential and commercial soft floorcovering markets. Our brands are well known, highly regarded and complementary; by being differentiated, we offer meaningful alternatives to the discriminating customer. Our Business Units We are in one line of business, Carpet Manufacturing. Fabrica
Fabrica, founded in 1977, markets and manufactures luxurious residential carpet and custom rugs, at selling prices that we believe are approximately four and one half times the average for the soft floorcovering industry. Its primary customers are interior decorators and designers, selected retailers and furniture stores, luxury home builders and manufacturers of luxury motor coaches and yachts. Fabrica is among the leading premium brands in the domestic marketplace and is known for styling innovation and unique colors and patterns. Fabrica is viewed by the trade as a premier brand and resource for very high-end carpet and enjoys an established reputation as a styling trendsetter and a market leader in the very high-end residential sector. Fabrica accounted for approximately 18% of our sales in 2007.
Masland
Masland Carpets, founded in 1866, markets and manufactures residential and commercial products. Masland Residential markets and manufactures design-driven specialty carpets and rugs for the high-end residential marketplace. Its residential broadloom carpet products are marketed at selling prices that we believe are approximately three and one half times the average for the soft floorcovering industry. Its products are marketed through the interior design community, as well as to consumers through specialty floorcovering retailers. Masland Residential accounted for approximately 32% of our sales in 2007. Masland Residential has strong brand recognition within the upper-end residential market. Masland Residential competes through innovative styling, color, product design, quality and service. Masland Contract markets and manufactures broadloom and modular carpet (carpet tiles) for the specified commercial marketplace. Its commercial products are marketed through the architectural and specifier community and directly to commercial end users, as well as to consumers through specialty floorcovering retailers. Masland Contract was started in 1993 and accounted for approximately 27% of our sales in 2007. Masland Contract has strong brand recognition within the upper-end contract market. Masland Contract competes through innovative styling, color, patterns, quality and service.
2
Dixie Home
We introduced Dixie Home in 2003 as a brand to provide stylishly designed, differentiated products that offer affordable fashion to residential and commercial consumers. Dixie Home markets an array of tufted broadloom residential and commercial carpet to selected retailers and home centers under the Dixie Home and private label brands. Its objective is to make the Dixie Home brand the choice for styling, service and quality in the more moderately priced sector of the high-end broadloom residential and commercial carpet market. Its products are marketed at selling prices which we believe are approximately two times the average for the soft floorcovering industry. Dixie Home's products have been well received in the marketplace and are expected to have significant growth potential. Dixie Home accounted for approximately 18% of our sales in 2007.
Industry The carpet and rug industry has two primary markets, residential and commercial, with the residential market making up the largest portion of the industry's sales. A substantial portion of industry shipments is made in response to replacement demand. Residential products consist of broadloom carpets and rugs in a broad range of styles, colors and textures. Commercial products consist primarily of broadloom carpet and carpet tiles for a variety of institutional applications such as office buildings, restaurant chains, schools and other commercial establishments. The carpet industry also manufactures carpet for the automotive, recreational vehicle, small boat and other industries. The Carpet and Rug Institute (the "CRI") is the national trade association representing carpet and rug manufacturers. Information compiled by the CRI suggests that the domestic carpet and rug industry is comprised of fewer than 100 manufacturers, with a significant majority of the industry's production concentrated in a limited number of manufacturers. The industry has continued to consolidate in recent years. We believe that this consolidation provides us with opportunities to capitalize on our competitive strengths in selected markets where innovative styling, design, product differentiation, focused service and limited distribution can add value. Competition The floorcovering industry is highly competitive. We compete with other carpet manufacturers and rug manufacturers and other types of floorcoverings. Despite the industry consolidation, a number of smaller manufacturers remain. We believe our products are among the leaders in styling and design in the high-end residential and high-end commercial carpet markets. However, a number of manufacturers produce competitive products and some of these manufacturers have greater financial resources than we do. We believe the principal competitive factors in our primary floorcovering markets are innovative styling, color, product design, quality and service. In the high-end residential and high-end commercial markets, carpet competes with various other types of floorcoverings, many of which have grown at a faster rate than carpet in recent years. Nevertheless, we believe we have competitive advantages in several areas. We have an attractive portfolio of brands that we believe are well known, highly regarded by customers and complementary; by being differentiated, we offer meaningful alternatives to the discriminating customer. In addition, we have established longstanding relationships with key suppliers in our industry and customers in most of our markets. Finally, our reputation for innovative design excellence and our experienced management team enhance our competitive position. See "Risk Factors" in Item 1A of this report. Backlog Sales order backlog is not material to an understanding of our business, due to relatively short lead times for order fulfillment in the markets for the vast majority of our products. Trademarks Our floorcovering businesses own a variety of trademarks under which our products are marketed. Among such trademarks, the names "Masland" "Fabrica" and "Dixie Home" are of greatest importance to our business. We believe that we have taken adequate steps to protect our interest in all significant trademarks.
3
Customer and Product Concentration No single customer accounts for more than 10 percent of our sales and we do not make a material amount of sales to foreign countries. We do not believe that we have any single class of products that accounts for more than 10 percent of our sales. However, our sales may be classified by significant markets, and such information for the past three years is summarized as follows: 2007 2006 2005 Residential floorcovering products 60% 65% 64%Commercial floorcovering products 35% 30% 30%Carpet yarn processing and carpet dyeing and finishing services 5% 5% 6%
Seasonality Our sales volumes historically have normally reached their highest levels in the fourth quarter (approximately 28% of our annual sales) and their lowest levels in the first quarter (approximately 22% of our annual sales), with the remaining sales being distributed relatively equally between the second and third quarters. Working capital requirements have normally reached their highest levels in the second and third quarters of the year. Environmental Our operations are subject to federal, state and local laws and regulations relating to the generation, storage, handling, emission, transportation and discharge of materials into the environment. The costs of complying with environmental protection laws and regulations have not had a material adverse impact on our financial condition or results of operations in the past and are not expected to have a material adverse impact in the future. See "Risk Factors” in Item 1A of this report. Raw Materials We obtain our raw materials from a number of domestic suppliers. Man-made yarns are purchased from major chemical companies. Where possible, we pass raw material price increases through to our customers; however, there can be no assurance that price increases can be passed through to customers and that increases in raw material prices will not have an adverse effect on our profitability. See "Risk Factors” in Item 1A of this report. We purchase a significant portion of our raw materials (nylon yarn) from one supplier. We believe there are other sources of nylon yarn; however, an unanticipated termination or interruption of our supply arrangements could adversely affect our supply arrangements and could be material. See "Risk Factors” in Item 1A of this report. Utilities We use electricity as our principal energy source, with oil or natural gas used in some facilities for finishing operations as well as heating. We have not experienced any material problem in obtaining adequate supplies of electricity, natural gas or oil. Energy shortages of extended duration could have an adverse effect on our operations, and price volatility could negatively impact future earnings. See "Risk Factors” in Item 1A of this report. Working Capital We are required to maintain significant levels of inventory in order to provide the enhanced service levels demanded by the nature of our business and our customers, and to ensure timely delivery of our products. Consistent and dependable sources of liquidity are required to maintain such inventory levels. Failure to maintain appropriate levels of inventory could materially adversely affect our relationships with our customers and adversely affect our business. Employment Level We employ approximately 1,500 associates in our operations.
4
Available Information Our internet address is www.thedixiegroup.com. We make the following reports filed by us with the Securities and Exchange Commission available, free of charge, on our website under the heading "Investor Relations":
1. annual reports on Form 10-K; 2. quarterly reports on Form 10-Q; 3. current reports on Form 8-K; and 4. amendments to the foregoing reports.
The contents of our website are not a part of this report. ITEM 1A. RISK FACTORS In addition to the other information provided in this Report, the following risk factors should be considered when evaluating results of our operations, future prospects and an investment in shares of our Common Stock. Any of these factors could cause our actual financial results to differ materially from our historical results, and could give rise to events that might have a material adverse effect on our business, financial condition and results of operations. The floorcovering industry is cyclical and prolonged declines in residential or commercial construction activity or corporate remodeling and refurbishment could have a material adverse effect on our business. The U.S. floorcovering industry is cyclical and is influenced by a number of general economic factors. In general, the industry is dependent on residential and commercial construction activity, including new construction as well as remodeling. New construction is cyclical in nature. To a somewhat lesser degree, this also is true with residential and commercial remodeling. A prolonged decline in new construction or remodeling activity could have a material adverse effect on our business, financial condition and results of operations. The level of activity in these industries is significantly affected by numerous factors, all of which are beyond our control, including among others:
• consumer confidence; • housing demand; • financing availability; • national and local economic conditions; • interest rates; • employment levels; • changes in disposable income; • commercial rental vacancy rates; and • federal and state income tax policies.
Our product concentration in the higher-end of the residential and commercial markets could significantly affect the impact of these factors on our business. We face intense competition in our industry, which could decrease demand for our products and could have a material adverse effect on our profitability. The floorcovering industry is highly competitive. We face competition from a number of domestic manufacturers and independent distributors of floorcovering products and, in certain product areas, foreign manufacturers. There has been significant consolidation within the floorcovering industry during recent years that has caused a number of our existing and potential competitors to be significantly larger and have significantly greater resources and access to capital than we do. Maintaining our competitive position may require us to make substantial additional investments in our product development efforts, manufacturing facilities, distribution network and sales and marketing activities, which may be limited by our access to capital, as well as restrictions set forth in our credit facilities. Competitive pressures may also result in decreased demand for our products and in the loss of market share. In addition, we face, and will continue to face, pressure on sales prices of our products from competitors. As a result of any of these factors, there could be a material adverse effect on our sales and profitability.
5
Raw material prices may increase. The cost of raw materials has a significant impact on our profitability. In particular, our business requires the purchase of large volumes of nylon yarn, synthetic backing, latex, and dyes. Increases in the cost of these raw materials could materially adversely affect our business, results of operations and financial condition if we are unable to pass these increases through to our customers. We believe we are successful in passing along raw material and other cost increases as they may occur; however, there can be no assurance that we will successfully recover such increases in cost. Unanticipated termination or interruption of our arrangements with third-party suppliers of nylon yarn could have a material adverse effect on us.
Nylon yarn is the principal raw material used in our floorcovering products. A significant portion of such yarn is purchased from one supplier. We believe there are other sources of nylon yarns; however, an unanticipated termination or interruption of our supply arrangements could adversely affect our supply arrangements and could be material. We may be responsible for environmental cleanup costs. Various federal, state and local environmental laws govern the use of our facilities. These laws govern such matters as:
• Discharges to air and water; • Handling and disposal of solid and hazardous substances and waste; and • Remediation of contamination from releases of hazardous substances in our facilities and off-site
disposal locations. Our operations also are governed by laws relating to workplace safety and worker health, which, among other things, establish noise standards and regulate the use of hazardous materials and chemicals in the workplace. We have taken, and will continue to take, steps to comply with these laws. If we fail to comply with present or future environmental or safety regulations, we could be subject to future liabilities. However, we cannot ensure that complying with these environmental or health and safety laws and requirements will not adversely affect our business, results of operations and financial condition. Future laws, ordinances or regulations could give rise to additional compliance or remediation costs that could have a material adverse effect on our business, results of operations and financial condition. Acts of Terrorism. Our business could be materially adversely affected as a result of international conflicts or acts of terrorism. Terrorist acts or acts of war may cause damage or disruption to our facilities, employees, customers, suppliers, and distributors, which could have a material adverse effect on our business, results of operations or financial condition. Such conflicts also may cause damage or disruption to transportation and communication systems and to our ability to manage logistics in such an environment, including receipt of supplies and distribution of products. Unanticipated Business Interruptions. Our business could be adversely affected if a significant portion of our plant, equipment or operations were damaged or interrupted by a casualty, condemnation, utility service, work stoppage or other event beyond our control. Such an event could have a material adverse effect on our business, results of operations and financial condition. ITEM 1B. UNRESOLVED STAFF COMMENTS None.
6
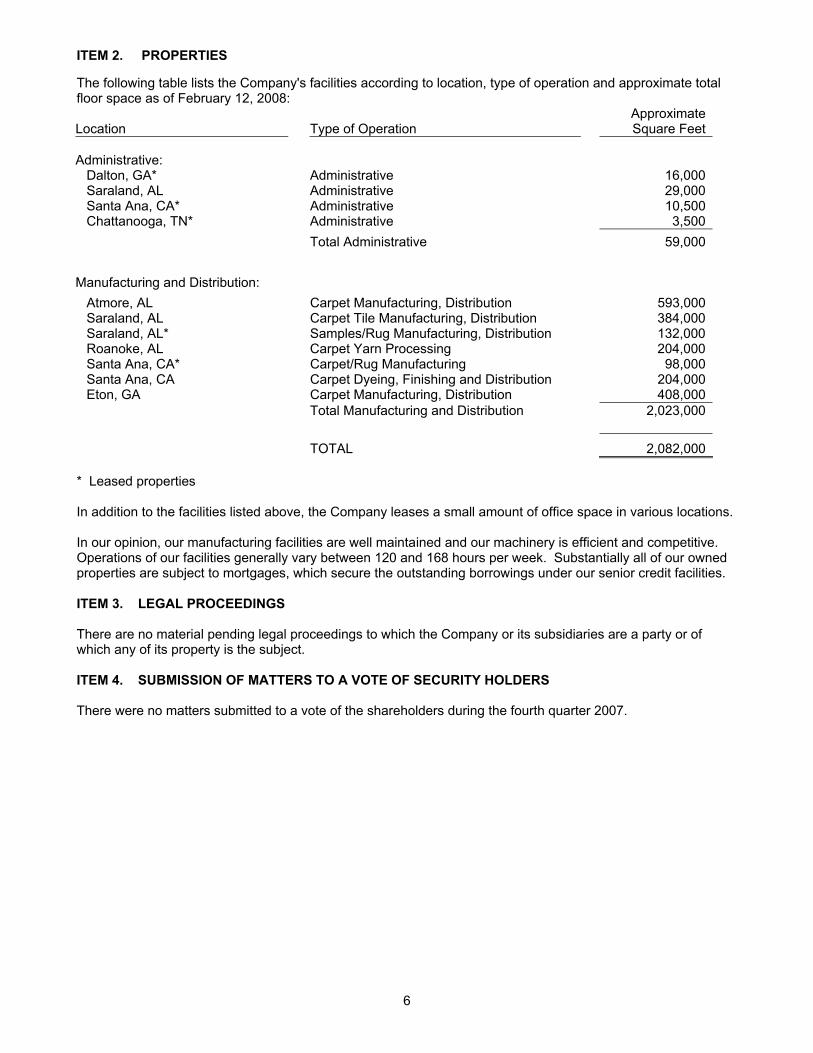
ITEM 2. PROPERTIES The following table lists the Company's facilities according to location, type of operation and approximate total floor space as of February 12, 2008:
Location
Type of Operation ApproximateSquare Feet
Administrative: Dalton, GA* Administrative 16,000 Saraland, AL Administrative 29,000 Santa Ana, CA* Administrative 10,500 Chattanooga, TN* Administrative 3,500 Total Administrative 59,000 Manufacturing and Distribution: Atmore, AL Carpet Manufacturing, Distribution 593,000 Saraland, AL Carpet Tile Manufacturing, Distribution 384,000 Saraland, AL* Samples/Rug Manufacturing, Distribution 132,000 Roanoke, AL Carpet Yarn Processing 204,000 Santa Ana, CA* Carpet/Rug Manufacturing 98,000 Santa Ana, CA Carpet Dyeing, Finishing and Distribution 204,000 Eton, GA Carpet Manufacturing, Distribution 408,000 Total Manufacturing and Distribution 2,023,000
TOTAL 2,082,000 * Leased properties In addition to the facilities listed above, the Company leases a small amount of office space in various locations. In our opinion, our manufacturing facilities are well maintained and our machinery is efficient and competitive. Operations of our facilities generally vary between 120 and 168 hours per week. Substantially all of our owned properties are subject to mortgages, which secure the outstanding borrowings under our senior credit facilities. ITEM 3. LEGAL PROCEEDINGS There are no material pending legal proceedings to which the Company or its subsidiaries are a party or of which any of its property is the subject. ITEM 4. SUBMISSION OF MATTERS TO A VOTE OF SECURITY HOLDERS There were no matters submitted to a vote of the shareholders during the fourth quarter 2007.
7
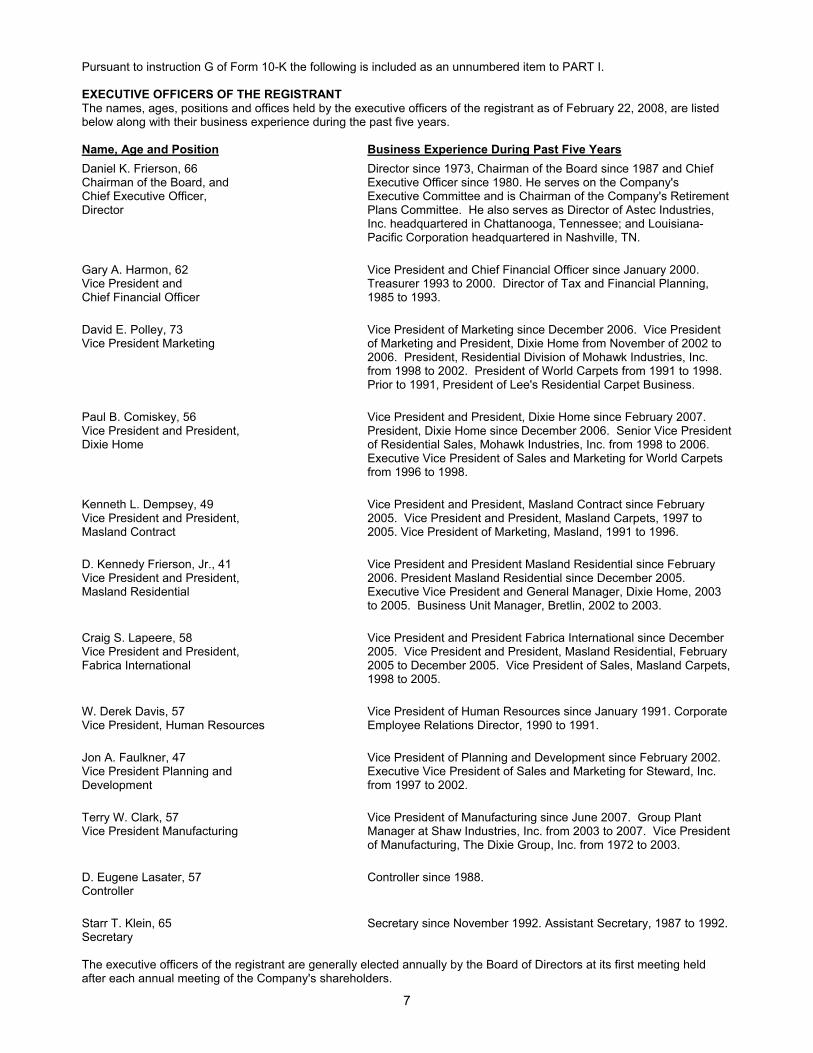
Pursuant to instruction G of Form 10-K the following is included as an unnumbered item to PART I. EXECUTIVE OFFICERS OF THE REGISTRANT The names, ages, positions and offices held by the executive officers of the registrant as of February 22, 2008, are listed below along with their business experience during the past five years. Name, Age and Position Business Experience During Past Five Years Daniel K. Frierson, 66 Chairman of the Board, and Chief Executive Officer, Director
Director since 1973, Chairman of the Board since 1987 and Chief Executive Officer since 1980. He serves on the Company's Executive Committee and is Chairman of the Company's Retirement Plans Committee. He also serves as Director of Astec Industries, Inc. headquartered in Chattanooga, Tennessee; and Louisiana-Pacific Corporation headquartered in Nashville, TN.
Gary A. Harmon, 62 Vice President and Chief Financial Officer
Vice President and Chief Financial Officer since January 2000. Treasurer 1993 to 2000. Director of Tax and Financial Planning, 1985 to 1993.
David E. Polley, 73 Vice President Marketing
Vice President of Marketing since December 2006. Vice President of Marketing and President, Dixie Home from November of 2002 to 2006. President, Residential Division of Mohawk Industries, Inc. from 1998 to 2002. President of World Carpets from 1991 to 1998. Prior to 1991, President of Lee's Residential Carpet Business.
Paul B. Comiskey, 56 Vice President and President, Dixie Home
Vice President and President, Dixie Home since February 2007. President, Dixie Home since December 2006. Senior Vice President of Residential Sales, Mohawk Industries, Inc. from 1998 to 2006. Executive Vice President of Sales and Marketing for World Carpets from 1996 to 1998.
Kenneth L. Dempsey, 49 Vice President and President, Masland Contract
Vice President and President, Masland Contract since February 2005. Vice President and President, Masland Carpets, 1997 to 2005. Vice President of Marketing, Masland, 1991 to 1996.
D. Kennedy Frierson, Jr., 41 Vice President and President, Masland Residential
Vice President and President Masland Residential since February 2006. President Masland Residential since December 2005. Executive Vice President and General Manager, Dixie Home, 2003 to 2005. Business Unit Manager, Bretlin, 2002 to 2003.
Craig S. Lapeere, 58 Vice President and President, Fabrica International
Vice President and President Fabrica International since December 2005. Vice President and President, Masland Residential, February 2005 to December 2005. Vice President of Sales, Masland Carpets, 1998 to 2005.
W. Derek Davis, 57 Vice President, Human Resources
Vice President of Human Resources since January 1991. Corporate Employee Relations Director, 1990 to 1991.
Jon A. Faulkner, 47 Vice President Planning and Development
Vice President of Planning and Development since February 2002. Executive Vice President of Sales and Marketing for Steward, Inc. from 1997 to 2002.
Terry W. Clark, 57 Vice President Manufacturing
Vice President of Manufacturing since June 2007. Group Plant Manager at Shaw Industries, Inc. from 2003 to 2007. Vice President of Manufacturing, The Dixie Group, Inc. from 1972 to 2003.
D. Eugene Lasater, 57 Controller
Controller since 1988.
Starr T. Klein, 65 Secretary
Secretary since November 1992. Assistant Secretary, 1987 to 1992.
The executive officers of the registrant are generally elected annually by the Board of Directors at its first meeting held after each annual meeting of the Company's shareholders.
8
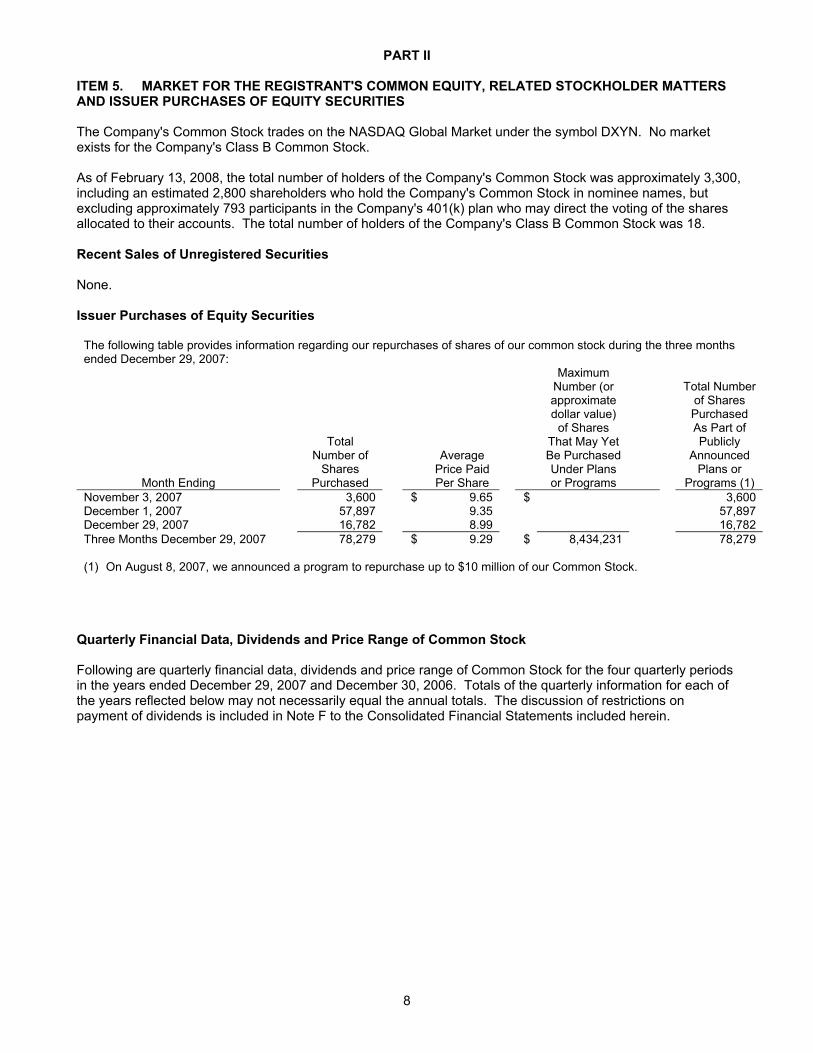
PART II ITEM 5. MARKET FOR THE REGISTRANT'S COMMON EQUITY, RELATED STOCKHOLDER MATTERS AND ISSUER PURCHASES OF EQUITY SECURITIES The Company's Common Stock trades on the NASDAQ Global Market under the symbol DXYN. No market exists for the Company's Class B Common Stock. As of February 13, 2008, the total number of holders of the Company's Common Stock was approximately 3,300, including an estimated 2,800 shareholders who hold the Company's Common Stock in nominee names, but excluding approximately 793 participants in the Company's 401(k) plan who may direct the voting of the shares allocated to their accounts. The total number of holders of the Company's Class B Common Stock was 18. Recent Sales of Unregistered Securities None. Issuer Purchases of Equity Securities
The following table provides information regarding our repurchases of shares of our common stock during the three months ended December 29, 2007:
Month Ending
Total Number of
Shares Purchased
Average Price PaidPer Share
Maximum Number (or approximate dollar value)
of Shares That May Yet Be Purchased Under Plans or Programs
Total Number of Shares Purchased As Part of Publicly
Announced Plans or
Programs (1) November 3, 2007 3,600 $ 9.65 $ 3,600 December 1, 2007 57,897 9.35 57,897 December 29, 2007 16,782 8.99 16,782 Three Months December 29, 2007 78,279 $ 9.29 $ 8,434,231 78,279 (1) On August 8, 2007, we announced a program to repurchase up to $10 million of our Common Stock.
Quarterly Financial Data, Dividends and Price Range of Common Stock Following are quarterly financial data, dividends and price range of Common Stock for the four quarterly periods in the years ended December 29, 2007 and December 30, 2006. Totals of the quarterly information for each of the years reflected below may not necessarily equal the annual totals. The discussion of restrictions on payment of dividends is included in Note F to the Consolidated Financial Statements included herein.
9
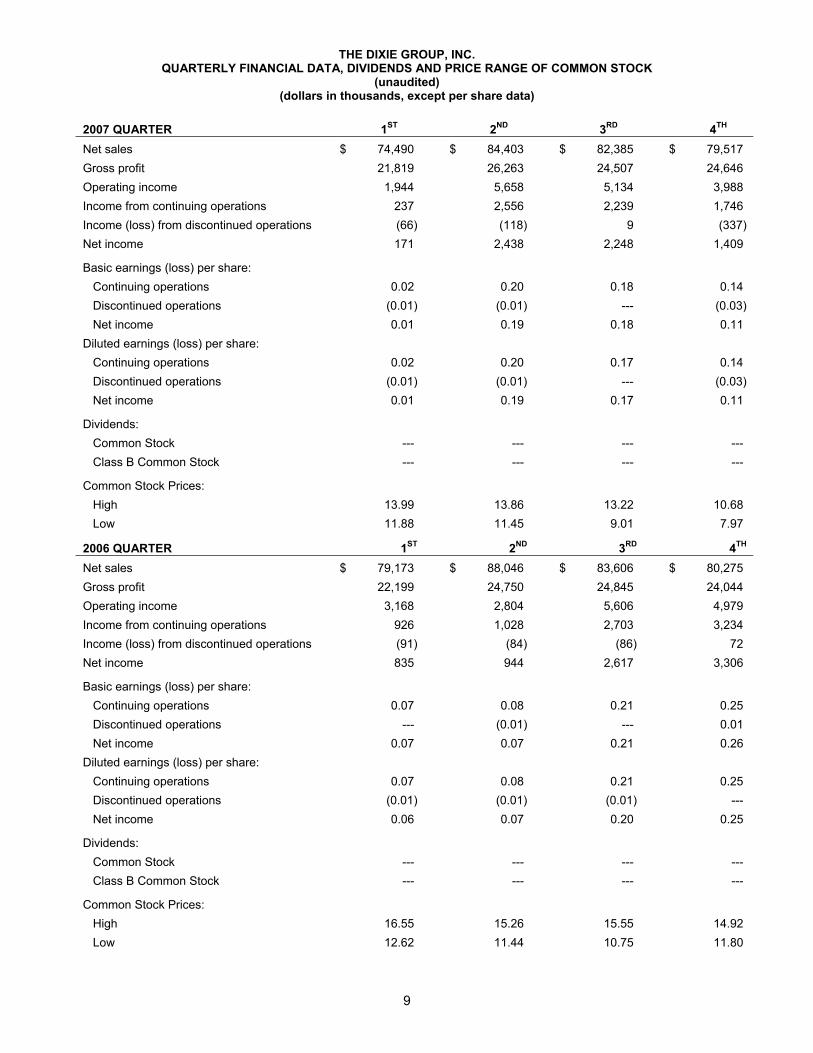
THE DIXIE GROUP, INC. QUARTERLY FINANCIAL DATA, DIVIDENDS AND PRICE RANGE OF COMMON STOCK
(unaudited) (dollars in thousands, except per share data)
2007 QUARTER 1ST 2ND 3RD 4TH Net sales $ 74,490 $ 84,403 $ 82,385 $ 79,517 Gross profit 21,819 26,263 24,507 24,646 Operating income 1,944 5,658 5,134 3,988 Income from continuing operations 237 2,556 2,239 1,746 Income (loss) from discontinued operations (66) (118) 9 (337) Net income 171 2,438 2,248 1,409
Basic earnings (loss) per share: Continuing operations 0.02 0.20 0.18 0.14 Discontinued operations (0.01) (0.01) --- (0.03) Net income 0.01 0.19 0.18 0.11 Diluted earnings (loss) per share: Continuing operations 0.02 0.20 0.17 0.14 Discontinued operations (0.01) (0.01) --- (0.03) Net income 0.01 0.19 0.17 0.11
Dividends: Common Stock --- --- --- --- Class B Common Stock --- --- --- ---
Common Stock Prices: High 13.99 13.86 13.22 10.68 Low 11.88 11.45 9.01 7.97
2006 QUARTER 1ST 2ND 3RD 4TH Net sales $ 79,173 $ 88,046 $ 83,606 $ 80,275 Gross profit 22,199 24,750 24,845 24,044 Operating income 3,168 2,804 5,606 4,979 Income from continuing operations 926 1,028 2,703 3,234 Income (loss) from discontinued operations (91) (84) (86) 72 Net income 835 944 2,617 3,306
Basic earnings (loss) per share: Continuing operations 0.07 0.08 0.21 0.25 Discontinued operations --- (0.01) --- 0.01 Net income 0.07 0.07 0.21 0.26 Diluted earnings (loss) per share: Continuing operations 0.07 0.08 0.21 0.25 Discontinued operations (0.01) (0.01) (0.01) --- Net income 0.06 0.07 0.20 0.25
Dividends: Common Stock --- --- --- --- Class B Common Stock --- --- --- ---
Common Stock Prices: High 16.55 15.26 15.55 14.92 Low 12.62 11.44 10.75 11.80
10
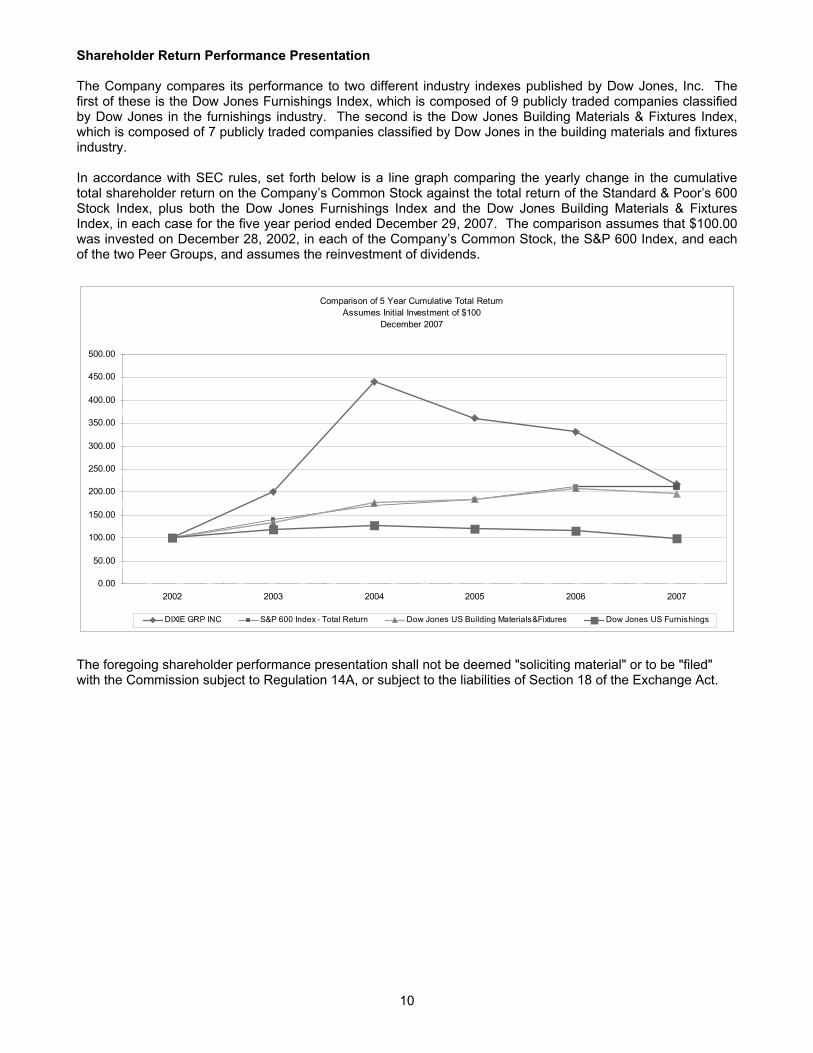
Shareholder Return Performance Presentation The Company compares its performance to two different industry indexes published by Dow Jones, Inc. The first of these is the Dow Jones Furnishings Index, which is composed of 9 publicly traded companies classified by Dow Jones in the furnishings industry. The second is the Dow Jones Building Materials & Fixtures Index, which is composed of 7 publicly traded companies classified by Dow Jones in the building materials and fixtures industry. In accordance with SEC rules, set forth below is a line graph comparing the yearly change in the cumulative total shareholder return on the Company’s Common Stock against the total return of the Standard & Poor’s 600 Stock Index, plus both the Dow Jones Furnishings Index and the Dow Jones Building Materials & Fixtures Index, in each case for the five year period ended December 29, 2007. The comparison assumes that $100.00 was invested on December 28, 2002, in each of the Company’s Common Stock, the S&P 600 Index, and each of the two Peer Groups, and assumes the reinvestment of dividends.
Comparison of 5 Year Cumulative Total ReturnAssumes Initial Investment of $100
December 2007
0.00
50.00
100.00
150.00
200.00
250.00
300.00
350.00
400.00
450.00
500.00
2002 2003 2004 2005 2006 2007
DIXIE GRP INC S&P 600 Index - Total Return Dow Jones US Building Materials&Fixtures Dow Jones US Furnishings
The foregoing shareholder performance presentation shall not be deemed "soliciting material" or to be "filed" with the Commission subject to Regulation 14A, or subject to the liabilities of Section 18 of the Exchange Act.
11
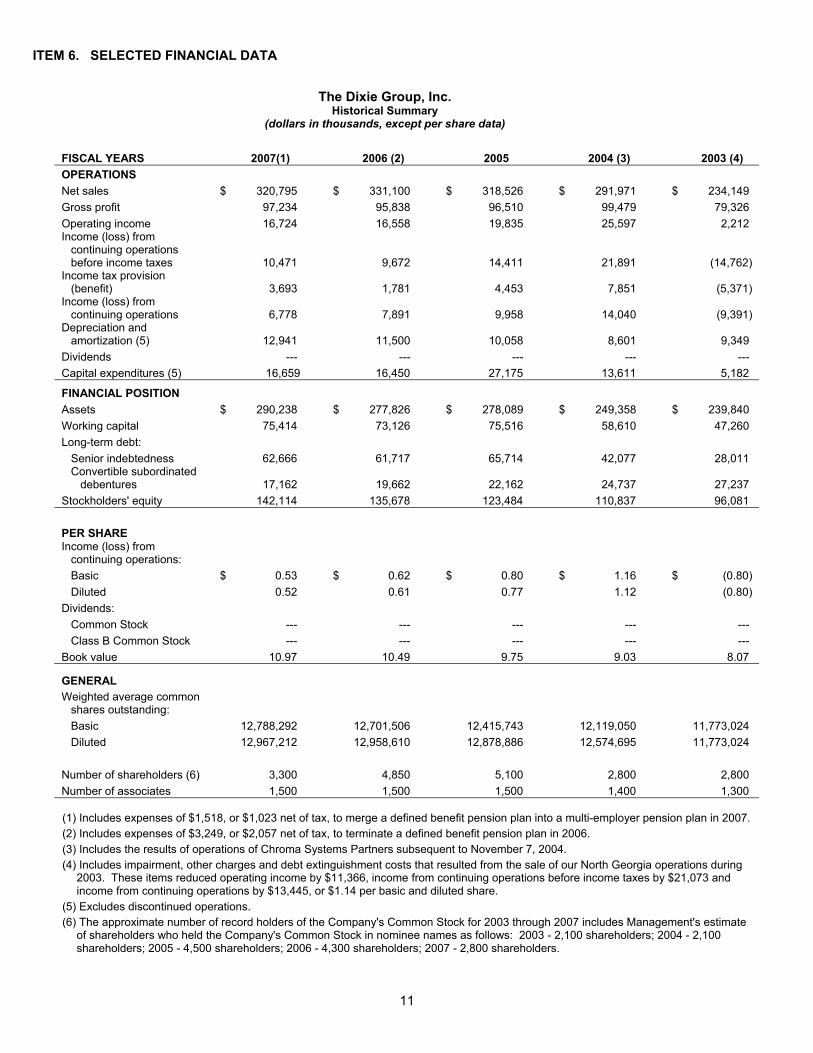
ITEM 6. SELECTED FINANCIAL DATA
The Dixie Group, Inc. Historical Summary
(dollars in thousands, except per share data)
FISCAL YEARS 2007(1) 2006 (2) 2005 2004 (3) 2003 (4) OPERATIONS Net sales $ 320,795 $ 331,100 $ 318,526 $ 291,971 $ 234,149 Gross profit 97,234 95,838 96,510 99,479 79,326 Operating income 16,724 16,558 19,835 25,597 2,212 Income (loss) from continuing operations before income taxes 10,471 9,672 14,411 21,891 (14,762) Income tax provision (benefit) 3,693 1,781 4,453 7,851 (5,371) Income (loss) from continuing operations 6,778 7,891 9,958 14,040 (9,391) Depreciation and amortization (5) 12,941 11,500 10,058 8,601 9,349 Dividends --- --- --- --- --- Capital expenditures (5) 16,659 16,450 27,175 13,611 5,182
FINANCIAL POSITION Assets $ 290,238 $ 277,826 $ 278,089 $ 249,358 $ 239,840 Working capital 75,414 73,126 75,516 58,610 47,260 Long-term debt: Senior indebtedness 62,666 61,717 65,714 42,077 28,011 Convertible subordinated debentures 17,162 19,662 22,162 24,737 27,237 Stockholders' equity 142,114 135,678 123,484 110,837 96,081 PER SHARE Income (loss) from continuing operations: Basic $ 0.53 $ 0.62 $ 0.80 $ 1.16 $ (0.80) Diluted 0.52 0.61 0.77 1.12 (0.80) Dividends: Common Stock --- --- --- --- --- Class B Common Stock --- --- --- --- --- Book value 10.97 10.49 9.75 9.03 8.07
GENERAL Weighted average common shares outstanding: Basic 12,788,292 12,701,506 12,415,743 12,119,050 11,773,024 Diluted 12,967,212 12,958,610 12,878,886 12,574,695 11,773,024 Number of shareholders (6) 3,300 4,850 5,100 2,800 2,800 Number of associates 1,500 1,500 1,500 1,400 1,300 (1) Includes expenses of $1,518, or $1,023 net of tax, to merge a defined benefit pension plan into a multi-employer pension plan in 2007. (2) Includes expenses of $3,249, or $2,057 net of tax, to terminate a defined benefit pension plan in 2006. (3) Includes the results of operations of Chroma Systems Partners subsequent to November 7, 2004. (4) Includes impairment, other charges and debt extinguishment costs that resulted from the sale of our North Georgia operations during
2003. These items reduced operating income by $11,366, income from continuing operations before income taxes by $21,073 and income from continuing operations by $13,445, or $1.14 per basic and diluted share.
(5) Excludes discontinued operations. (6) The approximate number of record holders of the Company's Common Stock for 2003 through 2007 includes Management's estimate
of shareholders who held the Company's Common Stock in nominee names as follows: 2003 - 2,100 shareholders; 2004 - 2,100 shareholders; 2005 - 4,500 shareholders; 2006 - 4,300 shareholders; 2007 - 2,800 shareholders.
12
ITEM 7. MANAGEMENT'S DISCUSSION AND ANALYSIS OF RESULTS OF OPERATIONS AND FINANCIAL CONDITION The following discussion and analysis should be read in conjunction with our consolidated financial statements and related notes appearing elsewhere in this report. OVERVIEW Our business is concentrated in areas of the soft floorcovering market where innovative styling, design, color, quality and service as well as selected distribution are welcomed and rewarded. Through our Fabrica, Masland Residential, Masland Contract and Dixie Home brands, we have a significant presence in the high-end of the soft floorcovering market. A small portion of our manufacturing capacity is used to process plied and heat-set filament yarns and provides carpet dyeing and finishing services for other carpet manufacturers. Over the last two years, tightening credit conditions, higher energy costs and other factors have considerably reduced the levels of new residential housing construction and sales of existing homes. The housing and credit markets issues have negatively impacted the carpet industry, where sales have fallen significantly in both units and dollars over the last two years and the industry's sales volume is now running well below its high point in 2005. We have not seen signs of near-term improvement in the industry’s markets. Despite the market weakness, our carpet business has continued growing. Our total carpet sales grew 1.7% during the two years ended December 29, 2007, with carpet sales up 4.7% in fiscal 2006 and down 2.8% in fiscal 2007. Over the last five years, our carpet sales have grown at a compounded annual growth rate of 9.2%, significantly faster than the industry’s compounded annual rate of growth, which was 2.1% during this same period. We believe our focus on high-end residential and commercial markets and our dedication to the development and marketing of new and differentiated products has contributed to our growth and will allow us to continue to grow at a rate that is faster than the industry. CRITICAL ACCOUNTING POLICIES Certain estimates and assumptions are made when preparing our financial statements. These estimates and assumptions affect various matters, including:
• Amounts reported for assets and liabilities in our Consolidated Balance Sheets at the dates of the financial statements, and
• Amounts reported for revenues and expenses in our Consolidated Statements of Operations during the
reporting periods presented. Estimates involve judgments with respect to, among other things, future economic factors that are difficult to predict. As a result, actual amounts could differ from estimates made when our financial statements are prepared. The Securities and Exchange Commission requires management to identify its most critical accounting policies, defined as those that are both most important to the portrayal of our financial condition and operating results and the application of which requires our most difficult, subjective, and complex judgments. Although our estimates have not differed materially from our experience, such estimates pertain to inherently uncertain matters that could result in material differences in subsequent periods. We believe application of the following accounting policies require significant judgments and estimates and represent our critical accounting policies. Other significant accounting policies are discussed in Note A to our Consolidated Financial Statements.
• Revenue recognition. Revenues, including shipping and handling amounts, are recognized when the following criteria are met: there is persuasive evidence that a sales agreement exists, delivery has occurred or services have been rendered, the price to the buyer is fixed or determinable, and collection is reasonably assured. Delivery is not considered to have occurred until the customer takes title to products shipped and assumes the risks and rewards of ownership, which is generally on the date of shipment. At the time revenue is recognized, we record a provision for the estimated amount of future returns based primarily on historical experience and any known trends or conditions.
13
• Accounts receivable. We provide allowances for expected cash discounts, returns, claims and
doubtful accounts based upon historical experience and periodic evaluations of the financial condition of our customers. If the financial conditions of our customers were to significantly deteriorate, or other factors impair their ability to pay their debts, credit losses could differ from allowances recorded in our Consolidated Financial Statements.
• Customer claims and product warranties. We provide product warranties related to manufacturing
defects and specific performance standards for our products. We record reserves for the estimated costs of defective products and failure to meet applicable performance standards. The levels of reserves are established based primarily upon historical experience and our evaluation of pending claims. Because our evaluations are based on historical experience and conditions at the time our financial statements are prepared, actual results could differ from the reserves in our Consolidated Financial Statements.
• Inventories. Inventories are stated at the lower of cost or market. Cost is determined using the last-in,
first-out method (LIFO), which generally matches current costs of inventory sold with current revenues, for substantially all inventories. Reserves are also established to adjust inventories that are off-quality, aged or obsolete to their estimated net realizable value. Additionally, rates of recoverability per unit of off-quality, obsolete or excessive inventory are estimated based on historical rates of recoverability and other known conditions or circumstances that may affect future recoverability. Actual results could differ from assumptions used to value our inventory.
• Goodwill. Goodwill is subject to annual impairment testing. This test is based on the fair value of the
underlying assets and businesses to which the goodwill applies based on estimates of future cash flows, which require judgments and assumptions about future economic factors that are difficult to predict. Changes in our judgments and assumptions about future economic factors could materially change our estimate of values and could materially impact the value of goodwill and our Consolidated Financial Statements.
• Self-insured accruals. We estimate costs required to settle claims related to our self-insured medical,
dental and workers' compensation plans. These estimates include costs to settle known claims, as well as incurred and unreported claims. The estimated costs of known and unreported claims are based on historical experience. Actual results could differ from assumptions used to estimate these accruals.
• Deferred income tax assets and liabilities. We recognize deferred income tax assets and liabilities
for the future tax consequences of the differences between the financial statement carrying amounts of assets and liabilities and their respective tax bases. Deferred income tax assets and liabilities are measured using statutory income tax rates that are expected to be applicable in future periods when temporary differences are expected to be recovered or paid. The effect on deferred income tax assets and liabilities of changes in income tax rates is recognized in earnings in the period that a change in income tax rates is enacted. Taxing jurisdictions could disagree with our tax treatment of various items in a manner that could affect the tax treatment of such items in the future. Accounting rules require these future effects to be evaluated using existing laws, rules and regulations, each of which is subject to change.
SHARE-BASED COMPENSATION We adopted Statement of Financial Accounting Standards No. 123(R), "Share-Based Payments" effective January 1, 2006. Prior to January 1, 2006, we accounted for share-based payments using Accounting Principles Board (APB) Opinion No. 25, "Accounting for Stock Issued to Employees" ("APB No. 25"), as permitted by SFAS No. 123, and accordingly, did not record compensation expense for stock options since our options are issued at market value on the grant date. We did not modify existing stock-based awards prior to adoption of the new accounting standard and used the modified prospective method to account for compensation expense for share-based payments for periods after the date of adoption for (a) all unvested stock-based awards granted prior to January 1, 2006, based on the awards' estimated grant-date fair value in accordance with previous guidance, and (b) all stock-based awards granted after December 31, 2005, based on the awards' estimated grant-date fair value in accordance with the new provisions. All stock-based awards granted prior to adoption of the new standard, and some of the awards
14
granted after the adoption of the new standard, were not subject to a market condition. Accordingly, we used the Black-Scholes option-pricing model to determine the grant-date fair value of awards that are not subject to a market condition, both prior to and after adoption of the new statement. The grant-date fair value of awards that are subject to a market condition were determined using a binomial model. Because the modified prospective method was used to adopt the new standard and we used the estimated forfeiture method under SFAS No. 123 prior to the adoption of SFAS No. 123(R), there was no cumulative effect on our Consolidated Financial Statements as a result of the adoption of SFAS 123(R). At December 29, 2007, the weighted average vesting period for unvested stock options and restricted stock awards was four and one half years. On February 28, 2008 restricted stock, with a grant-date fair value of approximately $1.6 million was granted under our 2006 stock incentive plan. These restricted stock awards are expected to vest over the next 2 years to 19 years. RESULTS OF OPERATIONS Our discussion and analysis of financial condition and results of operations is based on our Consolidated Financial Statements that were prepared in accordance with U. S. generally accepted accounting principles. The following table sets forth certain elements of our continuing operations as a percentage of net sales for the periods indicated: Fiscal Year Ended
December 29,
2007 December 30,
2006 December 30,
2005 Net sales 100.0 % 100.0 % 100.0 %Cost of sales 69.7 % 71.1 % 69.7 %Gross profit 30.3 % 28.9 % 30.3 %Selling and administrative expenses 24.5 % 22.9 % 24.1 %Other operating income (0.1)% (0.2)% (0.2)%Other operating expense 0.2 % 0.2 % 0.2 %Defined benefit pension plan merger/termination expenses 0.5 % 1.0 % 0.0 %Operating income 5.2 % 5.0 % 6.2 % Fiscal Year Ended December 29, 2007 Compared with Fiscal Year Ended December 30, 2006 Net Sales. Net sales for the year ended December 29, 2007 decreased 3.1% to $320.8 million. Continued weakness in residential carpet markets had a negative impact on the sales of the industry and our business. Nevertheless, our sales continued to significantly outpace the sales of the industry, which reported that total carpet sales declined 8.0%, with residential carpet sales down 13.1% and commercial carpet sales improving 1.6%, compared with the prior year. Our 2007 year-over-year carpet sales comparison reflected a 2.8% decline in total carpet sales, with net sales of residential carpet down 9.1% and net sales of commercial carpet growing 10.5%. In addition to difficult conditions in the industry, over 95% of the decline in our total carpet sales was a result of lower sales of residential carpet to one large home center customer. Revenue from carpet yarn processing and carpet dyeing and finishing services decreased 8.2% in 2007, compared with 2006. Cost of Sales. The 1.4 percentage point decrease in cost of sales as a percentage of sales in 2007, compared with 2006 was principally attributable to higher selling prices, improved product mix and operational performance. The year-over-year comparison was also affected by LIFO inventory liquidations that reduced cost of sales by $297 thousand in 2006. Gross Profit. Despite lower net sales and higher raw material and other costs, gross profit improved $1.4 million in 2007, compared with 2006. The improved results of our modular/carpet tile operation and the items described above that decreased cost of sales as a percentage of sales, more than offset the effect of lower sales volume. Selling and Administrative Expenses. Selling and administrative expenses increased $2.9 million in 2007, compared with 2006. The higher level of these expenses is principally attributable to investments in our sales and marketing infrastructure, information systems and inflationary cost increases. As a percentage of net sales, these expenses also increased due to lower net sales volume.
15
Other Operating Income. Other operating income decreased $171 thousand in 2007 primarily due to insurance settlements and refunds in 2006 that did not repeat in 2007 which more than offset higher levels of miscellaneous income in 2007. Other Operating Expense. Other operating expense decreased $60 thousand in 2007, compared with 2006 due to lower asset retirement and impairment losses and higher levels of miscellaneous expense. Defined Benefit Pension Plan Merger/Termination Expenses. In 2007, $1.5 million of expenses were incurred to merge our one remaining defined benefit pension plan into a multi-employer plan. These expenses principally consisted of non-cash, previously unrecognized actuarial losses. In 2006, $3.2 million of expenses were incurred to terminate our legacy defined benefit pension plan. Approximately $2.9 million of these 2006 expenses related to the settlement of pension benefits for employees of our discontinued textile business segment and the remaining expenses related to the settlement of pension benefits for employees of our ongoing floorcovering business segment. Operating Income. Operating income was $16.7 million, or 5.2% of sales in 2007, compared with $16.6 million, or 5.0% of sales in 2006. Interest Expense. Interest expense decreased $866 thousand in 2007 due to lower levels of debt, lower interest rates and higher levels of capitalized interest. Other Income. Other income decreased $291 thousand in 2007 principally as a result of a dispute settled in 2006 that did not repeat in 2007. Other Expense. Other expense was not significant in 2007 or 2006. Income Tax Provision. Our effective income tax rate was 35.3% in 2007, compared with 18.4% in 2006. The change in the effective tax rates is principally due to reductions in our tax contingency reserve in 2006 as a result of the resolution of federal and state tax examinations and expirations of tax statutes of limitations. We also were able to utilize more state and federal income tax credits in 2006. Net Income. Income from continuing operations was $6.8 million, or $0.52 per diluted share in 2007, compared with $7.9 million, or $0.61 per diluted share in 2006. Our discontinued operations reflected a loss of $512 thousand, or $0.04 per diluted share, in 2007, compared with a loss of $188 thousand, or $0.02 per diluted share, in 2006. Including discontinued operations, net income was $6.3 million, or $0.48 per diluted share in 2007, compared with $7.7 million, or $0.59 per diluted share, in 2006. Fiscal Year Ended December 30, 2006 (52 weeks), Compared with Fiscal Year Ended December 31, 2005 (53 weeks) Net Sales. Net sales for the year ended December 30, 2006 increased 3.9% to $331.1 million. Net sales of our carpet products increased 4.7% and net sales related to our carpet yarn and carpet dyeing and finishing services decreased 7.4%. Compared with 2005, net sales of residential carpet increased 4.1% and net sales of commercial carpet increased 5.9%. Our 2006 net sales were negatively affected by significant weakness in the carpet industry, particularly during the last half of the year and one less operating week in 2006, compared with 2005. Adjusting for the extra operating week in 2005, our net sales of carpet products rose 6.7% in dollars and 7.9% in units in 2006, compared to the previous year. Our carpet sales continued to outpace the carpet industry, where 2006 sales of carpet declined 0.6% in dollars and 6.5% in units, compared with the prior year. We believe the improvement in our net sales is principally attributable to our focus on high-end markets and our continuing development of new and differentiated products. Our carpet yarn processing and carpet dyeing and finishing services are not significant to our core business and their decrease had less than a 0.5% effect on our total net sales. Cost of Sales. The increase in cost of sales as a percentage of sales in 2006, compared with 2005, was principally attributable to costs related to start-up of new tufting and modular/carpet tile operations and higher levels of off-quality production during the first half of the year. A significant portion of the quality issues were related to outsourcing of tufting production prior to June when our new tufting facility began operating on a full schedule. The year-over-year comparison was also affected by LIFO inventory liquidations that reduced cost of sales by $297 thousand in 2006 and $389 thousand in 2005.
16
Gross Profit. The 1.4 percentage point decline in gross profit as a percent of sales was attributable to the cost increases described above. Selling and Administrative Expenses. Selling and administrative expenses decreased $864 thousand in 2006, compared with 2005, due to tight control of discretionary spending. The decrease of these expenses as a percentage of net sales to 22.9% in 2006, compared with 24.1% in 2005, reflects the lower levels of spending and higher net sales in 2006. Other Operating Income. Other operating income increased $78 thousand in 2006 due to insurance settlements and refunds that more than offset lower gains from the sale of operating assets. Other Operating Expense. Other operating expense increased $298 thousand in 2006 primarily as a result of losses recognized from the impairment of certain operating assets. Defined Benefit Pension Plan Termination Expenses. Expenses to terminate our legacy defined benefit pension plan were $3.2 million in 2006. Approximately $2.9 million of these expenses related to the settlement of pension benefits for employees of our discontinued textile business segment. These employees were terminated in 1999 and prior years. The remaining expenses related to the settlement of pension benefits for employees of our ongoing floorcovering business segment. Operating Income. Operating income was $16.6 million, or 5.0% of sales in 2006, compared with $19.8 million, or 6.2% of sales in 2005. Interest Expense. Interest expense increased $1.3 million in 2006 primarily as a result of higher levels of debt. Other Income. Other income decreased $157 thousand in 2006 principally as a result of a gain on the sale of real estate in 2005 that did not repeat in 2006. Other Expense. Other expense was not significant in 2006 or 2005. Income Tax Provision. Our effective income tax rate was 18.4% in 2006, compared with 30.9% in 2005. The change in the effective tax rates is principally due to reductions in our tax contingency reserve due to the resolution of federal and state income tax examinations and expirations of tax statutes of limitations. We also were able to utilize more state and federal income tax credits in 2006. Net Income. Income from continuing operations was $7.9 million, or $0.61 per diluted share in 2006, compared with $10.0 million, or $0.77 per diluted share in 2005. Our discontinued operations reflected a loss of $188 thousand, or $0.02 per diluted share in 2006, compared to income of $178 thousand, or $0.02 per diluted share, in 2005. Including discontinued operations, net income was $7.7 million, or $0.59 per diluted share in 2006, compared with $10.1 million, or $0.79 per diluted share, in 2005. LIQUIDITY AND CAPITAL RESOURCES During the year ended December 29, 2007, cash generated from operating activities was $19.8 million. These funds were supplemented by $6.0 million of borrowings to finance equipment purchases and $381 thousand of funds from the exercise of employee stock options. These funds were used to support our operations, purchase $16.7 million of property, plant and equipment, retire $6.4 million of debt, purchase $1.6 million of our Common Stock and reduce outstanding checks in excess of cash by $1.7 million. Working capital increased $2.3 million in 2007 principally due to higher levels of inventories and accounts receivable in excess of the increase in the levels of accounts payable and accrued expenses. Accounts receivable increased $1.8 million, inventories increased $6.3 million and accounts payable and accrued expenses increased $4.7 million. The increase in inventory is primarily due to higher levels of raw material. During the year ended December 30, 2006, cash generated from operating activities was $19.4 million. These funds were supplemented by $6.5 million of borrowings to finance equipment purchases, $1.1 million of funds received from the exercise of employee stock options and a $2.3 million increase in outstanding checks in excess of cash. These funds were used to finance $16.5 million of purchases of property, plant and equipment, retire $12.2 million of debt and increase cash and cash equivalents by $538 thousand. Working capital decreased $2.4 million in 2006 principally as a result of lower levels of accounts receivable, inventories and income tax refunds receivable which more than offset lower levels of accounts payable and accrued expenses.
17
Accounts receivable decreased by $2.4 million, inventory decreased by $3.3 million and accounts payable and accrued expenses decreased by $6.2 million, due to softness in our business in the fourth quarter of the year. Other current assets decreased due principally to lower levels of income tax refunds receivable. During the year ended December 31, 2005, cash generated from operating activities was $5.0 million and $873 thousand of funds were generated from an increase in outstanding checks in excess of cash. These funds were supplemented by $18.3 million of net borrowing under our credit facilities, $2.0 million from the exercise of employee stock options and $1.0 million from the sale of property plant and equipment. These funds financed $27.2 million of property, plant and equipment purchases. Working capital increased $16.9 million principally due to higher levels of inventory to support sales growth and to better serve our customers. In December 2007, we merged our only remaining defined benefit pension plan into a multi-employer pension plan. As a result of the merger, we ceased to be a plan sponsor and will become a contributing employer in the multi-employer pension plan. In connection with the merger, we contributed $205 thousand in early January 2008 to complete our funding obligations for the defined benefit pension plan. In June 2006, we terminated a legacy defined benefit pension plan and distributed the plan's assets to participants. Approximately $2.6 million of cash was used to fully fund that pension plan in order to complete the plan's termination and asset distribution. Capital expenditures were $16.7 million in 2007, $16.5 million in 2006 and $27.2 million in 2005, while depreciation and amortization were $12.9 million in 2007, $11.5 million in 2006 and $10.1 million in 2005. Capital expenditures in 2007 and 2006 were primarily for new manufacturing technology and investments in information systems. The capital expenditures in 2005 included a new distribution center and tufting facility, equipment to produce modular/carpet tile and investments in new manufacturing technology. We expect capital expenditures in the $12.0 million to $14.0 million range in 2008, while depreciation and amortization is expected to be approximately $13.9 million. Capital expenditures in 2008 will be primarily for newer manufacturing technology and, to a lesser extent, information systems. In 2007, we amended our senior loan and security agreement to (1) increase the limit on revolver loans from $60.0 million to $70.0 million, (2) increase our flexibility to repurchase Common Stock or pay dividends, and (3) increase the level of "permitted purchase money debt" as defined in the loan agreement from $10.0 million to $20.0 million. The senior loan and security agreement matures on May 11, 2010 and at December 29, 2007 provided the Company with $86.0 million of credit, consisting of $70.0 million of revolving credit and a $16.0 million term loan. The term loan is payable in monthly principal installments of $142 thousand and is due May 11, 2010. Interest rates available under the senior loan and security agreement may be selected from a number of options that effectively allow us to borrow at rates ranging from the lender's prime rate to the lender's prime rate plus 0.50% for base rate loans, or at rates ranging from LIBOR plus 1.00% to LIBOR plus 2.75% for LIBOR loans. The weighted-average interest rate on borrowings outstanding under this agreement was 6.68% at December 29, 2007 and 6.99% at December 30, 2006. Commitment fees ranging from 0.25% to 0.375% per annum are payable on the average daily unused balance of the revolving credit facility. The interest rate on a portion of the borrowings under the senior loan and security agreement is fixed by an interest rate swap arrangement that effectively sets the interest rate on $30.0 million of borrowings under the senior loan and security agreement at 4.79% plus applicable credit spreads. The levels of our accounts receivable and inventory limit borrowing availability under the revolving credit facility. The facility is secured by a first priority lien on substantially all of our assets. Our credit facilities do not contain ongoing financial covenants and permit payment of dividends and repurchases of our Common Stock in an aggregate annual amount of up to $3.0 million and distributions in excess in $3.0 million under conditions specified in the agreement. The agreement also contains provisions that may permit the payment of up to an additional $10.0 million of dividends or repurchases of Common Stock prior to December 31, 2008. The agreement also contains covenants that could limit future acquisitions. The unused borrowing capacity under the senior loan and security agreement on December 29, 2007 was approximately $27.7 million. Our equipment financing notes have terms ranging from five to seven years, are secured by the specific equipment financed, bear interest ranging from 5.55% to 6.94% and are due in monthly installments of principal and interest of $311 thousand through February 2010 and monthly installments of principal and interest ranging from $263 thousand to $38 thousand from March 2010 through May 2014. The notes do not contain financial covenants.
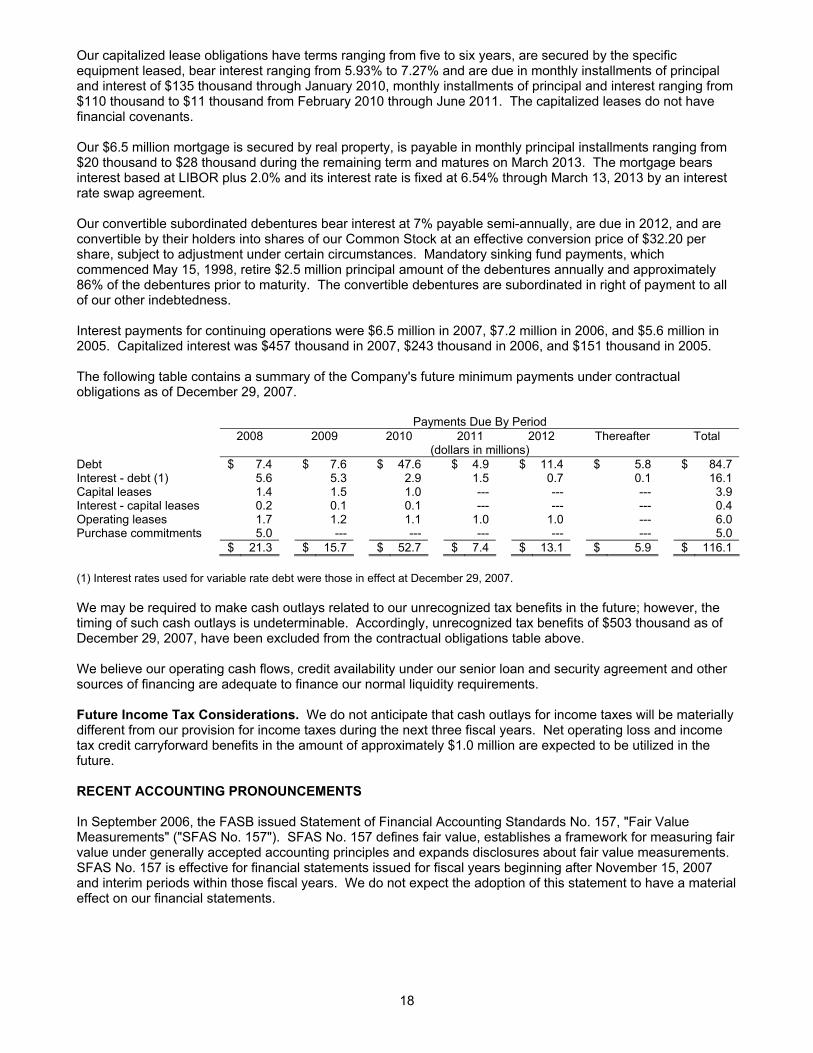
18
Our capitalized lease obligations have terms ranging from five to six years, are secured by the specific equipment leased, bear interest ranging from 5.93% to 7.27% and are due in monthly installments of principal and interest of $135 thousand through January 2010, monthly installments of principal and interest ranging from $110 thousand to $11 thousand from February 2010 through June 2011. The capitalized leases do not have financial covenants. Our $6.5 million mortgage is secured by real property, is payable in monthly principal installments ranging from $20 thousand to $28 thousand during the remaining term and matures on March 2013. The mortgage bears interest based at LIBOR plus 2.0% and its interest rate is fixed at 6.54% through March 13, 2013 by an interest rate swap agreement. Our convertible subordinated debentures bear interest at 7% payable semi-annually, are due in 2012, and are convertible by their holders into shares of our Common Stock at an effective conversion price of $32.20 per share, subject to adjustment under certain circumstances. Mandatory sinking fund payments, which commenced May 15, 1998, retire $2.5 million principal amount of the debentures annually and approximately 86% of the debentures prior to maturity. The convertible debentures are subordinated in right of payment to all of our other indebtedness. Interest payments for continuing operations were $6.5 million in 2007, $7.2 million in 2006, and $5.6 million in 2005. Capitalized interest was $457 thousand in 2007, $243 thousand in 2006, and $151 thousand in 2005. The following table contains a summary of the Company's future minimum payments under contractual obligations as of December 29, 2007. Payments Due By Period 2008 2009 2010 2011 2012 Thereafter Total (dollars in millions) Debt $ 7.4 $ 7.6 $ 47.6 $ 4.9 $ 11.4 $ 5.8 $ 84.7 Interest - debt (1) 5.6 5.3 2.9 1.5 0.7 0.1 16.1 Capital leases 1.4 1.5 1.0 --- --- --- 3.9 Interest - capital leases 0.2 0.1 0.1 --- --- --- 0.4 Operating leases 1.7 1.2 1.1 1.0 1.0 --- 6.0 Purchase commitments 5.0 --- --- --- --- --- 5.0 $ 21.3 $ 15.7 $ 52.7 $ 7.4 $ 13.1 $ 5.9 $ 116.1 (1) Interest rates used for variable rate debt were those in effect at December 29, 2007. We may be required to make cash outlays related to our unrecognized tax benefits in the future; however, the timing of such cash outlays is undeterminable. Accordingly, unrecognized tax benefits of $503 thousand as of December 29, 2007, have been excluded from the contractual obligations table above. We believe our operating cash flows, credit availability under our senior loan and security agreement and other sources of financing are adequate to finance our normal liquidity requirements. Future Income Tax Considerations. We do not anticipate that cash outlays for income taxes will be materially different from our provision for income taxes during the next three fiscal years. Net operating loss and income tax credit carryforward benefits in the amount of approximately $1.0 million are expected to be utilized in the future. RECENT ACCOUNTING PRONOUNCEMENTS In September 2006, the FASB issued Statement of Financial Accounting Standards No. 157, "Fair Value Measurements" ("SFAS No. 157"). SFAS No. 157 defines fair value, establishes a framework for measuring fair value under generally accepted accounting principles and expands disclosures about fair value measurements. SFAS No. 157 is effective for financial statements issued for fiscal years beginning after November 15, 2007 and interim periods within those fiscal years. We do not expect the adoption of this statement to have a material effect on our financial statements.
19
In February 2007, the FASB issued SFAS No. 159, "The Fair Value Option for Financial Assets and Financial Liabilities", including an amendment of SFAS No. 115, "Accounting for Certain Investments in Debt and Equity Securities" (“SFAS No. 159”). SFAS No. 159 permits entities to choose to measure many financial instruments and certain other items at fair value. The objective of SFAS No. 159 is to improve financial reporting by providing entities with the opportunity to mitigate the volatility in reported earnings caused by measuring related assets and liabilities differently without having to apply complex hedge accounting provisions to such assets and liabilities. Eligible items for the measurement option include all recognized financial assets and liabilities except: investments in subsidiaries, interests in variable interest entities, obligations for pension benefits, assets and liabilities recognized under leases, deposit liabilities, and financial instruments that are a component of shareholder’s equity. Also included are firm commitments that involve only financial instruments, nonfinancial insurance contracts and warranties and host financial instruments. The statement permits all entities to choose the fair value measurement option at specified election dates, after which the entity must report unrealized gains and losses on items for which the fair value option has been elected in earnings, at each subsequent reporting date. The fair value option may be applied instrument by instrument; however, the election is irrevocable and may be applied only to entire instruments and not to portions of instruments. SFAS No. 159 is effective for fiscal years beginning after November 15, 2007. We do not expect this statement to have a material effect on our financial position or results of operations. In December 2007, the FASB issued SFAS No. 141R, "Business Combinations" ("SFAS No. 141R"). SFAS No. 141R replaces SFAS No. 141 and establishes principles and requirements for how identifiable assets, liabilities assumed, any non-controlling interest in acquiree and goodwill is recognized and measured in an acquirer’s financial statements. SFAS No. 141R also establishes disclosure requirements to assist users in evaluating the nature and financial effects of business combinations. This standard is effective for fiscal years beginning after December 15, 2008. We do not expect the adoption of this statement to have a material effect on our financial statements. In December 2007, the FASB issued SFAS No. 160, "Noncontrolling Interests in Consolidated Financial Statements" ("SFAS No. 160"). SFAS No. 160 establishes accounting and reporting standards for ownership interests in subsidiaries held by parties other than the parent, the amount of consolidated net income attributable to the parent and to the holder of a noncontrolling interest, changes in a parent's ownership interest and the valuation of retained noncontrolling equity investments when a subsidiary is no longer consolidated. SFAS No. 160 also establishes reporting requirements to clearly identify, distinguish and disclose the interests of the parent and the interests of the noncontrolling owners. This standard is effective for fiscal years beginning after December 15, 2008. We do not expect the adoption of this statement to have a material effect on our financial statements. CERTAIN FACTORS AFFECTING THE COMPANY'S PERFORMANCE In addition to the other information provided in this Report, the risk factors included in Item 1A should be considered when evaluating results of our operations, future prospects and an investment in shares of our Common Stock. Any of these factors could cause our actual financial results to differ materially from our historical results, and could give rise to events that might have a material adverse effect on our business, financial condition and results of operations. FORWARD-LOOKING INFORMATION This Report contains statements that may be considered forward-looking statements within the meaning of Section 27A of the Securities Act of 1933, as amended and Section 21E of the Securities Exchange Act of 1934, as amended. Such statements include the use of terms or phrases such as "expects," "estimated," "projects," "believes," "anticipates," "intends," and similar terms and phrases. Such forward-looking statements relate to, among other matters, our future financial performance, business prospects, growth strategies or liquidity. The following important factors may affect our future results and could cause those results to differ materially from our historical results. These factors include, in addition to those "Risk Factors" detailed in Item 1A of this report, and described elsewhere in this document, the cost and availability of capital, raw material and transportation costs related to petroleum price levels, the cost and availability of energy supplies, the loss of a significant customer or group of customers, materially adverse changes in economic conditions generally in carpet, rug and floorcovering markets we serve and other risks detailed from time to time in our filings with the Securities and Exchange Commission.
20
ITEM 7A. QUANTITATIVE AND QUALITATIVE DISCLOSURES ABOUT MARKET RISK (dollars in thousands) The Company's earnings, cash flows and financial position are exposed to market risks relating to interest rates. It is the Company's policy to minimize its exposure to adverse changes in interest rates and manage interest rate risks inherent in funding the Company with debt. The Company addresses this financial exposure through a risk management program that includes maintaining a mix of fixed and floating rate debt and the use of derivative financial instruments. At December 29, 2007, the Company was a party to an interest rate swap agreement on its mortgage note payable with a notional amount equal to the outstanding balance of the mortgage note ($6,538 at December 29, 2007) which expires in March of 2013. Under the interest rate swap agreement, the Company pays a fixed rate of 4.54% of interest times the notional amount and receives in return an amount equal to a specified variable rate of interest times the same notional amount. This swap agreement effectively fixes the interest rate on the mortgage note payable at 6.54%. On October 11, 2005, the Company entered into an interest rate swap agreement with a notional amount of $30,000 through May 11, 2010. Under this agreement, the Company pays a fixed rate of interest of 4.79% times the notional amount and receives in return a specified variable rate of interest times the same notional amount. The interest rate swap agreement is linked to the Company's variable rate debt and is considered a highly effective hedge. At December 29, 2007, $15,464, or approximately 17% of the Company's total debt, was subject to floating interest rates. A 10% fluctuation in the variable interest rates applicable to this floating rate debt would have an annual after-tax impact of approximately $69. ITEM 8. FINANCIAL STATEMENTS AND SUPPLEMENTARY DATA The supplementary financial information required by ITEM 302 of Regulation S-K is included in PART II, ITEM 5 of this report and the Financial Statements is included in a separate section of this report. ITEM 9. CHANGES IN AND DISAGREEMENTS WITH ACCOUNTANTS ON ACCOUNTING AND FINANCIAL DISCLOSURE None. ITEM 9A. CONTROLS AND PROCEDURES
(a) Evaluation of Disclosure Controls and Procedures. We maintain disclosure controls and procedures to ensure that information required to be disclosed in the reports that we file or submit under the Exchange Act is recorded, processed, summarized and reported within the time periods specified in the Commission's rules and forms and is accumulated and communicated to management, including our principal executive officer and principal financial officer, or persons performing similar functions, as appropriate to allow timely decisions regarding required disclosure. Our management, under the supervision and with the participation of our Chief Executive Officer and Chief Financial Officer, evaluated the effectiveness of our disclosure controls and procedures (as such terms are defined in Rules 13(a)-15(e) and 15(d)-15(e)) under the Securities Exchange Act of 1934, as amended (the "Exchange Act") as of December 29, 2007, the date of the financial statements included in this Form 10-K (the "Evaluation Date"). Based on that evaluation, our Chief Executive Officer and Chief Financial Officer concluded that our disclosure controls and procedures were effective as of the Evaluation Date.
(b) Changes in Internal Control over Financial Reporting. During the last fiscal quarter, there have not been
any changes in our internal control over financial reporting that have materially affected or are reasonably likely to materially affect our internal controls over financial reporting.
21
MANAGEMENT'S REPORT ON INTERNAL CONTROL OVER FINANCIAL REPORTING Our management is responsible for establishing and maintaining adequate internal control over financial reporting, as such term is defined in Exchange Act Rules 13(a)-15(f) and 15(d)-15(f). Internal control over financial reporting cannot provide absolute assurance of achieving financial reporting objectives because of its inherent limitations. Internal control over financial reporting is a process that involves human diligence and compliance and is subject to lapses in judgment and breakdowns resulting from human failures as well as diverse interpretation of U.S. generally accepted accounting principles by accounting professionals. It is also possible that internal controls could be circumvented by collusion or improper management override. Because of such limitations, there is a risk that material misstatements may not be prevented or detected on a timely basis by internal control over financial reporting. Furthermore, projections of any evaluation of effectiveness to future periods are subject to the risk that controls may become inadequate because of changes in conditions, or that the degree of compliance with the policies or procedures may deteriorate. These inherent limitations are known features of the financial reporting process; therefore, it is possible to design into the reporting process safeguards to reduce, though not eliminate, this risk. We conducted, under the supervision and with the participation of our management, including our principal executive officer and principal financial officer, an evaluation of the effectiveness of our internal control over financial reporting based on the framework in Internal Control - Integrated Framework issued by the Committee of Sponsoring Organizations of the Treadway Commission. Based on our evaluation under such framework, our management concluded that our internal control over financial reporting was effective as of December 29, 2007. Our independent auditors, Ernst & Young LLP, an independent registered public accounting firm, has audited and reported on our consolidated financial statements and has issued an attestation report on the effectiveness of our internal control over financial reporting.
22
Report of Independent Registered Public Accounting Firm The Board of Directors and Shareholders of The Dixie Group, Inc. We have audited The Dixie Group, Inc.’s internal control over financial reporting as of December 29, 2007, based on criteria established in Internal Control—Integrated Framework issued by the Committee of Sponsoring Organizations of the Treadway Commission (the COSO criteria). The Dixie Group, Inc.’s management is responsible for maintaining effective internal control over financial reporting, and for its assessment of the effectiveness of internal control over financial reporting included in the accompanying Management’s Report on Internal Control over Financial Reporting. Our responsibility is to express an opinion on the effectiveness of the Company’s internal control over financial reporting based on our audit. We conducted our audit in accordance with the standards of the Public Company Accounting Oversight Board (United States). Those standards require that we plan and perform the audit to obtain reasonable assurance about whether effective internal control over financial reporting was maintained in all material respects. Our audit included obtaining an understanding of internal control over financial reporting, assessing the risk that a material weakness exists, testing and evaluating the design and operating effectiveness of internal control based on the assessed risk, and performing such other procedures as we considered necessary in the circumstances. We believe that our audit provides a reasonable basis for our opinion. A company’s internal control over financial reporting is a process designed to provide reasonable assurance regarding the reliability of financial reporting and the preparation of financial statements for external purposes in accordance with generally accepted accounting principles. A company’s internal control over financial reporting includes those policies and procedures that (1) pertain to the maintenance of records that, in reasonable detail, accurately and fairly reflect the transactions and dispositions of the assets of the company; (2) provide reasonable assurance that transactions are recorded as necessary to permit preparation of financial statements in accordance with generally accepted accounting principles, and that receipts and expenditures of the company are being made only in accordance with authorizations of management and directors of the company; and (3) provide reasonable assurance regarding prevention or timely detection of unauthorized acquisition, use, or disposition of the company’s assets that could have a material effect on the financial statements. Because of its inherent limitations, internal control over financial reporting may not prevent or detect misstatements. Also, projections of any evaluation of effectiveness to future periods are subject to the risk that controls may become inadequate because of changes in conditions, or that the degree of compliance with the policies or procedures may deteriorate. In our opinion, The Dixie Group, Inc. maintained, in all material respects, effective internal control over financial reporting as of December 29, 2007, based on the COSO criteria. We also have audited, in accordance with the standards of the Public Company Accounting Oversight Board (United States), the consolidated balance sheets of The Dixie Group, Inc. as of December 29, 2007 and December 30, 2006, and the related consolidated statements of operations, stockholders’ equity and comprehensive income, and cash flows for each of the three years in the period ended December 29, 2007. Our report dated March 4, 2008 expressed an unqualified opinion thereon. /s/ Ernst & Young LLP Atlanta, Georgia March 4, 2008
23
ITEM 9B. OTHER INFORMATION None.
PART III ITEM 10. DIRECTORS AND EXECUTIVE OFFICERS OF THE REGISTRANT The sections entitled "Information about Nominees for Director" and "Section 16(a) Beneficial Ownership Reporting Compliance" in the Proxy Statement of the registrant for the annual meeting of shareholders to be held April 30, 2008 is incorporated herein by reference. Information regarding the executive officers of the registrant is presented in PART I of this report. The Company has adopted a Code of Business Conduct and Ethics (the "Code of Ethics") which applies to its principal executive officer, principal financial officer and principal accounting officer or controller, and any persons performing similar functions. A copy of the Code of Ethics is incorporated by reference as Exhibit 14 to this Report. Audit Committee Financial Expert The Board has determined that John W. Murrey, III is an audit committee financial expert as defined by Item 401(h) of Regulation S-K of the Securities Exchange Act of 1934, as amended, and is independent within the meaning of Item 7(d)(3)(iv) of Schedule 14A of the Securities Exchange Act of 1934. For a brief listing of Mr. Murrey's relevant experience, please refer to the "Election of Directors" section of the Company's Proxy Statement. Audit Committee The Company has a standing audit committee. At December 29, 2007, members of the Company's audit committee are John W. Murrey, III, Chairman, J. Don Brock, Walter W. Hubbard and Lowry F. Kline. ITEM 11. EXECUTIVE COMPENSATION The section entitled "Compensation Discussion and Analysis", "Executive Compensation Information" and "Director Compensation" in the Proxy Statement of the registrant for the annual meeting of shareholders to be held April 30, 2008 is incorporated herein by reference. ITEM 12. SECURITY OWNERSHIP OF CERTAIN BENEFICIAL OWNERS AND MANAGEMENT AND RELATED STOCKHOLDER MATTERS The section entitled "Principal Shareholders", as well as the beneficial ownership table (and accompanying notes) in the Proxy Statement of the registrant for the annual meeting of shareholders to be April 30, 2008 is incorporated herein by reference.
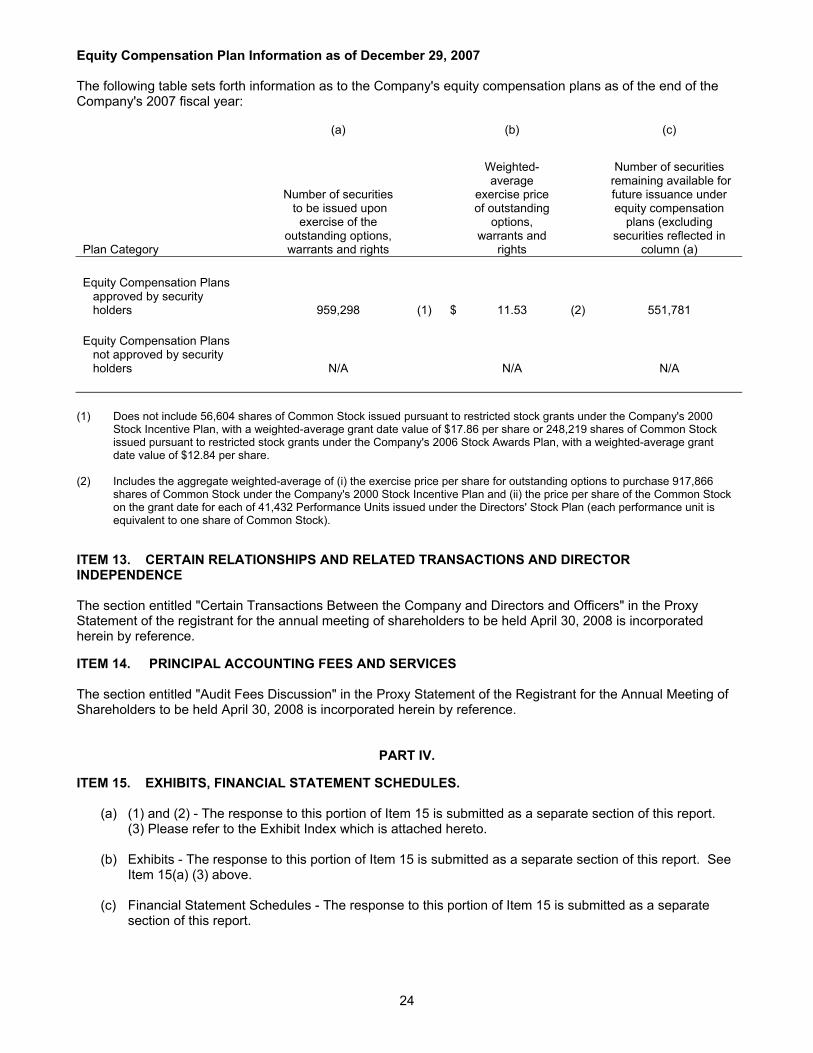
24
Equity Compensation Plan Information as of December 29, 2007 The following table sets forth information as to the Company's equity compensation plans as of the end of the Company's 2007 fiscal year:
(a) (b) (c)
Plan Category
Number of securities to be issued upon
exercise of the outstanding options, warrants and rights
Weighted- average
exercise price of outstanding
options, warrants and
rights
Number of securities remaining available for future issuance under equity compensation
plans (excluding securities reflected in
column (a) Equity Compensation Plans approved by security holders 959,298 (1) $ 11.53 (2) 551,781 Equity Compensation Plans not approved by security holders N/A N/A N/A
(1) Does not include 56,604 shares of Common Stock issued pursuant to restricted stock grants under the Company's 2000 Stock Incentive Plan, with a weighted-average grant date value of $17.86 per share or 248,219 shares of Common Stock issued pursuant to restricted stock grants under the Company's 2006 Stock Awards Plan, with a weighted-average grant date value of $12.84 per share.
(2) Includes the aggregate weighted-average of (i) the exercise price per share for outstanding options to purchase 917,866
shares of Common Stock under the Company's 2000 Stock Incentive Plan and (ii) the price per share of the Common Stock on the grant date for each of 41,432 Performance Units issued under the Directors' Stock Plan (each performance unit is equivalent to one share of Common Stock).
ITEM 13. CERTAIN RELATIONSHIPS AND RELATED TRANSACTIONS AND DIRECTOR INDEPENDENCE The section entitled "Certain Transactions Between the Company and Directors and Officers" in the Proxy Statement of the registrant for the annual meeting of shareholders to be held April 30, 2008 is incorporated herein by reference. ITEM 14. PRINCIPAL ACCOUNTING FEES AND SERVICES The section entitled "Audit Fees Discussion" in the Proxy Statement of the Registrant for the Annual Meeting of Shareholders to be held April 30, 2008 is incorporated herein by reference.
PART IV. ITEM 15. EXHIBITS, FINANCIAL STATEMENT SCHEDULES.
(a) (1) and (2) - The response to this portion of Item 15 is submitted as a separate section of this report. (3) Please refer to the Exhibit Index which is attached hereto.
(b) Exhibits - The response to this portion of Item 15 is submitted as a separate section of this report. See Item 15(a) (3) above.
(c) Financial Statement Schedules - The response to this portion of Item 15 is submitted as a separate
section of this report.
25
SIGNATURES Pursuant to the requirements of Section 13 or 15(d) of the Securities Exchange Act of 1934, the registrant has duly caused this report to be signed on its behalf by the undersigned, thereunto duly authorized. Date: March 4, 2007 The Dixie Group, Inc.
/s/ DANIEL K. FRIERSON By: Daniel K. Frierson Chairman of the Board and Chief Executive Officer
Pursuant to the requirements of the Securities Exchange Act of 1934, this report has been signed below by the following persons on behalf of the registrant and in the capacities and on the dates indicated. /s/ DANIEL K. FRIERSON Daniel K. Frierson
Chairman of the Board, Director and Chief Executive Officer March 4, 2008
/s/ GARY A. HARMON Gary A. Harmon
Vice President, Chief Financial Officer
March 4, 2008
/s/ D. EUGENE LASATER D. Eugene Lasater
Controller
March 4, 2008
/s/ J. DON BROCK J. Don Brock
Director
March 4, 2008
/s/ PAUL K. FRIERSON Paul K. Frierson
Director
March 4, 2008
/s/ WALTER W. HUBBARD Walter W. Hubbard
Director
March 4, 2008
/s/ LOWRY F. KLINE Lowry F. Kline
Director
March 4, 2008
/s/ JOHN W. MURREY, III John W. Murrey, III
Director
March 4, 2008
26
ANNUAL REPORT ON FORM 10-K
ITEM 8, ITEM 15(a)(1) AND ITEM 15(d)
LIST OF FINANCIAL STATEMENTS AND FINANCIAL STATEMENT SCHEDULES
FINANCIAL STATEMENTS
FINANCIAL STATEMENT SCHEDULES
YEAR ENDED DECEMBER 29, 2007
THE DIXIE GROUP, INC.
CHATTANOOGA, TENNESSEE
27
FORM 10-K - ITEM 15(a)(1) and (2)
THE DIXIE GROUP, INC. AND SUBSIDIARIES
LIST OF FINANCIAL STATEMENTS AND FINANCIAL STATEMENT SCHEDULES
The following consolidated financial statements of The Dixie Group, Inc. and subsidiaries are included in Item 8: Report of Independent Registered Public Accounting Firm Consolidated balance sheets - December 29, 2007 and December 30, 2006 Consolidated statements of operations - Years ended December 29, 2007, December 30, 2006, and
December 31, 2005 Consolidated statements of cash flows - Years ended December 29, 2007, December 30, 2006, and
December 31, 2005 Consolidated statements of stockholders' equity and comprehensive income - Years ended December 29,
2007, December 30, 2006, and December 31, 2005 Notes to consolidated financial statements The following consolidated financial statement schedule of The Dixie Group, Inc. and subsidiaries is included in Item 15(d): Schedule II - Valuation and qualifying accounts All other schedules for which provision is made in the applicable accounting regulation of the Securities and Exchange Commission are not required under the related instructions, or are inapplicable, or the information is otherwise shown in the financial statements or notes thereto, and therefore such schedules have been omitted.
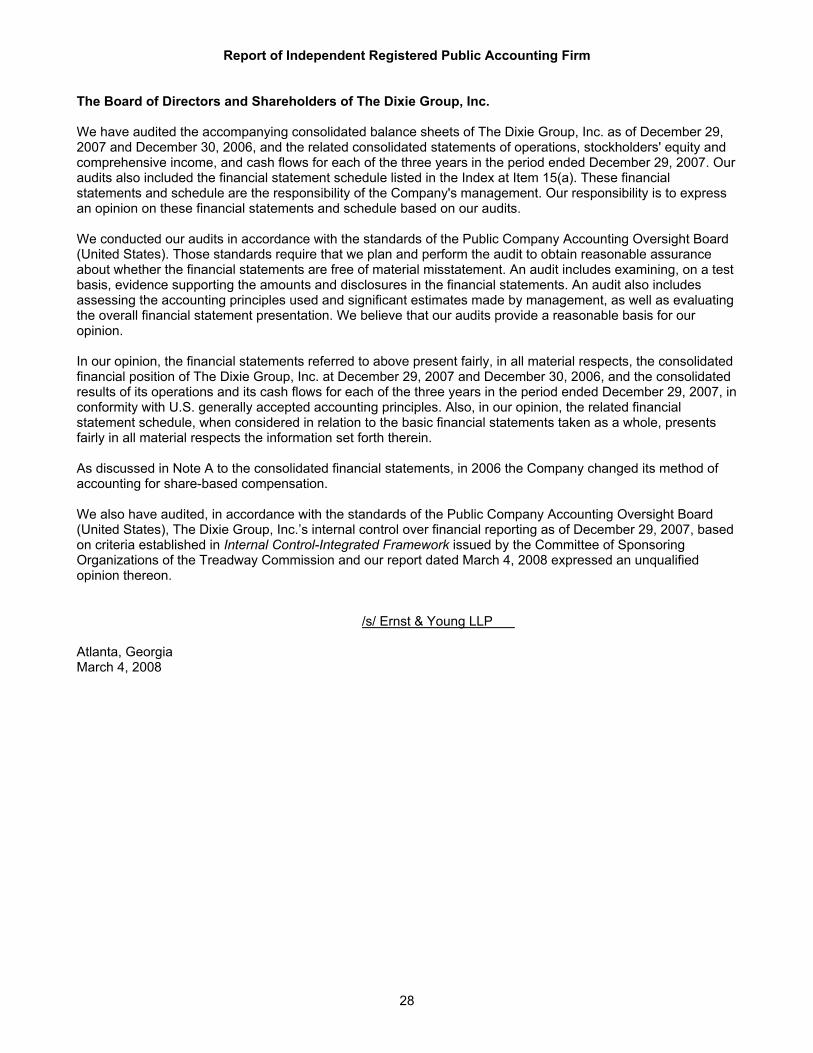
28
Report of Independent Registered Public Accounting Firm The Board of Directors and Shareholders of The Dixie Group, Inc. We have audited the accompanying consolidated balance sheets of The Dixie Group, Inc. as of December 29, 2007 and December 30, 2006, and the related consolidated statements of operations, stockholders' equity and comprehensive income, and cash flows for each of the three years in the period ended December 29, 2007. Our audits also included the financial statement schedule listed in the Index at Item 15(a). These financial statements and schedule are the responsibility of the Company's management. Our responsibility is to express an opinion on these financial statements and schedule based on our audits. We conducted our audits in accordance with the standards of the Public Company Accounting Oversight Board (United States). Those standards require that we plan and perform the audit to obtain reasonable assurance about whether the financial statements are free of material misstatement. An audit includes examining, on a test basis, evidence supporting the amounts and disclosures in the financial statements. An audit also includes assessing the accounting principles used and significant estimates made by management, as well as evaluating the overall financial statement presentation. We believe that our audits provide a reasonable basis for our opinion. In our opinion, the financial statements referred to above present fairly, in all material respects, the consolidated financial position of The Dixie Group, Inc. at December 29, 2007 and December 30, 2006, and the consolidated results of its operations and its cash flows for each of the three years in the period ended December 29, 2007, in conformity with U.S. generally accepted accounting principles. Also, in our opinion, the related financial statement schedule, when considered in relation to the basic financial statements taken as a whole, presents fairly in all material respects the information set forth therein. As discussed in Note A to the consolidated financial statements, in 2006 the Company changed its method of accounting for share-based compensation. We also have audited, in accordance with the standards of the Public Company Accounting Oversight Board (United States), The Dixie Group, Inc.’s internal control over financial reporting as of December 29, 2007, based on criteria established in Internal Control-Integrated Framework issued by the Committee of Sponsoring Organizations of the Treadway Commission and our report dated March 4, 2008 expressed an unqualified opinion thereon. /s/ Ernst & Young LLP Atlanta, Georgia March 4, 2008
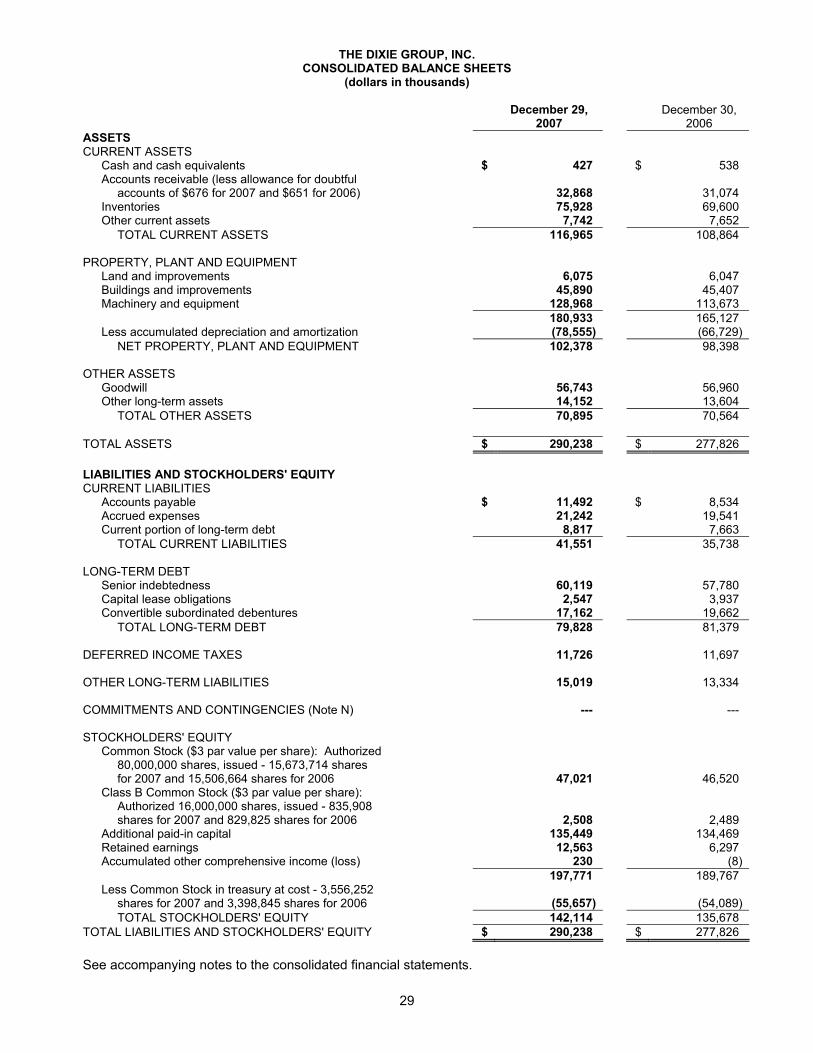
29
THE DIXIE GROUP, INC. CONSOLIDATED BALANCE SHEETS
(dollars in thousands)
December 29,
2007 December 30,
2006 ASSETS CURRENT ASSETS Cash and cash equivalents $ 427 $ 538 Accounts receivable (less allowance for doubtful accounts of $676 for 2007 and $651 for 2006) 32,868 31,074 Inventories 75,928 69,600 Other current assets 7,742 7,652 TOTAL CURRENT ASSETS 116,965 108,864
PROPERTY, PLANT AND EQUIPMENT Land and improvements 6,075 6,047 Buildings and improvements 45,890 45,407 Machinery and equipment 128,968 113,673 180,933 165,127 Less accumulated depreciation and amortization (78,555) (66,729) NET PROPERTY, PLANT AND EQUIPMENT 102,378 98,398
OTHER ASSETS Goodwill 56,743 56,960 Other long-term assets 14,152 13,604 TOTAL OTHER ASSETS 70,895 70,564
TOTAL ASSETS $ 290,238 $ 277,826
LIABILITIES AND STOCKHOLDERS' EQUITY CURRENT LIABILITIES Accounts payable $ 11,492 $ 8,534 Accrued expenses 21,242 19,541 Current portion of long-term debt 8,817 7,663 TOTAL CURRENT LIABILITIES 41,551 35,738
LONG-TERM DEBT Senior indebtedness 60,119 57,780 Capital lease obligations 2,547 3,937 Convertible subordinated debentures 17,162 19,662 TOTAL LONG-TERM DEBT 79,828 81,379
DEFERRED INCOME TAXES 11,726 11,697 OTHER LONG-TERM LIABILITIES 15,019 13,334 COMMITMENTS AND CONTINGENCIES (Note N) --- ---
STOCKHOLDERS' EQUITY Common Stock ($3 par value per share): Authorized 80,000,000 shares, issued - 15,673,714 shares for 2007 and 15,506,664 shares for 2006 47,021 46,520 Class B Common Stock ($3 par value per share): Authorized 16,000,000 shares, issued - 835,908 shares for 2007 and 829,825 shares for 2006 2,508 2,489 Additional paid-in capital 135,449 134,469 Retained earnings 12,563 6,297 Accumulated other comprehensive income (loss) 230 (8) 197,771 189,767 Less Common Stock in treasury at cost - 3,556,252 shares for 2007 and 3,398,845 shares for 2006 (55,657) (54,089) TOTAL STOCKHOLDERS' EQUITY 142,114 135,678
TOTAL LIABILITIES AND STOCKHOLDERS' EQUITY $ 290,238 $ 277,826 See accompanying notes to the consolidated financial statements.
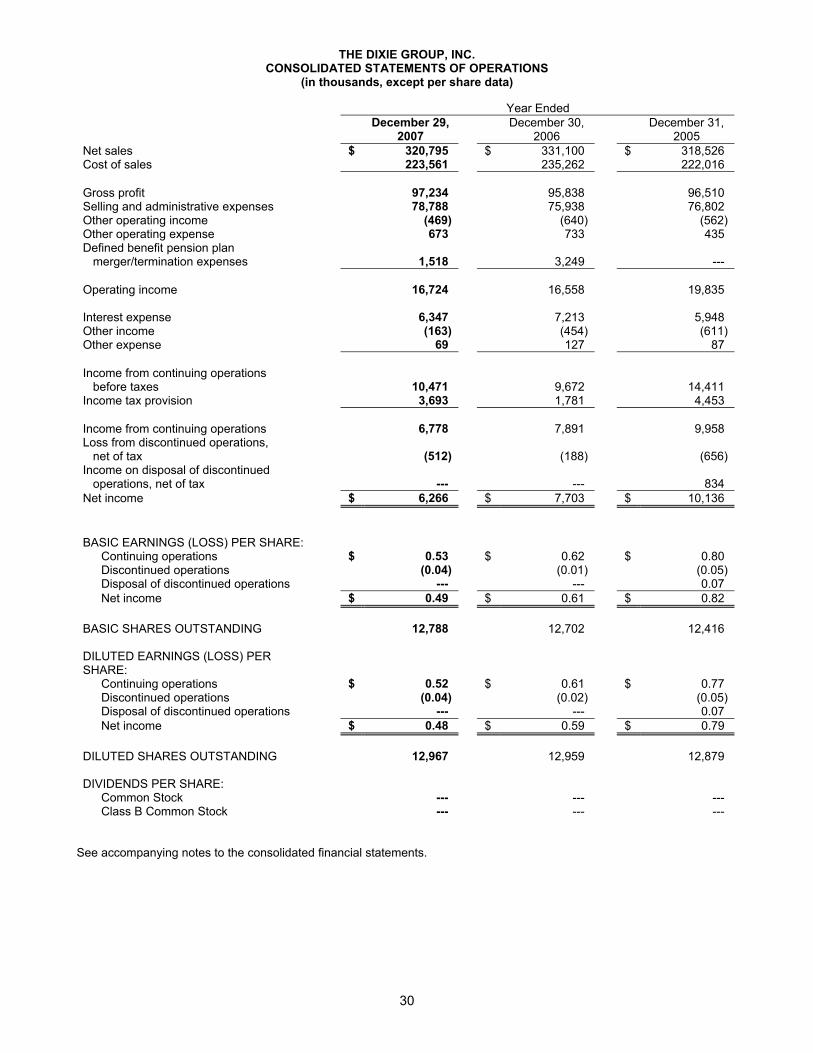
30
THE DIXIE GROUP, INC. CONSOLIDATED STATEMENTS OF OPERATIONS
(in thousands, except per share data)
Year Ended
December 29,
2007 December 30,
2006 December 31,
2005 Net sales $ 320,795 $ 331,100 $ 318,526 Cost of sales 223,561 235,262 222,016
Gross profit 97,234 95,838 96,510 Selling and administrative expenses 78,788 75,938 76,802 Other operating income (469) (640) (562) Other operating expense 673 733 435 Defined benefit pension plan merger/termination expenses 1,518 3,249 ---
Operating income 16,724 16,558 19,835
Interest expense 6,347 7,213 5,948 Other income (163) (454) (611) Other expense 69 127 87
Income from continuing operations before taxes 10,471 9,672 14,411 Income tax provision 3,693 1,781 4,453
Income from continuing operations 6,778 7,891 9,958 Loss from discontinued operations, net of tax (512) (188) (656) Income on disposal of discontinued operations, net of tax --- --- 834 Net income $ 6,266 $ 7,703 $ 10,136
BASIC EARNINGS (LOSS) PER SHARE: Continuing operations $ 0.53 $ 0.62 $ 0.80 Discontinued operations (0.04) (0.01) (0.05) Disposal of discontinued operations --- --- 0.07 Net income $ 0.49 $ 0.61 $ 0.82
BASIC SHARES OUTSTANDING 12,788 12,702 12,416
DILUTED EARNINGS (LOSS) PER SHARE: Continuing operations $ 0.52 $ 0.61 $ 0.77 Discontinued operations (0.04) (0.02) (0.05) Disposal of discontinued operations --- --- 0.07 Net income $ 0.48 $ 0.59 $ 0.79
DILUTED SHARES OUTSTANDING 12,967 12,959 12,879
DIVIDENDS PER SHARE: Common Stock --- --- --- Class B Common Stock --- --- ---
See accompanying notes to the consolidated financial statements.
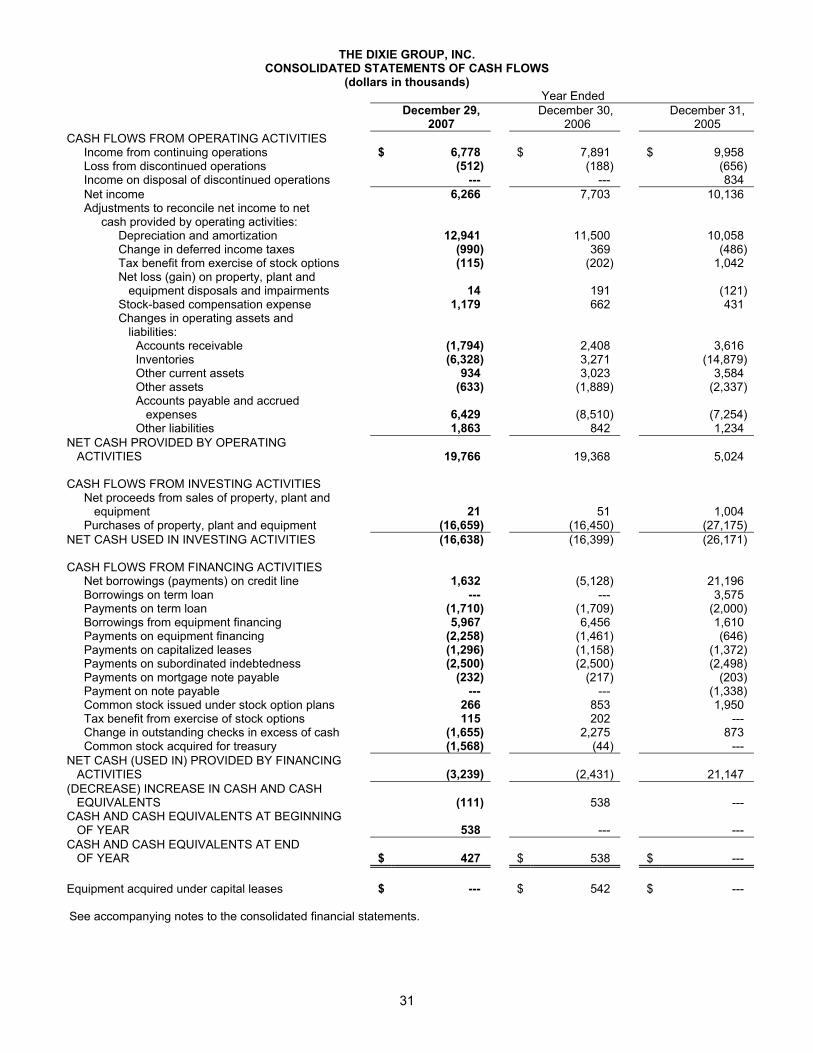
31
THE DIXIE GROUP, INC. CONSOLIDATED STATEMENTS OF CASH FLOWS
(dollars in thousands) Year Ended
December 29,
2007 December 30,
2006 December 31,
2005 CASH FLOWS FROM OPERATING ACTIVITIES Income from continuing operations $ 6,778 $ 7,891 $ 9,958 Loss from discontinued operations (512) (188) (656) Income on disposal of discontinued operations --- --- 834 Net income 6,266 7,703 10,136 Adjustments to reconcile net income to net cash provided by operating activities: Depreciation and amortization 12,941 11,500 10,058 Change in deferred income taxes (990) 369 (486) Tax benefit from exercise of stock options (115) (202) 1,042
Net loss (gain) on property, plant and equipment disposals and impairments 14 191 (121)
Stock-based compensation expense 1,179 662 431
Changes in operating assets and liabilities:
Accounts receivable (1,794) 2,408 3,616 Inventories (6,328) 3,271 (14,879) Other current assets 934 3,023 3,584 Other assets (633) (1,889) (2,337)
Accounts payable and accrued expenses 6,429 (8,510) (7,254)
Other liabilities 1,863 842 1,234 NET CASH PROVIDED BY OPERATING ACTIVITIES 19,766 19,368 5,024 CASH FLOWS FROM INVESTING ACTIVITIES
Net proceeds from sales of property, plant and equipment 21 51 1,004
Purchases of property, plant and equipment (16,659) (16,450) (27,175) NET CASH USED IN INVESTING ACTIVITIES (16,638) (16,399) (26,171) CASH FLOWS FROM FINANCING ACTIVITIES Net borrowings (payments) on credit line 1,632 (5,128) 21,196 Borrowings on term loan --- --- 3,575 Payments on term loan (1,710) (1,709) (2,000) Borrowings from equipment financing 5,967 6,456 1,610 Payments on equipment financing (2,258) (1,461) (646) Payments on capitalized leases (1,296) (1,158) (1,372) Payments on subordinated indebtedness (2,500) (2,500) (2,498) Payments on mortgage note payable (232) (217) (203) Payment on note payable --- --- (1,338) Common stock issued under stock option plans 266 853 1,950 Tax benefit from exercise of stock options 115 202 --- Change in outstanding checks in excess of cash (1,655) 2,275 873 Common stock acquired for treasury (1,568) (44) --- NET CASH (USED IN) PROVIDED BY FINANCING ACTIVITIES (3,239) (2,431) 21,147 (DECREASE) INCREASE IN CASH AND CASH EQUIVALENTS (111) 538 --- CASH AND CASH EQUIVALENTS AT BEGINNING OF YEAR 538 --- --- CASH AND CASH EQUIVALENTS AT END OF YEAR $ 427 $ 538 $ --- Equipment acquired under capital leases $ --- $ 542 $ --- See accompanying notes to the consolidated financial statements.
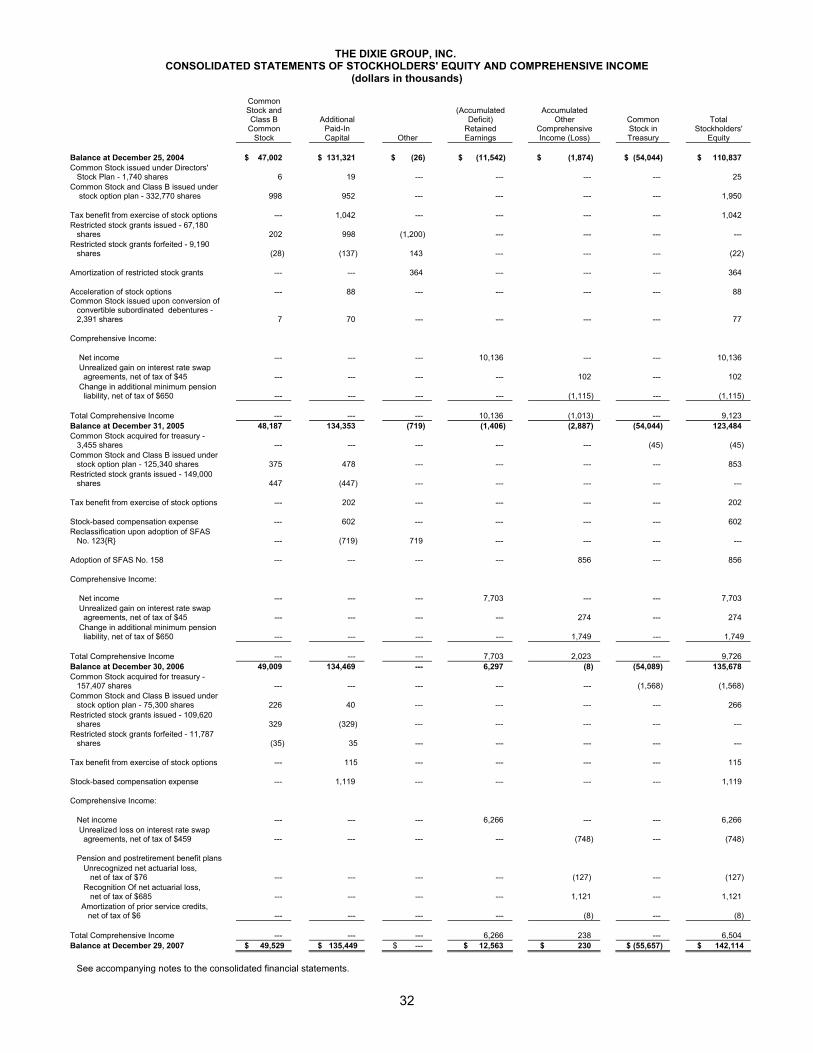
32
THE DIXIE GROUP, INC. CONSOLIDATED STATEMENTS OF STOCKHOLDERS' EQUITY AND COMPREHENSIVE INCOME
(dollars in thousands)
Common Stock and Class B
Common Stock
Additional Paid-In Capital Other
(Accumulated Deficit)
Retained Earnings
Accumulated Other
Comprehensive Income (Loss)
Common Stock in Treasury
Total Stockholders'
Equity
Balance at December 25, 2004 $ 47,002 $ 131,321 $ (26) $ (11,542) $ (1,874) $ (54,044) $ 110,837 Common Stock issued under Directors' Stock Plan - 1,740 shares 6 19 --- --- --- --- 25 Common Stock and Class B issued under stock option plan - 332,770 shares 998 952 --- --- --- --- 1,950
Tax benefit from exercise of stock options --- 1,042 --- --- --- --- 1,042 Restricted stock grants issued - 67,180 shares 202 998 (1,200) --- --- --- --- Restricted stock grants forfeited - 9,190 shares (28) (137) 143 --- --- --- (22)
Amortization of restricted stock grants --- --- 364 --- --- --- 364
Acceleration of stock options --- 88 --- --- --- --- 88 Common Stock issued upon conversion of convertible subordinated debentures - 2,391 shares 7 70 --- --- --- --- 77
Comprehensive Income:
Net income --- --- --- 10,136 --- --- 10,136 Unrealized gain on interest rate swap agreements, net of tax of $45 --- --- --- --- 102 --- 102 Change in additional minimum pension liability, net of tax of $650 --- --- --- --- (1,115) --- (1,115)
Total Comprehensive Income --- --- --- 10,136 (1,013) --- 9,123 Balance at December 31, 2005 48,187 134,353 (719) (1,406) (2,887) (54,044) 123,484 Common Stock acquired for treasury - 3,455 shares --- --- --- --- --- (45) (45) Common Stock and Class B issued under stock option plan - 125,340 shares 375 478 --- --- --- --- 853 Restricted stock grants issued - 149,000 shares 447 (447) --- --- --- --- ---
Tax benefit from exercise of stock options --- 202 --- --- --- --- 202
Stock-based compensation expense --- 602 --- --- --- --- 602 Reclassification upon adoption of SFAS No. 123{R} --- (719) 719 --- --- --- ---
Adoption of SFAS No. 158 --- --- --- --- 856 --- 856
Comprehensive Income:
Net income --- --- --- 7,703 --- --- 7,703 Unrealized gain on interest rate swap agreements, net of tax of $45 --- --- --- --- 274 --- 274 Change in additional minimum pension liability, net of tax of $650 --- --- --- --- 1,749 --- 1,749
Total Comprehensive Income --- --- --- 7,703 2,023 --- 9,726 Balance at December 30, 2006 49,009 134,469 --- 6,297 (8) (54,089) 135,678 Common Stock acquired for treasury - 157,407 shares --- --- --- --- --- (1,568) (1,568) Common Stock and Class B issued under stock option plan - 75,300 shares 226 40 --- --- --- --- 266 Restricted stock grants issued - 109,620 shares 329 (329) --- --- --- --- --- Restricted stock grants forfeited - 11,787 shares (35) 35 --- --- --- --- ---
Tax benefit from exercise of stock options --- 115 --- --- --- --- 115
Stock-based compensation expense --- 1,119 --- --- --- --- 1,119
Comprehensive Income:
Net income --- --- --- 6,266 --- --- 6,266 Unrealized loss on interest rate swap agreements, net of tax of $459 --- --- --- --- (748) --- (748)
Pension and postretirement benefit plans Unrecognized net actuarial loss, net of tax of $76 --- --- --- --- (127) --- (127) Recognition Of net actuarial loss, net of tax of $685 --- --- --- --- 1,121 --- 1,121 Amortization of prior service credits, net of tax of $6 --- --- --- --- (8) --- (8)
Total Comprehensive Income --- --- --- 6,266 238 --- 6,504 Balance at December 29, 2007 $ 49,529 $ 135,449 $ --- $ 12,563 $ 230 $ (55,657) $ 142,114
See accompanying notes to the consolidated financial statements.
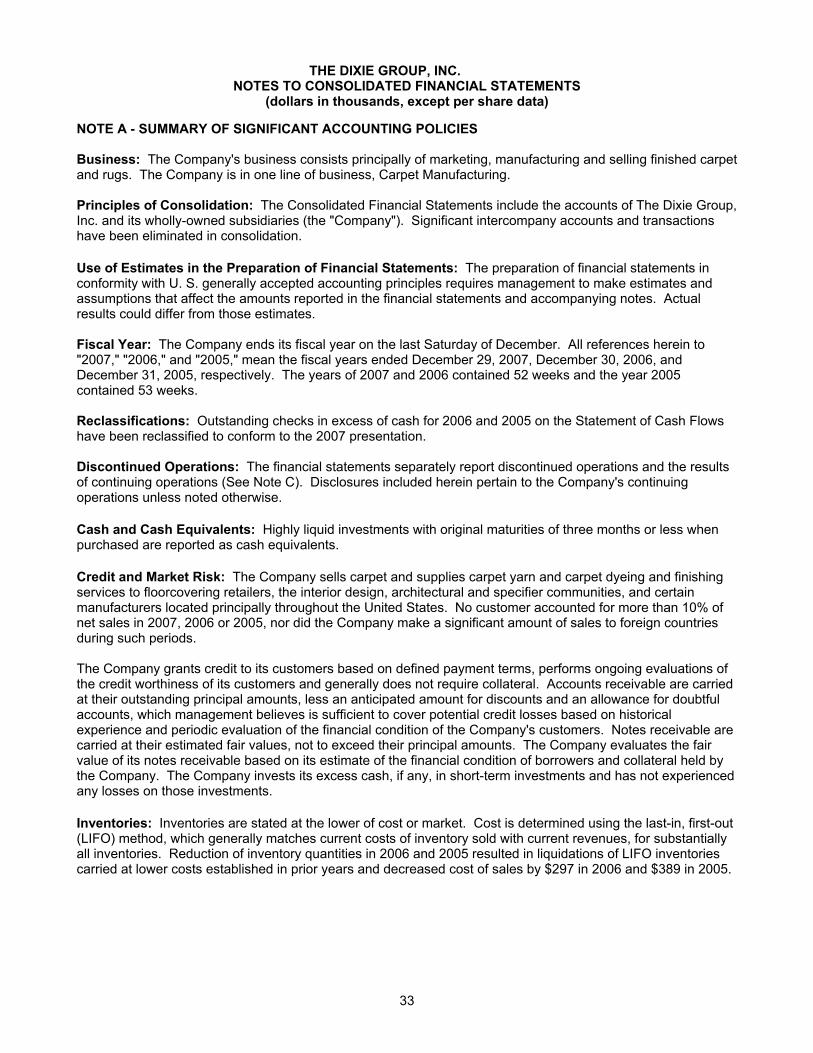
33
THE DIXIE GROUP, INC.
NOTES TO CONSOLIDATED FINANCIAL STATEMENTS (dollars in thousands, except per share data)
NOTE A - SUMMARY OF SIGNIFICANT ACCOUNTING POLICIES Business: The Company's business consists principally of marketing, manufacturing and selling finished carpet and rugs. The Company is in one line of business, Carpet Manufacturing. Principles of Consolidation: The Consolidated Financial Statements include the accounts of The Dixie Group, Inc. and its wholly-owned subsidiaries (the "Company"). Significant intercompany accounts and transactions have been eliminated in consolidation. Use of Estimates in the Preparation of Financial Statements: The preparation of financial statements in conformity with U. S. generally accepted accounting principles requires management to make estimates and assumptions that affect the amounts reported in the financial statements and accompanying notes. Actual results could differ from those estimates. Fiscal Year: The Company ends its fiscal year on the last Saturday of December. All references herein to "2007," "2006," and "2005," mean the fiscal years ended December 29, 2007, December 30, 2006, and December 31, 2005, respectively. The years of 2007 and 2006 contained 52 weeks and the year 2005 contained 53 weeks. Reclassifications: Outstanding checks in excess of cash for 2006 and 2005 on the Statement of Cash Flows have been reclassified to conform to the 2007 presentation. Discontinued Operations: The financial statements separately report discontinued operations and the results of continuing operations (See Note C). Disclosures included herein pertain to the Company's continuing operations unless noted otherwise. Cash and Cash Equivalents: Highly liquid investments with original maturities of three months or less when purchased are reported as cash equivalents. Credit and Market Risk: The Company sells carpet and supplies carpet yarn and carpet dyeing and finishing services to floorcovering retailers, the interior design, architectural and specifier communities, and certain manufacturers located principally throughout the United States. No customer accounted for more than 10% of net sales in 2007, 2006 or 2005, nor did the Company make a significant amount of sales to foreign countries during such periods. The Company grants credit to its customers based on defined payment terms, performs ongoing evaluations of the credit worthiness of its customers and generally does not require collateral. Accounts receivable are carried at their outstanding principal amounts, less an anticipated amount for discounts and an allowance for doubtful accounts, which management believes is sufficient to cover potential credit losses based on historical experience and periodic evaluation of the financial condition of the Company's customers. Notes receivable are carried at their estimated fair values, not to exceed their principal amounts. The Company evaluates the fair value of its notes receivable based on its estimate of the financial condition of borrowers and collateral held by the Company. The Company invests its excess cash, if any, in short-term investments and has not experienced any losses on those investments. Inventories: Inventories are stated at the lower of cost or market. Cost is determined using the last-in, first-out (LIFO) method, which generally matches current costs of inventory sold with current revenues, for substantially all inventories. Reduction of inventory quantities in 2006 and 2005 resulted in liquidations of LIFO inventories carried at lower costs established in prior years and decreased cost of sales by $297 in 2006 and $389 in 2005.
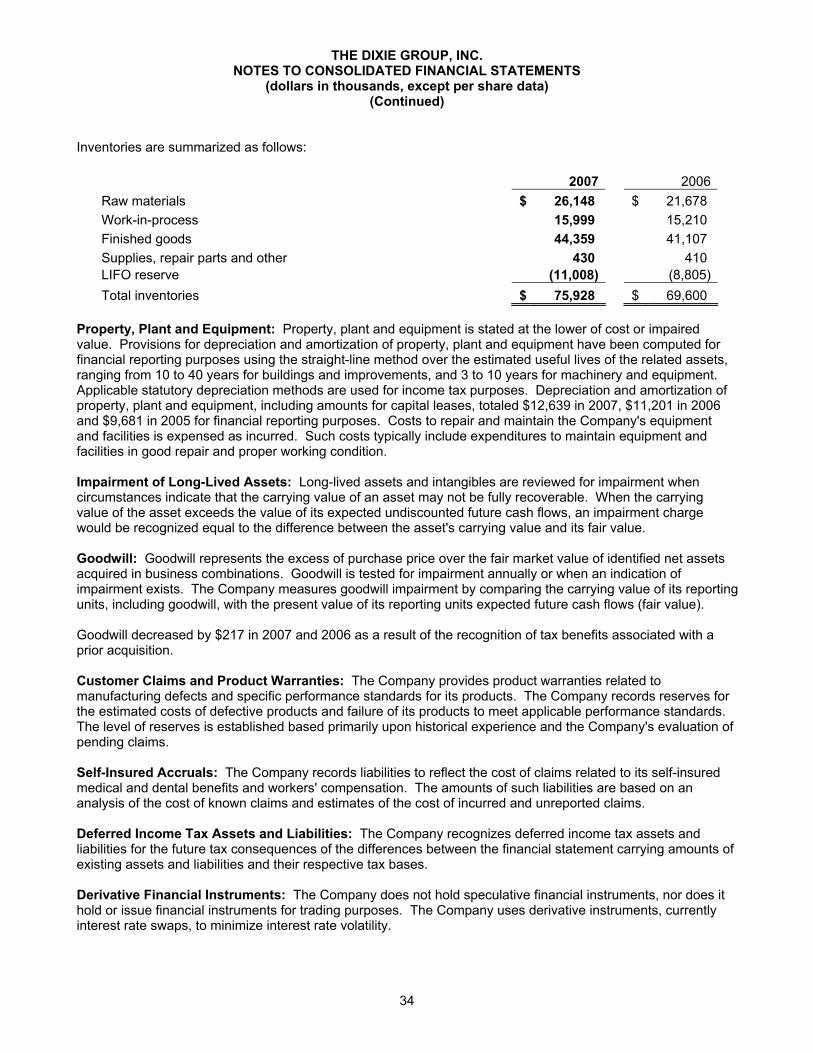
34
THE DIXIE GROUP, INC. NOTES TO CONSOLIDATED FINANCIAL STATEMENTS
(dollars in thousands, except per share data) (Continued)
Inventories are summarized as follows: 2007 2006 Raw materials $ 26,148 $ 21,678 Work-in-process 15,999 15,210 Finished goods 44,359 41,107 Supplies, repair parts and other 430 410 LIFO reserve (11,008) (8,805) Total inventories $ 75,928 $ 69,600
Property, Plant and Equipment: Property, plant and equipment is stated at the lower of cost or impaired value. Provisions for depreciation and amortization of property, plant and equipment have been computed for financial reporting purposes using the straight-line method over the estimated useful lives of the related assets, ranging from 10 to 40 years for buildings and improvements, and 3 to 10 years for machinery and equipment. Applicable statutory depreciation methods are used for income tax purposes. Depreciation and amortization of property, plant and equipment, including amounts for capital leases, totaled $12,639 in 2007, $11,201 in 2006 and $9,681 in 2005 for financial reporting purposes. Costs to repair and maintain the Company's equipment and facilities is expensed as incurred. Such costs typically include expenditures to maintain equipment and facilities in good repair and proper working condition. Impairment of Long-Lived Assets: Long-lived assets and intangibles are reviewed for impairment when circumstances indicate that the carrying value of an asset may not be fully recoverable. When the carrying value of the asset exceeds the value of its expected undiscounted future cash flows, an impairment charge would be recognized equal to the difference between the asset's carrying value and its fair value. Goodwill: Goodwill represents the excess of purchase price over the fair market value of identified net assets acquired in business combinations. Goodwill is tested for impairment annually or when an indication of impairment exists. The Company measures goodwill impairment by comparing the carrying value of its reporting units, including goodwill, with the present value of its reporting units expected future cash flows (fair value). Goodwill decreased by $217 in 2007 and 2006 as a result of the recognition of tax benefits associated with a prior acquisition. Customer Claims and Product Warranties: The Company provides product warranties related to manufacturing defects and specific performance standards for its products. The Company records reserves for the estimated costs of defective products and failure of its products to meet applicable performance standards. The level of reserves is established based primarily upon historical experience and the Company's evaluation of pending claims. Self-Insured Accruals: The Company records liabilities to reflect the cost of claims related to its self-insured medical and dental benefits and workers' compensation. The amounts of such liabilities are based on an analysis of the cost of known claims and estimates of the cost of incurred and unreported claims. Deferred Income Tax Assets and Liabilities: The Company recognizes deferred income tax assets and liabilities for the future tax consequences of the differences between the financial statement carrying amounts of existing assets and liabilities and their respective tax bases. Derivative Financial Instruments: The Company does not hold speculative financial instruments, nor does it hold or issue financial instruments for trading purposes. The Company uses derivative instruments, currently interest rate swaps, to minimize interest rate volatility.
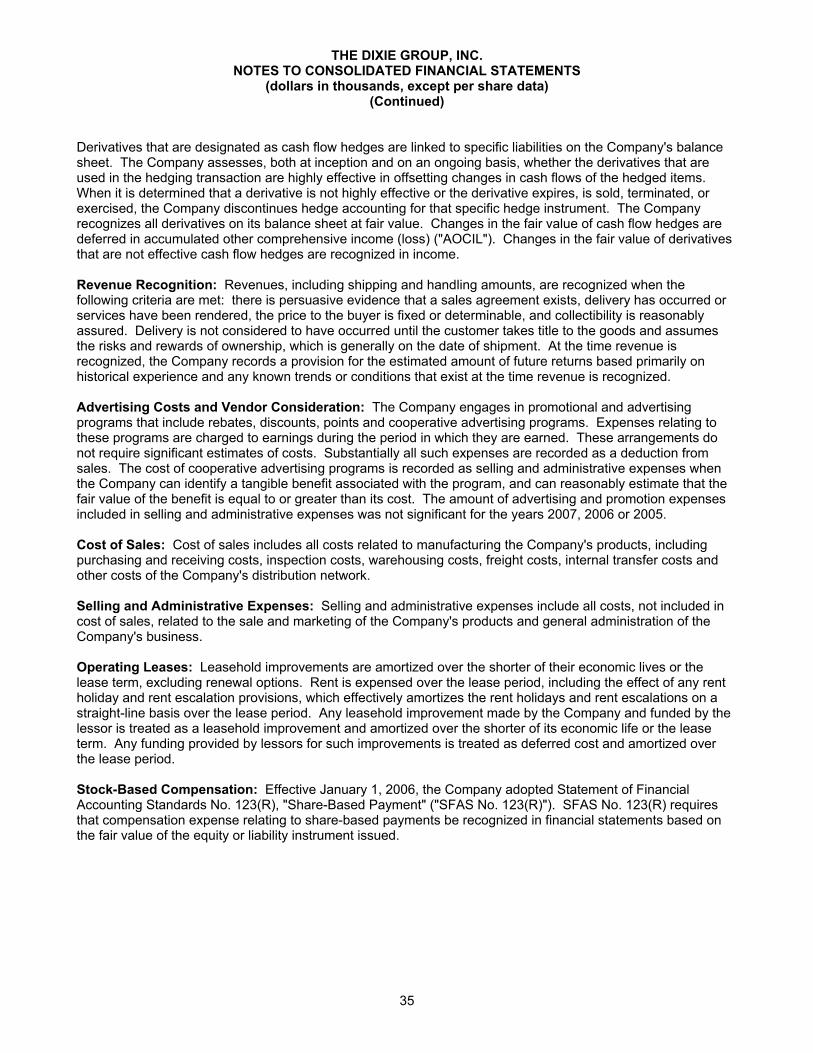
35
THE DIXIE GROUP, INC. NOTES TO CONSOLIDATED FINANCIAL STATEMENTS
(dollars in thousands, except per share data) (Continued)
Derivatives that are designated as cash flow hedges are linked to specific liabilities on the Company's balance sheet. The Company assesses, both at inception and on an ongoing basis, whether the derivatives that are used in the hedging transaction are highly effective in offsetting changes in cash flows of the hedged items. When it is determined that a derivative is not highly effective or the derivative expires, is sold, terminated, or exercised, the Company discontinues hedge accounting for that specific hedge instrument. The Company recognizes all derivatives on its balance sheet at fair value. Changes in the fair value of cash flow hedges are deferred in accumulated other comprehensive income (loss) ("AOCIL"). Changes in the fair value of derivatives that are not effective cash flow hedges are recognized in income. Revenue Recognition: Revenues, including shipping and handling amounts, are recognized when the following criteria are met: there is persuasive evidence that a sales agreement exists, delivery has occurred or services have been rendered, the price to the buyer is fixed or determinable, and collectibility is reasonably assured. Delivery is not considered to have occurred until the customer takes title to the goods and assumes the risks and rewards of ownership, which is generally on the date of shipment. At the time revenue is recognized, the Company records a provision for the estimated amount of future returns based primarily on historical experience and any known trends or conditions that exist at the time revenue is recognized. Advertising Costs and Vendor Consideration: The Company engages in promotional and advertising programs that include rebates, discounts, points and cooperative advertising programs. Expenses relating to these programs are charged to earnings during the period in which they are earned. These arrangements do not require significant estimates of costs. Substantially all such expenses are recorded as a deduction from sales. The cost of cooperative advertising programs is recorded as selling and administrative expenses when the Company can identify a tangible benefit associated with the program, and can reasonably estimate that the fair value of the benefit is equal to or greater than its cost. The amount of advertising and promotion expenses included in selling and administrative expenses was not significant for the years 2007, 2006 or 2005. Cost of Sales: Cost of sales includes all costs related to manufacturing the Company's products, including purchasing and receiving costs, inspection costs, warehousing costs, freight costs, internal transfer costs and other costs of the Company's distribution network. Selling and Administrative Expenses: Selling and administrative expenses include all costs, not included in cost of sales, related to the sale and marketing of the Company's products and general administration of the Company's business. Operating Leases: Leasehold improvements are amortized over the shorter of their economic lives or the lease term, excluding renewal options. Rent is expensed over the lease period, including the effect of any rent holiday and rent escalation provisions, which effectively amortizes the rent holidays and rent escalations on a straight-line basis over the lease period. Any leasehold improvement made by the Company and funded by the lessor is treated as a leasehold improvement and amortized over the shorter of its economic life or the lease term. Any funding provided by lessors for such improvements is treated as deferred cost and amortized over the lease period. Stock-Based Compensation: Effective January 1, 2006, the Company adopted Statement of Financial Accounting Standards No. 123(R), "Share-Based Payment" ("SFAS No. 123(R)"). SFAS No. 123(R) requires that compensation expense relating to share-based payments be recognized in financial statements based on the fair value of the equity or liability instrument issued.
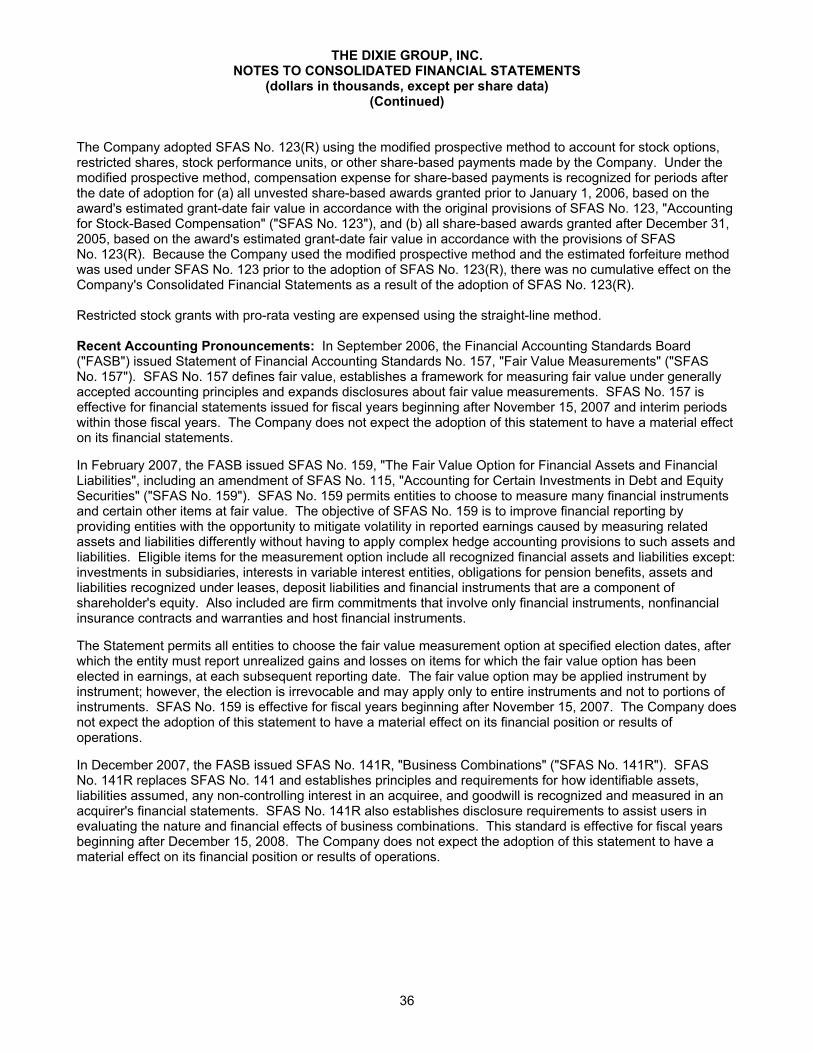
36
THE DIXIE GROUP, INC. NOTES TO CONSOLIDATED FINANCIAL STATEMENTS
(dollars in thousands, except per share data) (Continued)
The Company adopted SFAS No. 123(R) using the modified prospective method to account for stock options, restricted shares, stock performance units, or other share-based payments made by the Company. Under the modified prospective method, compensation expense for share-based payments is recognized for periods after the date of adoption for (a) all unvested share-based awards granted prior to January 1, 2006, based on the award's estimated grant-date fair value in accordance with the original provisions of SFAS No. 123, "Accounting for Stock-Based Compensation" ("SFAS No. 123"), and (b) all share-based awards granted after December 31, 2005, based on the award's estimated grant-date fair value in accordance with the provisions of SFAS No. 123(R). Because the Company used the modified prospective method and the estimated forfeiture method was used under SFAS No. 123 prior to the adoption of SFAS No. 123(R), there was no cumulative effect on the Company's Consolidated Financial Statements as a result of the adoption of SFAS No. 123(R). Restricted stock grants with pro-rata vesting are expensed using the straight-line method. Recent Accounting Pronouncements: In September 2006, the Financial Accounting Standards Board ("FASB") issued Statement of Financial Accounting Standards No. 157, "Fair Value Measurements" ("SFAS No. 157"). SFAS No. 157 defines fair value, establishes a framework for measuring fair value under generally accepted accounting principles and expands disclosures about fair value measurements. SFAS No. 157 is effective for financial statements issued for fiscal years beginning after November 15, 2007 and interim periods within those fiscal years. The Company does not expect the adoption of this statement to have a material effect on its financial statements. In February 2007, the FASB issued SFAS No. 159, "The Fair Value Option for Financial Assets and Financial Liabilities", including an amendment of SFAS No. 115, "Accounting for Certain Investments in Debt and Equity Securities" ("SFAS No. 159"). SFAS No. 159 permits entities to choose to measure many financial instruments and certain other items at fair value. The objective of SFAS No. 159 is to improve financial reporting by providing entities with the opportunity to mitigate volatility in reported earnings caused by measuring related assets and liabilities differently without having to apply complex hedge accounting provisions to such assets and liabilities. Eligible items for the measurement option include all recognized financial assets and liabilities except: investments in subsidiaries, interests in variable interest entities, obligations for pension benefits, assets and liabilities recognized under leases, deposit liabilities and financial instruments that are a component of shareholder's equity. Also included are firm commitments that involve only financial instruments, nonfinancial insurance contracts and warranties and host financial instruments. The Statement permits all entities to choose the fair value measurement option at specified election dates, after which the entity must report unrealized gains and losses on items for which the fair value option has been elected in earnings, at each subsequent reporting date. The fair value option may be applied instrument by instrument; however, the election is irrevocable and may apply only to entire instruments and not to portions of instruments. SFAS No. 159 is effective for fiscal years beginning after November 15, 2007. The Company does not expect the adoption of this statement to have a material effect on its financial position or results of operations. In December 2007, the FASB issued SFAS No. 141R, "Business Combinations" ("SFAS No. 141R"). SFAS No. 141R replaces SFAS No. 141 and establishes principles and requirements for how identifiable assets, liabilities assumed, any non-controlling interest in an acquiree, and goodwill is recognized and measured in an acquirer's financial statements. SFAS No. 141R also establishes disclosure requirements to assist users in evaluating the nature and financial effects of business combinations. This standard is effective for fiscal years beginning after December 15, 2008. The Company does not expect the adoption of this statement to have a material effect on its financial position or results of operations.
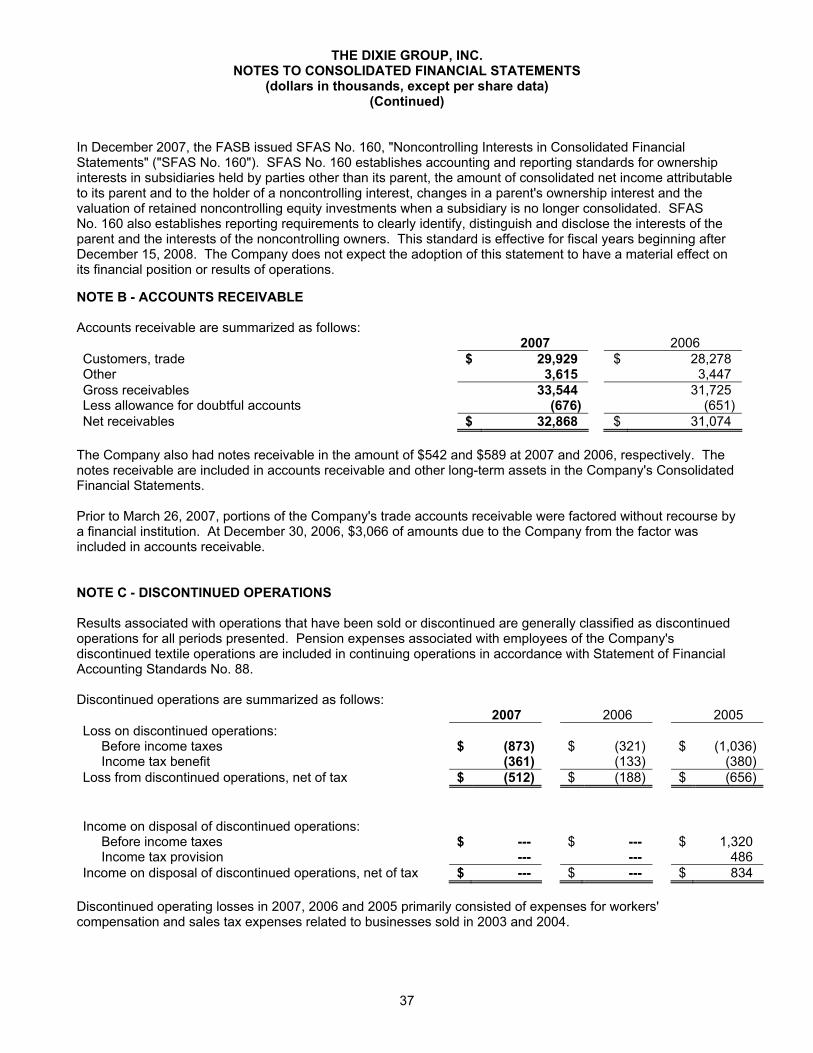
37
THE DIXIE GROUP, INC. NOTES TO CONSOLIDATED FINANCIAL STATEMENTS
(dollars in thousands, except per share data) (Continued)
In December 2007, the FASB issued SFAS No. 160, "Noncontrolling Interests in Consolidated Financial Statements" ("SFAS No. 160"). SFAS No. 160 establishes accounting and reporting standards for ownership interests in subsidiaries held by parties other than its parent, the amount of consolidated net income attributable to its parent and to the holder of a noncontrolling interest, changes in a parent's ownership interest and the valuation of retained noncontrolling equity investments when a subsidiary is no longer consolidated. SFAS No. 160 also establishes reporting requirements to clearly identify, distinguish and disclose the interests of the parent and the interests of the noncontrolling owners. This standard is effective for fiscal years beginning after December 15, 2008. The Company does not expect the adoption of this statement to have a material effect on its financial position or results of operations. NOTE B - ACCOUNTS RECEIVABLE Accounts receivable are summarized as follows: 2007 2006 Customers, trade $ 29,929 $ 28,278 Other 3,615 3,447 Gross receivables 33,544 31,725 Less allowance for doubtful accounts (676) (651)Net receivables $ 32,868 $ 31,074
The Company also had notes receivable in the amount of $542 and $589 at 2007 and 2006, respectively. The notes receivable are included in accounts receivable and other long-term assets in the Company's Consolidated Financial Statements. Prior to March 26, 2007, portions of the Company's trade accounts receivable were factored without recourse by a financial institution. At December 30, 2006, $3,066 of amounts due to the Company from the factor was included in accounts receivable. NOTE C - DISCONTINUED OPERATIONS Results associated with operations that have been sold or discontinued are generally classified as discontinued operations for all periods presented. Pension expenses associated with employees of the Company's discontinued textile operations are included in continuing operations in accordance with Statement of Financial Accounting Standards No. 88. Discontinued operations are summarized as follows:
2007 2006 2005 Loss on discontinued operations: Before income taxes $ (873) $ (321) $ (1,036) Income tax benefit (361) (133) (380)
Loss from discontinued operations, net of tax $ (512) $ (188) $ (656)
Income on disposal of discontinued operations: Before income taxes $ --- $ --- $ 1,320 Income tax provision --- --- 486
Income on disposal of discontinued operations, net of tax $ --- $ --- $ 834 Discontinued operating losses in 2007, 2006 and 2005 primarily consisted of expenses for workers' compensation and sales tax expenses related to businesses sold in 2003 and 2004.
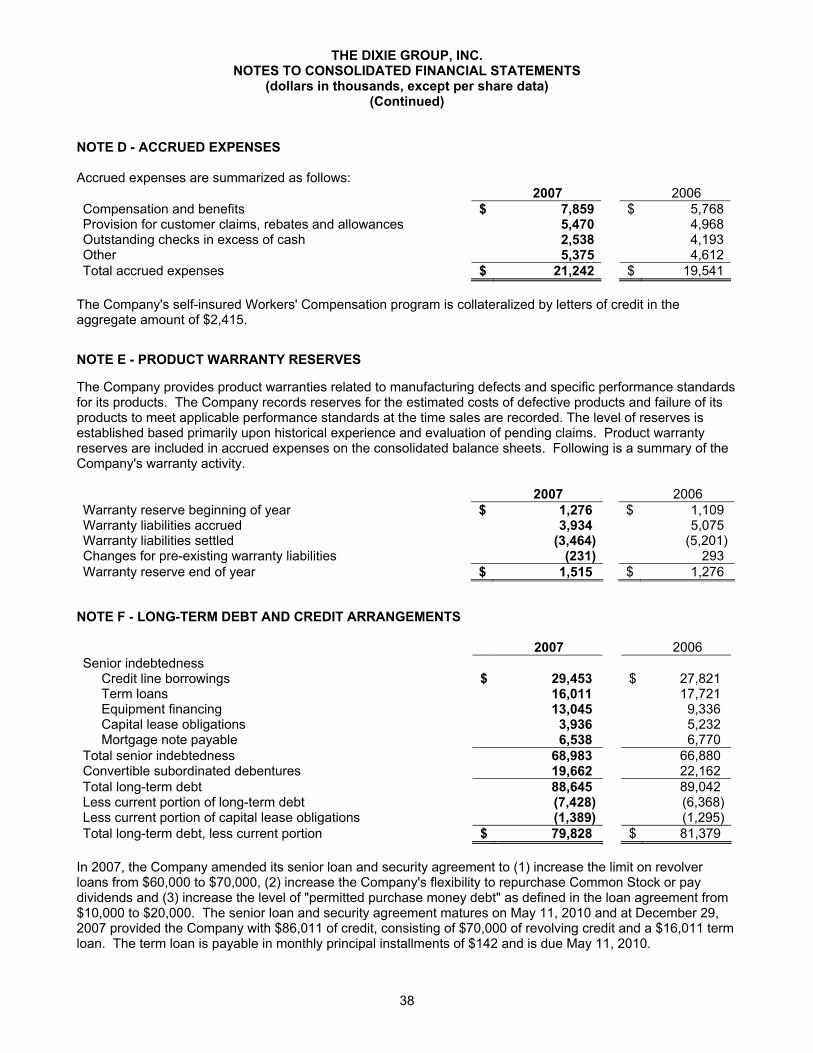
38
THE DIXIE GROUP, INC. NOTES TO CONSOLIDATED FINANCIAL STATEMENTS
(dollars in thousands, except per share data) (Continued)
NOTE D - ACCRUED EXPENSES Accrued expenses are summarized as follows: 2007 2006 Compensation and benefits $ 7,859 $ 5,768 Provision for customer claims, rebates and allowances 5,470 4,968 Outstanding checks in excess of cash 2,538 4,193 Other 5,375 4,612 Total accrued expenses $ 21,242 $ 19,541
The Company's self-insured Workers' Compensation program is collateralized by letters of credit in the aggregate amount of $2,415. NOTE E - PRODUCT WARRANTY RESERVES The Company provides product warranties related to manufacturing defects and specific performance standards for its products. The Company records reserves for the estimated costs of defective products and failure of its products to meet applicable performance standards at the time sales are recorded. The level of reserves is established based primarily upon historical experience and evaluation of pending claims. Product warranty reserves are included in accrued expenses on the consolidated balance sheets. Following is a summary of the Company's warranty activity. 2007 2006 Warranty reserve beginning of year $ 1,276 $ 1,109 Warranty liabilities accrued 3,934 5,075 Warranty liabilities settled (3,464) (5,201)Changes for pre-existing warranty liabilities (231) 293 Warranty reserve end of year $ 1,515 $ 1,276
NOTE F - LONG-TERM DEBT AND CREDIT ARRANGEMENTS
2007 2006 Senior indebtedness Credit line borrowings $ 29,453 $ 27,821 Term loans 16,011 17,721 Equipment financing 13,045 9,336 Capital lease obligations 3,936 5,232 Mortgage note payable 6,538 6,770
Total senior indebtedness 68,983 66,880 Convertible subordinated debentures 19,662 22,162 Total long-term debt 88,645 89,042 Less current portion of long-term debt (7,428) (6,368)Less current portion of capital lease obligations (1,389) (1,295)Total long-term debt, less current portion $ 79,828 $ 81,379
In 2007, the Company amended its senior loan and security agreement to (1) increase the limit on revolver loans from $60,000 to $70,000, (2) increase the Company's flexibility to repurchase Common Stock or pay dividends and (3) increase the level of "permitted purchase money debt" as defined in the loan agreement from $10,000 to $20,000. The senior loan and security agreement matures on May 11, 2010 and at December 29, 2007 provided the Company with $86,011 of credit, consisting of $70,000 of revolving credit and a $16,011 term loan. The term loan is payable in monthly principal installments of $142 and is due May 11, 2010.
39
THE DIXIE GROUP, INC. NOTES TO CONSOLIDATED FINANCIAL STATEMENTS
(dollars in thousands, except per share data) (Continued)
Interest rates available under the senior loan and security agreement may be selected from a number of options that effectively allow the Company to borrow at rates ranging from the lender's prime rate to the lender's prime rate plus 0.50% for base rate loans, or at rates ranging from LIBOR plus 1.00% to LIBOR plus 2.75% for LIBOR loans. The weighted-average interest rate on borrowings outstanding under this agreement was 6.68% at December 29, 2007 and 6.99% at December 30, 2006. Commitment fees ranging from 0.25% to 0.375% per annum are payable on the average daily unused balance of the revolving credit facility. The interest rate on a portion of borrowings under the senior loan and security agreement is fixed by an interest rate swap arrangement that effectively sets the interest rate on $30,000 of borrowings under the senior loan and security agreement at 4.79% plus the applicable credit spreads. The levels of the Company's accounts receivable and inventory limit borrowing availability under the revolving credit facility. The facility is secured by a first priority lien on substantially all of the Company's assets. The Company's credit facilities do not contain ongoing financial covenants and permit payment of dividends and repurchases of the Company's Common Stock in an aggregate annual amount of up to $3,000 and distributions in excess of $3,000 annually under conditions specified in the agreement. The agreement also contains flexible provisions that may permit payment of an additional $10,000 of dividends or repurchases of the Company's Common Stock prior to December 31, 2008. The agreement also contains covenants that could limit future acquisitions. Unused borrowing capacity under the senior loan and security agreement on December 29, 2007 was $27,697. The Company's equipment financing notes have terms ranging from five to seven years, are secured by the specific equipment financed, bear interest ranging from 5.55% to 6.94% and are due in monthly installments of principal and interest of $311 through February 2010 and monthly installments of principal and interest ranging from $263 to $38 from March 2010 through May 2014. The notes do not contain financial covenants. The Company's capitalized lease obligations have terms ranging from five to six years, are secured by the specific equipment leased, bear interest at rates ranging from 5.93% to 7.27% and are due in monthly installments of principal and interest of $135 through January 2010, monthly installments of principal and interest ranging from $110 to $11 from February 2010 through June 2011. One of the lease obligations requires a final installment of $67 in January 2010 and another requires a final installment of $200 in July 2010. The capitalized leases do not contain financial covenants. The Company's $6,538 mortgage is secured by real property, is payable in monthly principal installments ranging from $20 to $28 during the remaining term and matures on March 2013. The mortgage bears interest at LIBOR plus 2.0% and the interest rate is fixed at 6.54% through March 13, 2013 by an interest rate swap. The Company's convertible subordinated debentures bear interest at 7% payable semi-annually, are due in 2012, and are convertible by their holders into shares of the Company's Common Stock at an effective conversion price of $32.20 per share, subject to adjustment under certain circumstances. Mandatory sinking fund payments, which commenced May 15, 1998, retire $2,500 principal amount of the debentures annually and approximately 86% of the debentures prior to maturity. The convertible debentures are subordinated in right of payment to all of the Company's other indebtedness. Interest payments for continuing operations were $6,469 in 2007, $7,152 in 2006, and $5,646 in 2005. Interest capitalized by the Company was $457 in 2007, $243 in 2006, and $151 in 2005.
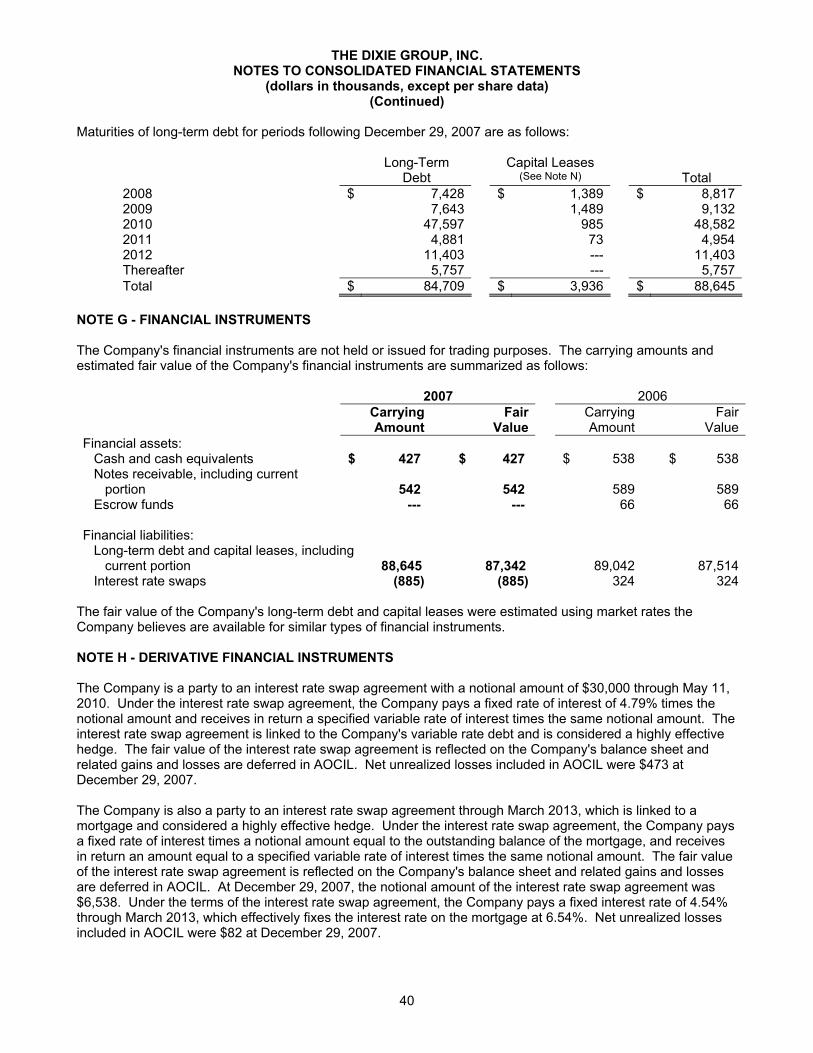
40
THE DIXIE GROUP, INC. NOTES TO CONSOLIDATED FINANCIAL STATEMENTS
(dollars in thousands, except per share data) (Continued)
Maturities of long-term debt for periods following December 29, 2007 are as follows:
Capital Leases Long-Term Debt (See Note N) Total
2008 $ 7,428 $ 1,389 $ 8,817 2009 7,643 1,489 9,132 2010 47,597 985 48,582 2011 4,881 73 4,954 2012 11,403 --- 11,403 Thereafter 5,757 --- 5,757 Total $ 84,709 $ 3,936 $ 88,645
NOTE G - FINANCIAL INSTRUMENTS The Company's financial instruments are not held or issued for trading purposes. The carrying amounts and estimated fair value of the Company's financial instruments are summarized as follows: 2007 2006
CarryingAmount
FairValue
Carrying Amount
FairValue
Financial assets: Cash and cash equivalents $ 427 $ 427 $ 538 $ 538 Notes receivable, including current portion 542 542 589 589 Escrow funds --- --- 66 66
Financial liabilities: Long-term debt and capital leases, including current portion 88,645 87,342 89,042 87,514 Interest rate swaps (885) (885) 324 324
The fair value of the Company's long-term debt and capital leases were estimated using market rates the Company believes are available for similar types of financial instruments. NOTE H - DERIVATIVE FINANCIAL INSTRUMENTS The Company is a party to an interest rate swap agreement with a notional amount of $30,000 through May 11, 2010. Under the interest rate swap agreement, the Company pays a fixed rate of interest of 4.79% times the notional amount and receives in return a specified variable rate of interest times the same notional amount. The interest rate swap agreement is linked to the Company's variable rate debt and is considered a highly effective hedge. The fair value of the interest rate swap agreement is reflected on the Company's balance sheet and related gains and losses are deferred in AOCIL. Net unrealized losses included in AOCIL were $473 at December 29, 2007. The Company is also a party to an interest rate swap agreement through March 2013, which is linked to a mortgage and considered a highly effective hedge. Under the interest rate swap agreement, the Company pays a fixed rate of interest times a notional amount equal to the outstanding balance of the mortgage, and receives in return an amount equal to a specified variable rate of interest times the same notional amount. The fair value of the interest rate swap agreement is reflected on the Company's balance sheet and related gains and losses are deferred in AOCIL. At December 29, 2007, the notional amount of the interest rate swap agreement was $6,538. Under the terms of the interest rate swap agreement, the Company pays a fixed interest rate of 4.54% through March 2013, which effectively fixes the interest rate on the mortgage at 6.54%. Net unrealized losses included in AOCIL were $82 at December 29, 2007.
41
THE DIXIE GROUP, INC. NOTES TO CONSOLIDATED FINANCIAL STATEMENTS
(dollars in thousands, except per share data) (Continued)
The Company was a party to an interest rate swap agreement which expired March 11, 2005. Under the interest rate swap agreement, the Company paid a fixed rate of interest of 3.24% times a notional amount of $70,000, and received in return an amount equal to a specified variable rate of interest times the same notional amount. The interest rate swap agreement was considered highly effective as a cash flow hedge by the Company until a significant portion of the related debt was retired in 2003. At the time the interest rate swap agreement became ineffective, the Company recorded as interest expense the portion of AOCIL related to the debt retired. Subsequent changes in the fair value of the interest rate swap agreement were marked to market through interest expense. Amounts that remained in AOCIL at the time of the interest rate swap agreement became ineffective were amortized into earnings through interest expense over the remaining life of the interest rate swap agreement. During 2005, the Company reduced earnings by approximately $52, net of taxes, to amortize the unrealized loss in AOCIL related to the interest rate swap agreement. NOTE I - EMPLOYEE BENEFIT PLANS The Company sponsors a 401(k) defined contribution plan covering substantially all associates. The Company matches participants' contributions, on a sliding scale, up to a maximum of 5% of the participant's earnings. The Company may make additional contributions to the plan if the Company attains certain performance targets. The Company sponsors a non-qualified retirement savings plan that allows eligible associates to defer a specified percentage of their compensation. The obligations owed to participants under this plan were $12,709 at December 29, 2007 and $11,704 at December 30, 2006 and are included in Other Liabilities in the Company's consolidated balance sheets. The obligations are unsecured general obligations of the Company and the participants have no right, interest or claim in the assets of the Company, except as unsecured general creditors. The Company utilizes a Rabbi Trust to hold, invest and reinvest deferrals and contributions under the plan. Assets invested in cash and company-owned life insurance in the Rabbi Trust were $12,777 at December 29, 2007 and $11,673 at December 30, 2006 and are included in cash and cash equivalents and other long-term assets in the Company's consolidated balance sheets. On December 29, 2007, the Company merged its only remaining defined benefit pension plan into a multi-employer pension plan. As a result of the merger, the Company ceased to be a plan sponsor and will become a contributing employer in the multi-employer pension plan. Expenses related to the merger were $1,518, or $1,023 net of tax, and the Company contributed $205 in January 2008 to complete the Company's funding obligations for the defined benefit pension plan. Substantially all of the expenses were non-cash and principally consisted of previously unrecognized actuarial losses. During June 2006, the Company terminated a defined benefit retirement plan and distributed the plan's assets to its participants. The plan had been frozen as to new benefits since 1993. The majority of participants covered by this plan had been employed by operations that were previously sold or discontinued. Settlement expenses for the plan termination recognized in 2006 were $3,249, or $2,057 net of tax. The funds required to terminate the plan were $2,595. The Company sponsors a legacy postretirement benefit plan that provides life insurance to a limited number of associates as a result of a prior acquisition. The Company also sponsors a postretirement benefit plan that provides medical and life insurance for a limited number of associates who retired prior to January 1, 2003. During 2006, the Company adopted the provisions of Financial Accounting Standards No. 158, "Employers' Accounting for Defined Benefit Pension and Other Postretirement Plans - an amendment of FASB Statement Nos. 87, 88, 106 and 132(R)".
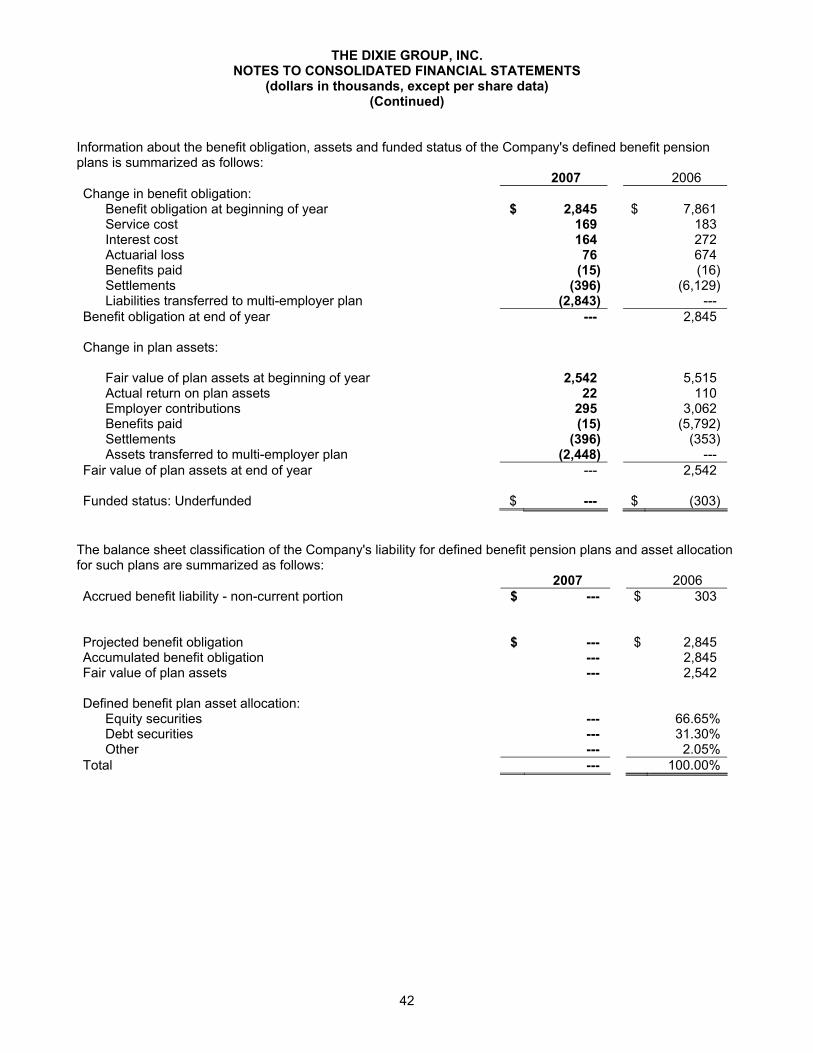
42
THE DIXIE GROUP, INC. NOTES TO CONSOLIDATED FINANCIAL STATEMENTS
(dollars in thousands, except per share data) (Continued)
Information about the benefit obligation, assets and funded status of the Company's defined benefit pension plans is summarized as follows: 2007 2006 Change in benefit obligation:
Benefit obligation at beginning of year $ 2,845 $ 7,861 Service cost 169 183 Interest cost 164 272 Actuarial loss 76 674 Benefits paid (15) (16) Settlements (396) (6,129) Liabilities transferred to multi-employer plan (2,843) ---
Benefit obligation at end of year --- 2,845
Change in plan assets:
Fair value of plan assets at beginning of year 2,542 5,515 Actual return on plan assets 22 110 Employer contributions 295 3,062 Benefits paid (15) (5,792) Settlements (396) (353) Assets transferred to multi-employer plan (2,448) ---
Fair value of plan assets at end of year --- 2,542
Funded status: Underfunded $ --- $ (303) The balance sheet classification of the Company's liability for defined benefit pension plans and asset allocation for such plans are summarized as follows:
2007 2006 Accrued benefit liability - non-current portion $ --- $ 303
Projected benefit obligation $ --- $ 2,845 Accumulated benefit obligation --- 2,845 Fair value of plan assets --- 2,542
Defined benefit plan asset allocation:
Equity securities --- 66.65% Debt securities --- 31.30% Other --- 2.05%
Total --- 100.00%
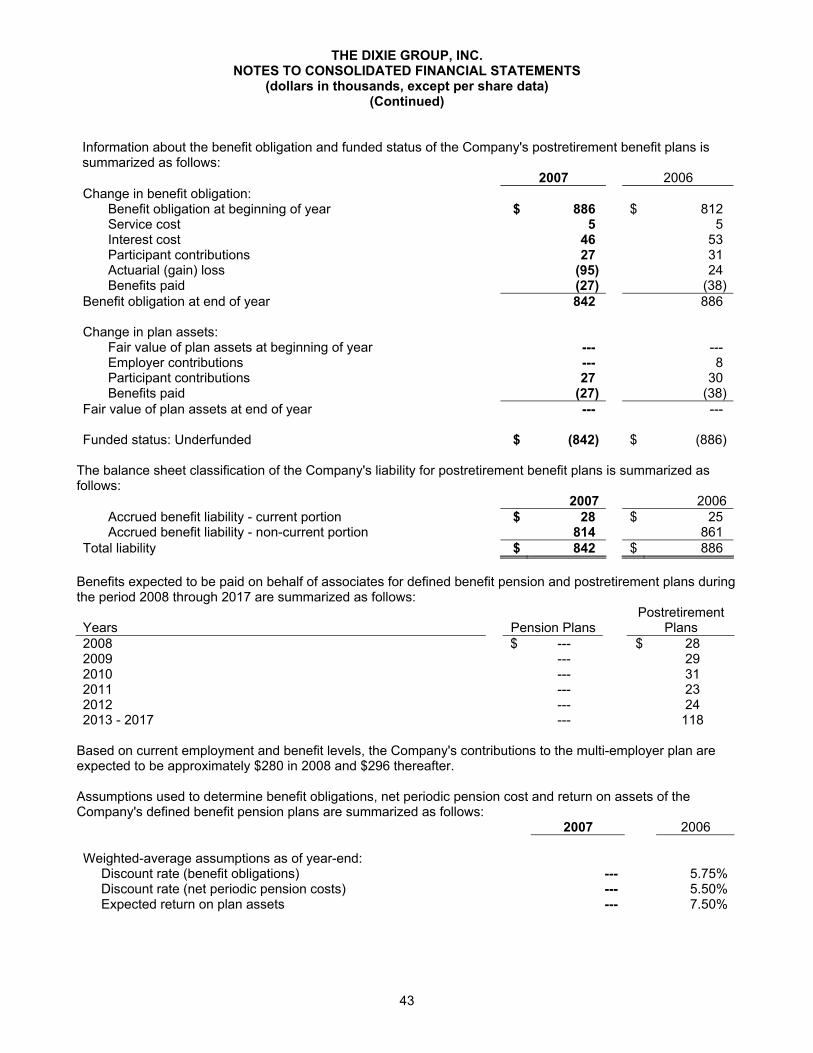
43
THE DIXIE GROUP, INC. NOTES TO CONSOLIDATED FINANCIAL STATEMENTS
(dollars in thousands, except per share data) (Continued)
Information about the benefit obligation and funded status of the Company's postretirement benefit plans is summarized as follows: 2007 2006 Change in benefit obligation:
Benefit obligation at beginning of year $ 886 $ 812 Service cost 5 5 Interest cost 46 53 Participant contributions 27 31 Actuarial (gain) loss (95) 24 Benefits paid (27) (38)
Benefit obligation at end of year 842 886
Change in plan assets: Fair value of plan assets at beginning of year --- --- Employer contributions --- 8 Participant contributions 27 30 Benefits paid (27) (38)
Fair value of plan assets at end of year --- ---
Funded status: Underfunded $ (842) $ (886) The balance sheet classification of the Company's liability for postretirement benefit plans is summarized as follows:
2007 2006 Accrued benefit liability - current portion $ 28 $ 25 Accrued benefit liability - non-current portion 814 861 Total liability $ 842 $ 886
Benefits expected to be paid on behalf of associates for defined benefit pension and postretirement plans during the period 2008 through 2017 are summarized as follows:
Years Pension Plans Postretirement
Plans 2008 $ --- $ 28 2009 --- 29 2010 --- 31 2011 --- 23 2012 --- 24 2013 - 2017 --- 118
Based on current employment and benefit levels, the Company's contributions to the multi-employer plan are expected to be approximately $280 in 2008 and $296 thereafter. Assumptions used to determine benefit obligations, net periodic pension cost and return on assets of the Company's defined benefit pension plans are summarized as follows: 2007 2006
Weighted-average assumptions as of year-end: Discount rate (benefit obligations) --- 5.75% Discount rate (net periodic pension costs) --- 5.50% Expected return on plan assets --- 7.50%
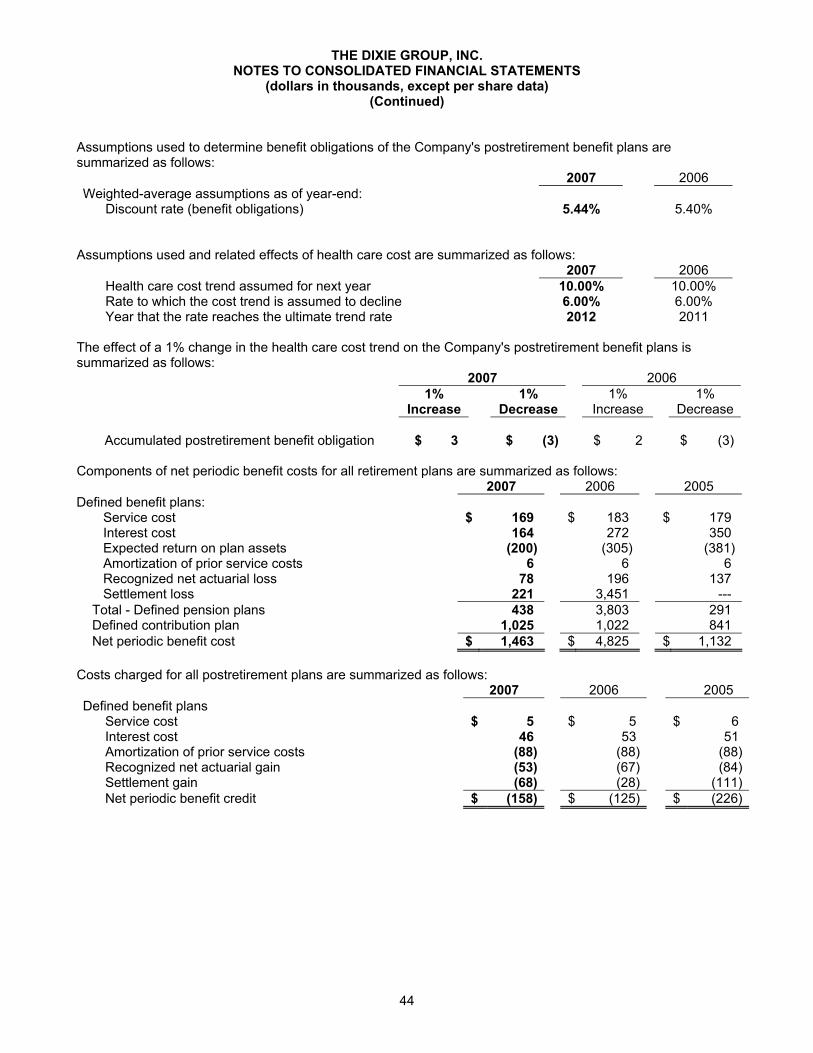
44
THE DIXIE GROUP, INC. NOTES TO CONSOLIDATED FINANCIAL STATEMENTS
(dollars in thousands, except per share data) (Continued)
Assumptions used to determine benefit obligations of the Company's postretirement benefit plans are summarized as follows:
2007 2006 Weighted-average assumptions as of year-end:
Discount rate (benefit obligations) 5.44% 5.40%
Assumptions used and related effects of health care cost are summarized as follows:
2007 2006 Health care cost trend assumed for next year 10.00% 10.00%
Rate to which the cost trend is assumed to decline 6.00% 6.00% Year that the rate reaches the ultimate trend rate 2012 2011
The effect of a 1% change in the health care cost trend on the Company's postretirement benefit plans is summarized as follows: 2007 2006
1%
Increase 1%
Decrease 1%
Increase 1%
Decrease Accumulated postretirement benefit obligation $ 3 $ (3) $ 2 $ (3) Components of net periodic benefit costs for all retirement plans are summarized as follows: 2007 2006 2005 Defined benefit plans: Service cost $ 169 $ 183 $ 179 Interest cost 164 272 350 Expected return on plan assets (200) (305) (381) Amortization of prior service costs 6 6 6 Recognized net actuarial loss 78 196 137 Settlement loss 221 3,451 --- Total - Defined pension plans 438 3,803 291 Defined contribution plan 1,025 1,022 841 Net periodic benefit cost $ 1,463 $ 4,825 $ 1,132 Costs charged for all postretirement plans are summarized as follows:
2007 2006 2005 Defined benefit plans
Service cost $ 5 $ 5 $ 6 Interest cost 46 53 51 Amortization of prior service costs (88) (88) (88) Recognized net actuarial gain (53) (67) (84) Settlement gain (68) (28) (111) Net periodic benefit credit $ (158) $ (125) $ (226)
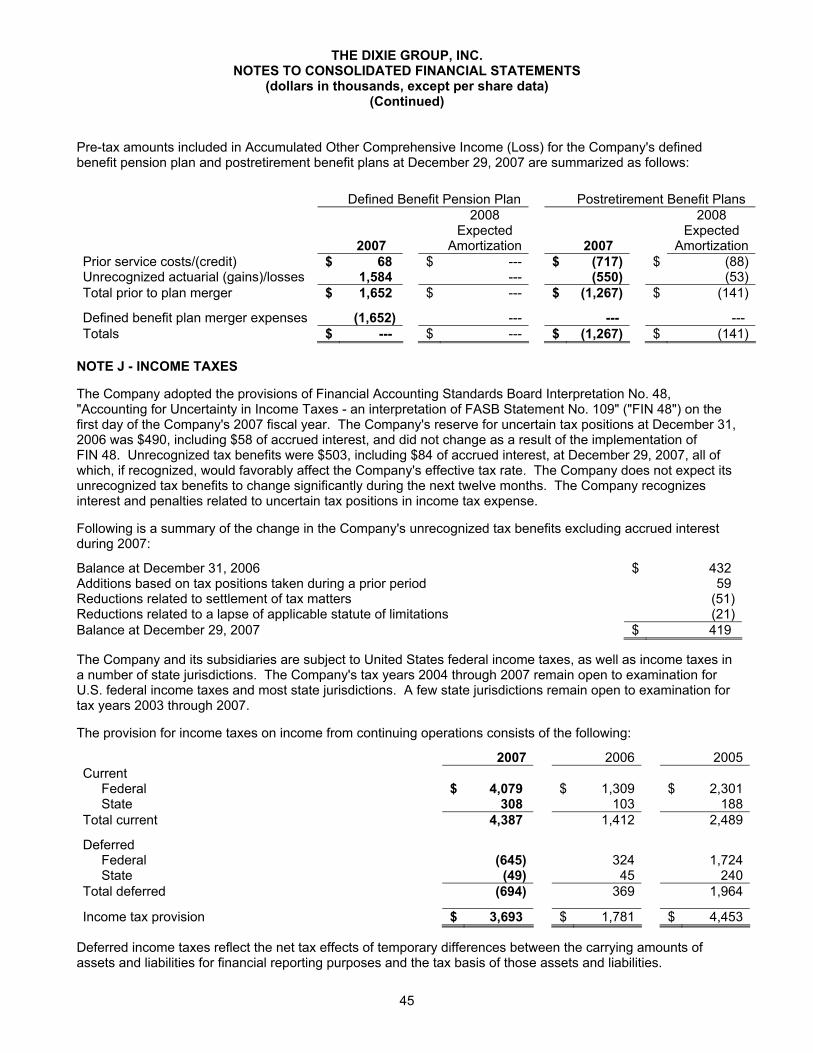
45
THE DIXIE GROUP, INC. NOTES TO CONSOLIDATED FINANCIAL STATEMENTS
(dollars in thousands, except per share data) (Continued)
Pre-tax amounts included in Accumulated Other Comprehensive Income (Loss) for the Company's defined benefit pension plan and postretirement benefit plans at December 29, 2007 are summarized as follows:
Defined Benefit Pension Plan Postretirement Benefit Plans
2007
2008 Expected
Amortization 2007
2008 Expected
AmortizationPrior service costs/(credit) $ 68 $ --- $ (717) $ (88)Unrecognized actuarial (gains)/losses 1,584 --- (550) (53)Total prior to plan merger $ 1,652 $ --- $ (1,267) $ (141)
Defined benefit plan merger expenses (1,652) --- --- --- Totals $ --- $ --- $ (1,267) $ (141)
NOTE J - INCOME TAXES The Company adopted the provisions of Financial Accounting Standards Board Interpretation No. 48, "Accounting for Uncertainty in Income Taxes - an interpretation of FASB Statement No. 109" ("FIN 48") on the first day of the Company's 2007 fiscal year. The Company's reserve for uncertain tax positions at December 31, 2006 was $490, including $58 of accrued interest, and did not change as a result of the implementation of FIN 48. Unrecognized tax benefits were $503, including $84 of accrued interest, at December 29, 2007, all of which, if recognized, would favorably affect the Company's effective tax rate. The Company does not expect its unrecognized tax benefits to change significantly during the next twelve months. The Company recognizes interest and penalties related to uncertain tax positions in income tax expense. Following is a summary of the change in the Company's unrecognized tax benefits excluding accrued interest during 2007:
Balance at December 31, 2006 $ 432 Additions based on tax positions taken during a prior period 59 Reductions related to settlement of tax matters (51)Reductions related to a lapse of applicable statute of limitations (21)Balance at December 29, 2007 $ 419 The Company and its subsidiaries are subject to United States federal income taxes, as well as income taxes in a number of state jurisdictions. The Company's tax years 2004 through 2007 remain open to examination for U.S. federal income taxes and most state jurisdictions. A few state jurisdictions remain open to examination for tax years 2003 through 2007. The provision for income taxes on income from continuing operations consists of the following:
2007 2006 2005Current Federal $ 4,079 $ 1,309 $ 2,301 State 308 103 188
Total current 4,387 1,412 2,489
Deferred Federal (645) 324 1,724 State (49) 45 240
Total deferred (694) 369 1,964
Income tax provision $ 3,693 $ 1,781 $ 4,453 Deferred income taxes reflect the net tax effects of temporary differences between the carrying amounts of assets and liabilities for financial reporting purposes and the tax basis of those assets and liabilities.
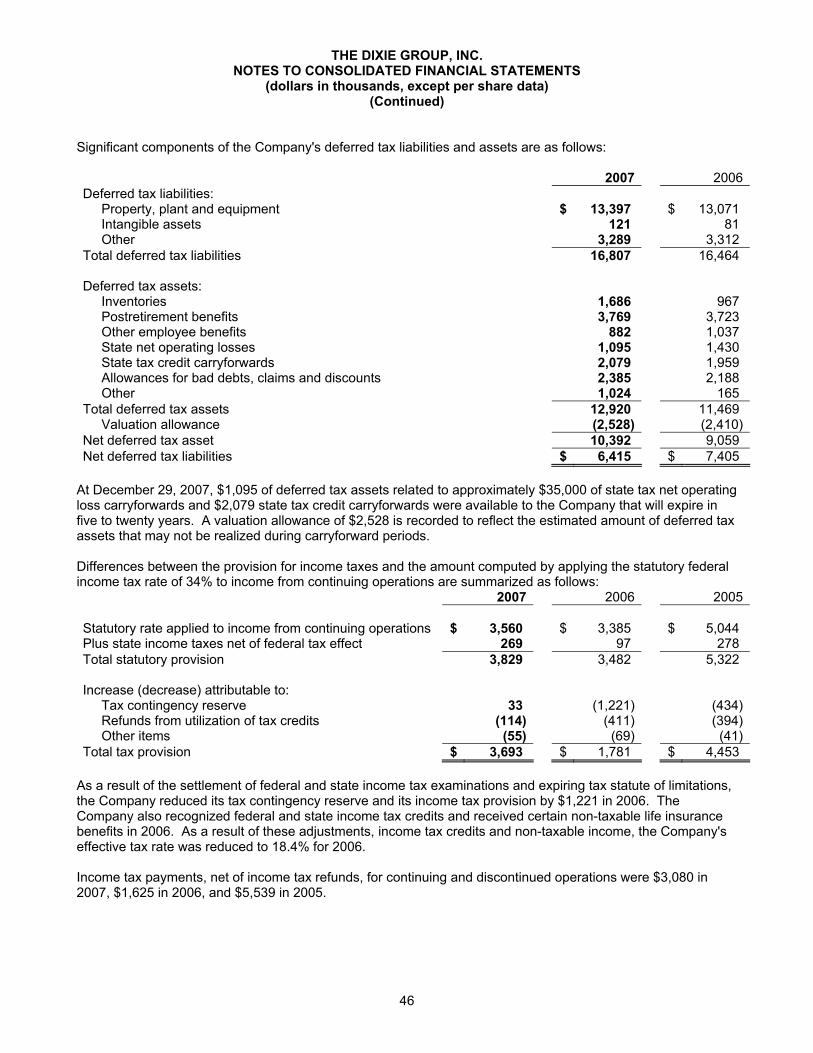
46
THE DIXIE GROUP, INC. NOTES TO CONSOLIDATED FINANCIAL STATEMENTS
(dollars in thousands, except per share data) (Continued)
Significant components of the Company's deferred tax liabilities and assets are as follows:
2007 2006Deferred tax liabilities: Property, plant and equipment $ 13,397 $ 13,071 Intangible assets 121 81 Other 3,289 3,312
Total deferred tax liabilities 16,807 16,464
Deferred tax assets: Inventories 1,686 967 Postretirement benefits 3,769 3,723 Other employee benefits 882 1,037 State net operating losses 1,095 1,430 State tax credit carryforwards 2,079 1,959 Allowances for bad debts, claims and discounts 2,385 2,188 Other 1,024 165
Total deferred tax assets 12,920 11,469 Valuation allowance (2,528) (2,410)
Net deferred tax asset 10,392 9,059 Net deferred tax liabilities $ 6,415 $ 7,405
At December 29, 2007, $1,095 of deferred tax assets related to approximately $35,000 of state tax net operating loss carryforwards and $2,079 state tax credit carryforwards were available to the Company that will expire in five to twenty years. A valuation allowance of $2,528 is recorded to reflect the estimated amount of deferred tax assets that may not be realized during carryforward periods. Differences between the provision for income taxes and the amount computed by applying the statutory federal income tax rate of 34% to income from continuing operations are summarized as follows:
2007 2006 2005 Statutory rate applied to income from continuing operations $ 3,560 $ 3,385 $ 5,044 Plus state income taxes net of federal tax effect 269 97 278 Total statutory provision 3,829 3,482 5,322
Increase (decrease) attributable to: Tax contingency reserve 33 (1,221) (434) Refunds from utilization of tax credits (114) (411) (394) Other items (55) (69) (41)
Total tax provision $ 3,693 $ 1,781 $ 4,453 As a result of the settlement of federal and state income tax examinations and expiring tax statute of limitations, the Company reduced its tax contingency reserve and its income tax provision by $1,221 in 2006. The Company also recognized federal and state income tax credits and received certain non-taxable life insurance benefits in 2006. As a result of these adjustments, income tax credits and non-taxable income, the Company's effective tax rate was reduced to 18.4% for 2006. Income tax payments, net of income tax refunds, for continuing and discontinued operations were $3,080 in 2007, $1,625 in 2006, and $5,539 in 2005.
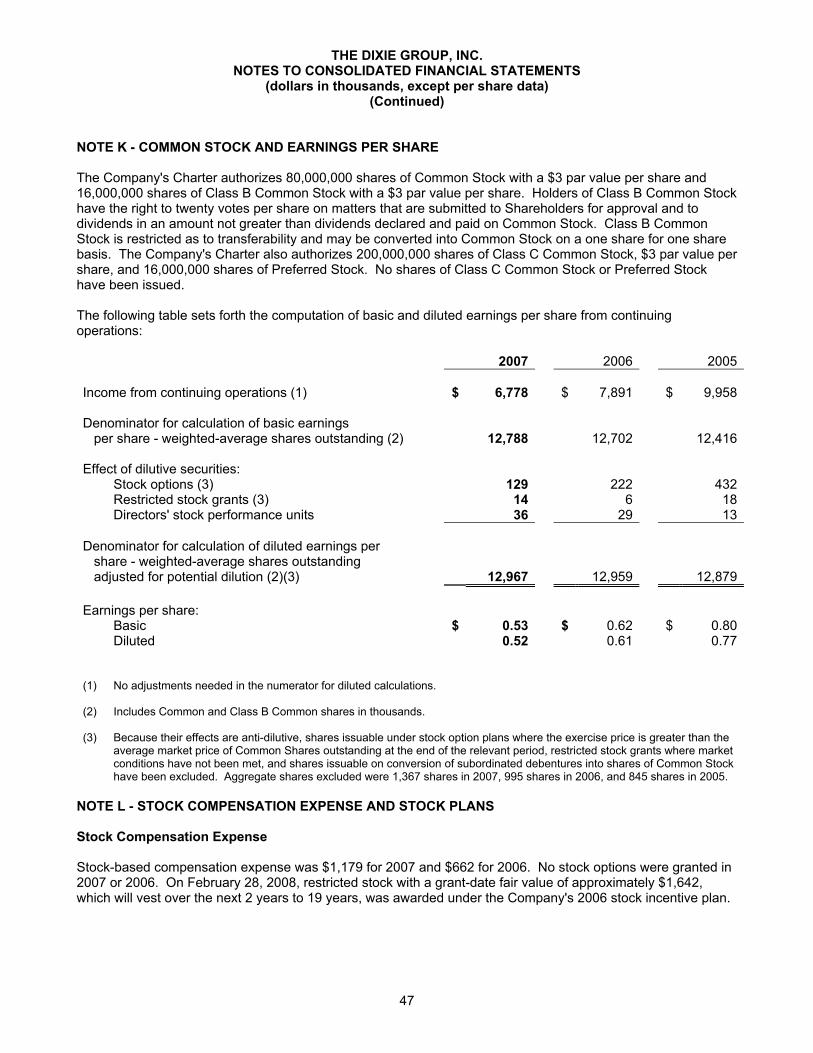
47
THE DIXIE GROUP, INC. NOTES TO CONSOLIDATED FINANCIAL STATEMENTS
(dollars in thousands, except per share data) (Continued)
NOTE K - COMMON STOCK AND EARNINGS PER SHARE The Company's Charter authorizes 80,000,000 shares of Common Stock with a $3 par value per share and 16,000,000 shares of Class B Common Stock with a $3 par value per share. Holders of Class B Common Stock have the right to twenty votes per share on matters that are submitted to Shareholders for approval and to dividends in an amount not greater than dividends declared and paid on Common Stock. Class B Common Stock is restricted as to transferability and may be converted into Common Stock on a one share for one share basis. The Company's Charter also authorizes 200,000,000 shares of Class C Common Stock, $3 par value per share, and 16,000,000 shares of Preferred Stock. No shares of Class C Common Stock or Preferred Stock have been issued. The following table sets forth the computation of basic and diluted earnings per share from continuing operations:
2007 2006 2005
Income from continuing operations (1) $ 6,778 $ 7,891 $ 9,958
Denominator for calculation of basic earnings per share - weighted-average shares outstanding (2) 12,788 12,702 12,416
Effect of dilutive securities:
Stock options (3) 129 222 432 Restricted stock grants (3) 14 6 18 Directors' stock performance units 36 29 13
Denominator for calculation of diluted earnings per share - weighted-average shares outstanding adjusted for potential dilution (2)(3) 12,967 12,959 12,879
Earnings per share:
Basic $ 0.53 $ 0.62 $ 0.80 Diluted 0.52 0.61 0.77
(1) No adjustments needed in the numerator for diluted calculations.
(2) Includes Common and Class B Common shares in thousands.
(3) Because their effects are anti-dilutive, shares issuable under stock option plans where the exercise price is greater than the average market price of Common Shares outstanding at the end of the relevant period, restricted stock grants where market conditions have not been met, and shares issuable on conversion of subordinated debentures into shares of Common Stock have been excluded. Aggregate shares excluded were 1,367 shares in 2007, 995 shares in 2006, and 845 shares in 2005.
NOTE L - STOCK COMPENSATION EXPENSE AND STOCK PLANS Stock Compensation Expense Stock-based compensation expense was $1,179 for 2007 and $662 for 2006. No stock options were granted in 2007 or 2006. On February 28, 2008, restricted stock with a grant-date fair value of approximately $1,642, which will vest over the next 2 years to 19 years, was awarded under the Company's 2006 stock incentive plan.
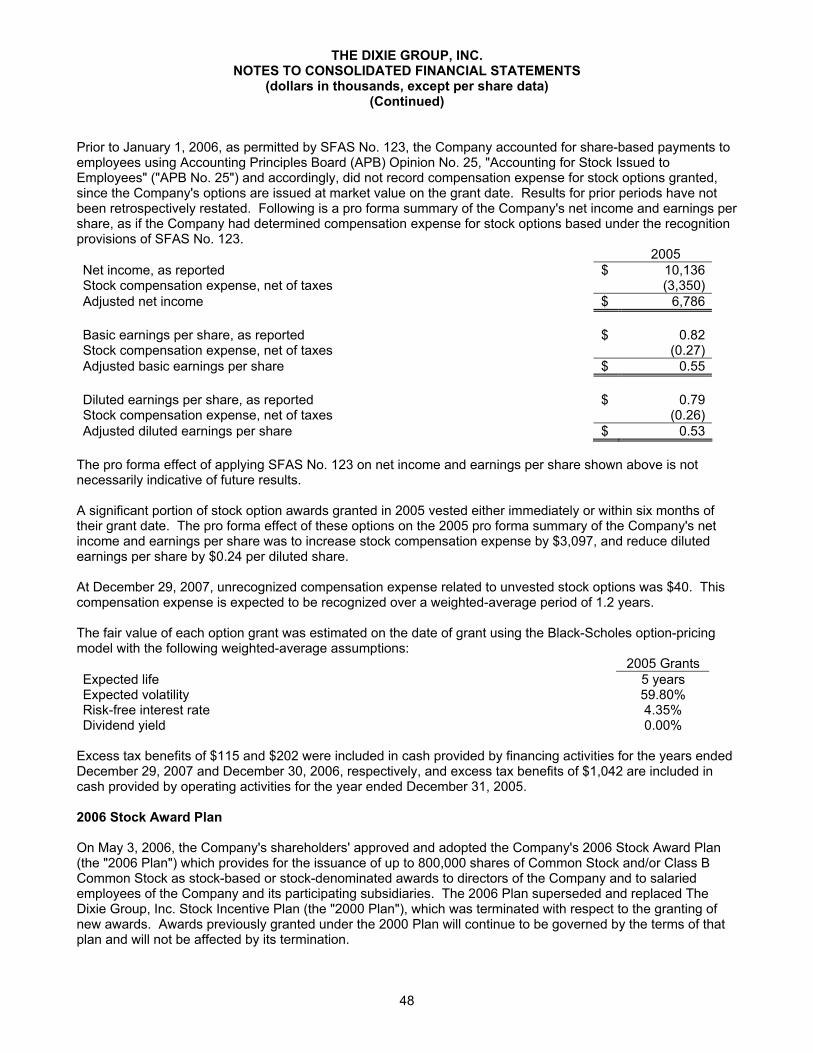
48
THE DIXIE GROUP, INC. NOTES TO CONSOLIDATED FINANCIAL STATEMENTS
(dollars in thousands, except per share data) (Continued)
Prior to January 1, 2006, as permitted by SFAS No. 123, the Company accounted for share-based payments to employees using Accounting Principles Board (APB) Opinion No. 25, "Accounting for Stock Issued to Employees" ("APB No. 25") and accordingly, did not record compensation expense for stock options granted, since the Company's options are issued at market value on the grant date. Results for prior periods have not been retrospectively restated. Following is a pro forma summary of the Company's net income and earnings per share, as if the Company had determined compensation expense for stock options based under the recognition provisions of SFAS No. 123. 2005 Net income, as reported $ 10,136 Stock compensation expense, net of taxes (3,350)Adjusted net income $ 6,786
Basic earnings per share, as reported $ 0.82 Stock compensation expense, net of taxes (0.27)Adjusted basic earnings per share $ 0.55
Diluted earnings per share, as reported $ 0.79 Stock compensation expense, net of taxes (0.26)Adjusted diluted earnings per share $ 0.53
The pro forma effect of applying SFAS No. 123 on net income and earnings per share shown above is not necessarily indicative of future results. A significant portion of stock option awards granted in 2005 vested either immediately or within six months of their grant date. The pro forma effect of these options on the 2005 pro forma summary of the Company's net income and earnings per share was to increase stock compensation expense by $3,097, and reduce diluted earnings per share by $0.24 per diluted share. At December 29, 2007, unrecognized compensation expense related to unvested stock options was $40. This compensation expense is expected to be recognized over a weighted-average period of 1.2 years. The fair value of each option grant was estimated on the date of grant using the Black-Scholes option-pricing model with the following weighted-average assumptions:
2005 Grants Expected life 5 years Expected volatility 59.80% Risk-free interest rate 4.35% Dividend yield 0.00%
Excess tax benefits of $115 and $202 were included in cash provided by financing activities for the years ended December 29, 2007 and December 30, 2006, respectively, and excess tax benefits of $1,042 are included in cash provided by operating activities for the year ended December 31, 2005. 2006 Stock Award Plan On May 3, 2006, the Company's shareholders' approved and adopted the Company's 2006 Stock Award Plan (the "2006 Plan") which provides for the issuance of up to 800,000 shares of Common Stock and/or Class B Common Stock as stock-based or stock-denominated awards to directors of the Company and to salaried employees of the Company and its participating subsidiaries. The 2006 Plan superseded and replaced The Dixie Group, Inc. Stock Incentive Plan (the "2000 Plan"), which was terminated with respect to the granting of new awards. Awards previously granted under the 2000 Plan will continue to be governed by the terms of that plan and will not be affected by its termination.
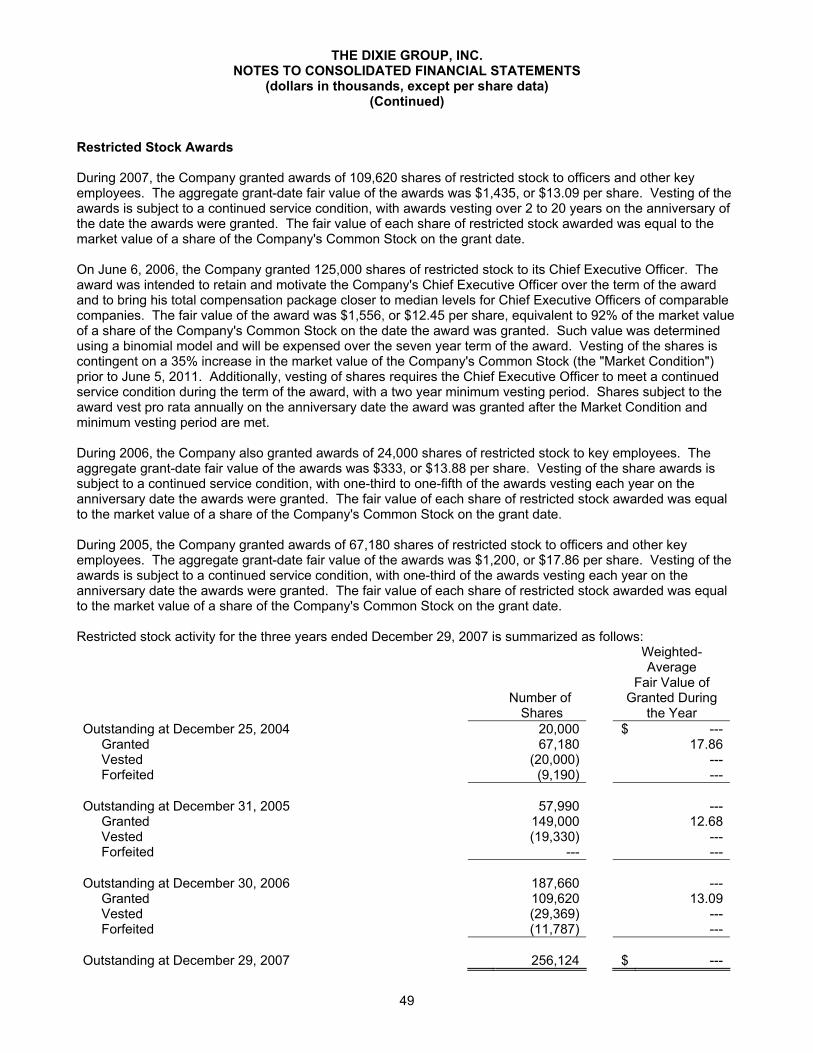
49
THE DIXIE GROUP, INC. NOTES TO CONSOLIDATED FINANCIAL STATEMENTS
(dollars in thousands, except per share data) (Continued)
Restricted Stock Awards During 2007, the Company granted awards of 109,620 shares of restricted stock to officers and other key employees. The aggregate grant-date fair value of the awards was $1,435, or $13.09 per share. Vesting of the awards is subject to a continued service condition, with awards vesting over 2 to 20 years on the anniversary of the date the awards were granted. The fair value of each share of restricted stock awarded was equal to the market value of a share of the Company's Common Stock on the grant date. On June 6, 2006, the Company granted 125,000 shares of restricted stock to its Chief Executive Officer. The award was intended to retain and motivate the Company's Chief Executive Officer over the term of the award and to bring his total compensation package closer to median levels for Chief Executive Officers of comparable companies. The fair value of the award was $1,556, or $12.45 per share, equivalent to 92% of the market value of a share of the Company's Common Stock on the date the award was granted. Such value was determined using a binomial model and will be expensed over the seven year term of the award. Vesting of the shares is contingent on a 35% increase in the market value of the Company's Common Stock (the "Market Condition") prior to June 5, 2011. Additionally, vesting of shares requires the Chief Executive Officer to meet a continued service condition during the term of the award, with a two year minimum vesting period. Shares subject to the award vest pro rata annually on the anniversary date the award was granted after the Market Condition and minimum vesting period are met. During 2006, the Company also granted awards of 24,000 shares of restricted stock to key employees. The aggregate grant-date fair value of the awards was $333, or $13.88 per share. Vesting of the share awards is subject to a continued service condition, with one-third to one-fifth of the awards vesting each year on the anniversary date the awards were granted. The fair value of each share of restricted stock awarded was equal to the market value of a share of the Company's Common Stock on the grant date. During 2005, the Company granted awards of 67,180 shares of restricted stock to officers and other key employees. The aggregate grant-date fair value of the awards was $1,200, or $17.86 per share. Vesting of the awards is subject to a continued service condition, with one-third of the awards vesting each year on the anniversary date the awards were granted. The fair value of each share of restricted stock awarded was equal to the market value of a share of the Company's Common Stock on the grant date. Restricted stock activity for the three years ended December 29, 2007 is summarized as follows:
Number of
Shares
Weighted- Average
Fair Value of Granted During
the Year Outstanding at December 25, 2004 20,000 $ --- Granted 67,180 17.86 Vested (20,000) --- Forfeited (9,190) --- Outstanding at December 31, 2005 57,990 --- Granted 149,000 12.68 Vested (19,330) --- Forfeited --- --- Outstanding at December 30, 2006 187,660 --- Granted 109,620 13.09 Vested (29,369) --- Forfeited (11,787) --- Outstanding at December 29, 2007 256,124 $ ---
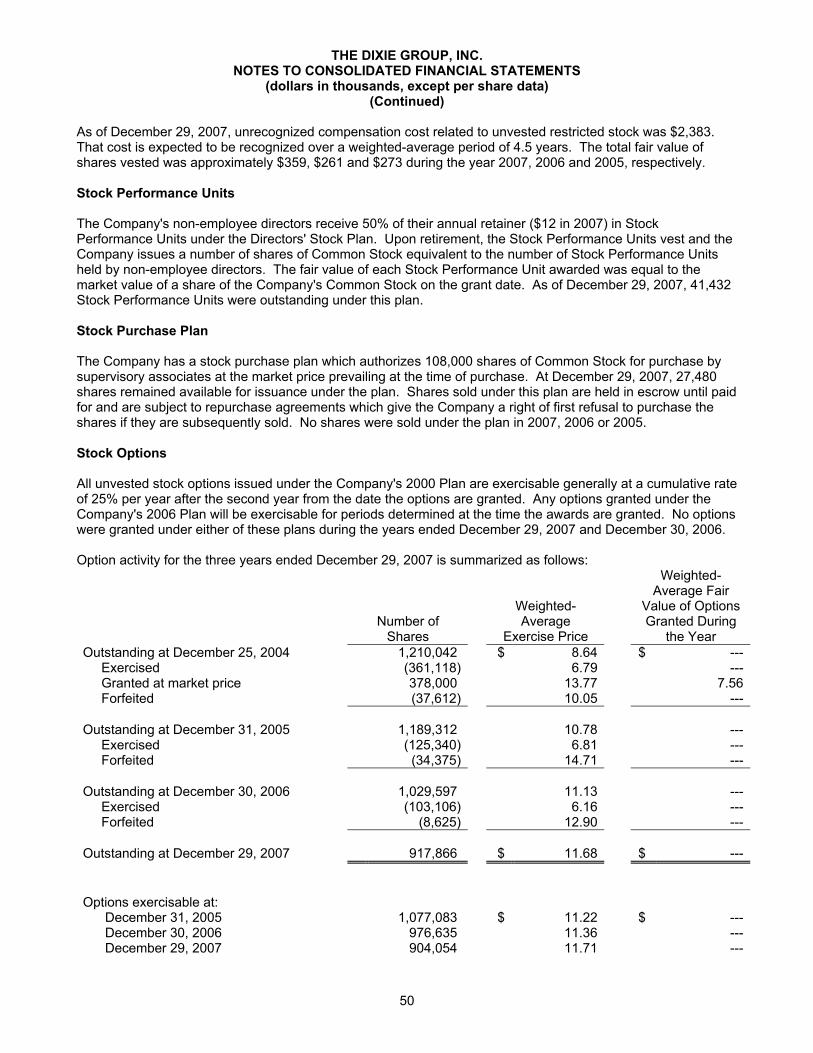
50
THE DIXIE GROUP, INC. NOTES TO CONSOLIDATED FINANCIAL STATEMENTS
(dollars in thousands, except per share data) (Continued)
As of December 29, 2007, unrecognized compensation cost related to unvested restricted stock was $2,383. That cost is expected to be recognized over a weighted-average period of 4.5 years. The total fair value of shares vested was approximately $359, $261 and $273 during the year 2007, 2006 and 2005, respectively. Stock Performance Units The Company's non-employee directors receive 50% of their annual retainer ($12 in 2007) in Stock Performance Units under the Directors' Stock Plan. Upon retirement, the Stock Performance Units vest and the Company issues a number of shares of Common Stock equivalent to the number of Stock Performance Units held by non-employee directors. The fair value of each Stock Performance Unit awarded was equal to the market value of a share of the Company's Common Stock on the grant date. As of December 29, 2007, 41,432 Stock Performance Units were outstanding under this plan. Stock Purchase Plan The Company has a stock purchase plan which authorizes 108,000 shares of Common Stock for purchase by supervisory associates at the market price prevailing at the time of purchase. At December 29, 2007, 27,480 shares remained available for issuance under the plan. Shares sold under this plan are held in escrow until paid for and are subject to repurchase agreements which give the Company a right of first refusal to purchase the shares if they are subsequently sold. No shares were sold under the plan in 2007, 2006 or 2005. Stock Options All unvested stock options issued under the Company's 2000 Plan are exercisable generally at a cumulative rate of 25% per year after the second year from the date the options are granted. Any options granted under the Company's 2006 Plan will be exercisable for periods determined at the time the awards are granted. No options were granted under either of these plans during the years ended December 29, 2007 and December 30, 2006. Option activity for the three years ended December 29, 2007 is summarized as follows:
Number of
Shares
Weighted- Average
Exercise Price
Weighted- Average Fair
Value of OptionsGranted During
the Year Outstanding at December 25, 2004 1,210,042 $ 8.64 $ --- Exercised (361,118) 6.79 --- Granted at market price 378,000 13.77 7.56 Forfeited (37,612) 10.05 ---
Outstanding at December 31, 2005 1,189,312 10.78 --- Exercised (125,340) 6.81 --- Forfeited (34,375) 14.71 ---
Outstanding at December 30, 2006 1,029,597 11.13 --- Exercised (103,106) 6.16 --- Forfeited (8,625) 12.90 ---
Outstanding at December 29, 2007 917,866 $ 11.68 $ ---
Options exercisable at: December 31, 2005 1,077,083 $ 11.22 $ --- December 30, 2006 976,635 11.36 --- December 29, 2007 904,054 11.71 ---
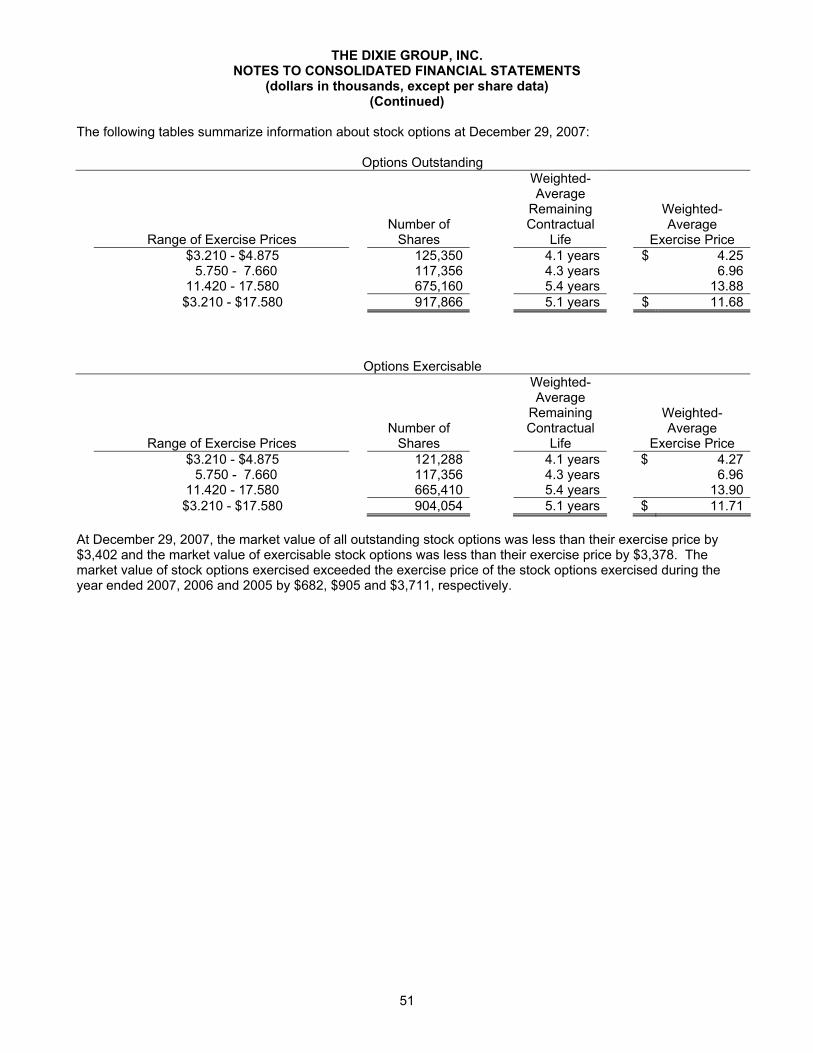
51
THE DIXIE GROUP, INC. NOTES TO CONSOLIDATED FINANCIAL STATEMENTS
(dollars in thousands, except per share data) (Continued)
The following tables summarize information about stock options at December 29, 2007: Options Outstanding
Range of Exercise Prices Number of
Shares
Weighted-Average
Remaining Contractual
Life
Weighted-Average
Exercise Price $3.210 - $4.875 125,350 4.1 years $ 4.25 5.750 - 7.660 117,356 4.3 years 6.96 11.420 - 17.580 675,160 5.4 years 13.88 $3.210 - $17.580 917,866 5.1 years $ 11.68
Options Exercisable
Range of Exercise Prices Number of
Shares
Weighted- Average
Remaining Contractual
Life
Weighted- Average
Exercise Price $3.210 - $4.875 121,288 4.1 years $ 4.27 5.750 - 7.660 117,356 4.3 years 6.96 11.420 - 17.580 665,410 5.4 years 13.90 $3.210 - $17.580 904,054 5.1 years $ 11.71
At December 29, 2007, the market value of all outstanding stock options was less than their exercise price by $3,402 and the market value of exercisable stock options was less than their exercise price by $3,378. The market value of stock options exercised exceeded the exercise price of the stock options exercised during the year ended 2007, 2006 and 2005 by $682, $905 and $3,711, respectively.
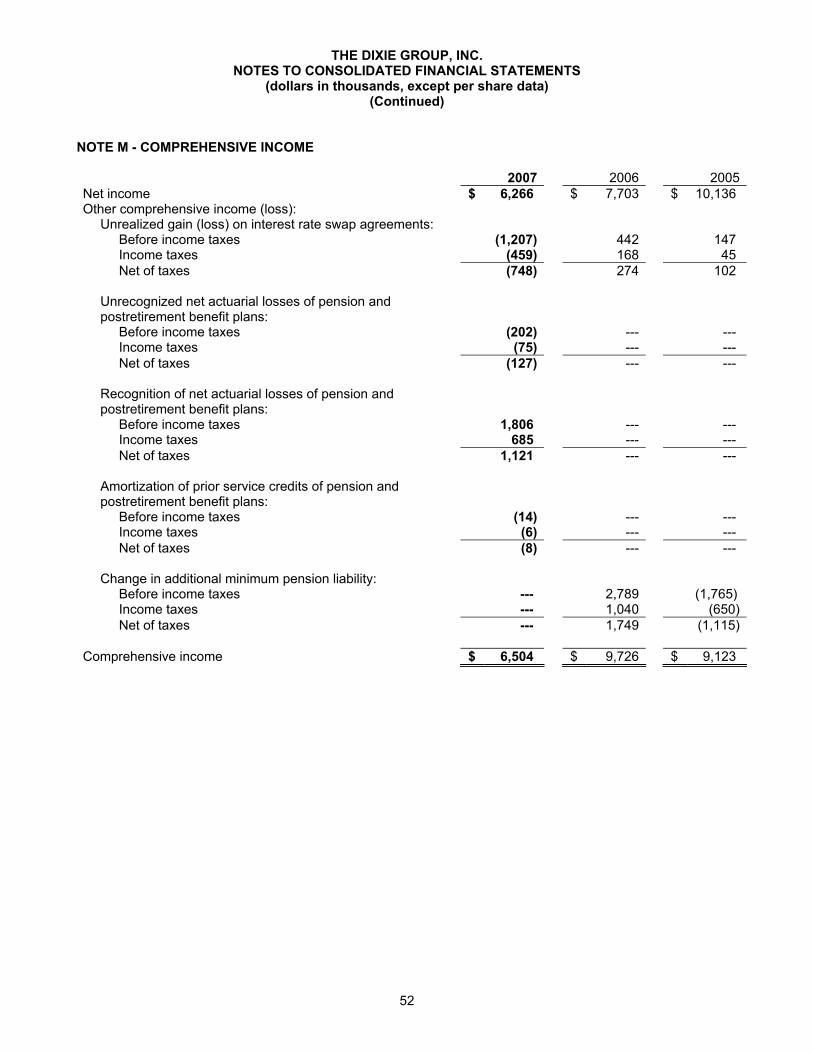
52
THE DIXIE GROUP, INC. NOTES TO CONSOLIDATED FINANCIAL STATEMENTS
(dollars in thousands, except per share data) (Continued)
NOTE M - COMPREHENSIVE INCOME
2007 2006 2005Net income $ 6,266 $ 7,703 $ 10,136 Other comprehensive income (loss):
Unrealized gain (loss) on interest rate swap agreements: Before income taxes (1,207) 442 147 Income taxes (459) 168 45 Net of taxes (748) 274 102
Unrecognized net actuarial losses of pension and postretirement benefit plans:
Before income taxes (202) --- --- Income taxes (75) --- --- Net of taxes (127) --- ---
Recognition of net actuarial losses of pension and postretirement benefit plans:
Before income taxes 1,806 --- --- Income taxes 685 --- --- Net of taxes 1,121 --- ---
Amortization of prior service credits of pension and postretirement benefit plans:
Before income taxes (14) --- --- Income taxes (6) --- --- Net of taxes (8) --- --- Change in additional minimum pension liability: Before income taxes --- 2,789 (1,765) Income taxes --- 1,040 (650) Net of taxes --- 1,749 (1,115) Comprehensive income $ 6,504 $ 9,726 $ 9,123
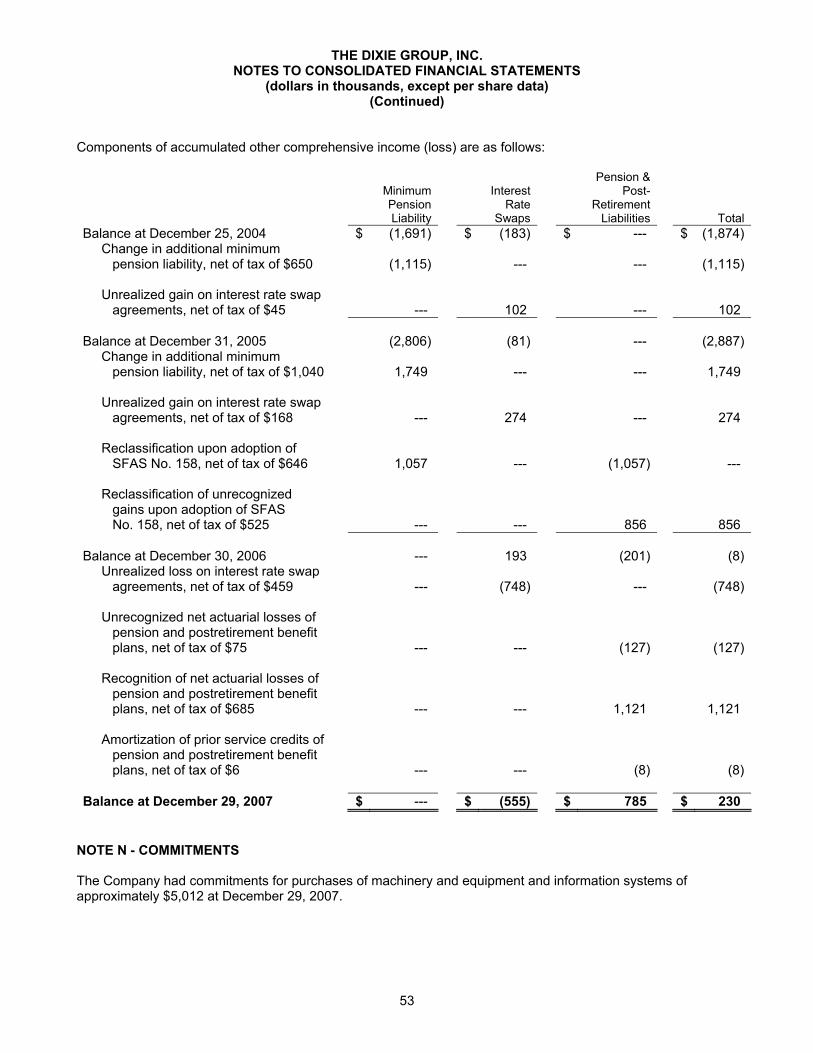
53
THE DIXIE GROUP, INC. NOTES TO CONSOLIDATED FINANCIAL STATEMENTS
(dollars in thousands, except per share data) (Continued)
Components of accumulated other comprehensive income (loss) are as follows:
Minimum Pension Liability
Interest Rate
Swaps
Pension & Post-
Retirement Liabilities Total
Balance at December 25, 2004 $ (1,691) $ (183) $ --- $ (1,874)
Change in additional minimum pension liability, net of tax of $650 (1,115) --- --- (1,115)
Unrealized gain on interest rate swap agreements, net of tax of $45 --- 102 --- 102
Balance at December 31, 2005 (2,806) (81) --- (2,887)
Change in additional minimum pension liability, net of tax of $1,040 1,749 --- --- 1,749
Unrealized gain on interest rate swap agreements, net of tax of $168 --- 274 --- 274
Reclassification upon adoption of SFAS No. 158, net of tax of $646 1,057 --- (1,057) ---
Reclassification of unrecognized gains upon adoption of SFAS No. 158, net of tax of $525 --- --- 856 856
Balance at December 30, 2006 --- 193 (201) (8)
Unrealized loss on interest rate swap agreements, net of tax of $459 --- (748) --- (748)
Unrecognized net actuarial losses of pension and postretirement benefit plans, net of tax of $75 --- --- (127) (127)
Recognition of net actuarial losses of pension and postretirement benefit plans, net of tax of $685 --- --- 1,121 1,121
Amortization of prior service credits of pension and postretirement benefit plans, net of tax of $6 --- --- (8) (8)
Balance at December 29, 2007 $ --- $ (555) $ 785 $ 230
NOTE N - COMMITMENTS The Company had commitments for purchases of machinery and equipment and information systems of approximately $5,012 at December 29, 2007.
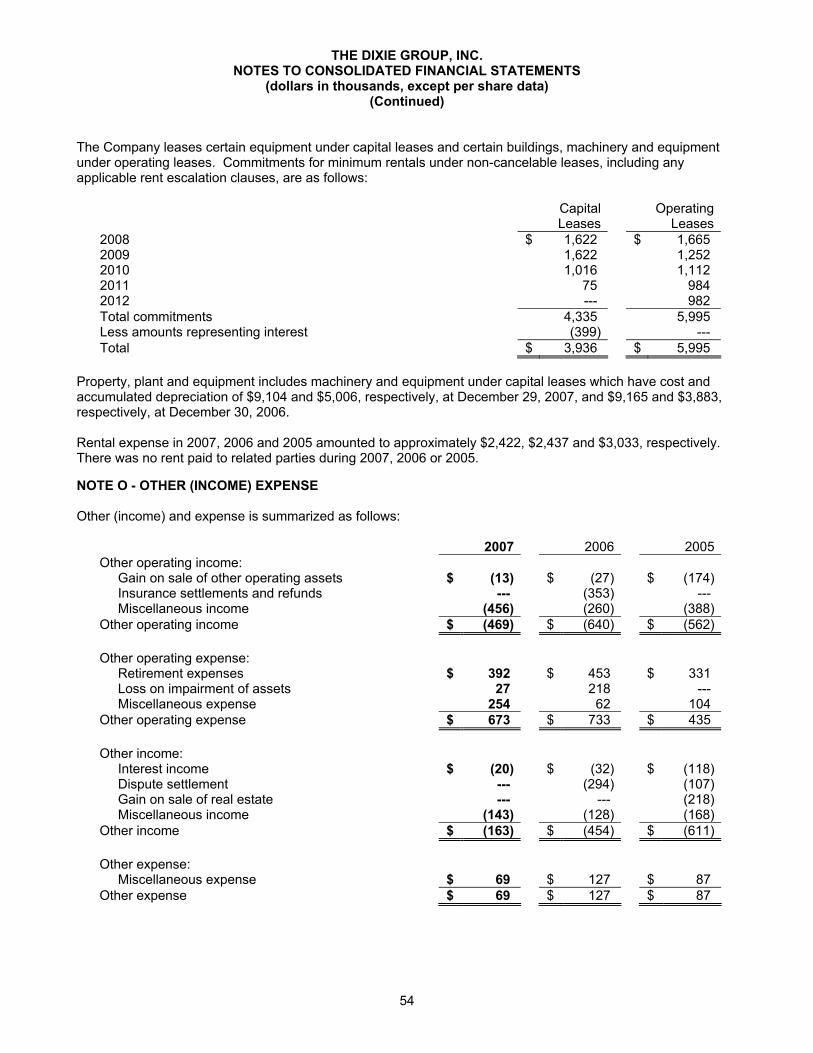
54
THE DIXIE GROUP, INC. NOTES TO CONSOLIDATED FINANCIAL STATEMENTS
(dollars in thousands, except per share data) (Continued)
The Company leases certain equipment under capital leases and certain buildings, machinery and equipment under operating leases. Commitments for minimum rentals under non-cancelable leases, including any applicable rent escalation clauses, are as follows:
Capital Operating Leases Leases
2008 $ 1,622 $ 1,665 2009 1,622 1,252 2010 1,016 1,112 2011 75 984 2012 --- 982 Total commitments 4,335 5,995 Less amounts representing interest (399) --- Total $ 3,936 $ 5,995
Property, plant and equipment includes machinery and equipment under capital leases which have cost and accumulated depreciation of $9,104 and $5,006, respectively, at December 29, 2007, and $9,165 and $3,883, respectively, at December 30, 2006. Rental expense in 2007, 2006 and 2005 amounted to approximately $2,422, $2,437 and $3,033, respectively. There was no rent paid to related parties during 2007, 2006 or 2005. NOTE O - OTHER (INCOME) EXPENSE Other (income) and expense is summarized as follows:
2007 2006 2005Other operating income: Gain on sale of other operating assets $ (13) $ (27) $ (174) Insurance settlements and refunds --- (353) --- Miscellaneous income (456) (260) (388)
Other operating income $ (469) $ (640) $ (562)
Other operating expense: Retirement expenses $ 392 $ 453 $ 331 Loss on impairment of assets 27 218 --- Miscellaneous expense 254 62 104
Other operating expense $ 673 $ 733 $ 435
Other income: Interest income $ (20) $ (32) $ (118) Dispute settlement --- (294) (107) Gain on sale of real estate --- --- (218) Miscellaneous income (143) (128) (168)
Other income $ (163) $ (454) $ (611)
Other expense: Miscellaneous expense $ 69 $ 127 $ 87
Other expense $ 69 $ 127 $ 87
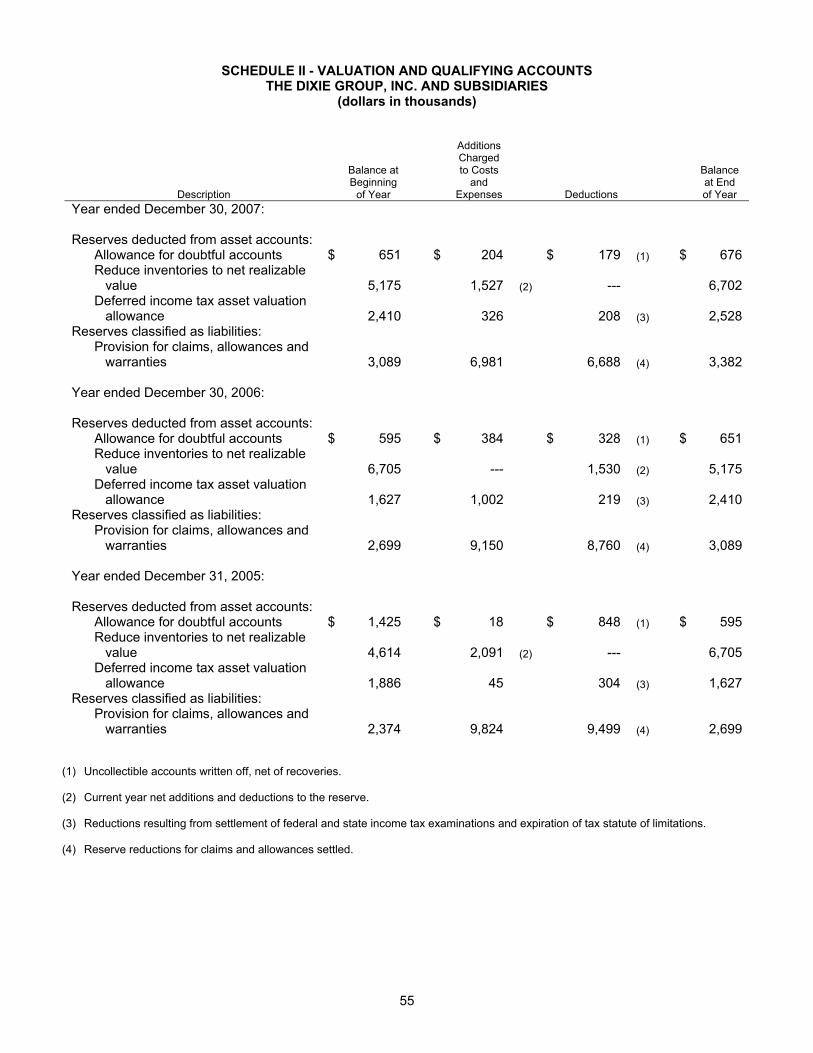
55
SCHEDULE II - VALUATION AND QUALIFYING ACCOUNTS
THE DIXIE GROUP, INC. AND SUBSIDIARIES (dollars in thousands)
Description
Balance at Beginning
of Year
Additions Charged to Costs
and Expenses Deductions
Balance at End of Year
Year ended December 30, 2007: Reserves deducted from asset accounts: Allowance for doubtful accounts $ 651 $ 204 $ 179 (1) $ 676
Reduce inventories to net realizable value 5,175 1,527 (2) --- 6,702
Deferred income tax asset valuation allowance 2,410 326 208 (3) 2,528
Reserves classified as liabilities:
Provision for claims, allowances and warranties 3,089 6,981 6,688 (4) 3,382
Year ended December 30, 2006: Reserves deducted from asset accounts: Allowance for doubtful accounts $ 595 $ 384 $ 328 (1) $ 651
Reduce inventories to net realizable value 6,705 --- 1,530 (2) 5,175
Deferred income tax asset valuation allowance 1,627 1,002 219 (3) 2,410
Reserves classified as liabilities:
Provision for claims, allowances and warranties 2,699 9,150 8,760 (4) 3,089
Year ended December 31, 2005: Reserves deducted from asset accounts: Allowance for doubtful accounts $ 1,425 $ 18 $ 848 (1) $ 595
Reduce inventories to net realizable value 4,614 2,091 (2) --- 6,705
Deferred income tax asset valuation allowance 1,886 45 304 (3) 1,627
Reserves classified as liabilities:
Provision for claims, allowances and warranties 2,374 9,824 9,499 (4) 2,699
(1) Uncollectible accounts written off, net of recoveries. (2) Current year net additions and deductions to the reserve. (3) Reductions resulting from settlement of federal and state income tax examinations and expiration of tax statute of limitations. (4) Reserve reductions for claims and allowances settled.
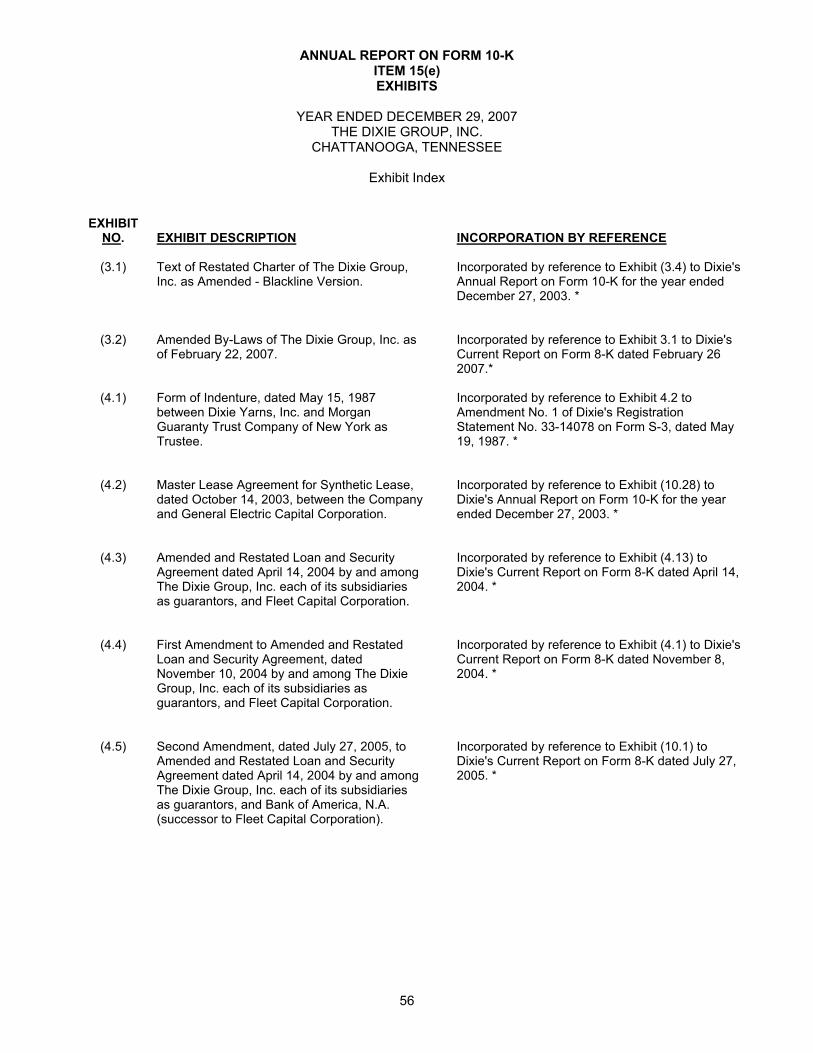
56
ANNUAL REPORT ON FORM 10-K ITEM 15(e) EXHIBITS
YEAR ENDED DECEMBER 29, 2007
THE DIXIE GROUP, INC. CHATTANOOGA, TENNESSEE
Exhibit Index
EXHIBIT NO.
EXHIBIT DESCRIPTION
INCORPORATION BY REFERENCE
(3.1) Text of Restated Charter of The Dixie Group,
Inc. as Amended - Blackline Version.
Incorporated by reference to Exhibit (3.4) to Dixie's Annual Report on Form 10-K for the year ended December 27, 2003. *
(3.2) Amended By-Laws of The Dixie Group, Inc. as of February 22, 2007.
Incorporated by reference to Exhibit 3.1 to Dixie's Current Report on Form 8-K dated February 26 2007.*
(4.1) Form of Indenture, dated May 15, 1987 between Dixie Yarns, Inc. and Morgan Guaranty Trust Company of New York as Trustee.
Incorporated by reference to Exhibit 4.2 to Amendment No. 1 of Dixie's Registration Statement No. 33-14078 on Form S-3, dated May 19, 1987. *
(4.2) Master Lease Agreement for Synthetic Lease, dated October 14, 2003, between the Company and General Electric Capital Corporation.
Incorporated by reference to Exhibit (10.28) to Dixie's Annual Report on Form 10-K for the year ended December 27, 2003. *
(4.3) Amended and Restated Loan and Security Agreement dated April 14, 2004 by and among The Dixie Group, Inc. each of its subsidiaries as guarantors, and Fleet Capital Corporation.
Incorporated by reference to Exhibit (4.13) to Dixie's Current Report on Form 8-K dated April 14, 2004. *
(4.4) First Amendment to Amended and Restated Loan and Security Agreement, dated November 10, 2004 by and among The Dixie Group, Inc. each of its subsidiaries as guarantors, and Fleet Capital Corporation.
Incorporated by reference to Exhibit (4.1) to Dixie's Current Report on Form 8-K dated November 8, 2004. *
(4.5) Second Amendment, dated July 27, 2005, to Amended and Restated Loan and Security Agreement dated April 14, 2004 by and among The Dixie Group, Inc. each of its subsidiaries as guarantors, and Bank of America, N.A. (successor to Fleet Capital Corporation).
Incorporated by reference to Exhibit (10.1) to Dixie's Current Report on Form 8-K dated July 27, 2005. *
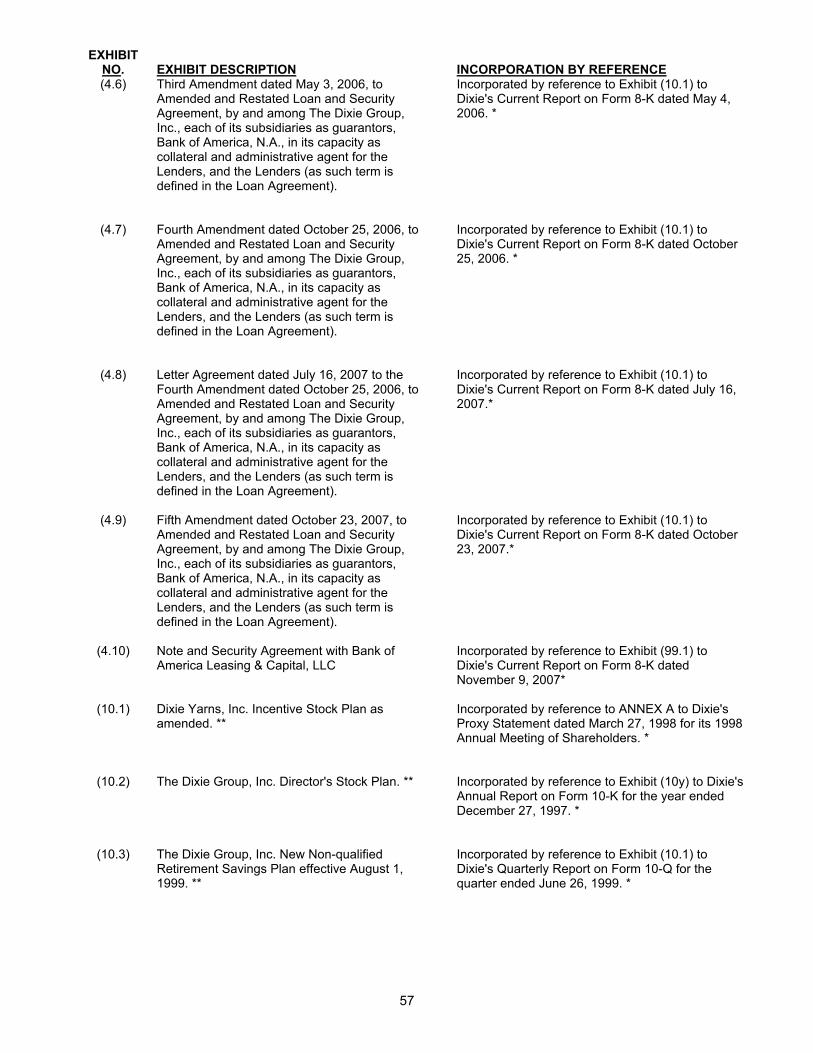
57
EXHIBIT NO.
EXHIBIT DESCRIPTION
INCORPORATION BY REFERENCE
(4.6)
Third Amendment dated May 3, 2006, to Amended and Restated Loan and Security Agreement, by and among The Dixie Group, Inc., each of its subsidiaries as guarantors, Bank of America, N.A., in its capacity as collateral and administrative agent for the Lenders, and the Lenders (as such term is defined in the Loan Agreement).
Incorporated by reference to Exhibit (10.1) to Dixie's Current Report on Form 8-K dated May 4, 2006. *
(4.7) Fourth Amendment dated October 25, 2006, to Amended and Restated Loan and Security Agreement, by and among The Dixie Group, Inc., each of its subsidiaries as guarantors, Bank of America, N.A., in its capacity as collateral and administrative agent for the Lenders, and the Lenders (as such term is defined in the Loan Agreement).
Incorporated by reference to Exhibit (10.1) to Dixie's Current Report on Form 8-K dated October 25, 2006. *
(4.8) Letter Agreement dated July 16, 2007 to the Fourth Amendment dated October 25, 2006, to Amended and Restated Loan and Security Agreement, by and among The Dixie Group, Inc., each of its subsidiaries as guarantors, Bank of America, N.A., in its capacity as collateral and administrative agent for the Lenders, and the Lenders (as such term is defined in the Loan Agreement).
Incorporated by reference to Exhibit (10.1) to Dixie's Current Report on Form 8-K dated July 16, 2007.*
(4.9) Fifth Amendment dated October 23, 2007, to Amended and Restated Loan and Security Agreement, by and among The Dixie Group, Inc., each of its subsidiaries as guarantors, Bank of America, N.A., in its capacity as collateral and administrative agent for the Lenders, and the Lenders (as such term is defined in the Loan Agreement).
Incorporated by reference to Exhibit (10.1) to Dixie's Current Report on Form 8-K dated October 23, 2007.*
(4.10) Note and Security Agreement with Bank of America Leasing & Capital, LLC
Incorporated by reference to Exhibit (99.1) to Dixie's Current Report on Form 8-K dated November 9, 2007*
(10.1) Dixie Yarns, Inc. Incentive Stock Plan as amended. **
Incorporated by reference to ANNEX A to Dixie's Proxy Statement dated March 27, 1998 for its 1998 Annual Meeting of Shareholders. *
(10.2) The Dixie Group, Inc. Director's Stock Plan. **
Incorporated by reference to Exhibit (10y) to Dixie's Annual Report on Form 10-K for the year ended December 27, 1997. *
(10.3) The Dixie Group, Inc. New Non-qualified Retirement Savings Plan effective August 1, 1999. **
Incorporated by reference to Exhibit (10.1) to Dixie's Quarterly Report on Form 10-Q for the quarter ended June 26, 1999. *
58
EXHIBIT NO.
EXHIBIT DESCRIPTION
INCORPORATION BY REFERENCE
(10.4) The Dixie Group, Inc. Deferred Compensation Plan Amended and Restated Master Trust Agreement effective as of August 1, 1999. **
Incorporated by reference to Exhibit (10.2) to Dixie's Quarterly Report on Form 10-Q for the quarter ended June 26, 1999. *
(10.5) Stock Purchase Agreement dated as of July 1, 2000, by and among the Company and the stockholders of Fabrica International, Inc. named therein.
Incorporated by reference to Exhibit (2.1) to Dixie's Current Report on Form 8-K dated July 1, 2000. *
(10.6) Stock Purchase Agreement dated as of July 1, 2000, by and among the Company and all of the stockholders of Chroma Technologies, Inc.
Incorporated by reference to Exhibit (2.2) to Dixie's Current Report on Form 8-K dated July 1, 2000. *
(10.7) The Dixie Group, Inc. Stock Incentive Plan, as amended. **
Incorporated by reference to Annex A to Dixie's Proxy Statement dated April 5, 2002 for its 2002 Annual Meeting of Shareholders. *
(10.8) Amended and restated stock purchase agreement by and among The Dixie Group, Inc., and Scott D. Guenther, Royce R. Renfroe, and the Albert A. Frink and Denise Frink Charitable Remainder Unitrust and the Albert A. Frink Loving Trust dated September 8, 2000.
Incorporated by reference to Exhibit (10.1) to Dixie's Quarterly Report on Form 10-Q for the quarter ended March 31, 2001. *
(10.9) Form of Stock Option Agreement under The Dixie Group, Inc. Stock Incentive Plan. **
Incorporated by reference to Exhibit (10.23) to Dixie's Annual Report on Form 10-K for the year ended December 29, 2001. *
(10.10) Form of Stock Rights and Restrictions Agreement for Restricted Stock Award under The Dixie Group, Inc. Stock Incentive Plan, as amended.**
Incorporated by reference to Exhibit (10.35) to Dixie's Annual Report on Form 10-K for the year ended December 25, 2004. *
(10.11) Form of Stock Option Agreement under The Dixie Group, Inc. Stock Incentive Plan for Non-Qualified Options Granted December 20, 2005.**
Incorporated by reference to Exhibit (10.1) to Dixie's Current Report on Form 8-K dated December 20, 2005. *
(10.12) Employment Agreement between The Dixie Group, Inc. and David E. Polley, dated November 20, 2002**
Incorporated by reference to Exhibit (10.1) to Dixie's Quarterly Report on Form 10-Q for the quarter ended March 29, 2003. *
(10.13) First Amendment dated January 26, 2004 to Employment Agreement between The Dixie Group, Inc. and David E. Polley, dated November 20, 2002.**
Incorporated by reference to Exhibit (10.29) to Dixie's Annual Report on Form 10-K for the year ended December 27, 2003. *
59
EXHIBIT NO.
EXHIBIT DESCRIPTION
INCORPORATION BY REFERENCE
(10.14) Second Amendment, dated January 18, 2006, to Employment Agreement dated November 20, 2002 between The Dixie Group, Inc. and David E. Polley.**
Incorporated by reference to Exhibit (10.1) to Dixie's Current Report on Form 8-K dated January 18, 2006. *
(10.15) Third Amendment, dated January 6, 2007, to Employment Agreement dated November 20, 2002 between The Dixie Group, Inc. and David E. Polley.**
Incorporated by reference to Exhibit (10.1) to Dixie's Current Report on Form 8-K dated January 16, 2007. *
(10.16) Summary Description of the 2004 Annual Incentive Plan for The Dixie Group, Inc.**
Incorporated by reference to Exhibit (10.33) to Dixie's Annual Report on Form 10-K for the year ended December 25, 2004. *
(10.17) Summary Description of the Director Compensation Arrangements for The Dixie Group, Inc.**
Incorporated by reference to Exhibit (10.34) to Dixie's Annual Report on Form 10-K for the year ended December 25, 2004. *
(10.18) Severance Agreement and Release Between Fabrica International and Royce Renfroe effective as of May 12, 2005.**
Incorporated by reference to Exhibit (10.1) to Dixie's Current Report on Form 8-K dated May 12, 2005. *
(10.19) The Dixie Group, Inc. 2006 Stock Awards Plan. **
Incorporated by reference to Annex A to the Company's Proxy Statement for its 2006 Annual Meeting of Shareholders, filed March 20, 2006. *
(10.20) The 2006 Incentive Compensation Plan, approved February 23, 2006.**
Incorporated by reference to Current Report on Form 8-K dated March 1, 2006. *
(10.21) Material terms of the performance goals for the period 2007-2011, pursuant to which incentive compensation awards may be made to certain key executives of the Company based on the results achieved by the Company during such years, approved March 14, 2006.**
Incorporated by reference to Current Report on Form 8-K dated March 20, 2006. *
(10.22) Form of Award of Career Shares under the 2006 Incentive Compensation Plan for Participants holding only shares of the Company’s Common Stock.**
Incorporated by reference to Exhibit (10.1) to Dixie's Current Report on Form 8-K dated June 6, 2006. *
(10.23) Form of Award of Career Shares under the 2006 Incentive Compensation Plan for Participants holding shares of the Company’s Class B Common Stock.**
Incorporated by reference to Exhibit (10.2) to Dixie's Current Report on Form 8-K dated June 6, 2006. *
(10.24) Form of Award of Long Term Incentive Plan Shares under the 2006 Incentive Compensation Plan for Participants holding only shares of the Company’s Common Stock.**
Incorporated by reference to Exhibit (10.3) to Dixie's Current Report on Form 8-K dated June 6, 2006. *
60
EXHIBIT NO.
EXHIBIT DESCRIPTION
INCORPORATION BY REFERENCE
(10.25) Form of Award of Long Term Incentive Plan Shares under the 2006 Incentive Compensation Plan for Participants holding shares of the Company’s Class B Common Stock.**
Incorporated by reference to Exhibit (10.4) to Dixie's Current Report on Form 8-K dated June 6, 2006. *
(10.26) Award of 125,000 shares of Restricted Stock under the 2006 Stock Awards Plan to Daniel K. Frierson.**
Incorporated by reference to Exhibit (10.1) to Dixie's Current Report on Form 8-K dated June 7, 2006. *
(10.27) Summary description of The Dixie Group, Inc. 2007 Annual Compensation Plan.**
Incorporated by reference to Exhibit (10.1) to Dixie's Current Report on Form 8-K dated February 26, 2007.*
(10.28) Rule 10b5-1 and 10b-18 Repurchase Agreement by and between The Dixie Group, Inc. and Raymond James & Associates, Inc. dated December 11, 2007*
Incorporated by reference to Exhibit (99.1) to Dixie's Current Report on Form 8-K dated December 11, 2007*
(10.29) Merger agreement between The Dixie Group, Inc. and Unite Here National Retirement Fund regarding the Company's Masland Bargaining Unit Defined Benefit Pension Plan.**
Incorporated by reference to Exhibit (99.1) to Dixie's Current Report on Form 8-K dated December 28, 2007*
(14) Code of Ethics.
Incorporated by reference to Exhibit (14) to Dixie's
Annual Report on Form 10-K for the year ended December 27, 2003. *
(21) Subsidiaries of the Registrant. Filed herewith.
(23) Consent of Independent Registered Public Accounting Firm.
Filed herewith.
(31.1) CEO Certification pursuant to Securities Exchange Act Rule 13a-14(a).
Filed herewith.
(31.2) CFO Certification pursuant to Securities Exchange Act Rule 13a-14(a).
Filed herewith.
(32.1) CEO Certification pursuant to Securities Exchange Act Rule 13a-14(b).
Filed herewith.
(32.2) CFO Certification pursuant to Securities Exchange Act Rule 13a-14(b).
Filed herewith.
* Commission File No. 0-2585. ** Indicates a management contract or compensatory plan or arrangement.
345-B Nowlin Lane • Chattanooga, TN 37421
www.thed ix iegroup.com