Embed Size (px)
Citation preview
Results Presentation
2016
2
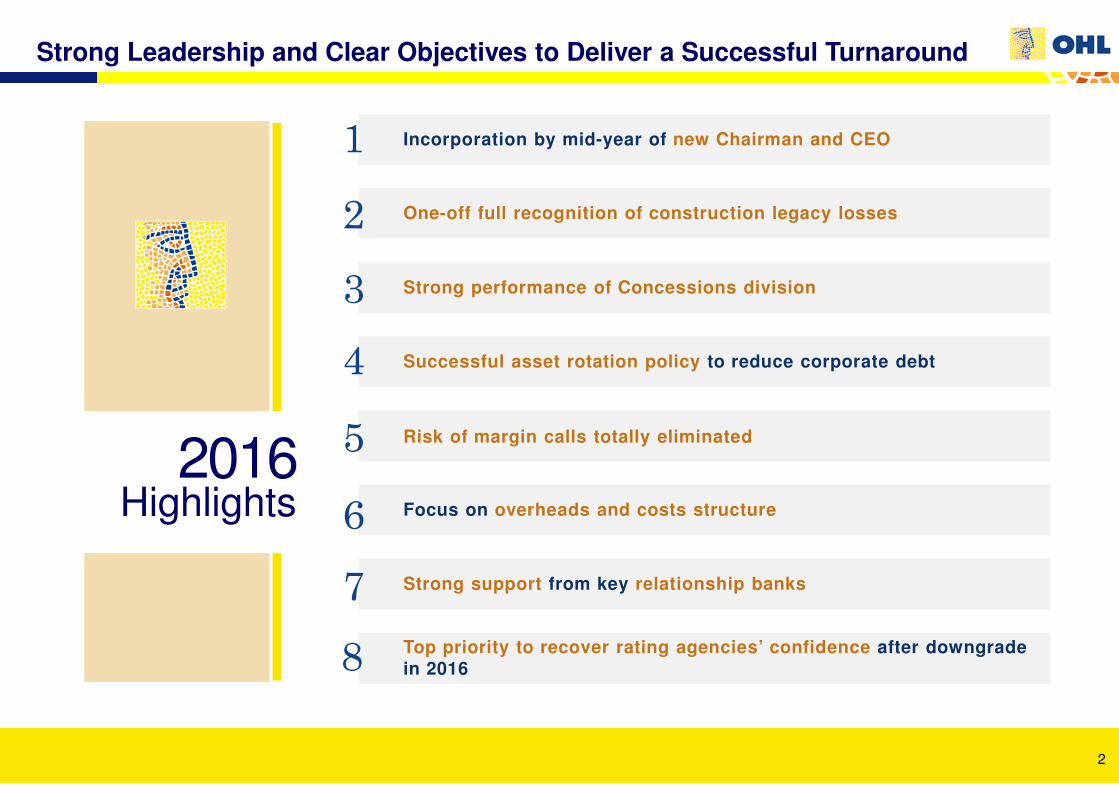
Top priority to recover rating agencies’ confidence after downgrade in 2016
Successful asset rotation policy to reduce corporate debt
Incorporation by mid-year of new Chairman and CEO
One-off full recognition of construction legacy losses
Strong support from key relationship banks
Risk of margin calls totally eliminated
Strong performance of Concessions division
Focus on overheads and costs structure
1
2
3
5
6
2016Highlights
Strong Leadership and Clear Objectives to Deliver a Successful Turnaround
4
7
8
3
NetDebt
P&L
20152016
Reported Construction Industrial FX2016
Normalized Var.%
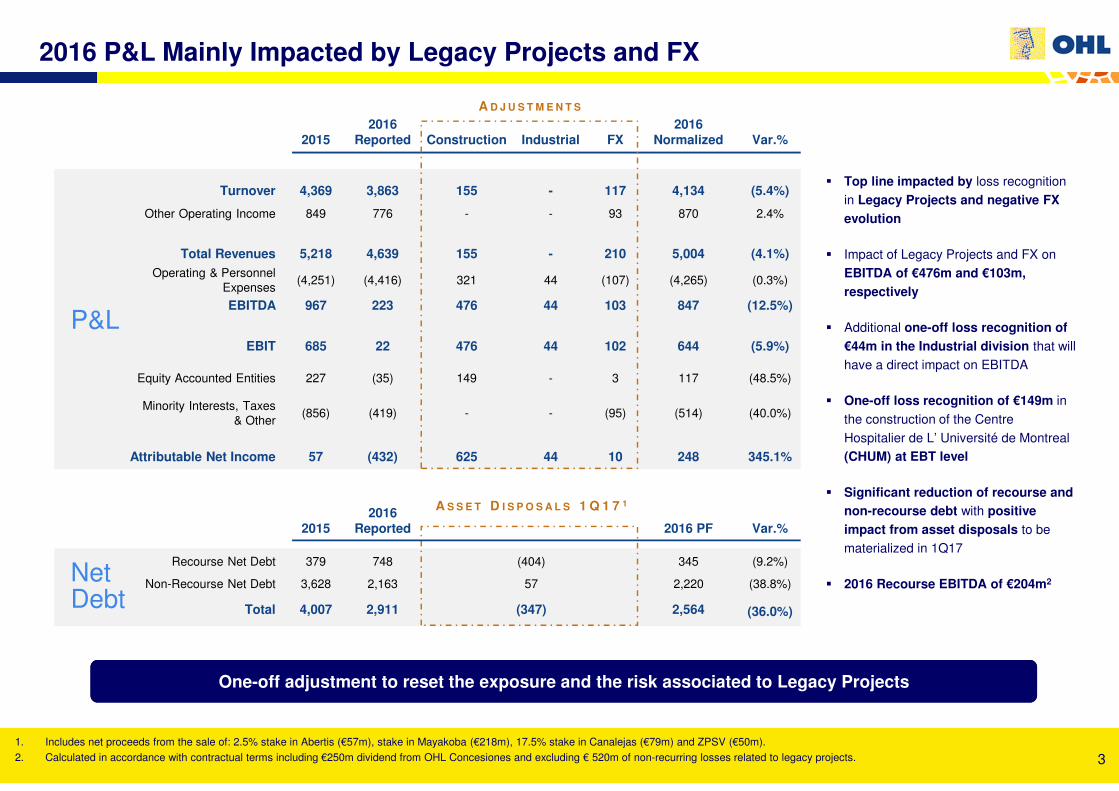
Turnover 4,369 3,863 155 - 117 4,134 (5.4%)
Other Operating Income 849 776 - - 93 870 2.4%
Total Revenues 5,218 4,639 155 - 210 5,004 (4.1%)
Operating & Personnel
Expenses(4,251) (4,416) 321 44 (107) (4,265) (0.3%)
EBITDA 967 223 476 44 103 847 (12.5%)
EBIT 685 22 476 44 102 644 (5.9%)
Equity Accounted Entities 227 (35) 149 - 3 117 (48.5%)
Minority Interests, Taxes
& Other(856) (419) - - (95) (514) (40.0%)
Attributable Net Income 57 (432) 625 44 10 248 345.1%
20152016
Reported 2016 PF Var.%
Recourse Net Debt 379 748 (404) 345 (9.2%)
Non-Recourse Net Debt 3,628 2,163 57 2,220 (38.8%)
Total 4,007 2,911 (347) 2,564 (36.0%)
2016 P&L Mainly Impacted by Legacy Projects and FX
� Top line impacted by loss recognition
in Legacy Projects and negative FX
evolution
� Impact of Legacy Projects and FX on
EBITDA of €476m and €103m,
respectively
� Additional one-off loss recognition of
€44m in the Industrial division that will
have a direct impact on EBITDA
� One-off loss recognition of €149m in
the construction of the Centre
Hospitalier de L’ Université de Montreal
(CHUM) at EBT level
� Significant reduction of recourse and non-recourse debt with positive
impact from asset disposals to be
materialized in 1Q17
� 2016 Recourse EBITDA of €204m2
A D J U S T M E N T S
One-off adjustment to reset the exposure and the risk associated to Legacy ProjectsOne-off adjustment to reset the exposure and the risk associated to Legacy Projects
A S S E T D I S P O S A L S 1 Q 1 7 1
1. Includes net proceeds from the sale of: 2.5% stake in Abertis (€57m), stake in Mayakoba (€218m), 17.5% stake in Canalejas (€79m) and ZPSV (€50m).
2. Calculated in accordance with contractual terms including €250m dividend from OHL Concesiones and excluding € 520m of non-recurring losses related to legacy projects.
4
Strong Commitment with Our Asset Rotation Policy
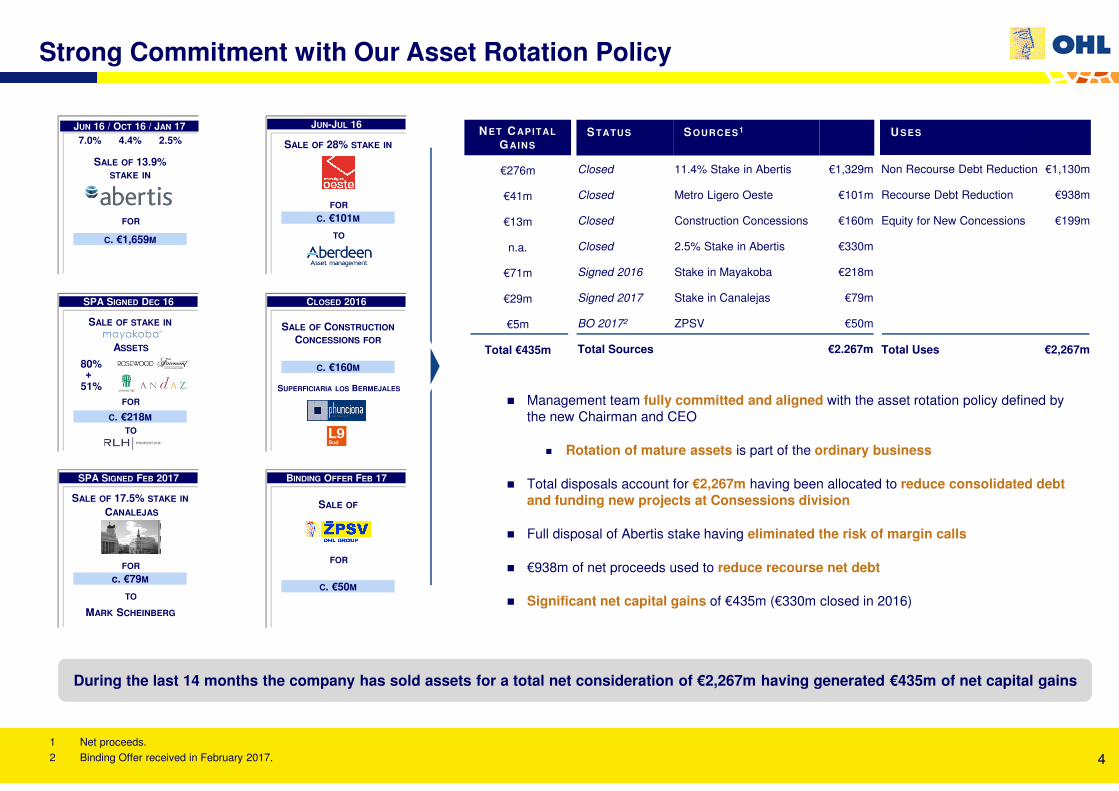
� Management team fully committed and aligned with the asset rotation policy defined by
the new Chairman and CEO
� Rotation of mature assets is part of the ordinary business
� Total disposals account for €2,267m having been allocated to reduce consolidated debt and funding new projects at Consessions division
� Full disposal of Abertis stake having eliminated the risk of margin calls
� €938m of net proceeds used to reduce recourse net debt
� Significant net capital gains of €435m (€330m closed in 2016)
SALE OF 13.9% STAKE IN
C. €1,659M
JUN 16 / OCT 16 / JAN 17
FOR
SALE OF STAKE IN
C. €218M
SPA SIGNED DEC 16
ASSETS
FOR
TO
80%+
51%
SALE OF 28% STAKE IN
C. €101M
JUN-JUL 16
FOR
TO
SALE OF CONSTRUCTION
CONCESSIONS FOR
CLOSED 2016
C. €160M
SUPERFICIARIA LOS BERMEJALES
STATUS SOURCES1
Closed 11.4% Stake in Abertis €1,329m
Closed Metro Ligero Oeste €101m
Closed Construction Concessions €160m
Closed 2.5% Stake in Abertis €330m
Signed 2016 Stake in Mayakoba €218m
Signed 2017 Stake in Canalejas €79m
BO 20172 ZPSV €50m
Total Sources €2.267m
USES
Non Recourse Debt Reduction €1,130m
Recourse Debt Reduction €938m
Equity for New Concessions €199m
Total Uses €2,267m
SALE OF 17.5% STAKE IN
c. €79M
SPA SIGNED FEB 2017
FOR
TO
CANALEJAS
MARK SCHEINBERG
1 Net proceeds.
2 Binding Offer received in February 2017.
SALE OF
BINDING OFFER FEB 17
FOR
C. €50M
7.0% 4.4% 2.5%NET CAPITAL
GAINS
€276m
€41m
€13m
n.a.
€71m
€29m
€5m
Total €435m
During the last 14 months the company has sold assets for a total net consideration of €2,267m having generated €435m of net capital gainsDuring the last 14 months the company has sold assets for a total net consideration of €2,267m having generated €435m of net capital gains
5
50
70
90
110
jul-16 ago-16 sep-16 oct-16 dic-16 ene-17 feb-17
2020 Bond Share Price
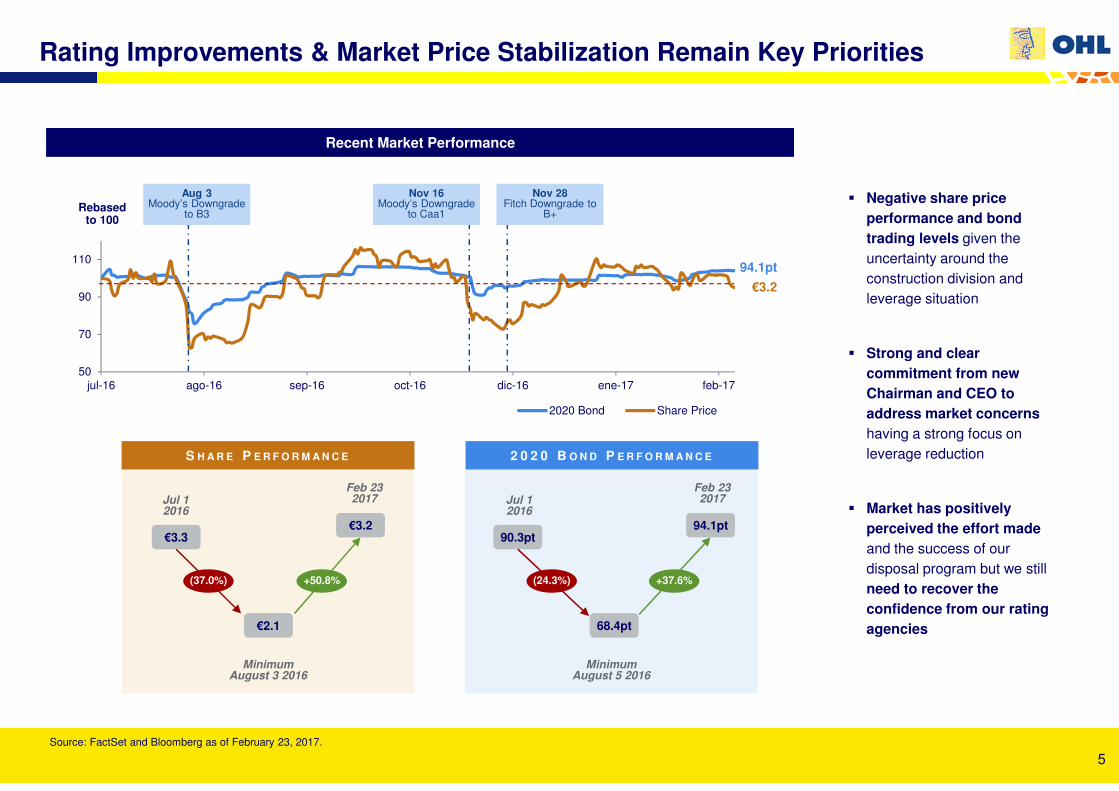
Rating Improvements & Market Price Stabilization Remain Key Priorities
Recent Market PerformanceRecent Market Performance
Rebasedto 100
Source: FactSet and Bloomberg as of February 23, 2017.
S H A R E P E R F O R M A N C E 2 0 2 0 B O N D P E R F O R M A N C E
� Negative share price performance and bond trading levels given the
uncertainty around the
construction division and
leverage situation
� Strong and clear commitment from new Chairman and CEO to address market concernshaving a strong focus on
leverage reduction
� Market has positively perceived the effort madeand the success of our
disposal program but we still
need to recover the confidence from our rating agencies
€3.2
94.1pt
Nov 16Moody’s Downgrade
to Caa1
Nov 16Moody’s Downgrade
to Caa1
Nov 28Fitch Downgrade to
B+
Nov 28Fitch Downgrade to
B+
Aug 3Moody’s Downgrade
to B3
Aug 3Moody’s Downgrade
to B3
€2.1
€3.2€3.3
(37.0%) +50.8%
MinimumAugust 3 2016
Feb 23 2017Jul 1
2016
68.4pt
94.1pt90.3pt
(24.3%)
MinimumAugust 5 2016
Feb 23 2017Jul 1
2016
+37.6%
6
Country Project Name Amount
I-405 1 €671m
Hospital del Curicó €229m
Owen’s Lake Dust €196m
Evitamiento de Chimbote €117m
Ellis CO. IH 35E €116m
Camino Nogales Puchuncavi €115m
Widening of 40th Street to SR-836 €101m
Elevación presa Atamina €73m
Travis Ct IH35 Widening €71m
Tranque Talabre €71m
Puerto Bilbao €63m
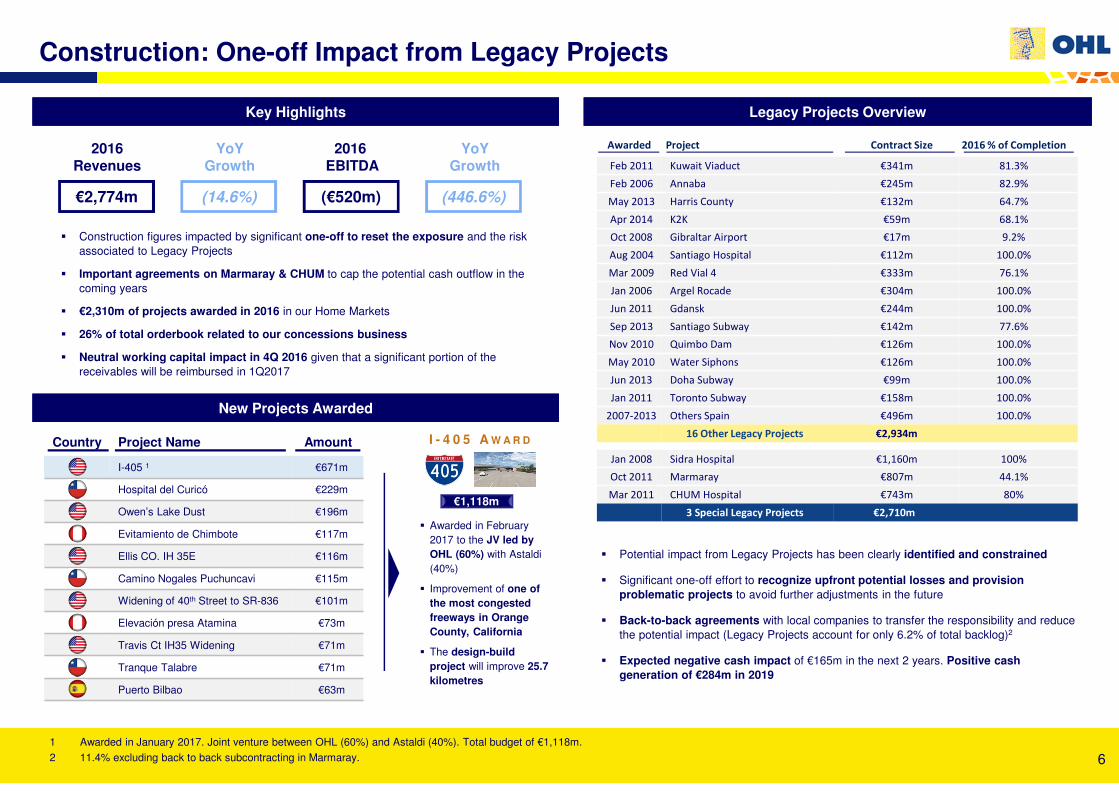
Construction: One-off Impact from Legacy Projects
Key HighlightsKey Highlights
� Construction figures impacted by significant one-off to reset the exposure and the risk
associated to Legacy Projects
� Important agreements on Marmaray & CHUM to cap the potential cash outflow in the
coming years
� €2,310m of projects awarded in 2016 in our Home Markets
� 26% of total orderbook related to our concessions business
� Neutral working capital impact in 4Q 2016 given that a significant portion of the
receivables will be reimbursed in 1Q2017
2016Revenues
YoYGrowth
2016 EBITDA
YoYGrowth
€2,774m (14.6%) (€520m) (446.6%)
1 Awarded in January 2017. Joint venture between OHL (60%) and Astaldi (40%). Total budget of €1,118m.
2 11.4% excluding back to back subcontracting in Marmaray.
New Projects AwardedNew Projects Awarded
€1,118m
� Awarded in February
2017 to the JV led by OHL (60%) with Astaldi
(40%)
� Improvement of one of the most congested freeways in Orange County, California
� The design-build project will improve 25.7 kilometres
Legacy Projects OverviewLegacy Projects Overview
Awarded Project Contract Size 2016 % of Completion
Feb 2011 Kuwait Viaduct €341m 81.3%
Feb 2006 Annaba €245m 82.9%
May 2013 Harris County €132m 64.7%
Apr 2014 K2K €59m 68.1%
Oct 2008 Gibraltar Airport €17m 9.2%
Aug 2004 Santiago Hospital €112m 100.0%
Mar 2009 Red Vial 4 €333m 76.1%
Jan 2006 Argel Rocade €304m 100.0%
Jun 2011 Gdansk €244m 100.0%
Sep 2013 Santiago Subway €142m 77.6%
Nov 2010 Quimbo Dam €126m 100.0%
May 2010 Water Siphons €126m 100.0%
Jun 2013 Doha Subway €99m 100.0%
Jan 2011 Toronto Subway €158m 100.0%
2007-2013 Others Spain €496m 100.0%
16 Other Legacy Projects €2,934m
Jan 2008 Sidra Hospital €1,160m 100%
Oct 2011 Marmaray €807m 44.1%
Mar 2011 CHUM Hospital €743m 80%
3 Special Legacy Projects €2,710m
I - 4 0 5 A W A R D
� Potential impact from Legacy Projects has been clearly identified and constrained
� Significant one-off effort to recognize upfront potential losses and provision problematic projects to avoid further adjustments in the future
� Back-to-back agreements with local companies to transfer the responsibility and reduce
the potential impact (Legacy Projects account for only 6.2% of total backlog)2
� Expected negative cash impact of €165m in the next 2 years. Positive cash generation of €284m in 2019
7
36%
35%
15%3%
11%
210 236
347 342
(269)
(64) (101)
284
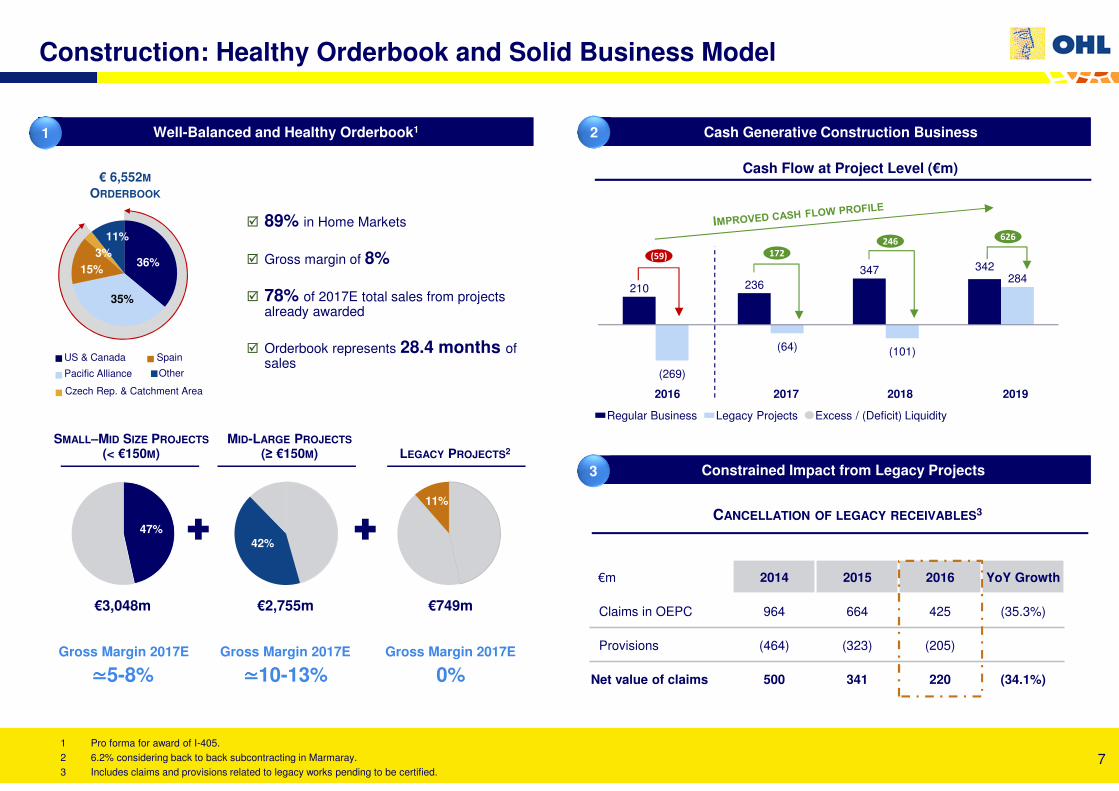
Construction: Healthy Orderbook and Solid Business Model
Well-Balanced and Healthy Orderbook1Well-Balanced and Healthy Orderbook1 Cash Generative Construction BusinessCash Generative Construction Business
CANCELLATION OF LEGACY RECEIVABLES3
Cash Flow at Project Level (€m)
€m 2014 2015 2016 YoY Growth
Claims in OEPC 964 664 425 (35.3%)
Provisions (464) (323) (205)
Net value of claims 500 341 220 (34.1%)
1 Pro forma for award of I-405.
2 6.2% considering back to back subcontracting in Marmaray.
3 Includes claims and provisions related to legacy works pending to be certified.
2016 2017 2018 2019
(59)
Regular Business Excess / (Deficit) Liquidity
172
246
Pacific Alliance
US & Canada Spain
Czech Rep. & Catchment Area
Other
Constrained Impact from Legacy ProjectsConstrained Impact from Legacy Projects
1
3
2
Legacy Projects
626
� 89% in Home Markets
� Gross margin of 8%
� 78% of 2017E total sales from projects already awarded
� Orderbook represents 28.4 months of sales
€ 6,552M
ORDERBOOK
47%42%
SMALL–MID SIZE PROJECTS(< €150M)
€3,048m
11%
Gross Margin 2017E
MID-LARGE PROJECTS(≥ €150M) LEGACY PROJECTS2
€2,755m €749m
Gross Margin 2017E Gross Margin 2017E
≃≃≃≃5-8% ≃≃≃≃10-13% 0%
8
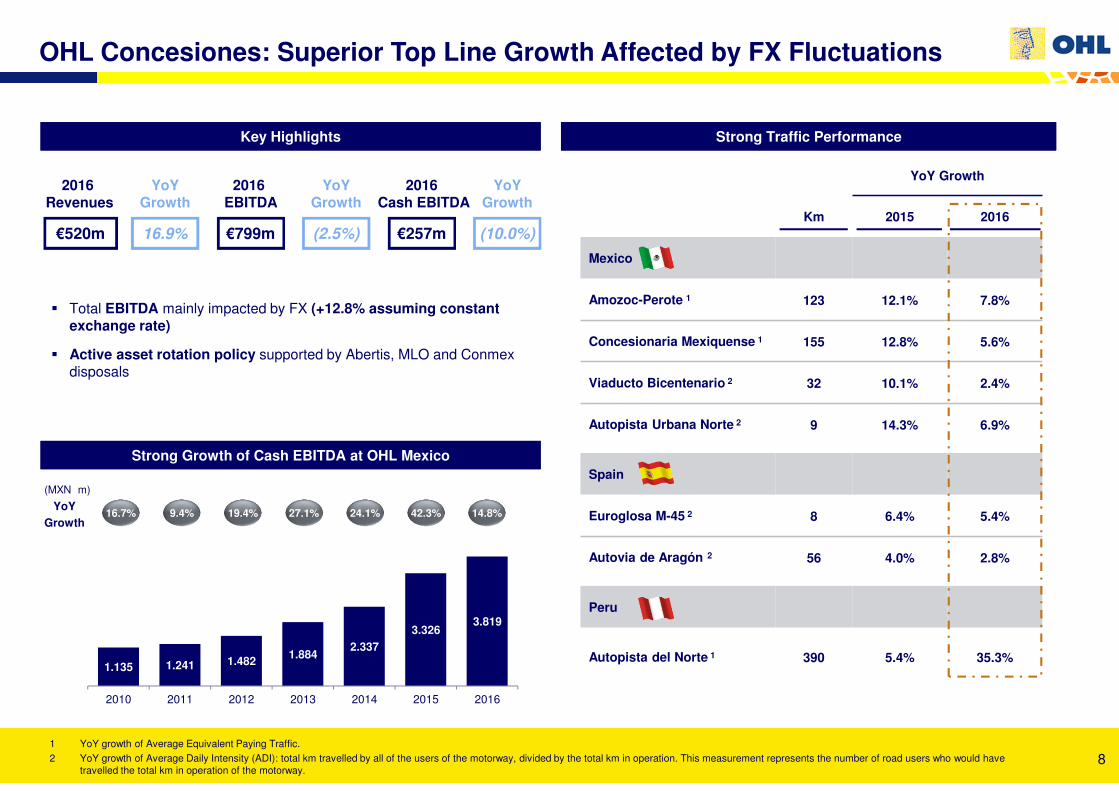
1.135 1.241 1.4821.884
2.337
3.3263.819
2010 2011 2012 2013 2014 2015 2016
OHL Concesiones: Superior Top Line Growth Affected by FX Fluctuations
Key HighlightsKey Highlights Strong Traffic PerformanceStrong Traffic Performance
� Total EBITDA mainly impacted by FX (+12.8% assuming constant exchange rate)
� Active asset rotation policy supported by Abertis, MLO and Conmex
disposals
Strong Growth of Cash EBITDA at OHL MexicoStrong Growth of Cash EBITDA at OHL Mexico
YoY Growth
Km 2015 2016
Mexico
Amozoc-Perote 1 123 12.1% 7.8%
Concesionaria Mexiquense 1 155 12.8% 5.6%
Viaducto Bicentenario 2 32 10.1% 2.4%
Autopista Urbana Norte 2 9 14.3% 6.9%
Spain
Euroglosa M-45 2 8 6.4% 5.4%
Autovia de Aragón 2 56 4.0% 2.8%
Peru
Autopista del Norte 1 390 5.4% 35.3%
2016 Revenues
€520m
YoYGrowth
16.9%
2016 EBITDA
€799m
YoYGrowth
(2.5%)
2016Cash EBITDA
€257m
YoYGrowth
(10.0%)
(MXN m)
42.3%24.1%27.1%19.4%9.4%16.7%YoY
Growth
1 YoY growth of Average Equivalent Paying Traffic.
2 YoY growth of Average Daily Intensity (ADI): total km travelled by all of the users of the motorway, divided by the total km in operation. This measurement represents the number of road users who would have
travelled the total km in operation of the motorway.
14.8%
9
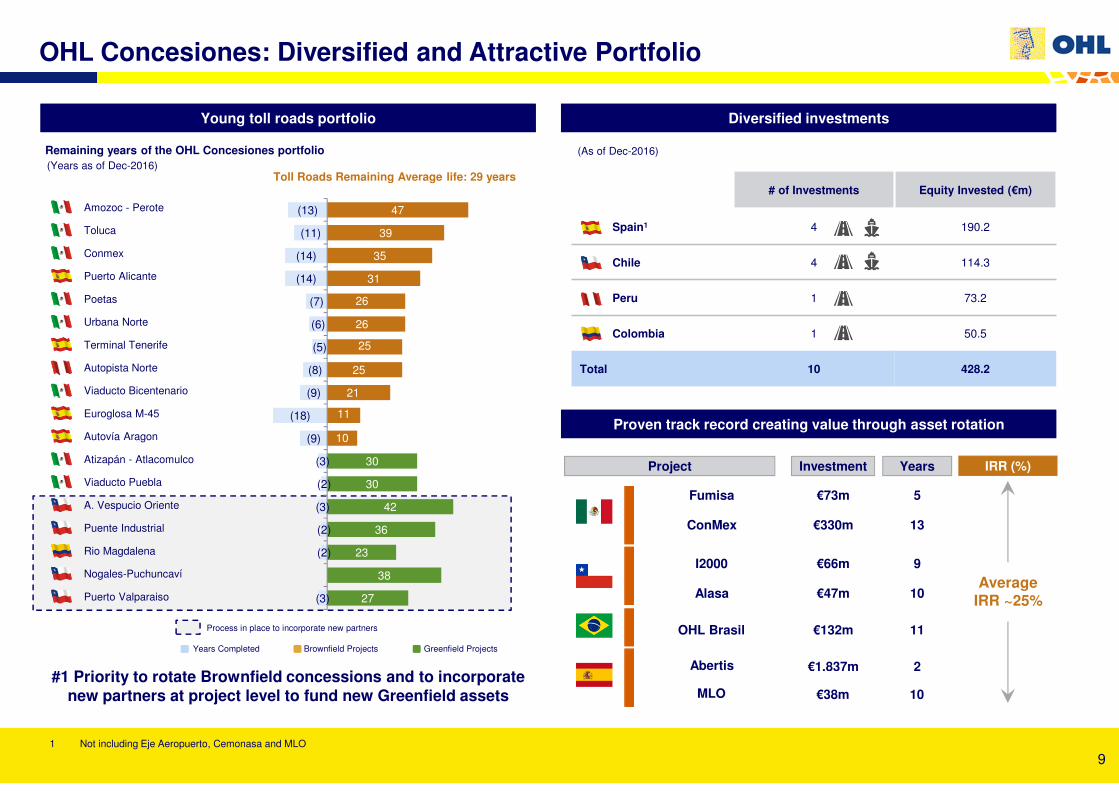
Diversified investmentsDiversified investments
# of Investments Equity Invested (€m)
Spain1 4 190.2
Chile 4 114.3
Peru 1 73.2
Colombia 1 50.5
Total 10 428.2
Young toll roads portfolioYoung toll roads portfolio
OHL Concesiones: Diversified and Attractive Portfolio
Remaining years of the OHL Concesiones portfolio(Years as of Dec-2016)
Proven track record creating value through asset rotationProven track record creating value through asset rotation
Toll Roads Remaining Average life: 29 years
(As of Dec-2016)
#1 Priority to rotate Brownfield concessions and to incorporate new partners at project level to fund new Greenfield assets
27
38
23
36
42
30
30
10
11
21
25
25
26
26
31
35
39
47
(3)
(2)
(2)
(3)
(2)
(3)
(9)
(18)
(9)
(8)
(5)
(6)
(7)
(14)
(14)
(11)
(13)
€73m 5
€47m
IRR (%)YearsProject Investment
Fumisa
ConMex €330m 13
€66m 9I2000
Alasa 10
OHL Brasil €132m 11
Abertis €1,837m 2
Average IRR ~25%
Rio Magdalena
Autopista Norte
Euroglosa M-45
Autovía Aragon
Nogales-Puchuncaví
A. Vespucio Oriente
Puente Industrial
Conmex
Atizapán - Atlacomulco
Viaducto Puebla
Urbana Norte
Poetas
Viaducto Bicentenario
Amozoc - Perote
Terminal Tenerife
Puerto Alicante
Toluca
Puerto Valparaiso
Years Completed Brownfield Projects Greenfield Projects
Process in place to incorporate new partners
MLO €38m 10
1 Not including Eje Aeropuerto, Cemonasa and MLO
10
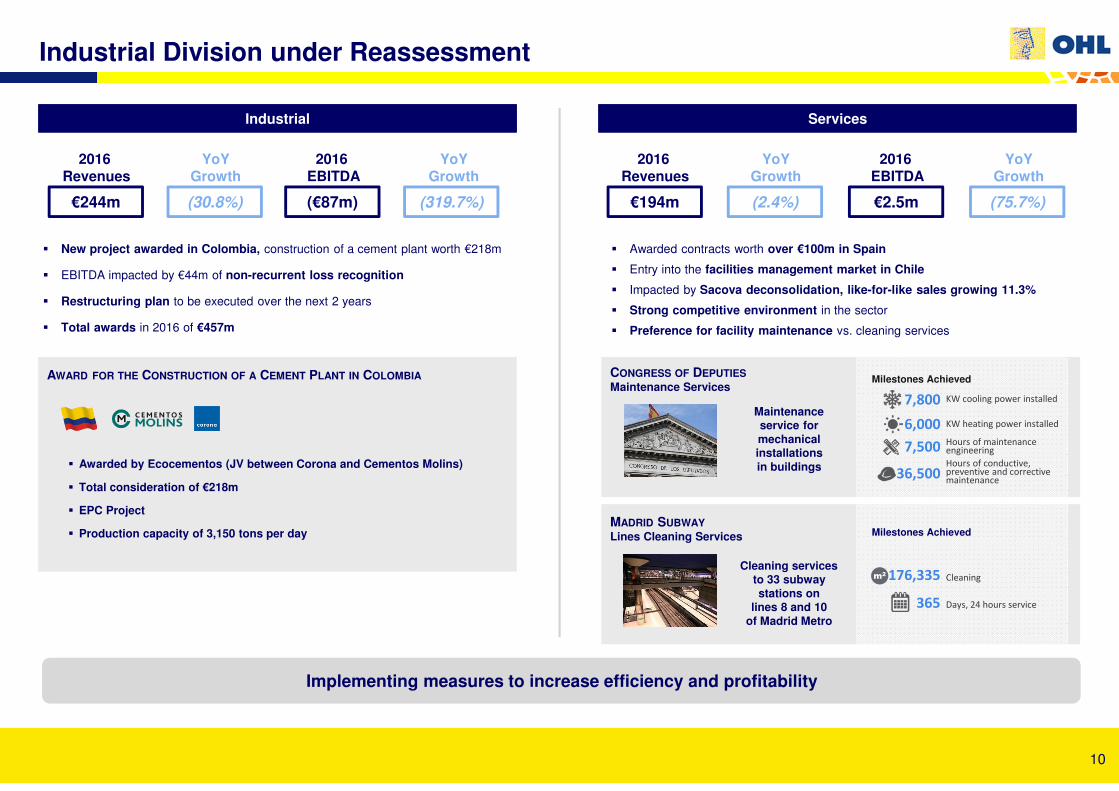
Industrial Division under Reassessment
IndustrialIndustrial
� New project awarded in Colombia, construction of a cement plant worth €218m
� EBITDA impacted by €44m of non-recurrent loss recognition
� Restructuring plan to be executed over the next 2 years
� Total awards in 2016 of €457m
2016 Revenues
YoYGrowth
2016 EBITDA
YoYGrowth
€244m (30.8%) (€87m) (319.7%)
ServicesServices
2016 Revenues
YoYGrowth
2016 EBITDA
YoYGrowth
€194m (2.4%) €2.5m (75.7%)
� Awarded contracts worth over €100m in Spain
� Entry into the facilities management market in Chile
� Impacted by Sacova deconsolidation, like-for-like sales growing 11.3%
� Strong competitive environment in the sector
� Preference for facility maintenance vs. cleaning services
Implementing measures to increase efficiency and profitabilityImplementing measures to increase efficiency and profitability
AWARD FOR THE CONSTRUCTION OF A CEMENT PLANT IN COLOMBIA
Maintenance service for mechanical installationsin buildings
CONGRESS OF DEPUTIESMaintenance Services
Milestones Achieved
7,800
6,000
7,500
36,500
KW cooling power installed
KW heating power installed
Hours of maintenance engineering
Hours of conductive, preventive and corrective maintenance
Cleaning services to 33 subway stations on
lines 8 and 10 of Madrid Metro
MADRID SUBWAYLines Cleaning Services Milestones Achieved
176,335
365
Cleaning
Days, 24 hours service
m2
� Awarded by Ecocementos (JV between Corona and Cementos Molins)
� Total consideration of €218m
� EPC Project
� Production capacity of 3,150 tons per day
11
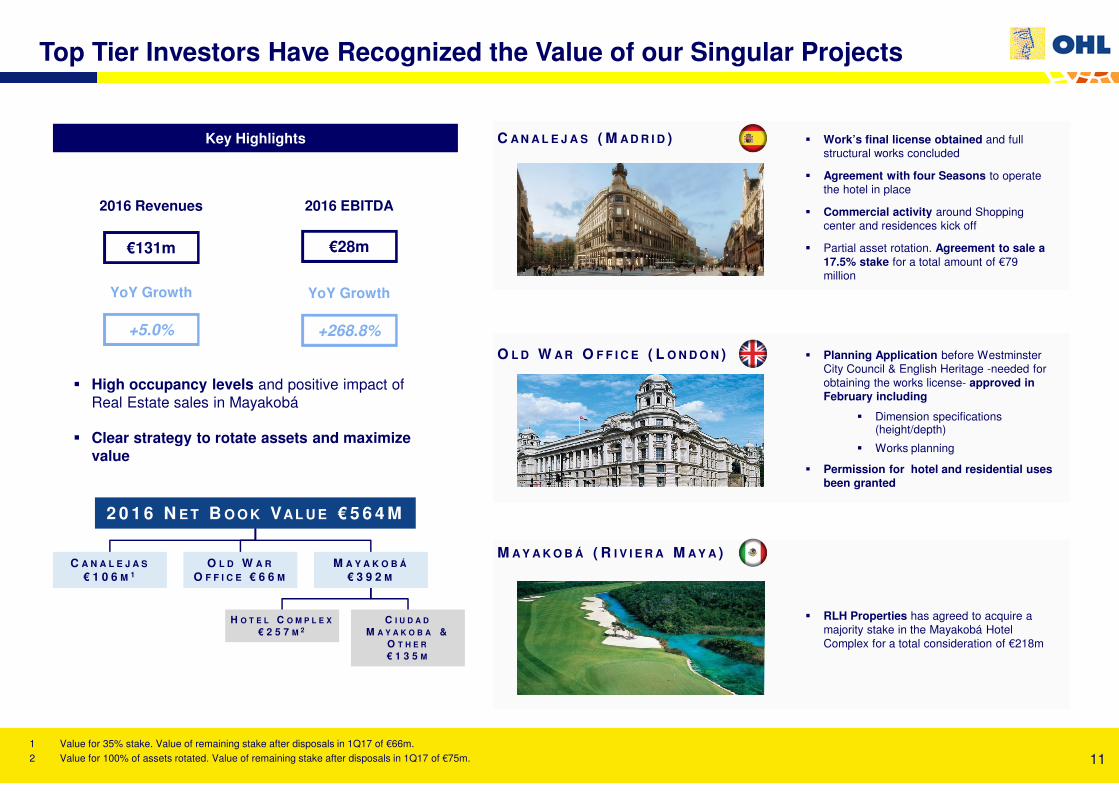
Top Tier Investors Have Recognized the Value of our Singular Projects
M A Y A K O B Á ( R I V I E R A M A Y A )
C A N A L E J A S ( M A D R I D )
O L D W A R O F F I C E ( L O N D O N )
2 0 1 6 N E T B O O K VAL U E € 5 6 4 M
Key HighlightsKey Highlights
� High occupancy levels and positive impact of
Real Estate sales in Mayakobá
� Clear strategy to rotate assets and maximize value
YoY Growth
2016 Revenues
+5.0%
€131m
2016 EBITDA
YoY Growth
€28m
+268.8%
� Work’s final license obtained and full structural works concluded
� Agreement with four Seasons to operate the hotel in place
� Commercial activity around Shopping center and residences kick off
� Partial asset rotation. Agreement to sale a 17.5% stake for a total amount of €79 million
� Planning Application before Westminster City Council & English Heritage -needed for
obtaining the works license- approved in February including
� Dimension specifications (height/depth)
� Works planning
� Permission for hotel and residential uses been granted
� RLH Properties has agreed to acquire a majority stake in the Mayakobá Hotel
Complex for a total consideration of €218m
C A N A L E J A S
€ 1 0 6 M 1O L D W A R
O F F I C E € 6 6 M
M A Y A K O B Á
€ 3 9 2 M
H O T E L C O M P L E X
€ 2 5 7 M 2C I U D A D
M A Y A K O B A & O T H E R
€ 1 3 5 M
1 Value for 35% stake. Value of remaining stake after disposals in 1Q17 of €66m.
2 Value for 100% of assets rotated. Value of remaining stake after disposals in 1Q17 of €75m.
12
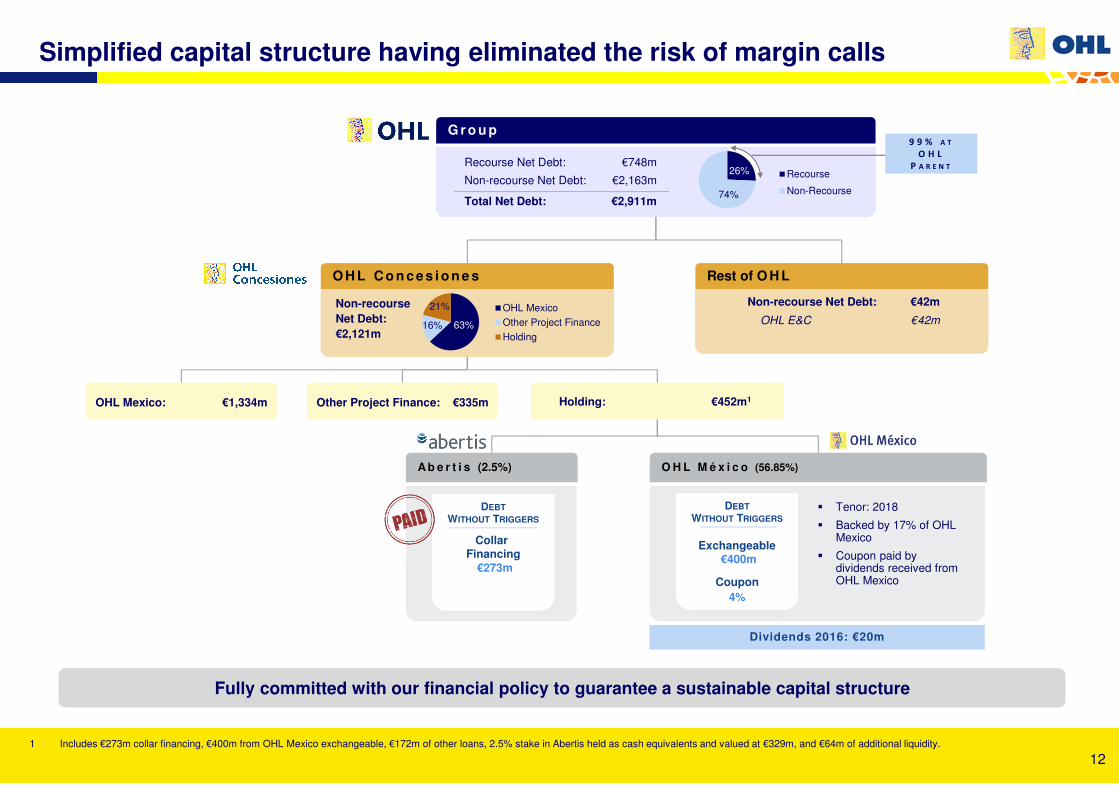
63%16%
21% OHL Mexico
Other Project Finance
Holding
Simplified capital structure having eliminated the risk of margin calls
Fully committed with our financial policy to guarantee a sustainable capital structureFully committed with our financial policy to guarantee a sustainable capital structure
1 Includes €273m collar financing, €400m from OHL Mexico exchangeable, €172m of other loans, 2.5% stake in Abertis held as cash equivalents and valued at €329m, and €64m of additional liquidity.
G r o u p
O H L C o n c e s i o n e s Rest of O H L
Recourse Net Debt: €748m
Non-recourse Net Debt: €2,163m
Total Net Debt: €2,911m
Non-recourse Net Debt: €42m
OHL E&C €42m
Non-recourse Net Debt:€2,121m
Other Project Finance: €335m
A b e r t i s (2.5%)
DEBTWITHOUT TRIGGERS
Collar Financing
€273m
O H L M é x i c o (56.85%)
Dividends 2016: €20mDividends 2016: €20m
DEBTWITHOUT TRIGGERS
Exchangeable€400m
Holding: €452m1
� Tenor: 2018
� Backed by 17% of OHL Mexico
� Coupon paid by dividends received from OHL MexicoCoupon
4%
OHL Mexico: €1,334m
9 9 % A T
O H L
P A R E N T26%
74%
Recourse
Non-Recourse
13
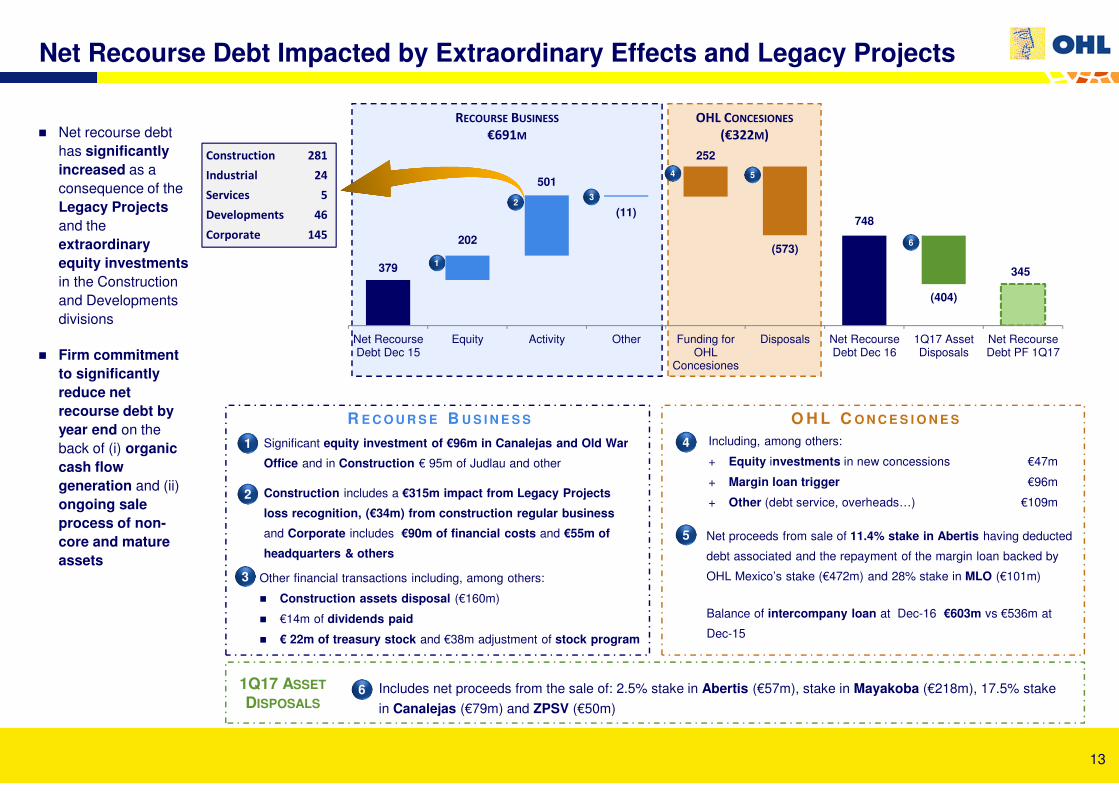
� Significant equity investment of €96m in Canalejas and Old War
Office and in Construction € 95m of Judlau and other
OHL CONCESIONES
(€322M)
RECOURSE BUSINESS
€691M
� Construction includes a €315m impact from Legacy Projects
loss recognition, (€34m) from construction regular business
and Corporate includes €90m of financial costs and €55m of
headquarters & others
� Net recourse debt
has significantly increased as a
consequence of the
Legacy Projects and the
extraordinary equity investments in the Construction
and Developments
divisions
� Firm commitment to significantly reduce net recourse debt by year end on the
back of (i) organic cash flow generation and (ii)
ongoing sale process of non-core and mature assets
1
2
3
Net Recourse Debt Impacted by Extraordinary Effects and Legacy Projects
� Includes net proceeds from the sale of: 2.5% stake in Abertis (€57m), stake in Mayakoba (€218m), 17.5% stake
in Canalejas (€79m) and ZPSV (€50m)
R E C O U R S E B U S I N E S S
� Net proceeds from sale of 11.4% stake in Abertis having deducted
debt associated and the repayment of the margin loan backed by
OHL Mexico’s stake (€472m) and 28% stake in MLO (€101m)
4
5
O H L C O N C E S I O N E S
1Q17 ASSET
DISPOSALS
1
23
6
4 5
Construction 281
Industrial 24
Services 5
Developments 46
Corporate 145
Other financial transactions including, among others:
� Construction assets disposal (€160m)
� €14m of dividends paid
� € 22m of treasury stock and €38m adjustment of stock program
Including, among others:
+ Equity investments in new concessions €47m
+ Margin loan trigger €96m
+ Other (debt service, overheads…) €109m
202
501
(11)
252
(573)
(404)
379
748
345
Net RecourseDebt Dec 15
Equity Activity Other Funding forOHL
Concesiones
Disposals Net RecourseDebt Dec 16
1Q17 AssetDisposals
Net RecourseDebt PF 1Q17
6
� Balance of intercompany loan at Dec-16 €603m vs €536m at
Dec-15
14
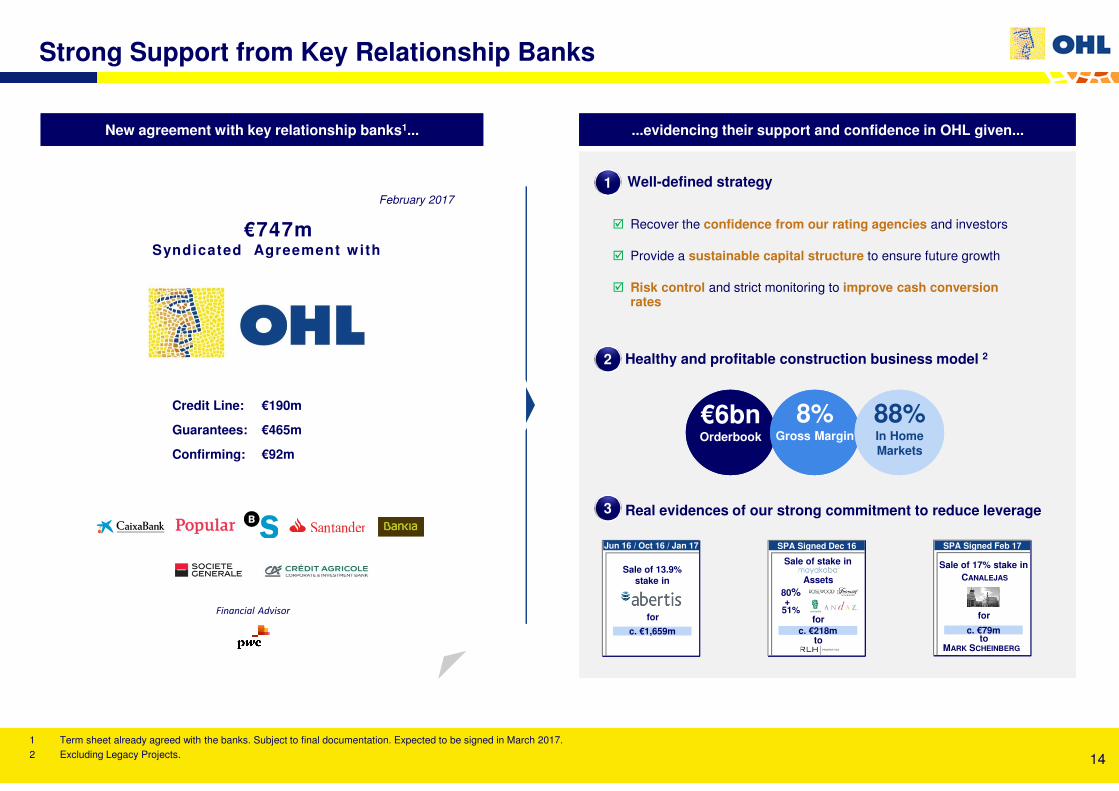
Strong Support from Key Relationship Banks
New agreement with key relationship banks1...New agreement with key relationship banks1... ...evidencing their support and confidence in OHL given......evidencing their support and confidence in OHL given...
€747m Syndicated Agreement with
February 2017
1 Term sheet already agreed with the banks. Subject to final documentation. Expected to be signed in March 2017.
2 Excluding Legacy Projects.
Credit Line: €190m
Guarantees: €465m
Confirming: €92m
� Well-defined strategy1
� Healthy and profitable construction business model 22
€6bnOrderbook
€6bnOrderbook
� Real evidences of our strong commitment to reduce leverage3
8%Gross Margin
8%Gross Margin
88%In HomeMarkets
88%In HomeMarkets
Sale of 13.9% stake in
c. €1,659m
Jun 16 / Oct 16 / Jan 17
for
Sale of stake in
c. €218m
SPA Signed Dec 16
Assets
for
to
80%+
51%
Sale of 17% stake in
c. €79m
SPA Signed Feb 17
for
to
CANALEJAS
� Recover the confidence from our rating agencies and investors
� Provide a sustainable capital structure to ensure future growth
� Risk control and strict monitoring to improve cash conversion rates
MARK SCHEINBERG
Financial Advisor
15
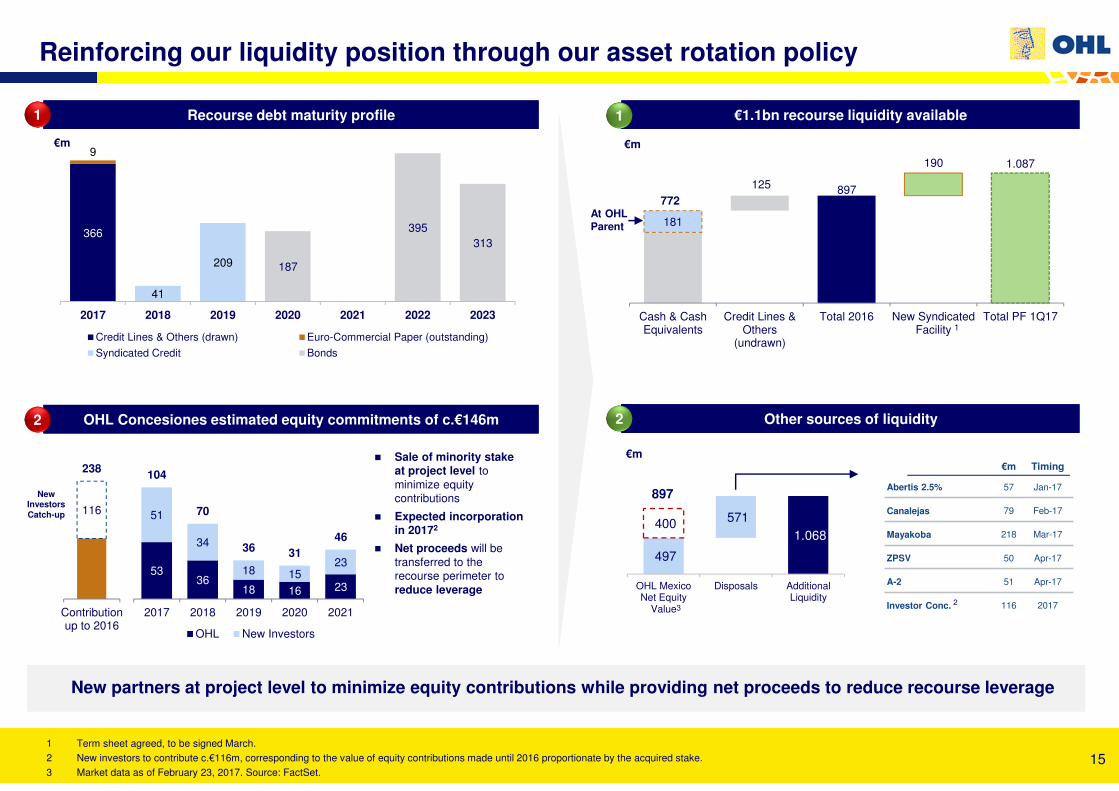
497
1.068 400
571
OHL MexicoNet Equity
Value
Disposals AdditionalLiquidity
€m Timing
Abertis 2.5% 57 Jan-17
Canalejas 79 Feb-17
Mayakoba 218 Mar-17
ZPSV 50 Apr-17
A-2 51 Apr-17
Investor Conc. 116 2017
Reinforcing our liquidity position through our asset rotation policy
1 Term sheet agreed, to be signed March.
2 New investors to contribute c.€116m, corresponding to the value of equity contributions made until 2016 proportionate by the acquired stake.
3 Market data as of February 23, 2017. Source: FactSet.
5336
18 16 23
51
34
18 1523
104
70
36 3146
2017 2018 2019 2020 2021
OHL New Investors
366
9
41
209 187
395
313
2017 2018 2019 2020 2021 2022 2023
Credit Lines & Others (drawn) Euro-Commercial Paper (outstanding)
Syndicated Credit Bonds
Recourse debt maturity profileRecourse debt maturity profile
OHL Concesiones estimated equity commitments of c.€146mOHL Concesiones estimated equity commitments of c.€146m
€m
897
1.087
125
181
190
772
Cash & CashEquivalents
Credit Lines &Others
(undrawn)
Total 2016 New SyndicatedFacility
Total PF 1Q17
€m
€1.1bn recourse liquidity available€1.1bn recourse liquidity available
New partners at project level to minimize equity contributions while providing net proceeds to reduce recourse leverage
1
2
1
New Investors Catch-up
€m
Other sources of liquidityOther sources of liquidity2
1
� Sale of minority stake at project level to
minimize equity contributions
� Expected incorporation in 20172
� Net proceeds will be
transferred to the recourse perimeter to
reduce leverage
897116
238
Contributionup to 2016
At OHL Parent
23
16
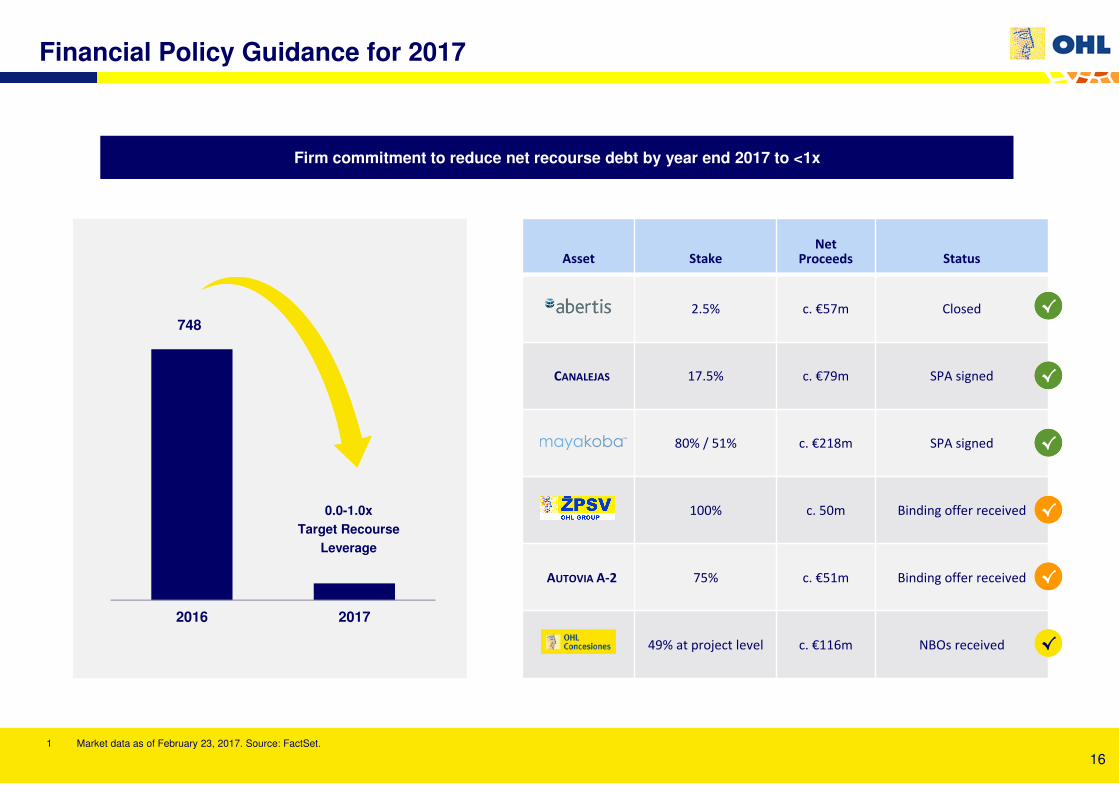
Financial Policy Guidance for 2017
Firm commitment to reduce net recourse debt by year end 2017 to <1xFirm commitment to reduce net recourse debt by year end 2017 to <1x
748
2016 2017
Asset StakeNet
Proceeds Status
2.5% c. €57m Closed
CANALEJAS 17.5% c. €79m SPA signed
80% / 51% c. €218m SPA signed
100% c. 50m Binding offer received
AUTOVIA A-2 75% c. €51m Binding offer received
49% at project level c. €116m NBOs received
√√
√√
√√
√√
√√
√√
0.0-1.0x
Target Recourse
Leverage
1 Market data as of February 23, 2017. Source: FactSet.
17
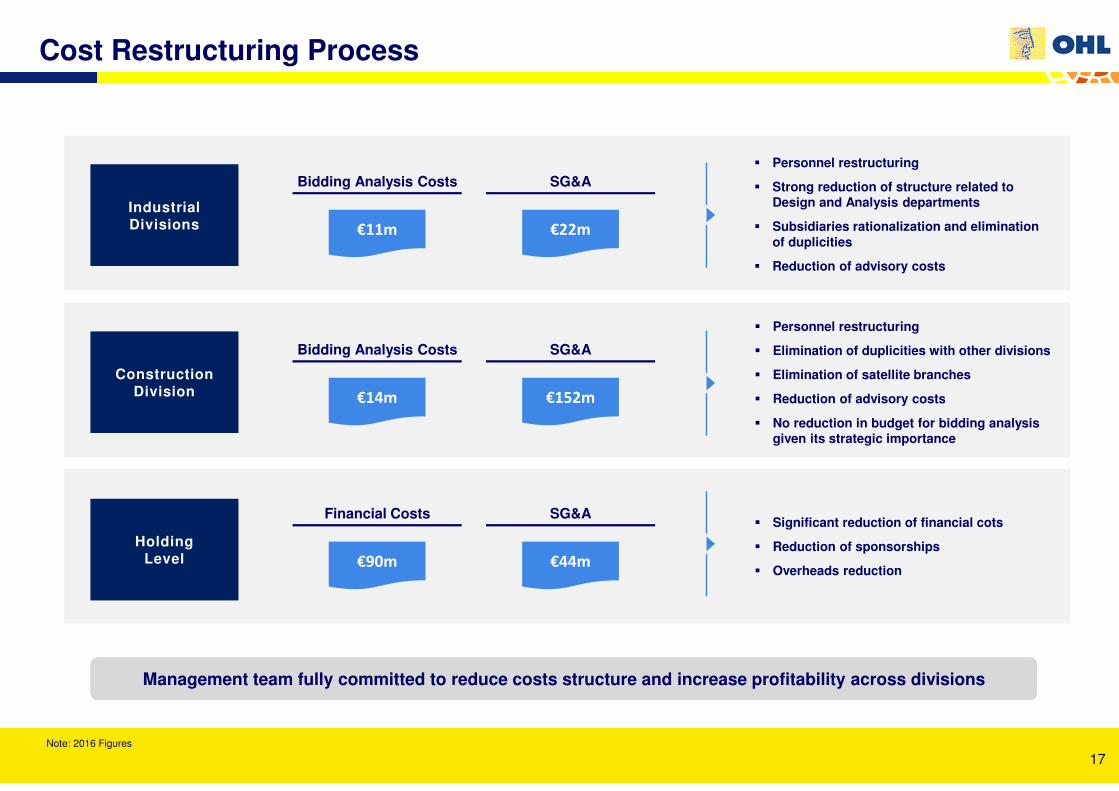
Cost Restructuring Process
Industrial DivisionsIndustrial Divisions
Construction Division
Construction Division
HoldingLevel
HoldingLevel
� Personnel restructuring
� Strong reduction of structure related to Design and Analysis departments
� Subsidiaries rationalization and eliminationof duplicities
� Reduction of advisory costs
� Personnel restructuring
� Elimination of duplicities with other divisions
� Elimination of satellite branches
� Reduction of advisory costs
� No reduction in budget for bidding analysis given its strategic importance
� Significant reduction of financial cots
� Reduction of sponsorships
� Overheads reduction
Management team fully committed to reduce costs structure and increase profitability across divisionsManagement team fully committed to reduce costs structure and increase profitability across divisions
Bidding Analysis Costs SG&A
€11m €22m
Bidding Analysis Costs SG&A
€14m €152m
Financial Costs SG&A
€90m €44m
Note: 2016 Figures
18
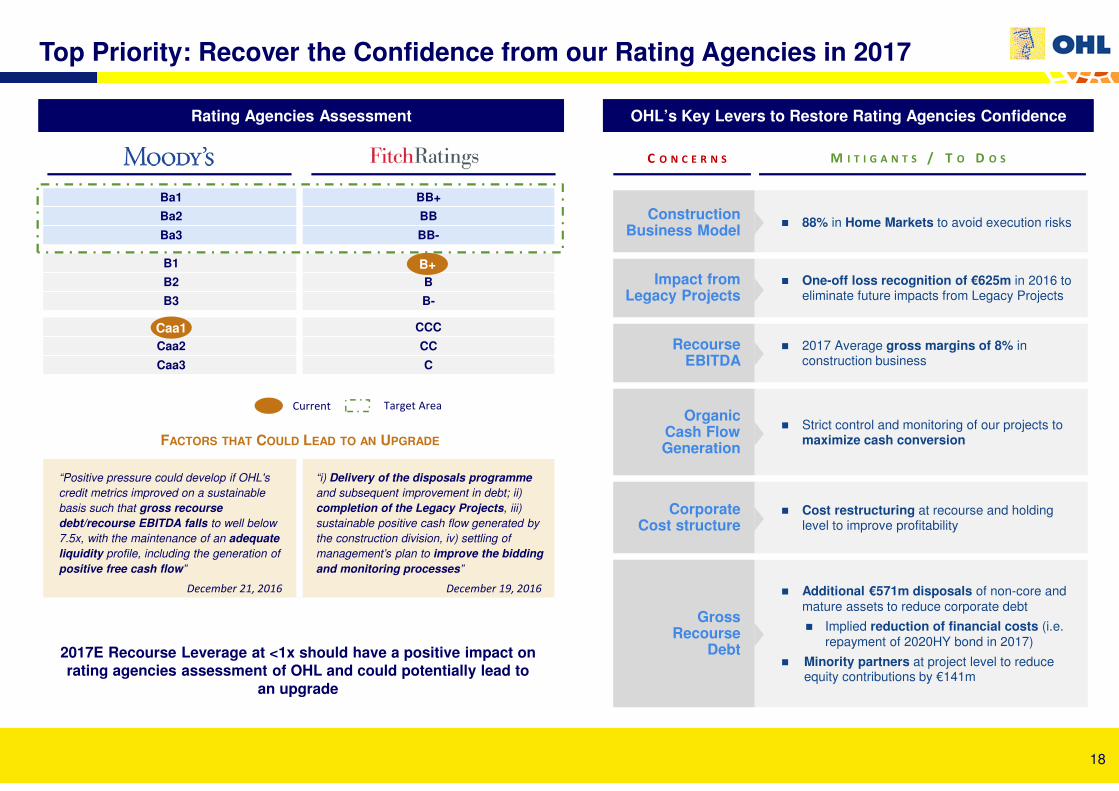
Top Priority: Recover the Confidence from our Rating Agencies in 2017
Rating Agencies AssessmentRating Agencies Assessment OHL’s Key Levers to Restore Rating Agencies ConfidenceOHL’s Key Levers to Restore Rating Agencies Confidence
Ba1 BB+
Ba2 BB
Ba3 BB-
B1 B+
B2 B
B3 B-
Caa1 CCC
Caa2 CC
Caa3 C
FACTORS THAT COULD LEAD TO AN UPGRADE
“Positive pressure could develop if OHL's
credit metrics improved on a sustainable
basis such that gross recourse
debt/recourse EBITDA falls to well below
7.5x, with the maintenance of an adequate
liquidity profile, including the generation of
positive free cash flow”
“i) Delivery of the disposals programme
and subsequent improvement in debt; ii)
completion of the Legacy Projects, iii)
sustainable positive cash flow generated by
the construction division, iv) settling of
management’s plan to improve the bidding
and monitoring processes”
Caa1
B+
Current Target Area
Construction Business Model � 88% in Home Markets to avoid execution risks
Impact from Legacy Projects
� One-off loss recognition of €625m in 2016 to eliminate future impacts from Legacy Projects
Recourse EBITDA
� 2017 Average gross margins of 8% in construction business
Organic Cash Flow Generation
� Strict control and monitoring of our projects to maximize cash conversion
Corporate Cost structure
� Cost restructuring at recourse and holding level to improve profitability
Gross Recourse
Debt
� Additional €571m disposals of non-core and mature assets to reduce corporate debt
� Implied reduction of financial costs (i.e. repayment of 2020HY bond in 2017)
� Minority partners at project level to reduce equity contributions by €141m
C O N C E R N S M I T I G A N T S / T O D O S
December 21, 2016 December 19, 2016
2017E Recourse Leverage at <1x should have a positive impact on rating agencies assessment of OHL and could potentially lead to
an upgrade
19
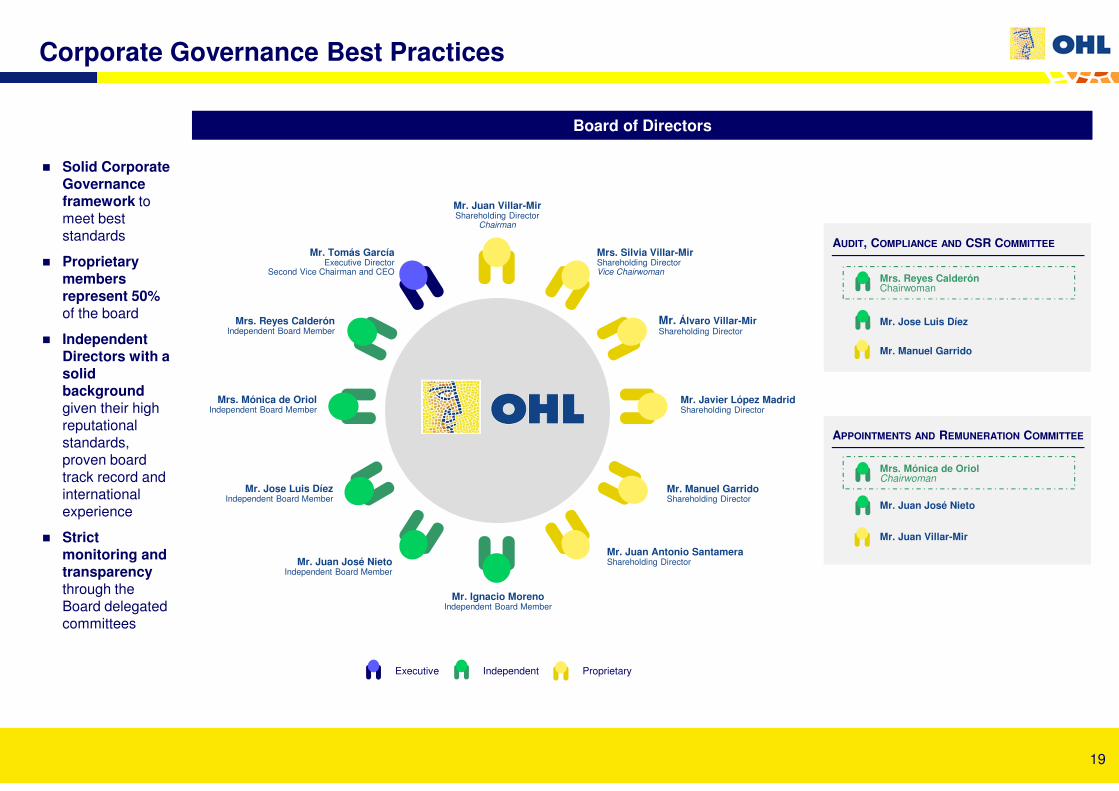
AUDIT, COMPLIANCE AND CSR COMMITTEE
Mrs. Reyes CalderónChairwoman
Mr. Jose Luis Díez
Mr. Manuel Garrido
APPOINTMENTS AND REMUNERATION COMMITTEE
Mrs. Mónica de OriolChairwoman
Mr. Juan Villar-Mir
Mr. Juan José Nieto
Corporate Governance Best Practices
� Solid Corporate Governance framework to
meet best
standards
� Proprietary members represent 50% of the board
� Independent Directors with a solid background given their high
reputational
standards,
proven board
track record and
international
experience
� Strict monitoring and transparency through the
Board delegated
committees
Board of DirectorsBoard of Directors
Mr. Juan Villar-MirShareholding Director
Chairman
Mrs. Silvia Villar-MirShareholding DirectorVice Chairwoman
Mr. Juan Antonio SantameraShareholding Director
Mr. Tomás GarcíaExecutive Director
Second Vice Chairman and CEO
Mr. Javier López Madrid Shareholding Director
Mr. Álvaro Villar-Mir Shareholding Director
Mrs. Mónica de Oriol Independent Board Member
Mr. Manuel GarridoShareholding Director
Mr. Juan José Nieto Independent Board Member
Executive ProprietaryIndependent
Mr. Jose Luis DíezIndependent Board Member
Mr. Ignacio MorenoIndependent Board Member
Mrs. Reyes CalderónIndependent Board Member
20
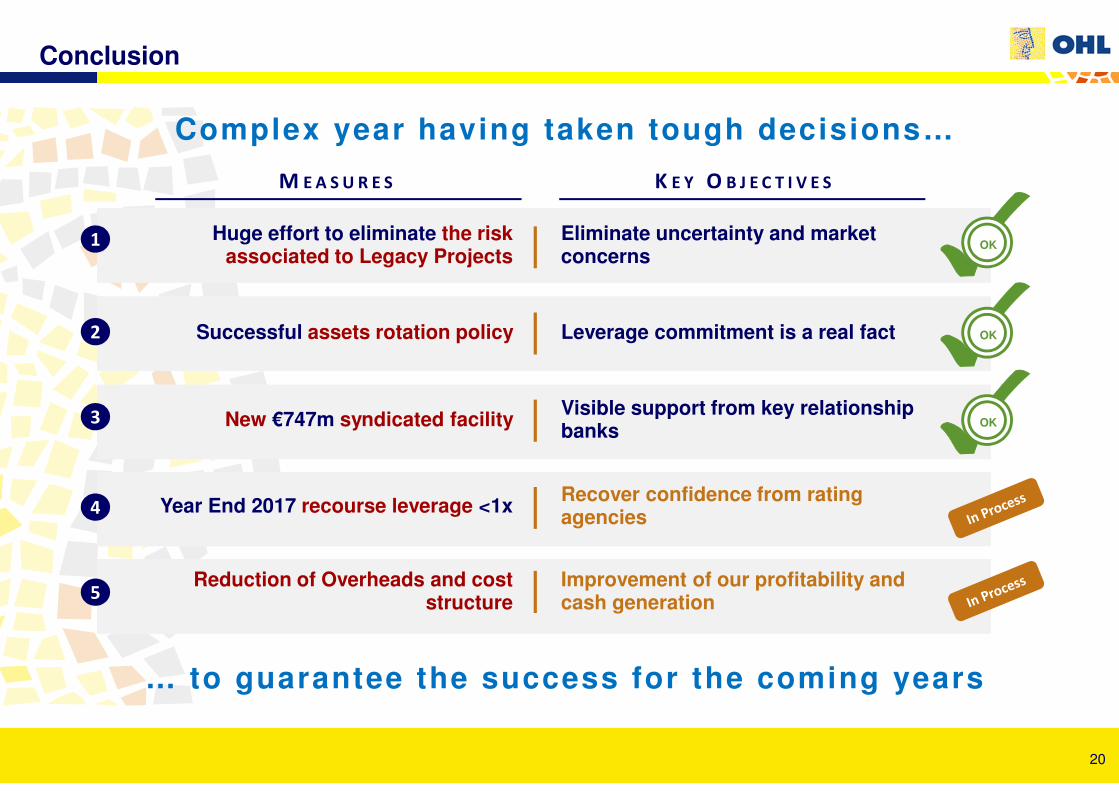
Conclusion
Huge effort to eliminate the risk associated to Legacy Projects
Successful assets rotation policy
New €747m syndicated facility
Year End 2017 recourse leverage <1x
Reduction of Overheads and cost structure
Complex year having taken tough decisions…
… to guarantee the success for the coming years
1
2
3
4
5
Eliminate uncertainty and market concerns
Leverage commitment is a real fact
Visible support from key relationship banks
Recover confidence from rating agencies
Improvement of our profitability and cash generation
OK
OK
OK
M E A S U R E S K E Y O B J E C T I V E S
Appendix
22
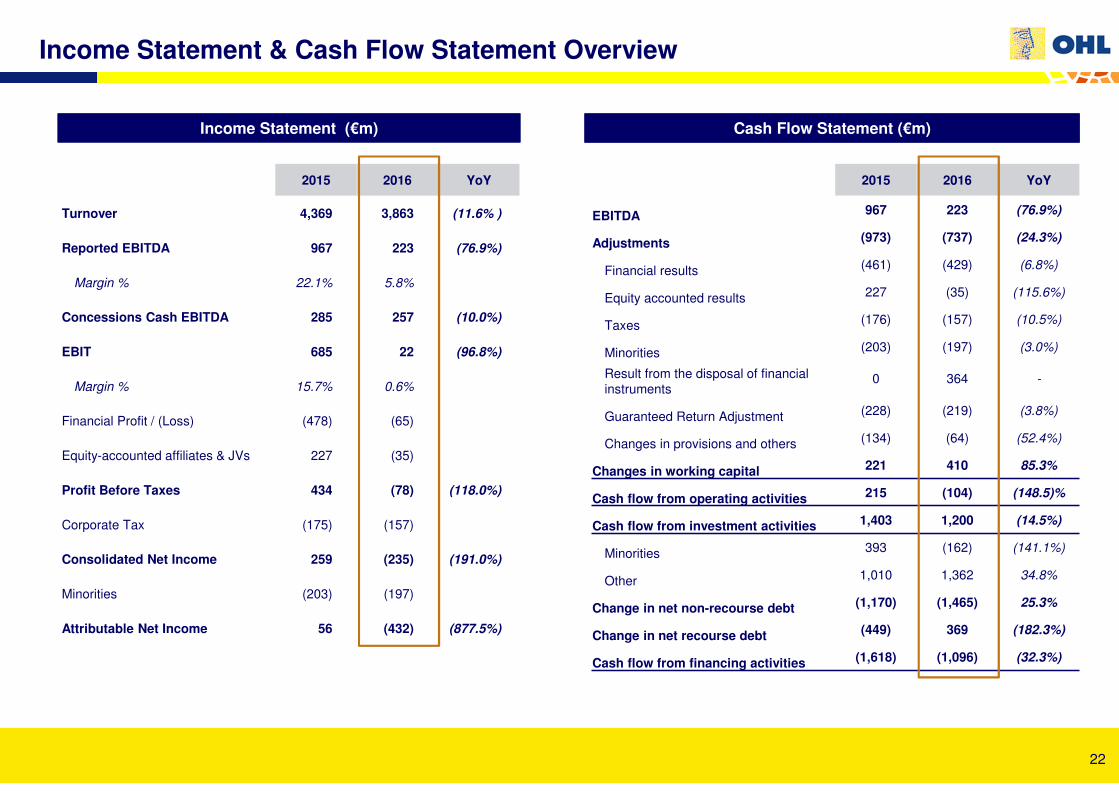
Income Statement & Cash Flow Statement Overview
2015 2016 YoY
Turnover 4,369 3,863 (11.6% )
Reported EBITDA 967 223 (76.9%)
Margin % 22.1% 5.8%
Concessions Cash EBITDA 285 257 (10.0%)
EBIT 685 22 (96.8%)
Margin % 15.7% 0.6%
Financial Profit / (Loss) (478) (65)
Equity-accounted affiliates & JVs 227 (35)
Profit Before Taxes 434 (78) (118.0%)
Corporate Tax (175) (157)
Consolidated Net Income 259 (235) (191.0%)
Minorities (203) (197)
Attributable Net Income 56 (432) (877.5%)
Income Statement (€m)Income Statement (€m) Cash Flow Statement (€m)Cash Flow Statement (€m)
2015 2016 YoY
EBITDA 967 223 (76.9%)
Adjustments (973) (737) (24.3%)
Financial results (461) (429) (6.8%)
Equity accounted results 227 (35) (115.6%)
Taxes (176) (157) (10.5%)
Minorities (203) (197) (3.0%)
Result from the disposal of financial instruments
0 364 -
Guaranteed Return Adjustment (228) (219) (3.8%)
Changes in provisions and others (134) (64) (52.4%)
Changes in working capital 221 410 85.3%
Cash flow from operating activities 215 (104) (148.5)%
Cash flow from investment activities 1,403 1,200 (14.5%)
Minorities 393 (162) (141.1%)
Other 1,010 1,362 34.8%
Change in net non-recourse debt (1,170) (1,465) 25.3%
Change in net recourse debt (449) 369 (182.3%)
Cash flow from financing activities (1,618) (1,096) (32.3%)
23
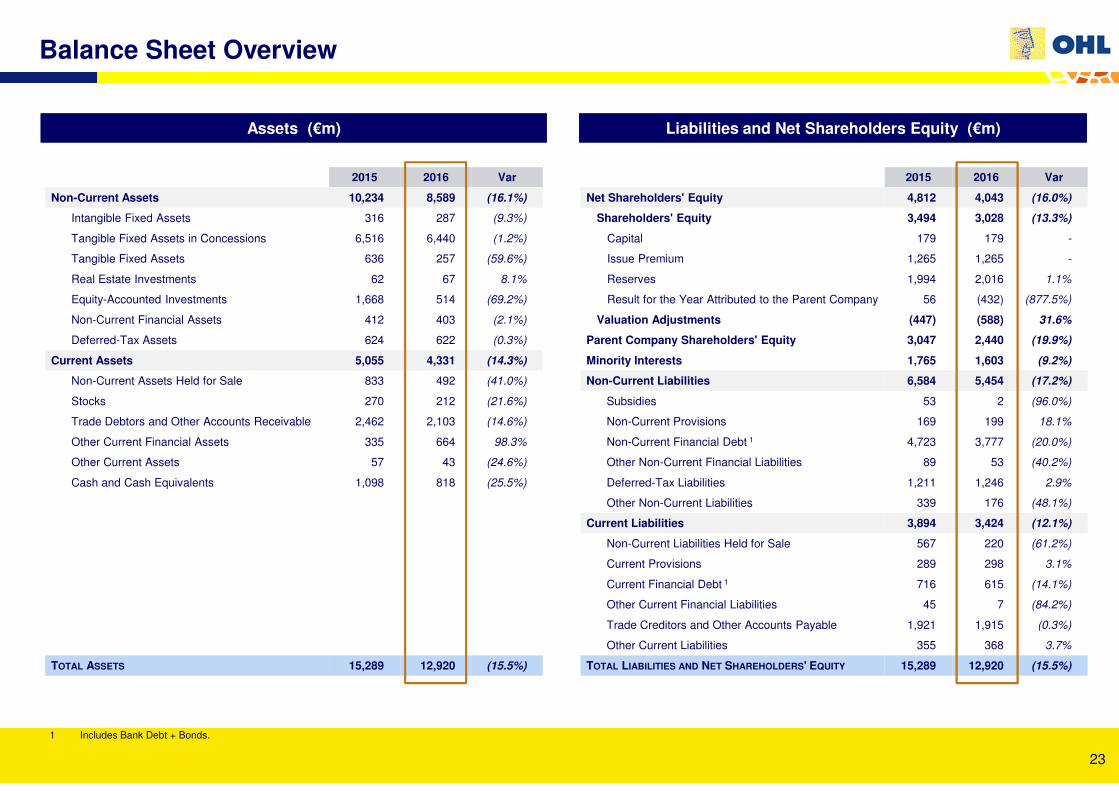
Balance Sheet Overview
2015 2016 Var
Non-Current Assets 10,234 8,589 (16.1%)
Intangible Fixed Assets 316 287 (9.3%)
Tangible Fixed Assets in Concessions 6,516 6,440 (1.2%)
Tangible Fixed Assets 636 257 (59.6%)
Real Estate Investments 62 67 8.1%
Equity-Accounted Investments 1,668 514 (69.2%)
Non-Current Financial Assets 412 403 (2.1%)
Deferred-Tax Assets 624 622 (0.3%)
Current Assets 5,055 4,331 (14.3%)
Non-Current Assets Held for Sale 833 492 (41.0%)
Stocks 270 212 (21.6%)
Trade Debtors and Other Accounts Receivable 2,462 2,103 (14.6%)
Other Current Financial Assets 335 664 98.3%
Other Current Assets 57 43 (24.6%)
Cash and Cash Equivalents 1,098 818 (25.5%)
TOTAL ASSETS 15,289 12,920 (15.5%)
2015 2016 Var
Net Shareholders' Equity 4,812 4,043 (16.0%)
Shareholders' Equity 3,494 3,028 (13.3%)
Capital 179 179 -
Issue Premium 1,265 1,265 -
Reserves 1,994 2,016 1.1%
Result for the Year Attributed to the Parent Company 56 (432) (877.5%)
Valuation Adjustments (447) (588) 31.6%
Parent Company Shareholders' Equity 3,047 2,440 (19.9%)
Minority Interests 1,765 1,603 (9.2%)
Non-Current Liabilities 6,584 5,454 (17.2%)
Subsidies 53 2 (96.0%)
Non-Current Provisions 169 199 18.1%
Non-Current Financial Debt 1 4,723 3,777 (20.0%)
Other Non-Current Financial Liabilities 89 53 (40.2%)
Deferred-Tax Liabilities 1,211 1,246 2.9%
Other Non-Current Liabilities 339 176 (48.1%)
Current Liabilities 3,894 3,424 (12.1%)
Non-Current Liabilities Held for Sale 567 220 (61.2%)
Current Provisions 289 298 3.1%
Current Financial Debt 1 716 615 (14.1%)
Other Current Financial Liabilities 45 7 (84.2%)
Trade Creditors and Other Accounts Payable 1,921 1,915 (0.3%)
Other Current Liabilities 355 368 3.7%
TOTAL LIABILITIES AND NET SHAREHOLDERS' EQUITY 15,289 12,920 (15.5%)
1 Includes Bank Debt + Bonds.
Assets (€m)Assets (€m) Liabilities and Net Shareholders Equity (€m)Liabilities and Net Shareholders Equity (€m)
24
Disclaimer
Any declaration made in this presentation that may differ from
previous past figures made in reference to, but not limited to; the
operational development, business strategies and future goals, are
to be interpreted only as future estimates, and as such, they
imply known and unknown risks, uncertainties and other factors
that could cause OHL’s results, behavior and achievements, or the
results and conditions of its activities, to be substantially different
to those and to its future estimates.
This presentation and the future estimations contained here within,
are given on this date and OHL expressly declines from any
obligation or compromise to give any update or revision of the
information contained here within, any change in its expectations
or modification in the facts, conditions and circumstances in which
these future estimates were founded.