Embed Size (px)
Citation preview
Sustainable LandManagement
CHALLENGES, OPPORTUNITIES, AND TRADE-OFFS
A G R I C U L T U R E A N D R U R A L D E V E L O P M E N T
36654
Pub
lic D
iscl
osur
e A
utho
rized
Pub
lic D
iscl
osur
e A
utho
rized
Pub
lic D
iscl
osur
e A
utho
rized
Pub
lic D
iscl
osur
e A
utho
rized
Pub
lic D
iscl
osur
e A
utho
rized
Pub
lic D
iscl
osur
e A
utho
rized
Pub
lic D
iscl
osur
e A
utho
rized
Pub
lic D
iscl
osur
e A
utho
rized


SustainableLANDMANAGEMENT

THE WORLD BANK
Washington, DC
SustainableLANDMANAGEMENT
Challenges, Opportunities, and Trade-offs
© 2006 The International Bank for Reconstruction and Development/The World Bank1818 H Street, NWWashington, DC 20433Telephone 202-473-1000Internet www.worldbank.orgE-mail [email protected]
All rights reserved.
1 2 3 4 :: 09 08 07 06
This volume is a product of the staff of the International Bank for Reconstruction andDevelopment / The World Bank. The findings, interpretations, and conclusions expressedin this volume do not necessarily reflect the views of the Executive Directors of TheWorld Bank or the governments they represent.
The World Bank does not guarantee the accuracy of the data included in this work.The boundaries, colors, denominations, and other information shown on any map in this work do not imply any judgment on the part of The World Bank concerning thelegal status of any territory or the endorsement or acceptance of such boundaries.
Rights and PermissionsThe material in this publication is copyrighted. Copying and/or transmitting portions or all of this work without permission may be a violation of applicable law. TheInternational Bank for Reconstruction and Development / The World Bank encouragesdissemination of its work and will normally grant permission to reproduce portions ofthe work promptly.
For permission to photocopy or reprint any part of this work, please send a requestwith complete information to the Copyright Clearance Center Inc., 222 Rosewood Drive, Danvers, MA 01923, USA; telephone: 978-750-8400; fax: 978-750-4470; Internet:www.copyright.com.
All other queries on rights and licenses, including subsidiary rights, should beaddressed to the Office of the Publisher, The World Bank, 1818 H Street NW,Washington, DC 20433, USA; fax: 202-522-2422; e-mail: [email protected].
ISBN-10: 0-8213-6597-5 e-ISBN: 0-8213-6598-3ISBN-13: 978-0-8213-6597-7 DOI: 10.1596/978-0-8213-6597-7
Library of Congress Cataloging-in-Publication Data has been applied for.
Tables, Figures, and Boxes vii
Acknowledgments ix
Acronyms and Abbreviations xi
Overview xiii
1. Introduction 1
2. Incidence and Effects of Land Degradation 5Changing Land Use: Its Causes and Implications 10Global Environmental Change 16
3. Challenges to Sustainable Land Management 18Appropriate Land Management Systems 18Improved Water Management 22Adapting to Climate Change 24Knowledge Dissemination and Land Policy Constraints 27
4. SLM Interventions:An Agri-technical Perspective 31Protecting the Land Resource:Agricultural Intensification
and Integrated Farming Systems 34Soil Fertility Management 35Market Opportunities Linked to Erosion Control Practices:
A Key to Adoption? 37Protecting and Managing Watersheds 39Exploiting the Production and Environmental Service Functions
of Land 42
v
C O N T E N T S
5. The Bank’s Evolving SLM Portfolio 50Past and Current Investments for SLM and Related Interventions 50The Pattern of Bank Group Investments in SLM, NRM, BioCarbon,
and Watershed Management Programs 51Lessons Learned 57
6. SLM: Strategic Options 59Policy and Sector Work 59Research and Technology Development 60Knowledge Sharing and Extension 63Providing Incentives, Expenditure Priorities, and Modes of Financing 66Recommended Approach and the Role of the World Bank Group 67
Appendix: Land Management and a Useful Plant Diversity Index (“V” Index) 70
Notes 73
Bibliography 75
Index 83
CONTENTSvi
Tables
4.1 Organizing Framework for Technical Aspects of Land and Natural Resource Management at the Watershed Level 41
4.2 Economic Valuation Techniques for PES 46
5.1 Summary of SLM Strategies Implemented across Sectors 52
5.2 Selected Examples of Investments for Watershed Management Programs in Different Regions:World Bank Watershed Management Projects (1990–2004) 55
6.1 The ASB Matrix 60
Figures
2.1 The DPSIR Framework for Assessing Land Degradation and SLM Intervention Points 7
2.2 Global Food Production, Food Price, and Total Number of Undernourished People (1991–2003) 9
2.3 Agricultural Expansion and Deforestation 15
3.1 Five Broad Clusters of Forces Driving Tropical Deforestation and Land Degradation 20
vii
TA B L E S , F I G U R E S , A N D B OX E S
4.1 Effects of Land and Water Management at the Watershed Level 40
5.1 Actual World Bank Lending by Region for Sustainable Natural Resource Management Projects with More Than 25 Percent of Total for SLM 53
5.2 BioCarbon Projects by Region 56
5.3 Carbon Value of BioCarbon Projects by Land Management Category 56
A1.1 Relationship between Land Use Type, Plant Biodiversity, and Oil Palm Tenure, Jambi, Sumatra 71
A1.2 Relationship between Land Use Type, Plant Biodiversity, and Age of Oil Palm Plantation, Jambi District, Sumatra (Indonesia) 72
A1.3 Relationship between Employment and Plant Biodiversity, Jambi, Sumatra 72
Boxes
2.1 Ecosystem Services 6
2.2 Land Use Dynamics in the Cerrado (Brazil) and the Miombo (Southern Africa) 16
3.1 Blue and Green Water Management for SLM and Enhanced Productivity 23
3.2 SLM and Enhancing Water Productivity 25
3.3 Projected Country-Level Effects of Climate Change on Rain-Fed Cereal Production (IPCC 2001) 26
4.1 A Vision for Improved Land and Water Management in Rural Landscapes 34
4.2 Linking Income-Earning and Cost-Saving Opportunities to Soil Conservation Practices and Control of Pollution and Sedimentation 39
4.3 Assessing Whether Forests and Reforestation Are Beneficial forHydrology and Groundwater Recharge 43
4.4 Madagascar’s Protected Areas and Payments for Environmental Services 48
viii TABLES, FIGURES,AND BOXES
ix
A C K N O W L E D G M E N T S
The preparation of this report was managed by the Agriculture and Rural Devel-opment (ARD) Department. Erick Fernandes and Richard Burcroff wrote thereport with substantive contributions from Jonathan Anderson, MalcolmBlackie, Mustapha Ceesay, Enos Esikuri, Andrew Gillison, Nteranya Sanginga,Eric Smaling, and Erika Styger.
The authors are grateful for constructive comments and suggestions fromthe peer reviewers: Shawki Bhargouti, Aziz Bouzaher, Guy Evers (FAO), NadimKhouri, James Smyle, and Mark Wilson. Many others provided inputs, includ-ing Tom Tomich (ICRAF), Steve Vosti (UC Davis), Gerhard Dieterlhe, SalahDarghouth, and Severin Kodderitzsch, as well as Melissa Williams, MarisaBaldwin, and Sarian Akibo-Betts.
Kevin Cleaver and Sushma Ganguly provided strong support throughoutthe development of this report and helped focus the scope of the document.The report is intended to support the efforts of the development communityand national stakeholders to better integrate land and natural resource man-agement approaches to improve rural livelihoods and reduce poverty.

ANGAP National Association for the Management of Protected Areas in Madagascar
ASB Alternatives to Slash and Burn
BNF biological nitrogen fixation
CAS country assistance strategy
CER certified emissions reduction
CGIAR Consultative Group on International Agricultural Research
CIMMYT International Center for Maize and Wheat Improvement
DFID United Kingdom Department for International Development
DPSIR Driving Forces, Pressures, State, Impacts, Responses
ERR economic rate of return
ESW economic and sector work
FAO Food and Agriculture Organization
FRP Forestry Research Program
GDP gross domestic product
GEF Global Environment Facility
GIS geographic information system
IBRD International Bank for Reconstruction and Development
IDA International Development Assistance
MEA Millennium Ecosystem Assessment
xi
A C R O N Y M S A N D A B B R E V I AT I O N S
NRM natural resource management
OECD Organisation for Economic Co-operation and Development
OED Operations Evaluation Department
PES payments for environmental services
PFT plant functional type
PIR nucleus estate/smallholder system
PRSP poverty-reduction strategy program
SLM sustainable land management
WSM watershed management
xii ACRONYMS
In the twenty-first century, food and fiber production systems will need tomeet the following three major requirements:
1. Adequately supply safe, nutritious, and sufficient food for the world’sgrowing population.
2. Significantly reduce rural poverty by sustaining the farming-derived component of rural household incomes.
3. Reduce and reverse natural resource degradation, especially that of land.
It is now known that these challenges will need to be resolved in the face of sig-nificant but highly unpredictable changes in global climate—a key factor innatural and agroecosystem productivity. Other major issues that will influencehow agriculture evolves to meet the challenge of food security include global-ization of markets and trade, the increasing market orientation of agriculture,significant technological changes, and increasing public concern about theeffects of unsustainable natural resource management.
The overall goal of this report is to give strategic focus to the implementa-tion of the sustainable land management (SLM) components of the WorldBank’s corporate strategies. The specific objectives of the report are to articu-late priorities for investment in SLM and natural resource management and toidentify the policy, institutional, and incentive reform options that will accel-erate the adoption of SLM productivity improvements and pro-poor growth.The primary audiences for the report are policy makers and project managersin our partner countries and development organizations, as well as Bank coun-
xiii
OV E R V I E W
OVERVIEW
try and sector managers and task team leaders. There is broad interest amongthese partners in collaborating with the Bank on SLM and on the rehabilita-tion of degraded lands.
DEFINITION OF SLM
SLM is defined as a knowledge-based procedure that helps integrate land, water,biodiversity, and environmental management (including input and outputexternalities) to meet rising food and fiber demands while sustaining ecosystemservices and livelihoods. SLM is necessary to meet the requirements of a grow-ing population. Improper land management can lead to land degradation and asignificant reduction in the productive and service (biodiversity niches, hydrol-ogy, carbon sequestration) functions of watersheds and landscapes.
In layman’s terms, SLM involves:
� Preserving and enhancing the productive capabilities of land in cropped andgrazed areas—that is, upland areas, downslope areas, and flat and bottomlands; sustaining productive forest areas and potentially commercial and non-commercial forest reserves; and maintaining the integrity of watersheds forwater supply and hydropower generation needs and water conservation zonesand the capability of aquifers to serve farm and other productive activities.
� Actions to stop and reverse degradation—or at least to mitigate the adverseeffects of earlier misuse—which is increasingly important in the uplandsand watersheds, especially those where pressure from the resident popula-tions is severe and where the destructive consequences of upland degrada-tion are being felt in far more densely populated areas “downstream.”
CHALLENGES TO SLM
At the global level, a large area of formerly productive land has been renderedunproductive. Caution is required in interpreting the extent of land degrada-tion and desertification described in the international literature, because localcommunities often have age-old strategies that allow them to manage land,forest, fallow, and water resources at variable and interacting spatial and tem-poral levels. However, there is a general consensus that it is far less expensive toprevent land degradation via the application of good management based onboth cultural and scientific knowledge than to rehabilitate degraded land, andthat where land is truly degraded, significant production and ecosystem servicebenefits can result from the rehabilitation of degraded lands.
The potentially deleterious effects of global climate change and naturalcatastrophes (earthquakes, tsunamis, hurricanes, and volcanic activity) on landresources are proving difficult to anticipate, both for the Bank and its clientsand for the international community as a whole. In this area, adaptive man-
xiv
agement tailored to decrease the vulnerability of regions and communities willbe increasingly necessary. Other driving forces behind degradation that can bereversed might best be termed “behavioral.” These include misaligned policiesand incentives; unclear property rights, especially use rights; and weak enforce-ment capabilities, often aggravated by corruption and governance problems.
Given the scale of potential benefits and negative effects, it is essential forproblem diagnosis, assessments of resource use alternatives, and cost-benefitanalyses to be conducted at appropriate spatial and temporal levels. Moreemphasis needs to be placed on planning and implementation at the watershedand landscape levels. Given the transboundary effects of land, water, and otherresource management costs and benefits, equitable regional arrangements andtreaties will need to be considered and revised as necessary.
Property rights to resources such as land, water, and trees have been foundto play a fundamental role at the nexus of poverty reduction, resource manage-ment, and environmental management. The property rights held by poor peo-ple represent key household and community assets that may provide incomeopportunities, ensure access to essential household subsistence needs (water,food, fuel, and medicines), and insure against livelihood risk. Poorer groupstend to rely more heavily on customary or informal rights. It is unlikely thatSLM can be achieved in the absence of explicit attention to property rights.
OPPORTUNITIES FOR SLM
Where land and resource management programs have been successful, the fol-lowing contributing factors have often been present: (a) local community par-ticipation in all aspects of the program, (b) public support for private invest-ment in soil and water conservation, (c) improvement and maintenance ofroads, (d) sound macroeconomic management that does not discriminateagainst agriculture and natural resources, (e) robust local capacity building bynongovernmental organizations and other cooperative-type projects, and (f)consistent efforts over at least a decade by concerned governments to increasenot only land productivity but also awareness of environmental problems andpossible solutions at local levels.
Intensification of Land Use and Integrated Resource Management
Production practices that emphasize integrated nutrient and water manage-ment—for example, no-till production, conservation tillage, or mixed crop-ping that combines food crops with cover crop legumes and/or tree and shrubspecies—can greatly facilitate SLM. Coupled with enhanced management,improved breeds and varieties of animals, crops, and trees can also significantlyincrease resource use efficiency in agroecosystems and plantations and reducedpressure on pristine lands, including primary and healthy secondary forests.
xvOVERVIEW
OVERVIEW
The conservation of native above- and below-ground biodiversity is oftenrequired for sustaining ecological processes (nutrient cycles, pest-predator asso-ciations, and soil structure and function) and to maintain the resilience ofmost agroecosystems. The stocks of available plant nutrients need to be man-aged to prevent consumption from exceeding availability and, where necessary,effective recycling of crop residues and manures ought to be supplemented byexternal (organic and/or fertilizer) sources in order to sustain system functionand productivity.
Exploiting the Production and Environmental Functions of Land
In addition to facilitating the production of food, feeds, and industrial crops,natural and agroecosystems also provide a wide variety of “nonmarket” ser-vices. The environmental benefits (or services) derived from well-managedagroecosystems typically include but are not limited to (a) improved hydrol-ogy: controlling the timing and volume of water flows and protecting waterquality; (b) reduced sedimentation: avoiding damage to downstream reser-voirs and waterways, thereby safeguarding uses such as hydroelectric powergeneration, irrigation, recreation, and providing the water necessary for fish-eries and domestic water supplies; (c) disaster prevention: preventing floodsand landslides; (d) biodiversity conservation; and (e) sequestering carbon andproviding sinks for other greenhouse gases.
Payments for environmental services are increasingly important sources ofincome for land users. For example, the World Bank has pioneered the marketfor carbon emissions reductions via the $165 million prototype carbon fund topromote compensation for carbon emission reductions in developing coun-tries. Communities in Central America have received payments for carbonsequestration via a program collaboratively financed by the Bank and theGlobal Environment Facility.
Mechanisms and Incentives for Improved Land Management at the Watershed Level
The following “best practices” have been found to facilitate upstream-down-stream land and water management and the equitable assessment of costs andbenefits:
� All parties in the watershed are given a stake in the management programand in watershed development functions as an equity-enhancing mecha-nism.
� Because water is often the most valuable resource of watershed manage-ment, it is essential to develop mechanisms that allow an equitable sharingof the water. This resource sharing can substitute for direct payments tosome stakeholders.
xvi
� Where common property is involved, especially in the upper catchments, itis essential that local communities collectively protect the common land sothat land and water resources are not compromised by illegal deforestationor overgrazing and subsequent land degradation.
� If irrigation water is used to produce greater vegetation biomass on com-mon lands, biomass-sharing agreements are needed, especially for landlessstakeholders.
� If water harvesting results in improved recharge of groundwater aquifers,designating groundwater as a common property resource can provide allstakeholders with a powerful incentive to improve natural resources man-agement practices and to promote collective action.
TRADE-OFFS AND SLM STRATEGIC OPTIONS
Though the specifics will vary from country to country and region to region,there are four main components to a comprehensive strategy for facilitatingsustainable land and natural resource management. These include:
� Policy and sector work� Research and technology development� Knowledge sharing and extension� Providing incentives, expenditure priorities, and modes of financing
Policy and Sector Work
Further empirical work is necessary to clarify the private and social costs andbenefits of alternative land use systems. Tradeoffs and synergies need to beidentified and quantified where possible. Policy makers need such informationwhen deciding on the relative priorities for the alignment of producer and con-sumer price incentives, fiscal and financial subsidies, licensing fees and taxa-tion, and the structure of protection in the context of a country’s environmen-tal and social policy objectives.
Research and Technology Development
A revitalization of investments in agricultural and land use research will be needed to underpin the undertaking of SLM strategies and programs at the country and agroecological zone levels. Emphasis must be given to theadaptation and improvement of technologies associated with agriculturalintensification, the management and rehabilitation of forest cover in sensitivewatersheds, and more effective water management (to avert salinization andmitigate flooding) on irrigated and bottom lands.
A large number of studies have demonstrated that investments in agricul-tural and natural resource management research can produce significant
xviiOVERVIEW
OVERVIEW
returns. Despite this evidence, however, current trends are not encouraging. Inthe wake of the generally successful “Green Revolution” of the 1970s and 1980s,fiscal and financial resource transfers to most national agricultural researchsystems and institutes have fallen sharply. For example, African countries nowspend only 0.5 percent of their agricultural gross domestic product (GDP) onresearch. A significantly increased adaptive effort is required on issues such asnutrient management and monitoring nutrient balances at appropriate scales,development of stress-tolerant varieties, and the rehabilitation of degradedlands.
Investing in research on how to better adapt current land management sys-tems to cope with increasing climate variability and climate change and theassociated shocks and stresses, such as drought, flood, pests, and soil salinity,will also result in improved adaptation to climate change.
Geographic information systems (GIS), geo-spatial mapping, and remotesensing technologies are central to achieving a successful transition from tra-ditional environmental and resource management practices to sustainabledevelopment because of their integrative quality (linking social, economic, andenvironmental data) and their place-based quality (addressing relationshipsamong places at local, national, regional, and global levels).
For instance, there is growing recognition by decision makers that problemsat the intersection of agriculture and environmental management, climatechange, and land vegetative cover change, with their attendant social and eco-nomic consequences, will be at the forefront in the new century. Technologicaladvances in GIS fostering the integration of satellite imagery with other data(such as socioeconomic or health data) are opening new ways to synthesizecomplex and diverse geographic data sets, creating new opportunities for col-laboration among natural and social scientists and decision makers at all levels.
Knowledge Sharing and Extension
For improved land management practices, it will be important to build farmerinnovation into national extension programs and into agricultural and naturalresource management initiatives. Experience shows that farmers do not pas-sively wait for extension advice, but actively experiment and innovate withagricultural and natural resource management practices. A major advantage ofinnovations by farmers is that they are site-specific and often are readilyacceptable to neighboring farmers. The incorporation of the farmer innova-tion approach within a systematic venue can significantly improve the perfor-mance of agroextension and technoadvisory services, particularly in the fieldof soil and water conservation, where the visual impact of demonstrations canbe a powerful way to attract potential end users of new “best practices.”Although land users can financially contribute to costs, public funding will berequired in the poorer areas to prepare and facilitate such visits and provide
xviii
follow-up. The establishment of research partnerships will be central to help-ing farmers conserve their land and water resources and meet other environ-mental and social objectives. Advising and assisting agriculturalists in this areamight be commercially unattractive for private companies, but it should be anappropriate initial role for the public sector with the aim of establishing effec-tive public-private sector partnerships.
When designing extension programs (privately operated or public sector)and the feedback systems that can capture farmer innovations, considerationshould be given to establishing regional centers where information on bestpractices or success stories can be accessed by farmers’ organizations and otherentities. Such an approach is especially important in the larger countries andin those with an agroecologically diverse natural resource endowment, where a“one-size-fits-all” approach does not work and innovative technologies need tobe adapted to local conditions.
Providing Incentives, Expenditure Priorities, and Modes of Financing
SLM practices are likely to be adopted where agriculture is important in rurallivelihoods, where agricultural land is in short supply, and/or where SLM hasthe potential to increase yields of high-value crops.
Policies to facilitate SLM are more likely to be successful if they provide tan-gible benefits to the individual household or community by emphasizingenhanced agricultural productivity, food security, and income, rather than bycontrolling land degradation per se. In this context, a policy framework whichprovides for market access and attractive producer prices is essential to SLM.
In addition to offering policy incentives, normally operating at price and costmargins sufficient to redirect the private sector’s utilization of resources in direc-tions deemed socially desirable, achieving SLM will require additional invest-ments in research and technology generation, knowledge dissemination, and theintegration of knowledge and policies at appropriate spatial and temporal levels.
The costs of these investments can be considerable in countries where severedegradation has already taken place—often over decades and even centuries—and in those countries that will be hard hit by increasing climate variability andeventual climate change. Thus governments will need to (a) realistically assessthe availability of resources, domestic and foreign, then (b) prioritize invest-ments to rehabilitate the most egregiously damaged lands and soils (as meas-ured, primarily, by the opportunity costs of taking no action), (c) develop arealistic phasing of investments, (d) set forth financing plans, and (e) seekagreements with likely beneficiaries in the private sector and civil society, bothto participate in program implementation and to share a portion of the costsin accord with agreed mechanisms. To stimulate the involvement of privateinvestors in land-friendly commercial activities would relieve pressures on the
OVERVIEW xix

budget for adequate program finance while bringing to bear some of the flex-ibility and responsiveness needed to address the physical and financial contin-gencies associated with the kinds of investments mentioned. The use of riskreduction or guarantee funds or the provision of insurance, partially under-written by government, might prove sufficient in some countries to induce astrong private sector response.
xx OVERVIEW

This report focuses on land management issues for the sustainableintensification of food and fiber systems and for the rehabilitation ofdegraded crop, pasture, and forestlands. While good land management
is important at the field and farm level, it is not enough to ensure sustainabil-ity. The planning and execution of sound resource management at the water-shed (catchment*) level and even beyond (often referred to as the “landscapelevel”) is increasingly important for retaining ecological integrity and ensuringthat food and fiber systems are resilient enough to absorb shocks and stressesand avoid degradation of land and water resources (FRP 2005). New scientificknowledge detailing the extent and importance of ecosystem services and theirroles in sustaining humans and our agroecosystems is now becoming available.The social and economic values of these services provide new opportunities forpolicies to encourage SLM. Recent advances in remote sensing tools will greatlyfacilitate the timely monitoring of land management effects and resourcedegradation by both users and policy makers. However, new investments willbe necessary to meet the demand from land users to (a) improve access toexisting knowledge and information of SLM and the consequences of in-appropriate management, (b) appropriately intensify land use, and (c) rehabili-tate land that has been degraded for both productive and ecosystem functions.
1
IntroductionC H A P T E R O N E
*The terms “watershed” and “catchment” are used interchangeably. In this context, bothterms mean the topographic basin that collects water from the surrounding ridges. Alandscape may contain one or more watersheds or catchments.
In the twenty-first century, food and fiber production systems will need tomeet three major requirements:
1. Adequately supply safe, nutritious, and sufficient food for the world’sgrowing population.
2. Significantly reduce rural poverty by sustaining the farming-derived com-ponent of rural household incomes.
3. Reduce and reverse natural resource degradation, especially that of land.
It is now known that these challenges will need to be resolved in the face of sig-nificant but highly unpredictable changes in global climate—a key factor innatural and agroecosystem productivity. Other major issues that will influencehow agriculture evolves to meet the challenge of food security include global-ization of markets and trade, the increasing market orientation of agriculture,significant technological changes, and increasing public concern about theeffects of unsustainable natural resource management.
SLM is defined as a knowledge-based procedure that helps integrate land,water, biodiversity, and environmental management (including input and out-put externalities) to meet rising food and fiber demands while sustainingecosystem services and livelihoods. SLM is necessary to meet the requirementsof a growing population. Improper land management can lead to land degra-dation and a significant reduction in the productive and service functions.1 Inlayman’s terms, SLM involves:
� Preserving and enhancing the productive capabilities of land in croppedand grazed areas—that is, upland areas, downslope areas, and flat and bot-tom lands; sustaining productive forest areas and potentially commercialand noncommercial forest reserves; and maintaining the integrity of water-shed for water supply and hydropower generation needs and water conser-vation zones and the capability of aquifers to serve the needs of farm andother productive activities.
� Actions to stop and reverse degradation—or at least to mitigate the adverseeffects of earlier misuse—which is increasingly important in uplands andwatersheds, especially those where pressure from the resident populationsare severe and where the destructive consequences of upland degradationare being felt in far more densely populated areas “downstream.”
The requisites of successful SLM do not operate in isolation from otherenvironmentally strategic interventions. For example, SLM will clearly overlapwith, and to some extent be dependent on, progress in improving the sustain-ability of agriculture, as well as associated soil conservation efforts; responsiblewater management; and accountable livestock management and reduced-impact logging practices. However, there are manifestly important aspects of
2 SUSTAINABLE LAND MANAGEMENT
SLM that singularly pertain to the most significant land issues, namely sus-taining soil productivity and averting land degradation.
The causes of the more obvious kinds of degradation have been fairly welldocumented. These causes—whether the result of population pressure, de-forestation and abuse of forest margins, disregard (or ignorance) of the envi-ronmental consequences stemming from the dominant crop-livestock system,or industrialization and urbanization—can be grouped, in general terms, intothree categories:
� Those owing to chemical and physical processes resulting from interactionbetween the prevailing agricultural and industrial technologies and the sur-rounding land resource base.
� Those of a grander or “macro” nature, such as global warming or volcaniceruption, whose consequences can be anticipated even if the onset of dam-age cannot be forecast with precision.
� Those whose roots are behavioral, whether deliberate—and thus the resultof improper private incentives ultimately linked to market failure—orstemming from lack of knowledge or from technologies.
Not all of these causes are amenable to remediation through policy reformand institutional development, such as research, education, or reforms to “inter-nalize the externalities” associated with land use decisions. The potentiallydeleterious effects of global warming and natural catastrophes (for example,earthquakes, tsunamis, hurricanes, and volcanic activity) on SLM are provingdifficult to anticipate, both for the Bank and its clients and for the internationalcommunity as a whole. In this area, adaptation, tailored to decrease the vul-nerability of regions and communities is one viable approach. Quick fixes arenot likely to show great promise, at least not from the standpoint of guaran-teeing longer-term sustainability, much less a broad-based mitigation of on-going degradation.
But much can be done to attain SLM, and it is the contention of this reportthat significant gains can result from understanding and respecting traditionaland cultural approaches to natural resource management and generating andapplying scientific and technical knowledge of the biological, chemical, andphysical processes that cause or prevent degradation and desertification.Though much of the research will necessarily be tailored to local biophysicalenvironments, such research is still needed in many parts of the world to enableus to better understand the untoward side effects of local land use practices andto establish a firmer empirical basis for improved land management. Other driv-ing forces behind degradation that can be reversed might best be termed “behav-ioral.” These include misaligned incentives policies; unclear property rights,especially use rights; and weak enforcement capabilities, often aggravated bycorruption and governance problems. These range from (a) the most obviousmisalignments between private and social costs, often encouraged through sub-
INTRODUCTION 3
sidies and taxes, direct and indirect, that might, for example, promote a damag-ing overapplication of farm chemicals or irrigation water to (b) the problem ofthe commons on upland rangelands, where individual property rights areunclear and the local communities’ rights to regulate land use are either unclearor unenforceable to (c) the widespread and often illegal harvesting of publiclyowned forestlands. All are amenable to policy reform and corrective action.
Simple lack of knowledge is another leading cause of misuse of the landresource, both by farmers and others exercising their land usufruct and by pub-lic authorities responsible for, among other things, misguided or overly expen-sive infrastructure construction programs, including those that prove toocostly to maintain.2 Again, such lack of knowledge, though pervasive, can becountered by education programs, as well as by technical advice and by animprovement in land use–monitoring capabilities.
The remainder of this study is presented in five chapters. Chapter 2 willreview the factors underlying land degradation in some detail, including itsapparent root causes and other contributing factors. In Chapter 3, the reportidentifies the requisites for shifting to a posture of SLM as quickly as possiblein various parts of the world, and anticipates activities that should be under-taken by the international community, and especially by the Bank’s clientstates. Chapter 4 examines in greater detail the kinds of SLM interventionslikely to result in improved management and the cessation of degradation,while Chapter 5 reviews the Bank’s evolving SLM portfolio. Chapter 6 thenproposes an action program for the Bank.
The overall goal of this report is to highlight the key SLM issues and emerg-ing challenges that require urgent investments and to give strategic focus toimplementation of the SLM components of the World Bank’s corporate strate-gies. Its specific objectives are to identify the policy, institutional, and incentivereform options that will accelerate the adoption of SLM productivity improve-ments and pro-poor growth and to articulate priorities for investment in SLMand natural resource management (NRM). The primary audiences for thereport are policy makers and project managers in our partner countries anddevelopment organizations, as well as Bank country and sector managers andtask team leaders. There is broad interest among these partners in collaborat-ing with the Bank on SLM and the rehabilitation of degraded lands. The reportwill be widely disseminated via the Bank, the Global Environment Facility(GEF), and the United Nations Convention to Combat Desertification chan-nels and will be used to guide external agencies and the Bank’s partners on thebest policy, institutional, and investment options for SLM and NRM in general.
4 SUSTAINABLE LAND MANAGEMENT
At present, land use practices in many developing countries are result-ing in land, water, and forest degradation, with significant repercus-sions for the countries’ agriculture sectors, natural resource bases, and
ecoenvironmental balances. Land degradation can be defined as the loss ofland productivity through one or more processes, such as reduced soil biolog-ical diversity and activity, the loss of soil structure, soil removal due to windand water erosion, acidification, salinization, waterlogging, soil nutrient min-ing, and pollution.
Land degradation also results in the loss of ecosystem services (box 2.1),which further undermines the sustainability of both managed and naturalecosystems. Blaikie and Brookfield (1987) observed that land and water degra-dation may be unintentional and unperceived; it may result from carelessnessor from the unavoidable struggle of vulnerable populations for the necessitiesof survival.
Land degradation is a global phenomenon that endangers the livelihoods ofrural farmers—indeed, of the population at large—as well as a country’s abil-ity to produce crops, livestock, and products from other natural resources.Population pressure, disparities in access to the more productive lands, andcivil strife have all pushed farmers into cultivating ever-steeper slopes forsmall-scale food crop production. For example, in many African, CentralAmerican, and Southeast Asian countries 50 to 70 percent of total agriculturaloutput value comes from hillside farms, a semi-subsistence regime whose prac-titioners are among the smallest and poorest farming households. Farming on
5
Incidence and Effects of Land Degradation
C H A P T E R T W O
6 SUSTAINABLE LAND MANAGEMENT
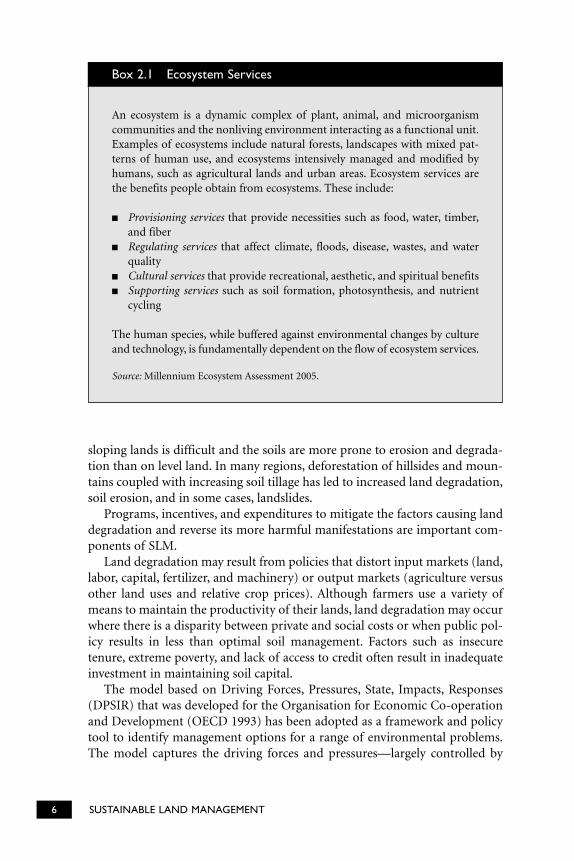
An ecosystem is a dynamic complex of plant, animal, and microorganismcommunities and the nonliving environment interacting as a functional unit.Examples of ecosystems include natural forests, landscapes with mixed pat-terns of human use, and ecosystems intensively managed and modified byhumans, such as agricultural lands and urban areas. Ecosystem services arethe benefits people obtain from ecosystems. These include:
� Provisioning services that provide necessities such as food, water, timber,and fiber
� Regulating services that affect climate, floods, disease, wastes, and waterquality
� Cultural services that provide recreational, aesthetic, and spiritual benefits� Supporting services such as soil formation, photosynthesis, and nutrient
cycling
The human species, while buffered against environmental changes by cultureand technology, is fundamentally dependent on the flow of ecosystem services.
Source: Millennium Ecosystem Assessment 2005.
Box 2.1 Ecosystem Services
sloping lands is difficult and the soils are more prone to erosion and degrada-tion than on level land. In many regions, deforestation of hillsides and moun-tains coupled with increasing soil tillage has led to increased land degradation,soil erosion, and in some cases, landslides.
Programs, incentives, and expenditures to mitigate the factors causing landdegradation and reverse its more harmful manifestations are important com-ponents of SLM.
Land degradation may result from policies that distort input markets (land,labor, capital, fertilizer, and machinery) or output markets (agriculture versusother land uses and relative crop prices). Although farmers use a variety ofmeans to maintain the productivity of their lands, land degradation may occurwhere there is a disparity between private and social costs or when public pol-icy results in less than optimal soil management. Factors such as insecuretenure, extreme poverty, and lack of access to credit often result in inadequateinvestment in maintaining soil capital.
The model based on Driving Forces, Pressures, State, Impacts, Responses(DPSIR) that was developed for the Organisation for Economic Co-operationand Development (OECD 1993) has been adopted as a framework and policytool to identify management options for a range of environmental problems.The model captures the driving forces and pressures—largely controlled by
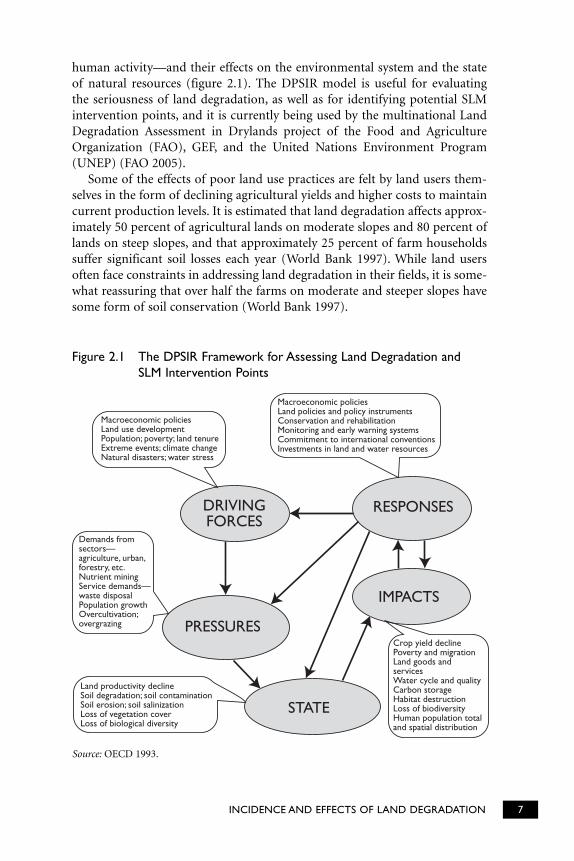
human activity—and their effects on the environmental system and the stateof natural resources (figure 2.1). The DPSIR model is useful for evaluating the seriousness of land degradation, as well as for identifying potential SLMintervention points, and it is currently being used by the multinational LandDegradation Assessment in Drylands project of the Food and AgricultureOrganization (FAO), GEF, and the United Nations Environment Program(UNEP) (FAO 2005).
Some of the effects of poor land use practices are felt by land users them-selves in the form of declining agricultural yields and higher costs to maintaincurrent production levels. It is estimated that land degradation affects approx-imately 50 percent of agricultural lands on moderate slopes and 80 percent oflands on steep slopes, and that approximately 25 percent of farm householdssuffer significant soil losses each year (World Bank 1997). While land usersoften face constraints in addressing land degradation in their fields, it is some-what reassuring that over half the farms on moderate and steeper slopes havesome form of soil conservation (World Bank 1997).
INCIDENCE AND EFFECTS OF LAND DEGRADATION 7
Macroeconomic policiesLand use developmentPopulation; poverty; land tenureExtreme events; climate changeNatural disasters; water stress
Demands from sectors—agriculture, urban,forestry, etc.Nutrient miningService demands—waste disposalPopulation growthOvercultivation;overgrazing
Land productivity declineSoil degradation; soil contaminationSoil erosion; soil salinizationLoss of vegetation coverLoss of biological diversity
Crop yield declinePoverty and migrationLand goods andservicesWater cycle and qualityCarbon storageHabitat destructionLoss of biodiversityHuman population totaland spatial distribution
Macroeconomic policiesLand policies and policy instrumentsConservation and rehabilitationMonitoring and early warning systemsCommitment to international conventionsInvestments in land and water resources
DRIVINGFORCES
RESPONSES
IMPACTS
PRESSURES
STATE
Figure 2.1 The DPSIR Framework for Assessing Land Degradation andSLM Intervention Points
Source: OECD 1993.
Desertification is a reflection of land degradation in arid, semiarid, and dry,subhumid areas (drylands) resulting mainly from adverse human effects. It isa widespread but spatially concentrated process of land degradation in theworld’s drylands that is quite different from the phenomenon of observedcyclic oscillations of vegetation productivity at desert fringes (desert expansionor contraction), such as has recently been revealed by satellite data and isrelated to climate fluctuations. Some estimates claim that desertificationdirectly affects about 3.6 billion hectares—70 percent of the earth’s total, dry-lands, or nearly a quarter of its total land area. The immediate consequences ofdesertification are felt by about one-sixth of the world’s population. These fig-ures exclude natural hyperarid deserts.
At present, desertification in the drylands manifests itself through:
� Overexploitation and degradation of 3,333 million hectares or about 73percent of the total area of rangelands, which are of low potential forhuman and animal carrying capacity and have a low population density butmay be intrinsically resilient and might have considerable capacity to recu-perate and regain their potential productivity if properly managed.
� Reductions in soil fertility and soil structure, leading gradually to soil loss on216 million hectares of rain-fed croplands or nearly 47 percent of their totalarea in the drylands. These constitute the most vulnerable and fragile amongthe marginally cultivable lands subjected to increasing population pressure.
� Degradation of 43 million hectares of irrigated croplands, or nearly 30 per-cent of their total area in the drylands, which usually have the highest agri-cultural potential and the greatest population densities when well managed.(UNEP 2006)
It is important to point out, however, that there is significant uncertainty as tothe true extent of degraded lands at regional and global levels (Reij et al. 1996).Nevertheless, the local, regional, and global consequences of land degradationare serious and reasonably well known. Figure 2.1 demonstrates the multiplepoints of potential intervention for land degradation control. Soil conservationmay be the most immediate, but equally effective could be measures to stembiodiversity loss, such as reduced grazing pressure, increased water use effi-ciency, and protection of soil carbon stocks.
Extensive degradation also stems from the overexploitation of lands in thewatersheds. When coupled with inadequate water management downstream,the consequences can be quite severe, including:
� A markedly increased vulnerability to flooding and landslides� Dry season water scarcity� Declining water quality from increased sediments and nutrients such as
nitrogen
8 SUSTAINABLE LAND MANAGEMENT
� Sedimentation and increased costs to hydroelectric, irrigation, and munici-pal water systems
� Reduced productivity of inland aquaculture and harm to marine fisheries� Increased stress, and ultimately permanent damage, to watersheds and wet-
lands
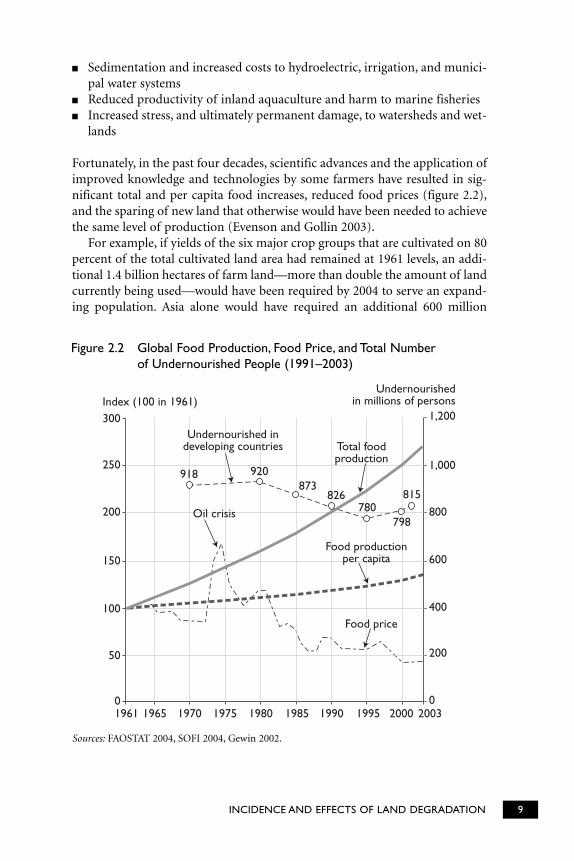
Fortunately, in the past four decades, scientific advances and the application ofimproved knowledge and technologies by some farmers have resulted in sig-nificant total and per capita food increases, reduced food prices (figure 2.2),and the sparing of new land that otherwise would have been needed to achievethe same level of production (Evenson and Gollin 2003).
For example, if yields of the six major crop groups that are cultivated on 80percent of the total cultivated land area had remained at 1961 levels, an addi-tional 1.4 billion hectares of farm land—more than double the amount of landcurrently being used—would have been required by 2004 to serve an expand-ing population. Asia alone would have required an additional 600 million
INCIDENCE AND EFFECTS OF LAND DEGRADATION 9
Index (100 in 1961)300
250
200
150
100
50
01961 1965 1970 1975 1980 1985 1990 1995 2000 2003
1,200
1,000
800
600
400
200
0
Undernourishedin millions of persons
Undernourished indeveloping countries Total food
production
Oil crisis
Food productionper capita
Food price
918 920873
826780
815
798
Figure 2.2 Global Food Production, Food Price, and Total Number of Undernourished People (1991–2003)
Sources: FAOSTAT 2004, SOFI 2004, Gewin 2002.
hectares, which represents 25 percent more land area than is suitable for culti-vation on that continent. Rather than enjoying surpluses of grains, Asia wouldnow be heavily dependent on food imports if crop yields had remained at 1961levels (Wood 2005).
Although agricultural growth in Africa has been significantly lower than inAsia and Latin America, examples of quantifiable success in agriculture andSLM have also been documented. Gabre-Madhin and Haggblade (2004) iden-tified major commodity-specific successes, such as breakthroughs in maizebreeding across Africa, sustained gains in cassava breeding and control ofmajor pests and plant diseases, successful control of the rinderpest livestockdisease, booming horticultural and flower exports in East and Southern Africa,and increased cotton production and exports in West Africa. Improved landmanagement led to higher crop yields, often derived from improved fallowmanagement, rotations with leguminous food and cover crop species, the tar-geted use of rock phosphate to enhance biological, nitrogen fixation, conser-vation (minimum tillage) farming, and innovative livelihood diversificationapproaches involving agriculture and community-based wildlife management.In a study focusing on African drylands, SLM successes were found to includereforestation of degraded lands, harnessing of indigenous knowledge aboutsoil and water conservation, and area development via the rehabilitation ofdegraded lands (Reij and Steeds 2003).
Despite the impressive gains in agricultural productivity via crop intensifi-cation in most regions, two negative trends persist. The first relates to themeasured land degradation on some intensively cropped lands, the overuse ofground water, excessive nutrient loads in surface and ground water, andincreased pesticide use. The second is the continuing expansion of agricultureinto existing savanna and forest ecosystems, which often results in negativeeffects on ecosystem functions (for example, hydrology and predator-pestequilibria) and environmental services (greenhouse gas sinks and biodiversityrefugia).3 Both are increasingly important for sustaining rural livelihoods inthe face of population pressure and encroachment.
CHANGING LAND USE: ITS CAUSES AND IMPLICATIONS
There is an emerging consensus that several, interrelated forces drive landmanagement dynamics.
Growing Demand for Food and Fiber
The world’s population is projected to reach 9 billion in 2050, and the increasewill be largely in developing countries. Urban populations in developing coun-tries will also increase, resulting in major supply issues for food and fiber,because although rural populations purchase about 40 percent of their food
10 SUSTAINABLE LAND MANAGEMENT
(approximately 60 percent comes from their fields and forests), urban popula-tions depend on markets for close to 90 percent of their food supply. Rural-to-urban migration thus implies a twofold increase in the commercial demand forfood and fiber from rural areas. Furthermore, recent changes in the nature offood demand show that a rise in incomes tends to be accompanied by a changein the nature of food demand, with a significant increase in demand for meatproducts. Far more natural resources are required to produce 1 kilogram ofmeat than 1 kilogram of grain.
Despite rapid urbanization, it will be another 10–15 years before urbanand rural populations equalize. Most of the 825 million undernourished peo-ple in the world today live in the tropics. In many tropical countries, 40–70percent of the population still lives in rural areas. Unlike relatively homoge-nous temperate farming systems, however, tropical systems are highly diverseand largely dominated by small-scale production systems (except in the Cer-rado zone of central Brazil). Significant increases in grain production have insome cases been achieved at the expense of the natural resource base (e.g.,reduced natural forest area and pollution of surface and ground water).Although complex by their very nature, mixed-food, livestock, and tree-basedsystems have in many cases played a vital role in sustaining rural agroecosys-tems and protecting the natural resources required for more homogenousgrain crop systems. These systems are increasingly being neglected or con-verted. Managing these heterogeneous tropical landscapes involves assessing arange of land, water, biodiversity, and ecosystem service synergies and trade-offs and is challenging.
The major findings of the recently concluded Millennium Ecosystem Assess-ment warned that approximately 60 percent of the ecosystem supporting life onEarth was being degraded or used unsustainably and that the consequences ofdegradation could grow significantly worse in the next half century (MEA 2005a).
Economic Forces and Land Management Incentives
The Millennium Development Goals specifically target the reduction of poverty.Reardon and Vosti’s (1995) typology of poverty is explicitly linked to the envi-ronment and the sustainable management of land and natural resources. Theseauthors examine the asset portfolio of the rural poor in terms of
� Natural resources, such as water, ground cover, biodiversity of wild anddomestic fauna and flora, and soil
� Human resources, such as education, health, nutrition, skills, and numberof people
� On-farm resources, such as livestock, farmland, pastures, reservoirs, build-ings, equipment, and financial resources
� Off-farm resources, including local off-farm physical and financial capital
INCIDENCE AND EFFECTS OF LAND DEGRADATION 11
� Community-owned resources, such as roads, dams, and commons� Social and political capital
Where markets are absent, underdeveloped, or constrained, asset-specificpoverty can influence livelihood activities and investment decisions. Manyhouseholds that are not considered poor according to the usual consumption-oriented definition may have a food surplus above the minimum diet line thatis still too small to make key conservation or land intensification investmentsnecessary to prevent land and resource degradation. In some cases, such house-holds may start cultivating highly marginal lands (conservation-investmentpoverty).
Land management options are strongly governed by regulatory and incen-tives policies, as well as public expenditure priorities. In most countries, thesepolicies and priorities aim to improve access to and the availability of rawmaterials. Included, for example, are infrastructure development incentivesand public expenditures (for access roads, water control facilities, and the like)and land use or land management policies allowing for such things as resourceextraction, logging, oil exploration, and urbanization.
These types of policies can either be supportive of or run counter to sus-tainable resource management, especially with respect to environmental andsocial goals. Identifying perverse incentives and underlying economic forcesthat lead to resource degradation is critical for SLM, a key element of whichmust be implementation of the kinds of incentives that will lead to more effi-cient land management and optimal output levels.
In practice, the following types of incentives are commonly applied:
� Policy-Related Incentives. Generally, policies to stimulate sectoral develop-ment—often in the form of direct inducements—are employed in conjunc-tion with taxes, subsidies, and new laws. Such policies can result in landdegradation when they encourage a particular form of land use that excludesother options (for example, monoculture versus mixed cropping and theplanting of annual crops versus perennials), when they promote human settlements in ecologically sensitive areas (with, for example, the draining of wetlands or clearing of native forests for agriculture in catchments),or when they fail to account for waste management and nonpoint sourcepollution.
� Market-Based Incentives. The price mechanism strongly influences the rela-tive profitability of land management options, and thus land user decisionson production and consumption levels. If markets are inefficient and pricesare distorted, land and other natural resource endowments may be signifi-cantly undervalued, leading to overconsumption and resource degradation.Thus, artificially low royalties and stumpage fees in forestry, cheap fertiliz-ers and pesticides, and lack of environmental service markets can result inland degradation.
12 SUSTAINABLE LAND MANAGEMENT
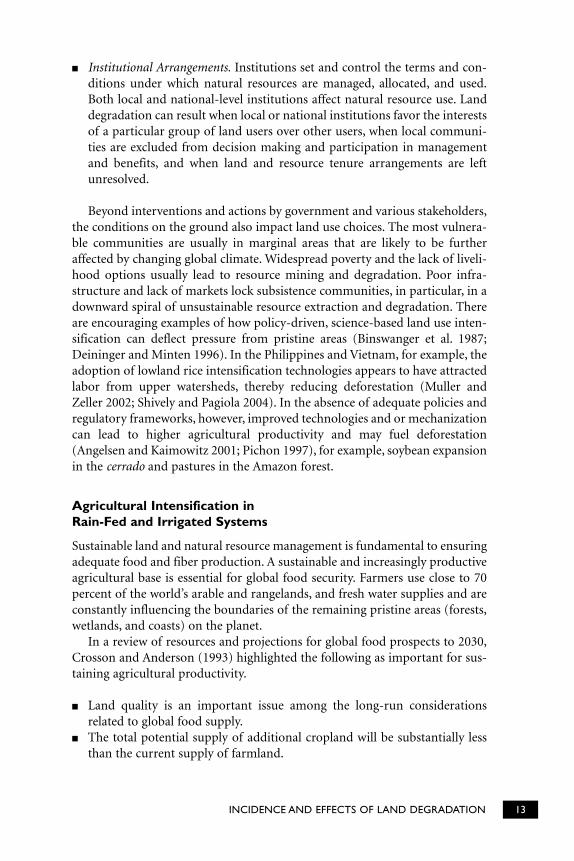
� Institutional Arrangements. Institutions set and control the terms and con-ditions under which natural resources are managed, allocated, and used.Both local and national-level institutions affect natural resource use. Landdegradation can result when local or national institutions favor the interestsof a particular group of land users over other users, when local communi-ties are excluded from decision making and participation in managementand benefits, and when land and resource tenure arrangements are leftunresolved.
Beyond interventions and actions by government and various stakeholders,the conditions on the ground also impact land use choices. The most vulnera-ble communities are usually in marginal areas that are likely to be furtheraffected by changing global climate. Widespread poverty and the lack of liveli-hood options usually lead to resource mining and degradation. Poor infra-structure and lack of markets lock subsistence communities, in particular, in adownward spiral of unsustainable resource extraction and degradation. Thereare encouraging examples of how policy-driven, science-based land use inten-sification can deflect pressure from pristine areas (Binswanger et al. 1987;Deininger and Minten 1996). In the Philippines and Vietnam, for example, theadoption of lowland rice intensification technologies appears to have attractedlabor from upper watersheds, thereby reducing deforestation (Muller andZeller 2002; Shively and Pagiola 2004). In the absence of adequate policies andregulatory frameworks, however, improved technologies and or mechanizationcan lead to higher agricultural productivity and may fuel deforestation(Angelsen and Kaimowitz 2001; Pichon 1997), for example, soybean expansionin the cerrado and pastures in the Amazon forest.
Agricultural Intensification in Rain-Fed and Irrigated Systems
Sustainable land and natural resource management is fundamental to ensuringadequate food and fiber production. A sustainable and increasingly productiveagricultural base is essential for global food security. Farmers use close to 70percent of the world’s arable and rangelands, and fresh water supplies and areconstantly influencing the boundaries of the remaining pristine areas (forests,wetlands, and coasts) on the planet.
In a review of resources and projections for global food prospects to 2030,Crosson and Anderson (1993) highlighted the following as important for sus-taining agricultural productivity.
� Land quality is an important issue among the long-run considerationsrelated to global food supply.
� The total potential supply of additional cropland will be substantially lessthan the current supply of farmland.
INCIDENCE AND EFFECTS OF LAND DEGRADATION 13
� The contribution of increased irrigation water to agricultural production inselected countries will be sizeable, but global supplies of irrigation waterwill be increasingly constrained.
� New and more productive varieties of food and other crops developed viaadvances in accessing genetic material from wild relatives and plant breed-ing are likely to contribute to enhanced food supplies.
� Climate variability will continue, but neither detract from nor enhance foodproduction possibilities.
� Property rights—clearly specified, well defined, and enforceable—are quiteimportant in facilitating good resource management directly or via appro-priate policies and incentives.
� Based on previous yield improvements in cereals and reductions in envi-ronmental costs of agriculture, and anticipating major breakthroughs indisease resistance and crop yield potentials, food supplies will be adequateto meet demand.
In the past two decades, more than 70 percent of the increased cereal produc-tion in Sub-Saharan Africa is estimated to have resulted from crop area expan-sion, whereas other regions have achieved 80 percent of their increased pro-duction via yield increases (FAO 2000; Dorward et al. 2004). The currenthotspots of deforestation for subsistence and plantation crops are in the Congoand Indonesia, and for ranching and settlement in the Amazon (figure 2.3).Addressing the land management problems associated with areal expansion inAfrica is a priority, because it is resulting in land degradation at a compara-tively faster rate than in the other Bank regions.4 The most severe incidence ofdegradation is being felt in Africa’s forest and woodland and in that continent’ssavanna-ecosystem services (Scholes and Biggs 2004). Current evidence sug-gests that climate variability and medium- to long-term climate change arelikely to significantly increase the risk of crop failures due to factors such asdrought, flood, expanding pest and pathogen ranges, and increased competi-tion from aggressive and better-adapted invasive weeds.
Although it is estimated that there are probably around 1.8 billionhectares of potential agricultural land still available, mainly in Latin Americaand Sub-Saharan Africa, significant soil and other biophysical constraintswill limit the projected expansion of cultivated lands to around 120 millionadditional hectares. The likely zones for significant further crop and live-stock area expansion, at significant cost to biodiversity and ecosystem ser-vices, are the Cerrado zone in Brazil and the Miombo zone in southern Africa(see box 2.2).
Despite the impressive increases in agricultural productivity over the pastfour decades, continuing expansion of agricultural areas, coupled with increas-ing production risks from climate variability and the negative effects of pastland management on ecosystem services, suggests an increased urgency forsustainable productivity gains on existing crop-, pasture-, and forestlands.
14 SUSTAINABLE LAND MANAGEMENT
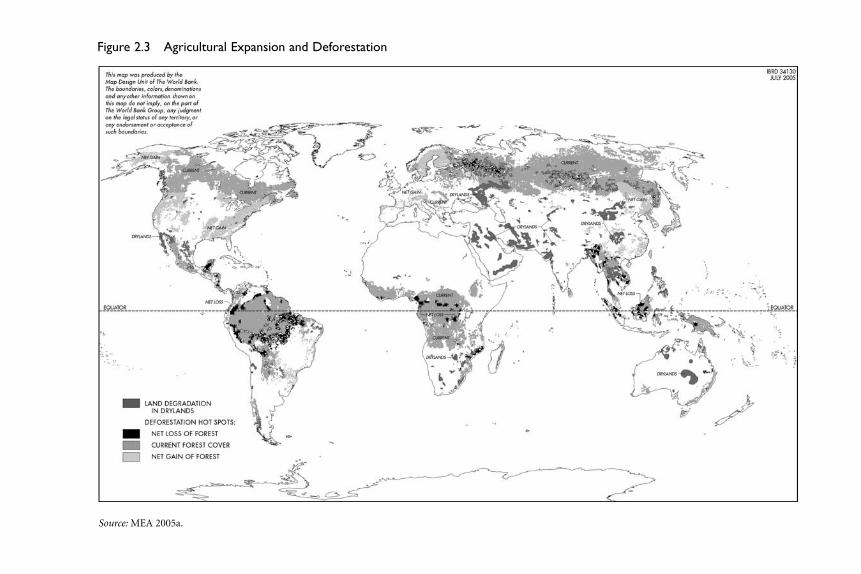
Figure 2.3 Agricultural Expansion and Deforestation
Source: MEA 2005a.
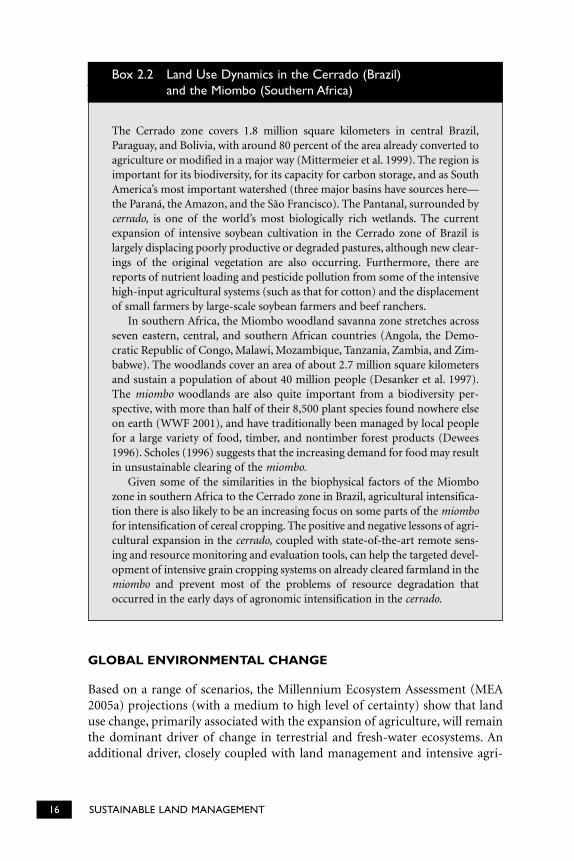
16 SUSTAINABLE LAND MANAGEMENT
The Cerrado zone covers 1.8 million square kilometers in central Brazil,Paraguay, and Bolivia, with around 80 percent of the area already converted toagriculture or modified in a major way (Mittermeier et al. 1999). The region isimportant for its biodiversity, for its capacity for carbon storage, and as SouthAmerica’s most important watershed (three major basins have sources here—the Paraná, the Amazon, and the São Francisco). The Pantanal, surrounded bycerrado, is one of the world’s most biologically rich wetlands. The currentexpansion of intensive soybean cultivation in the Cerrado zone of Brazil islargely displacing poorly productive or degraded pastures, although new clear-ings of the original vegetation are also occurring. Furthermore, there arereports of nutrient loading and pesticide pollution from some of the intensivehigh-input agricultural systems (such as that for cotton) and the displacementof small farmers by large-scale soybean farmers and beef ranchers.
In southern Africa, the Miombo woodland savanna zone stretches acrossseven eastern, central, and southern African countries (Angola, the Demo-cratic Republic of Congo, Malawi, Mozambique, Tanzania, Zambia, and Zim-babwe). The woodlands cover an area of about 2.7 million square kilometersand sustain a population of about 40 million people (Desanker et al. 1997).The miombo woodlands are also quite important from a biodiversity per-spective, with more than half of their 8,500 plant species found nowhere elseon earth (WWF 2001), and have traditionally been managed by local peoplefor a large variety of food, timber, and nontimber forest products (Dewees1996). Scholes (1996) suggests that the increasing demand for food may resultin unsustainable clearing of the miombo.
Given some of the similarities in the biophysical factors of the Miombozone in southern Africa to the Cerrado zone in Brazil, agricultural intensifica-tion there is also likely to be an increasing focus on some parts of the miombofor intensification of cereal cropping. The positive and negative lessons of agri-cultural expansion in the cerrado, coupled with state-of-the-art remote sens-ing and resource monitoring and evaluation tools, can help the targeted devel-opment of intensive grain cropping systems on already cleared farmland in themiombo and prevent most of the problems of resource degradation thatoccurred in the early days of agronomic intensification in the cerrado.
Box 2.2 Land Use Dynamics in the Cerrado (Brazil) and the Miombo (Southern Africa)
GLOBAL ENVIRONMENTAL CHANGE
Based on a range of scenarios, the Millennium Ecosystem Assessment (MEA2005a) projections (with a medium to high level of certainty) show that landuse change, primarily associated with the expansion of agriculture, will remainthe dominant driver of change in terrestrial and fresh-water ecosystems. Anadditional driver, closely coupled with land management and intensive agri-
culture, is nutrient loading, which already has major adverse effects on fresh-water ecosystems and coastal regions in both industrial and developing coun-tries. The major nutrient in question is nitrogen. Three out of four scenariosproject (with a medium level of certainty) that global fluxes of nitrogen incoastal ecosystems will increase by 10–20 percent until 2030. The effects ofnutrient loading include toxic algae blooms, other human health problems,fish kills, and damage to habitats such as coral reefs. The amount of river nitro-gen will not change in most industrial countries, while a 20–30 percentincrease is projected for developing countries, particularly in Asia.
A key question is this: To what extent can good land management con-tribute to sustaining a high level of agricultural productivity in intensive mono-culture and mixed crop–, livestock-, and tree-based systems and maintain environmental services? Integrated soil, nutrient, and water conservationapproaches that combine technologies based on biological, chemical, and phys-ical principles could significantly reduce the negative externalities of intensivecrop and livestock systems and improve the productivity of lower-yielding butenvironmentally friendly production systems in more marginal farming areas.
Because preventing land degradation is usually far less expensive and moreeffective than rehabilitating badly degraded lands, the first priority is to pre-vent the degradation of currently productive land. The second priority is torehabilitate moderately degraded lands and then the severely degraded landsvia measures that facilitate the recovery of soil biological communities essen-tial to efficient nutrient conservation and soil physical integrity (Uphoff et al.2006), improve the nutrient status via added fertilizer nutrients if necessary,and increase the amount of organic carbon in soil. Clearly, however, local com-munity and government priorities should take precedence when deciding whatneeds to be done in any particular location.
INCIDENCE AND EFFECTS OF LAND DEGRADATION 17
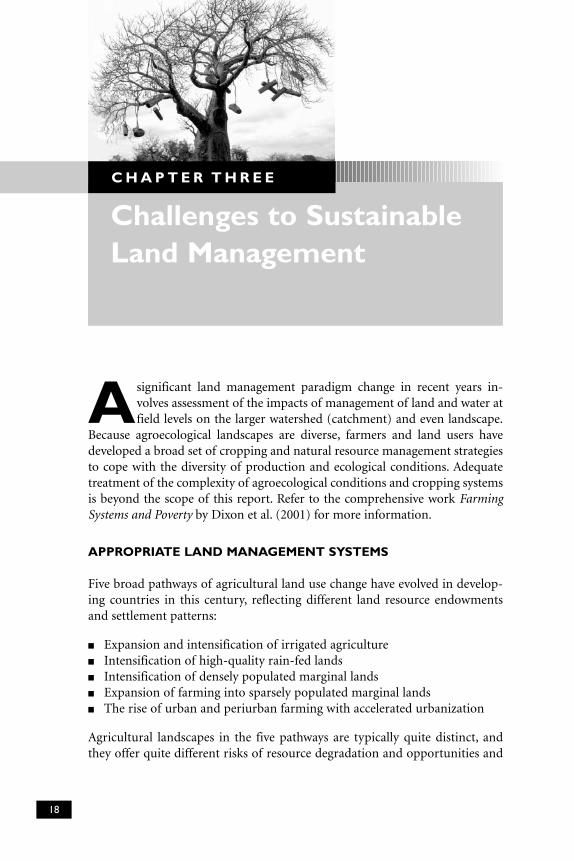
Asignificant land management paradigm change in recent years in-volves assessment of the impacts of management of land and water atfield levels on the larger watershed (catchment) and even landscape.
Because agroecological landscapes are diverse, farmers and land users havedeveloped a broad set of cropping and natural resource management strategiesto cope with the diversity of production and ecological conditions. Adequatetreatment of the complexity of agroecological conditions and cropping systemsis beyond the scope of this report. Refer to the comprehensive work FarmingSystems and Poverty by Dixon et al. (2001) for more information.
APPROPRIATE LAND MANAGEMENT SYSTEMS
Five broad pathways of agricultural land use change have evolved in develop-ing countries in this century, reflecting different land resource endowmentsand settlement patterns:
� Expansion and intensification of irrigated agriculture� Intensification of high-quality rain-fed lands� Intensification of densely populated marginal lands� Expansion of farming into sparsely populated marginal lands� The rise of urban and periurban farming with accelerated urbanization
Agricultural landscapes in the five pathways are typically quite distinct, andthey offer quite different risks of resource degradation and opportunities and
Challenges to SustainableLand Management
C H A P T E R T H R E E
18
constraints for intensification, diversification, and land-improving investment.Further landscape differences and resource management challenges arise fromvariations in the land’s settlement history and its past history of degradation;the mix of crop, perennial, and livestock components; and the mix of com-mercial and subsistence enterprises. For example, Templeton and Scherr (1997)found empirical evidence that the relationship between population growth andresource quality on hills and mountains was influenced by rainfall (mainly byaffecting crop-product choice, risks of soil degradation, and land use inten-sity), topography (by affecting the spatial distribution of production systems),and soil characteristics (through crop choice, cropping frequency, and inputuse). These factors also affected returns to conservation.
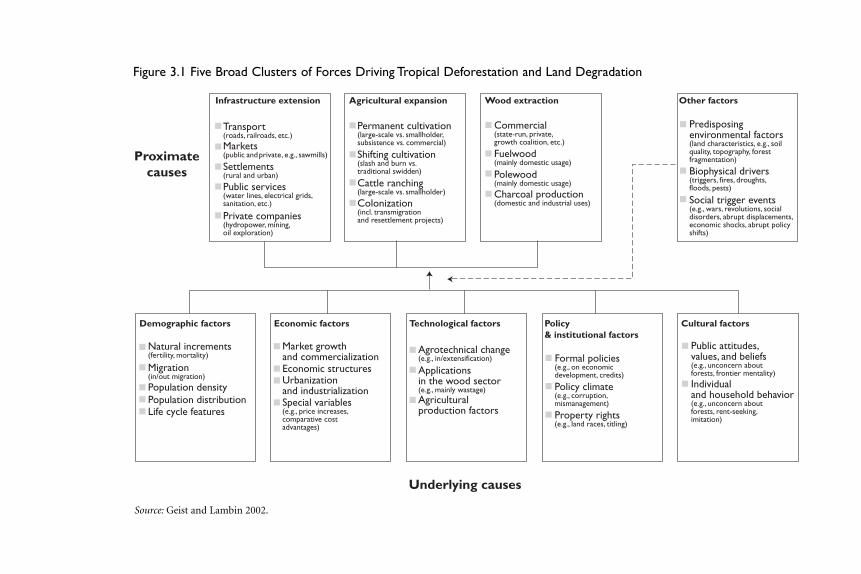
A review by Geist and Lambin (2002) has provided a framework for ana-lyzing and classifying the causes of deforestation, and potentially land degra-dation (figure 3.1). These authors examined and compared the factors at workin 152 cases of tropical deforestation in Africa, Asia, and Latin America. Theydistinguish between the proximate causes of deforestation—human activitieson the ground at the local level—and the larger driving forces that underliethese activities. In their analytical framework, four broad clusters of proximatecauses—agricultural expansion, wood extraction, infrastructure development,and other factors—are linked to five clusters of underlying causes: demo-graphic, economic, technological, policy and institutional, and cultural. Ineach case, the clusters are subdivided into more specific factors. For example,agricultural expansion may take the form of permanent cultivation, shiftingcultivation, cattle ranching, or colonization (see figure 3.1).
A mix of causes is normally at work when deforestation occurs. The reviewgoes on to identify what it calls “causal synergies”—associations of proximateand underlying causes that help to explain deforestation more convincinglythan previous “single-factor” explanations. Together with other recentresearch, the review by Geist and Lambin (2002) tells us much about the realand often complex interacting causes of tropical deforestation.
Although agricultural expansion was found to be at least one of the factors in96 percent of the cases, shifting cultivation of food crops by smallholders, so oftenthought to be a major cause, was in fact a relatively minor contributor to defor-estation. Other forms of agricultural expansion, such as permanent cropping orcattle ranching, appear equally or more significant in most regions, though theagroecological and policy factors influencing this cause of forest loss vary consid-erably across regions—with very different pathways identified for the Amazon,the Congo Basin, and Southeast Asia—and even within regions across countries.
Far more influential than shifting cultivation, or indeed any of the proxi-mate causes of deforestation, are the macroeconomic forces that create theincentives to which individuals respond. Often these forces manifest them-selves as shocks that destabilize the lives of poor people, for example, a massiveincrease in urban unemployment triggering reverse migration into the country-side. These shocks punctuate longer periods in which social and economic
CHALLENGES TO SUSTAINABLE LAND MANAGEMENT 19
Infrastructure extension Agricultural expansion Wood extraction Other factors
Demographic factors Economic factors Technological factors Policy& institutional factors
Cultural factors
Transport(roads, railroads, etc.)Markets(public and private, e.g., sawmills)
Settlements(rural and urban)
Public services(water lines, electrical grids,sanitation, etc.)
Private companies(hydropower, mining,oil exploration)
Permanent cultivation(large-scale vs. smallholder,subsistence vs. commercial)
Shifting cultivation(slash and burn vs.traditional swidden)
Cattle ranching(large-scale vs. smallholder)
Colonization(incl. transmigrationand resettlement projects)
Commercial(state-run, private,growth coalition, etc.)
Fuelwood(mainly domestic usage)
Polewood(mainly domestic usage)
Charcoal production(domestic and industrial uses)
Predisposingenvironmental factors(land characteristics, e.g., soilquality, topography, forestfragmentation)
Biophysical drivers(triggers, fires, droughts,floods, pests)
Social trigger events(e.g., wars, revolutions, socialdisorders, abrupt displacements,economic shocks, abrupt policyshifts)
Natural increments(fertility, mortality)
Migration(in/out migration)
Population densityPopulation distributionLife cycle features
Market growthand commercializationEconomic structuresUrbanizationand industrializationSpecial variables(e.g., price increases,comparative costadvantages)
Agrotechnical change(e.g., in/extensification)
Applicationsin the wood sector(e.g., mainly wastage)Agriculturalproduction factors
Formal policies(e.g., on economicdevelopment, credits)
Policy climate(e.g., corruption,mismanagement)
Property rights(e.g., land races, titling)
Public attitudes,values, and beliefs(e.g., unconcern aboutforests, frontier mentality)
Individualand household behavior(e.g., unconcern aboutforests, rent-seeking,imitation)
Underlying causes
Proximatecauses
Figure 3.1 Five Broad Clusters of Forces Driving Tropical Deforestation and Land Degradation
Source: Geist and Lambin 2002.
trends bring about more gradual changes in the opportunities available to poorrural people, such as the steady growth of the international timber trade or ofthe demand for livestock products and the steadily expanding ecological andeconomic “footprint” of distant city markets. The economic integration of for-est margins and the continual development of product and labor markets thataccompany this process are factors at work in almost all cases.
Strongly associated with the influence of macroeconomic forces is thebuilding of roads. Often paid for by logging companies or through inter-national aid, new roads open up forest areas, first for wood extraction and thenfor the expansion of agriculture. New migrants colonize roadsides and useroads to obtain inputs and deliver their produce to markets. By linking forestedareas to the broader economy, roads lower costs and increase the returns ofconversion, heightening the sensitivity of these areas to changes in macro-economic conditions.
In this report, we highlight the low- to moderate-input systems that opti-mize nutrient recycling—via residue return, conservation tillage, soil conser-vation, and protection of riparian zones—as the recommended baseline uponwhich to build production systems that may require the increasing use ofexternal inputs. For example, the use of efficient biological nitrogen fixation(BNF) technology by Brazilian soybean farmers results in approximately US$200 million annual savings from not using nitrogen fertilizers. Given the factthat the nitrogen use efficiency of fertilizer rarely exceeds 30 percent and excessnitrates can either contaminate ground water or be denitrified to producenitrous oxide—a greenhouse gas 310 times more powerful than carbon dioxide—BNF contributions to high levels of soybean productivity also result in sig-nificant environmental benefits.
Land users can foster a variety of environmental services, ranging from reg-ulation of hydrological flows to biodiversity conservation and carbon seques-tration. However, land uses that provide such services are rapidly being dis-placed by uses that do not. A key reason is that land users typically receive nocompensation for environmental services they generate for others.
As an example, the link between agricultural practices on hillsides and envi-ronmental degradation has clear implications for land use: farmers must beinduced to adopt sustainable agricultural systems that favor the production ofenvironmental services while also allowing them to increase their food securityand incomes.
Land degradation and its relation to rural poverty remain poorly understood,though the link remains very much in evidence. A downward spiral of landdegradation and poverty may be occurring—a kind of physical-technical equiv-alent to the Lewis low-income trap—with land degradation causing decliningagricultural productivity and worsening poverty, and poverty causing house-holds to further degrade their land.
More recently, soil conservation measures have relied largely on food-for-work programs as an incentive and have been oriented toward labor-intensive
CHALLENGES TO SUSTAINABLE LAND MANAGEMENT 21
activities such as terracing, bund construction, and tree planting. There is agrowing consensus that the effects of past soil conservation programs havebeen rather disappointing (Bojo 1996; Bekele and Holden 1999), althoughthere is evidence of positive effects from conservation measures in some areas,especially within lower-rainfall regimes (Pender 2004).
The general failure of past conservation efforts can be attributed to a rangeof factors that make the recommended strategies inappropriate to local condi-tions. In particular, these have tended to focus on arresting soil erosion with-out considering the underlying socioeconomic causes of low soil productivity,thus promoting technologies that are not profitable or are risky or ill suited tofarmers’ food security needs and financial constraints (Pagiola 1999). Conser-vation efforts have also neglected the pronounced regional disparities within agiven country and have frequently been implemented in a top-down manner,absent the participation of the local communities.
For example, research has shown that terracing and several other land man-agement practices can increase productivity fairly quickly by increasing soilmoisture retention, and thus are profitable for farmers in lower-rainfall areasof the northern Ethiopian highlands (Pender and Gebremedhin 2004). Thesame techniques are much less profitable in higher-rainfall areas of the high-lands because they can actually reduce farmers’ yields by reducing the effectivearea of the plot, causing waterlogging, or causing crops to harbor pests (Her-weg 1993). By contrast, the use of fertilizer and improved seeds is much moreprofitable and less risky in higher-rainfall areas than in lower-rainfall areas,which explains the limited effect of the agricultural extension programs foundin lower-rainfall areas (Pender and Gebremedhin 2004) compared to very pos-itive effects of the programs found in higher-rainfall areas (Benin 2005).
IMPROVED WATER MANAGEMENT
Rainfall is the basic fresh-water source over a river basin. An average of 110,000cubic kilometers of rain falls over the continents annually. Two-thirds of therainfall is either consumed by plants or returned to the atmosphere by evapo-ration and transpiration (green water). Around one-third reaches the aquifers,rivers, and lakes (blue water), out of which only about 12,000 cubic kilometersis considered readily available for human use. Current water withdrawals formunicipal, industrial, and agricultural use amount to some 10 percent of theblue-water resource. Green water is a very important resource for global foodproduction. About 60 percent of the world’s staple food production relies onrain-fed irrigation, hence on green water. The livestock-grazing and -browsingproduction systems rely on green water, as does the production of wood fromnatural and plantation forestry (box 3.1).
Lending for irrigation (blue water) in Sub-Saharan Africa has declined con-siderably over the past two decades. There are thought to be various reasons forthis decline, but the common denominator is the disappointing performance
22 SUSTAINABLE LAND MANAGEMENT
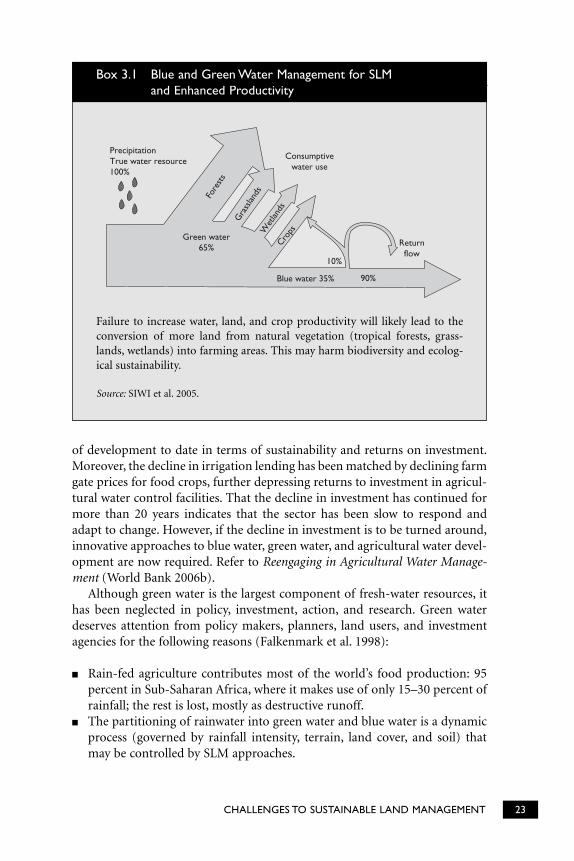
CHALLENGES TO SUSTAINABLE LAND MANAGEMENT 23
Failure to increase water, land, and crop productivity will likely lead to theconversion of more land from natural vegetation (tropical forests, grass-lands, wetlands) into farming areas. This may harm biodiversity and ecolog-ical sustainability.
Source: SIWI et al. 2005.
Box 3.1 Blue and Green Water Management for SLM and Enhanced Productivity
of development to date in terms of sustainability and returns on investment.Moreover, the decline in irrigation lending has been matched by declining farmgate prices for food crops, further depressing returns to investment in agricul-tural water control facilities. That the decline in investment has continued formore than 20 years indicates that the sector has been slow to respond andadapt to change. However, if the decline in investment is to be turned around,innovative approaches to blue water, green water, and agricultural water devel-opment are now required. Refer to Reengaging in Agricultural Water Manage-ment (World Bank 2006b).
Although green water is the largest component of fresh-water resources, ithas been neglected in policy, investment, action, and research. Green waterdeserves attention from policy makers, planners, land users, and investmentagencies for the following reasons (Falkenmark et al. 1998):
� Rain-fed agriculture contributes most of the world’s food production: 95percent in Sub-Saharan Africa, where it makes use of only 15–30 percent ofrainfall; the rest is lost, mostly as destructive runoff.
� The partitioning of rainwater into green water and blue water is a dynamicprocess (governed by rainfall intensity, terrain, land cover, and soil) thatmay be controlled by SLM approaches.
Green water65%
Blue water 35% 90%
Returnflow
Consumptivewater use
PrecipitationTrue water resource100%
Fore
sts
Crops
Gra
sslan
dsW
etlan
ds
10%
� Management of green water contributes to blue water. Soils process severaltimes more water than they retain, while soil erosion, by runoff and bankerosion during peak flows, contributes nearly all the sediment load ofstreams, leading to the siltation of reservoirs and water courses.
� More effective management of green water can mitigate the competition andpotential conflict between agricultural water users on the one hand and theneeds of industry, urban populations, and the environment on the other.
In areas where crop, livestock, and forestry productivity is constrained bydrought and recurring water deficits, supplementary irrigation from ground-water could be the key to breaking the poverty trap. Water use efficiency indrought-prone, rain-fed agriculture may be as low as 6,000 cubic meters ofwater consumed per ton of grain produced. A crucial question for povertyeradication, therefore, is this: How can rain-fed crop yields be improved bysupplementary irrigation based on water harvested from local rainwater orflash floods and stored in small tanks? If green water was properly partitionedvia water harvesting and storage, relatively small quantities of blue water (irri-gation) would be required to safeguard crop and livestock production. Thiswould result in significantly higher yields of blue water per cubic meter thancan be attained from full-scale (dry season) irrigation alone. This is one reasonwhy systems for deep-rooted tree production, which can utilize both green-and blue-water components, often function as important safety-net produc-tion systems for farmers and pastoralists in drought-prone areas.
Green water is vital for food and wood production, water supply (watertables and flows in springs and streams), water quality (including salinity andthe dilution function of fresh water in wetlands), aquatic ecosystems, and wastetreatment. SLM can positively affect green water, and thus significantly enhanceirrigation “crop per drop” efficiency. Such innovation will also require adaptiveplant research studies of crop-water relationships and of soil chemistry, struc-ture, and permeability for many of the potential service areas (box 3.2).
ADAPTING TO CLIMATE CHANGE
Because of the certainty of global climate change, but also the extreme un-predictability of when, where, and to what extent regional and microclimateswill change, a business-as-usual approach to increasing food and fiber produc-tivity may not prove sustainable over the longer term. Climate variability ishighly significant for many developing countries, especially in most of Africa(box 3.3), and it can be a major impediment to development if it is notaddressed properly and managed well across a range of sectors. Unfortunately,there are few countries where climate variability is managed well today. As aconsequence, improved climate risk management offers a low-cost opportunityfor deriving greater benefit from existing land and water resources throughbetter use of knowledge already gained.
24 SUSTAINABLE LAND MANAGEMENT
CHALLENGES TO SUSTAINABLE LAND MANAGEMENT 25
In both rain-fed and irrigated food production systems, the potential toimprove water productivity—that is, to produce more food per unit of water—is substantial.
The measures required include:
� Improved management of water in irrigated and rain-fed agriculturebased on secure water use rights and land tenure.
� Improvement of biological, chemical, and physical properties of the soilthrough improved land management (conservation tillage, mulching, andthe construction of microcatchments).
� Dry spell mitigation though rainwater harvesting and supplementary irri-gation.
� Effective arrangements and support services for marketing, affordablecredit, technological improvements, and extension services, with a partic-ular focus on rain-fed agriculture.
� Investment in new irrigation and storage infrastructure and improvedmanagement of existing irrigation.
Source: SIWI et al. 2005; World Bank 2006b.
Box 3.2 SLM and Enhancing Water Productivity
The main land-related influences of climate change will be experienced bythe changing availability of agricultural water resources, its effects on attainableagricultural production and food security, and the changing requisites of natu-ral resource management and maintenance of biodiversity. The effects of climatechange will be felt in both agricultural and fisheries sectors. Changes in soilmoisture and temperature, evapo-transpiration, and rainfall, and possibleincreases in heat stress, will affect the growth of some subsistence root crops andmany open-field vegetables. Land use and the agroecology of many islands in thePacific, the Indian Ocean, and the Caribbean, which are already experiencingwater scarcity, will suffer even more from climate change. The resulting floodsand droughts will also have a negative effect on agriculture. On the lowestislands—and there are many—rising sea levels will change the height of thewater table and increase salinization. The viability of food crops with low salttolerance will become a major issue (IPCC 2001).
It is likely that global warming and the resulting climate change will affectthe production of certain crops, such as rice, wheat, corn, beans, and potatoes,which are major food crops for many people in Africa (IPCC 2001). Othercrops, such as millet, are resistant to high temperatures and low levels of water,and so may be less affected by future climate change. An experiment in Zim-babwe showed that an increase in temperature of 2 to 4 degrees Celsius caused
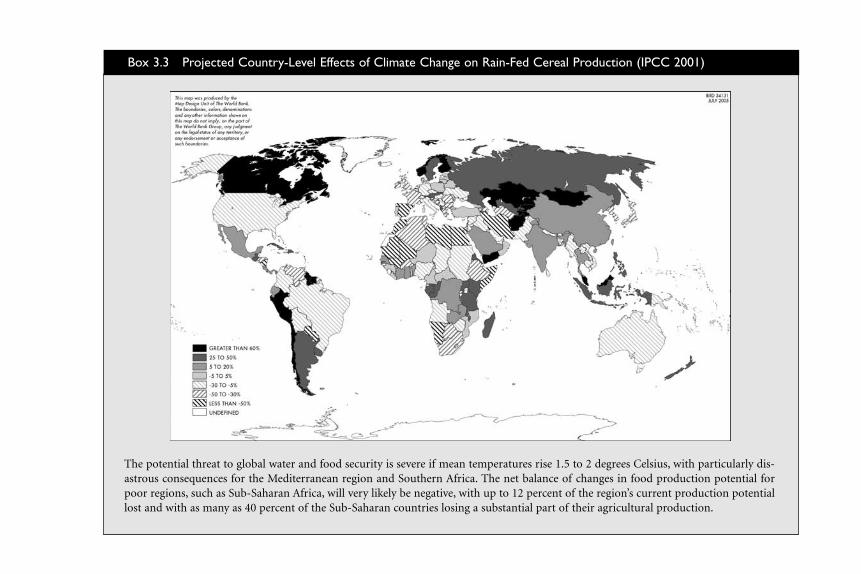
Box 3.3 Projected Country-Level Effects of Climate Change on Rain-Fed Cereal Production (IPCC 2001)
The potential threat to global water and food security is severe if mean temperatures rise 1.5 to 2 degrees Celsius, with particularly dis-astrous consequences for the Mediterranean region and Southern Africa. The net balance of changes in food production potential forpoor regions, such as Sub-Saharan Africa, will very likely be negative, with up to 12 percent of the region’s current production potentiallost and with as many as 40 percent of the Sub-Saharan countries losing a substantial part of their agricultural production.
CHALLENGES TO SUSTAINABLE LAND MANAGEMENT 27
a reduction of maize yield at all experimental sites. Changes in farming systemsmay compensate for some yield reductions, although additional inputs such asfertilizers and increased irrigation may be needed, involving extra costs to thefarmers. Food-importing countries will be at greater risk, although the effectsmay have more to do with changes in world markets than with changes in thelocal climate and agricultural production (IPCC 2001).
Climate change will also affect both marine and inland fisheries. In somecases, temperature increases will increase productivity. It is projected that awarming of 3 to 5 degrees Celsius will increase the productivity of the GambiaRiver by about 13–21 percent. However, some fish species might be more sen-sitive to temperature, and increases of 3 to 4 degrees Celsius could negativelyaffect catfish and herring populations. On the other hand, it is estimated thatshrimp yields will increase significantly (IPCC 2001). A decline in marine andaquatic fish stocks will mean that people who currently depend on fishing forfood and livelihoods will turn to already depleted land resources for food pro-duction. A reduction in annual precipitation will affect the numbers of range-fed livestock in many African regions. Pastoral livelihoods in the semiaridzones of Africa are likely to be adversely affected by climate change, becauseseveral global climate models predict a decrease in mean annual precipitationof about 10–20 percent, and this will affect the dry-matter intake of pastoral-ists’ animal herds.
To increase the adaptive capacity of rural landscapes against climate changeand the expected increase in the frequency and severity of extreme events suchas floods and droughts, the land management paradigm will require significantshifts of at least two types. The first is a shift in focus and perspective, from a“view from the field” (or paddock) to a broader watershed or even a landscapereferent. Though highly desirable, this shift could introduce an added com-plexity, because it not only would encompasses a wider spatial reference, but italso would have to take into account interacting social, political (national andtransnational), and economic domains. Additionally, attention will more fre-quently need to be given to arresting and reversing the degradation of ecosys-tem services and the resultant biotic and abiotic stress. Increased efforts will berequired to advance scientific knowledge in general, in particular knowledge ofbiotechnology (that is, agronomy, genetics, pest management, and near-real-time monitoring, evaluation, and response).6
KNOWLEDGE DISSEMINATION AND LAND POLICY CONSTRAINTS
Low levels of land productivity and subsequent land and resource degradationcan often be traced to inadequate access to the best or most appropriate knowl-edge required to overcome local constraints. Providing better information toboth technology developers and farmers can stimulate the adoption of bothsoil conservation technologies and improved land management practices. For
example, technology developers may lack information about cropping patternsand practices that might serve the priorities of farmers and at the same timecontribute to soil conservation. This information could be used to focus tech-nology development efforts.
Farmers are usually aware when degradation threatens their immediatelivelihoods. When a lack of concern is shown, it is often because farmers eitherhave not yet considered degradation a serious longer-term threat or becausethe resource in question provides only a marginal contribution to farm familylivelihoods (Scherr and Hazell 1994; Enters 1998).
In several situations, however, lack of farmer awareness significantly con-strains adaptation. The first is when degradation effects, or their causal factors,are not immediately observable by farmers without modern measuringdevices. Such situations may occur with soil acidification, micronutrient deple-tion, changes in microfauna, or spread of disease vectors.
The second is the case of recent immigrants who are farming in unfamiliaragroenvironmental conditions or are attempting to employ unfamiliar farmingsystems. In such instances, external intervention in problem diagnoses, farmereducation, and demonstration of the positive effects of resource managementchange may be needed to trigger an adaptive response.
A third situation occurs when the type of resource degradation involved isnot simply a local concern, but rather a concern to outsiders, as may be the casewith some types of habitat loss or downstream sedimentation. An adaptiveresponse is unlikely to be triggered without the provision of appropriate incen-tives, regulatory and conflict interest frameworks, and noncompliance penal-ties as appropriate.
A fourth situation arises when poor farmers fail to respond because of ashort planning horizon or a high discount rate. The empirical evidence as towhether the poor really have high rates of time preference is sketchy, however.Furthermore, Pagiola (1995) argues that poor farmers often have an evengreater willingness to protect or invest their natural resource assets than do the well-off because of their relatively greater dependence on those assets forlivelihood security.
Property rights to resources such as land, water, and trees have been foundto play a fundamental role in the poverty reduction–resource management–environmental management nexus. On the one hand, they govern the patternsof natural resource management and may either impede or facilitate sustain-able use, protection, or resource-improving investment. On the other hand,they determine important aspects of the welfare of individuals, households,and communities who depend on those resources.
Natural resources (land, water, trees, and vegetation), rather than having asingle “owner,” commonly involve diverse property rights that may be held bydifferent people, including the rights to access, withdraw, manage, or excludeothers from a resource and the right to transmit or alienate rights (Schlagerand Ostrom 1992). Men and women, people of different castes, local people or
28 SUSTAINABLE LAND MANAGEMENT
outsiders, and both individuals and the state may have rights to use theresource in different ways: for different crops, grazing, and gathering fromland; for irrigating, washing, drinking, or other enterprises from water; and fortimber, fruits, leaves, firewood, shade, or other products from trees. Propertyrights may be acquired through a variety of means: (a) market purchases;(b) inheritance, transfers, or gifts; (c) labor or other types of investment inimproving the resource; (d) adverse possession (“squatters’ ” rights); (e) grantsby the state; and (f) membership in a community (especially in communal orcommon property regimes) (Meinzen-Dick et al. 1997).
The property rights held by poor people represent key household and com-munity assets that may provide income opportunities, ensure access to essen-tial household subsistence needs (water, food, fuel, and medicines), and insureagainst livelihood risk. Poorer groups tend to rely more heavily on customaryor informal rights. Marginal users, such as women and the poor, thus often loseout as a result of policies and processes that privatize and reduce complex bun-dles of rights into a single unitary right (under many land and water reforms)(Baland and Platteau 1996; Otsuka and Quisumbing 1998).
Property rights also affect long-term agricultural productivity and incen-tives for resource conservation and investment. For example, more equitableaccess to natural resources by women has been found not only to improve wel-fare outcomes for women, but also to increase agricultural productivity, theeconomic returns to agroforestry, and the use efficiency of water in irrigationprojects (Meinzen-Dick et al. 1997). Tenure security, though not necessarilyformal titling, is associated with cropland conservation practices and improve-ments.
Bruce and Mearns (2004) identified the importance of addressing theunderlying incentive framework in ways that match the complexity and diver-sity of local livelihood systems rather than out of concern for sustainabilitythat it is not shared, or is defined very differently, by the resource users them-selves. Very often, external change agents must understand what else is neededto foster an enabling environment for sustainable land management (so-calledtenure +), which may call for supporting interventions to improve access toalternative forms of capital (human, social, physical, and financial).
The weakness of conventional property rights approaches to NRM is wellillustrated in pastoral systems in which an important goal is to achieve sus-tainability by balancing the number of grazing livestock against the long-runcarrying capacity of the range. A common assumption of outsiders is that pas-toralists are unable to control access to and use of resources among their mem-bers. So it is taken for granted that the appropriate management solution is toassign property rights to individuals (or to the state). Given the high level ofecological variability and risk, however, livestock producers in such systemsneed to be able to “track” available forage or browse for their livestock, whichusually requires that they have access to large areas that encompass a diverserange of upland ecological niches. Small-scale subdivisions and property rights
CHALLENGES TO SUSTAINABLE LAND MANAGEMENT 29
can greatly reduce the opportunistic tracking strategies needed to cope withresource variability, and thereby increase vulnerability, overgrazing, and landdegradation and conflicts.
While monitoring and evaluation methodologies are well established, therecannot be a universal approach to monitoring, for instance, by relying on a sin-gle pre-established set of indicators, however comprehensive and encompassingthese might be. Rather, a balance among the previously described features mustbe struck and tailored to the unique set of agroecological environments, as wellas to the discrete specifics of the programs, interventions, and incentives poli-cies being introduced to encourage SLM practices by farmers and communities.
For example, in a study of smallholder farmers using participatory methodsin Malawi, Cromwell et al. (2001) identified the following five factors used byfarmers in Malawi as the most important indicators of sustainable agriculture:
� Crop diversification—growing a range of staple crops� Access to adequate quantities of good seed—enough seed for timely plant-
ing at recommended spacing for all crops� Farmland size—enough land to feed one’s family� Owning all the necessary farm tools and implements� An optimal mix of crops for in-field soil fertility management through
intercropping and relay planting (with legumes)
Not surprisingly, farmer concerns regarding sustainability of farming andcropping systems differ quite significantly, not only in spatial and temporalscales but also in scope, from the articulated priorities of researchers and pol-icy makers (see Crosson and Anderson 1993).
30 SUSTAINABLE LAND MANAGEMENT
To stem the forbidding complexity of population pressure on an essen-tially fixed endowment of arable land, SLM and its associated curtail-ment of land degradation will require sustainable improvements in
agricultural productivity. This necessarily entails not only the development ofmore input-responsive production technologies, but also a reduction of thereal costs and the risks associated with input and output marketing.7
While input and output marketing should be ensured largely by the privatesector, some government involvement is needed to facilitate efficient and trans-parent markets. The role of government will vary from country to country andby stage in the agricultural transformation process. The extent of the role willdepend on factors such as the willingness of international agribusinesses and thecapacity of the indigenous private sector to invest in input markets (which havehigh capital requirements and low profit margins), as well as farmers’ effectivedemand for purchased inputs. This demand is dependent on the availability ofprofitable technology, on farm incomes and risk-bearing capabilities, and onfarmers’ knowledge of that technology and the financial capacity to invest in it.
As technologies requiring external input use are extended to more marginalproduction environments and poorer farmers, cost-effective ways to diminishor hedge and insure against downside risk will become critical to SLM. Impor-tant points to consider include:
� The possibility that inputs available for purchase may not be appropriate forall farmers.
31
SLM Interventions:An Agri-technicalPerspective
C H A P T E R F O U R
� Whether alternative soil productivity–enhancing technologies, such as greenmanuring, minimum tillage, and improved fallows, may be financially andeconomically viable in riskier environments.
� The fact that complementary institutions and organizations are necessaryto spread risk more evenly among farmers and input suppliers, therebyencouraging reliable use and repayment of bank or suppliers’ credit.
An important corollary question is this: How can such institutions and organ-izations be designed and operated in a cost-effective way? In a review of suc-cessful land and resource management in African drylands, Reij and Steeds(2003) rated as success stories the remarkable resilience and adaptability of thepeople who inhabit drylands and the positive role of innovators. They identi-fied the following contributing factors:
� Public support for private investment in soil and water conservation� Systematic improvement of trunk roads� Sound macroeconomic management, not discriminating against agricul-
ture and natural resources� Robust local capacity building by nongovernmental organizations, and other
cooperative-type projects� Consistent efforts by concerned governments since the mid-1980s to increase
awareness of environmental problems and possible solutions
The Soil Fertility Initiative (SFI) was launched in 1996 in response to con-cerns of African stakeholders about land and natural resource degradation thatwere resulting in rapid declines in agricultural productivity. The SFI was co-sponsored by the World Bank, FAO, the CGIAR (represented by ICRAF), theInternational Fertilizer Development Corporation (IFDC), and several NGOs.The original goal of SFI was the introduction and adoption of sustainable soilfertility management practices by African smallholder farmers.
Although 20 Sub-Saharan countries endorsed SFI and several developedNational Action Plans (NAP), very little national and international funding wasmade available for adequate and systematic implementation of SFI. The impacton the soil fertility management problem has been negligible (FAO 2002).
According to FAO (1999) the major constraints on the implementation ofSFI Action Plans include:
� There has been a failure to recognize and address issues of national andregional ownership.
� There has been a lack of “champions” to motivate local, regional, and inter-national stakeholders.
� Resources for coordination and facilitation and to operationalize the NAPshave been lacking.
� The SFI coalition expected the World Bank to provide coordination andfacilitation, but this was not achieved.
32 SUSTAINABLE LAND MANAGEMENT
SLM INTERVENTIONS 33
� High turnover of local coordination staff led to a breakdown of the SFIcoalition, a significant lack of operational funding, and significant delays inNAP preparation and implementation.
� Soil fertility problems are generally not recognized as critical issues in thePRSPs and CASs and hence do not receive resources via Bank lending oper-ations—the notable exceptions are Burkina Faso and Guinea.
As a result of the dialogue generated by the early attempts to operational-ize SFI, there is a regional consensus that lowland and farm productivity in Sub-Saharan Africa requires more than just mineral fertilizers andimproved seed. The SFI concept has evolved to include integrated land andwater management involving complementary organic and mineral sources of nutrients, crop and livestock diversification, and active links betweenindigenous knowledge and adaptive scientific research, backed by agriculturalknowledge dissemination that involves farmer participation and experientiallearning.
Targeted input programs for phosphorus fertilizer, seeds of appropriatelegume crops, cover crops, and trees, coupled with payments for ecosystemand environmental services, will be necessary to jump start the SFI at locallevels. International donor funding will be necessary to establish and sustaina coordination and facilitation unit to support NAP implementation.
The African Integrated Land and Water Management Initiative (ALWI),also sponsored by the Bank, was launched in 2001 to “contribute towardsreversing the present trends of rapid natural resource degradation” with astrong focus on coordination among stakeholders to find synergies and reduceduplication of efforts related to improved resource management at catchmentand watershed scales. In 2005, the World Bank supported the launch of Terr-Africa, a coalition of countries and stakeholders from Sub-Saharan Africa seek-ing to build on the lessons of SFI and ALWI and enhance SLM support.
As reflected above, SLM requires undertaking a complex and often inter-locking set of actions to protect the existing land resource and curtail landdegradation (box 4.1). These laudable objectives cannot be pursued (norshould they be) absent participation by farmers, other local residents, andother concerned stakeholders. To improve the prospects of success, it is thecontention of this report that the authorities must find ways to align privateinterests (for example, the drive by rural households to secure basic needs,maintain income and consumption levels, enjoy some degree of food security,and mitigate risk) with the public’s larger interest in SLM. But positive andnegative incentives must be employed, and in locales where policy-induceddisincentives and regulations might prove difficult to enforce, to every possi-ble extent the emphasis will have to be placed on the application of positiveincentives—for example, those that will contribute to improved real incomesand economic security while guaranteeing access to basic, often resource-based, needs.
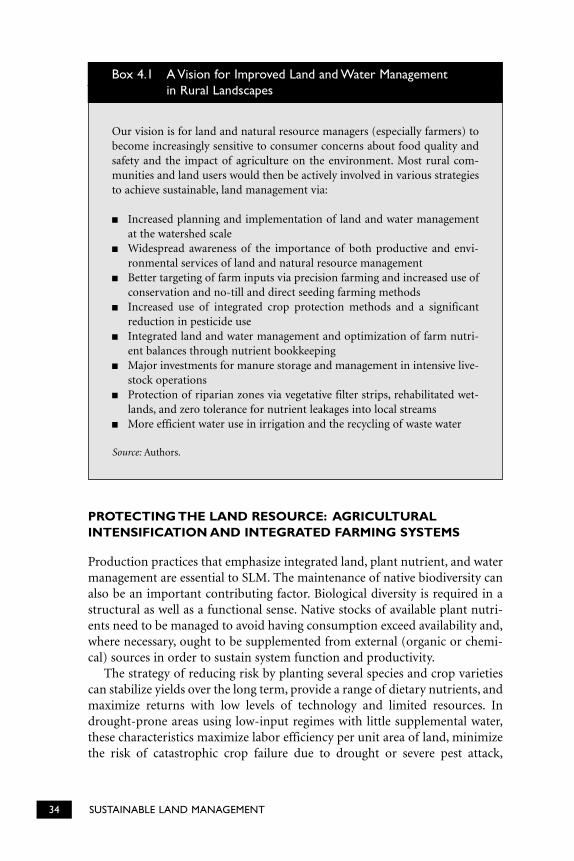
PROTECTING THE LAND RESOURCE: AGRICULTURALINTENSIFICATION AND INTEGRATED FARMING SYSTEMS
Production practices that emphasize integrated land, plant nutrient, and watermanagement are essential to SLM. The maintenance of native biodiversity canalso be an important contributing factor. Biological diversity is required in astructural as well as a functional sense. Native stocks of available plant nutri-ents need to be managed to avoid having consumption exceed availability and,where necessary, ought to be supplemented from external (organic or chemi-cal) sources in order to sustain system function and productivity.
The strategy of reducing risk by planting several species and crop varietiescan stabilize yields over the long term, provide a range of dietary nutrients, andmaximize returns with low levels of technology and limited resources. Indrought-prone areas using low-input regimes with little supplemental water,these characteristics maximize labor efficiency per unit area of land, minimizethe risk of catastrophic crop failure due to drought or severe pest attack,
34 SUSTAINABLE LAND MANAGEMENT
Our vision is for land and natural resource managers (especially farmers) tobecome increasingly sensitive to consumer concerns about food quality andsafety and the impact of agriculture on the environment. Most rural com-munities and land users would then be actively involved in various strategiesto achieve sustainable, land management via:
� Increased planning and implementation of land and water managementat the watershed scale
� Widespread awareness of the importance of both productive and envi-ronmental services of land and natural resource management
� Better targeting of farm inputs via precision farming and increased use ofconservation and no-till and direct seeding farming methods
� Increased use of integrated crop protection methods and a significantreduction in pesticide use
� Integrated land and water management and optimization of farm nutri-ent balances through nutrient bookkeeping
� Major investments for manure storage and management in intensive live-stock operations
� Protection of riparian zones via vegetative filter strips, rehabilitated wet-lands, and zero tolerance for nutrient leakages into local streams
� More efficient water use in irrigation and the recycling of waste water
Source: Authors.
Box 4.1 A Vision for Improved Land and Water Management in Rural Landscapes
and guarantee the availability of food at medium to high levels of species pro-ductivity. There is a three-way interaction among biodiversity, ecosystemprocesses, and landscape dynamics. SLM practices that favor biodiversitymaintenance at a regional level are also likely to benefit ecosystem services suchas nutrient, water, and soil conservation; biological pest control; and efficientnutrient cycling.
Quite often, land degradation is accompanied by the proliferation of inva-sive and exotic weeds (for example, Imperata cylindrica, Lantana camara, Chro-molaena odorata, and Rubus moluccanus). In Brazil, for example, the introduc-tion of aggressive C4 pasture grasses (Brachiaria humidicola and B. brizantha)in the forest and cerrado regions means that natural regeneration of less aggres-sive native C3 species cannot occur very easily. The invasive weeds thus act todepress or eliminate native species. The control of invasive species is an essen-tial component of the rehabilitation of degraded lands (Fernandes et al. 2006).
In South Africa, a mega-scale water conservation project, the Working forWater program, has been initiated with the dual aim of saving 10 percent of theannual runoff and protecting native biodiversity by means of a countrywideclearing of invasive alien water-consuming plants. The effort will engage some40,000 individuals over a 30-year period. The goal is to improve rain-fed agri-culture by reducing the hydroclimatic constraints to rain-fed crop productionand by making supplementary irrigation an efficient means to increase other-wise poor crop yields. This is an example of how SLM practices can be used tomanage the partitioning of rainwater between the vertical green and the hori-zontal blue water pools via clearing, reforestation, afforestation, and croppingsystem management.
SOIL FERTILITY MANAGEMENT
An important component of SLM is the management of soil and plant nutri-ents. Soil fertility can be improved by managing nutrient stocks and flows(where inputs exceed or balance outputs). A range of intervention strategiesare available to farmers (Scoones and Toulmin 1999):
� Nutrient recapitalization—for example, adding phosphorus via a one-timeapplication of rock phosphate
� Applying inorganic fertilizers together with lime to control soil acidity� Using organic manures and legumes to fix atmospheric nitrogen� Combining organic and inorganic nutrient sources
Plant nutrients are usually removed from the crop and forest systems via har-vests of grain, tubers, fruit, and wood and also by surface erosion and sub-surface leaching. Land users tend to purchase and use fertilizer nutrients inareas with good market access and higher agricultural potential. In order forfarmers to realize the yield potential due to added fertilizers, it is essential that
SLM INTERVENTIONS 35
they have access to good (improved) seed. Major constraints to farmers pur-chasing fertilizers include one or more of the following: (a) high cost of fertil-izer, (b) lack of cash or credit to purchase the fertilizer, and (c) low prices forthe increased yields from added fertilizer.
In agroecologically less favored areas, farmers can use a variety of risk-minimization strategies based on biological sources of nutrients, adapted cropvarieties or species, and integrated land and water management. The literatureon integrated nutrient management documents the following generic practicesfor effective nutrient management and sustainable cropping:
� Minimize soil erosion and leaching. The most effective way to reduce soil ero-sion and leaching is to maximize soil cover via the use of cover crops andmulches and by integrating perennials in vegetative strips along the con-tours to further stabilize the soil. Where soil depth is adequate, such vegeta-tive strips permit interstrip erosion and result in a gradual leveling of theslope and in terrace formation without the need for labor intensive manualterrace formation. Soil’s organic matter (humus) is essential for maintain-ing its physical and chemical environment for plant growth as well as hydro-logic functions. In semiarid rain-fed systems, inputs of crop residues andother forms of plant biomass are often insufficient (or have other priorityuses) to maintain critical levels of organic matter. Under these conditions,conservation or minimum tillage significantly reduces soil carbon oxidationfollowing the planting of each crop (and also frees up labor for other activ-ities). Conservation and no-till farming can also significantly reduce soilerosion (Pieri et al. 2002). Note that some erosion is desirable for maintain-ing downstream and coastal habitats and ecosystem processes.
� Recycle organic nutrients. One method is to return all crop residues to thefield of origin. In many cases, however, crop residues are fed to livestock. Ide-ally the livestock should be fed the residues in the field so that the manuregoes directly onto the soil. If the residues are removed and fed to livestockelsewhere, the manure should be returned to the field as soon as possible.The transport and spreading of manure on fields, however, is often a prob-lem because of labor constraints. The composting of vegetable residues andthe use of animal manure is an efficient way to conserve farm nutrients andenable farmers to redistribute the nutrient-rich compost to fields duringperiods when demand for scarce labor is low. Combining manures withinorganic fertilizers can result in significant synergy and increased nutrientand water use efficiencies (Piha 1993). One desirable goal is the ability tomanipulate SOM dynamics via management practices to promote soil con-servation, to ensure the sustainable productivity of agroecosystems, and toincrease the capacity of tropical soils to act as a sink for, rather than a sourceof, atmospheric carbon (Fernandes et al. 1997).
� Enhance biological sources of nutrients. Nitrogen-fixing trees, shrubs, andherbaceous and crop species can fix nitrogen from the atmosphere and
36 SUSTAINABLE LAND MANAGEMENT
SLM INTERVENTIONS 37
make it available to subsequent crops via biological or associative nitrogenfixation.
� Compensate for nutrient loss. Add nutrients first as green or animal manureand, if necessary, top off with inorganic fertilizers. Where soil nutrients havebeen severely depleted, it is often necessary to restore the minimum levelsrequired for adequate plant growth and yield. Sanchez et al. (1997) haveargued for nutrient recapitalization (especially of phosphorus) in Sub-Saharan Africa as a means of priming the biological nitrogen-fixationprocess and improving crop productivity. Animal manure and plant littersare generally low in phosphorus, and phosphorus, unlike nitrogen, cannotbe fixed from the atmosphere. Phosphorus deficiency is a major constrainton effective nitrogen fixation because phosphorus is an important nutrientin the process of nodulation and nitrogen fixation. Guano (for both nitro-gen and phosphorus) and rock phosphate (phosphorus and calcium) can begood sources of phosphorus where such materials are available locally (forexample, in Peru, Madagascar, Zaire, and West Africa).
� Select and use adapted and efficient species. Some leguminous tree and cropspecies are able to fix nitrogen at very low levels of available soil phospho-rus. Leguminous crops that combine some grain yield with high levels ofroot and leaf biomass, and thus a low nitrogen harvest, offer a useful com-promise in meeting farmers’ food security concerns and improving soil fer-tility. On-farm nitrogen budgets indicate that the use of legumes with high-quality residues and deep root systems is an effective way of improvingnutrient cycling.
� Optimize fertilizer-rainfall interactions. Rainfall markedly affects fertilizeruse efficiency, yet there is almost no guidacne as how farmers should adjustfertilizer use to seasonal rainfall. Piha (1993) developed and modified“response farming” techniques that use early rainfall events to decide on theamounts of fertilizer to apply in any given season. Over a five-year period,Piha’s system gave 25–42% more yield and 21–41% more profit than did theexisting fertilizer recommendations. The key to the system was its flexibil-ity. In poor years, fertilizer nitrogen use was reduced, but yields would bepoor in those years in any case. In good years, the farmer could get goodyields. Participating farmers’ profits were 105% higher than those of thecontrol group of comparably good farmers. Yields were 78% higher. Loanrepayment was excellent at 90%. Yet Piha’s work has yet to be recognized adecade later.
MARKET OPPORTUNITIES LINKED TO EROSION CONTROL PRACTICES:A KEY TO ADOPTION?
In the developing countries of the tropics, hillside agriculture is often charac-terized by a vicious circle of poverty reinforcing environmental degradation.Most of the poor people employed in farming reside in the fragile ecosystems
of the mid-altitude hillsides. Mining the natural resource base gives farmersshort-term subsistence, but creates a profound discrepancy between actual sys-tems of land use and the ecologically sound systems appropriate for fragilesoils on steep slopes. Maintenance of the natural resource base on the hillsidesis thus of vital importance not only to ensure the future livelihood of resource-poor farmers, but also to restrain rural-urban drift, at least until urban centersare better positioned to accept increased numbers of rural migrants.
Soil erosion has been identified as one of the most pressing resource man-agement problems on the hillsides. In Central America alone, for example, over60 percent of the hillsides are subject to severe water erosion caused by agri-culture. Although an abundance of erosion control technologies exists, adop-tion of these technologies in tropical countries has been disappointing. Inmany cases, soil depletion is rational from the farmer’s point of view (Ashby1985; Anderson and Thampapillai 1990). As the soil degenerates, however,yield and income losses build up. At early stages of soil depletion, the netreturns without soil conservation exceed the net returns with conservation.Over time, as soil degenerates further, the gap declines, until eventually netreturns with conservation are higher than those without. Adoption of soil con-servation technologies is unlikely to occur before this point, which one studycalculates to be at least 40 to 60 years after degeneration begins, depending onthe discount rate used (Seitz et al. 1979), and this can lead to a conflict betweenthe farmer’s logic and ecological considerations.
Studies also suggest that even when farmers are aware of the monetary ben-efits of erosion control, such as yield increases, they are unlikely to be con-cerned with nonmonetary benefits, such as soil resilience, or with downstreambenefits that accrue to others. Thus, the extent to which soil conservation prac-tices are voluntarily adopted by farmers will often prove suboptimal from soci-ety’s point of view.
The problems with adoption of the soil conservation practices discussedabove imply that farmers will have to be offered incentives to induce timelyadoption. Incentives have commonly taken the form of subsidies or regula-tions. The former are costly, and in many cases induce distortions in other sectors of the economy. The latter are extremely difficult to enforce. The researchreported here explores a different type of incentive. The objective is to linkincome earning and/or cost-saving opportunities to soil conservation prac-tices (box 4.2). This is expected to increase the returns to conservation practices,resulting in earlier adoption of sustainable practices.
In many cases, adoption of soil conservation practices may in fact occurbecause of the opportunity to increase income, with soil conservation occur-ring as a by-product. This approach derives support from the fact that, in the few cases of successful adoption that have occurred, soil conservation prac-tices permitted the introduction of high-value crops, supported the introduc-tion of livestock, or generated income by being associated with value-addedprocesses (Nimlos and Savage 1991; Tiffen and Mortimore 1992). Linking
38 SUSTAINABLE LAND MANAGEMENT
Two well-known examples of payments by lowland communities for eco-systems services provided by upland communities can be found in New YorkCity and in the Cauca Valley of Colombia. In 1989, New York’s water, pipedin from the Catskill Mountains, was found to contain rising levels of sedi-ments and pollutants. The Environmental Protection Agency ordered the cityto build a water filtration plant at an estimated cost of between US$ 6 billionand 8 billion. Instead of building the expensive filtration plant, however, thecity opted to work with the residents of the Catskills watershed. Theyfinanced reforestation projects, created riparian woodlands to protect theintegrity of the streams, and signed conservation easements with local farm-ers to enhance the filtration of sediments and pollutants by the riparian veg-etation. The quality of the water improved dramatically, and the cost ofthis collaborative effort with the residents of the Catskills was less than US$ 2 billion—a big saving to New York City taxpayers. Similarly, in Colom-bia’s Cauca Valley, agricultural producers pay fees, via their water-user associ-ations, to compensate upland communities for soil conservation on steepslopes, reforestation, and maintenance of riparian vegetation buffers toimprove water flows and reduce sedimentation in irrigation canals.
Source: Pagiola et al. 2002.
Box 4.2 Linking Income-Earning and Cost-Saving Opportunities to Soil Conservation Practices and Control of Pollutionand Sedimentation
market opportunity to conservation practices is vital, however. The literatureis replete with cases in which the introduction of income-generating opportu-nities without any links to conservation have exacerbated resource degradation(Thrupp 1993).
In particular, upland farmers lack information about marketing opportuni-ties. This information could widen the range of crops grown to include thosethat can positively contribute to curtailing soil erosion. There is evidence fromthe Bank’s Europe and Central Asia region that vertical marketing systems thatlink farmer producers to product processors might facilitate the exploitation ofnew market opportunities by small-scale farmers.
PROTECTING AND MANAGING WATERSHEDS
Investments in watershed management are critical to the sustainability of landand water resources (see figure 4.1). In upland areas, set-asides, reforestation,and soil conservation on a large scale are essential. In floodplains, land zoningto provide space for inevitable flooding is preferable to enormously costly (and
SLM INTERVENTIONS 39
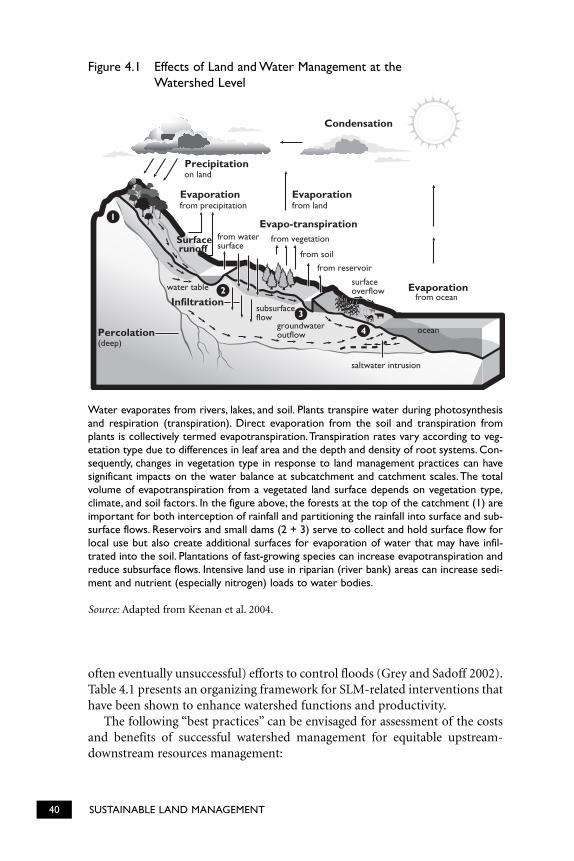
40 SUSTAINABLE LAND MANAGEMENT
The Hydrological Cycle
Condensation
Precipitation
EvaporationEvaporation
Evaporation
Percolation
Infiltration
Surfacerunoff
Evapo-transpiration
from precipitation
on land
from land
from watersurface
from vegetation
from soil
from reservoir
surfaceoverflow
from ocean
ocean(deep)
water table
subsurfaceflow
groundwateroutflow
saltwater intrusion
1
2
3
4
Figure 4.1 Effects of Land and Water Management at the Watershed Level
Water evaporates from rivers, lakes, and soil. Plants transpire water during photosynthesisand respiration (transpiration). Direct evaporation from the soil and transpiration fromplants is collectively termed evapotranspiration.Transpiration rates vary according to veg-etation type due to differences in leaf area and the depth and density of root systems. Con-sequently, changes in vegetation type in response to land management practices can havesignificant impacts on the water balance at subcatchment and catchment scales.The totalvolume of evapotranspiration from a vegetated land surface depends on vegetation type,climate, and soil factors. In the figure above, the forests at the top of the catchment (1) areimportant for both interception of rainfall and partitioning the rainfall into surface and sub-surface flows. Reservoirs and small dams (2 + 3) serve to collect and hold surface flow forlocal use but also create additional surfaces for evaporation of water that may have infil-trated into the soil. Plantations of fast-growing species can increase evapotranspiration andreduce subsurface flows. Intensive land use in riparian (river bank) areas can increase sedi-ment and nutrient (especially nitrogen) loads to water bodies.
Source: Adapted from Keenan et al. 2004.
often eventually unsuccessful) efforts to control floods (Grey and Sadoff 2002).Table 4.1 presents an organizing framework for SLM-related interventions thathave been shown to enhance watershed functions and productivity.
The following “best practices” can be envisaged for assessment of the costsand benefits of successful watershed management for equitable upstream-downstream resources management:
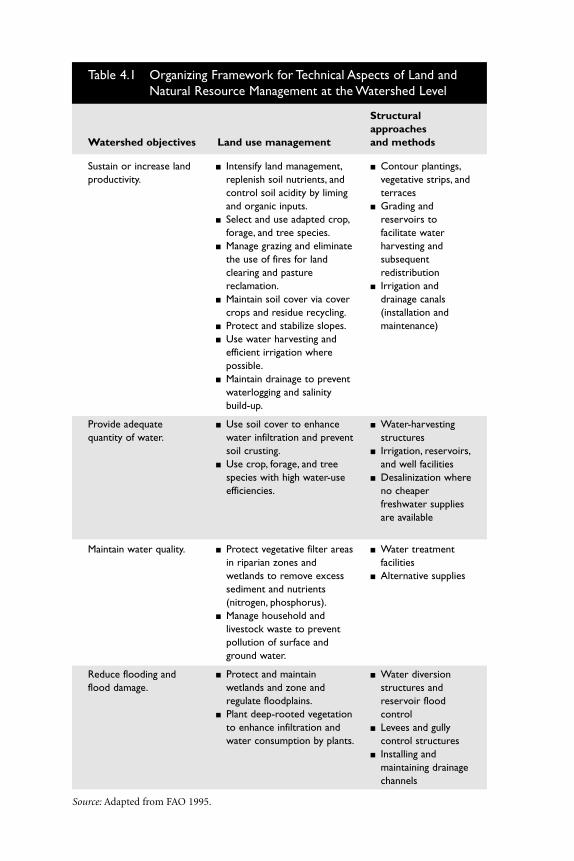
Structural approaches
Watershed objectives Land use management and methods
Table 4.1 Organizing Framework for Technical Aspects of Land andNatural Resource Management at the Watershed Level
Sustain or increase landproductivity.
� Intensify land management,replenish soil nutrients, andcontrol soil acidity by limingand organic inputs.
� Select and use adapted crop,forage, and tree species.
� Manage grazing and eliminatethe use of fires for landclearing and pasturereclamation.
� Maintain soil cover via covercrops and residue recycling.
� Protect and stabilize slopes.� Use water harvesting and
efficient irrigation wherepossible.
� Maintain drainage to preventwaterlogging and salinitybuild-up.
� Contour plantings,vegetative strips, andterraces
� Grading andreservoirs tofacilitate waterharvesting andsubsequentredistribution
� Irrigation anddrainage canals(installation andmaintenance)
Provide adequatequantity of water.
� Use soil cover to enhancewater infiltration and preventsoil crusting.
� Use crop, forage, and treespecies with high water-useefficiencies.
� Water-harvestingstructures
� Irrigation, reservoirs,and well facilities
� Desalinization whereno cheaperfreshwater suppliesare available
Maintain water quality. � Protect vegetative filter areasin riparian zones andwetlands to remove excesssediment and nutrients(nitrogen, phosphorus).
� Manage household andlivestock waste to preventpollution of surface andground water.
� Water treatmentfacilities
� Alternative supplies
Reduce flooding andflood damage.
� Protect and maintainwetlands and zone andregulate floodplains.
� Plant deep-rooted vegetationto enhance infiltration andwater consumption by plants.
� Water diversionstructures andreservoir floodcontrol
� Levees and gullycontrol structures
� Installing andmaintaining drainagechannels
Source: Adapted from FAO 1995.
� All parties in the watershed have a stake in the management program andwatershed development functions as an equity-enhancing mechanism.
� Because irrigation water is often the most valuable resource of watershedmanagement, it is essential to develop mechanisms that allow an equitablesharing of the water. This resource sharing can substitute for direct paymentsto some stakeholders.
� Where common property is involved, especially in the upper catchments, it isessential that local communities collectively protect the common land so thatthe irrigation water resource is not compromised by illegal deforestation orovergrazing. Collective action is easier where communities are homogeneous.
� The benefits of good resource management and water harvesting for irriga-tion in watersheds will vary with agroclimatic and biophysical conditions. Ifthe benefits are not sufficiently substantial to be meaningfully shared, envi-ronmental service payments may not be economically viable.
� Leverage for the landless and less powerful stakeholders in the watershed isnecessary to enable them to participate effectively in the program. In somecases, external institutions may need to play a facilitating role on behalf ofthe “weakest” stakeholders.
� If irrigation water is used to produce greater vegetation biomass on com-mon lands, biomass-sharing agreements are needed, especially for landlessstakeholders.
� If water harvesting results in improved recharge of groundwater aquifers,designating ground water as a common property resource can provide allstakeholders with a powerful incentive to improve natural resource man-agement practices and collective action.
EXPLOITING THE PRODUCTION AND ENVIRONMENTAL SERVICE FUNCTIONS OF LAND
In addition to facilitating the production of food, feeds, and industrial crops,natural ecosystems and agroecosystems also provide a wide variety of “non-market” services. The environmental services derived from forest ecosystemstypically include (but are not limited to):
� Hydrological benefits: controlling the timing and volume of water flows andprotecting water quality
� Reduced sedimentation: avoiding damage to downstream reservoirs andwaterways, thereby safeguarding uses such as hydroelectric power genera-tion, irrigation, recreation, fisheries, and domestic water supplies
� Disaster mitigation: buffering against floods and landslides� Biodiversity conservation� Carbon sequestration and sinks for other greenhouse gases such as methane
42 SUSTAINABLE LAND MANAGEMENT
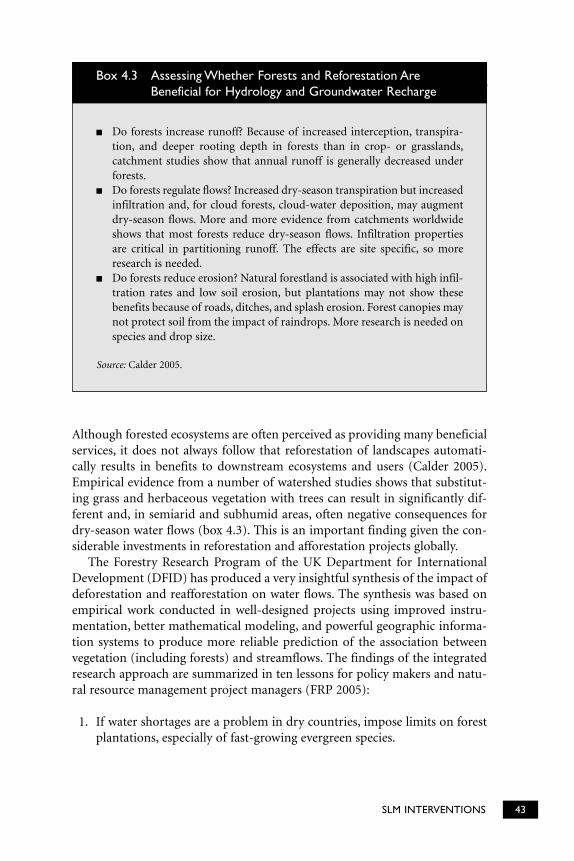
Although forested ecosystems are often perceived as providing many beneficialservices, it does not always follow that reforestation of landscapes automati-cally results in benefits to downstream ecosystems and users (Calder 2005).Empirical evidence from a number of watershed studies shows that substitut-ing grass and herbaceous vegetation with trees can result in significantly dif-ferent and, in semiarid and subhumid areas, often negative consequences fordry-season water flows (box 4.3). This is an important finding given the con-siderable investments in reforestation and afforestation projects globally.
The Forestry Research Program of the UK Department for InternationalDevelopment (DFID) has produced a very insightful synthesis of the impact ofdeforestation and reafforestation on water flows. The synthesis was based onempirical work conducted in well-designed projects using improved instru-mentation, better mathematical modeling, and powerful geographic informa-tion systems to produce more reliable prediction of the association betweenvegetation (including forests) and streamflows. The findings of the integratedresearch approach are summarized in ten lessons for policy makers and natu-ral resource management project managers (FRP 2005):
1. If water shortages are a problem in dry countries, impose limits on forestplantations, especially of fast-growing evergreen species.
SLM INTERVENTIONS 43
� Do forests increase runoff? Because of increased interception, transpira-tion, and deeper rooting depth in forests than in crop- or grasslands,catchment studies show that annual runoff is generally decreased underforests.
� Do forests regulate flows? Increased dry-season transpiration but increasedinfiltration and, for cloud forests, cloud-water deposition, may augmentdry-season flows. More and more evidence from catchments worldwideshows that most forests reduce dry-season flows. Infiltration propertiesare critical in partitioning runoff. The effects are site specific, so moreresearch is needed.
� Do forests reduce erosion? Natural forestland is associated with high infil-tration rates and low soil erosion, but plantations may not show thesebenefits because of roads, ditches, and splash erosion. Forest canopies maynot protect soil from the impact of raindrops. More research is needed onspecies and drop size.
Source: Calder 2005.
Box 4.3 Assessing Whether Forests and Reforestation AreBeneficial for Hydrology and Groundwater Recharge
2. Implement “green water” instruments (based on data from plant transpir-ation) to control levels of evaporation from upland vegetation.
3. If upland forests are cleared for cultivation, provide farmers with guide-lines for best agricultural practices.
4. Any market mechanism or tax system linking land management to quan-tified streamflow should ensure that scientific validation is possible at thescale of the operation.
5. Use decision support systems to assess the impact of alternative land man-agement options on water resources, and of alternative land use and watermanagement and policy options on different social groups.
6. Ensure that policy instruments are equitable in terms of livelihood bene-fits, not just water allocation.
7. Ensure that any proposed market mechanism is adequately pro-poor.8. Consider improvements in rain-fed farming (crop breeding, rainwater har-
vesting, mulching, conservation tillage, market access, capacity building) inpreference to further investments in rural small-scale irrigation schemes.
9. Use negotiation support system techniques such as choice experiments toascertain stakeholder preferences for policy agreements.
10. Tailor employment programs to dovetail with other livelihood activities ofthe people whom they are intended to attract.
Payments for environmental services (PES) could significantly improve anddiversify the income sources of land users, especially in the developing world.There are a variety of existing market-based mechanisms and criteria forrewarding good natural resources management via payments for the resultingenvironmental services. For trading purposes, the services need to be tangible,scientifically quantified, and in accordance with local legislation (Pagiola et al.2002). The payment mechanisms include private deals, public payments, andopen trading schemes among local communities, municipalities, companies,and national governments. Economic valuation offers a way to compare thediverse benefits and costs associated with ecosystems by attempting to measurethem and expressing them in a common denominator—typically a monetaryunit used (see table 4.2). The main framework used is the Total EconomicValue approach (Pearce and Warford 1993).
The market-based incentive systems that provide rewards in the hope ofpromoting sustainable land and water stewardship in catchments and basinsgenerally work on the concept that enhanced resources management in uppercatchments results in both productivity and ecosystem services that can bene-fit stakeholders in the lower catchments. In most incentive-based systems, thebeneficiaries are charged an appropriate amount that is then equitably sharedamong the land users in the upper catchment.
Emerging markets for payments for ecosystem services in Costa Rica(Miranda et al. 2003), India, the United States, and Australia have resulted insome positive behavioral changes in resource management on the part of
44 SUSTAINABLE LAND MANAGEMENT
upstream land users—with significant downstream benefits (Pagiola et al.2002). Watershed services are very dependent on the watershed or subwater-shed level, however, which limits market scale and size.
To ensure the success and sustainability of incentive-based systems to facil-itate the improved management of irrigation water and associated naturalresources, the following challenges may have to be overcome:
� Identifying and reliably quantifying the volume and quality of water flowsand associated benefits (for example, vegetation biomass and soil cover,reduced erosion, and added food and fiber production) provided by goodland and natural resources stewardship.
� Identifying the risks (for example, climate change) and opportunities formitigating the risk to irrigation water and natural resources managementoperations (Burton and van Aalst 2004).
� Identifying the beneficiaries of the improved volume and quality of waterflows and charging them to provide the financing mechanism.
� Ensuring that payments are equitably distributed to all stakeholders andthat the amount not only compensates them for the costs of changes inresources management but also reflects the value of the services provided.Because supply price and ecosystem benefits are based on location in thewatershed or landscape, Chomitz et al. (1998) suggest a framework basedon spatial information to guide prioritization and pricing.
� Creating an appropriate decision-making framework and institutional sup-port structure that can be accessed by all stakeholders. Watershed-modelingtools are also very useful in engaging community, research, and policy stake-holders (Calder 2005).
Although biodiversity itself is not an ecosystem service, conserving bio-diversity can promote a wide range of ecosystem benefits and environmentalservices. It is the ecological interaction of taxonomic and functional groups ofbiota that maintain ecosystem function and provide a measure of resilience inthe face of environmental shocks. Loss of biodiversity is commonly associatedwith a loss of system function that, in extreme cases, can lead to irreversiblesystem breakdown. Rural farmers in marginally productive lands tend to bemore acutely aware of the relationship between biodiversity and its role in themaintenance of livelihoods than are their counterparts, broad-scale agricultur-alists. The irony for the rural poor is that a downward economic spiral rarelyprovides any leeway for biodiversity conservation. Under such circumstances,providing incentives directly through monetary payments, or indirectlythrough policy instruments that facilitate some form of tax relief, is most likelyto generate positive feedback for land management and sustainable livelihoods(box 4.4).
Although there are, as yet, no efficient mechanisms for the economic cali-bration of naturally occurring and farm-based biodiversity, recent studies in
SLM INTERVENTIONS 45
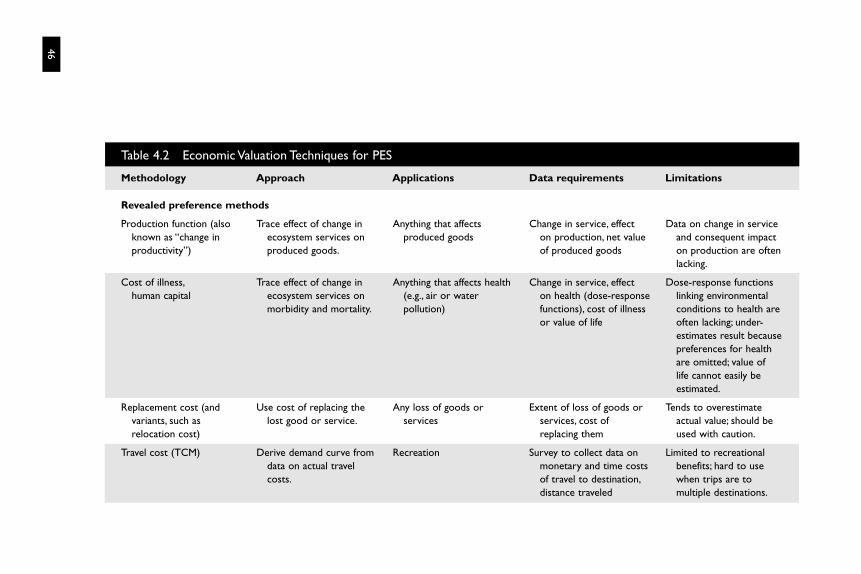
46
Table 4.2 Economic Valuation Techniques for PES
Methodology Approach Applications Data requirements Limitations
Revealed preference methods
Production function (also Trace effect of change in Anything that affects Change in service, effect Data on change in serviceknown as “change in ecosystem services on produced goods on production, net value and consequent impactproductivity”) produced goods. of produced goods on production are often
lacking.
Cost of illness, Trace effect of change in Anything that affects health Change in service, effect Dose-response functionshuman capital ecosystem services on (e.g., air or water on health (dose-response linking environmental
morbidity and mortality. pollution) functions), cost of illness conditions to health areor value of life often lacking; under-
estimates result becausepreferences for health are omitted; value of life cannot easily be estimated.
Replacement cost (and Use cost of replacing the Any loss of goods or Extent of loss of goods or Tends to overestimatevariants, such as lost good or service. services services, cost of actual value; should berelocation cost) replacing them used with caution.
Travel cost (TCM) Derive demand curve from Recreation Survey to collect data on Limited to recreationaldata on actual travel monetary and time costs benefits; hard to usecosts. of travel to destination, when trips are to
distance traveled multiple destinations.
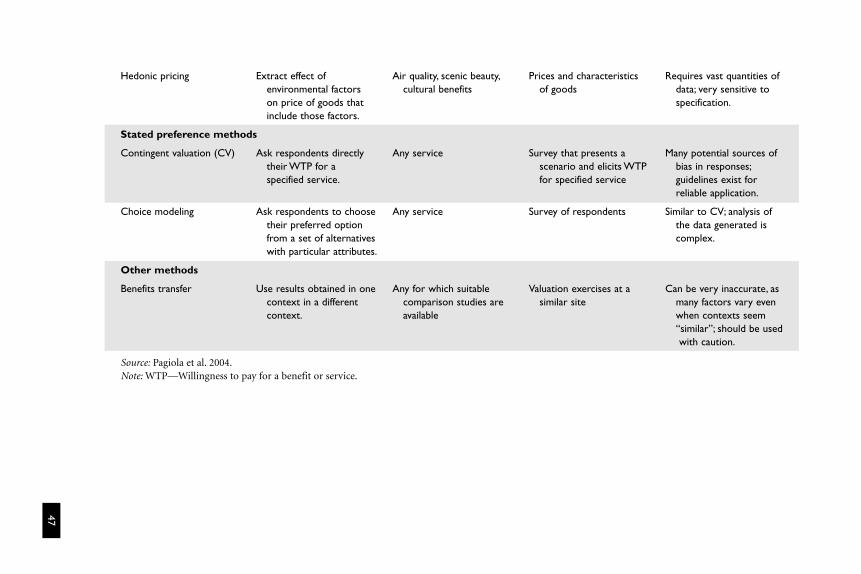
47
Hedonic pricing Extract effect of Air quality, scenic beauty, Prices and characteristics Requires vast quantities ofenvironmental factors cultural benefits of goods data; very sensitive toon price of goods that specification.include those factors.
Stated preference methods
Contingent valuation (CV) Ask respondents directly Any service Survey that presents a Many potential sources oftheir WTP for a scenario and elicits WTP bias in responses;specified service. for specified service guidelines exist for
reliable application.
Choice modeling Ask respondents to choose Any service Survey of respondents Similar to CV; analysis of their preferred option the data generated isfrom a set of alternatives complex.with particular attributes.
Other methods
Benefits transfer Use results obtained in one Any for which suitable Valuation exercises at a Can be very inaccurate, ascontext in a different comparison studies are similar site many factors vary evencontext. available when contexts seem
“similar”; should be usedwith caution.
Source: Pagiola et al. 2004.Note: WTP—Willingness to pay for a benefit or service.
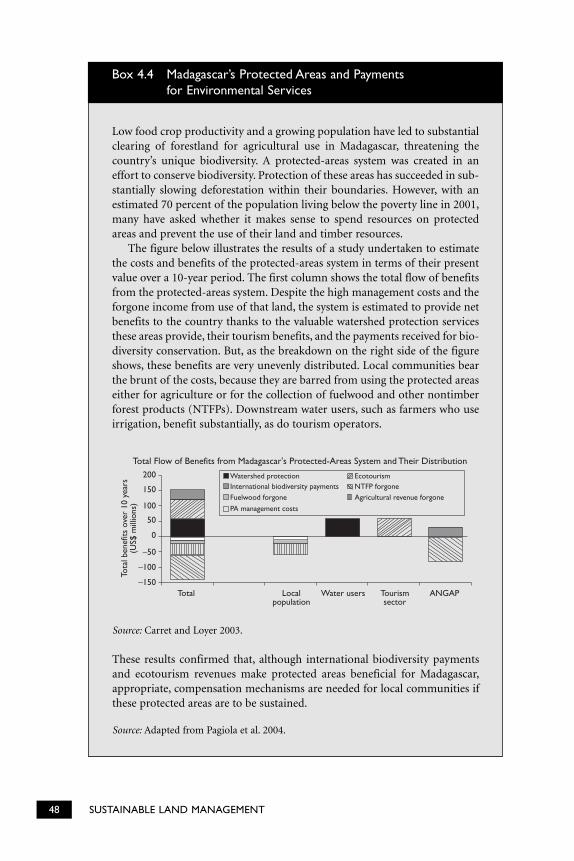
48 SUSTAINABLE LAND MANAGEMENT
Low food crop productivity and a growing population have led to substantialclearing of forestland for agricultural use in Madagascar, threatening thecountry’s unique biodiversity. A protected-areas system was created in aneffort to conserve biodiversity. Protection of these areas has succeeded in sub-stantially slowing deforestation within their boundaries. However, with anestimated 70 percent of the population living below the poverty line in 2001,many have asked whether it makes sense to spend resources on protectedareas and prevent the use of their land and timber resources.
The figure below illustrates the results of a study undertaken to estimatethe costs and benefits of the protected-areas system in terms of their presentvalue over a 10-year period. The first column shows the total flow of benefitsfrom the protected-areas system. Despite the high management costs and theforgone income from use of that land, the system is estimated to provide netbenefits to the country thanks to the valuable watershed protection servicesthese areas provide, their tourism benefits, and the payments received for bio-diversity conservation. But, as the breakdown on the right side of the figureshows, these benefits are very unevenly distributed. Local communities bearthe brunt of the costs, because they are barred from using the protected areaseither for agriculture or for the collection of fuelwood and other nontimberforest products (NTFPs). Downstream water users, such as farmers who useirrigation, benefit substantially, as do tourism operators.
Box 4.4 Madagascar’s Protected Areas and Payments for Environmental Services
Total Flow of Benefits from Madagascar's Protected-Areas System and Their Distribution200
150
100
50
0
–50
–100
–150
Tota
l ben
efits
ove
r 10
yea
rs(U
S$ m
illio
ns)
Total Localpopulation
Water users Tourismsector
ANGAP
Watershed protectionInternational biodiversity paymentsFuelwood forgone
PA management costs
EcotourismNTFP forgoneAgricultural revenue forgone
Source: Carret and Loyer 2003.
These results confirmed that, although international biodiversity paymentsand ecotourism revenues make protected areas beneficial for Madagascar,appropriate, compensation mechanisms are needed for local communities ifthese protected areas are to be sustained.
Source: Adapted from Pagiola et al. 2004.
Southeast Asia and Latin America (Gillison 2000, 2002) have shown how rela-tively low-cost baseline surveys can provide a model for coupling biodiversitywith potential agricultural productivity and profitability (total factor prof-itability), including above-ground carbon. Models of this kind show promisein identifying and calibrating indicators that can be used to attach an economicvalue to biodiversity. To put such methods into practice will require a systemof user-friendly field indicators derived from representative regional baselinestudies. Among the relatively simple indicators that have been established sofar is a relative measure of vegetation or plant diversity known as the “V” index(see appendix). The emergence of this and other simple science-based indica-tors is providing a generic, rapid, low-cost approach to valuing biodiversity.Further critical testing is envisioned in contrasting ecological zones beforesuch indicators can be implemented with confidence.
SLM INTERVENTIONS 49
The Bank’s Evolving SLM Portfolio
C H A P T E R T H R E E
50
Currently the World Bank’s country operational frameworks, such aspoverty reduction strategy papers, country assistance strategies(CAS), strategic environmental assessments, country environmental
analyses, and so on, affect the preparation of SLM and other forms of naturalresource projects. Each has aimed to address many of the issues directly orindirectly involved in integrating land and water management, biodiversityconservation, and the environment.
PAST AND CURRENT INVESTMENTS FOR SLM AND RELATED INTERVENTIONS
The Bank’s rural development strategy Reaching the Rural Poor (World Bank2003) specifically targets the “enhanced sustainability of natural resourcemanagement.” To promote the conservation and restoration of natural assets in rural areas, the Bank has developed guidelines and strategies for the environment, forestry, and water, and explicitly links rural develop-ment in agriculture to sustainable, resource management. In addition, the in-country poverty-reduction strategy program (PRSP) approach has beensupported with a Poverty-Reduction Strategy Source Book available on theWorld Bank’s web site that has sections on natural resources and related concerns.
C H A P T E R F I V E
THE PATTERN OF BANK GROUP INVESTMENTS IN SLM, NRM, BIOCARBON,AND WATERSHED MANAGEMENT PROGRAMS
The World Bank, the International Finance Corporation, the Global Environ-ment Facility, and other donors have supported SLM projects through the pro-vision of significant loans and grants over several decades.8 The investmentsinclude:
� International Bank for Reconstruction and Development (IBRD) and Inter-national Development Assistance (IDA) projects with SLM as a component(1999–2004)
� IBRD and IDA projects focusing on watershed management� World Bank carbon investment funds (2002–2005)
IBRD and IDA Projects with SLM as a Component (1999–2004)
Since 1990, there have been investments in approximately 250 projects withSLM components within agriculture, forestry, natural resource management,land rehabilitation, mining, and land administration across the Bank’s sixregions. The projects dealt with SLM field activities or the organizational, pol-icy, and technical means to implement SLM and to create the enabling condi-tions necessary to induce land management change (for example, the provisionof secure land title). Target groups or implementing participants were eitherthe government or multiple partners that included government, industry,community groups, and individual land users. See table 5.1 for a detailed list ofSLM practices targeted in IBRD and IDA investments.
A review of implementation completion reports for 47 projects in which theSLM component comprised more than 25 percent of the total investmentrevealed that between 1990 and 2000, 34 projects (72 percent) involved sub-stantially sustainable natural resource management components. Of the totallending of $2.6 billion allocated to the 47 projects, $2.0 billion went to the sus-tainable NRM-oriented projects. This constituted 74 percent of the total lend-ing allocated to the 47 projects (figure 5.1). The range of SLM investmentsacross sectors is presented in table 5.1.
The SLM projects had a high rate of success in achieving the intended proj-ect outcomes. The economic rate of return (ERR) estimated for all projectexpenditures ranged between 6.7 and 34 percent, averaging 21.8 percent.Although this is a relatively small sample, the figures are indicative of the highvariability in performance among the projects. The agriculture sector and theland rehabilitation projects that were agriculturally oriented provided signifi-cant gains in improving rural livelihoods. The coupling of SLM activities with
THE BANK’S EVOLVING SLM PORTFOLIO 51
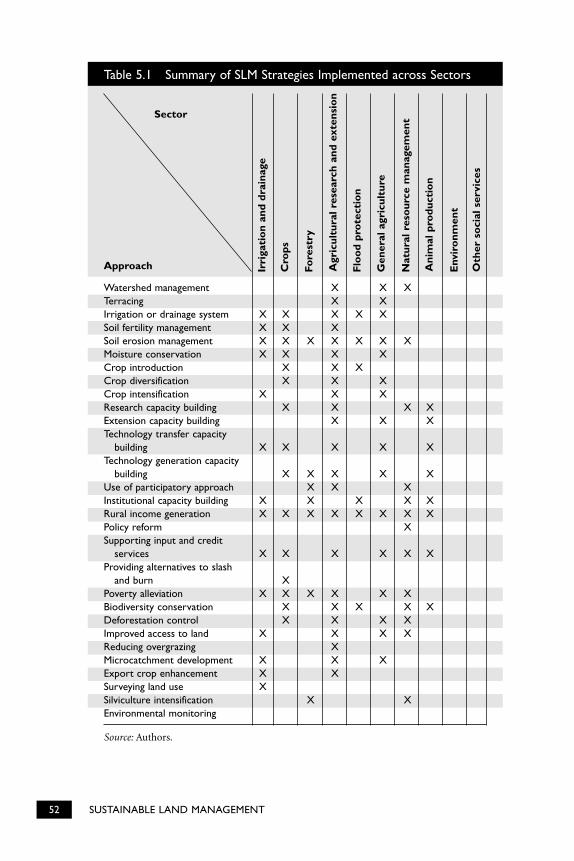
52 SUSTAINABLE LAND MANAGEMENT
Table 5.1 Summary of SLM Strategies Implemented across Sectors
Watershed management X X XTerracing X XIrrigation or drainage system X X X X XSoil fertility management X X XSoil erosion management X X X X X X XMoisture conservation X X X XCrop introduction X X XCrop diversification X X XCrop intensification X X XResearch capacity building X X X XExtension capacity building X X XTechnology transfer capacity
building X X X X XTechnology generation capacity
building X X X X XUse of participatory approach X X XInstitutional capacity building X X X X XRural income generation X X X X X X X XPolicy reform XSupporting input and credit
services X X X X X XProviding alternatives to slash
and burn XPoverty alleviation X X X X X XBiodiversity conservation X X X X XDeforestation control X X X XImproved access to land X X X XReducing overgrazing XMicrocatchment development X X XExport crop enhancement X XSurveying land use XSilviculture intensification X XEnvironmental monitoring
Source: Authors.
Irri
gati
on
and
drai
nage
Cro
ps
Fore
stry
Agr
icul
tura
lres
earc
han
dex
tens
ion
Flo
od
pro
tect
ion
Gen
eral
agri
cult
ure
Nat
ural
reso
urce
man
agem
ent
Ani
mal
pro
duct
ion
Env
iro
nmen
t
Oth
erso
cial
serv
ices
Approach
Sector
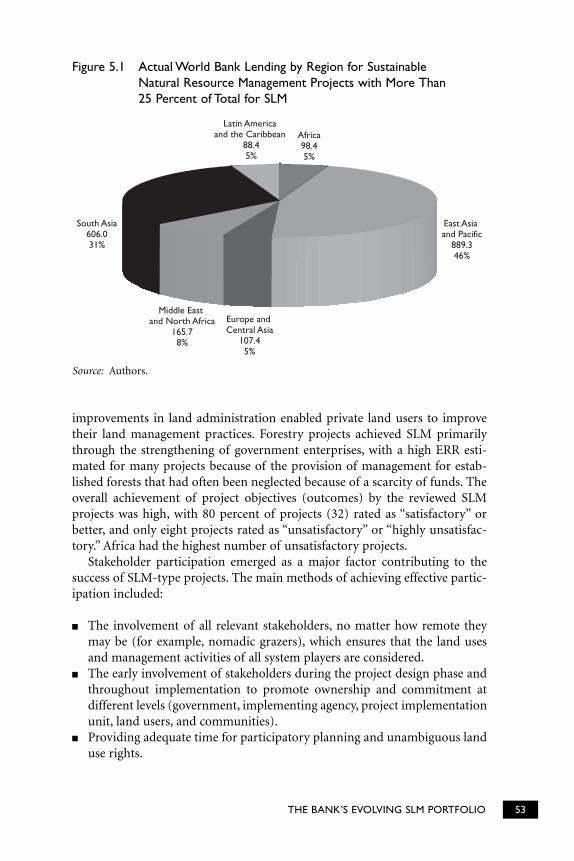
THE BANK’S EVOLVING SLM PORTFOLIO 53
improvements in land administration enabled private land users to improvetheir land management practices. Forestry projects achieved SLM primarilythrough the strengthening of government enterprises, with a high ERR esti-mated for many projects because of the provision of management for estab-lished forests that had often been neglected because of a scarcity of funds. Theoverall achievement of project objectives (outcomes) by the reviewed SLMprojects was high, with 80 percent of projects (32) rated as “satisfactory” orbetter, and only eight projects rated as “unsatisfactory” or “highly unsatisfac-tory.” Africa had the highest number of unsatisfactory projects.
Stakeholder participation emerged as a major factor contributing to thesuccess of SLM-type projects. The main methods of achieving effective partic-ipation included:
� The involvement of all relevant stakeholders, no matter how remote theymay be (for example, nomadic grazers), which ensures that the land usesand management activities of all system players are considered.
� The early involvement of stakeholders during the project design phase andthroughout implementation to promote ownership and commitment atdifferent levels (government, implementing agency, project implementationunit, land users, and communities).
� Providing adequate time for participatory planning and unambiguous landuse rights.
Latin America and the Caribbean
88.45%
Africa98.45%
East Asia and Pacific
889.346%
South Asia606.031%
Middle East and North Africa
165.78%
Europe and Central Asia
107.45%
Figure 5.1 Actual World Bank Lending by Region for Sustainable Natural Resource Management Projects with More Than 25 Percent of Total for SLM
Source: Authors.
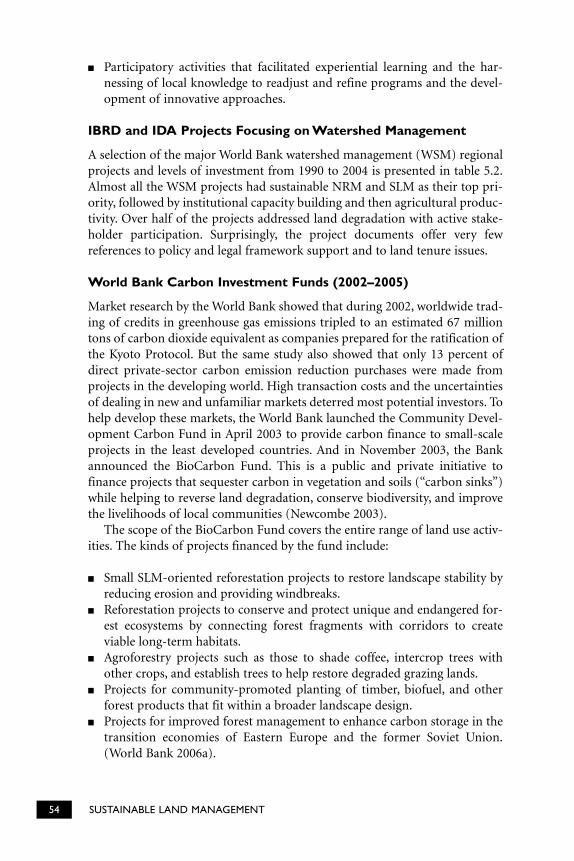
� Participatory activities that facilitated experiential learning and the har-nessing of local knowledge to readjust and refine programs and the devel-opment of innovative approaches.
IBRD and IDA Projects Focusing on Watershed Management
A selection of the major World Bank watershed management (WSM) regionalprojects and levels of investment from 1990 to 2004 is presented in table 5.2.Almost all the WSM projects had sustainable NRM and SLM as their top pri-ority, followed by institutional capacity building and then agricultural produc-tivity. Over half of the projects addressed land degradation with active stake-holder participation. Surprisingly, the project documents offer very fewreferences to policy and legal framework support and to land tenure issues.
World Bank Carbon Investment Funds (2002–2005)
Market research by the World Bank showed that during 2002, worldwide trad-ing of credits in greenhouse gas emissions tripled to an estimated 67 milliontons of carbon dioxide equivalent as companies prepared for the ratification ofthe Kyoto Protocol. But the same study also showed that only 13 percent ofdirect private-sector carbon emission reduction purchases were made fromprojects in the developing world. High transaction costs and the uncertaintiesof dealing in new and unfamiliar markets deterred most potential investors. Tohelp develop these markets, the World Bank launched the Community Devel-opment Carbon Fund in April 2003 to provide carbon finance to small-scaleprojects in the least developed countries. And in November 2003, the Bankannounced the BioCarbon Fund. This is a public and private initiative tofinance projects that sequester carbon in vegetation and soils (“carbon sinks”)while helping to reverse land degradation, conserve biodiversity, and improvethe livelihoods of local communities (Newcombe 2003).
The scope of the BioCarbon Fund covers the entire range of land use activ-ities. The kinds of projects financed by the fund include:
� Small SLM-oriented reforestation projects to restore landscape stability byreducing erosion and providing windbreaks.
� Reforestation projects to conserve and protect unique and endangered for-est ecosystems by connecting forest fragments with corridors to createviable long-term habitats.
� Agroforestry projects such as those to shade coffee, intercrop trees withother crops, and establish trees to help restore degraded grazing lands.
� Projects for community-promoted planting of timber, biofuel, and otherforest products that fit within a broader landscape design.
� Projects for improved forest management to enhance carbon storage in thetransition economies of Eastern Europe and the former Soviet Union.(World Bank 2006a).
54 SUSTAINABLE LAND MANAGEMENT
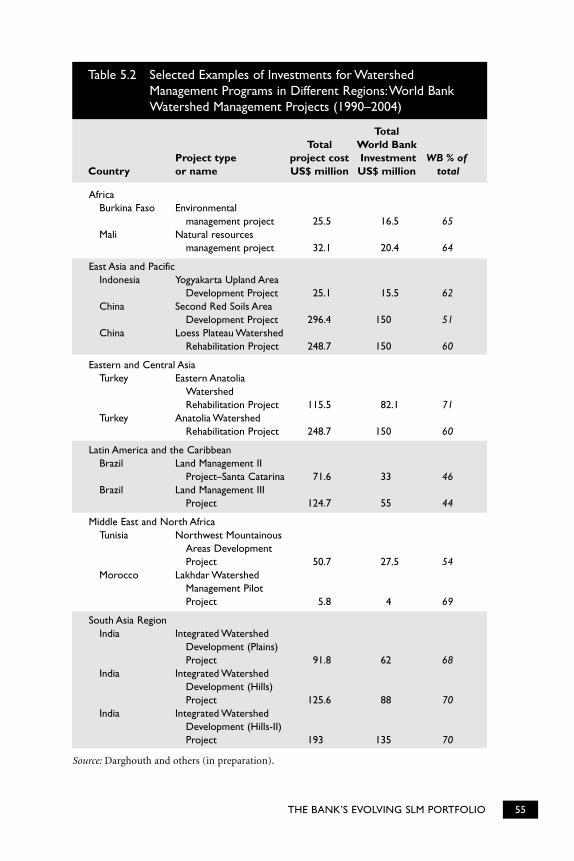
THE BANK’S EVOLVING SLM PORTFOLIO 55
Table 5.2 Selected Examples of Investments for WatershedManagement Programs in Different Regions:World BankWatershed Management Projects (1990–2004)
TotalTotal World Bank
Project type project cost Investment WB % ofCountry or name US$ million US$ million total
AfricaBurkina Faso Environmental
management project 25.5 16.5 65Mali Natural resources
management project 32.1 20.4 64
East Asia and PacificIndonesia Yogyakarta Upland Area
Development Project 25.1 15.5 62China Second Red Soils Area
Development Project 296.4 150 51China Loess Plateau Watershed
Rehabilitation Project 248.7 150 60
Eastern and Central AsiaTurkey Eastern Anatolia
Watershed Rehabilitation Project 115.5 82.1 71
Turkey Anatolia Watershed Rehabilitation Project 248.7 150 60
Latin America and the CaribbeanBrazil Land Management II
Project–Santa Catarina 71.6 33 46Brazil Land Management III
Project 124.7 55 44
Middle East and North AfricaTunisia Northwest Mountainous
Areas Development Project 50.7 27.5 54
Morocco Lakhdar Watershed Management Pilot Project 5.8 4 69
South Asia RegionIndia Integrated Watershed
Development (Plains) Project 91.8 62 68
India Integrated Watershed Development (Hills) Project 125.6 88 70
India Integrated Watershed Development (Hills-II) Project 193 135 70
Source: Darghouth and others (in preparation).
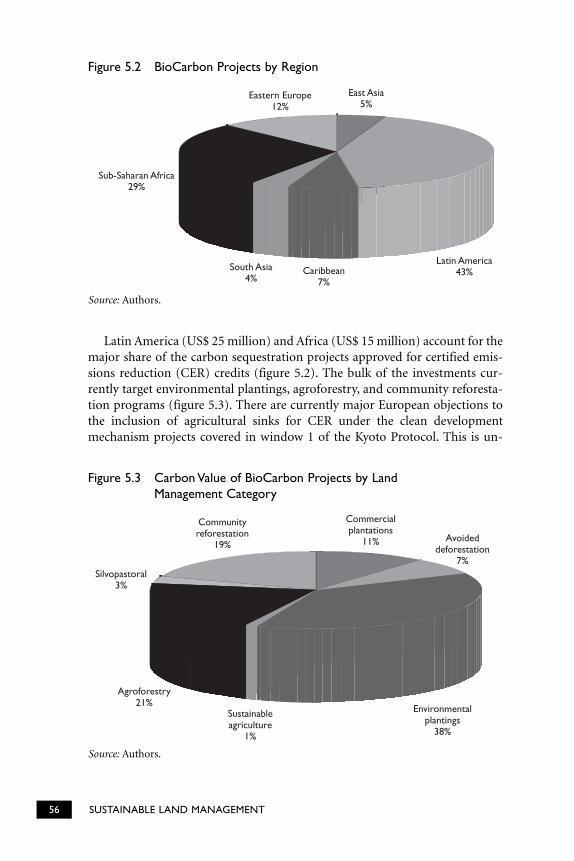
56 SUSTAINABLE LAND MANAGEMENT
Latin America (US$ 25 million) and Africa (US$ 15 million) account for themajor share of the carbon sequestration projects approved for certified emis-sions reduction (CER) credits (figure 5.2). The bulk of the investments cur-rently target environmental plantings, agroforestry, and community reforesta-tion programs (figure 5.3). There are currently major European objections tothe inclusion of agricultural sinks for CER under the clean development mechanism projects covered in window 1 of the Kyoto Protocol. This is un-
Eastern Europe12%
East Asia5%
Latin America43%Caribbean
7%
South Asia4%
Sub-Saharan Africa29%
Figure 5.2 BioCarbon Projects by Region
Communityreforestation
19%
Commercialplantations
11% Avoideddeforestation
7%
Environmentalplantings
38%
Silvopastoral3%
Agroforestry21%
Sustainableagriculture
1%
Figure 5.3 Carbon Value of BioCarbon Projects by Land Management Category
Source: Authors.
Source: Authors.
fortunate, because if agricultural sinks were eligible, the resulting increases insequestered soil carbon (that is, more soil organic matter) would also have asignificant beneficial effect on soil biological, chemical, and physical properties(Ingram and Fernandes 2001), which would result in greater nutrient andwater-holding capacity and thus enhance productivity and promote furtherinvestments in SLM.
LESSONS LEARNED
Because land and natural resource management issues vary greatly from com-munity to community, from watershed to watershed, and from country tocountry, it is simplistic to generalize about outcomes. We examined the WorldBank’s Operations Evaluation Department (World Bank 1988) review of invest-ment experiences in NRM, where 12 country case studies were undertaken toexamine the Bank’s operations through economic and sector work (ESW) andproject lending during the period 1965 to 1986.
The conceptual framework used by the OED to evaluate successful NRMwas based on the following principles:
� Sustainability is likely when renewable resources are properly used and con-served rather than depleted.
� Economic efficiency is essential.� The resulting benefits must be equitably distributed.
The OED review also assumed that, although in practice conflicts arise andchoices have to be made, any use of renewable resources that leads to theexhaustion of those resources cannot be efficient. Furthermore, althoughtrade-offs between equity and sustainability or equity and efficiency may existin the short run, the concept of equity implies that over the long term, man-agement must promote equity for future generations, too. The lessonsdescribed in the OED report are instructive and very valuable to current analy-ses of investment approaches and trends, so we summarize them here.
1. ESW products produced between 1965 and 1986 generally did not providethe strategic framework for specifically identifying the main natural resource(including land) management issues in a country and the options for deal-ing with them. The result, therefore, was an opportunistic approach wherebythe selection and design of projects was influenced more by policy papers.
2. In all countries, resource management is governed by social and institu-tional arrangements that are as complex as they are sensitive. Often little isknown about the interactions between the socioeconomic and natural sys-tems. (These days, the Bank is very alert to safeguard issues—social andindigenous rights, environmental protection, development policy lending,and environmental impact assessments.)
THE BANK’S EVOLVING SLM PORTFOLIO 57
3. The indications are that environmental issues frequently were inadequatelyaddressed during project design. Such issues, therefore, often got little atten-tion in the supervision reports, project concept reviews, and project pre-appraisal reports. Also, the long-term environmental effects may not havebeen noticeable at the time the project (or the loan disbursement) was com-pleted. Environmental effects may emerge long after loan disbursement hasbeen completed.
4. The potential positive effects of Bank lending were compromised by a num-ber of factors:a. Policy recommendations were difficult in implement in practice.b. There was little guidance for selecting and designing projects.c. Recommendations were provided at a scale that was inadequate for
sustainable development.d. The guiding ESW did not provide a comprehensive overview of devel-
opments in the country, and the activities of other multilateral andbilateral agencies were not considered.
These lessons provide scope for improving the design and cross-sectoral syn-ergy in future investments for SLM and NRM. The following can serve as best-practice guidelines:
1. Incorporate newly available methods to assess synergies and tradeoffs viaenvironmental impact assessments and resource baselines in problem assess-ments and subsequent project design, implementation, and monitoring.
2. Use currently available geographic information systems (GIS) to assemblerelevant data layers (biophysical, economic, environmental, infrastructure,political, and social) at site, watershed, and landscape levels and couplethese geo-referenced data layers with robust modeling to assess the effects ofspatial and temporal factors.
3. Use the multisectoral GIS baseline described earlier to objectively assess the key SLM and NRM issues that need to be addressed in the short, medium,and long terms, and use this information to design and phase investments.Such an approach will reduce the likelihood of the flawed opportunisticinvestments identified by the OED evaluation in future SLM and NRM programs.
4. As highlighted in the previous sections, SLM interventions can have majorcross-sector (land, forest, water, and biodiversity) implications. It is essen-tial that project teams include members with competencies in these disci-plines when investments are being planned and designed.
5. There is significant scope for leveraging GEF grant funds and carbonsequestration funds to facilitate the integration of global environmental(public good) issues in SLM and NRM programs that target agriculture andforestry sectors.
58 SUSTAINABLE LAND MANAGEMENT
SLM: Strategic Options
59
C H A P T E R T H R E E
Sustainable land management is vital for enhancing and sustaining theproductivity of food and fiber systems globally. The world’s highly pro-ductive grain, livestock, and forestry products systems need to be sus-
tained and made more efficient in terms of reduced environmental impact.Where marginal lands have been occupied for agriculture and land degrada-tion has occurred, there is an urgent need to stop further degradation andreverse the slide.
Though the specifics will vary from country to country and region to region,there are four main components to a comprehensive strategy for enhancingland productivity while countering degradation. These include:
� Policy and sector work� Research and technology development� Knowledge sharing and extension� Providing incentives, expenditure priorities, and modes of financing
POLICY AND SECTOR WORK
Policy and sector work consists of aligning producer and consumer priceincentives, fiscal and financial subsidies, licensing fees and taxation, and thestructure of protection with a country’s environmental and social policy objec-tives for SLM.
C H A P T E R S I X
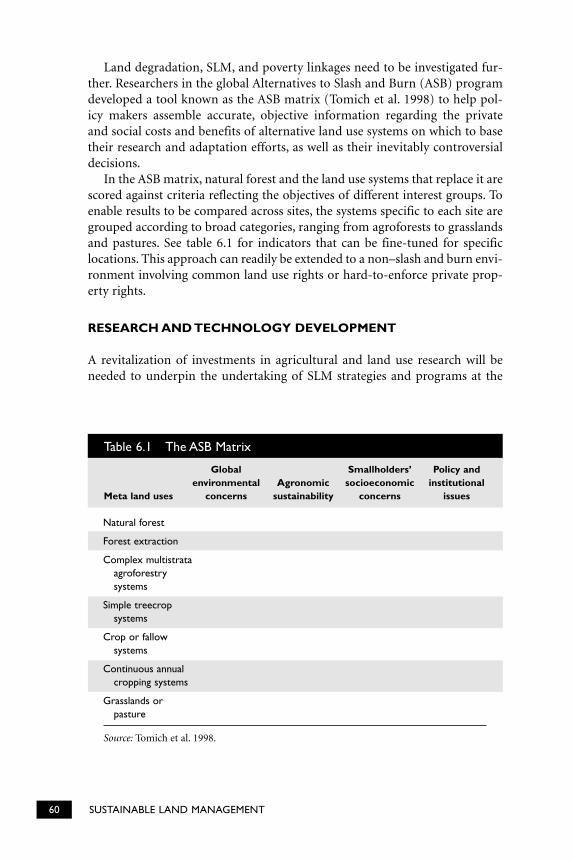
60 SUSTAINABLE LAND MANAGEMENT
Land degradation, SLM, and poverty linkages need to be investigated fur-ther. Researchers in the global Alternatives to Slash and Burn (ASB) programdeveloped a tool known as the ASB matrix (Tomich et al. 1998) to help pol-icy makers assemble accurate, objective information regarding the private and social costs and benefits of alternative land use systems on which to basetheir research and adaptation efforts, as well as their inevitably controversialdecisions.
In the ASB matrix, natural forest and the land use systems that replace it arescored against criteria reflecting the objectives of different interest groups. Toenable results to be compared across sites, the systems specific to each site aregrouped according to broad categories, ranging from agroforests to grasslandsand pastures. See table 6.1 for indicators that can be fine-tuned for specificlocations. This approach can readily be extended to a non–slash and burn envi-ronment involving common land use rights or hard-to-enforce private prop-erty rights.
RESEARCH AND TECHNOLOGY DEVELOPMENT
A revitalization of investments in agricultural and land use research will beneeded to underpin the undertaking of SLM strategies and programs at the
Table 6.1 The ASB Matrix
Global Smallholders’ Policy andenvironmental Agronomic socioeconomic institutional
Meta land uses concerns sustainability concerns issues
Natural forest
Forest extraction
Complex multistrata agroforestry systems
Simple treecrop systems
Crop or fallow systems
Continuous annual cropping systems
Grasslands or pasture
Source: Tomich et al. 1998.
SLM: STRATEGIC OPTIONS 61
country and agroecological zone levels. Emphasis must be given to the adapta-tion and improvement of technologies associated with agricultural intensifica-tion, the management and rehabilitation of forest cover in sensitive watersheds,and more effective water management (to avert salinization and mitigate flood-ing) on irrigated and bottom lands.
A large number of studies have demonstrated that investments in agricul-tural research can produce significant returns (for instance, Gabre-Madhinand Haggblade 2004). Despite this evidence, however, current trends are notencouraging. In the wake of the generally successful “Green Revolution” of the1970s and 1980s, support for institutes affiliated with the Consultative Groupon International Agricultural Research (CGIAR) has fallen off sharply, as havefiscal and financial resource transfers to most national agricultural researchsystems and institutes (Timmer 2005). For example, African countries nowspend only 0.5 percent of their agricultural GDP on research (Pardey and Bein-tema 2001).
Nonetheless, an important orientation for an adaptation agenda aimedtoward SLM will be to identify and create cropping, animal, forest manage-ment, and on-farm water use systems that will benefit producers where itcounts—in their pocketbooks—while serving the SLM objectives of, for exam-ple, land and soil conservation or the reversal of erosion, salinization, andother kinds of damage.
Several examples, at least partially successful, are available:
� Nutrient management and monitoring. In Sub-Saharan Africa, during thepast 10 years much attention has been focused on the quantification andestimation of nutrients that enter and leave agricultural systems. The bal-ance between these nutrient inputs and outputs shows whether the agricul-tural system is a net gainer or a net loser of soil fertility. An FAO-commis-sioned mega-scale study (Stoorvogel and Smaling 1990) showed nitrogen,phosphorus, and potassium balances for land use systems in several coun-tries, revealing that soil fertility in Africa is following a downward trend.9
� Densely populated and hilly countries in the Rift Valley area (Kenya,Ethiopia, Rwanda, and Malawi) have the most negative values because ofa high ratio of cultivated land to total arable land, relatively high cropyields, and soil erosion. The FAO-commissioned study triggered numer-ous case studies at plot, farm, and village levels of different degrees ofsophistication. Some studies focused on the measurement of some flows,others on the linkage between nutrient balance and farm household eco-nomic performance, and others on participatory learning and actiontoward improving soil fertility and its management. The results havebeen published (for example, Buresh et al. 1997; Smaling 1998; Smalinget al. 1997; Scoones 2001; Tian et al. 2001; Vanlauwe et al. 2002) and havebeen integrated into a toolkit (NUTMON 2006).
62 SUSTAINABLE LAND MANAGEMENT
� There have been few routine measurements of some potentially importantnutrient flows (leaching, gaseous losses, and erosion) in the tropics, andtheir values are estimated. Accumulation of error renders the procedurevulnerable, but at the same time insight into the functioning of farming systems and agroecological zones as to soil fertility dynamics has increasedsignificantly. Current knowledge gaps (apart from the difficult-to-measureflows) include the importance of crop-livestock integration and the kind oflivestock system involved, dust input in West Africa, the potential of aqua-culture as a source and a sink of nutrients, and the extent of periurban,nutrient exchange, that is, the classic win-win case of sanitation in townplus soil fertility around the town. The availability of high-precision,remote-sensing tools and GIS now allows a more precise disaggregation ofthe micro (plot), meso (region), and macro (country) scales, thereby greatlyenhancing the precision of predictions (Schlecht and Hiernaux 2004).10
� Conducting adaptive research on nutrients and seed. This research was the foun-dation underlying the “starter pack” program in Malawi (Blackie and Mann2005). Though the program ultimately failed, owing to the onset of a cripplingdrought and a hasty scaling-up by the government to serve essentially short-term political objectives, its design and the intended process of adaptation andfarmer use were quite sound and offer several useful pointers. With the par-ticipation of the International Center for Maize and Wheat Improvement(CIMMYT) from the very start, the starter pack program aimed both to adapt CIMMYT’s high-yielding hybrid maize varieties to Malawian growingconditions and to breed in the flinty texture favored by Malawi’s households.It further sought to provide levels of fertilizer application consonant with maximization of farmers’ net income rather than maximizing yields andprouction, which most of the country’s smallholders simply could not afford.A third objective was rural poverty alleviation, which was to be accomplishedby targeting the state’s delivery system (seeds, fertilizers, and advice) at small farmers. The expectation was that, following the introduction of thestarter packets more or less free of charge into Malawi’s maize-growing areas,farmers would be willing to pay for the packets in subsequent seasons once theyield enhancements and real income benefits had become apparent. Becausethe adaptation effort lacked (by and large) the in-country financial and staffcapabilities to conduct adaptive research, the involvement of CIMMYT wasessential to that effort in Malawi, as well as to the design of the government’soutreach and extension efforts. Thus, this effort shows the potential benefit ofharnessing support from CGIAR institutions for the adaptation of “land-friendly” farming technologies, in collaboration with in-country resources.
� Improving agricultural water management. In recent years, there have beenmajor advances in improving crop water productivity, irrigation efficiency,and management of evapotranspiration. The reader is referred to two impor-tant publications that detail these advances: Reengaging in Agricultural WaterManagement: Challenges and Options (World Bank 2006b) and Shaping the
SLM: STRATEGIC OPTIONS 63
Future of Water for Agriculture: A Sourcebook for Investment in AgriculturalWater Management (World Bank 2005).
� Public-private sector partnerships for farm inputs (nutrients and seed). Anexample of such a partnership is the Farm Input Promotions Africa (FIPS-Africa) which involves private sector collaboration with public sectorresearch and extension agencies in Kenya. The private sector partnersinclude agribusiness firms (Monsanto, Dow Chemical), national seed companies and suppliers, and Athi River Mining (ARM), which produces afertilizer called Mavuno, a fast-acting NPK fertilizer, enriched with micro-nutrients, sulfur, calcium, and magnesium, that is ideal for vegetables and cereals as well as for commercial crops like coffee, wheat, and tobacco.This fertilizer is made available, through local dealers, in small quantities(1–10 kg). In the Siaya and Busia districts of Western Kenya, total fertilizeruse by collaborating farmers rose from 0 to 500 tons during a five-yearperiod. Sales of 5- to 10-kg bags made up at least a quarter of all sales inmany outlets. Some 40% of fertilizer sales were to women, and most cus-tomers were 20 years old or over (Seward and Okello 1998). FIPS has nowmoved beyond seed and fertilizer into helping farmers evaluate otherimportant technologies—to reduce crop losses through treatment of crops instorage, and to improve weeding efficiency through herbicide application.
� Introducing stress-tolerant crops and trees. Plant breeders are making signifi-cant progress in developing new varieties that are better able to withstandboth biotic (pests) and abiotic (for example, drought) stresses. The availabil-ity of crop varieties able to adapt and be productive under climate change sce-narios will be especially important to minimize risk for poor rural farmers.
� Rehabilitating degraded lands. A priority is the rehabilitation of the produc-tive and service functions of approximately 20 million hectares of degradedpasturelands in Brazil and more than 200 million hectares of deforested and degraded former croplands that are currently occupied by Imperatacyclindrica–alang alang in Southeast Asia and spear grass in West Africa. Thehillsides of Central America and Southeast Asia, where soil erosion andnutrient mining has significantly reduced the productive capacity of the landand its resilience to storms, are also a priority. Agricultural and urban expan-sion into wetlands and coastal mangroves has severely compromised theflood protection provided by these lands. The devastating effect of the recenttsunamis along deforested coastlines in Asia and the flooding of NewOrleans by Hurricane Katrina are but two examples of the effects of thedegradation and loss of riparian and coastal forests, wetlands, and sedimentbanks, and their protective functions against wind and storm surges.
KNOWLEDGE SHARING AND EXTENSION
When promoting better land use practices, it will be important to build farmerinnovation into national extension programs and into agricultural and natural
64 SUSTAINABLE LAND MANAGEMENT
resource management initiatives. Experience shows that farmers do not waitpassively for extension advice, but actively experiment and innovate with agri-cultural and natural resource management practices. Their creativity may beone of the major underexploited resources in the Africa region (Reij andWaters-Bayer 2001; Mutunga and Critchley 2002).
A major advantage of innovations by farmers is that they are site-specificand often are readily acceptable to neighboring farmers. The incorporation ofthe farmer innovation approach within a systematic venue can significantlyimprove the performance of agroextension and technoadvisory services, par-ticularly in the field of soil and water conservation, where the visual impact ofdemonstrations can be a powerful way to attract potential end users of “bestpractices.” Although land users can financially contribute to costs, public fund-ing will be required in the poorer areas to prepare and facilitate such visits andprovide follow-up. Central to this will be the establishment of research part-nerships to help farmers conserve their land and water resources and meetother environmental and social objectives. Advising and assisting agricultural-ists in this area might be commercially unattractive for private companies,11
but it should be an important role for the public sector.Policy research is also needed to guide and support technological change. It
should cover such questions as intellectual property rights, biosafety, and foodsafety. The need to better explain technological developments to consumers,farmers, and others in society is also critically important, as demonstrated bythe public concern about and distrust of many improved crop varieties devel-oped via biotechnology-mediated advances in plant breeding, for example,genetically modified varieties. Early attention to biosafety (human health andenvironmental impact) issues by those developing the technologies and trans-parent access to accurate and reliable information for end users of the tech-nology is therefore important to facilitate the smooth introduction of newtechnologies.
Objective criteria are essential for analysis and management of the risks ofnew technology used for SLM and environmental protection. The opinions ofthe scientific community are frequently sought, but scientists are often absentfrom the public debate. In the future, it might help if researchers were encour-aged to become much more involved in the knowledge dissemination andextension-outreach activities.
When designing extension programs (privately operated or public sector)and the feedback systems that can capture farmer innovation, considerationshould be given to establishing regional centers where information on bestpractices or success stories can be accessed by farmers’ organizations and oth-ers. Such an approach is especially important in the larger countries and inthose with an agroecologically diverse natural resource endowment, where a“one-size-fits-all” approach does not work and innovative technologies need tobe adapted to local conditions.
SLM: STRATEGIC OPTIONS 65
GIS and other technologies are central to achieving a successful transitionfrom traditional environmental and resource management practices to sus-tainable development because of their integrative quality (linking social, eco-nomic, and environmental data) and place-based quality (addressing relation-ships among places at local, national, regional, and global levels).
For instance, there is a growing recognition by decision makers that prob-lems at the intersection of agriculture and environmental management,climate change, and land cover change, with their attendant social and eco-nomic consequences, will be at the forefront in the new century. Technologicaladvances fostering the integration of satellite imagery with other data (such associoeconomic or health data) in GIS are opening new ways to synthesize com-plex and diverse geographic data sets, creating new opportunities for collabo-ration among natural and social scientists and decision makers at all levels.
Nonetheless, investments are urgently needed to overcome the followingconstraints on the effective use of GIS for improved SLM:
� Technical limitations of accessibility to data, such as inadequate tele-communications infrastructure, limited bandwidth, and low Internet connectivity.
� Administrative challenges of accessibility to data, including the inability ofgovernment officials to satisfy requests for information because of lack offamiliarity with the subject matter, a shortage of efficient protocols forrequesting government data, a lack of common and data standards to pro-mote sharing, and a vexing array of unresolved issues of copyright and distribution.
� The inability to finance the collection and processing of needed data inmany countries, especially those facing severe hard currency constraints.
� Educational and organizational limitations on access to data and technol-ogy, including a poorly trained workforce and limited private sectordemand to spur the development of geographic information and tools.
The development of conserving technologies for land use, their adaptationto local environments, and the knowledge and diffusion elements of SLMstrategy are very important components. Indeed, the more vexing problemsassociated with remedial measures for land degradation and soil conservationinvolve the lack of financially viable technical options that might encourage theundertaking of less destructive farming and logging practices. These moredestructive practices are generally associated with unclear land use rights,12
with poorly specified rights to manage public lands (thereby resulting in theso-called problem of the commons), or simply with corruption and inadequateenforcement.
The relative importance of the previously mentioned constraints to sus-tainable land management will vary from country to country, legal tradition to
66 SUSTAINABLE LAND MANAGEMENT
legal tradition, and even among jurisdictions within countries with people of diverse ethnicities, or where the laws, regulations, and rules of contract governing land rights and transfers of usufruct are themselves in the midst oftransition and (re-)articulation (viz. China and the former Soviet Union).Thus, no simple menu of palliatives can be recommended to policy makerswhose goal is to strengthen a country’s SLM capabilities by addressing emptyboxes in local legal tradition, short of saying that something can and usuallyshould be done to rectify these shortcomings.
PROVIDING INCENTIVES, EXPENDITURE PRIORITIES,AND MODES OF FINANCING
In addition to incentives policies, normally operating at price and cost marginsto redirect the private sector’s utilization of resources in directions deemedsocially desirable, achieving SLM will require investments in physical infra-structure, land reclamation and stabilization, replenishment of soil nutrients,and the replanting of tree cover. Additionally, improved forest managementwill normally be required.
The costs of these investments can be considerable in countries wheresevere degradation has already taken place, often over decades and even cen-turies (table 5.2 provides examples of actual Bank investments in WSM pro-grams across the different regions). Thus, governments will need to (a) realis-tically assess the availability of resources, domestic and foreign; then (b)prioritize investments to rehabilitate the most egregiously damaged lands andsoils (as measured, primarily, by the opportunity costs of taking no action);(c) develop a realistic phasing of investments; (d) set forth financing plans; and(e) seek agreements with likely beneficiaries in the private sector and civil soci-ety, both to participate in program implementation and to share a portion ofthe costs in accord with agreed mechanisms. To stimulate the involvement ofprivate investors in land-friendly commercial activities would relieve pressureson the budget for adequate program finance while bringing to bear some of theflexibility and responsiveness needed to address the physical and financial con-tingencies associated with the above kinds of investments. The use of risk orguarantee funds or the provision of insurance, partially underwritten by gov-ernment, might prove sufficient in some countries to induce a strong private-sector response.
For example, the International Finance Corporation (IFC) has recently con-tributed to a Chilean private equity forest fund (the Lignum Fund) that pro-vides forest-backed securitization as an alternative captial market fundingsource for the forestry sector. At the same time, the fund will have an impor-tant environmental impact through sustainable forestry management practicesand the afforestation of dry, eroded land that currently has marginal alterna-tive agricultural use.
SLM: STRATEGIC OPTIONS 67
RECOMMENDED APPROACH AND THE ROLE OF THE WORLD BANK GROUP
The combination of regional and country experiences and examples from table 5.2 will likely weigh large in the selection of policies and instruments bygovernments that intend to place SLM high on their strategic agendas. In manycases, the shift from excessive resource consumption to a more ecologicallysustainable land management profile will impose short-term costs on produc-ers as well as consumers. In the Sub-Saharan uplands, the Andes highlands,and the piedmont and transmontane zones of South and East Asia, it is likelythat very few households can afford to absorb sudden and substantial increasesin the cost of living. An immediate implication is that economic growth willlikely continue to require increased use of natural resources, at least in theshort to medium term, leading to more resource degradation and misuse.However, this should not be considered a cause for inaction or despair. Thelead time for many kinds of SLM inventions to pay off can be quite long, whichmandates that remedial measures be initiated as quickly as possible, especiallyin the more seriously degraded watersheds and agroecological zones.
The Need for Phasing
Most countries—indeed, the world at large—probably could not sustain abroad-based attack on land and soil issues, even were the associated private costsof financing deemed politically acceptable. There will be a need for phasing,which underscores the related need to establish program and financing priorities.
Information Needs
While policy makers have devoted considerable attention to pollution issues andbiodiversity in the past two decades, with full support from the internationalcommunity, relatively less attention has been given to the technical and financialrequisites of SLM. For example, many of the country environmental assessmentsoffer only token proposals to reverse land degradation in damaged watersheds,and even fewer in support of soil conservation needs. In several countries, thereis a need to fill yawning gaps in the available information concerning land qual-ity and land use in the more fragile parts of the ecosystem. The systematic com-pletion (or updating) of country-level and regional “watershed inventories,”replete with technical data on land use and capabilities and on the severity ofdamage to lands and soils—including prospects for regeneration, as well as rel-evant socioeconomic data and indicators—would be a good place to begin.
Defining SLM Priorities
On the basis of more complete information and assessments of land use andland capability, policy makers, their advisors, and representatives of groupsusing land, water, or forest resources, as well as civil society, could debate
and hopefully establish agreed priorities for SLM. The next steps would be to(a) match the agreed priorities with a supporting array of incentives policiesand expenditure programs, (b) determine the respective roles of the privateand public sectors in both program execution and the provision of requisitetechnical and financial support for implementation, and (c) adopt a phasingplan. Should external advisory assistance be required, ample grant funds andlow-cost credits are available from bilateral and multilateral donors for techni-cal assistance and training. Indeed, governments are well advised to activelyseek this kind of assistance, because it comes replete with program advice andsometimes with an implied commitment to help finance start-up initiatives.
Role of the Bank and the Global Environment Facility (GEF)
The Bank Group (including GEF) can play an important role in jump startingSLM initiatives worldwide. It either has, or can quickly mobilize, both the often-needed advisory capabilities and implementation financing. Additionally, theBank Group is organized as a center for knowledge exchange, which can beespecially useful to governments intending to adopt more land-sustainingapproaches toward development.
Since its establishment in 1991, the GEF has been providing incrementalfunding to assist countries to prevent and control land degradation, primarilydesertification and deforestation, as it relates to its four focal areas (biodiver-sity conservation, climate change, international waters, and ozone layer deple-tion). To further improve the GEF’s assistance for land degradation preventionand control, the GEF Council recommended the designation of land degrada-tion as a focal area, as a means to enhance GEF support for the successfulimplementation of the United Nations Convention to Combat Desertification(UNCCD). This designation makes sustainable land management a primaryfocus of GEF assistance.
From 2003 to 2006, the GEF allocated a total of $500 million to support landdegradation prevention and control activities—$250 million under the sustain-able land management focal area and another $250 million for activities withinother focal areas—biodiversity conservation, climate change, internationalwaters, and persistent organic pollutants. In addition, GEF facilitating countrypartnership programs on sustainable land management aimed at assisting GEF-eligible countries to address land degradation issues in a comprehensiveand integrated manner based on priorities outlined in their National ActionPlans (NAPs) on Desertification and Poverty Reduction Strategy Papers (PRSPs).The partnership will comprise a package of interventions to address land degra-dation policy, regulatory and institutional reforms, capacity building, andinvestments financed, in a coordinated way, from a variety of sources, includingnational budgets, bilateral development cooperation agreements, country assis-tance programs of multilateral agencies, and private foundations.
The success of the Bank’s endeavor to generate country-managed environ-
68 SUSTAINABLE LAND MANAGEMENT
mental assessments as a requisite for CAS approval, and the Bank and fund’ssupport for poverty-reduction strategy programs (PRSPs), including the posi-tive outcomes of these exercises, suggests that a similar approach should be fol-lowed to promote borrowers’ commitment to SLM. Allowing that many of theBank’s clients are probably experiencing a degree of “assessment fatigue,” theeffort should perhaps be initially aimed at the regional level by selecting a sub-set of willing countries within each region to carry out land use and landdegradation assessments and then arrange to conduct these with assistancemobilized by the Bank or GEF. The expected outcome, of course, will be thearticulation of SLM action programs, including timetables and financingplans. The involvement of the regional development banks, the EuropeanUnion, bilateral donors, and even United Nations agencies at this early stagemight broaden the appeal of the approach.
Once initial country plans have been articulated and design and implemen-tation efforts have commenced, the demonstration effect will likely make itpossible to entice other countries to carry out SLM assessments. After all, thesepilots can likely demonstrate that international funds will be forthcomingshould a government’s effort appear adequate and properly focused.
The Bank’s regions differ markedly, and there is no “one-size-fits-all” ap-proach that will be likely to result in the successful introduction of SLM. Unlikethe PRSPs and the earlier environmental assessments, the specificity of land usepolicies in most countries strikes close to the heart of rural livelihoods and pow-erful business interests. For the regional vice presidencies that choose to moveforward quickly, pilot demonstration and technical assistance in willing coun-tries could be incorporated into ongoing CAS. But generally, a more measuredapproach might be required to induce serious response. This study thus recom-mends, as an initial step, that regional workshops be organized to highlight theneed, modalities, and practicality of SLM-type interventions and the long-term(and somewhat catastrophic) consequences for humans of failing to do so. Inparallel, the resources available to GEF, the Global Development Learning Net-work, and the World Bank Institute could be harnessed to spread the messageelectronically, while conferences and symposia could be organized to intensifythe debate over land-conserving priorities, as well as to link the findings ofongoing research with the SLM message(s) staff wish to convey. For example, topromote South-South learning on practical issues related to SLM and reducedenvironmental degradation, the WBI recently organized a GDLN event to shareChina’s experience on poverty reduction on fragile land with African countriesthat are facing similar land and environmental degradation problems.
In 2005, countries such as Bhutan, Cameroon, Kenya, Madagascar, Mozam-bique, and the Philippines have undertaken dedicated SLM investments withIDA and GEF resources. The goal of such investments is to improve local SLMbenefits and livelihoods and to harness the synergies with global environmentbenefits. These are promising developments and could prove catalytic for addi-tional and similar investments elsewhere.
SLM: STRATEGIC OPTIONS 69
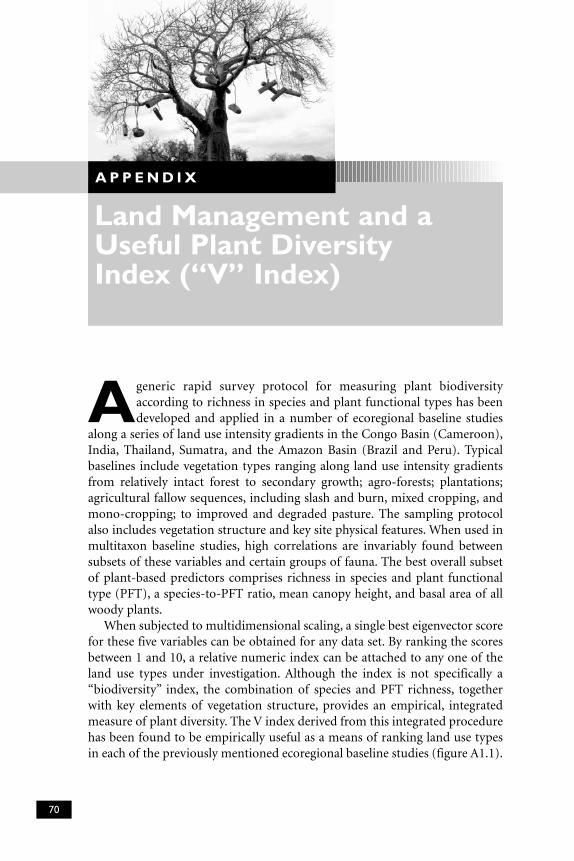
A P P E N D I X
Land Management and aUseful Plant DiversityIndex (“V” Index)
70
Ageneric rapid survey protocol for measuring plant biodiversityaccording to richness in species and plant functional types has beendeveloped and applied in a number of ecoregional baseline studies
along a series of land use intensity gradients in the Congo Basin (Cameroon),India, Thailand, Sumatra, and the Amazon Basin (Brazil and Peru). Typicalbaselines include vegetation types ranging along land use intensity gradientsfrom relatively intact forest to secondary growth; agro-forests; plantations;agricultural fallow sequences, including slash and burn, mixed cropping, andmono-cropping; to improved and degraded pasture. The sampling protocolalso includes vegetation structure and key site physical features. When used inmultitaxon baseline studies, high correlations are invariably found betweensubsets of these variables and certain groups of fauna. The best overall subsetof plant-based predictors comprises richness in species and plant functionaltype (PFT), a species-to-PFT ratio, mean canopy height, and basal area of allwoody plants.
When subjected to multidimensional scaling, a single best eigenvector scorefor these five variables can be obtained for any data set. By ranking the scoresbetween 1 and 10, a relative numeric index can be attached to any one of theland use types under investigation. Although the index is not specifically a“biodiversity” index, the combination of species and PFT richness, togetherwith key elements of vegetation structure, provides an empirical, integratedmeasure of plant diversity. The V index derived from this integrated procedurehas been found to be empirically useful as a means of ranking land use typesin each of the previously mentioned ecoregional baseline studies (figure A1.1).
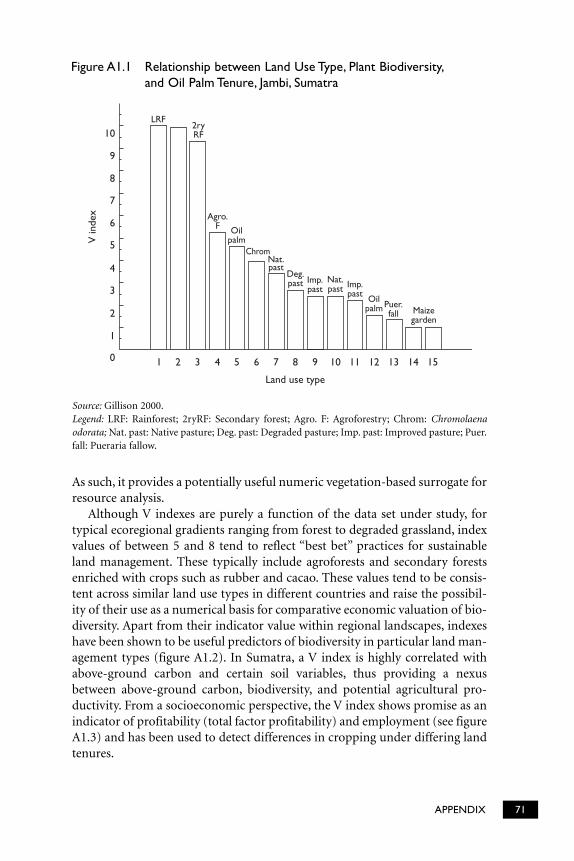
APPENDIX 71
Maizegarden
Puer.fall
Oilpalm
Imp.past
Nat.past
Imp.past
Deg.past
Nat.past
Chrom
Oilpalm
Agro.F
2ryRF
LRF
10
9
8
7
6
5
4
3
2
1
0
V in
dex
1 2 3 4 5 6 7 8 9 10 11 12 13 14 15
Land use type
Figure A1.1 Relationship between Land Use Type, Plant Biodiversity,and Oil Palm Tenure, Jambi, Sumatra
Source: Gillison 2000.Legend: LRF: Rainforest; 2ryRF: Secondary forest; Agro. F: Agroforestry; Chrom: Chromolaenaodorata; Nat. past: Native pasture; Deg. past: Degraded pasture; Imp. past: Improved pasture; Puer.fall: Pueraria fallow.
As such, it provides a potentially useful numeric vegetation-based surrogate forresource analysis.
Although V indexes are purely a function of the data set under study, fortypical ecoregional gradients ranging from forest to degraded grassland, indexvalues of between 5 and 8 tend to reflect “best bet” practices for sustainableland management. These typically include agroforests and secondary forestsenriched with crops such as rubber and cacao. These values tend to be consis-tent across similar land use types in different countries and raise the possibil-ity of their use as a numerical basis for comparative economic valuation of bio-diversity. Apart from their indicator value within regional landscapes, indexeshave been shown to be useful predictors of biodiversity in particular land man-agement types (figure A1.2). In Sumatra, a V index is highly correlated withabove-ground carbon and certain soil variables, thus providing a nexusbetween above-ground carbon, biodiversity, and potential agricultural pro-ductivity. From a socioeconomic perspective, the V index shows promise as anindicator of profitability (total factor profitability) and employment (see figureA1.3) and has been used to detect differences in cropping under differing landtenures.
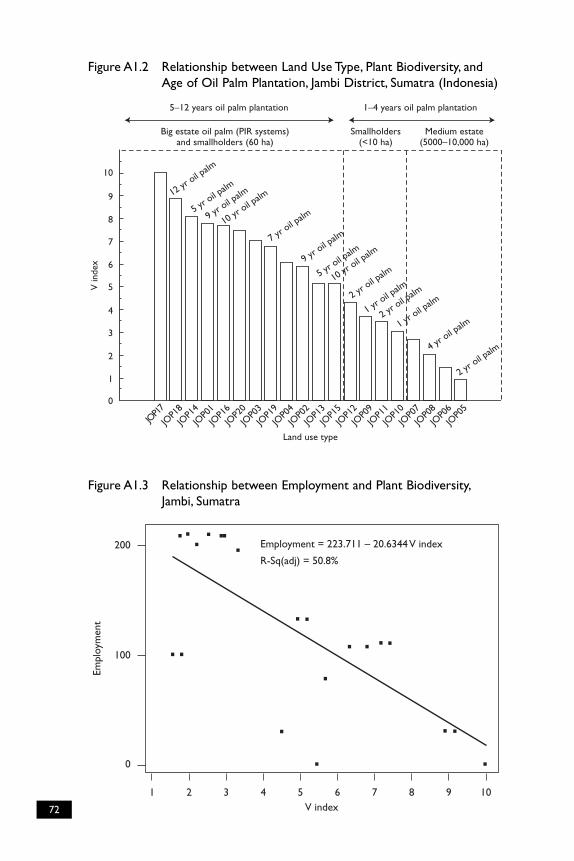
72
200
100
0
1 102 3 4 5 6 7 8 9V index
Empl
oym
ent
Employment = 223.711 – 20.6344 V index
R-Sq(adj) = 50.8%
10
9
8
7
6
5
4
3
2
1
0
V in
dex
JOP1
7
JOP1
8
JOP1
4
JOP0
1
JOP1
6
JOP2
0
JOP0
3
JOP1
9
JOP0
4
JOP0
2
JOP1
3
JOP1
5
JOP1
2
JOP0
9
JOP1
1
Land use type
JOP1
0
JOP0
7
JOP0
8
JOP0
6
JOP0
5
5–12 years oil palm plantation 1–4 years oil palm plantation
Big estate oil palm (PIR systems)and smallholders (60 ha)
Smallholders(<10 ha)
Medium estate(5000–10,000 ha)
12 yr
oil palm
10 yr
oil palm
9 yr o
il palm
5 yr o
il palm
9 yr o
il palm
5 yr o
il palm
10 yr
oil palm
7 yr o
il palm
1 yr o
il palm
4 yr o
il palm
2 yr o
il palm
2 yr o
il palm
1 yr o
il palm
2 yr o
il palm
Figure A1.2 Relationship between Land Use Type, Plant Biodiversity, andAge of Oil Palm Plantation, Jambi District, Sumatra (Indonesia)
Figure A1.3 Relationship between Employment and Plant Biodiversity,Jambi, Sumatra
1. Numerous definitions of sustainable agriculture and natural resource managementexist (Crosson and Anderson 1993; Smyth and Dumanski 1993; Hurni et al. 1996)that are equally applicable to land management. This report draws upon these in thedefinition provided earlier.
2. Overdesigned irrigation systems, inadequate drainages, secondary and rural roadswith insufficient culverts, and expansion of villages and village infrastructure muchtoo far into the uplands or into fragile agroecological zones (for example, the formerSoviet Union and China).
3. The FAO (2000) estimates for developing countries show that, over the past fourdecades, the amount of land under agriculture has increased to around 1 billionhectares, although the amount of cultivated cropland per capita has declined byalmost a half since 1960. The area under pasture increased by about 15 percent, to2.2 billion hectares, mostly via expansion into rainforests and savanna woodlands.The total irrigated land in developing countries has doubled since the 1960s, toaround 197 million hectares. Irrigated agriculture currently consumes roughly 70percent of the world’s fresh water used by humans.
4. Though it can also be argued that the damage has already been done in other regions,that it is both historical and irreversible.
5. Pagiola (1999) suggests, however, that the poverty–land degradation relationship isunlikely to be unambiguous and is not as simple as is often assumed. The authorsuggests that the assertions that the poor tend to conserve less and degrade more arelittle more than “plausible hypotheses” based on assumed characteristics of the poor,and that these same assumed characteristics could easily lead to a plausible hypoth-esis that the poor conserve more and degrade less.
6. The change in land management approaches to reduce the risk of climate changealso is referred to as “adaptation.” The definition of adaptation used here is that ofSmit et al. (1999, 2000) and of the IPCC (2001): adaptation refers to the “adjustment
73
N OT E S
in ecological, social, or economic systems in response to actual or expected climaticstimuli and their effects or impacts.” The term adaptation refers to changes in“processes, practices, or structures to moderate or offset potential damages or totake advantage of opportunities associated with changes in climate” (IPCC 2001).Adaptation involves adjustments to decrease the vulnerability of communities andregions to climate change and variability (IPCC 2001). As an interesting aside,Adger and Kelly (2001) view adaptation as a dynamic social process and believe thatthe ability of a society to act collectively determines its ability to adapt.
7. Country-level research is needed to identify investments and institutions, bothpublic and private, that can reduce costs and risks and provide incentives for theadoption of improved production, processing, and marketing technology through-out the food system (Kelly et al. 1999).
8. IBRD IDA grants and GEF grants.
9. Using a nutrient balance model, Stoorvogel and Smaling (1990) calculated that, onaverage, 660 kilograms of nitrogen per hectare, 75 kilograms of phosphorus perhectare, and 450 kilograms of potassium per hectare have been lost during the past30 years from about 200 million hectares of land in 37 African countries, primarilyin crop harvests. This amounts to annual losses of about 8 million tons of nitrogen,phosphorus, and potassium. Stoorvogel and Smaling (1990) concluded that no sys-tems can sustain such large net imbalances between nutrient acquisition and losses,so restoration of fertility, let alone enhancement of crop yield, requires substantialnutrient inputs in the form of organic materials or commercial fertilizers.
10. However, their fundamental conclusion remains unchanged: that soil fertility inSub-Saharan Africa continues to decline.
11. Unless organized under the umbrella of longer-term service agreements, perhapswith some subsidization and with assurance by private service providers that con-tracts will be honored and enforced and that payments will be received more or lessroutinely. Armenia’s animal breeding and animal health services provide goodexamples of how private sector services can be mobilized successfully, partlyfinanced by the public sector.
12. Whether ensconced in the exercise of private freehold or conveyed by indirecttenure (i.e., leasing, share rental, and the like) or by concessions, licensing, andother kinds of permissions granted to identified users by public authority.
74 NOTES
Adger, W. N., and P. M. Kelly. 2001. “Social vulnerability and resilience.” In Living withEnvironmental Change: Social Vulnerability, Adaptation and Resilience in Vietnam,ed. W. N. Adger, P. M. Kelly, and Nhuyen Huu Ninh, 19–34. London: Routledge.
Anderson, J. R., and J. Thampapillai. 1990. Soil Conservation in Developing Countries:Project and Policy Intervention. Policy and Research Series 8. Washington, DC: WorldBank.
Angelsen, A., and D. Kaimowitz. 2001. “When Does Technological Change in Agricul-ture Promote Deforestation?” In Tradeoffs or Synergies: Agricultural Intensification,Economic Development and the Environment, ed. D. R. Lee and C. B. Barrett, 89–114.Wallingford, UK: CABI.
Ashby, J. 1985. “Women and Agricultural Technology in Latin America and the Car-ribbean.” Background document prepared for a seminar of the Center on Womenand Agricultural Technology, Bellagio, Italy, March 25–29. Inter-American Develop-ment Bank (IADB).
Aylward, B., J. Echeverría, A. F. González, I. Porras, K. Allen, and R. Mejías. 1998. Eco-nomic Incentives for Watershed Protection: A Case Study of Lake Arenal, Costa Rica.Final Report. London: International Institute for Environment and Development,Tropical Science Center, San José, Costa Rica; International Center in Economic Pol-icy, National University, Heredia, Costa Rica. February.
Baland, J. M., and J. P. Platteau. 1996. Halting Degradation of Natural Resources: Is Therea Role for Rural Communities? Oxford: Oxford University Press.
Bekele, S., and S. T. Holden. 1999. “Soil Erosion and Smallholders’ Conservation Deci-sions in the Highlands of Ethiopia.” World Development 27 (4): 739–52.
Benin, S. 2005. “Policies and Programs Affecting Land Management Practices, InputUse and Productivity in the Highlands of Amhara Region, Ethiopia. In Strategies forSustainable Land Management in the East African Highlands, ed. J. Pender, F. Place,and S. Ehui. Washington, DC: International Food Policy Research Institute.
75
B I B L I O G R A P H Y
Binswanger, H., Y. Mundlak, M. C. Yang, and A. Bowers. 1987. “On the Determinants ofCross-Country Aggregate Agricultural Supply.” Journal of Econometrics 36: 111–31.
Blackie, M., and C. Mann. 2005.“The Origin and Concept of the Starter Pack.” In StarterPacks: A Strategy to Fight Hunger in Developing Countries, ed. S. Levy. Wallingford,UK: CABI.
Blaikie, P., and H. Brookfield, eds. 1987. Land Degradation and Society. London and NewYork: Methuen.
Bojo, J. 1996. “The Costs of Land Degradation in Sub-Saharan Africa.” Ecological Eco-nomics 16: 161–73.
Bruce, J. W., and R. Mearns. 2004. Natural Resource Management and Land Policy inDeveloping Countries: Lessons Learned and New Challenges for the World Bank. Wash-ington, DC: World Bank.
Buresh, R. J., P. A. Sanchez, and F. Calhoun, eds. 1997. Replenishing Soil Fertility inAfrica. Madison, WI: Soil Science Society of America Special Publication No. 51.
Burton, I., and M. van Aalst. 2004. Look before You Leap: A Risk Management Approachfor Incorporating Climate Change Adaptation in World Bank Operations. Washington,DC: World Bank.
Calder, I. R. 1998. Water-Resource and Land-Use Issues. Systemwide Initiative on WaterManagement (SWIM). Paper No. 3. Colombo: International Water ManagementInstitute.
———. 2005. The Blue Revolution: Land Use and Integrated Water Resource Manage-ment. Second Edition. London: Earthscan.
Carret, J.C., and D. Loyer. 2003. “Madagascar Protected Area Network SustainableFinancing: Economic Analysis Perspective.” Paper contributed to the World Park’sCongress, Durban, South Africa, September.
Chomitz, K. M., E. Brenes, and L. Constantino. 1998. “Financing Environmental Ser-vices: The Costa Rican Experience and Its Implications.” Paper prepared for Devel-opment Research Group (DRG) and Environmentally and Socially SustainableDevelopment—Latin America and Caribbean (ESSD-LCR). World Bank, Washing-ton, DC.
Cromwell, E., P. Kambewa, R. Mwanza, and R. Chirwa. 2001. “Impact Assessment UsingParticipatory Approaches: ‘Starter Pack’ and Sustainable Agriculture in Malawi.” Net-work Paper No. 112. London: Overseas Development Institute (ODI) / AgriculturalResearch and Extension Network (AGREN).
Crosson, P., and J. R. Anderson. 1993. “Concerns for Sustainability: Integration of Nat-ural Resource and Environmental Issues for the Research Agendas of NARSs.”Research Report No. 4. The Hague: International Service for National AgriculturalResearch (ISNAR).
Deininger, K., and B. Minten. 1996. “Poverty, Policies, and Deforestation: The Case ofMexico. Research Project on Social and Environmental Consequences of Growth-Oriented Policies.” Working Paper No. 5. World Bank Policy Research Department,Washington, DC.
Desanker, P. V., P. G. H. Frost, C. O. Frost, C.O. Justice, and R. J. Scholes, eds. 1997. TheMiombo Network: Framework for a Terrestrial Transect Study of Land-Use and Land-Cover Change in the Miombo Ecosystems of Central Africa. IGBP Report 41. Stock-holm: International Geosphere-Biosphere Programme (IGBP). 109 p.
Dewees, P. A. 1996. “The Miombo Woodlands of Southern Africa: Emerging Prioritiesand Common Themes for Dryland Forest management.” Commonwealth ForestryReview 75 (2): 130–35.
76 BIBLIOGRAPHY
Dixon, J., A. Gulliver, and D. Gibbon. 2001. Farming Systems and Poverty: ImprovingFarmers’ Livelihoods in a Changing World. Rome and Washington, DC: FAO and theWorld Bank.
Dobie, P. 2001. Poverty and Drylands. Nairobi, Kenya. The Global Dry Lands Partnership.
Dorward, A., J. Kydd, J. Morrison, and I. Urey. 2004. “A Policy Agenda for Pro-PoorAgricultural Growth.” World Development 32 (1): 73–89.
Enters, T. E. 1998. Methods for the Economic Assessment of the On- and Off-Site Impactsof Soil Erosion. Issues in Sustainable Land Management No. 2. Bangkok: Interna-tional Board for Soil Research and Management.
Evenson, R. E., and D. Gollin. 2003.“Assessing the Impact of the Green Revolution, 1960to 2000.” Science, 2 May: 758–62.
Falkenmark, M., W. Klohn, J. Lundqvist, S. Postel, J. Rockström, D. Seckler, H. Shuval,and J. Wallace. 1998. “Water Scarcity as a Key Factor behind Global Food Insecurity:Round Table Discussion.” Ambio 27 (2).
Fan, S., and P. Hazell. 1997. “Should India Invest More in Less-Favored Areas?”EPTD Discussion Paper No. 25. International Food Policy Research Institute, Wash-ington, DC.
FAO (Food and Agriculture Organization). 1995. TAC Study on Priorities and Strategiesfor Soil and Water Aspects of Natural Resource Management Research in the CGIAR.Rome: FAO.
———. 1999. Expert Consultation on Soil and Nutrient Management in SSA, in Supportof the Soil Fertility Initiative (SFI): Summary Report, Conclusions, and Recommenda-tions. Rome: FAO.
———. 2000. Crops and Drops: Making the Best Use of Land and Water. Rome: FAO.
———. 2003. World Agriculture: Towards 2015/2030, an FAO Perspective. London: FAO/Earthscan.
———. 2005. Agro-Ecological Zoning and GIS Applications in Asia, with Special Empha-sis on Land Degradation Assessment in Drylands (LADA): Proceedings of a RegionalWorkshop. Bangkok, Thailand, November 10–14, 2003. Rome: FAO. 125 p.
FAOSTAT. 2004. http://faostat.fao.org/default.jsp. Accessed November.
Feder, G., R. Murgai, and J. B. Quizon. 2003. “Sending Farmers Back to School: The Im-pact of Farmer Field Schools in Indonesia.” Review of Agricultural Economics 26: 45–62.
Fernandes, E. C. M., P. P. Motavalli, C. Castilla, and L. Mukurumbira. 1997. “Manage-ment Control of Soil Organic Matter Dynamics in Tropical Land Use Systems.” Geo-derma 79: 49–67.
Fernandes, E. C. M., E. Wandelli, R. Perin, and S. A. Garcia. 2006. “Restoring Productiv-ity to Degraded Pasture Lands in the Amazon through Agroforestry Practices.” InBiological Approaches to Sustainable Soil Systems, ed. N. Uphoff, A. Ball, E. Fernan-des, H. Herren, O. Husson, M. Laing, C. Palm, J. Pretty, P. Sanchez, N. Sanginga, andJ. Thies, 305–18. New York: CRC Press.
FRP (Forestry Research Programme). 2005. “From the Mountain to the Tap: How LandUse and Water Management Can Work for the Rural Poor.” Report of a dissemina-tion project funded by the United Kingdom Department for International Develop-ment (DFID) for the benefit of developing countries. Forestry Research Programme,NR International Ltd. Hayle, UK: Rowe The Printers.
Gabre-Madhin, E., and S. Haggblade. 2001. Successes in African Agriculture: Results of anExpert Survey. Washington, DC: International Food Policy Research Institute.
———. 2004. “Successes in African Agriculture: Results of an Expert Survey.” WorldDevelopment 32 (5): 745–66.
BIBLIOGRAPHY 77
Geist, H. J., and E. F. Lambin. 2002. “Proximate Causes and Underlying Driving Forcesof Tropical Deforestation.” BioScience 52 (2): 143–50.
Gewin, V. 2002. “The State of the Planet.” Nature 417: 112–13.
Gillison, A. N. 2000. “Rapid Vegetation Survey.” In Above-Ground Biodiversity Assess-ment Working Group Summary Report 1996–99: Impact of Different Land Uses onBiodiversity, ed. A. N. Gillison, 25–38. Nairobi: Alternatives to Slash and Burn Pro-ject, International Center for Research in Agroforestry (ICRAF).
———. 2002. Bioregional Assessment, Land Use and Zoning for Biodiversity Conser-vation in NW Mato Grosso: Baseline Survey for the Municipalities of Castanheira,Cotriguaçu and Juruena. Report prepared for the United Nations Development Program / Global Environment Facility and PróNatura.
Gisladottir, G., and M. Stocking. 2005. “Land Degradation Control and Its Global Envi-ronmental Benefits.” Land Degradation and Development 16: 99–112.
Grey, D., and C. Sadoff. 2002. “Water Resources and Poverty in Africa: Essential Eco-nomic and Political Responses.” Paper presented at the African Ministerial Confer-ence on Water, Abuja, Nigeria.
Herweg, K. 1993. “Problems of Acceptance and Adoption of Soil Conservation inEthiopia.” Tropics Applied Resource Management 3: 391–411.
Hope, R. A. 2005. “Water, Workfare and Poverty: The Impact of the Working for WaterProgramme on Rural Poverty Reduction.” Environment, Development and Sustain-ability. FRP R7937.
Hurni, H. 1993. “Land Degradation, Famines, and Resources Scenarios in Ethiopia.” InWorld Soil Erosion and Conservation, ed. D. Pimentel. Cambridge: Cambridge Uni-versity Press.
Hurni, H., with the assistance of an international group of contributors. 1996. PreciousEarth: From Soil and Water Conservation to Sustainable Land Management. Bern:International Soil Conservation Organisation (ISCO) and Centre for Developmentand Environment (CDE).
Ingram, J. S. I., and E. C. M. Fernandes. 2001. “Managing Carbon Sequestration in Soils:A Note on Concepts and Terminology.” Agriculture Ecosystems & the Environment87: 111–17.
IPCC (Intergovernmental Panel on Climate Change). 2001. Climate Change 2001: TheScientific Basis. Intergovernmental Panel on Climate Change. Cambridge: CambridgeUniversity Press.
Keenan, R. J., M. Parsons, E. O’Loughlin, A. Gerrand, S. Beavis, D. Gunawardana,M. Gavran, and A. Bugg. 2004. “Plantations and Water Use: A Review.” Forest andWood Products Research and Development Corporation. Canberra, Australia:Bureau of Rural Sciences.
Kelly, V., A. Adesina, and A. Gordon. 2003. “Expanding Access to Agricultural Inputs inAfrica: A Review of Recent Market Development Experience.” Food Policy 28: 379–404.
Kelly, V. A., E. W. Crawford, J. A. Howard, T. Jayne, J. Staatz, and M. T. Weber. 1999.“Towards a Strategy for Improving Agricultural Input Markets in Africa.” Policy Syn-thesis. Food Security II Cooperative Agreement, Michigan State University, Depart-ment of Agricultural Economics.
Meinzen-Dick, R. S., L. R. Brown, H. S. Feldstein, and A. R. Quisumbing. 1997. “Gen-der, Property Rights, and Natural Resources.” World Development 25 (8): 1303–15.
Millennium Development Goals. http://www.developmentgoals.org. Accessed January12.
78 BIBLIOGRAPHY
MEA (Millennium Ecosystem Assessment). 2005a. Ecosystems and Human Well-being:Synthesis. Washington, DC: Island Press.
———. 2005b. Ecosystems and Human Well-being: Desertification Synthesis. Washing-ton, DC: World Resources Institute.
Miranda, M., I. T. Porras, and M. Luz Moreno. 2003. The Social Impacts of Payments forEnvironmental Services in Costa Rica: A Quantitative Field Survey and Analysis of theVirilla Watershed. London: International Institute for Environment and Develop-ment.
Mittermeier, R. A., N. Myers, P. R. Gil, and C. Mittermeier. 1999. Hotspots: Earth’s Bio-logically Richest and Most Endangered Terrestrial Ecoregions. Mexico City: Conserva-tion International.
Mutunga, K., and W. Critchley. 2002. Farmer’s Initiatives in Land Husbandry. Nairobi:Sida’s Regional Land Management Unit, International Center for Research in Agro-forestry (ICRAF).
Muller, D., and M. Zeller. 2002. “Land Use Dynamics in the Central Highlands of Viet-nam: A Spatial Model Combining Village Survey Data with Satellite Imagery Inter-pretation.” Agricultural Economics 27 (3): 333–54.
Newcombe, K. 2003. “Extending the Carbon Market to the World’s Poor.” Paper pre-sented at the ABCDE Conference, Europe. Report No. 28732. World Bank, Wash-ington, DC.
Nimlos, T. J., and R. F. Savage. 1991. “Successful Soil Conservation in the EcuadorianHighlands.” Journal of Soil and Water Conservation 46: 341–43.
NUTMON (Nutrient Monitoring for Tropical Farming Systems). 2006. Toolbox avail-able for download. http://www.nutmon.org. Accessed April.
OECD (Organisation for Economic Co-operation and Development). 1993. “Environ-mental Indicators: Basic Concepts and Terminology.” Background paper No. 1. OECD,Paris, 150 p.
Otsuka, K., and A. Quisumbing. 1998. “Gender and Forest Resource Management: ASynthesis of Case Studies in Ghana and Sumatra.” In Gender and Forest ResourceManagement: A Comparative Study in Selected Areas of Asia and Africa. Washington,DC: International Food Policy Research Institute. Mimeo.
Pagiola, S. 1995. “Environmental and Natural Resource Degradation in Intensive Agri-culture in Bangladesh.” Paper No. 15, Environmental Economics Series. World Bank,Washington, DC. June.
———. 1996. “Price Policy and Returns to Soil Conservation in Semi-arid Kenya.”Environmental and Resource Economics 8: 255–71.
———. 1999. “The Global Environmental Benefits of Land Degradation Control onAgricultural Land.” Environment Paper 16. Global Overlays Program, World Bank,Washington, DC.
Pagiola, S., J. Bishop, and N. Landell-Mills. 2002. Selling Forest Environmental Services:Market-Based Mechanisms for Conservation and Development. London: Earthscan.
Pagiola, S., K. von Ritter, and J. Bishop J. 2004. “Assessing the Economic Value of Eco-system Conservation.” Environment Department Paper No. 101. World Bank Envi-ronment Department (Washington, DC) in collaboration with the Nature Conser-vancy and International Union for Conservation of Nature and Natural Resources(IUCN).
Pardey, P., and N. Beintema. 2001. Slow Magic: Agricultural R&D a Century after Mendel.Food Policy Report. Washington, DC: International Food Policy Research Institute.
BIBLIOGRAPHY 79
Pearce, D. W., and J. J. Watford. 1993. World without End. New York: Oxford UniversityPress.
Pender, J. 2004. “Development Pathways for Hillsides and Highlands: Some Lessonsfrom Central America and East Africa.” Food Policy 29: 339–67.
Pender, J., and B. Gebremedhin. 2004. “Impacts of Policies and Technologies in DrylandAgriculture: Evidence from Northern Ethiopia.” In Challenges and Strategies for Dry-land Agriculture, ed. S.C. Rao. Special Publication 32. Madison, WI: American Soci-ety of Agronomy and Crop Science Society of America.
Pichon, F. J. 1997. “Colonist Land-Allocation Decisions, Land Use, and Deforestation inthe Ecuadorean Amazon Frontier.” Economic Development and Cultural Change 44:707–44.
Pieri, C., G. Evers, J. Landers, P. O’Connell, and E. Terry. 2002.“No-Till Farming for Sus-tainable Rural Development.” ARD Working Paper. World Bank, Washington, DC.
Piha, M. I. 1993. “Optimizing Fertilizer Use and Practical Rainfall Capture in a Semi-arid Environment with Variable Rainfall.” Experimental Agriculture 29: 405–15.
Reardon, T., and S. A. Vosti. 1992. “Issues in the Analysis of the Effects of Policy on Con-servation and Productivity at the Household Level in Developing Countries.” Quar-terly Journal of International Agriculture 31 (4): 380–96.
———. 1995. “Links between Rural Poverty and the Environment in DevelopingCountries: Asset Categories and Investment Poverty.” World Development 23 (9):1495–1506.
Reij, C., and D. Steeds. 2003. Success Stories in Africa’s Drylands: Supporting Advocatesand Answering Skeptics. Rome: Global Mechanism of the United Nations Conven-tion to Combat Desertification.
Reij, C., and A. Waters-Bayer. 2001. Farmer Innovation in Africa: A Source of Inspirationfor Agricultural Development. London: Earthscan. 362 p.
Reij, C., I. Scoones, and C. Toulmin. 1996. Indigenous Soil Conservation. London: Earth-scan.
Sanchez, P. A., K. D. Shephered, M. J. Soule, F. M. Place, A. U. Mukwenye, R. J. Buresh,F. R. Kwesiga, A. Izac, C. G. Ndiritu, and P. L. Woomer. 1997. “Soil Fertility Replen-ishment in Africa: An Investment in Natural Resource Capital.” In R. J. Buresh et al., eds., Replenishing Soil Fertility in Africa, 1–46. Special Publication No. 51.Madison, WI: Soil Science Society of America (SSSA).
Scherr, S. J., and P. A. Hazell. 1994. “Sustainable Agricultural Development Strategies inFragile Lands.” Environment and Production Technology Division (EPTD) Discus-sion Paper 1. International Food Policy Research Institute, Washington, DC.
Schlager, E., and E. Ostrom. 1992. “Property-Rights Regimes and Natural Resources: AConceptual Analysis.” Land Economics 68: 249–62.
Schlecht, E., and P. Hiernaux. 2004. “Beyond Adding Up Inputs and Outputs: ProcessAssessment and Upscaling in Modelling Nutrient Flows.” Nutrient Cycling in Agro-ecosystems 70: 303–19.
Scholes, B. 1996. “Miombo Woodlands and Global Change.” In The Miombo in Transi-tion: Woodlands and Welfare in Africa, ed. B. Campbell, 13. Bogor: Center for Inter-national Forestry Research.
Scholes, R. J., and R. Biggs. 2004. Ecosystem Services in Southern Africa: A Regional Per-spective. Pretoria: Council for Scientific and Industrial Research (CSIR).
Scoones, I. 1998. “Sustainable Rural Livelihoods: A Framework for Analysis.” WorkingPaper No. 72. Institute for Development Studies, Brighton, England.
80 BIBLIOGRAPHY
———. 2001. Dynamics and Diversity: Soil Fertility and Farming Livelihoods in Africa.London: Earthscan.
Scoones, I., and C. Toulmin. 1999. “Policies for Soil Fertility Management in Africa.”Report prepared for the Department for International Development, London, by theInstitute for Development Studies (IDS) and the International Institute for Envi-ronment and Development (IIED).
Seitz, W. D., R. C. Taylor, R. G. F. Spitze, C. Osteen, and M. C. Nelson. 1979. “EconomicImpacts of Soil Erosion Control.” Land Economics 55 (1): 28–42.
Seward, P., and D. Okello. 1998. “Methods to Develop an Infrastructure for the Supplyof the Appropriate Fertilizers for Use by Small Farmers in Sub-Saharan Africa: Expe-rience from Western Kenya.” Paper presented at the IFA Regional Conference,Maputo, Mozambique, June 8–12 (mimeo).
Shively, G., and S. N. Pagiola. 2004. “Agricultural Intensification, Local Labor Markets,and Deforestation in the Philippines.” Environment and Development Economics 9:241–66.
SIWI (Stockholm International Water Institute), IFPRI (International Food PolicyResearch Institute), IUCN (International Union for Conservation of Nature andNatural Resources), and IWMI (International Water Management Institute). 2005.“Let It Reign: The New Water Paradigm for Global Food Security.” Final Report toCSD-13. Stockholm International Water Institute, Stockholm.
Smaling, E. M. A., ed. 1998. “Nutrient Balances as Indicators of Productivity and Sus-tainability in Sub-Saharan African Agriculture.” Agriculture, Ecosystems & Environ-ment 71.
Smaling E. M. A., S. M. Nandwa, and B. H. Janssen. 1997. “Soil Fertility in Africa Is atStake.” In Replenishing Soil Fertility in Africa. R. J. Buresh et al., ed. Special Publica-tion 51. Madison, WI: Soil Science Society of America (SSSA).
Smit, B., I. Burton, R. Klein, and T. Street. 1999. “The Science of Adaptation: A Frame-work for Assessment.” Mitigation and Adaptation Strategies for Global Change 4:199–213.
Smit, B., I. Burton, R. Klein, and J. Wandel. 2000. “The Anatomy of Adaptation to Cli-mate Change and Variability.” Climatic Change 45: 223–51.
Smyth, A. J., and J. Dumanski. 1993. “FESLM: An International Framework for Evalu-ating Sustainable Land Management: A Discussion Paper.” World Soil ResourcesReport 73. Food and Agriculture Organization, Rome. 74 p.
Stoorvogel, J. J., and E. M. A. Smaling. 1990. “Assessment of Soil Nutrient Depletion inSub-Sahara Africa: 1983–2000.” Report 28. Winand Staring Centre for IntegratedLand, Soil and Water Research, Wageningen, The Netherlands.
Templeton, S., and S. J. Scherr. 1997. “Population Pressure and the Microeconomy of Land Management in Hills and Mountains of Developing Countries.” EPTD Discussion Paper No. 26. International Food Policy Research Institute, Washington,DC.
Thrupp, L. A. 1993. Green Guidance for Latin America and the Caribbean. Washington,DC: Bureau for Latin America and the Caribbean, United States Agency for Inter-national Development: Center for International Development and Environment,World Resources Institute.
———. 1998. Cultivating Diversity: Agrobiodiversity and Food Security. Washington,DC: World Resources Institute.
Thurston, D. H. 1997. Slash/Mulch Systems: Sustainable Methods for Tropical Agriculture.Boulder, Colorado: Westview Press.
BIBLIOGRAPHY 81
Tian, H. D., T. Kumamaru, Y. Takemoto, M. Ogawa, and H. Satoh. 2001. “Gene Analysisof New 57H Mutant Gene, glup6, in Rice.” RGN 18: 48–50.
Tiffen, M., and M. Mortimore. 1992. “Environment, Population Growth and Produc-tivity in Kenya: A Case Study of Machakos District.” Development Policy Review 10:359–87
Tiffen, M., M. Mortimore, and F. Gichuki. 1994. More People, Less Erosion: Environmen-tal Recovery in Kenya. Chichester, England: John Wiley and Sons.
Timmer, C. P. 2005. “Agriculture and Pro-Poor Growth: An Asian Perspective.” Unpub-lished manuscript, Center for Global Development, Washington DC.
Tomich, T. P., M. van Noordwijk, S. A. Vosti, and J. Witcover. 1998. “Agricultural Devel-opment with Rainforest Conservation: Methods for Seeking Best Bet Alternatives toSlash-and-Burn, with Applications to Brazil and Indonesia.” Agricultural Economics19: 159–74. Reprinted in Hill, H., ed., The Economic Development of Southeast Asia.Cheltenham, UK: Edward Elgar Publishing.
UNEP (United Nations Environment Programme). 2006. “Desertification.” GlobalResource Information Database. Washington, DC: UNEP–North America, Divisionof Early Warning and Assessment. http://www.na.unep.net/des/uncedexsum.php3.Accessed April.
Uphoff, N., A. Ball, E. Fernandes, H. Herren, O. Husson, M. Laing, C. Palm, J. Pretty,P. Sanchez, N. Sanginga, and J. Thies, eds. 2006. Biological Approaches to SustainableSoil Systems. New York: CRC Press.
Vanlauwe, B., J. Diels, K. Aihou, E. N. O. Iwuafor, O. Lyasse, N. Sanginga, and R.Merckx. 2002. “Direct Interactions between N Fertilizer and Organic Matter: Evi-dence from Trials with 15N-Labelled Fertilizer.” In Integrated Plant Nutrient Man-agement in Sub-Saharan Africa: From Concept to Practice, ed. B. Vanlauwe et al.Oxon, England: CAB International Wallingford.
Vosti, S., and T. Reardon. 1997. “Introduction: The Critical Triangle of Links amongSustainability, Growth and Poverty Alleviation.” In Sustainability, Growth and PovertyAlleviation: A Policy and Agroecological Perspective, ed. S. Vosti and T. Reardon, 1–18.Baltimore: Johns Hopkins University Press.
Wood, S. 2005. “Cultivated Systems, Ch. 26.” In Millennium Ecosystem Assessment: Eco-systems and Human Well-being. Washington, DC: World Resources Institute.
World Bank. 1988. “Renewable Resource Management in Agriculture.” Report No. 735.Operations Evaluation Department. World Bank, Washington, DC.
———. 1994. “World Development Report 1994.” World Bank, Washington, DC.
———. 1997. Soil Fertility Initiative. Washington, DC: World Bank.
———. 2003. Reaching the Rural Poor: A Renewed Strategy for Rural Development.Washington, DC: World Bank.
———. 2004. Agriculture Investment Sourcebook. Washington, DC: World Bank.
———. 2005. Shaping the Future of Water for Agriculture: A Sourcebook for Investmentin Agricultural Water Management. Washington, DC: World Bank.
———. 2006a. Carbon Finance Unit Web site. http://www.carbonfinance.org. AccessedApril.
———. 2006b. Reengaging in Agricultural Water Management: Challenges and Options.Washington, DC: World Bank.
WWF (World Wildlife Federation). 2001. “Integrated Conservation and DevelopmentProjects: DGIS-WWF Tropical Forest Portfolio.” Workshop Report. WWF Interna-tional, Gland, Switzerland.
82 BIBLIOGRAPHY
AAfrica
agricultural growth in, 10, 14, 16b,19
baseline studies in, 70climate change in, 24, 25–27, 26bfarmer innovation in, 64food production in, 14, 23lack of research in, xviii, 61land degradation in, 5, 14, 16b, 19nutrient monitoring in, 61, 62nutrient recapitalization in, 37sustainable land management in,
32–33, 35, 55t, 56, 56f, 63, 67water management in, 22, 23
African Integrated Land and WaterManagement Initiative (ALWI),33
Agriculture. See also Land useclimate change and, 25–27, 26bpastoral, 27rain-fed, 22–24, 25–27, 25b, 26b, 35,
44
Alternatives to Slash and Burn (ASB)matrix, 60, 60t
Asiabaseline studies in, 49, 70food production in, 9–10land degradation in, 19sustainable land management in, 55t,
56f, 67Athi River Mining (ARM), 63
BBaseline studies, 49, 70–71, 71f, 72fBioCarbon Fund, 54, 56fBiodiversity
conservation of, xvi, 34–35, 45, 48b,49
measuring, 70–71, 71f, 72fBiological nitrogen fixation (BNF)
technology, 21Biosafety, 64Blue water, 22–23, 23b, 24Brazil, 14, 16b, 21, 35, 55t, 63, 70Burkina Faso, 55t
83
I N D E X
Note: Page numbers followed by letters b, f, and t refer to entries in boxes, figures, andtables, respectively.
CCameroon, 70Carbon funds, xvi, 54–57, 56fCatchment. See WatershedsCatskill Mountains (United States), 39bCauca Valley (Colombia), 39bCentral America
land degradation in, 5soil erosion in, 38, 63
Central Asia, 55tCerrado zone (Brazil), 14, 16bCertified emissions reduction (CER),
56Chile, 66China, 55tCIMMYT. See International Center for
Maize and Wheat ImprovementClimate change
adapting to, 24–27and agriculture, 2effects of, xiv–xv, 3, 25–27, 26band poverty, 13
Climate risk management, 24Common property, xvii, 28–29, 42Community Development Carbon
Fund, 54, 56Consultative Group on International
Agricultural Research (CGIAR),32, 61, 62
Costa Rica, 44
DDeforestation
causes of, 13, 19–21, 20fof hillsides, 6impact of, 43–44incidence of, 14, 15f, 16b, 19
Desertification, xiv, 8, 68Driving Forces, Pressures, State,
Impacts, Responses (DPSIR), 6–7,7f
EEast Africa, 10East Asia, 55t, 56f, 67Eastern Europe, 54, 56fEcosystem services, 5, 6b, 14, 27, 33,
35
Environmental services, 42–49payments for, xvi, 33, 44–49, 46t–47t,
48bvariety of, 21, 42
Ethiopia, 22Evaporation, 40bEvapotranspiration, 40b, 62–63Expenditure priorities, xix–xx, 66
FFarm Input Promotions Africa (FIPS-
Africa), 63Farmer innovation, xviii, 63–64Fertilizer use
public-private sector partnership in, 63
rainfall and, 22, 37risk of, 22in soil fertility management, 33,
35–36, 37Fiber, 2, 10–11, 13Financing, xix–xx, 66. See also
InvestmentsFisheries, 27Food
African production of, 14, 23Asian production of, 9–10demand for, 10–11global production of, 9–10, 9fglobal security of, 13price of, 9frequirements for production of, 2
Food and Agriculture Organization(FAO), 7, 32, 61
Forests, 43, 43b, 53, 54. See alsoDeforestation; Reforestation
GGlobal Development Learning Network
(GDLN), 69Global Environment Facility (GEF),
xvi, 7, 51, 58, 68–69Global warming. See Climate changeGovernments, 13, 31, 51, 65, 66“Green Revolution,” xviii, 61Green water, 22, 23–24, 23b, 44Groundwater, xvii, 24, 42, 43bGuano, 37
84 INDEX
HHillside farming, 5–6, 7, 22, 37–39Humus, 36
IIncentives
and land degradation, 3–4, 6, 12, 13in sustainable land management,
xix–xx, 12–13, 29, 38, 44–49, 66India, 44, 55t, 70Indonesia, 14, 55t. See also SumatraIntegrated farming systems, 34–35Integrated nutrient management, 35,
36–37Integrated resource management,
xv–xviInternational Bank for Reconstruction
and Development (IBRD), 51–54,52t, 53f
International Center for Maize andWheat Improvement (CIMMYT),62
International Development Assistance(IDA), 51–54, 52t, 53f, 69
International Fertilizer DevelopmentCorporation (IFDC), 32
International Finance Corporation(IFC), 51, 66
Investments, 1, 66in carbon funds, 54–57, 56fpriorities of, 4in research and technology, xvii–xviiiin water management, 23
Irrigation water, xvii, 22–23, 24, 42, 45
KKenya, 61, 63Knowledge sharing and extension,
xviii–xix, 27–28, 63–66Kyoto Protocol, 54, 56
LLand degradation, xiv, 5–17
assessment of, xiv, 6–7, 7fbehavioral causes of, 3–4, 6, 12, 13causes of, 3–4, 5–6, 10, 14, 19–21,
20f, 27–30definition of, 5
effects of, 5, 7, 8–9, 21, 35incidence of, 5, 7, 8, 14, 15f, 16b, 19,
37–39prevention of, xiv, 17rehabilitation of, 63at watershed level, 8–9
Land Degradation Assessment inDrylands, 7
Land use. See also Agriculturechanges in, 10–14, 16, 18climate change and, 25–27, 26bintensification of, xv–xvi, 9–10, 9f,
13–14, 15f, 16b, 19, 34–35Landscape, land management at, xiv, 1Latin America
agricultural growth in, 14, 16b, 19baseline studies in, 49, 70land degradation in, 14, 16b, 19sustainable land management in, 55t,
56, 56f, 67Leaching, 36Legumes, 10, 35, 37
MMadagascar, 48bMalawi, 30, 62Mali, 55tMavuno (fertilizer), 63Millennium Development Goals, 11Millennium Ecosystem Assessment
(MEA), 11, 16–17Miombo zone (Southern Africa), 14,
16bMorocco, 55t
NNational Action Plans (NAPs), 32, 33,
68Natural catastrophes, xiv–xv, 3, 27Natural resource management (NRM)
assessment of, 57–58investments in, 4property rights in, 29–30
Nitrogen, 17, 21, 35, 36–37, 61North Africa, 55tNutrient loading, 17Nutrient recapitalization, 35, 37Nutrient recycling, 21, 36
INDEX 85
Nutrients. See also Fertilizer usecombining organic and inorganic,
35, 36, 37compensating for loss of, 37enhancing biological sources of, 36–37research on, 61–62, 63
OOperations Evaluation Department
(OED), 57–58Organization for Economic Co-operation
and Development (OECD), 6–7
PPastoral agriculture, 27Payments for environmental services
(PES), xvi, 33, 44–49, 46t–47t, 48bPeru, 70Philippines, 13Phosphorus, 33, 37, 61Plant functional type (PFT), 70Policy work
constraints on, 28–30, 65–66and land degradation, 3–4, 6, 12in sustainable land management,
xvii, 12, 59–60, 60tPotassium, 61Poverty
assessment of, 11–12climate change and, 13hillside farming and, 5, 37–38land degradation and, 21, 37–38, 60and payments for environmental
services, 45, 48bproperty rights and, 29water management and, 24
Poverty-reduction strategy program(PRSP), 50, 68, 69
Property rights, xv, 3–4, 28–30, 64
RRainfall, 22, 40b
agriculture fed by, 22–24, 25–27, 25b,26b, 35, 44
and fertilizer use, 22, 37Reforestation, 43, 43b, 54Research and technology development,
xvii–xviii, 60–63
Resource sharing, 42Rift Valley (Kenya), 61Road building, 21
SSector work, xvii, 59–60Seed research, 62Soil conservation, 8, 21–22, 32, 38–39,
39bSoil erosion
causes of, 6, 37–38forests reducing, 43bincidence of, 7minimizing, 36rehabilitation of, 63and sediment load in streams, 24
Soil Fertility Initiative (SFI), 32–33Soil fertility management, 32–33,
35–37, 61, 62South Africa, 35South Asia, 55t, 56fSoutheast Asia
agricultural growth in, 19baseline studies in, 49land degradation in, 5sustainable land management in, 63
Southern Africaagricultural growth in, 10, 14, 16bclimate change in, 26b
Stress-tolerant crops, 63Sub-Saharan Africa
BioCarbon projects in, 56fclimate change in, 26bfood production in, 14nutrient monitoring in, 61nutrient recapitalization in, 37soil fertility management in, 33water management in, 22, 23
Sumatra, 70, 71, 71f, 72fSustainable land management (SLM)
assessment of, 57–58, 69challenges to, xiv–xv, 18–30constraints on, 28–30, 65–66definition of, xiv, 2examples of successful, 9–10, 9f, 13,
21–22, 30, 32, 35factors for successful, 2–3, 13–14,
34–35, 58
86 INDEX
importance of, 13incentives in, xix–xx, 12–13, 29, 38,
44–49, 66information needed for, 67intervention points in, 6–7, 7f, 31–49investments in. See Investmentsat landscape level, xiv, 1objectives of, xiv, 17, 31, 33, 34b,
67–68opportunities for, xv–xvii, 2phasing, 67policy work in, xvii, 12, 59–60, 60tstrategic options for, xvii–xx, 12–13,
29, 59–69at watershed level, xiv, xvi–xvii, 1,
39–42, 40f, 41t, 54, 55tWorld Bank’s portfolio on, 50–58,
52t, 53f
TTerrAfrica, 33Thailand, 70Transpiration, 40b, 43bTunisia, 55tTurkey, 55t
UUndernourished people, 9f, 11United Nations Convention to Combat
Desertification (UNCCD), 68United Nations Environment Program
(UNEP), 7
VV index, 70–71, 71f, 72fVietnam, 13
WWater, 40b
blue, 22–23, 23b, 24deforestation and, 43–44equitable sharing of, xvigreen, 22, 23–24, 23b, 44groundwater, xvii, 24, 42, 43bfor irrigation, xvii, 22–23, 24, 42,
45management of, 22–24, 25b, 33, 34b,
35, 41t, 42, 62–63Watersheds
land management at, xiv, xvi–xvii, 1,39–42, 40f, 41t, 54, 55t
overexploitation of, 8–9Weeds, 35West Africa, 10, 62, 63Working for Water program, 35World Bank
African Integrated Land and WaterManagement Initiative of, 33
Operations Evaluation Departmentof, 57–58
role of, 67–69SLM portfolio of, 50–58, 52t,
53fSoil Fertility Initiative of, 32
World Bank Institute (WBI), 69
INDEX 87
E C O - A U D I T
Environmental Benefits StatementThe World Bank is committed to pre-serving endangered forests and naturalresources. We have chosen to print Sustainable Land Management: Challenges,Opportunities, and Trade-offs on recycledpaper with 30 percent postconsumerfiber. The World Bank has formallyagreed to follow the recommendedstandards for paper usage set by theGreen Press Initiative, a nonprofit program supporting publishers in usingfiber that is not sourced from endan-gered forests. For more information,visit www.greenpressinitiative.org.
Saved:
• 3 trees
• 2 million BTUs oftotal energy
• 269 lbs ofgreenhouse gases
• 1,116 gallons ofwaste water
• 143 lbs of solidwaste

Land is the integrating component of all livelihoods depending on farm, forest, rangeland, orwater (rivers, lakes, coastal marine) habitats. Due to varyingpolitical, social, and economic factors, the heavy use ofnatural resources to supply a rapidly growing global population and economy has resulted in the unintended mismanagement and degradation of land and ecosystems.
Sustainable Land Management: Challenges, Opportunities, andTrade-offs provides strategic focus to the implementation ofsustainable land management (SLM) components of theWorld Bank’s development strategies. SLM is a knowledge-based procedure that integrates land, water, biodiversity, andenvironmental management to meet rising food and fiberdemands while sustaining livelihoods and the environment.
This book, aimed at policy makers, project managers, and development organizations, articulates priorities for investment in SLM and natural resource management and identifies the policy, institutional, and incentive reformoptions that will accelerate the adoption of SLM productivityimprovements and pro-poor growth.
ISBN 0-8213-6597-5