Embed Size (px)
Citation preview

2016 ANNUAL REPORT375 Saxonburg Boulevard, Saxonburg, PA 16056
724.352.4455
www.ii-vi.com

About II-VIII-VI Incorporated, a global leader in engineered materials and optoelectronic devices and components, is a vertically integrated manufacturing company that develops innovative products for diversified applications in the industrial, optical communications, military, life sciences, semiconductor equipment and consumer markets. Headquartered in Saxonburg, Pennsylvania, with research and development, manufacturing, sales, service and distribution facilities worldwide, the Company produces a wide variety of application-specific photonic and electronic materials and components and deploys them in various forms, including integrated with advanced software, to enable our customers’ success.
II-VI stock appreciation since IPO under Fran’s tenure with the Company
TRIBUTE TO FRANCIS J. KRAMERAfter a 33-year career that shaped the II-VI we know today, Francis J. Kramer has retired as the CEO of II-VI. He joined II-VI with the goal to build a profitable global company that would endure. His commitment to ensuring that our Company was not just about him but about all of us, and all of us who would come after him, has been inspiring and elevating. His focus on directing our research and development to identify materials with a 50-year or even a 100-year life was all about creating a lasting foundation of competitive advantage. Fran treated everyone as a partner, whether a long-serving employee who joined the same year he did, or someone who joined in the last year. He always demonstrated that he had something to learn from each one of us.
During Fran’s tenure with the Company, II-VI grew from $5 million in revenue to over $800 million, a 16 percent compound annual growth rate. He successfully completed 20 acquisitions in 20 years, drove the global manufacturing and sales footprint, diversified the Company’s product portfolio and established a culture that focuses on the consistent delivery of strategic, profitable growth worldwide.
We thank Fran for his leadership, his fine example of respect and appreciation, his pride in everything that is II-VI and his willingness to share his wisdom and experience with us for so many years. We look forward to his continued strategic guidance as our Chairman of the Board of Directors. Fran said on his last earnings call that he has loved what he did at II-VI. We are all the grateful beneficiaries of his love and dedication to our Company.
Francis J. Kramer
>5,000%6000%
0%1988 2016
CORPORATE INFORMATION
II-VI Incorporated is an Equal Opportunity Employer. As such, it is the Company’s policy to promote equal employment opportunities and to prohibit discrimination on the basis of race, color, religion, sex, age, national origin, disability, status as a veteran or other legally protected class in all aspects of employment, including recruiting, hiring, training and promoting personnel. In fulfilling this commitment, the Company shall comply with the letter and spirit of all applicable laws, regulations and Executive Orders governing equal opportunity in employment.
Board of DirectorsJoseph J. CorasantiRetired President, CEO and Director CONMED Corporation
Wendy F. DiCiccoPresident and Chief Operating Officer Camber Spine Technologies
Francis J. KramerChairman II-VI Incorporated
Vincent D. Mattera, Jr.President and Chief Executive Officer II-VI Incorporated
Thomas E. MistlerRetired Executive Westinghouse Electric Corporation
Marc Y. E. PelaezRear AdmiralUnited States Navy (retired)
William A. SchrommExecutive Vice President and Chief Operating Officer ON Semiconductor Corporation
Shaker SadasivamPresident and Chief Executive Officer SunEdison Semiconductor LLC
Howard H. XiaRetired Executive Vodafone China
Executive OfficersVincent D. Mattera, Jr.President and Chief Executive Officer
Gary A. KapustaChief Operating Officer
Mary Jane RaymondChief Financial Officer
Giovanni BarbarossaChief Technology Officer
David G. WagnerVice President, Human Resources
Walter R. Bashaw IIInterim General Counsel and Secretary
Annual MeetingFriday, November 4, 2016 At 1:30 PM ESTMarriott Pittsburgh North 100 Cranberry Woods Drive Cranberry Township, PA 16066
Stock ListingThe common stock of II-VI Incorporated is traded on Nasdaq under the trading symbol “IIVI.”
Transfer AgentAmerican Stock Transfer & Trust Company6201 15th Ave. Brooklyn, NY 11219 1.800.937.5449
Independent Registered Public AccountantsErnst & Young LLP2100 One PPG Place Pittsburgh, PA 15222
Corporate CounselSherrard, German & Kelly, P.C.535 Smithfield Street, Ste. 300 Pittsburgh, PA 15222
Securities CounselK&L Gates LLPK&L Gates Center 210 Sixth Avenue Pittsburgh, PA 15222
MATERIALS THAT MATTER 1
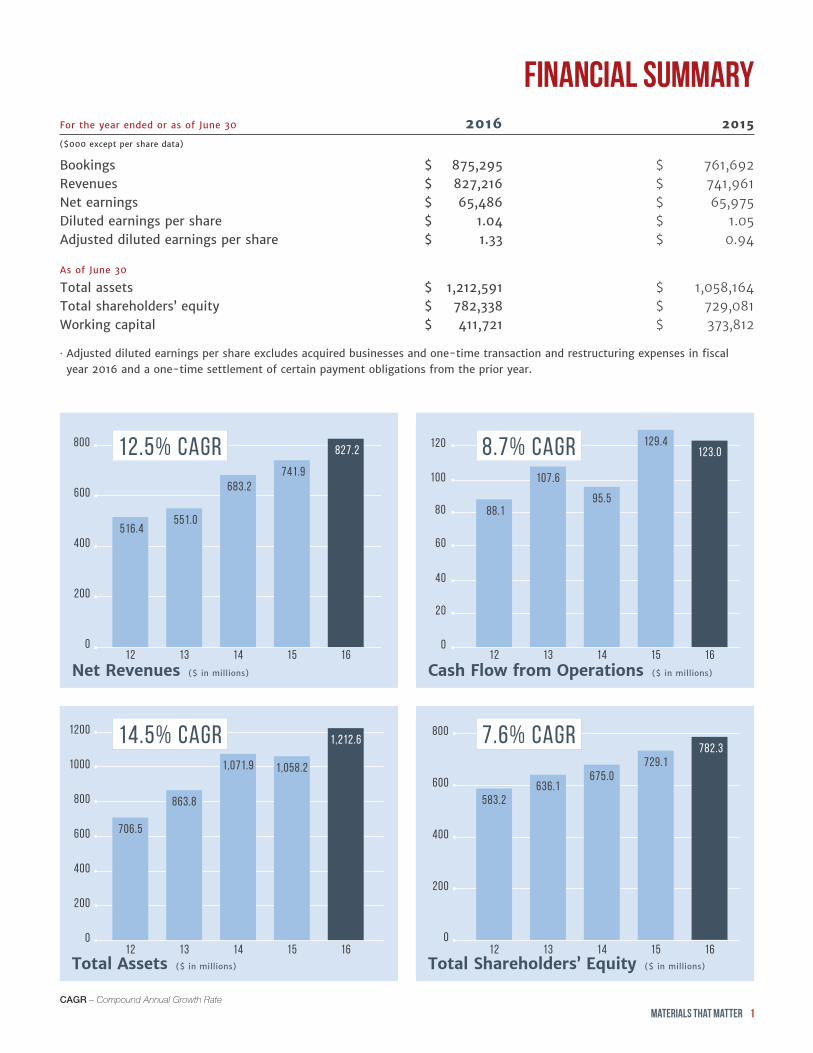
FINANCIAL SUMMARY
CAGR – Compound Annual Growth Rate
For the year ended or as of June 30 2016 2015($000 except per share data)
Bookings $ 875,295 $ 761,692Revenues $ 827,216 $ 741,961Net earnings $ 65,486 $ 65,975Diluted earnings per share $ 1.04 $ 1.05Adjusted diluted earnings per share $ 1.33 $ 0.94
As of June 30
Total assets $ 1,212,591 $ 1,058,164Total shareholders’ equity $ 782,338 $ 729,081Working capital $ 411,721 $ 373,812
• Adjusted diluted earnings per share excludes acquired businesses and one-time transaction and restructuring expenses in fiscal year 2016 and a one-time settlement of certain payment obligations from the prior year.
Cash Flow from Operations ($ in millions)Net Revenues ($ in millions)
800
600
400
200
0
80
60
40
20
1212 1616 1515 1414 13130
100
120
800
1000
1200
600
400
0
200
Total Assets ($ in millions) Total Shareholders’ Equity ($ in millions)
1212 1616 1515 1414 1313
800
600
400
200
0
516.4
706.5
583.2636.1
675.0729.1
863.8
1,071.9 1,058.2
1,212.6 782.3
88.1
107.6
95.5
129.4123.0
551.0
683.2 741.9
827.212.5% CAGR
14.5% CAGR
8.7% CAGR
7.6% CAGR

2 II-VI INCORPORATED 2016 ANNUAL REPORT
SHAREHOLDER LETTER
2016 was a year for the record books for II-VI Incorporated. We saw strong growth in revenues, bookings, and earnings; good returns on investments; expansion of new markets; and foundations laid for future products. It was exciting for our customers, shareholders, and employees.
With record revenues and bookings, we were able to further expand our leadership positions in our two largest end markets: Industrial Laser Materials Processing and Optical Communications. Our expansion of materials and products in both of these end markets has advanced the strategic positioning of our customers and prepared them for the next steps in their growth trajectory. With our two new acquisitions, EpiWorks and ANADIGICS (now II-VI OptoElectronic Devices Division (OED)), we have laid the foundation of a new platform for optoelectronic devices.
Our noteworthy fiscal year 2016 milestones include:• Record Bookings of $875M, an increase of 15% over
FY15, and a book-to-bill ratio of 1.06;
• Record Revenues of $827M, an increase of 11% over FY15, and record Backlog of $290M heading into FY17;
• Increase in Return on Sales to 10.3% from 7.9%, exclusive of the acquired businesses and one-time transactions;
• Global capacity expansion of 30% in Photonics to support sharp increase in customer demand;
• Ongoing Quality Transformation to continually improve all aspects of the business to meet and exceed customer and shareholder expectations;
• New Product Revenue for products released within the past 3 years of $177 million, 21% of total Revenue, and an R&D investment of $60 million, 7% of Revenue;
• Introduction of high-power 980nm submarine and terrestrial pump lasers to further strengthen our market position and serve rapidly growing markets, using our high-reliability laser chip from Laser Enterprise;
• Release of ultra-compact low noise amplification solutions for high-speed 100G, 200G, and 400G optical transmission modules;
• Acquisition of EpiWorks, Inc. and ANADIGICS, Inc. to expand our optoelectronic materials and device capabilities and the subsequent sale of the ANADIGICS RF products and assets.
Returns on Existing Platform InvestmentsOver the past several years, II-VI has made significant investments in its photonics and semiconductor laser platforms, including the acquisitions of the Gallium Arsenide (GaAs) Semiconductor Laser and Optical Amplifier businesses from Oclaro in 2013. Through intensive integration, these acquisitions along with the earlier acquisitions of Photop, Aegis Lightwave, and the Oclaro Thin Film Filter business have cemented the Photonics Segment leadership position in amplification and network monitoring.
Photonics revenue has grown from $217M in fiscal year 2014 to $261M in 2015 and to a record $326M this year—year-over-year growth rates of 20% and 25%, respectively. Over the same period, operating margin has grown from breakeven in fiscal year 2014 to 2.8% in 2015 and to 11.6% this year. Based on projected market conditions, we expect continued strong performance from
MATERIALS THAT MATTER 3
Photonics in fiscal year 2017. This Photonics example is characteristic of the strategic investments II-VI makes in enabling platforms that can fuel long-term growth and differentiated performance.
Future Platform InvestmentsWe made two acquisitions in fiscal year 2016, EpiWorks, Inc. (February 2016) and ANADIGICS, Inc. (March 2016), that significantly expand our semiconductor laser market, platform, and capabilities.
EpiWorks is a world leader in advanced epitaxial wafers for next generation photonics and RF devices. Our photonic wafers meet the demanding requirements for lasers and detectors used in optical communications, industrial and medical applications, and advanced display technologies. EpiWorks RF wafers improve the efficiency and performance of high-speed electronics, including those for mobile devices, wireless infrastructure, and the emerging Internet of Things. The EpiWorks acquisition adds a 6-inch epitaxial wafer scale that increases our capacity and an Indium Phosphide (InP) materials capability that expands our market.
The ANADIGICS acquisition provides us with a world-class team and a global leadership position in technology, scale, and cost for GaAs-based devices through its differentiated 6-inch GaAs wafer fab. Post-acquisition, we divested some commercial assets associated with their RF products, including their legacy product lines, and entered into an agreement for ongoing supply of fabricated wafers to the buyer. The restructured business is now our new II-VI OptoElectronic Devices Division.
We have placed EpiWorks and the II-VI OptoElectronic Devices Division along with the Laser Enterprise Division formed a new group in the Laser Solution Segment. Through these combined capabilities we have expanded
Vincent D. (Chuck) Mattera, Jr. President and Chief Executive Officer
our addressable markets. Among other applications, we believe we can offer our customers a significant time-to-market advantage with a scalable, high-volume VCSEL platform for applications in 3D sensing and the consumer electronics market.
LeadershipFiscal year 2017 starts with our newly appointed President and Chief Executive Officer, Chuck Mattera. His 14-year career at II-VI, including starting on our Board of Directors in 2000 and being reappointed in 2012, has seen many changes. His leadership to position our Company for the next 50 years will expand opportunities for all our 9,000 employees around the globe. We also welcomed our new COO, Gary Kapusta, in February 2016 and we are excited about the continued focus on operational excellence he brings to II-VI as we scale our business further. With Fran Kramer continuing to serve as our Chairman of the Board, the Company is well positioned for future growth.
Strong MomentumLeveraging the progress and our investments, we are excited about the momentum we carry into fiscal 2017. We expect to deliver another good year of financial performance while making significant investments in our engineered material platforms to accelerate growth. With a focus on Materials That Matter, we look forward to continued development of technical advances that create value for our shareholders and make the world safer, healthier, closer, and more efficient.

4 II-VI INCORPORATED 2016 ANNUAL REPORT
KEY TECHNOLOGIES FOR THE FUTURE:
MATERIALS PROCESSING MARKETMarketOur industrial laser optics and solutions for the Materials Processing Market remained in strong demand in fiscal 2016, comprising 37% of total revenues. The world continues to leverage the superior performance and reliability of laser-based materials processing systems, and our customers are processing more advanced materials of varied compositions and forms to deliver the next generation of lighter weight and energy-efficient industrial, consumer, and medical products. For example, car makers such as Ford, GM, BMW, Toyota, and Tesla among others are designing their vehicles with greater proportions of lightweight materials, including metal alloys, ceramic composites, carbon fibers, and specialize plastics, all of which require wavelength-
selected laser processing technologies. From multi kilowatt high-power cutting, welding, and brazing to low-power pulsed laser marking, existing and new applications create a greater than $2B addressable opportunity for II-VI in the materials processing market.
ProductsII-VI’s differentiated laser optics, components, and solutions make a more efficient world
by enabling the laser systems that process the next generation of advanced materials. In fiscal year 2016, there was steady global demand to support existing installations and new deployments of CO2 and fiber laser systems, especially for our > 1 kilowatt (kW) high-power handling optics and beam delivery solutions. Our products were also essential to emerging direct diode systems and specialized materials processing systems such as those incorporating Ultrafast, UV, and CO2 lasers.
Our vertically integrated and market leading zinc selenide (ZnSe) optics and components have enabled high-power CO2 laser systems for many decades and remain critical to the steady stream of new deployments as well as to the continued operation, serving as replacement optics, of the installed base of nearly 75,000 CO2 lasers. Moreover, we have introduced similar products that address new and growing applications for low-power CO2 lasers.
Over the past several years fiber laser-based systems have taken a central role in nearly all materials processing segments and from the laser chips that generate the input optical power to the beam delivery systems that direct the output optical power to the target, II-VI supplies a broad set of enabling products into these systems. The same set of II-VI products is also at the core of existing and emerging direct diode laser systems.
In fiscal 2016, customers relied on our high-power gallium arsenide (GaAs) single emitter laser chips and multiple emitter laser bars as well as our newly introduced high-power single mode seed modules to drive their fiber and direct diode lasers. Additional new product offerings were our acousto-optic modulators for high peak powers and our high-power aspheres and one-micron
Automotive manufacturing employing lasers in their operations.

MATERIALS THAT MATTER 5
Industry leading laser processing head manufactured at our HIGHYAG operations.
optics for multi-kW systems. We also added automated control of beam size and location to our industry-leading BIMO-FSC beam delivery cutting heads for up to 8kW laser power, enabling faster reconfi guration and higher throughput.
PlatformsOur diff erentiated product off erings, from high-power laser chips to sophisticated machine-controlled beam delivery cutting and welding heads, all have at their foundation our materials, technology, and infrastructure platforms. The high reliability GaAs laser chips, bars, and modules leverage our optical semiconductor platform in Zurich, Switzerland. Our crystal growth, optics fi nishing, and high performance coating platforms in Saxonburg, Pennsylvania and in Suzhou and Fuzhou, China are at the core of our ZnSe optics and our one micron aspheres, optics, and optical components. Additionally, these materials and technology platforms, in combination with our global manufacturing platform, enable us to provide the highly and vertically integrated solutions critical to many of our customers.
II-VI PRODUCTS
Gallium Arsenide (GaAs)
High-Power Laser Diodes and Pump LasersMicrochip Wafers
Zinc Selenide OpticsSilicon Carbide Wafer

6 II-VI INCORPORATED 2016 ANNUAL REPORT
KEY TECHNOLOGIES FOR THE FUTURE:
OPTICAL COMMUNICATIONS MARKET
Subsystems and Linecards
980nm Pump Lasers Low Noise Optical Amplifi ers
Optical Time Domain Refl ectometer
II-VI PRODUCTS
Optical Time Domain
II-VI PRODUCTS
MarketOptical Communications fueled our growth this fi scal year, with sales into this market increasing to 39% of our total revenues from 35% in fi scal 2015. The global demand for information bandwidth and data storage continues to increase at a dramatic pace driven by smartphones, tablets, computers, and HDTV. Cloud services, streaming video, and other content-rich applications, including Netfl ix, FaceTime, YouTube, SnapChat, Skype, and Amazon Web Services, are driving communications infrastructure spending not only by traditional carriers like Verizon, AT&T, and China Mobile but also by Internet Content Providers such as Google, Facebook, Microsoft, Amazon, and Alibaba. Annual infrastructure investments result in an addressable market for II-VI of over $3B.
ProductsII-VI’s optical communications products and technologies bring the world closer together by enabling the next generation of high-speed optical transmission systems, networks, and data center solutions necessary to meet the accelerating global bandwidth demand. In fi scal
year 2016, there was broad-based demand across a number of regions and market segments, especially for our products critical to high-speed 100, 200, and 400 gigabits per second (Gbps) transmission. Particularly strong demand was driven by optical transport network build outs in North America, Europe and China and from expansion and interconnection of data centers. These drivers were complemented by strength in global undersea network deployments.
At the core of both terrestrial and undersea optical networks, our market-leading 980nm pump lasers enable a larger number of high speed signals to be transmitted over longer distances. Their enhanced optical performance, combined with their unparalleled reliability and low power consumption, makes the world’s optical communication systems more effi cient. Our latest generation of 980nm pump lasers along with miniature tunable fi lters and hybrid passives were introduced in fi scal 2016 as part of our ultra-compact family of components critical to small form factor, e.g. CFP2 and CFP4, long reach 100G, 200G, and 400G transmission modules.

MATERIALS THAT MATTER 7
Proliferation of smartphones require increased bandwidth resulting in increased demand for II-VI’s optical communications product portfolio.
Customers also continued to rely on us for our industry-leading optical amplification and embedded monitoring solutions for their next generation systems. Enabling a major network build out, we released a proprietary Optical Time Domain Reflectometer (OTDR) module that allows systems to automatically detect and pinpoint issues along the transmission path in real time. In addition to our highly integrated solutions, we have also provided differentiated products at the chip and sub-component levels. For example, our high-speed 25 Gbps Vertical Cavity Surface Emitting Lasers (VCSELs) and thin film filter wavelength division multiplexers (WDMs) have been essential in the expansion and upgrade of high-speed data centers.
PlatformsFrom chips to components to highly integrated modules and linecards, our leading-edge products leverage the significant investment we have made and continue to make in our materials, technology, and infrastructure platforms. Our optical semiconductor platform in Zurich provides the high reliability GaAs chips for our 980nm pumps and high-speed VCSELs. Our crystal growth, micro optics and coating platforms in China and the U.S. are at the core of our ultra-compact components as well as our amplification and monitoring solutions. And our vertical integration, highly valued by our customers, is underpinned by our global manufacturing platform. In fiscal 2016, these platforms enabled us to rapidly increase capacity, nearly doubling our 980nm pump output and increasing overall photonics capacity by over 30%, to enable our customers to meet the sharp rise in global demand.
Data center for optical communications and cloud computing.
8 II-VI INCORPORATED 2016 ANNUAL REPORT
INNOVATION FOR THE FUTURE:
NEW PRODUCTSTechnical innovation in materials that matter and the products that derive from them is at the core of our growth strategy. Through eff ective development and marketing of our engineered material technologies and solutions we are able to generate signifi cant revenue and profi tability growth. In fi scal 2016, we had organic bookings growth of $100M, 11% of our bookings, driven in large part by new products. In particular, our New Product Revenue, defi ned as revenue from products introduced within the past 3 years, was $177M, or 21% of our total revenue. These new products, with their typically higher margins, strongly contributed to our 120 basis point year-over-year gross margin improvement.
To keep the stream of innovation fl owing we continue to make signifi cant investments in new product development and the underlying technology platforms and intellectual property that enable them. We invested over $60M in research, development, and engineering (RD&E) in fi scal 2016 and plan to invest from 8 to 10% of total annual revenue. Ongoing innovations at II-VI are led by our over 900 employees in RD&E, including more than 500 engineers and scientists, and are backed by our over 750 worldwide patents.
Our RD&E activities are focused on expanding our market opportunities with new and diff erentiated products that are underpinned by our industry-leading platforms. In addition to the new products described previously for the Material Processing and Optical Communications markets, a few other examples are highlighted below.
VCSELs for 3D SensingDriven by gesture recognition, augmented and virtual reality, and 3D mapping applications, the market for 3D sensing is expanding at a dramatic pace. The market for Vertical Cavity Surface Emitting Lasers (VCSELs) alone is forecasted by industry analysts to grow from $0.8B in 2016 to $2.0B in 2020, led by these applications. II-VI is developing high
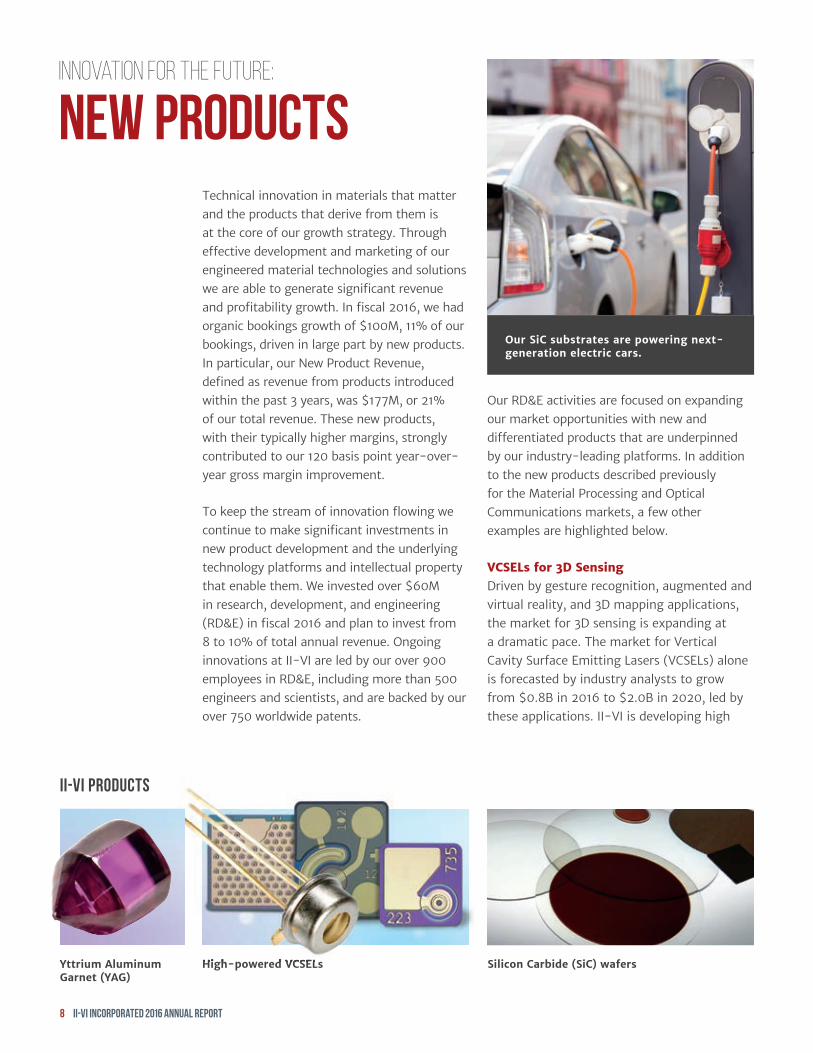
Our SiC substrates are powering next-generation electric cars.
Yttrium Aluminum Garnet (YAG)
II-VI PRODUCTS
Silicon Carbide (SiC) wafersHigh-powered VCSELsHigh-powered VCSELs

MATERIALS THAT MATTER 9
performance, low cost VCSELs and VCSEL arrays at the scale necessary to enable our customers a time-to-market advantage for high volume applications, such as in the consumer electronics market. These VCSEL products leverage our world-class 6-inch Gallium Arsenide platform, comprising our Zurich optical semiconductor operations and also our 6-inch epitaxial wafer growth and wafer fabrication capabilities of our recent acquisitions, EpiWorks and ANADIGICS. We continue to invest heavily in our semiconductor platforms as they underpin many of our end markets.
Silicon Carbide Substrates for High Performance SemiconductorsMany next generation electronics require high performance semiconductors like Silicon Carbide (SiC) that operate beyond what is achievable with existing silicon or gallium arsenide based semiconductors. For example, the market for SiC based power devices is expected to grow from around $200M today to around $800M by 2020. High-power wireless base stations, high-efficiency electric vehicles, and solar power conversion electronics need a combination of high-power density, high-frequency, high-efficiency, and/or high-temperature operation that are only afforded by advanced material systems such as Gallium Nitride (GaN) on SiC and SiC on SiC.
Our market leading SiC substrates are at the core of many of these high-performance semiconductors. We continue to introduce SiC substrates with best-in-class quality and low defect levels and have demonstrated wafers of up to 200 mm in diameter. These new SiC products leverage our industry-leading crystal growth and fabrication technology platforms, which we continue to invest in and scale to meet the high volume and growing demands of our customers.
Advanced Materials for High Performance ApplicationsII-VI specializes in the development of highly engineered materials and material systems to meet demanding performance requirements across a number of markets. In one recent military application, we developed large area sapphire windows with special functional properties for the targeting system of the F-35 Joint Strike Fighter. For the semiconductor manufacturing market we released the latest versions of our ultra-stable, large area, reaction bonded silicon carbide wafer chucks to handle increasingly larger wafer sizes required for advanced device
fabrication. Additionally, we introduced high-power handling polycrystalline CVD diamond windows and components for next generation, extreme ultraviolet, lithography systems. Serving the medical market, we developed custom yttrium aluminum garnet (YAG) based laser materials for compact and high performance laser based medical devices such as for laser eye surgery and dermatological and cosmetic applications.
Our VCSELS are enabling virtual reality and 3D mapping applications.

10 II-VI INCORPORATED 2016 ANNUAL REPORT
· Therapeutic procedures· Medical diagnosis· Medical innovations· Access to water· Agriculture/Aquaculture
HEALTHIER· Intelligence, Surveillance and Reconnaissance
· Personnel protection· Long-term deployment of high-energy laser weapons
· 3D Sensing· Driverless car
SAFER
WE MAKE OUR WORLD
· Global mobile bandwidth· Wireless infrastructure· Internet of Things· Cloud services· Mega data centers
CLOSER· Next generation manufacturing
· Reducing world energy consumption
· Automation· Machine ambient awareness
EFFICIENT

United States SECURITIES AND EXCHANGE COMMISSION
Washington, D.C. 20549
FORM 10-K
Annual Report pursuant to Section 13 or 15(d) of the Securities Exchange Act of 1934
for the fiscal year ended June 30, 2016
Transition report pursuant to Section 13 or 15(d) of the Securities Exchange Act of 1934
for the transition period from to .
Commission File Number: 0-16195
II-VI INCORPORATED (Exact name of registrant as specified in its charter)
PENNSYLVANIA 25-1214948(State or other jurisdiction of
incorporation or organization) (I.R.S. Employer
Identification No.)
375 Saxonburg BoulevardSaxonburg, PA 16056
(Address of principal executive offices) (Zip code)
Registrant’s telephone number, including area code: 724-352-4455
Securities registered pursuant to Section 12(b) of the Act:
Title of Each Class Name of Each Exchange on Which RegisteredCommon Stock, no par value Nasdaq Global Select Market
Securities registered pursuant to Section 12(g) of the Act: None
Indicate by check mark if the registrant is a well-known seasoned issuer, as defined in Rule 405 of the Securities Act. Yes No
Indicate by check mark if the registrant is not required to file reports pursuant to Section 13 or Section 15(d) of the Exchange Act. Yes No
Indicate by check mark whether the registrant (1) has filed all reports required to be filed by Section 13 or 15(d) of the Securities Exchange Act of 1934 during the preceding 12 months (or for such shorter period that the registrant was required to file such reports), and (2) has been subject to such filing requirements for the past 90 days. Yes No
Indicate by check mark whether the registrant has submitted electronically and posted on its corporate Web site, if any, every Interactive Data File required to be submitted and posted pursuant to Rule 405 of Regulation S-T during the preceding 12 months (or for shorter period that the registrant was required to submit and post such files). Yes No
Indicate by check mark if disclosure of delinquent filers pursuant to Item 405 of Regulation S-K is not contained herein, and will not be contained, to the best of registrant’s knowledge, in definitive proxy or information statements incorporated by reference in Part III of this Form 10-K or any amendment to this Form 10-K.
Indicate by check mark whether the registrant is a large accelerated filer, an accelerated filer, a non-accelerated filer, or a smaller reporting company. See definition of “large accelerated filer,” “accelerated filer” and “smaller reporting company” in Rule 12b-2 of the Exchange Act. (Check one):
Large accelerated filer Accelerated filer
Non-accelerated filer (Do not check if a smaller reporting company) Smaller reporting company
Indicate by check mark whether the registrant is a shell company (as defined in Rule 12b-2 of the Exchange Act). Yes No
Aggregate market value of outstanding Common Stock, no par value, held by non-affiliates of the Registrant at December 31, 2015, was approximately $1,100,264,770 based on the closing sale price reported on the Nasdaq Global Select Market. For purposes of this calculation only, directors and executive officers of the Registrant and their spouses are deemed to be affiliates of the Registrant.
Number of outstanding shares of Common Stock, no par value, at August 19, 2016, was 62,637,200.
9500_10Kc1.pdf August 30, 2016 pg 1

2
DOCUMENTS INCORPORATED BY REFERENCE
Portions of the registrant’s definitive proxy statement, which will be issued in connection with the 2016 Annual Meeting of Shareholders of II-VI Incorporated, are incorporated by reference into Part III of this Annual Report on Form 10-K.
Forward-Looking Statements
This Annual Report on Form 10-K (including certain information incorporated herein by reference) contains forward-looking statements made pursuant to Section 21E of the Securities Exchange Act of 1934, as amended (the “Exchange Act”), and the safe harbor provisions of the Private Securities Litigation Reform Act of 1995. These statements can be identified as those that may predict, forecast, indicate or imply future results, performance or advancements and by forward-looking words such as “expects,” “anticipates,” “intends,” “plans,” “projects,” “believes,” “estimates” or similar expressions. Forward-looking statements address, among other things, our expectations, our growth strategies, our efforts to increase bookings, sales and revenues, projections of our future profitability, results of operations, capital expenditures, our financial condition or other “forward-looking” information and include statements about revenues, earnings, spending, margins, costs or our actions, plans or strategies.
The forward-looking statements in this Annual Report on Form 10-K involve risks and uncertainties, which could cause actual results, performance or trends to differ materially from those expressed in the forward-looking statements herein or in previous disclosures. II-VI Incorporated believes that all forward-looking statements made by it have a reasonable basis, but there can be no assurance that these expectations, beliefs or projections will actually occur or prove to be correct. Actual results could materially differ from such statements.
The following factors, among others, in some cases have affected and in the future could affect our financial performance and actual results, and could cause actual results for fiscal 2016 and beyond to differ materially from those expressed or implied in any forward-looking statements included in this Annual Report on Form 10-K or otherwise made by our management:
Our future success depends on continued international sales,
Our competitive position depends on our ability to develop new products and processes,
Investments in future markets of potential significant growth may not result in expected returns,
We may fail to accurately estimate our customers’ demand,
Global economic downturns may adversely affect our business, operating results and financial condition,
Our global operations are complex to manage,
We have entered into supply agreements which commit us to supply products on specified terms,
We depend on highly complex manufacturing processes that require products from limited sources of supply,
Our global operations are subject to complex legal and regulatory requirements,
We may encounter substantially increased competition,
Our competitive position may require significant investments in strategic acquisitions,
Declines in the operating performance of one of our business segments could result in an impairment of the segment’s goodwill and indefinite-lived intangible assets,
There are limitations on the protection of our intellectual property,
We are subject to governmental import and export regulations,
We have agreements with government entities,
We use and generate hazardous substances that are subject to stringent environmental regulations,
We may be adversely affected by climate change regulations,
Data breach incidents and breakdown of information and communication technologies could disrupt our operations and impact our financial results,
Some systems that use our products are complex in design, and our products may contain defects that are not detected until deployed which could increase our costs and reduce our revenues,
Significant defense spending cuts and/or reductions in defense programs could adversely impact our business,
9500_10Kc1.pdf August 30, 2016 pg 2
3
Change in tax rates, tax liabilities or tax accounting rules could affect future results,
Our success depends on our ability to retain key personnel,
Natural disasters or other global or regional catastrophic events could disrupt our operations and adversely affect our results,
A significant portion of our business depends on cyclical industries,
Increases in commodity prices may adversely affect our results of operations and financial condition,
Regulations related to conflict minerals could adversely impact our business,
The market price of our common stock can be highly volatile,
Provisions in our articles of incorporation and by-laws may limit the price that investors may be willing to pay in the future for shares of our common stock,
Because we do not currently intend to pay dividends, shareholders will benefit from an investment in our common stock only if it appreciates in value
The foregoing and additional risk factors are described in more detail herein under Item 1A. “Risk Factors”. In addition, we operate in a highly competitive and rapidly changing environment and therefore, new risk factors can arise. It is not possible for management to predict all such risk factors, assess the impact of all such risk factors on our business nor estimate the extent to which any individual risk factor, or combination of risk factors, may cause results to differ materially from those contained in any forward-looking statement. The forward-looking statements included in this Annual Report on Form 10-K speak only as of the date of this Annual Report on Form 10-K. We do not assume any obligation to update or revise any forward-looking statements, whether as a result of new information, future events or developments, or otherwise, except as may be required by the securities laws. We caution you not to rely on them unduly.
Investors should also be aware that while II-VI Incorporated does communicate with securities analysts, from time to time, those communications are conducted in accordance with applicable securities laws. Investors should not assume that II-VI Incorporated agrees with any statement or report issued by any analyst irrespective of the content of the statement or report.
9500_10Kc1.pdf August 30, 2016 pg 3

4
PART I
Item 1. BUSINESS
Introduction
II-VI Incorporated (“II-VI,” the “Company,” “we,” “us,” or “our”) was incorporated in Pennsylvania in 1971. Our executive offices are located at 375 Saxonburg Boulevard, Saxonburg, Pennsylvania 16056. Our telephone number is 724-352-4455. Reference to “II-VI,” the “Company,” “we,” “us,” or “our” in this Annual Report on Form 10-K, unless the context requires otherwise, refers to II-VI Incorporated and its wholly-owned subsidiaries. The Company’s name is pronounced “Two Six Incorporated.” The majority of our revenues are attributable to the sale of engineered materials and optoelectronic components and devices for industrial laser applications, optical communications products, compound semiconductor substrate-based products and consumer products. Reference to “fiscal” or “fiscal year” means our fiscal year ended June 30 for the year referenced.
The Company’s organizational structure is divided into three reporting segments for the purpose of making operational decisions and assessing financial performance: (i) II-VI Laser Solutions, (ii) II-VI Photonics, and (iii) II-VI Performance Products. These segments, and the units within the segments, are reflected in the organization chart below:
9500_10Kc1.pdf August 30, 2016 pg 4

5
During the fiscal year ended June 30, 2016, the Company completed two acquisitions:
February 1, 2016 EpiWorks, Inc. (“EpiWorks”)March 15, 2016 ANADIGICS, Inc. (“ANADIGICS”)
These two acquired businesses joined the II-VI Laser Solutions segment. See Note 2 to the Company’s Consolidated Financial Statements included in Item 8 of this Annual Report on Form 10-K for additional information regarding the Company’s acquisitions, which information is incorporated herein by reference.
On June 3, 2016, the Company sold the assets of ANADIGICS’s radio frequency (“RF”) business. In conjunction with the sale of the RF business, the Company renamed ANADIGICS as II-VI OptoElectronic Devices, Inc. (“OED”). See Note 2 to the Company’s consolidated financial statements included in Item 8 of this Annual Report on Form 10-K for additional information regarding the Company’s disposition of the RF business, which information is incorporated herein by reference.
Information Regarding Market Segments and Foreign Operations
Financial data regarding our revenues, results of operations, industry segments and international sales for the three years ended June 30, 2016 are set forth in the Consolidated Statements of Earnings and in Note 11 to the Company’s Consolidated Financial Statements included in Item 8 of this Annual Report on Form 10-K and are incorporated herein by reference. We also discuss certain Risk Factors set forth in Item 1A of this Annual Report on Form 10-K related to our foreign operations, which are incorporated herein by reference.
General Description of Business
We develop and manufacture engineered materials, optoelectronic components and products for precision use in industrial, optical communications, military, semiconductor, consumer and life science applications. We use advanced engineered material growth technologies coupled with proprietary high-precision fabrication, micro-assembly, thin-film coating and electronic integration to enable complex optoelectronic devices and modules. Our products are deployed in applications that we believe reduce costs and improve performance and reliability in a variety of applications, including:
Laser cutting, welding and marking operations,
3D sensing consumer applications,
Optical communication products,
Intelligence, surveillance and reconnaissance,
Semiconductor processing and tooling, and
Thermoelectric cooling and power generation solutions.
A key Company strategy is to develop and manufacture high performance materials that are differentiated from those produced by our competitors. We focus on providing components that are critical to the heart of our customers’ assembly lines for products serving the applications mentioned above.
Our U.S. production and research and development operations are located in Pennsylvania, California, New Jersey, Texas, Mississippi, Massachusetts, Connecticut, Delaware, New York, Florida and Illinois and our non-U.S. production operations are based in China, Singapore, Vietnam, the Philippines, Germany and Switzerland. We also utilize a contract manufacturer in Thailand. In addition to sales offices at most of our manufacturing sites, we have sales and marketing subsidiaries in Hong Kong, Japan, Germany, China, Switzerland, Belgium, the United Kingdom (“U.K.”), Italy and South Korea. Approximately 63% of our revenues for the fiscal year ended June 30, 2016 were generated from sales to customers outside of the United States (“U.S.”).
9500_10Kc1.pdf August 30, 2016 pg 5

6
Our Markets and Products
Our market-focused businesses are organized by technology and products. Our businesses are composed of the following primary markets:
Our Markets: Addressable Markets:
Fiscal Year 2016 Revenues by Market:
Material processing - including laser cutting, welding, drilling, ablation, cladding, heat treating and marking.
Chemical Vapor Deposition (“CVD”) Diamond - windows, tooling, microwave and radiation detection.
Industrial
3D sensing and printing applications.
$294 million
Optical high-speed datacom applications and high power sensing for consumer electronic applications.
Low-power polarization locked products for optical mouse and finger navigation applications.
CATV networks and data centers.
Optical Communications
Metro to long haul and undersea networks.
$298 million
Military Intelligence, surveillance, and reconnaissance. $104 million
Semiconductor, display and refractory components.
Life science, medical and cosmetic devices.
Cooling, heating and power generation.
Other
Consumer applications.
$131 million
The details of our Addressable Markets and our Key Products by Business Unit:
II-VI Laser Solutions Segment
II-VI Infrared Optics Group:
Design, manufacture and marketing of engineered materials and optoelectronic components for industrial applications.
Increases in the installed worldwide base of carbon dioxide (“CO2”) and fiber laser machines for a variety of laser processing applications have driven CO2 laser optics component consumption. It is estimated that there are over 75,000 CO2 laser systems currently deployed in the world. CO2 and fiber lasers offer benefits in a wide variety of cutting, welding, drilling, ablation, cladding, heat treating and marking applications for materials such as steel alloys, non-ferrous metals, plastics, wood, paper, fiberboard, ceramics and composites.
Laser systems enable manufacturers to reduce parts cost and improve quality, as well as improve process precision, speed, throughput, flexibility, repeatability and automation. Automobile manufacturers, for example, deploy lasers both to cut body components and to weld those parts together in high-throughput production lines. Manufacturers of motorcycles, lawn mowers and garden tractors cut, trim, and weld metal parts with lasers to reduce post-processing steps and, therefore, lower overall manufacturing costs. Furniture manufacturers utilize lasers because of their easily reconfigurable, low-cost prototyping and production capabilities for customer-specified designs. In high-speed food and pharmaceutical packaging lines, laser marking is used to provide automated product, date and lot coding on containers.
In addition to being installed by original equipment manufacturers (“OEMs”) of laser systems in new machine builds, our optical components are purchased as replacement parts by end-users of laser machines to maintain proper system performance.
In newer and developing market segments, Silicon Carbide (“SiC”) and CVD Diamond both exhibit very high thermal conductivities for use in high-end applications in the semiconductor and optoelectronic markets. CVD Diamond also has applications in the windows, tooling, microwave and radiation detection markets.
9500_10Kc1.pdf August 30, 2016 pg 6
7
The key products enabling these applications in our addressable markets include precision infrared optoelectronic components such as lenses, output couplers, windows, mirrors and scan-lenses for use in CO2 and fiber lasers. Our precision optoelectronic components are used to control laser energy, enhance the properties of the laser beam and focus and direct laser beams to a target work surface. The optoelectronic components include both reflective and transmissive optics and are made from materials such as zinc selenide, zinc sulfide, copper, silicon, gallium arsenide (“GaAs”) and germanium. Transmissive optics used with CO2 lasers are predominately made from zinc selenide. We believe we are the largest manufacturer of zinc selenide in the world.
II-VI HIGHYAG Division:
Design, manufacture and marketing of customized technology for laser material processing to deliver both low-power and high-power one-micron laser light for industrial applications.
In many areas of material processing, laser technology has proven to be a better alternative to conventional production techniques. It has also enabled novel processing steps not previously achievable with legacy technologies. The precise cut and elegant seam are visible proof of a laser beam’s machining efficiency.
Industrial applications such as welding, drilling and cutting have driven the recent market growth of one-micron laser systems, and are demanding increased performance, lower total cost of ownership, ease of use and portability of the one-micron laser systems. One-micron laser systems require efficient and reliable tools for the most demanding automotive and machine tool industries.
The key product enabling these applications include modular laser processing heads for fiber lasers, direct diode lasers and other one-micron laser systems. We also manufacture beam delivery systems including fiber optic cables and modular beam coupling systems.
II-VI OptoElectronic Materials & Devices Group:
II-VI Laser Enterprise Division:
Design, manufacture and marketing of advanced semiconductor laser diodes and low-power polarization locked laser diodes.
We market advanced laser technology diodes for material processing, medical, cosmetic, 3-D sensing and printing applications and are exploring other new market opportunities for our high-power lasers. In addition, we sell low-power polarization locked products for optical mouse and finger navigation applications. Our market opportunities for vertical cavity surface emitting laser (“VCSEL”) products are expanding to include optical high-speed datacom applications and high-power sensing for consumer electronics applications.
II-VI OptoElectronic Devices Division:
Design, manufacture and marketing of six-inch GaAs wafers.
Current markets include consumer electronics, WiFi, Internet of Things and automotive. The need for epitaxial semiconductor wafers is critical as devices require more power and storage capacity.
II-VI EpiWorks:
Design, manufacture and marketing of epitaxial compound semiconductor wafers.
Epitaxial compound semiconductor wafers are driving performance in many differentiated markets including consumer electronics, laser projection, data centers, tailored heating and industrial marking. Our products are geared toward enabling higher performance photonic and RF components for consumer, communications, network and mobile applications and RF components for wireless handsets, tablets and the Internet of Things. We are a leading producer of advanced epitaxial wafers tailored for optimal performance in multiple next generation applications including LED and laser wafers used in displays and RF wafers used in smartphones.
9500_10Kc1.pdf August 30, 2016 pg 7

8
II-VI Suwtech Division:
Design, manufacture and marketing of high-power lasers for industrial applications and green lasers for consumer, life science and industrial applications. We supply high-power laser, green laser, narrow line-width laser and Q-switched laser solutions. Additionally, the division creates ultra-hard material laser cutting machines for industrial applications.
The need for high-power and green laser for industrial and medical applications continues to grow as does the need for a laser cutting device capable of processing the next generation of ultra-hard materials like diamond.
II-VI Photonics Segment
II-VI Photop Group:
Our engineering resources are broadly based for design, manufacture and marketing of a diverse range of customized optics, including optical assemblies for consumer and commercial applications such as fiber optic communications, projection and display products, lasers, medical equipment and bio-medical instrumentation. Products include a wide variety of standard and custom laser gain materials, optics, optical components and optical module assemblies. Our laser gain materials are produced to stringent industry standards and precisely fabricated to customer specifications, and include neodymium-doped yttrium aluminum garnet (“Nd:YAG”) and erbium-doped yttrium aluminum garnet (“Er:YAG”) components for many types of laser systems.
In addition, we design, manufacture and market crystal and optical components to major OEM customers for fiber, solid state and gas laser systems used in industrial and medical applications.
The II-VI Photop market is driven by applications in the optical communications, medical and life science, and industrial markets. The optical communications market segment requires delivery of ever-increasing data bandwidth and necessitates innovations in performance and cost of the underlying optics and optical components.
Medical and life science applications continue to gain traction in the market for laser procedures for aesthetic, vision correction, dental, ophthalmic, surgical and diagnostic lasers and instruments.
Industrial market segments are addressed by solid state lasers and fiber lasers, which are used in high-power applications such as cutting, welding, drilling, and lower power applications such as marking and engraving. These industrial applications are demanding higher performance levels for less cost and more efficiency, creating competition for older technologies.
II-VI Photop also addresses opportunities in the semiconductor processing, instrumentation, test and measurement and research market segments.
II-VI Optical Communications Group:
Design, manufacture and marketing of optical components, assemblies, modules, transceivers and monitor products for use in communications, cable television (“CATV”) networks and data centers.
Design, manufacture and marketing of Erbium Doped Fiber Amplifiers (“EDFA”) and their source 980 nanometer (“nm”) pump laser diodes used to compensate for losses in optical fiber and other optical components and modules in optical transmission systems.
Design, manufacture and marketing of Optical Time Domain Reflectometry (“OTDR”) products for embedded monitoring of the physical line integrity in optical transmission systems.
The optical communications market is being driven in part by demand for high-bandwidth communication capabilities through increasing worldwide usage of the Internet and data services, the growing number of broadband users, mobile device and cloud computing users, and the greater reliance on high-bandwidth capabilities in our daily lives. High-bandwidth communication networks are being extended closer to the end-user with fiber-to-the-home and other fiber optic networks. Mobile data traffic also is increasing as smart phones continue to proliferate with increasingly sophisticated audio, photo, video, email and Internet capabilities, as well as data connection and storage through cloud computing networks. The resulting traffic, in turn, is felt throughout the network, including the core that depends on optical technology. Our passive components, assemblies and modules are used for filtering, switching, combining and routing optical wavelengths within optical networks. Our monitoring products are used for measuring the performance of optical channels and systems.
Our 980 nm pump laser diodes are designed for use as high-power, highly reliable pump sources for EDFAs in terrestrial access, cross-connect, metro to long haul and undersea (submarine) repeater applications. Single mode high-power uncooled modules are designed for both the single channel and small form factor terrestrial market and also the stringent high reliability demands of the submarine (subsea) network market. In addition, we market EDFAs that are used to compensate for losses in optical fiber and other optical components and modules in optical transmission systems. We
9500_10Kc1.pdf August 30, 2016 pg 8
9
offer optical amplifiers at all levels of functionality, from simple optical modules through full circuit cards, which plug directly into our customers’ equipment racks and service the metro, regional and long-haul optical transmission markets. In some cases, we add additional switching and monitoring functionality to the base amplifier.
II-VI Performance Products Segment
II-VI Optical Systems:
Design, manufacture and marketing of Ultra Violet (“UV”), Visible (“VIS”) and Infrared (“IR”) optical components and high-precision optical assemblies, laser gain material and micro-fine conductive mesh patterns for intelligence, surveillance, reconnaissance and other military, life science and commercial laser and imaging applications.
We provide several key assemblies and optical components such as windows, domes, laser rods and optics and related sub-assemblies to military, semiconductor, medical, and life sciences markets for UV, VIS, and IR applications in night vision, targeting, navigation, missile warning, and Homeland Security Intelligence, Surveillance and Reconnaissance systems.
Infrared windows and window assemblies for navigational and targeting systems are deployed on fixed and rotary-wing aircraft, such as the F-35 Joint Strike Fighter, F-16 fighter jet, Apache Attack Helicopter, unmanned platforms such as the Predator and Reaper Unmanned Aerial Vehicle (“UAV”) and ground vehicles such as the Abrams M-1 Tank and Bradley Fighting Vehicle.
Additionally, multiple fighter jets, including the F-16, are equipped with large area sapphire windows, as a key component for the aircraft, providing advanced targeting and imaging systems. Our ability to grow large sapphire materials and manufacture these materials into large area sapphire windows has played a key role in our ability to provide an even larger suite of sapphire panels, which are a key component of the F-35 Joint Strike Fighter Electro Optical Targeting System.
Infrared domes are used on missiles with infrared guidance systems ranging from small, man-portable designs to larger designs mounted on helicopters, fixed-wing aircraft and ground vehicles. High-precision domes are an integral component of a missile’s targeting system, providing efficient tactical capability, while serving as a protective cover to its internal components.
The Company also offers precision optical engineering and manufacturing, with particular efficiency in designing to customer end-item specifications, assisting with co-engineering designs, and designing for manufacturability. The high precision optical components and assemblies programs include Deep Impact Comet Flyby HRI & MRI, Lunar Reconnaissance Orbiter, Hellfire II Missile Optics, missile launch detection sensor optical assembly, and High Altitude Observatory telescopes among others. In addition to imaging, many of these systems employ laser designation and range-finding capabilities supported by our YAG material growth and competency in short wave infrared and visible optics. Turreted systems and mounted targeting pods employ these capabilities in addition to hand-held soldier systems. Rotary and fixed-wing platforms also use missile warning systems to protect against shoulder fired man-portable missiles. Our competencies in material growth for UV crystals and our optical assembly capabilities provide significant support to these missile warning systems. A key attribute to several of these systems is the ability to filter electro-magnetic interference using micro-fine conductive mesh patterns. This technology is also applied to non-optical applications for absorbing and transmitting energy from the surfaces of aircraft and missiles.
II-VI Marlow:
Design, manufacture and marketing of Thermoelectric Modules (“TEMs”) and assemblies for cooling, heating and power generation applications in the defense, telecommunications, medical, consumer and industrial markets.
TEMs are solid-state semiconductor devices that act as small heat pumps to cool, heat and temperature stabilize a wide range of materials, components and systems. Conversely, the principles underlying thermoelectrics allow TEMs to be used as a source of power when subjected to temperature differences. TEMs are more reliable than alternative cooling solutions that require moving parts and provide more precise temperature control solutions than competing technologies.
TEMs also have many other advantages which have spurred their adoption in a variety of industries and applications including defense and space applications that involve IR cooled and uncooled night vision technologies and thermal reference sources that are deployed in state-of-the-art weapons, as well as cooling high-powered lasers used for range-finding target designation by military personnel. TEMs also allow for temperature stabilization of telecommunication lasers that generate and amplify optical signals for fiber optics systems.
Thermoelectric-based solutions appear in a variety of medical applications including instrumentation and analytical applications such as DNA replication, blood analyzers and medical laser equipment.
9500_10Kc1.pdf August 30, 2016 pg 9

10
The industrial, commercial and consumer markets provide a variety of niche applications ranging from desktop refrigerators and wine coolers to personal comfort technology, semiconductor processes and test equipment. In addition, power generation applications are expanding into fields such as waste heat recovery, heat scavenging and co-generation.
II-VI M Cubed:
Design, manufacture and marketing of advanced ceramic materials and precision products for the semiconductor, display, industrial and defense markets.
Metal matrix composites (“MMC”) and reaction bonded ceramics products are found in applications requiring precision, lightweight, strength, hardness and matched coefficient of thermal expansion. Each market has its own unique requirements and applications that drive material selection. This is especially true in semiconductor tool applications that require advanced materials to meet the need for increased tolerance, enhanced thermal stability, faster wafer transfer speeds, increased yields and reduced stage settling times.
The semiconductor markets employ SiC for wafer chucks, light-wave scanning stages and high temperature, corrosion resistant wafer support systems. Cooled SiC mirrors are used in the illumination systems of lithography tools.
The industrial market uses a variety of ceramic materials for applications requiring chemical inertness or high temperature tolerance such as in flat panel display manufacturing equipment, and refractory components.
The defense market uses MMCs for protective body armor as well as protection for ground, air and naval resources.
II-VI Advanced Materials:
Design, manufacture and marketing of single crystal SiC substrates and polycrystalline CVD Diamond materials for use in the mobile communications, renewable energy, industrial, defense, semiconductor equipment and thermal management markets.
SiC is a wide bandgap semiconductor material that offers high-temperature, high-power and high-frequency capabilities as a substrate for applications at the high-performance end of the defense, telecommunication and industrial markets. SiC has a high number of intrinsic physical and electronic advantages over competing semiconductor materials such as silicon and GaAs. For example, the high thermal conductivity of SiC enables SiC-based devices to operate at high-power levels and still dissipate the excess heat generated. II-VI Advanced Materials supplies base SiC substrates into this market.
SiC-based structures are being developed and deployed for the manufacture of a wide variety of microwave and power switching devices. High-power, high-frequency SiC-based microwave devices are used in next generation wireless switching telecommunication applications and in both commercial and military radar applications.
SiC-based, high-power, high-speed devices improve the performance, efficiency and reliability of electrical power transmission and distribution systems (“smart grid”). They also provide power conditioning and switching in power supplies and motor controls in a wide variety of applications including aircraft, hybrid vehicles, industrial, communications and green energy applications.
Both SiC and CVD Diamond materials are being utilized in optical and electronic applications requiring high thermal conductivity for advanced thermal management. CVD Diamond also has applications in the semiconductor equipment, including: extreme ultraviolet (“EUV”) lithography, windows, tooling, microwave and radiation detection markets.
9500_10Kc1.pdf August 30, 2016 pg 10

11
Our Strategy
Our strategy is to grow businesses with world-class engineered material capabilities to advance our current customers’ strategies, penetrate new markets through innovative technologies and platforms, and enable new applications in large and growing markets.
A substantial portion of our business is based on sales orders with market leaders, which enable our forward planning and production efficiencies. We intend to continue capitalizing and executing on this proven model, participating effectively in the growth of the markets discussed above, and continuing our focus on operational excellence as we execute business strategies in the areas of:
Key Business Strategies: Our Plan to Execute:
Identify New Products and Markets Identify new technologies, products and markets to meet evolving customer requirements for high performance engineered materials through our dedicated corporate R&D program to increase new product revenue and maximize return on investment.
Internally and externally funded R&D expenditures, targeting an overall investment of between 7 and 9 percent of revenues.
Balanced Approach to Research and Development
We are committed to accepting the right mix of internally and externally funded research that ties closely to our long-term strategic objectives.
Leverage Vertical Integration Combine R&D and manufacturing expertise, operating with a bias to both components and production machines, reducing cost and lead time to enhance competitiveness, time to market, and profitability.
Investment in Low Cost Manufacturing Strategically invest in, evaluate and identify opportunities to consolidate manufacturing operations worldwide to increase production capacity, capabilities and cost effectiveness.
Continue to improve upon our established reputation as a consistent, high-quality supplier of engineered materials and optoelectrical components into our customers’ products.
Enhance Our Performance and Reputation as a Quality and Customer Service Leader
Execute our global quality transformation process thereby eliminating costs of non-conforming materials and processes.
Identify and Complete Strategic Acquisitions and Alliances
Identify acquisition opportunities that accelerate our access to emerging high-growth segments of the markets we serve and further leverage our competencies and economies of scale.
Research, Development and Engineering
During the current fiscal year ended June 30, 2016, the Company continued to identify, invest in and focus our research and development on new products across the Company in an effort to accelerate our organic growth. This approach is managed under a disciplined innovation program that we refer to as the “II-VI Phase Gate Process”.
Our research and development program includes internally and externally funded research and development expenditures targeting an overall annual investment of between 7 and 9 percent of product revenues. From time to time, the ratio of externally funded contract activity to internally funded contract activity varies due to the unevenness of government funded research programs and changes in the focus of our internally funded research programs. We are committed to having the right mix of internally and externally funded research that ties closely to our long-term strategic objectives. The Company continues to believe that externally funded research and development will decrease in the near term due to governmental budget constraints.
We devote significant resources to research, development and engineering programs directed at the continuous improvement of our existing products and processes and to the timely development of new technologies, materials and products. We believe that our research, development and engineering activities are essential to establish and maintain a leadership position in each of the markets we serve. As of June 30, 2016, we employed 892 people in research, development and engineering functions, 535 of who are engineers or scientists. In addition, certain manufacturing personnel support or participate in our research and development efforts on an ongoing basis. We believe this interaction between the development and manufacturing functions enhances the direction of our projects and design for manufacturing, reducing costs and accelerating technology transfers.
9500_10Kc1.pdf August 30, 2016 pg 11

12
During the fiscal year ended June 30, 2016, we focused our research and development investments in the following areas:
Segment: Area of Development: Our Research and Development Investments:
Focusing on increasing fiber coupled optical output power of multi-emitter modules.
High Power Laser Diodes and High Volume Components
Developing high power VCSELs for consumer devices and next generation high speed VCSELs for 3D sensing and datacom applications.
Developing CVD synthetic diamond for EUV applications.
II-VI Laser Solutions
CVD Diamond Technology
Focusing on broadening our portfolio beyond infrared windows applications.
Photonics Design Continuing to improve photonic crystal materials, precision optical parts, and laser device components.
Investing in next generation GaAs pump chip and module for terrestrial and undersea performance.
Pump Lasers
Developing indium phosphide growth and processing capability.
Optical Amplifiers Investing and broadening the range of semi-custom and custom amplifiers for Tier 1 customers.
Continuing optical channel monitor investment.Optical Monitoring
Developing OTDR monitors to measure the health of outside fiber plant connections and connections within the central office.
Shifting toward smaller, more compact platforms and packages.
II-VI Photonics
Micro-Optics Manufacturing
Investing in equipment manufacture substrates using computerized manufacturing processes.
Continuing SiC substrate technology efforts to advance 4G and 5G wireless.
Silicon Carbide Technology
Producing as a leading supplier of 150mm SiC material and first supplier of 200mm SiC material.
Continuing to develop leading bismuth telluride (“Bi2Te3”) for thermoelectric cooling/heating.
Thermoelectric Materials and Devices
Focusing on thermoelectric power generation capability in order to introduce new products to the market.
II-VI Performance Products
Metal Matrix Composites and Reaction Bonded Ceramics
Supporting OEMs in new product development for measurement tools used in semiconductor fabrication.
The development of our products and manufacturing processes is largely based on proprietary technical know-how and expertise. We rely on a combination of contract provisions, trade secret laws, invention disclosures and patents to protect our proprietary rights. We have entered into selective intellectual property licensing agreements. When faced with potential infringement of our proprietary information, we have in the past and will continue to assert and vigorously protect our intellectual property rights.
Internally funded research and development expenditures were $60.4 million, $51.3 million and $42.5 million for the fiscal years ended June 30, 2016, 2015 and 2014, respectively. For these same periods, externally funded research and development expenditures were $8.7 million, $9.5 million and $3.5 million, respectively.
Marketing and Sales
We market our products through a direct sales force and through representatives and distributors around the world. Our market strategy is focused on understanding our customers’ requirements and building market awareness and acceptance of our products. New products are continually being produced and introduced to our new and established customers in all markets.
9500_10Kc1.pdf August 30, 2016 pg 12

13
The Company has undertaken an initiative to centralize the worldwide marketing and sales functions across the Company’s business units. Sales offices have been strategically established to best serve and distribute products to our worldwide customer base. There is significant cooperation, coordination and synergies among our business units that capitalize on the most efficient and appropriate marketing channels to address diverse applications within our markets.
Our sales forces develop effective communications with our OEM and end-user customers worldwide. Products are actively marketed through targeted mailings, telemarketing, select advertising and attendance at trade shows and customer partnerships. Our sales force includes a highly-trained team of application engineers to assist customers in designing, testing and qualifying our parts as key components of our customers’ systems. As of June 30, 2016, we employed 262 individuals in sales, marketing and support.
We do business with a number of customers in the defense industry, who in turn generally contract with a governmental entity, typically a U.S. governmental agency. Most governmental programs are subject to funding approval and can be modified or terminated without warning by a legislative or administrative body. For further information regarding our exposure to government markets, see the discussion set forth in Item 1A – Risk Factors of this Annual Report on Form 10-K.
Manufacturing Technology and Processes
As noted in the “Our Strategy” section, many of the products we produce depend on our ability to manufacture and refine technically challenging materials and components. The ability to produce, process and refine these complex materials and to control their quality and yields is an expertise of the Company that is critical to the performance of our customers’ instruments and systems. In the markets we serve, there are a limited number of suppliers of many of the components we manufacture and there are very few industry-standard products.
Our network of worldwide manufacturing sites allows us to manufacture our products in regions that provide cost-effective advantages and proximity to our customers. We employ numerous advanced manufacturing technologies and systems at our manufacturing facilities. These include automated Computer Numeric Control optical fabrication, high throughput thin-film coaters, micro-precision metrology and custom-engineered automated furnace controls for crystal growth processes. Manufacturing products for use across the electro-magnetic spectrum requires the capability to repeatedly produce products with high yields to atomic tolerances. We embody a technology and quality mindset that gives our customers the confidence to utilize our products on a just-in-time basis straight into the heart of their production lines.
Export and Import Compliance
We are required to comply with various export/import control and economic sanction laws, including:
The International Traffic in Arms Regulations (“ITAR”) administered by the U.S. Department of State, Directorate of Defense Trade Controls, which, among other things, impose licensing requirements on the export from the U.S. of certain defense articles and defense services, which generally include items that are specially designed or adapted for a military application and/or listed on the U.S. Munitions List;
The Export Administration Regulations (“EAR”) administered by the U.S. Department of Commerce, Bureau of Industry and Security, which, among other things, impose licensing requirements on the of certain dual-use goods, technology and software, which are items that potentially have both commercial and military applications;
The regulations administered by the U.S. Department of Treasury, Office of Foreign Assets Control, which implement economic sanctions imposed against designated countries, governments and persons based on U.S. foreign policy and national security considerations; and
The import regulations administered by the U.S. Customs and Border Protection.
Foreign governments have also implemented similar export and import control regulations, which may affect our operations or transactions subject to their jurisdiction. For additional discussions regarding our import and export compliance, see the discussion set forth in Item 1A – Risk Factors of this Annual Report Form on Form 10-K.
Sources of Supply
The major raw materials we use include zinc, selenium, zinc selenide, zinc sulfide, hydrogen selenide, hydrogen sulfide, tellurium, yttrium oxide, aluminum oxide, iridium, platinum, bismuth, silicon, thorium fluoride, antimony, carbon, gallium arsenide, copper, germanium, molybdenum, quartz, optical glass, diamond, and other materials. Excluding our own production, there are more than two external suppliers for all of the above materials except for zinc sulfide, hydrogen selenide and thorium fluoride, for which there is only one proven source of supply outside of the Company’s capabilities, and zinc selenide, for which there are no other proven external
9500_10Kc1.pdf August 30, 2016 pg 13

14
sources of supply. For many materials, we have entered into purchase arrangements which provide discounts for annual volume purchases in excess of specified amounts.
The continued high-quality of and access to these materials is critical to the stability and predictability of our manufacturing yields. We test materials at the onset of the production process. Additional research and capital investment may be needed to better define future starting material specifications. We have not experienced significant production delays due to shortages of materials. However, we do occasionally experience problems associated with vendor-supplied materials not meeting contract specifications for quality or purity. As discussed in greater detail in Item 1A – Risk Factors, of this Annual Report on Form 10-K, significant failure of our suppliers to deliver sufficient quantities of necessary high-quality materials on a timely basis could have a materially adverse effect on our results of our operations.
9500_10Kc1.pdf August 30, 2016 pg 14

15
Customers
The main groups of customers by segments are as follows:
Segment: Group/Division: Our Customers Are: Representative Customers:II-VI Laser Solutions
II-VI Infrared Optics Group
OEM and system integrators of industrial, medical and military laser systems.
TRUMPF GmbH+Co.KG Bystronic Laser AG Rofin-Sinar Technologies, Inc.
Laser end-users who require replacement optics for their existing laser systems.
Caterpillar, Inc. Honda of America Mfg., Inc.
Military, aerospace and commercial customers requiring products for use in advanced targeting, navigation and surveillance.
Lockheed Martin Corporation Northrop Grumman
Corporation.
II-VI HIGHYAG Division
Automotive manufacturers, laser manufacturers and system integrators.
Volkswagen AG Laserline GmbH
II-VI Laser Enterprise Division,II-VI EpiWorks, &II-VI OptoElectronic Devices Division
Manufacturers of industrial laser components, optical communication equipment and consumer technology applications.
Laserline GmbH Huawei Technologies, Co.,
Ltd. Cisco Systems, Inc. Samsung SkyWorks
Worldwide network system and sub-system providers of telecommunications, data communications and CATV.
II-VI Photonics
II-VI Photop Group &II-VI Optical Communications Group
Global manufacturers of commercial and consumer products used in a wide array of instruments, fiber lasers, display and projection devices.
Huawei Technologies, Co., Ltd.
Cisco Systems, Inc. Ciena Corporation Corning Incorporated Google, Inc.
II-VI Optical Systems
Manufacturers of equipment and devices for aerospace, defense, life science and commercial markets.
Lockheed Martin Corporation Raytheon Company BAE Systems Boeing Corporation Northrup Grumman
Corporation II-VI Marlow Manufacturers and developers of
equipment and devices for defense, space, telecommunications, medical, industrial, automotive, personal comfort and commercial markets.
Bio-Rad Laboratories, Inc. Raytheon Company Flextronics International Ltd.
II-VI M Cubed Manufacturers and developers of integrated circuit capital equipment for the semiconductor industry.
ASML Holding NV Nikon Corporation KLA-Tencor
Manufacturers and developers of products and components for various defense and industrial markets.
BAE Systems Corning Incorporated TenCate
Manufacturers and developers of equipment and devices for high-power RF electronics and high-power and voltage switching and power conversion systems for both commercial and military applications.
II-VI Performance Products
II-VI Advanced Materials
Manufacturers of high-power optical and electronic devices requiring advanced thermal management solutions.
IQE plc Infineon Technologies Sumitomo Electric Device
Innovations, Inc.
9500_10Kc1.pdf August 30, 2016 pg 15
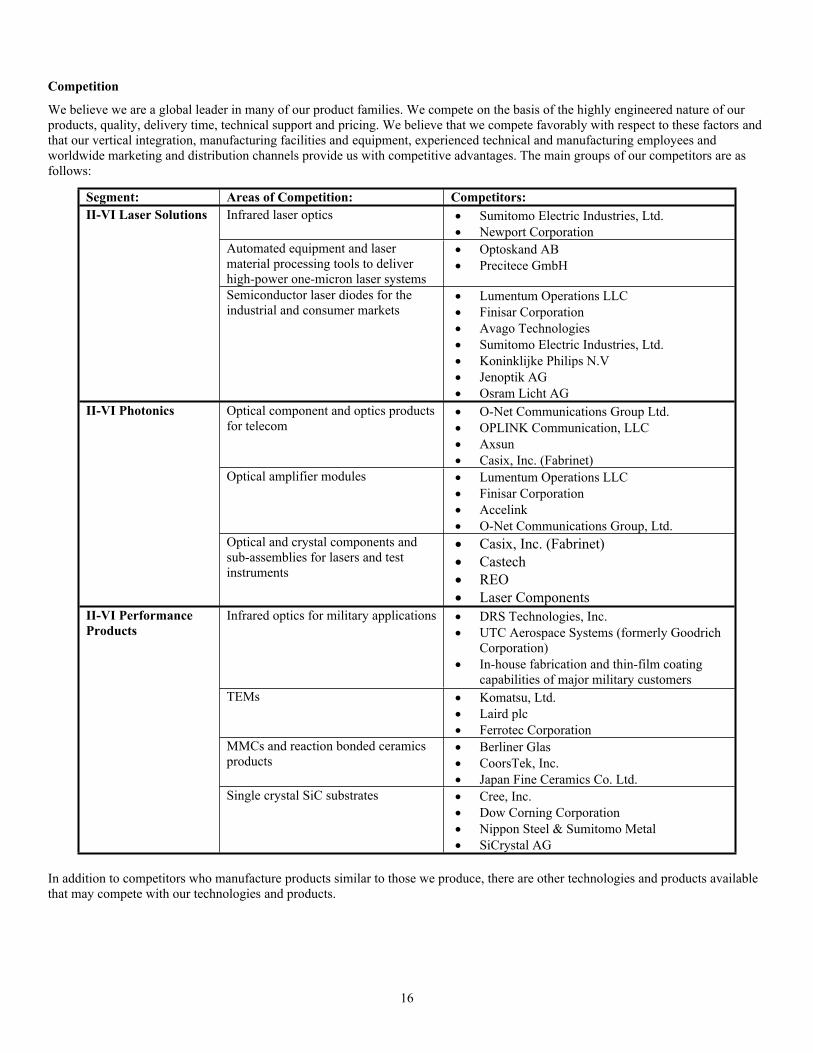
16
Competition
We believe we are a global leader in many of our product families. We compete on the basis of the highly engineered nature of our products, quality, delivery time, technical support and pricing. We believe that we compete favorably with respect to these factors and that our vertical integration, manufacturing facilities and equipment, experienced technical and manufacturing employees and worldwide marketing and distribution channels provide us with competitive advantages. The main groups of our competitors are as follows:
Segment: Areas of Competition: Competitors:Infrared laser optics Sumitomo Electric Industries, Ltd.
Newport CorporationAutomated equipment and laser material processing tools to deliver high-power one-micron laser systems
Optoskand AB Precitece GmbH
II-VI Laser Solutions
Semiconductor laser diodes for the industrial and consumer markets
Lumentum Operations LLC Finisar Corporation Avago Technologies Sumitomo Electric Industries, Ltd. Koninklijke Philips N.V Jenoptik AG Osram Licht AG
Optical component and optics products for telecom
O-Net Communications Group Ltd. OPLINK Communication, LLC Axsun Casix, Inc. (Fabrinet)
Optical amplifier modules Lumentum Operations LLC Finisar Corporation Accelink O-Net Communications Group, Ltd.
II-VI Photonics
Optical and crystal components and sub-assemblies for lasers and test instruments
Casix, Inc. (Fabrinet) Castech REO Laser Components
Infrared optics for military applications DRS Technologies, Inc. UTC Aerospace Systems (formerly Goodrich
Corporation) In-house fabrication and thin-film coating
capabilities of major military customersTEMs Komatsu, Ltd.
Laird plc Ferrotec Corporation
MMCs and reaction bonded ceramics products
Berliner Glas CoorsTek, Inc. Japan Fine Ceramics Co. Ltd.
II-VI Performance Products
Single crystal SiC substrates Cree, Inc. Dow Corning Corporation Nippon Steel & Sumitomo Metal SiCrystal AG
In addition to competitors who manufacture products similar to those we produce, there are other technologies and products available that may compete with our technologies and products.
9500_10Kc1.pdf August 30, 2016 pg 16

17
Bookings and Backlog
We define our bookings as customer orders received that are expected to be converted to revenues over the next twelve months. For long-term customer orders, to address the inherent uncertainty of orders that extend far into the future, the Company records only those orders which are expected to be converted into revenues within twelve months from the end of the reporting period. Bookings are adjusted if changes in customer demands or production schedules move a delivery beyond twelve months. For the year ended June 30, 2016, our bookings were approximately $875 million compared to bookings of approximately $762 million for the year ended June 30, 2015.
We define our backlog as bookings that have not been converted to revenues by the end of the reporting period. As of June 30, 2016, our backlog was approximately $290 million, compared to approximately $242 million at June 30, 2015.
Employees
As of June 30, 2016, we employed approximately 8,927 persons worldwide. Of these employees, approximately 892 were engaged in research, development and engineering, approximately 7,131 in direct production (of which approximately 858 are employees of Photop in China who work under contract manufacturing arrangements for customers of the Company) and the remaining balance of the Company’s employees work in sales and marketing, administration, finance and support services. Our production staff includes highly skilled optical craftsmen. We have a long-standing practice of encouraging active employee participation in areas of operations management. We believe our relations with our employees are good. We reward our employees with incentive compensation based on achievement of performance goals. There are approximately 124 employees located in the United States and the Philippines who are covered under collective bargaining agreements. The Company’s collective bargaining agreement in the Philippines expired in June 2016 and we are in the ordinary course of re-negotiating this agreement. The collective bargaining agreement covering certain U.S. based employees expires in January of 2021.
Trade Secrets, Patents and Trademarks
We rely on a combination of trade secrets, proprietary know-how, invention disclosures, patents and contractual provisions to help us develop and maintain our competitive position with respect to our products and manufacturing processes. We aggressively pursue process and product patents in certain areas of our businesses. We have entered into selective intellectual property licensing agreements. When faced with potential infringement of our proprietary information, we have in the past and will continue to assert and vigorously protect our intellectual property rights. We have confidentiality and noncompetition agreements with certain personnel. We require that all U.S. employees sign a confidentiality and noncompetition agreement upon their commencement of employment with us.
The processes and specialized equipment utilized in crystal growth, infrared materials fabrication and infrared optical coatings as developed by us are complex and difficult to duplicate. However, there can be no assurance that others will not develop or patent similar technology or that all aspects of our proprietary technology will be protected. Others have obtained patents covering a variety of infrared optical configurations and processes, and others could obtain patents covering technology similar to our technology. We may be required to obtain licenses under such patents, and there can be no assurance that we would be able to obtain such licenses, if required, on commercially reasonable terms, or that claims regarding rights to technology will not be asserted which may adversely affect our results of operations. In addition, our research and development contracts with agencies of the U.S. Government present a risk that project-specific technology could be disclosed to competitors as contract reporting requirements are fulfilled.
Availability of Information
Our Internet address is www.ii-vi.com. Information contained on our website is not part of, and should not be construed as being incorporated by reference into, this Annual Report on Form 10-K. We post the following reports on our website as soon as reasonably practical after they are electronically filed with or furnished to the Securities and Exchange Commission (the “SEC”): our Annual Reports on Form 10-K, our Quarterly Reports on Form 10-Q, our Current Reports on Form 8-K, and any amendments to those reports or statements filed or furnished pursuant to Section 13(a) or 15(d) of the Exchange Act. In addition, we post our proxy statements on Schedule 14A related to our annual shareholders’ meetings as well as reports filed by our directors, officers and ten-percent beneficial owners pursuant to Section 16 of the Exchange Act. In addition, all filings are available via the SEC’s website (www.sec.gov). We also make our corporate governance documents available on our website, including the Company’s Code of Business Conduct and Ethics, governance guidelines and the charters for various board committees. All such documents are located on the Investors page of our website and are available free of charge.
9500_10Kc1.pdf August 30, 2016 pg 17
18
Item 1A. RISK FACTORS
We caution our investors that our performance is subject to risks and uncertainties. The following material risk factors may cause our future results to differ materially from those projected in any forward-looking statement. You should carefully consider these factors, as well as the other information contained in this Annual Report on Form 10-K when evaluating an investment in our securities.
Our Future Success Depends on Continued International Sales
Sales to customers in countries other than the U.S. accounted for approximately 63%, 63% and 65% of revenues during the years ended June 30, 2016, 2015 and 2014, respectively. We anticipate that international sales will continue to account for a significant portion of our revenues for the foreseeable future. If we do not realize such international sales or if our international sales decrease substantially, we could suffer a material adverse effect on our business, results of operations and/or financial condition.
Our Competitive Position Depends on Our Ability to Develop New Products and Processes
To meet our strategic objectives, we must develop, manufacture and market new products and continue to update our existing products and processes to keep pace with market developments to address increasingly sophisticated customer requirements. Our success in developing and selling new and enhanced products and processes depends upon a variety of factors including strategic product selection, efficient completion of product design and development, timely implementation of manufacturing and assembly processes, effective sales and marketing, and successful product performance in the market.
The introduction by our competitors of products or processes using new developments better or faster than ours could render our efforts underway obsolete or unmarketable. We intend to continue to make significant investments in research and development to achieve our goals. There can be no assurance that we will be able to develop and introduce new products or enhancements to our existing products and processes in a manner which satisfies customer needs or achieves market acceptance. The failure to do so could have a material adverse effect on our ability to grow our business and maintain our competitive position.
Investments in Future Markets of Potential Significant Growth May Not Result in Expected Returns
We previously announced an investment program with the goal of gaining a greater share of end markets using semiconductor lasers, especially those used for 3D sensing. We cannot guarantee that our investments in capital and capabilities will be sufficient. The potential market may not materialize on the timeline anticipated or at all. We cannot be sure of the end market price. Our technology could fail to fulfill, completely or at all, our target customers’ finalized specifications. We cannot guarantee the end market customers’ acceptance of our technology. Further, we may be unable to fulfill the terms of our contracts with our target customers, which could result in penalties of a material nature, including consequential damages, loss of market share and loss of reputation.
We May Fail to Accurately Estimate Our Customers’ Demand
We make significant decisions based on our estimates of customer requirements. We use our estimates to determine the levels of business we seek and accept, production schedules, personnel needs and other resource requirements.
Customers may require rapid increases in production on short notice. We may not be able to purchase sufficient supplies or allocate sufficient manufacturing capacity to meet such increases in demand. Rapid customer ramp up and significant increases in demand may strain our resources or negatively affect our margins. Inability to satisfy customer demand in a timely manner may harm our reputation, reduce our other opportunities, damage our relationships with customers, reduce revenue growth, and/or incur contractual penalties.
Alternatively, downturns in the industries in which we compete may cause our customers to significantly reduce their demand. With respect to orders we initiate with our suppliers prior to a downturn to address our customer’s demand, certain suppliers may have required non-cancelable purchase commitments or advance payments, from us, and those obligations and commitments could reduce our ability to adjust our inventory or expense levels to declining market demands. Unexpected decline in customer demands can result in excess or obsolete inventory and result in additional charges. Because certain of our sales, research and development and internal manufacturing overhead expenses are relatively fixed, a reduction in customer demand may decrease our gross margins and operating income.
Global Economic Downturns May Adversely Affect Our Business, Operating Results and Financial Condition
Current and future conditions in the global economy have an inherent degree of uncertainty. As a result, it is difficult to estimate the level of growth or contraction for the global economy as a whole. It is even more difficult to estimate growth or contraction in various parts, sectors and regions of the economy, including industrial, military, optical communications, telecommunications, semiconductor, and medical and life science markets in which we participate. All aspects of our company forecast depend on estimates of growth or
9500_10Kc1.pdf August 30, 2016 pg 18

19
contraction in the markets we serve. Thus, prevailing global economic uncertainties render estimates of future income and expenditures very difficult to make.
Global economic downturns may affect industries in which our customers operate. These changes could include decreases in the rate of consumption or use of our customers’ products. Such conditions could have a material adverse effect on demand for our customers’ products, and in turn, on demand for our products.
Adverse changes may occur in the future as a result of declining or flat global or regional economic conditions, fluctuations in currency and commodity prices, wavering confidence, capital expenditure reductions, unemployment, decline in stock markets, contraction of credit availability or other factors affecting economic conditions. For example, factors that may affect our operating results include disruption in the credit and financial markets in the U.S., Europe and elsewhere, adverse effects of ongoing stagnation in the European economy, slowdown in the Chinese economy, reductions or limited growth in consumer spending or consumer credit, and other adverse economic conditions that may be specific to the Internet, e-commerce and payments industries.
These changes may negatively affect sales of products and increase exposure to losses from bad debt and commodity prices, the cost and availability of financing, and costs associated with manufacturing and distributing products. Any economic downturn could have a material adverse effect on our business, results of operations or financial condition.
Our Global Operations are Complex to Manage
We manufacture products in the United States, China, Singapore, Vietnam, the Philippines, Germany, and Switzerland, and through contract manufacturers in Thailand and China. We also maintain direct sales offices in Hong Kong, Japan, Germany, Switzerland, the U.K., Belgium, China, Singapore, Italy and South Korea. Our operations vary by location, are influenced by local customs, languages and work practices as well as different weather conditions, management styles, differences in education from country to country and the inability of management to always act in a timely manner. In addition, different issues may arise in different countries at the same time, further hampering the management’s ability to respond. Inability to respond to issues in our global operations could have a material adverse effect on our business, results of operations or financial condition.
We Have Entered into Supply Agreements which Commit Us to Supply Products on Specified Terms
We have supply agreements with some customers which require us to supply products and to allocate sufficient capacity to make these products. We have also agreed to pricing schedules and methodologies which could result in penalties if we fail to meet development, supply and quality commitments. Failure to do so may cause us to be unable to generate the amount of revenue or the level of profitability we expect from these arrangements. Our ability to realize a profit under some of these agreements will be subject to the level of customer demand, the cost of maintaining facilities and manufacturing capacity, and supply chain capability.
If we fail to fulfill our commitments under these supply agreements our business, after using all remedies available, financial conditions and results of operations may suffer a material adverse effect.
We Depend on Highly Complex Manufacturing Processes That Require Products from Limited Sources of Supply
Our operations are dependent upon a supply chain of difficult-to-make or difficult-to-refine products and materials. Some of our product inflow is subject to yield from growth or fabrication operations, and thus the quantities we may receive are not consistently predictable. Customers may also change the specification for a product that our suppliers cannot meet.
We also make products for which the Company is one of the world’s largest suppliers. We use high-quality, optical grade zinc selenide (ZnSe) in the production of many of our IR optical products. We are the leading producer of ZnSe for our internal use and for external sale. The production of ZnSe is a complex process requiring a highly controlled environment. A number of factors, including defective or contaminated materials, could adversely affect our ability to achieve acceptable manufacturing yields of high quality ZnSe. No proven external sources of ZnSe are currently available. Lack of adequate availability of high quality ZnSe could have a material adverse effect upon our business. There can be no assurance that we will not experience manufacturing yield inefficiencies which could have a material adverse effect on our business, results of operations or financial condition.
We produce Hydrogen Selenide gas which is used in our production of ZnSe. There are risks inherent in the production and handling of such material. Our lack of proper handling of Hydrogen Selenide could require us to curtail our production of Hydrogen Selenide. Hydrogen Selenide is available from only one outside source whose quantities and quality may be limited. The cost of purchasing such material is greater than the cost of internal production. As a result, the purchase of a substantial portion of such material from the outside source would increase our ZnSe production costs. Our potential inability to internally produce Hydrogen Selenide could have a material adverse effect on our business, results of operations or financial condition.
In addition, we produce and use other high purity and relatively uncommon materials and compounds to manufacture our products including, but not limited to, Zinc Sulfide (ZnS), Gallium Arsenide (GaAs), Yttrium Aluminum Garnet (YAG), Yttrium Lithium Fluoride (YLF), Calcium Fluoride (CaF2), Germanium (Ge), Selenium (Se), Telluride (Te), Bismuth Telluride (Bi2Te3) and Silicon
9500_10Kc1.pdf August 30, 2016 pg 19

20
Carbide (SiC). A significant failure of our internal production processes or our suppliers to deliver sufficient quantities of these necessary materials on a timely basis could have a material adverse effect on our business, results of operations or financial condition.
Our Global Operations Are Subject to Complex Legal and Regulatory Requirements
We manufacture products in the United States, China, Singapore, Vietnam, the Philippines, Germany, and Switzerland, and through contract manufacturers in Thailand and China. We also maintain direct sales offices in Hong Kong, Japan, Germany, Switzerland, the U.K., Belgium, China, Singapore, Italy and South Korea. Operations outside of the U.S. are subject to many legal and regulatory requirements, some of which are not aligned with others. These include tariffs, quotas, taxes and other market barriers, restrictions on the export or import of technology, potentially limited intellectual property protection, customs import and export requirements, anti-corruption and anti-bribery laws, foreign exchange controls and cash repatriation restrictions, foreign investment rules and regulations, data privacy requirements, anti-competition laws, employment and labor laws, pensions and social insurance, and environmental health, and safety laws and regulations.
Compliance with these laws and regulations can be onerous and expensive, and requirements differ among jurisdictions. New laws, changes in existing laws and abrogation of local regulations by national laws result in significant uncertainties in how they will be interpreted and enforced. Failure to comply with any of these foreign laws and regulations could have a material adverse effect on our business, results of operations or financial condition.
We May Encounter Substantial Competition
We may encounter substantial competition from other companies in the same market, including established companies with significant resources. Some of our competitors may have financial, technical, marketing or other capabilities that are more extensive than ours. They may be able to respond more quickly than we can to new or emerging technologies and other competitive pressures. We may not be able to compete successfully against our present or future competitors. Our failure to effectively compete could have a material adverse effect on our business, results of operations or financial condition.
Our Competitive Position May Require Significant Investments in Strategic Acquisitions
We continuously monitor the marketplace for strategic opportunities, and our business strategy includes expanding our product lines and markets through both internal product development and acquisitions. Consequently, we expect to continue to consider strategic acquisition of businesses, products or technologies complementary to our business. This may require significant investments of management time and financial resources. If market demand is outside our organic capabilities, if a strategic acquisition is required and we cannot identify one or execute on it, and/or if the financial investments do not result in a significant return on investment or the ability to serve our credit facility covenants due to inability to integrate the business, retain staff, or work with the customers, we could suffer a material adverse effect on our business, results of operations or financial condition.
Declines in the Operating Performance of One of Our Business Segments Could Result in an Impairment of the Segment’s Goodwill and Indefinite-Lived Intangible Assets
As of June 30, 2016, we had goodwill and indefinite-lived intangible assets of approximately $233.8 million and $14.1 million, respectively, on our Consolidated Balance Sheet. In accordance with applicable accounting guidance, we test our goodwill and indefinite-lived intangible assets for impairment on an annual basis or when an indication of possible impairment exists, to determine whether the carrying value of our assets is still supported by the fair value of the underlying business. To the extent that it is not, we are required to record an impairment charge to reduce the asset to fair value. A decline in the operating performance of any of our business segments could result in an impairment charge which could have a material adverse effect on our results of operations or financial condition.
There Are Limitations on the Protection of Our Intellectual Property
We rely on a combination of trade secret, patent, copyright and trademark laws combined with employee confidentiality, noncompetition and nondisclosure agreements to protect our intellectual property rights. There can be no assurance that the steps taken by us will be adequate to prevent misappropriation of our technology or intellectual property. Furthermore, there can be no assurance that third-parties will not assert infringement claims against us in the future.
Asserting our intellectual property rights or defending against third-party claims could involve substantial expense. In the event a third-party were successful in a claim that one of our processes infringed its proprietary rights, we could be required to pay substantial damages or royalties, or spend substantial amounts in order to obtain a license or modify processes so that they no longer infringe such proprietary rights. Any such events could have a material adverse effect on our business, results of operations or financial condition.
9500_10Kc1.pdf August 30, 2016 pg 20

21
We Are Subject to Governmental Import and Export Regulations
We are subject to the passage of and changes in the interpretation of regulation by U.S. government entities at the federal, state and local levels and non-U.S. agencies, including, but not limited to, the following:
We are required to comply with import laws and export control and economic sanctions laws, which may affect our transactions with certain customers, business partners and other persons, including dealings with or between our employees and subsidiaries. In certain circumstances, export control and economic sanctions regulations may prohibit the export of certain products, services and technologies. We may be required to obtain an export license before exporting a controlled item. Compliance with the import laws that apply to our businesses may restrict our access to, and may increase the cost of obtaining, certain products and could interrupt our supply of imported inventory.
Exported technologies necessary to develop and manufacture certain products are subject to U.S. export control laws and similar laws of other jurisdictions. We may be subject to adverse regulatory consequences, including government oversight of facilities and export transactions, monetary penalties and other sanctions for violations of these laws. In certain instances, these regulations may prohibit the Company from developing or manufacturing certain of its products for specific end applications outside the U.S.
Failure to comply with any of these laws and regulations could result in civil and criminal, monetary and non-monetary penalties, disruptions to our business, limitations on our ability to import and export products and services and damage to our reputation.
We Have Agreements with Government Entities
Our agreements relating to the sale of products to government entities may be subject to termination, reduction or modification in the event of changes in government requirements, reductions in federal spending and other factors. We are also subject to investigation and audit for compliance with the requirements of government contracts, including procurement integrity, export control, employment practices, the accuracy of records and the recording of costs. Failure to comply with these requirements might result in suspension of these contracts and suspension or debarment from government contracting or subcontracting.
We Use and Generate Hazardous Substances that Are Subject to Stringent Environmental Regulations
Hazardous substances used or generated in our research and manufacturing facilities are subject to stringent environmental regulation. We believe that our handling of such substances is in material compliance with applicable local, state and federal environmental, safety and health regulations at each operating location. We invest substantially in proper protective equipment, process controls and specialized training to minimize risks to employees, surrounding communities and the environment that could result from the presence and handling of such hazardous substances. We regularly conduct employee physical examinations and workplace monitoring regarding such substances. When exposure problems or potential exposure problems have been uncovered, corrective actions have been implemented and re-occurrence has been minimal or non-existent.
We have in place an emergency response plan with respect to our generation and use of the hazardous substance Hydrogen Selenide. Special attention has been given to all procedures pertaining to this gaseous material to minimize the chances of its accidental release into the atmosphere.
With respect to the manufacturing, use, storage and disposal of the low-level radioactive material Thorium Fluoride, our facilities and procedures have been inspected and licensed by the Nuclear Regulatory Commission. Thorium-bearing by-products are collected and shipped as solid waste to a government-approved low-level radioactive waste disposal site in Clive, Utah.
The generation, use, collection, storage and disposal of all other hazardous by-products, such as suspended solids containing heavy metals or airborne particulates, are believed by us to be in material compliance with regulations. We believe that we have obtained all of the permits and licenses required for operation of our business.
We do not carry environmental impairment insurance. And, although we do not know of any material environmental, safety or health problems in our properties or processes, there can be no assurance that problems will not develop in the future which could have a material adverse effect on our business, results of operations or financial condition.
We May Be Adversely Affected by Climate Change Regulations
In many of the countries in which we operate, government bodies are increasingly enacting legislation and regulations in response to potential impacts of climate change. These laws and regulations may be mandatory. They have the potential to impact our operations directly or indirectly as a result of required compliance by our customers or our supply chain. Inconsistency of regulations may also affect the costs of compliance with such laws and regulations. Assessments of the potential impact of future climate change legislation, regulation and international treaties and accords are uncertain, given the wide scope of potential regulatory change in countries in which we operate.
9500_10Kc1.pdf August 30, 2016 pg 21

22
We may incur increased capital expenditures resulting from required compliance with revised or new legislation or regulations, added costs to purchase or lower profits from sales of our products, allowances or credits under a “cap and trade” system, increased insurance premiums and deductibles as new actuarial tables are developed to reshape coverage, a change in competitive position relative to industry peers, and changes to profit or loss arising from increased or decreased demand for goods produced by us and indirectly, from changes in costs of goods sold.
Data Breach Incidents and Breakdown of Information and Communication Technologies Could Disrupt our Operations and Impact Our Financial Results
In the course of our business, we collect and store sensitive data, including intellectual property both proprietary and of our customers, as well as proprietary business information. We could be subject to service outages or breaches of security systems which may result in disruption, unauthorized access, misappropriation, or corruption of this information. Security breaches of our network or data including physical or electronic break-ins, vendor service outages, computer viruses, attacks by hackers or similar breaches can create system disruptions, shutdowns, or unauthorized disclosure of confidential information. Although we have not experienced an incident, if we are unable to prevent such security or privacy breaches, our operations would be disrupted or we could suffer legal claims, loss of reputation, financial loss, property damage, or regulatory penalties because of lost or misappropriated information.
Some Systems That Use our Products Are Complex in Design and May Contain Defects that Are Not Detected Until Deployed Which Could Increase Our Costs and Reduce Our Revenues
Some systems that use our products are inherently complex in design and require ongoing maintenance. Our customers may discover defects in our products after the products have been fully deployed and operated under peak stress conditions. In addition, some of our products are combined with products from other vendors which may contain defects. Should problems occur, it may be difficult to identify the source of the problem. If we are unable to correct defects or other problems, we could experience, among other things loss of customers, increased costs of product returns and warranty expenses, damage to our brand reputation, failure to attract new customers or achieve market acceptance, diversion of development and engineering resources, or legal action by our customers.
The occurrence of any one or more of the foregoing factors could have a material adverse effect on our business, results of operations or financial condition.
Significant Defense Spending Cuts and/or Reductions in Defense Programs Could Adversely Impact Our Business
Specific to the military business within our II-VI Laser Solutions and II-VI Performance Products segments, sales to customers in the defense industry totaled approximately 12% of revenues for the fiscal year ended June 30, 2016. These customers generally contract with a governmental entity, typically a U.S. governmental agency. Future reductions in defense spending could result from the current or future economic or political environment. For example, the ongoing sequestration of the defense budget could result in reductions in demand for defense-related products that we produce. Further, changes to existing defense procurement laws and regulations could adversely affect our results of operations. Most governmental programs are subject to funding approval and can be modified or terminated with no warning upon the determination of a legislative or administrative body. The loss of or failure to obtain certain contracts or the loss of a major government customer could have a material adverse effect on our business, results of operations or financial condition.
Changes in Tax Rates, Tax Liabilities or Tax Accounting Rules Could Affect Future Results
As a global company, we are subject to taxation in the U.S. and various other countries and jurisdictions. As such, we must exercise a level of judgment in determining our worldwide tax liabilities. Our future tax rates could be affected by changes in the composition of earnings in countries with differing tax rates or changes in tax laws. Changes in tax laws or tax rulings may have a significantly adverse impact on our effective tax rate. For example, proposals for fundamental U.S. international tax reform, if enacted, could have a significant adverse impact on our effective tax rate. In addition, we are subject to regular examination of our income tax returns by the Internal Revenue Service and other tax authorities. We regularly assess the likelihood of favorable or unfavorable outcomes resulting from these examinations to determine the adequacy of our provision for income taxes. Although we believe our tax estimates are reasonable, there can be no assurance that any final determination will not be materially different than the treatment reflected in our historical income tax provision and accruals, which could materially and adversely affect our business, results of operation or financial condition.
Our Success Depends on Our Ability to Retain Key Personnel
We are highly dependent upon the experience and continuing services of certain scientists, engineers, production and management personnel. Competition for the services of these personnel is intense. There can be no assurance that we will be able to retain or
9500_10Kc1.pdf August 30, 2016 pg 22

23
attract the personnel necessary for our success. The loss of the services of our key personnel could have a material adverse effect on our business, results of operations or financial condition.
Natural Disasters or Other Global or Regional Catastrophic Events Could Disrupt Our Operations and Adversely Affect Our Results
We may be exposed to business interruptions due to catastrophe, natural disaster, pandemic, terrorism or acts of war that are beyond our control. Disruptions to our facilities or systems, or to those of our key suppliers, could also interrupt operational processes and adversely impact our ability to manufacture our products and provide services and support to our customers. As a result, our business, results of operations or financial condition could be materially adversely affected.
A Significant Portion of Our Business is Dependent on Cyclical Industries
Our business is significantly dependent on the demand for products produced by end-users of industrial lasers and optical communication products. Many of these end-users are in industries that have historically experienced a highly cyclical demand for their products. As a result, demand for our products is subject to these cyclical fluctuations. Fluctuations in demand could have a material adverse effect on our business, results of operations or financial condition.
Increases in Commodity Prices May Adversely Affect Our Results of Operations and Financial Condition
We are exposed to a variety of market risks, including the effects of increases in commodity prices. Our businesses purchase, produce and sell high purity selenium and other raw materials based upon quoted market prices from minor metal exchanges. The negative impact from increases in commodity prices may not be recovered through our product sales which could have a material adverse effect on our net earnings and financial condition.
Regulations Related to Conflict Minerals Could Adversely Impact Our Business
The Dodd-Frank Wall Street Reform and Consumer Protection Act contain provisions to improve transparency and accountability concerning the supply of gold, columbite-tantalite (coltan), cassiterite and wolframite, including their derivatives, which are limited to tantalum, tin and tungsten, known as “conflict minerals,” originating from the Democratic Republic of Congo (DRC) and adjoining countries (collectively known as the "covered countries"). Pursuant to these rules, the SEC has adopted certain annual disclosure and reporting requirements for those companies that use conflict minerals in their products, regardless of whether such minerals were mined from the covered countries, compliance with which began in 2014. We could incur significant costs associated with complying with these disclosure requirements, including costs related to our due diligence efforts to determine the sources of any conflict minerals used in our products. These rules could adversely affect the sourcing, supply and pricing of materials we use in our products, particularly if there are only a limited number of suppliers offering conflict minerals that are from recycled or scrap sources, cannot be traced to a country of origin other than the covered countries, or cannot be traced to a source within the covered countries that does not finance or benefit armed groups in those countries. We cannot be sure that we will be able to obtain products from such suppliers in sufficient quantities or at competitive prices. Also, we may face reputational challenges if we determine that certain of our products contain conflict minerals originating from the covered countries and we cannot definitively determine whether the conflict minerals financed or otherwise benefited armed groups, or if we are unable to sufficiently verify the origins of all of the conflict minerals used in our products through the due diligence procedures we implement.
The Market Price of Our Common Stock Can Be Highly Volatile
Factors that could cause fluctuation in our stock price include, among other things, general economic and market conditions, actual or anticipated variations in operating results, changes in financial estimates by securities analysts, our inability to meet or exceed securities analysts’ estimates or expectations, conditions or trends in the industries in which our products are purchased, announcements by us or our competitors of significant acquisitions, strategic partnerships, divestitures, joint ventures or other strategic initiatives, capital commitments, additions or departures of key personnel and sales of our Common Stock.
Many of these factors are beyond our control. However, these factors could cause the market price of our Common Stock to decline, regardless of our actual operating performance.
Provisions in Our Articles of Incorporation and By-Laws May Limit the Price that Investors May be Willing to Pay in the Future for Shares of Our Common Stock
Our Articles of Incorporation and By-Laws contain provisions that could make us a less attractive target for a hostile takeover and could make more difficult or discourage a merger proposal, a tender offer or a proxy contest. Such provisions include:
9500_10Kc1.pdf August 30, 2016 pg 23

24
A requirement that shareholder-nominated director nominees be nominated in advance of the meeting at which directors are elected and that specific information be provided in connection with such nomination;
The ability of the board of directors to issue additional shares of Common Stock or preferred stock without shareholder approval; and
Certain provisions requiring supermajority approval (at least two-thirds of the votes cast by all shareholders entitled to vote thereon, voting together as a single class).
In addition, the Pennsylvania Business Corporation Law contains provisions that may have the effect of delaying or preventing a change in control of the Company. All of these provisions may limit the price that investors may be willing to pay for shares of our Common Stock.
Because We Do Not Currently Intend to Pay Dividends, Shareholders Will Benefit From an Investment in our Common Stock Only if it Appreciates in Value
We have never declared or paid any dividends on our Common Stock, and do not expect to pay cash dividends in the foreseeable future. We currently anticipate that we will retain any future earnings to support operations and to finance the development of our business. As a result, the success of an investment in our Common Stock will depend entirely upon future appreciation in its value. There is no guarantee that our Common Stock will maintain its value or appreciate in value.
Item 1B. UNRESOLVED STAFF COMMENTS
None.
9500_10Kc1.pdf August 30, 2016 pg 24

25
Item 2. PROPERTIES
Information regarding our principal U.S. properties at June 30, 2016 is set forth below:
Location Primary Use(s) Primary Business Segment(s) SquareFootage Ownership
Saxonburg, PA......................................... Manufacturing, Corporate Headquarters and Research and Development
II-VI Laser Solutions and II-VI Performance Products
252,000
Ownedand
LeasedWarren, NJ Manufacturing and
Research and Development II-VI Laser Solutions
151,000
Leased
Newark, DE ............................................. Manufacturing andResearch and Development
II-VI Performance Products
90,000
Leased
Temecula, CA.......................................... Manufacturing andResearch and Development
II-VI Performance Products
87,000
Leased
New Port Richey and Port Richey, FL .... Manufacturing andResearch and Development
II-VI Photonics and II-VI Performance Products
67,000
Owned
Dallas, TX................................................ Manufacturing andResearch and Development
II-VI Performance Products
67,000
Ownedand
LeasedMonroe, CT ............................................. Manufacturing and
Research and Development II-VI Performance Products
48,000
Leased
Pine Brook, NJ......................................... Manufacturing andResearch and Development
II-VI Performance Products
36,000
Leased
Santa Rosa, CA........................................ Manufacturing andResearch and Development
II-VI Photonics
33,000
Leased
Tustin, CA ............................................... Manufacturing andResearch and Development
II-VI Performance Products
31,000
Leased
Philadelphia, PA ...................................... Manufacturing andResearch and Development
II-VI Performance Products
30,000
Leased
Champaign, IL Manufacturing andResearch and Development
II-VI Laser Solutions
25,000
Leased
Woburn, MA............................................ Manufacturing andResearch and Development
II-VI Photonics
20,000
Leased
Newtown, CT .......................................... Manufacturing andResearch and Development
II-VI Performance Products
13,000
Leased
Tyngsboro, MA ....................................... Research and Development II-VI Laser Solutions 10,000 LeasedStarkville, MS.......................................... Manufacturing II-VI Performance Products 10,000 LeasedHorseheads, NY....................................... Research and Development II-VI Photonics 9,000 LeasedFlemington, NJ ........................................ Manufacturing and
Research and Development II-VI Photonics
5,000
Leased
San Jose, CA............................................ Research and Development II-VI Photonics 5,000 LeasedSunnyvale, CA......................................... Distribution
II-VI Photonics
2,300
Leased
9500_10Kc1.pdf August 30, 2016 pg 25

26
Information regarding our principal foreign properties at June 30, 2016 is set forth below:
Location Primary Use(s) Primary Business Segment(s) SquareFootage Ownership
China.......................................................
Manufacturing, Research and Development, and Distribution
II-VI Laser Solutions, II-VI Photonics and II-VI Performance Products
1,137,000
Leased
Philippines .............................................. Manufacturing
II-VI Laser Solutions and II-VI Performance Products
314,000
Leased
Vietnam .................................................. Manufacturing
II-VI Photonics and II-VI Performance Products
207,000
Leased
Switzerland ............................................. Manufacturing, Research and Development, and Distribution
II-VI Laser Solutions
134,000
Leased
Germany .................................................
Manufacturing and Distribution
II-VI Laser Solutions, II-VI Photonics and II-VI Performance Products
78,000
Owned and
LeasedSingapore ................................................ Manufacturing II-VI Laser Solutions 35,000 LeasedJapan .......................................................
Distribution
II-VI Laser Solutions, II-VI Photonics and II-VI Performance Products
5,000
Leased
Taiwan Distribution II-VI Laser Solutions 4,000 Leased
Belgium .................................................. Distribution II-VI Laser Solutions 3,000 LeasedItaly .........................................................
Distribution
II-VI Laser Solutions and II-VI Photonics
2,000
Leased
South Korea ............................................ Distribution II-VI Laser Solutions 2,000 LeasedUnited Kingdom .....................................
Distribution
II-VI Laser Solutions and II-VI Photonics
1,500
Leased
The square footage listed for each of the above properties represents facility square footage, except in the case of the Philippines location, which includes land.
Item 3. LEGAL PROCEEDINGS
The Company and its subsidiaries are involved in various claims and lawsuits incidental to its business. The resolution of each of these matters is subject to various uncertainties, and it is possible that these matters may be resolved unfavorably to the Company. Management believes, after consulting with legal counsel, that the ultimate liabilities, if any, resulting from such legal proceedings will not materially affect the Company’s financial condition, liquidity or results of operation.
Item 4. MINE SAFETY DISCLOSURES
Not applicable.
EXECUTIVE OFFICERS OF THE REGISTRANT
The executive officers of the Company and their respective ages and positions as of June 30, 2016 are set forth below. Each executive officer listed has been appointed by the Board of Directors to serve until removed or until such person’s successor is appointed and qualified. Name Age PositionFrancis J. Kramer ........................................................................................ 67 Chairman, Chief Executive Officer and DirectorVincent D. Mattera, Jr. ................................................................................ 60 President and DirectorMary Jane Raymond ................................................................................... 56 Chief Financial Officer and TreasurerGary A. Kapusta.......................................................................................... 56 Chief Operating OfficerGiovanni Barbarossa ................................................................................... 56 President II-VI Laser Solutions and Chief
Technology OfficerDavid G. Wagner ........................................................................................ 53 Vice President, Human ResourcesWalter R. Bashaw II .................................................................................... 51 Interim General Counsel and Secretary
9500_10Kc1.pdf August 30, 2016 pg 26

27
Francis J. Kramer joined II-VI in 1983, served as its President from 1985 to 2014, its Chief Executive Officer since 2007, and its Chairman and CEO from 2014 to 2016. Mr. Kramer will retire as the Company’s Chief Executive Officer effective September 1, 2016 and will serve as the Company’s Chairman of the Board of Directors. Mr. Kramer holds a B.S. degree in Industrial Engineering from the University of Pittsburgh and an M.S. degree in Industrial Administration from Purdue University. Mr. Kramer has served as director of Barnes Group Inc., a publicly traded aerospace and industrial manufacturing company (NYSE: B), since 2012. Mr. Kramer provides our Board and the Company with guidance on our growth strategy, in particular on the profitable and sustainable execution of the strategy to achieve sustainable competitive advantage. He contributes considerable business development experience, having completed 20 acquisitions in 20 years adding nearly $700 million of revenue and significant operations experience, relevant to our vertical integration strategy and globalization.
Vincent D. Mattera, Jr. joined II-VI in 2004, and was recently named the Company’s Chief Executive Officer effective September 1, 2016. Dr. Mattera has been serving in the role of President since 2014 and Chief Operating Office since 2013. Prior to that time, he served in several executive capacities. Dr. Mattera joined II-VI following a 20 year career at Agere Systems, Lucent Technologies, and AT&T Bell Laboratories. Dr. Mattera previously served as a non-employee director of the Company from 2000 through 2002. Dr. Mattera holds B.S. and Ph.D. degrees in Chemistry from the University of Rhode Island and Brown University, respectively.
Mary Jane Raymond has been Chief Financial Officer and Treasurer of the Company since March 2014. Previously, Ms. Raymond was Executive Vice President and Chief Financial Officer of Hudson Global, Inc. (NASDAQ: HSON) from 2005 to 2013. Ms. Raymond was the Chief Risk Officer and Vice President and Corporate Controller at Dun and Bradstreet, Inc. from 2002 to 2005. Additionally, she was the Vice President, Merger Integration at Lucent Technologies, Inc. from 1997 to 2002 and held several management positions at Cummins Engine Company from 1988 to 1997. Ms. Raymond holds a B.A. degree in Public Management from St. Joseph’s University, and an MBA from Stanford University.
Gary A. Kapusta joined II-VI in February 2016 serving as Chief Operating Officer. Prior to his employment with the Company, Mr. Kapusta served in various roles at Coca-Cola, including as President & Chief Executive Officer, Coca-Cola Bottlers’ Sales & Services L.L.C., President, Customer Business Solutions and Vice President, Procurement Transformation, Coca-Cola Refreshments. He joined Coca-Cola following a 19 year career at Agere Systems, Lucent Technologies, and AT&T. Mr. Kapusta graduated from University of Pittsburgh with B.S. and M.S. degrees in Industrial Engineering and an M.B.A from Lehigh University.
Giovanni Barbarossa joined II-VI in 2012 and has been the President, Laser Solutions Segment since 2014 and the Chief Technology Officer since 2012. Dr. Barbarossa was employed at Avanex Corporation from 2000 through 2009, serving in various executive positions in product development and general management, ultimately serving as President and Chief Executive Officer. When Avanex merged with Bookham Technology, forming Oclaro, Dr. Barbarossa became a member of the Board of Directors of Oclaro and served as such from 2009 to 2011. Previously, he had management responsibilities at British Telecom, AT&T Bell Labs, Lucent Technologies, and Hewlett-Packard. Dr. Barbarossa graduated from the University of Bari, Italy with a B.S. in Electrical Engineering and a Ph.D. in Photonics from the University of Glasgow, U.K.
David G. Wagner has been employed by the Company since 2008 and has been the Vice President, Human Resources since 2011 Prior to his employment with the Company, Mr. Wagner was employed with Owens Corning (NYSE: OC) from 1985-2008, serving in various human resource management positions, ultimately becoming the Vice President, Human Resources for Owens Corning’s global sales forces. Mr. Wagner graduated with a B.S. degree in Human Resources Management from Juniata College in 1985.
Walter R. Bashaw II has been engaged by the Company since December 2015 to act as its Interim General Counsel. Mr. Bashaw is also a Managing Shareholder and Director of the law firm of Sherrard, German & Kelly, P.C. in Pittsburgh, Pennsylvania, where he has practiced law since 1993. His role as Interim General Counsel to the Company is pursuant to a secondment arrangement between the Company and the Sherrard, German & Kelly, P.C. law firm. Mr. Bashaw graduated from Pennsylvania State University with a B.S. degree in Logistics and a J.D. from the University of Pittsburgh College of Law.
9500_10Kc1.pdf August 30, 2016 pg 27

28
PART II
Item 5. MARKET FOR REGISTRANT’S COMMON EQUITY, RELATED STOCKHOLDER MATTERS AND ISSUER PURCHASES OF EQUITY SECURITIES
The Company’s Common Stock is traded on the NASDAQ Global Select Market (“NASDAQ”) under the symbol “IIVI.” The following table sets forth the range of high and low trading prices per share of the Company’s Common Stock for the fiscal periods indicated, as reported by NASDAQ.
High Low Fiscal 2016
First Quarter $ 19.30 $ 15.04 Second Quarter $ 19.46 $ 15.69 Third Quarter $ 22.18 $ 16.09 Fourth Quarter $ 23.39 $ 17.91
High Low Fiscal 2015
First Quarter $ 14.75 $ 11.60 Second Quarter $ 14.45 $ 10.78 Third Quarter $ 18.70 $ 12.55 Fourth Quarter $ 19.64 $ 17.20
On August 19, 2016, the last reported sale price for the Company’s Common Stock was $21.67 per share. As of such date, there were approximately 1,236 holders of record of our Common Stock. The Company historically has not paid cash dividends and does not presently anticipate paying cash dividends in the future.
ISSUER PURCHASES OF EQUITY SECURITIES
In August 2014, the Board of Directors authorized the Company to purchase up to $50.0 million of its Common Stock. The repurchase program calls for shares to be purchased in the open market or in private transactions from time to time. Shares purchased by the Company are retained as treasury stock and available for general corporate purposes. During the fiscal year ended June 30, 2016 the Company purchased 380,538 shares of its Common Stock pursuant to the repurchase program for approximately $6.3 million. Since inception of the Plan, the Company has repurchased 1,316,587 shares of its Common Stock for approximately $19.0 million.
The following table provides information with respect to purchases of the Company’s equity securities during the quarter ended June 30, 2016.
Total Number of Dollar Value of Shares Purchased Shares That May as Part of Publicly Yet be Purchased
Total Number of Average Price Paid Announced Plans or Under the Plan
or
Period Shares
Purchased Per Share Programs (a) Program
April 1, 2016 to April 30, 2016 - $ - - $ 30,906,904 May 1, 2016 to May 31, 2016 1,189 (1) $ 19.20 - $ 30,906,904 June 1, 2016 to June 30, 2016 - $ - - $ 30,906,904
(1) Includes 1,189 shares of our Common Stock transferred to the Company from employees in satisfaction of minimum tax withholding obligations associated with the vesting of restricted share awards.
The information incorporated by reference in Item 12 of this Annual Report on Form 10-K from our 2016 Proxy Statement under the heading “Equity Compensation Plan Information” is hereby also incorporated by reference into this Item 5.
9500_10Kc1.pdf August 30, 2016 pg 28

29
PERFORMANCE GRAPH
The following graph compares cumulative total shareholder return on the Company’s Common Stock with the cumulative total shareholder return of the Nasdaq Composite Index and with a peer group of companies constructed by the Company for the period from June 30, 2011, through June 30, 2016. The Company’s peer group includes Cabot Microelectronics Corporation, Franklin Electric Co., Inc., MKS Instruments, Inc., Rofin-Sinar Technologies, Inc. and Silicon Laboratories.
6/11 6/12 6/13 6/14 6/15 6/16$0
$20
$40
$60
$80
$100
$120
$140
$160
$180
$200
II-VI Incorporated NASDAQ Composite Peer Group
COMPARISON OF 5 YEAR CUMULATIVE TOTAL RETURN*Among II-VI Incorporated, the NASDAQ Composite Index, and a Peer Group
*$100 invested on 6/30/11 in stock or index, including reinvestment of dividends.Fiscal year ending June 30.
9500_10Kc1.pdf August 30, 2016 pg 29
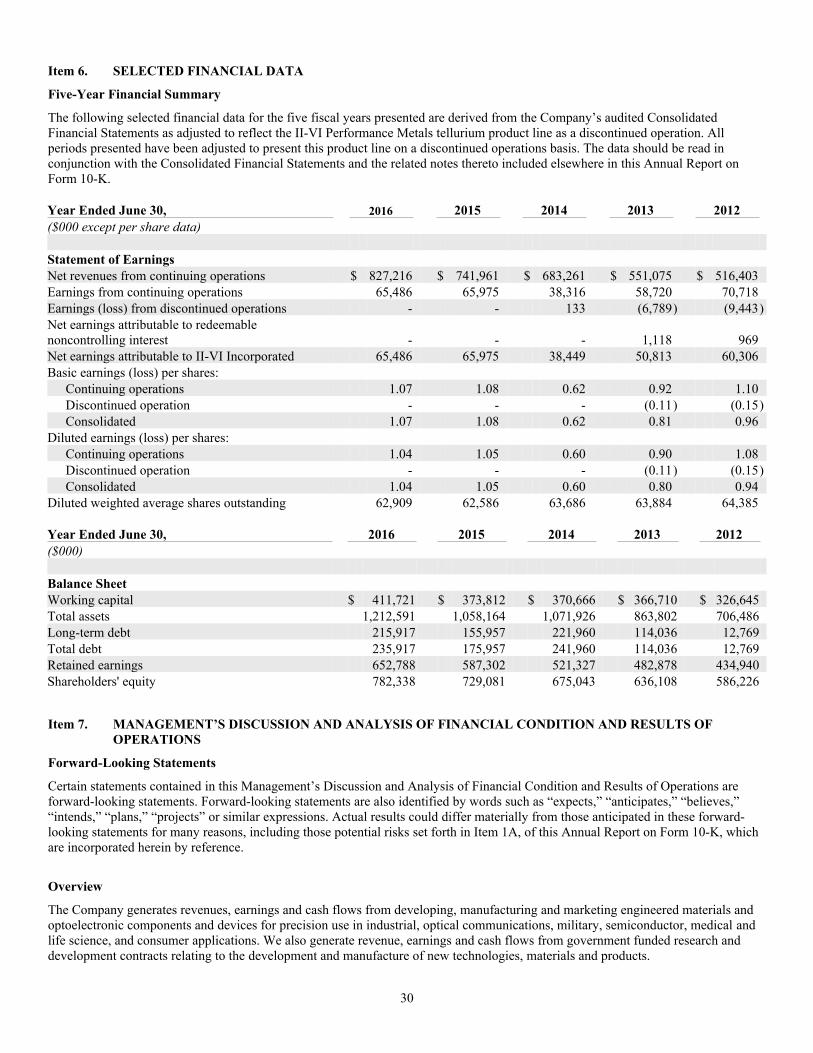
30
Item 6. SELECTED FINANCIAL DATA
Five-Year Financial Summary
The following selected financial data for the five fiscal years presented are derived from the Company’s audited Consolidated Financial Statements as adjusted to reflect the II-VI Performance Metals tellurium product line as a discontinued operation. All periods presented have been adjusted to present this product line on a discontinued operations basis. The data should be read in conjunction with the Consolidated Financial Statements and the related notes thereto included elsewhere in this Annual Report on Form 10-K. Year Ended June 30, 2016 2015 2014 2013 2012 ($000 except per share data) Statement of Earnings Net revenues from continuing operations $ 827,216 $ 741,961 $ 683,261 $ 551,075 $ 516,403 Earnings from continuing operations 65,486 65,975 38,316 58,720 70,718 Earnings (loss) from discontinued operations - - 133 (6,789) (9,443)Net earnings attributable to redeemable noncontrolling interest - - - 1,118 969 Net earnings attributable to II-VI Incorporated 65,486 65,975 38,449 50,813 60,306 Basic earnings (loss) per shares:
Continuing operations 1.07 1.08 0.62 0.92 1.10 Discontinued operation - - - (0.11) (0.15)Consolidated 1.07 1.08 0.62 0.81 0.96
Diluted earnings (loss) per shares: Continuing operations 1.04 1.05 0.60 0.90 1.08 Discontinued operation - - - (0.11) (0.15)Consolidated 1.04 1.05 0.60 0.80 0.94
Diluted weighted average shares outstanding 62,909 62,586 63,686 63,884 64,385
Year Ended June 30, 2016 2015 2014 2013 2012 ($000) Balance Sheet Working capital $ 411,721 $ 373,812 $ 370,666 $ 366,710 $ 326,645 Total assets 1,212,591 1,058,164 1,071,926 863,802 706,486 Long-term debt 215,917 155,957 221,960 114,036 12,769 Total debt 235,917 175,957 241,960 114,036 12,769 Retained earnings 652,788 587,302 521,327 482,878 434,940 Shareholders' equity 782,338 729,081 675,043 636,108 586,226
Item 7. MANAGEMENT’S DISCUSSION AND ANALYSIS OF FINANCIAL CONDITION AND RESULTS OF OPERATIONS
Forward-Looking Statements
Certain statements contained in this Management’s Discussion and Analysis of Financial Condition and Results of Operations are forward-looking statements. Forward-looking statements are also identified by words such as “expects,” “anticipates,” “believes,” “intends,” “plans,” “projects” or similar expressions. Actual results could differ materially from those anticipated in these forward-looking statements for many reasons, including those potential risks set forth in Item 1A, of this Annual Report on Form 10-K, which are incorporated herein by reference.
Overview
The Company generates revenues, earnings and cash flows from developing, manufacturing and marketing engineered materials and optoelectronic components and devices for precision use in industrial, optical communications, military, semiconductor, medical and life science, and consumer applications. We also generate revenue, earnings and cash flows from government funded research and development contracts relating to the development and manufacture of new technologies, materials and products.
9500_10Kc1.pdf August 30, 2016 pg 30

31
Our customer base includes OEMs, laser end-users, system integrators of high-power lasers, manufacturers of equipment and devices for the industrial, optical communications, military, semiconductor, medical and life science markets, consumer, U.S. government prime contractors, various U.S. Government agencies and thermoelectric integrators.
Critical Accounting Estimates
The preparation of financial statements and related disclosures in conformity with accounting principles generally accepted in the United States of America (“U.S. GAAP”) and the Company’s discussion and analysis of its financial condition and results of operations requires the Company’s management to make judgments, assumptions and estimates that affect the amounts reported in its Consolidated Financial Statements and accompanying notes. Note 1 of the Notes to our Consolidated Financial Statements contained in Item 8 of this Annual Report on Form 10-K describes the significant accounting policies and accounting methods used in the preparation of the Company’s Consolidated Financial Statements. Management bases its estimates on historical experience and on various other assumptions that it believes to be reasonable under the circumstances, the results of which form the basis for making judgments about the carrying values of assets and liabilities. Actual results may differ from these estimates.
Management believes the Company’s critical accounting estimates are those related to revenue recognition, allowance for doubtful accounts, warranty reserves, inventory valuation, business combinations, valuation of long-lived assets including acquired intangibles and goodwill, accrual of bonus and profit sharing estimates, accrual of income tax liability estimates and accounting for share-based compensation. Management believes these estimates to be critical because they are both important to the portrayal of the Company’s financial condition and results of operations, and they require management to make judgments and estimates about matters that are inherently uncertain.
Management has discussed the development and selection of these critical accounting estimates with the Audit Committee of the Board of Directors and the Audit Committee has reviewed the related disclosure. In addition, there are other items within our financial statements that require estimation, but are not deemed critical as described above. Changes in estimates used in these and other items could have a material impact on the financial statements.
Revenues for product shipments are realizable when we have persuasive evidence of a sales arrangement, the product has been shipped or delivered, the sales price is fixed or determinable and collectability is reasonably assured. Title and risk of loss passes from the Company to its customer at the time of shipment in most cases, with the exception of certain customers for whom customer’s title does not pass and revenue is not recognized until the customer has received the product at its physical location.
The Company’s revenue recognition policy is consistently applied across the Company’s segments, product lines and geographical locations. Further for the periods covered herein, we did not have post shipment obligations such as training or installation, customer acceptance provisions, credits and discounts, rebates and price protection or other similar privileges. Our distributors and agents are not granted price protection. Our distributors and agents, who comprise less than 10% of consolidated revenue, have no additional product return rights beyond the right to return defective products covered by our warranty policy. We believe our revenue recognition practices are consistent with Staff Accounting Bulletin (“SAB”) 104 and that we have adequately considered the requirements of Accounting Standards Codification (“ASC”) 605 Revenue Recognition. Revenues generated from transactions other than product shipments are contract-related and have historically accounted for less than 2% of the Company’s consolidated revenues.
The Company establishes an allowance for doubtful accounts based on historical experience and believes the collection of revenues, net of this reserve, is reasonably assured. The allowance for doubtful accounts is an estimate for potential non-collection of accounts receivable based on historical experience. The Company did not experience a non-collection of accounts receivable materially affecting its financial condition or results of operations as of and for each of the fiscal years ended June 30, 2016, 2015 and 2014. If the financial condition of the Company’s customers were to deteriorate, causing an impairment of their ability to make payments, additional provisions for bad debts could be required in future periods. The Company’s allowance for doubtful accounts reserve estimates have historically been proven to be materially correct based upon actual charges incurred.
The Company records a warranty reserve as a charge against earnings based on a historical percentage of revenues utilizing actual returns over a period that approximates historical warranty experience. If actual returns in the future are not consistent with the historical data used to calculate these estimates, additional warranty reserves could be required. The Company’s warranty reserve estimates have historically been proven to be materially correct based upon actual charges incurred.
The Company records an inventory reserve as a charge against earnings for all products on hand for more than twelve to twenty-four months, depending on the products that have not been sold to customers or cannot be further manufactured for sale to alternative customers. An additional reserve is recorded for products on hand that are in excess of product sold to customers over the same periods noted above. If actual market conditions are less favorable than projected, additional inventory reserves may be required. The Company’s inventory reserve estimates have historically been proven to be materially correct based upon actual write-offs incurred.
9500_10Kc1.pdf August 30, 2016 pg 31
32
The Company accounts for business acquisitions by establishing the acquisition-date fair value as the measurement for all assets acquired and liabilities assumed. Certain provisions of U.S. GAAP prescribe, among other things, the determination of acquisition-date fair value of consideration paid in a business combination (including contingent consideration) and the exclusion of transaction and acquisition-related restructuring costs from acquisition accounting.
The Company tests goodwill and indefinite-lived intangible assets on an annual basis for impairment or when events or changes in circumstances indicate that goodwill or indefinite-lived intangible assets might be impaired. Other intangible assets are amortized over their estimated useful lives. The determination of the estimated useful lives of other intangible assets and whether goodwill or indefinite-lived intangibles are impaired requires us to make judgments based upon long-term projections of future performance. Estimates of fair value are based on our projection of revenues, operating costs and cash flows of each reporting unit considering historical and anticipated results and general economic and market conditions. The fair values of the reporting units are determined using a discounted cash flow analysis based on historical and projected financial information as well as market analysis. The annual goodwill impairment analysis considers the financial projections of the reporting unit based on our most recently completed long-term strategic planning processes and also considers the current financial performance compared to our prior projections of the reporting unit. Changes in our internal structuring, financial performance, judgments and projections could result in an impairment of goodwill or indefinite-lived intangible assets.
The Company has the option to perform a qualitative assessment of goodwill prior to completing the two-step process described above to determine whether it is more likely than not that the fair value of a reporting unit is less than its carrying amount, including goodwill and other intangible assets. If the Company concludes that this is the case, it must perform the two-step process. Otherwise, the Company will forego the two-step process and does not need to perform any further testing.
As a result of the purchase price allocations from our acquisitions, and due to our decentralized structure, our goodwill is included in multiple reporting units which are the same as the Company’s operating segments. Due to the cyclical nature of our business, and the other factors described in the section on Risk Factors set forth in Item 1A, of this Annual Report on Form 10-K, the profitability of our individual reporting units may periodically suffer from downturns in customer demand, operational challenges and other factors. These factors may have a relatively more pronounced impact on the individual reporting units as compared to the Company as a whole, and might adversely affect the fair value of the individual reporting units. If material adverse conditions occur that impact one or more of our reporting units, our determination of future fair value may not support the carrying amount of one or more of our reporting units, and the related goodwill would need to be impaired.
Based upon our annual quantitative goodwill and indefinite-lived intangible assets impairment tests, the Company did not record any impairments of goodwill or indefinite-lived intangible assets for the fiscal year ended June 30, 2016.
The Company records certain bonus and profit sharing estimates as a charge against earnings. These estimates are adjusted to actual based on final results of operations achieved during the fiscal year. Certain partial bonus amounts are paid quarterly based on interim company performance, and the remainder is paid after the fiscal year end. Other bonuses are paid annually.
The Company prepares and files tax returns based on its interpretation of tax laws and regulations and records estimates based on these judgments and interpretations. In the normal course of business, the Company’s tax returns are subject to examination by various taxing authorities, which may result in future tax, interest and penalty assessments by these authorities. Inherent uncertainties exist in estimates of many tax positions due to changes in tax law resulting from legislation, regulation and/or as concluded through the various jurisdictions’ tax court systems. The Company recognizes the tax benefit from an uncertain tax position only if it is more likely than not that the tax position will be sustained on examination by the taxing authorities, based on the technical merits of the position. The tax benefits recognized in the financial statements from such a position are measured based on the largest benefit that has a greater than 50% likelihood of being realized upon ultimate resolution. The amount of unrecognized tax benefits is adjusted for changes in facts and circumstances. For example, adjustments could result from significant amendments to existing tax law and the issuance of regulations or interpretations by the taxing authorities, new information obtained during a tax examination, or resolution of an examination. The Company believes that its estimates for uncertain tax positions are appropriate and sufficient to pay assessments that may result from examinations of its tax returns. The Company recognizes both accrued interest and penalties related to unrecognized tax benefits in income tax expense.
The Company has recorded valuation allowances against certain of its deferred tax assets, primarily those that have been generated from net operating losses in certain foreign taxing jurisdictions and acquired U.S. carryforwards. The Company adopted an accounting policy to apply acquired deferred tax liabilities to pre-existing deferred tax assets before evaluating the need for a valuation allowance for acquired deferred tax assets. During fiscal year 2016, the Company recorded a $36.2 million valuation allowance as part of its purchase accounting. In evaluating whether the Company would more likely than not recover these deferred tax assets, it has not assumed any future taxable income or tax planning strategies in the jurisdictions associated with these carry-forwards where history does not support such an assumption. Implementation of tax planning strategies to recover these deferred tax assets or future income
9500_10Kc1.pdf August 30, 2016 pg 32
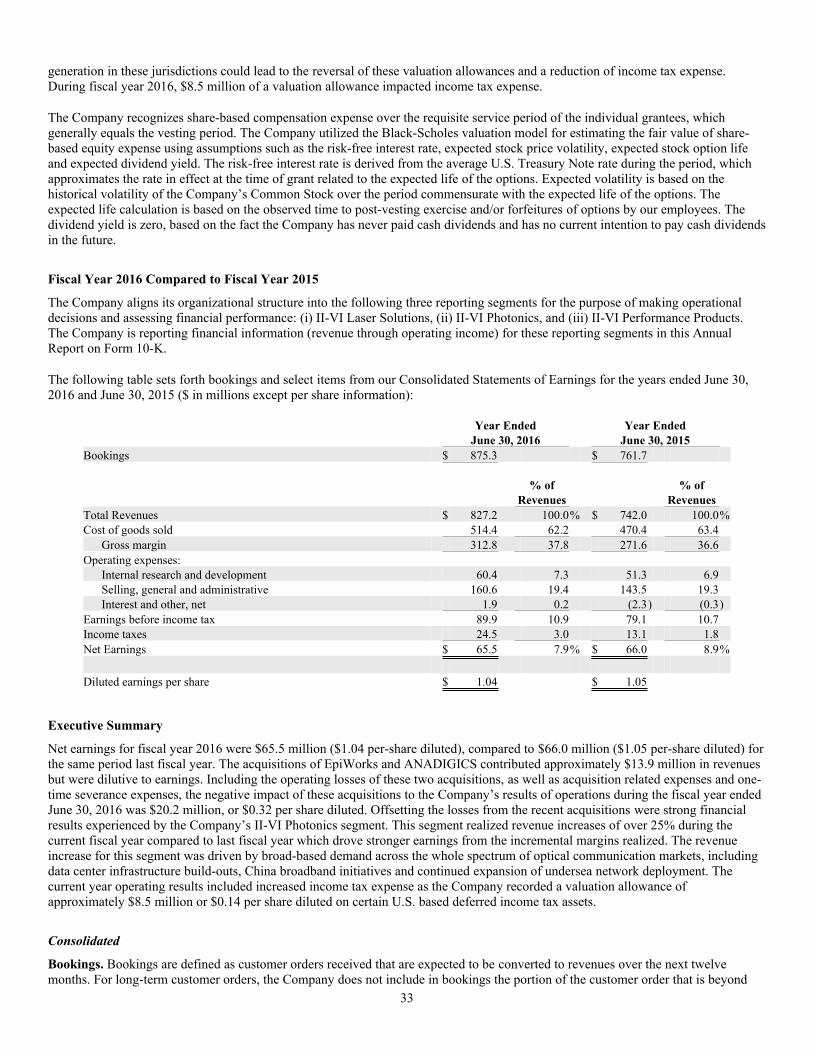
33
generation in these jurisdictions could lead to the reversal of these valuation allowances and a reduction of income tax expense. During fiscal year 2016, $8.5 million of a valuation allowance impacted income tax expense.
The Company recognizes share-based compensation expense over the requisite service period of the individual grantees, which generally equals the vesting period. The Company utilized the Black-Scholes valuation model for estimating the fair value of share-based equity expense using assumptions such as the risk-free interest rate, expected stock price volatility, expected stock option life and expected dividend yield. The risk-free interest rate is derived from the average U.S. Treasury Note rate during the period, which approximates the rate in effect at the time of grant related to the expected life of the options. Expected volatility is based on the historical volatility of the Company’s Common Stock over the period commensurate with the expected life of the options. The expected life calculation is based on the observed time to post-vesting exercise and/or forfeitures of options by our employees. The dividend yield is zero, based on the fact the Company has never paid cash dividends and has no current intention to pay cash dividends in the future.
Fiscal Year 2016 Compared to Fiscal Year 2015
The Company aligns its organizational structure into the following three reporting segments for the purpose of making operational decisions and assessing financial performance: (i) II-VI Laser Solutions, (ii) II-VI Photonics, and (iii) II-VI Performance Products. The Company is reporting financial information (revenue through operating income) for these reporting segments in this Annual Report on Form 10-K.
The following table sets forth bookings and select items from our Consolidated Statements of Earnings for the years ended June 30, 2016 and June 30, 2015 ($ in millions except per share information):
Year Ended Year Ended June 30, 2016 June 30, 2015 Bookings $ 875.3 $ 761.7 % of % of Revenues Revenues Total Revenues $ 827.2 100.0% $ 742.0 100.0%Cost of goods sold 514.4 62.2 470.4 63.4
Gross margin 312.8 37.8 271.6 36.6 Operating expenses:
Internal research and development 60.4 7.3 51.3 6.9 Selling, general and administrative 160.6 19.4 143.5 19.3 Interest and other, net 1.9 0.2 (2.3) (0.3)
Earnings before income tax 89.9 10.9 79.1 10.7 Income taxes 24.5 3.0 13.1 1.8 Net Earnings $ 65.5 7.9% $ 66.0 8.9% Diluted earnings per share $ 1.04 $ 1.05
Executive Summary
Net earnings for fiscal year 2016 were $65.5 million ($1.04 per-share diluted), compared to $66.0 million ($1.05 per-share diluted) for the same period last fiscal year. The acquisitions of EpiWorks and ANADIGICS contributed approximately $13.9 million in revenues but were dilutive to earnings. Including the operating losses of these two acquisitions, as well as acquisition related expenses and one-time severance expenses, the negative impact of these acquisitions to the Company’s results of operations during the fiscal year ended June 30, 2016 was $20.2 million, or $0.32 per share diluted. Offsetting the losses from the recent acquisitions were strong financial results experienced by the Company’s II-VI Photonics segment. This segment realized revenue increases of over 25% during the current fiscal year compared to last fiscal year which drove stronger earnings from the incremental margins realized. The revenue increase for this segment was driven by broad-based demand across the whole spectrum of optical communication markets, including data center infrastructure build-outs, China broadband initiatives and continued expansion of undersea network deployment. The current year operating results included increased income tax expense as the Company recorded a valuation allowance of approximately $8.5 million or $0.14 per share diluted on certain U.S. based deferred income tax assets.
Consolidated
Bookings. Bookings are defined as customer orders received that are expected to be converted to revenues over the next twelve months. For long-term customer orders, the Company does not include in bookings the portion of the customer order that is beyond
9500_10Kc1.pdf August 30, 2016 pg 33

34
twelve months, due to the inherent uncertainty of such an order that far out in the future. Bookings for the year ended June 30, 2016 increased 15% to $875.3 million, compared to $761.7 million for the same period last fiscal year. All of the Company’s operating segments experienced stronger booking volumes compared to last year. The increase in bookings was primarily lead by II-VI Photonics which realized increased bookings of $89.3 million or 32% over the prior fiscal year. This segment has continued to experience strong orders from the China broadband buildout program as well as increased demand for 100G metro deployments in the United States and continued demand for products that serve the data center expansion.
Revenues. Revenues for the year ended June 30, 2016 increased 11% to $827.2 million, compared to $742.0 million for the prior fiscal year. The increase in revenues for the year ended June 30, 2016 was driven by optical and data communication markets continuing to undergo a cycle of investment and expansion. The Company’s II-VI Photonics segment has capitalized on these markets dynamics and realized increased revenues of $65.1 million for the current fiscal year compared to last fiscal year.
Gross margin. Gross margin for the year ended June 30, 2016 was $312.8 million, or 37.8%, of total revenues, compared to $271.6 million, or 36.6%, of total revenues for the same period last fiscal year. The improvement in gross margin for the year ended June 30, 2016 compared to last fiscal year was primarily driven by incremental margins realized on the Company’s higher revenue levels as well as product mix at II-VI Photonics towards higher margin products relating to 980 nm pumps and undersea network deployments. The inclusion of the recent acquisitions did not have a material impact to the current year’s gross margin but going forward, the Company’s anticipates the margin to be impacted somewhat by the lower margin profile that each of EpiWorks and ANADIGICS historically has realized.
Internal research and development. Company-funded internal research and development expenses for the fiscal year ended June 30, 2016 were $60.4 million, or 7.3% of revenues, compared to $51.3 million, or 6.9% of revenues, last fiscal year. The increase in internal research and development expense is the result of the Company’s continued investments in the development of the technology required to fabricate VCSELs in large volume for future applications as well as new product introductions across the Company’s business units. The Company anticipates the internal research and development expenses as a percentage of revenues to continue to increase as the Company continues to invest in its growth strategy around high-volume VCSELs platform.
Selling, general and administrative. Selling, general and administrative (“SG&A”) expenses for the year ended June 30, 2016 were $160.6 million, or 19.4% of revenues, compared to $143.5 million, or 19.3% of revenues, last fiscal year. The increase in SG&A expense in relative dollars was primarily due to the current year acquisitions’ transaction expenses and severance totaling approximately $11.3 million. The remaining increase in relative dollars was to support a higher revenue base in the current fiscal year.
Interest and other, net. Interest and other, net for the year ended June 30, 2016 was expense of $1.9 million compared to income of $2.3 million last fiscal year. Included in interest and other, net for the year ended June 30, 2016 were earnings on the Company’s equity interest in Guangdong Fuxin Electronic Technology (“Fuxin”), interest expense on borrowings, interest income on excess cash reserves, and unrealized gains and losses on the Company’s deferred compensation plan and foreign currency gains and losses. The current fiscal year expense of $1.9 million includes $3.1 million of interest expense on the Company’s outstanding borrowings offset by $1.2 million of interest income on the Company’s excess cash reserves. The prior year’s income of $2.3 million primarily included a one-time settlement gain of $7.7 million related to certain payment obligations from prior year acquisitions offset by foreign currency losses of $2.2 million and $2.0 million impairment charge on certain tradenames in the II-VI Photonics segment.
Income taxes. The Company’s year-to-date effective income tax rate at June 30, 2016 was 27.3%, compared to an effective tax rate of 16.6% last fiscal year. The variation between the Company’s effective tax rate from continuing operations and the U.S. statutory rate of 35% was primarily due to the Company’s foreign operations, which are subject to income taxes at lower statutory rates. The higher effective tax rate during the current fiscal year is due to an $8.5 million valuation allowance against certain U.S. based deferred tax assets.
Segment Reporting
Bookings, revenues and operating income for each of the Company’s reportable segments are discussed below. Operating income differs from income from operations in that operating income excludes certain operational expenses included in other expense (income) – net as reported. Management believes operating income to be a useful measure for investors, as it reflects the results of segment performance over which management has direct control and is used by management in its evaluation of segment performance. See “Note 11. Segment and Geographic Reporting,” to the Consolidated Financial Statements included in this Annual Report on Form 10-K for further information on the Company’s reportable segments and for the reconciliation of operating income to net earnings, which is incorporated herein by reference.
9500_10Kc1.pdf August 30, 2016 pg 34

35
II-VI Laser Solutions ($ in millions)
% Year Ended Increase June 30, (Decrease) 2016 2015 Bookings $ 306.0 $ 284.8 7%Revenues $ 303.0 $ 287.9 5%Operating income $ 36.2 $ 55.0 (34%)
The Company’s II-VI Laser Solutions segment includes the combined operations of II-VI Infrared Optics, II-VI HIGHYAG, II-VI Laser Enterprise, II-VI Suwtech and, II-VI LaserTech, II-VI OptoElectronic Devices Division, and II-VI EpiWorks. The Company acquired II-VI EpiWorks on February 1, 2016 and II-VI OptoElectronic Devices Division, formerly known as ANADIGICS, on March 15, 2016.
Bookings for the fiscal year ended June 30, 2016 for II-VI Laser Solutions increased 7% to $306.0 million, compared to $284.8 million last fiscal year. Included in the current year’s bookings amounts was $14.3 million of bookings attributed to the current year acquisitions. Exclusive of this amount, bookings increased approximately $6.9 million driven by demand for one-micron components for the industrial materials processing market as well higher aftermarket demand for the segment’s CO2 laser optics.
Revenues for the fiscal year ended June 30, 2016 for II-VI Laser Solutions increased 5% to $303.0 million, compared to revenues of $287.9 million last fiscal year. Included in the current year’s revenue amount was $13.9 million of revenue attributed to the current year acquisitions. Exclusive of this amount, revenues were consistent with that of the prior fiscal year levels.
Operating income for the fiscal year ended June 30, 2016 for II-VI Laser Solutions decreased 34% to $36.2 million, compared to $55.0 million last fiscal year. The decrease in operating income compared to last fiscal year was primarily due to the inclusion of the operating results of the current year acquisitions. Operating income was also negatively impacted by acquisition related transaction and severance expenses of $11.3 million.
II-VI Photonics ($ in millions)
Year Ended % June 30, Increase 2016 2015 Bookings $ 372.2 $ 282.9 32%Revenues $ 325.9 $ 260.8 25%Operating income $ 37.8 $ 7.2 425%
The Company’s II-VI Photonics segment includes the combined operations of II-VI Photop and II-VI Optical Communications.
Bookings for the year ended June 30, 2016 for II-VI Photonics increased 32% to $372.2 million, compared to $282.9 million for the prior fiscal year. The increase in bookings was the result of market demand from the China broadband build-out, 100G metro deployments in the United States and undersea 980 nanometer pumps and high performance optical amplifiers.
Revenues for the year ended June 30, 2016 for II-VI Photonics increased 25% to $325.9 million, compared to $260.8 million for last fiscal year. The increase in revenues compared to last fiscal year was mainly attributable to increased customer demand for optical components and modules for the new deployment of CATV optical networks, the continued strength of the China broadband program by the government to extend the fiber to the home deployment, 4G wireless deployment, and accelerated 5G wireless development.
Operating income for the year ended June 30, 2016 for II-VI Photonics increased 425% to $37.8 million, compared to an operating income of $7.2 million last fiscal year. The increase in operating income was primarily due to incremental margins realized on the higher revenue levels as well as product mix to higher margin products including 980 nm pumps and optical amplifiers.
9500_10Kc1.pdf August 30, 2016 pg 35
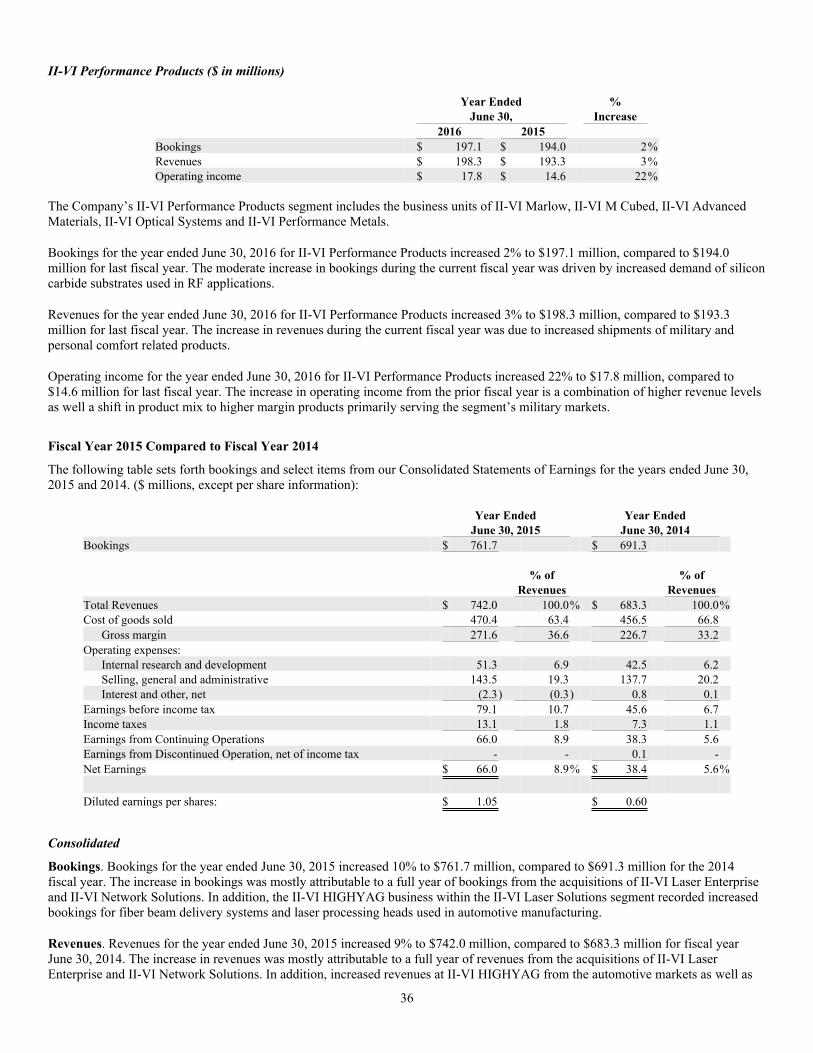
36
II-VI Performance Products ($ in millions)
Year Ended % June 30, Increase 2016 2015 Bookings $ 197.1 $ 194.0 2%Revenues $ 198.3 $ 193.3 3%Operating income $ 17.8 $ 14.6 22%
The Company’s II-VI Performance Products segment includes the business units of II-VI Marlow, II-VI M Cubed, II-VI Advanced Materials, II-VI Optical Systems and II-VI Performance Metals.
Bookings for the year ended June 30, 2016 for II-VI Performance Products increased 2% to $197.1 million, compared to $194.0 million for last fiscal year. The moderate increase in bookings during the current fiscal year was driven by increased demand of silicon carbide substrates used in RF applications.
Revenues for the year ended June 30, 2016 for II-VI Performance Products increased 3% to $198.3 million, compared to $193.3 million for last fiscal year. The increase in revenues during the current fiscal year was due to increased shipments of military and personal comfort related products.
Operating income for the year ended June 30, 2016 for II-VI Performance Products increased 22% to $17.8 million, compared to $14.6 million for last fiscal year. The increase in operating income from the prior fiscal year is a combination of higher revenue levels as well a shift in product mix to higher margin products primarily serving the segment’s military markets.
Fiscal Year 2015 Compared to Fiscal Year 2014
The following table sets forth bookings and select items from our Consolidated Statements of Earnings for the years ended June 30, 2015 and 2014. ($ millions, except per share information):
Year Ended Year Ended June 30, 2015 June 30, 2014 Bookings $ 761.7 $ 691.3 % of % of Revenues Revenues Total Revenues $ 742.0 100.0% $ 683.3 100.0%Cost of goods sold 470.4 63.4 456.5 66.8
Gross margin 271.6 36.6 226.7 33.2 Operating expenses:
Internal research and development 51.3 6.9 42.5 6.2 Selling, general and administrative 143.5 19.3 137.7 20.2 Interest and other, net (2.3) (0.3) 0.8 0.1
Earnings before income tax 79.1 10.7 45.6 6.7 Income taxes 13.1 1.8 7.3 1.1 Earnings from Continuing Operations 66.0 8.9 38.3 5.6 Earnings from Discontinued Operation, net of income tax - - 0.1 - Net Earnings $ 66.0 8.9% $ 38.4 5.6% Diluted earnings per shares: $ 1.05 $ 0.60
Consolidated
Bookings. Bookings for the year ended June 30, 2015 increased 10% to $761.7 million, compared to $691.3 million for the 2014 fiscal year. The increase in bookings was mostly attributable to a full year of bookings from the acquisitions of II-VI Laser Enterprise and II-VI Network Solutions. In addition, the II-VI HIGHYAG business within the II-VI Laser Solutions segment recorded increased bookings for fiber beam delivery systems and laser processing heads used in automotive manufacturing.
Revenues. Revenues for the year ended June 30, 2015 increased 9% to $742.0 million, compared to $683.3 million for fiscal year June 30, 2014. The increase in revenues was mostly attributable to a full year of revenues from the acquisitions of II-VI Laser Enterprise and II-VI Network Solutions. In addition, increased revenues at II-VI HIGHYAG from the automotive markets as well as
9500_10Kc1.pdf August 30, 2016 pg 36

37
higher revenues at II-VI Photonics driven by increased demand across a variety of products, such as optical components and modules required by global cable television operators for their broadband initiatives and ongoing investments drove this increase. Somewhat offsetting these higher revenue levels was a decrease in shipment volumes at the Company’s military related businesses, driven primarily by reduced U.S. defense spending.
Gross margin. Gross margin as a percentage of revenues for the year ended June 30, 2015 was 36.6%, compared to 33.2% for fiscal year June 30, 2014. The increase in gross margin during the fiscal year ended June 30, 2015 was primarily the result of the incremental margin realized on the 9% revenue increase during this period and the elimination of unprofitable product lines. In addition, as noted above, the Company begun to realize synergies and operational improvements in connection with its fiscal year 2014 acquisitions, which resulted in higher margin levels. Gross margin for fiscal year 2014 was negatively impacted by a one-time purchase accounting fair market inventory adjustment of $4.1 million relating to the fiscal year 2014 acquisitions as well as product lines with lower margins.
Internal research and development. Company-funded internal research and development expenses for the year ended June 30, 2015 were $51.3 million, or 6.9% of revenues, compared to $42.5 million, or 6.2% of revenues, for fiscal year June 30, 2014. The increase in research and development expense as a percentage of revenues in fiscal year 2015 was due to a full year of internal research and development from businesses acquired in prior fiscal years, which invest in higher levels of research and development activity to support their ongoing product development of fiber and direct diode laser components, fiber optical amplifiers and micro-optics.
Selling, general and administrative. SG&A expenses for the fiscal year ended June 30, 2015 were $143.5 million, or 19.3% of revenues, compared to $137.7 million, or 20.2% of revenues, for fiscal year June 30, 2014. In relative dollar amounts, the increase in SG&A expenses was the result of increased expenses incurred to support an overall revenue base increase from the prior fiscal year. The Company experienced leverage improvement with respect to SG&A expenses as a percentage of revenues through synergies, cost savings and restructuring programs undertaken during the fiscal year ended June 30, 2015.
Interest and other, net. Interest and other, net for the year ended June 30, 2015 and 2014 was income of $2.3 million compared to expense of $0.8 million for the prior fiscal year. Other income of $2.3 million for the fiscal year ended June 30, 2015 was primarily the result of a one-time settlement income of $7.7 million (pre-tax, $7.1 million after tax) related to certain payment obligations from the prior fiscal year acquisitions offset by foreign currency losses of $2.2 million due to weakened foreign currencies against the U.S. dollar and a $2.0 million impairment recorded during the fiscal year 2015 for the write-off of certain tradenames in the II-VI Photonics segment. Included in interest and other, net for the year ended June 30, 2015 were earnings from the Company’s equity investment in Fuxin, interest expense on borrowings, interest income on excess cash reserves, unrealized gains on the Company sponsored deferred compensation plan, foreign currency gains and losses.
Income taxes. The Company’s year-to-date effective income tax rate at June 30, 2015 was 16.6%, compared to an effective tax rate of 16.0% in fiscal year 2014. The variation between the Company’s effective tax rate and the U.S. statutory rate of 35% was primarily due to the Company’s foreign operations, which are subject to income taxes at lower statutory rates. The year-to-date effective tax rate between the two fiscal years was consistent.
II-VI Laser Solutions ($ in millions)
Year Ended % June 30, Increase 2015 2014 Bookings $ 284.8 $ 262.8 8%Revenues $ 287.9 $ 254.4 13%Operating income $ 55.0 $ 24.5 124%
Bookings for the year ended June 30, 2015 for II-VI Laser Solutions increased 8% to $284.8 million, compared to $262.8 million for fiscal year June 30, 2014. The increase in bookings was due in part to higher order levels at II-VI HIGHYAG, which continued to grow its product offerings into the one-micron fiber laser market, for fiber beam delivery systems and for laser processing heads used in automotive manufacturing. In addition, the II-VI Laser Solutions segment recorded a full year of bookings from the acquisition of II-VI Laser Enterprise, which experienced increased demand for products in the direct diode and fiber laser components markets.
Revenues for the year ended June 30, 2015 for II-VI Laser Solutions increased 13% to $287.9 million, compared to $254.4 million for fiscal year ended June 30, 2014. The increase in revenues was the result of increased shipment volumes of the segment’s fiber beam delivery systems and laser process heads from II-VI HIGHYAG as well as a full year of revenues from the acquisition of II-VI Laser Enterprise.
9500_10Kc1.pdf August 30, 2016 pg 37

38
Operating income for the year ended June 30, 2015 for II-VI Laser Solutions increased 124% to $55.0 million, compared to $24.5 million for fiscal year June 30, 2014. The increase in segment earnings was the result of higher revenues as well as gross margin improvements from II-VI Laser Enterprise, as this business unit begun to realize certain operational efficiencies and acquisition related synergies. Operating income for fiscal year 2014 was negatively impacted by transaction expenses of $3.9 million, $2.5 million of purchase accounting relating to the fair market inventory adjustment and $2.0 million of restructuring efforts at II-VI Laser Enterprise.
II-VI Photonics ($ in millions)
Year Ended % June 30, Increase 2015 2014 Bookings $ 282.9 $ 220.2 28%Revenues $ 260.8 $ 216.5 20%Operating income (loss) $ 7.2 $ (0.1) 7,300%
Bookings for the year ended June 30, 2015 for II-VI Photonics increased 28% to $282.9 million, compared to $220.2 million for fiscal year ended June 30, 2014. The increase in bookings was due to increased demand for a variety of the segment’s products, such as optical components and modules driven by broadband initiatives, development of next generation wireless networks and increased bandwidth trends in the data center and cloud applications. In addition, the segment recorded a full year of bookings from the acquisition of II-VI Network Solutions.
Revenues for the year ended June 30, 2015 for II-VI Photonics increased 20% to $260.8 million, compared to $216.5 million for fiscal year ended June 30, 2014. The increase in revenues was due to increased customer demand for optical filters, optical components and assemblies, pump lasers and fiber amplifier modules that serve multiple markets. In addition, the segment recorded a full year of revenues from the acquisition of II-VI Network Solutions.
Operating (loss) income for the year ended June 30, 2015 for II-VI Photonics increased 7,300% to $7.2 million, compared to an operating loss of $0.1 million for fiscal year June 30, 2014. The improvement in operating income was attributed primarily to incremental margin realized on increased revenues, and favorable product mix towards higher margin products, operational efficiencies and the absence of certain one-time purchase accounting fair market inventory adjustments that occurred in fiscal 2014, offset by $4.5 million of restructuring expenses to “right-size” its business in fiscal 2015. During fiscal year 2014, one-time fair market inventory purchase accounting adjustments totaled $1.6 million.
II-VI Performance Products ($ in millions)
Year Ended % June 30, (Decrease) 2015 2014 Bookings $ 194.0 $ 208.3 (7%)Revenues $ 193.3 $ 212.4 (9%)Operating income $ 14.6 $ 22.1 (34%)
Bookings for the year ended June 30, 2015 for II-VI Performance Products decreased 7% to $194.0 million, compared to $208.3 million for fiscal year June 30, 2014. The decrease in bookings related to lower order volumes of military-related products as a result of the decline in overall defense spending and funding constraints specific to certain U.S. military programs, as well as softness in the semiconductor capital equipment market. The decrease in bookings was somewhat offset by increased demand for SiC substrates addressing high-power high-frequency semiconductor devices.
Revenues for the year ended June 30, 2015 for II-VI Performance Products decreased 9% to $193.3 million, compared to $212.4 million for fiscal year June 30, 2014. The decrease in revenues was due to lower shipment volumes of military related products from lower overall defense spending as well as lower shipments to customers in the semiconductor capital equipment markets. The decrease in revenues was somewhat offset by higher revenues from the segment’s SiC substrates.
Operating income for the year ended June 30, 2015 for II-VI Performance Products was $14.6 million, compared to $22.1 million for fiscal year June 30, 2014. The decrease in operating income was a result of lower revenues during the current fiscal year as well as restructuring charges of $1.1 million relating to the consolidation of the Company’s military-related businesses.
9500_10Kc1.pdf August 30, 2016 pg 38

39
LIQUIDITY AND CAPITAL RESOURCES
Historically, our primary sources of cash have been provided through operations and long-term borrowings. Other sources of cash include proceeds received from the exercise of stock options and sales of equity investments and businesses. Our historical uses of cash have been for capital expenditures, investments in research and development, business acquisitions, payments of principal and interest on outstanding debt obligations and purchases of treasury stock. Supplemental information pertaining to our sources and uses of cash is presented as follows:
Sources (uses) of Cash (millions):
Year Ended June 30, 2016 2015 2014 Net cash provided by operating activities $ 123.0 $ 129.4 $ 95.5 Additions to property, plant & equipment (58.2) (52.3) (29.2)Net proceeds (payments) on long-term borrowings 59.5 (65.5) 128.0 Purchases of treasury stock (6.3) (12.7) (20.0)Proceeds from exercises of stock options 9.7 5.2 4.4 Proceeds from the sale of business 45.0 - - Purchases of businesses, net of cash acquired (122.2) - (177.7)Payments of redeemable noncontrolling interest - - (8.8)Payments on holdback arrangements - (2.4) (3.0)Other financing activities (1.4) (0.7) (1.5)Effect of exchange rate changes on cash and cash equivalents and other (4.3) (2.0) 1.5
Net cash provided by operating activities:
Net cash provided by operating activities was $123.0 million and $129.4 million for the fiscal years ended June 30, 2016 and 2015, respectively. The decrease in cash flows from operating activities in fiscal year 2016 compared to the prior fiscal year was mostly due to higher working capital requirements to accommodate the Company’s current increased business activities.
Net cash provided by operating activities was $129.4 million and $95.5 million for the fiscal years ended June 30, 2015 and 2014, respectively. The increase in cash flows from operating activities in fiscal year 2015 compared to fiscal year 2014 was the result of an increase in the Company’s net earnings by $27.5 million, or 72%, compared to fiscal year 2014.
Net cash used in investing activities:
Net cash used in investing activities was $135.2 million and $52.2 million for the fiscal years ended June 30, 2016 and 2015, respectively. Net cash used in investing activities during the year ended June 30, 2016 consisted of $122.2 million paid for purchases of businesses, net of cash acquired, capital expenditures of $58.2 million offset by cash received for the sale of the RF business in the amount of $45.0 million. Net cash used in investing activities for fiscal year 2015 consisted entirely of capital expenditures.
Net cash used in investing activities was $52.2 million and $206.8 million for the fiscal years ended June 30, 2015 and 2014, respectively. Net cash used in investing activities during the year ended June 30, 2015 consisted of $52.3 million paid for capital expenditures of which $13.4 million represented the purchase of the II-VI HIGHYAG manufacturing facility in Berlin, Germany which was previously accounted for as a capital lease. The majority of net cash used in investing activities for fiscal year 2014 consisted of $93.1 million for the acquisition of II-VI Laser Enterprise and $84.6 million net cash for the acquisition of II-VI Network Solutions. In addition, the Company paid $29.2 million for capital expenditures in fiscal year 2014.
Net cash provided by (used in) financing activities:
Net cash provided by financing activities was $61.5 million for the year ended June 30, 2016 compared to net cash used in financing activities of $76.1 million for the year ended June 30, 2015. During fiscal year 2016, the Company borrowed a total of $125.2 million to finance its current year acquisitions and repaid $65.7 million on its outstanding long-term borrowings. In addition, the Company repurchased $6.3 million of treasury shares under the Company’s current share repurchase program, paid $1.4 million in satisfaction of minimum tax withholding obligations associated with the vesting of restricted and performance share awards and received $9.7 million of cash from the exercises of stock options.
9500_10Kc1.pdf August 30, 2016 pg 39

40
Company Credit Facilities
The Company’s Second Amended and Restated Credit Agreement (the “Credit Facility), which was in effect through the period covered by this report, provided for a revolving credit facility of $225 million, as well as a $100 million term loan (“the Term Loan”). The Term Loan was being re-paid in consecutive quarterly principal payments on the first business day of each January, April, July and October, with the first payment having commenced on October 1, 2013, as follows: (i) twenty consecutive quarterly installments of $5.0 million and (ii) a final installment of all remaining principal due and payable on the maturity date of September 10, 2018. Amounts borrowed under the revolving credit facility were due and payable on the maturity date. The Credit Facility was unsecured, but was guaranteed by each existing and subsequently acquired or organized wholly-owned domestic subsidiary of the Company. The Company had the option to request an increase to the size of the revolving credit facility in an aggregate additional amount not to exceed $100 million. The Credit Facility had a five-year term through September 10, 2018 and had an interest rate of either a Base Rate Option or a Euro-Rate Option, plus an Applicable Margin, as defined in the agreement governing the Credit Facility. If the Base Rate option was selected for a borrowing, the Applicable Margin would have been 0.00% to 0.075% and if the Euro-Rate Option was selected for a borrowing, the Applicable Margin would have been 0.75% to 1.75%. The Applicable Margin was based on the Company’s ratio of consolidated indebtedness to consolidated EBITDA. Additionally, the Credit facility was subject to certain covenants, including those relating to minimum interest coverage and maximum leverage ratios. As of June 30, 2016, the Company was in compliance with all financial covenants under the Credit Facility.
In conjunction with the Company’s Second Amended and Restated Credit Facility, the Company incurred approximately $1.0 million of deferred financing costs which were being amortized over the term of the agreement. As a result of the overall increase in borrowing capacity, existing deferred financing costs at the time of the amendment of $0.5 million were also being amortized over the term of the Credit Facility.
The Company’s yen denominated line of credit is a 500 million Yen ($4.9 million) facility. The Yen line of credit was extended in September 2015 through August 2020 on substantially the same terms. The interest rate equal to LIBOR, as defined in the loan agreement, plus 0.625% to 1.50%. At June 30, 2016 and 2015, the Company had 300 million yen outstanding under the line of credit. Additionally, the facility is subject to certain covenants, including those relating to minimum interest coverage and maximum leverage ratios. As of June 30, 2016, the Company had $2.9 million outstanding and was in compliance with all financial covenants under its Yen facility.
The Company had aggregate availability of $37.7 million and $116.6 million under its lines of credit as of June 30, 2016 and June 30, 2015, respectively. The amounts available under the Company’s lines of credit are reduced by outstanding letters of credit. As of June 30, 2016 and 2015, total outstanding letters of credit supported by the Credit Facility were $1.2 million and $1.5 million respectively. The weighted average interest rate of total borrowings was 1.6% and 1.8% for the years ended June 30, 2016 and 2015, respectively.
In August 2014, the Board of Directors authorized the Company to purchase up to $50.0 million of its Common Stock. The repurchase program has no expiration date and provides for shares to be purchased in the open market or in private transactions from time to time. Shares purchased by the Company are retained as treasury stock and are available for general corporate purposes. During the fiscal year ended June 30, 2016, the Company purchased 380,538 shares of its Common Stock for $6.3 million under this repurchase program. Since inception of the repurchase program the Company has repurchased 1,316,587 shares of its Common Stock for approximately $19.0 million.
Our cash position, borrowing capacity and debt obligations are as follows (in millions):
June 30, June 30, 2016 2015
Cash and cash equivalents $ 218.4 $ 173.6 Available borrowing capacity 37.7 116.6 Total debt obligation 235.9 176.0
On July 28, 2016, subsequent to fiscal year ended June 30, 2016, the Company entered into a Third Amended and Restated Credit Facility (the “Amended Credit Facility”). The Amended Credit Facility provides for a revolving credit facility of $325 million (increased from $225 million), as well as a $100 million term loan, which mature on July 27, 2021. The term loan is to be re-paid in quarterly principal payments of $5.0 million commencing in October 2016, with any remaining principal due on the maturity date. The Amended Credit Facility is unsecured, but is guaranteed by each of the Company’s existing or subsequently acquired or organized wholly-owned domestic subsidiaries. The Company may request an increase to the size of the Amended Credit Facility in an aggregate additional amount not to exceed $100 million. Amounts outstanding under the Amended Credit Facility bear interest at LIBOR plus 1.00%-2.25% based on the Company’s ratio of consolidated indebtedness to consolidated EBITDA.
9500_10Kc1.pdf August 30, 2016 pg 40

41
The Amended Credit Facility contains customary affirmative and negative covenants for credit facilities of this type, including limitations on the Company and its subsidiaries with respect to indebtedness, liens, investments, distributions, mergers and acquisitions, disposition of assets, repurchases of the Company’s common stock and transactions with affiliates. The covenants permit the Company to use proceeds of the Amended Credit Facility for the repayment of existing indebtedness, permitted acquisitions, working capital and capital expenditures and other lawful corporate purposes. The Amended Credit Facility also contains financial covenants that require the Company to maintain a minimum consolidated interest coverage ratio of 4.0 and a maximum consolidated leverage ratio of 3.25. In conjunction with the new credit facility, the Company incurred $1.4 million of deferred financing costs which will be amortized over the term of the new facility.
The Company believes cash flow from operations, existing cash reserves and additional available borrowing capacity from its new credit facility will be sufficient to fund its working capital needs, capital expenditures and internal and external growth for fiscal year 2017. The Company’s cash and cash equivalent balances are generated and held in numerous locations throughout the world, including amounts held outside the U.S. As of June 30, 2016, the Company held approximately $177 million of cash and cash equivalents outside of the U.S. Cash balances held outside the United States could be repatriated to the U.S., but, under current law, would potentially be subject to U.S. federal income taxes, less applicable foreign tax credits. The Company has not recorded deferred income taxes related to the majority of its undistributed earnings outside of the U.S., as the majority of the earnings of the Company’s foreign subsidiaries are indefinitely reinvested.
Off-Balance Sheet Arrangements
The Company’s off-balance sheet arrangements include the operating lease obligations and the purchase obligations disclosed in the contractual obligations table below as well as letters of credit as discussed in Note 6 to the Company’s Consolidated Financial Statements included in Item 8 of this Annual Report on Form 10-K. The Company enters into these off-balance sheet arrangements to acquire goods and services used in its business.
Tabular Disclosure of Contractual Obligations Payments Due By Period
Less
Than 1 1-3 3-5 More
Than 5 Contractual Obligations Total Year Years Years Years ($000) Long-term debt obligations $ 235,917 $ 20,000 $ 213,000 $ 2,917 $ - Interest payments(1) 9,533 3,712 5,748 72 - Capital lease obligations - - - - - Operating lease obligations(2) 67,173 13,166 18,923 12,681 22,403 Purchase obligations(3)(4) 27,512 23,382 4,130 - - Other long-term liabilities reflected on the balance sheet under GAAP - - - - -
Total $ 340,135 $ 60,260 $ 241,801 $ 15,670 $ 22,403
(1) Variable rate interest obligations are based on the interest rate in place at June 30, 2016 and relate to the Second Amended and Restated Credit Facility.
(2) Includes an obligation for the use of two parcels of land related to II-VI Performance Metals. The lease obligations extend through years 2039 and 2056, respectively.
(3) A purchase obligation is defined as an agreement to purchase goods or services that is enforceable and legally binding on the Company and that specifies all significant terms, including fixed or minimum quantities to be purchased; minimum or variable price provisions, and the approximate timing of the transaction. These amounts are primarily comprised of open purchase order commitments to vendors for the purchase of supplies and materials.
(4) Includes cash earnout opportunities based upon II-VI EpiWorks for the achievement of certain agreed upon financial and operational targets for capacity, wafer output and gross margin.
Pension obligations are not included in the table above. The Company expects defined benefit plan employer contributions to be $2.5 million in 2017. Estimated funding obligations are determined by asset performance, workforce and retiree demographics, tax and employment laws and other actuarial assumptions which may change the annual funding obligations. The funded status of our defined benefit plans is disclosed in Note 14 to the Company’s Consolidated Financial Statements.
9500_10Kc1.pdf August 30, 2016 pg 41

42
The gross unrecognized income tax benefits at June 30, 2016, which are excluded from the above table, were $5.6 million. The Company is not able to reasonably estimate the amount by which the liability will increase or decrease over time; however, at this time, the Company does not expect a significant payment related to these obligations within the next fiscal year.
Item 7A. QUANTITATIVE AND QUALITATIVE DISCLOSURES ABOUT MARKET RISK
MARKET RISKS
The Company is exposed to market risks arising from adverse changes in foreign currency exchange rates and interest rates. In the normal course of business, the Company uses certain techniques and a derivative financial instrument as part of its overall risk management strategy, primarily focused on its exposure to the Japanese Yen. The Company also has transactions denominated in Euros, British Pounds Sterling, Chinese Renminbi and Swiss Francs. No significant changes have occurred in the techniques and instruments used by the Company during the current fiscal year.
Foreign Exchange Risks
In the normal course of business, the Company enters into foreign currency forward exchange contracts with its financial institutions. The purpose of these contracts is to hedge ordinary business risks regarding foreign currencies on product sales. Foreign currency exchange contracts are used to limit transactional exposure to changes in currency rates. The Company enters into foreign currency forward contracts that permit it to sell specified amounts of foreign currencies expected to be received from its export sales for pre-established U.S. dollar amounts at specified dates. The forward contracts are denominated in the same foreign currencies in which export sales are denominated. These contracts provide the Company with an economic hedge in which settlement will occur in future periods, thereby limiting the Company’s exposure. These contracts had a total notional amount of $9.2 million and $10.8 million at June 30, 2016 and 2015 respectively. The Company continually monitors its positions and the credit ratings of the parties to these contracts. While the Company may be exposed to potential losses due to risk in the event of non-performance by the counterparties to these financial instruments, it does not currently anticipate such losses.
A 10% change in the yen to U.S. dollar exchange rate would have changed revenues in the range from a decrease of approximately $5.2 million to an increase of approximately $6.4 million for the year ended June 30, 2016.
The Company has short-term intercompany notes that are denominated in U.S. dollars with certain European subsidiaries. A 10% change in the euro to dollar exchange rate would have changed net earnings in the range from a decrease of $1.8 million to an increase of $2.2 million for the year ended June 30, 2016.
Assets and liabilities of foreign operations are translated into U.S. dollars using the period-end exchange rate, while income and expenses are translated using the average exchange rates for the reporting period. Translation adjustments are recorded as accumulated other comprehensive income within shareholders’ equity.
Interest Rate Risks
As of June 30, 2016, the Company’s total borrowings of $235.9 million were from a line of credit borrowing of $188.0 million denominated in U.S. dollars, a term loan denominated in U.S. dollars of $45.0 million and a line of credit borrowing of $2.9 million denominated in Japanese yen. As such, the Company is exposed to changes in interest rates. A change in the interest rate of 100 basis points on these borrowings would have changed net earnings by $2.0 million, or $0.02 per-share diluted, for the fiscal year ended June 30, 2016.
Discount Rate Risks
During fiscal year 2016, the discount rate for the Switzerland Defined Benefit Plan was decreased from 1.10% at June 30, 2015 to 0.30% at June 30, 2016 resulting from a decrease in the yield on the 20-year Switzerland government bond. The resulting change to the discount rate increased the unfunded pension liability to $18.2 million at June 30, 2016, compared to $10.0 million at June 30, 2015.
9500_10Kc1.pdf August 30, 2016 pg 42

43
Item 8. FINANCIAL STATEMENTS AND SUPPLEMENTARY DATA
MANAGEMENT’S REPORT ON INTERNAL CONTROL OVER FINANCIAL REPORTING
Management’s Responsibility for Preparation of the Financial Statements
Management is responsible for the preparation of the financial statements included in this Annual Report on Form 10-K. The financial statements were prepared in accordance with the accounting principles generally accepted in the United States of America and include amounts that are based on the best estimates and judgments of management. The other financial information contained in this Annual Report on Form 10-K is consistent with the financial statements.
Management’s Report on Internal Control Over Financial Reporting
Management is responsible for establishing and maintaining adequate internal control over financial reporting. The Company’s internal control system is designed to provide reasonable assurance concerning the reliability of the financial data used in the preparation of the Company’s financial statements, as well as reasonable assurance with respect to safeguarding the Company’s assets from unauthorized use or disposition.
All internal control systems, no matter how well designed, have inherent limitations. Therefore, even those systems determined to be effective can provide only reasonable assurance with respect to financial statement presentation and other results of such systems.
Management conducted an evaluation of the effectiveness of the Company’s internal control over financial reporting as of June 30, 2016. In making this evaluation, management used the criteria set forth by the Committee of Sponsoring Organizations of the Treadway Commission (COSO) in Internal Control – Integrated Framework (2013). Management’s evaluation included reviewing the documentation of its controls, evaluating the design effectiveness of controls and testing their operating effectiveness. Management excluded from the scope of its assessment of internal control over financial reporting the operations and related assets of II-VI EpiWorks which was acquired on February 1, 2016, and ANADIGICS which was acquired on March 15, 2016. The recent acquisitions excluded from management’s assessment of internal controls over financial reporting represented approximately $101.4 million and $81.3 million of total assets and net assets, respectively, as of June 30, 2016 and approximately $13.9 million and $11.0 million of total revenues and net losses, respectively, for the fiscal year then ended. Based on the evaluation, management concluded that as of June 30, 2016, the Company’s internal controls over financial reporting were effective and provide reasonable assurance that the accompanying financial statements do not contain any material misstatement.
Ernst & Young LLP, an independent registered public accounting firm, has issued its report on the effectiveness of our internal control over financial reporting as of June 30, 2016. Its report is included herein.
9500_10Kc1.pdf August 30, 2016 pg 43

44
Report of Independent Registered Public Accounting Firm
The Board of Directors and Shareholders of II-VI Incorporated and Subsidiaries
We have audited II-VI Incorporated and Subsidiaries’ internal control over financial reporting as of June 30, 2016, based on criteria established in Internal Control—Integrated Framework issued by the Committee of Sponsoring Organizations of the Treadway Commission (2013 framework) (the COSO criteria). II-VI Incorporated and Subsidiaries’ management is responsible for maintaining effective internal control over financial reporting, and for its assessment of the effectiveness of internal control over financial reporting included in the accompanying Management’s Report on Internal Control Over Financial Reporting. Our responsibility is to express an opinion on the company’s internal control over financial reporting based on our audit.
We conducted our audit in accordance with the standards of the Public Company Accounting Oversight Board (United States). Those standards require that we plan and perform the audit to obtain reasonable assurance about whether effective internal control over financial reporting was maintained in all material respects. Our audit included obtaining an understanding of internal control over financial reporting, assessing the risk that a material weakness exists, testing and evaluating the design and operating effectiveness of internal control based on the assessed risk, and performing such other procedures as we considered necessary in the circumstances. We believe that our audit provides a reasonable basis for our opinion.
A company’s internal control over financial reporting is a process designed to provide reasonable assurance regarding the reliability of financial reporting and the preparation of financial statements for external purposes in accordance with generally accepted accounting principles. A company’s internal control over financial reporting includes those policies and procedures that (1) pertain to the maintenance of records that, in reasonable detail, accurately and fairly reflect the transactions and dispositions of the assets of the company; (2) provide reasonable assurance that transactions are recorded as necessary to permit preparation of financial statements in accordance with generally accepted accounting principles, and that receipts and expenditures of the company are being made only in accordance with authorizations of management and directors of the company; and (3) provide reasonable assurance regarding prevention or timely detection of unauthorized acquisition, use, or disposition of the company’s assets that could have a material effect on the financial statements.
Because of its inherent limitations, internal control over financial reporting may not prevent or detect misstatements. Also, projections of any evaluation of effectiveness to future periods are subject to the risk that controls may become inadequate because of changes in conditions, or that the degree of compliance with the policies or procedures may deteriorate.
As indicated in the accompanying Management’s Report on Internal Control Over Financial Reporting, management’s assessment of and conclusion on the effectiveness of internal control over financial reporting did not include the internal controls of II-VI EpiWorks and ANADIGICS, which is included in the 2016 consolidated financial statements of II-VI Incorporated and Subsidiaries and constituted $101.4 million and $81.3 million of total and net assets, respectively, as of June 30, 2016 and $13.9 million and $11.0 million of revenues and net losses, respectively, for the year then ended. Our audit of internal control over financial reporting of II-VI Incorporated and Subsidiaries also did not include an evaluation of the internal control over financial reporting of II-VI EpiWorks and ANADIGICS.
In our opinion, II-VI Incorporated and Subsidiaries maintained, in all material respects, effective internal control over financial reporting as of June 30, 2016, based on the COSO criteria.
We also have audited, in accordance with the standards of the Public Company Accounting Oversight Board (United States), the consolidated balance sheets of II-VI Incorporated and Subsidiaries as of June 30, 2016 and 2015, and the related consolidated statements of earnings, comprehensive income, shareholders' equity and cash flows for each of the three years in the period ended June 30, 2016 of II-VI Incorporated and Subsidiaries and our report dated August 26, 2016 expressed an unqualified opinion thereon.
/s/ Ernst & Young LLPPittsburgh, PA
August 26, 2016
9500_10Kc1.pdf August 30, 2016 pg 44

45
Report of Independent Registered Public Accounting Firm
The Board of Directors and Shareholders of II-VI Incorporated and Subsidiaries
We have audited the accompanying consolidated balance sheets of II-VI Incorporated and Subsidiaries as of June 30, 2016 and 2015, and the related consolidated statements of earnings, comprehensive income, shareholders' equity and cash flows for each of the three years in the period ended June 30, 2016. Our audits also included the financial statement schedule listed in the Index at Item 15(a)(2). These financial statements and schedule are the responsibility of the Company's management. Our responsibility is to express an opinion on these financial statements and schedule based on our audits.
We conducted our audits in accordance with the standards of the Public Company Accounting Oversight Board (United States). Those standards require that we plan and perform the audit to obtain reasonable assurance about whether the financial statements are free of material misstatement. An audit includes examining, on a test basis, evidence supporting the amounts and disclosures in the financial statements. An audit also includes assessing the accounting principles used and significant estimates made by management, as well as evaluating the overall financial statement presentation. We believe that our audits provide a reasonable basis for our opinion.
In our opinion, the financial statements referred to above present fairly, in all material respects, the consolidated financial position of II-VI Incorporated and Subsidiaries at June 30, 2016 and 2015, and the consolidated results of their operations and their cash flows for each of the three years in the period ended June 30, 2016, in conformity with U.S. generally accepted accounting principles. Also, in our opinion, the related financial statement schedule, when considered in relation to the basic financial statements taken as a whole, presents fairly in all material respects the information set forth therein.
We also have audited, in accordance with the standards of the Public Company Accounting Oversight Board (United States), II-VI Incorporated and Subsidiaries' internal control over financial reporting as of June 30, 2016, based on criteria established in Internal Control-Integrated Framework issued by the Committee of Sponsoring Organizations of the Treadway Commission (2013 framework) and our report dated August 26, 2016 expressed an unqualified opinion thereon.
/s/ Ernst & Young LLPPittsburgh, PA
August 26, 2016
9500_10Kc1.pdf August 30, 2016 pg 45

46
II-VI Incorporated and Subsidiaries Consolidated Balance Sheets ($000)June 30, 2016 2015 Assets Current Assets
Cash and cash equivalents $ 218,445 $ 173,634 Accounts receivable - less allowance for doubtful accounts of $2,016 at June 30, 2016 and $1,048 at June 30, 2015 164,817 140,772 Inventories 175,133 164,388 Deferred income taxes - 13,260 Prepaid and refundable income taxes 6,535 6,881 Prepaid and other current assets 18,033 14,033 Total Current Assets 582,963 512,968
Property, plant & equipment, net 242,857 203,812 Goodwill 233,755 195,894 Other intangible assets, net 124,590 122,462 Investment 11,354 11,914 Deferred income taxes 7,848 2,210 Other assets 9,224 8,904 Total Assets $ 1,212,591 $ 1,058,164 Liabilities and Shareholders' Equity Current Liabilities
Current portion of long-term debt $ 20,000 $ 20,000 Accounts payable 53,796 45,275 Accrued compensation and benefits 59,012 39,310 Accrued income taxes payable 12,588 9,310 Deferred income taxes - 685 Other accrued liabilities 25,846 24,576 Total Current Liabilities 171,242 139,156
Long-term debt 215,917 155,957 Deferred income taxes 11,103 7,105 Other liabilities 31,991 26,865 Total Liabilities 430,253 329,083 Shareholders' Equity Preferred stock, no par value; authorized - 5,000,000 shares; none issued - - Common stock, no par value; authorized - 300,000,000 shares; issued - 72,840,257 shares at June 30, 2016; 71,779,704 shares at June 30, 2015 243,812 226,609 Accumulated other comprehensive income (loss) (14,017) 8,665 Retained earnings 652,788 587,302 882,583 822,576 Treasury stock, at cost - 10,965,925 shares at June 30, 2016 and 10,565,209 shares at June 30, 2015 (100,245) (93,495)Total Shareholders' Equity 782,338 729,081 Total Liabilities and Shareholders' Equity $ 1,212,591 $ 1,058,164
See Notes to Consolidated Financial Statements.
9500_10Kc1.pdf August 30, 2016 pg 46

47
II-VI Incorporated and Subsidiaries Consolidated Statements of Earnings Year Ended June 30, 2016 2015 2014 ($000, except per share data) Revenues
Domestic $ 303,552 $ 274,142 $ 240,534 International 523,664 467,819 442,727
Total Revenues 827,216 741,961 683,261
Costs, Expenses and Other Expense (Income) Cost of goods sold 514,403 470,363 456,545 Internal research and development 60,354 51,260 42,523 Selling, general and administrative 160,646 143,539 137,707 Interest expense 3,081 3,863 4,479 Other expense (income), net (1,223) (6,176) (3,634)Total Costs, Expenses and Other Expense (Income) 737,261 662,849 637,620 Earnings from Continuing Operations Before Income Taxes 89,955 79,112 45,641 Income Taxes 24,469 13,137 7,325 Earnings from Continuing Operations 65,486 65,975 38,316 Earnings from Discontinued Operation, net of income tax - - 133 Net Earnings $ 65,486 $ 65,975 $ 38,449
Basic Earnings Per Share:
Continuing Operations $ 1.07 $ 1.08 $ 0.62 Discontinued Operation $ - $ - $ - Consolidated $ 1.07 $ 1.08 $ 0.62
Diluted Earnings Per Share:
Continuing Operations $ 1.04 $ 1.05 $ 0.60 Discontinued Operation $ - $ - $ - Consolidated $ 1.04 $ 1.05 $ 0.60
See Notes to Consolidated Financial Statements.
9500_10Kc1.pdf August 30, 2016 pg 47

48
II-VI Incorporated and Subsidiaries Consolidated Statements of Comprehensive Income Year Ended June 30, 2016 2015 2014 ($000) Net earnings $ 65,486 $65,975 $38,449 Other comprehensive income (loss):
Foreign currency translation adjustments (15,651) (8,497) 2,363 Pension adjustment, net of taxes of ($1,886), $(602), and $387 for the years ended June 30, 2016, 2015, and 2014, respectively (7,031) (2,244) 1,443
Comprehensive income $ 42,804 $55,234 $42,255
See Notes to Consolidated Financial Statements.
9500_10Kc1.pdf August 30, 2016 pg 48

49
II-VI Incorporated and Subsidiaries Consolidated Statements of Shareholders’ Equity Accumulated Other Common Stock Comprehensive Retained Treasury Stock Shares Amount Income (Loss) Earnings Shares Amount Total (000) Balance - June 30, 2013 70,223 $ 194,284 $ 15,600 $ 482,878 (8,012) $ (56,654) $ 636,108 Shares issued under share-based compensation plans 712 4,482 - - (44) (827) 3,655 Net earnings - - - 38,449 - - 38,449 Purchases of treasury stock - - - - (1,333) (19,973) (19,973)Treasury stock under deferred compensation arrangements - 1,809 - - (93) (1,809) - Foreign currency translation adjustments - - 2,363 - - - 2,363 Share-based compensation expense - 12,347 - - - - 12,347 Pension adjustment, net of taxes of $387 - - 1,443 - - - 1,443 Excess tax benefits from share-based compensation expense - 651 - - - - 651 Balance - June 30, 2014 70,935 $ 213,573 $ 19,406 $ 521,327 (9,482) $ (79,263) $ 675,043 Shares issued under share-based compensation plans 773 5,196 - - (75) (1,085) 4,111 Net earnings - - - 65,975 - - 65,975 Purchases of treasury stock - - - - (936) (12,729) (12,729)Treasury stock under deferred compensation arrangements 72 418 - - (72) (418) - Foreign currency translation adjustments - - (8,497) - - - (8,497)Share-based compensation expense - 11,340 - - - - 11,340 Pension adjustment, net of taxes of $(602) - - (2,244) - - - (2,244)APIC pool reclassification - (3,812) - - - - (3,812)Tax deficiency from share-based compensation expense - (106) - - - - (106)Balance - June 30, 2015 71,780 $ 226,609 $ 8,665 $ 587,302 (10,565) $ (93,495) $ 729,081 Shares issued under share-based compensation plans 1,046 9,653 - - (112) (2,004) 7,649 Net earnings - - - 65,486 - - 65,486 Purchases of treasury stock - - - - (381) (6,284) (6,284)Treasury stock under deferred compensation arrangements 14 (1,538) - - 92 1,538 - Foreign currency translation adjustments - - (15,651) - - - (15,651)Share-based compensation expense - 9,675 - - - - 9,675 Pension adjustment, net of taxes of ($1,886) - - (7,031) - - - (7,031)Tax deficiency from share-based compensation expense - (587) - - - - (587)Balance - June 30, 2016 72,840 $ 243,812 $ (14,017) $ 652,788 (10,966) $ (100,245) $ 782,338
See Notes to Consolidated Financial Statements.
9500_10Kc1.pdf August 30, 2016 pg 49

50
II-VI Incorporated and Subsidiaries Consolidated Statements of Cash Flows Year Ended June 30, 2016 2015 2014 ($000) Cash Flows from Operating Activities
Net earnings $ 65,486 $ 65,975 $ 38,449 Adjustments to reconcile net earnings to net cash provided by operating activities:
Earnings from discontinued operation, net of tax - - (133)Depreciation 44,324 41,114 41,805 Amortization 12,339 11,969 11,293 Share-based compensation expense 9,675 11,340 12,347 Impairment of intangible assets - 1,964 - (Gains) losses on foreign currency remeasurements and transactions (51) 2,178 700 Earnings from equity investment (29) (948) (698)Deferred income taxes 977 (3,781) (4,435)Excess tax benefits from share-based compensation expense (589) (335) (651)
Increase (decrease) in cash from changes in (net of effects of acquisitions and dispositions):
Accounts receivable (20,770) (10,742) (28,486)Inventories (8,650) (4,207) 12,794 Accounts payable 5,715 61 19,813 Income taxes 13,416 7,589 (6,282)Other operating net assets 1,127 7,189 (2,251)
Net cash provided by operating activities: Continuing Operations 122,970 129,366 94,265 Discontinued Operation - - 1,197
Net cash provided by operating activities 122,970 129,366 95,462 Cash Flows from Investing Activities
Additions to property, plant & equipment (58,170) (52,313) (29,220)Proceeds from the sale of business 45,000 - - Purchases of businesses, net of cash acquired (122,157) - (177,676)Other investing activities 161 67 79
Net cash used in investing activities (135,166) (52,246) (206,817)Cash Flows from Financing Activities
Proceeds from borrowings 125,200 3,000 183,000 Payments on borrowings (65,700) (68,500) (55,000)Purchases of treasury stock (6,284) (12,729) (19,973)Payments of redeemable noncontrolling interest - - (8,789)Payments on holdback arrangements - (2,350) (3,000)Proceeds from exercises of stock options 9,653 5,196 4,358 Other financing activities (1,417) (681) (1,514)
Net cash provided by (used in) financing activities 61,452 (76,064) 99,082 Effect of exchange rate changes on cash and cash equivalents (4,445) (2,082) 1,500 Net increase (decrease) in cash and cash equivalents 44,811 (1,026) (10,773)Cash and Cash Equivalents at Beginning of Period 173,634 174,660 185,433
Cash and Cash Equivalents at End of Period $ 218,445 $ 173,634 $ 174,660 Non cash transactions:
Purchase of business - earnout consideration recorded in Other liabilities $ 2,417 $ - $ - Purchases of business - earnout consideration recorded in Other accrued liabilities $ 1,935 $ - $ - Capital lease obligation incurred on facility lease $ - $ - $ 11,636 Purchases of businesses - holdback amount recorded in Other accrued liabilities $ - $ - $ 10,000
See Notes to Consolidated Financial Statements.
9500_10Kc1.pdf August 30, 2016 pg 50
51
II-VI Incorporated and Subsidiaries Notes to the Consolidated Financial Statements
Note 1. Nature of Business and Summary of Significant Accounting Policies
Nature of Business. II-VI Incorporated and its subsidiaries (the “Company,” “we,” “us,” or “our”), a global leader in engineered materials and optoelectronic components and devices, is a vertically-integrated manufacturing company that develops innovative products for diversified applications in the industrial, optical communications, military, life sciences, semiconductor equipment and consumer markets. The Company markets its products through its direct sales force and through distributors and agents.
The Company uses certain uncommon materials and compounds to manufacture its products. Some of these materials are available from only one proven outside source. The continued high quality of these materials is critical to the stability of the Company’s manufacturing yields. The Company has not experienced significant production delays due to a shortage of materials. However, the Company does occasionally experience problems associated with vendor-supplied materials not meeting specifications for quality or purity. A significant failure of the Company’s suppliers to deliver sufficient quantities of necessary high-quality materials on a timely basis could have a material adverse effect on the Company’s results of operations.
Principles of Consolidation. The Consolidated Financial Statements include the accounts of the Company. All intercompany transactions and balances have been eliminated.
Estimates. The preparation of financial statements in conformity with accounting principles generally accepted in the United States (“U.S. GAAP”) requires management to make estimates and assumptions that affect the reported amounts of assets and liabilities and disclosure of contingent assets and liabilities at the date of the financial statements and the reported amounts of revenues and expenses during the reporting period. Actual results could differ from those estimates.
Foreign Currency Translation. For II-VI Singapore Pte., Ltd. and its subsidiaries, II-VI Suisse S.a.r.l. and II-VI Laser Enterprise of the II-VI Laser Solutions segment, II-VI Network Solutions Division of the II-VI Photonics segment, and II-VI Performance Metals of the II-VI Performance Products segment the functional currency is the United States (U.S.) dollar. The determination of the functional currency is made based on the appropriate economic and management indicators.
For all other foreign subsidiaries, the functional currency is the local currency. Assets and liabilities of those operations are translated into U.S. dollars using period-end exchange rates while income and expenses are translated using the average exchange rates for the reporting period. Translation adjustments are recorded as accumulated other comprehensive income within shareholders’ equity in the accompanying Consolidated Balance Sheets.
Cash and Cash Equivalents. The Company considers highly liquid investment instruments with an original maturity of three months or less to be cash equivalents. We place our cash and cash equivalents with high credit quality financial institutions and to date have not experienced credit losses in these instruments. Cash of foreign subsidiaries is on deposit at banks in China, Vietnam, Singapore, Japan, Switzerland, the Netherlands, Germany, the Philippines, Belgium, Italy, Hong Kong, the United Kingdom and South Korea.
Accounts Receivable. The Company establishes an allowance for doubtful accounts based on historical experience and believes the collection of revenues, net of this allowance, is reasonably assured.
The Company factored a portion of the accounts receivable of its Japan subsidiary during each of the years ended June 30, 2016 and 2015. Factoring is done with high credit quality financial institutions in Japan. During the years ended June 30, 2016 and 2015, $20.5 million and $17.8 million, respectively, of accounts receivable had been factored. As of June 30, 2016 and 2015, the amount included in other accrued liabilities representing the Company’s obligation to the bank for these receivables factored with recourse was immaterial.
Inventories. Inventories are valued at the lower of cost or market (“LCM”), with cost determined on the first-in, first-out basis. Inventory costs include material, labor and manufacturing overhead. Market cannot exceed the net realizable value (i.e., estimated selling price in the ordinary course of business less reasonably predicted costs of completion and disposal) and market shall not be less than net realizable value reduced by an allowance for an approximately normal profit margin. In evaluating LCM, management also considers, if applicable, other factors as well, including known trends, market conditions, currency exchange rates and other such issues. The Company records an inventory reserve as a charge against earnings for all products on hand more than twelve to twenty-four months depending on the products that have not been sold to customers or cannot be further manufactured for sale to alternative customers. An additional reserve is recorded for product on hand that is in excess of product sold to customers over the same periods noted above. Inventories are presented net of reserves. The reserves totaled $17.7 million and $22.3 million at June 30, 2016 and 2015, respectively.
9500_10Kc1.pdf August 30, 2016 pg 51
52
Property, Plant and Equipment. Property, plant and equipment are carried at cost or fair market value upon acquisition. Major improvements are capitalized, while maintenance and repairs are generally expensed as incurred. The Company reviews its property, plant and equipment and other long-lived assets for impairment whenever events or circumstances indicate that the carrying amounts may not be recoverable. Depreciation for financial reporting purposes is computed primarily by the straight-line method over the estimated useful lives for building, building improvements and land improvements of 10 to 20 years and 3 to 20 years for machinery and equipment.
Business Combinations. The Company accounts for business acquisitions by establishing the acquisition-date fair value as the measurement for all assets acquired and liabilities assumed. Certain provisions of U.S. GAAP prescribe, among other things, the determination of acquisition-date fair value of consideration paid in a business combination (including contingent consideration) and the exclusion of transaction and acquisition-related restructuring costs from acquisition accounting. The Company accounts for contingent consideration received in accordance with the “Loss Recovery Approach” under U.S. GAAP. Contingent consideration is accounted for as a gain contingency and not recognized until all contingencies have been satisfied.
Goodwill. The excess purchase price over the fair market value allocated to identifiable tangible and intangible net assets of businesses acquired is reported as goodwill in the accompanying Consolidated Balance Sheets. The Company tests goodwill for impairment at least annually as of April 1, or when events or changes in circumstances indicate that goodwill might be impaired. The evaluation of impairment involves comparing the current fair value of the Company’s reporting units to the recorded value (including goodwill). The Company uses a discounted cash flow (“DCF”) model and a market analysis to determine the current fair value of its reporting units. A number of significant assumptions and estimates are involved in estimating the forecasted cash flows used in the DCF model, including markets and market shares, sales volume and pricing, costs to produce, working capital changes and income tax rates. Management considers historical experience and all available information at the time the fair values of the reporting units are estimated.
The Company has the option to perform a qualitative assessment of goodwill prior to completing the two-step process described above to determine whether it is more likely than not that the fair value of a reporting unit is less than its carrying amount, including goodwill and other intangible assets. If the Company concludes that this is the case, it must perform the two-step process. Otherwise, the Company will forego the two-step process and does not need to perform any further testing.
Intangibles. Intangible assets are initially recorded at their cost or fair market value upon acquisition. Finite-lived intangible assets are amortized for financial reporting purposes using the straight-line method over the estimated useful lives of the assets ranging from 5 to 20 years. Indefinite-lived intangible assets are not amortized but tested annually for impairment at April 1, or when events or changes in circumstances indicate that indefinite-lived intangible assets might be impaired.
Equity Method Investments. The Company has an equity investment in Guangdong Fuxin Electronic Technology (“Fuxin”) based in Guangdong Province, China of 20.2%, which is accounted for under the equity method of accounting. The total carrying value of the investment recorded at June 30, 2016 and June 30, 2015 was $11.4 million and $11.9 million, respectively. During the years ended June 30, 2016, 2015 and 2014, the Company’s pro-rata share of earnings from this investment was less than $0.1 million, $0.9 million and $0.7 million, respectively, and was recorded in other expense (income), net in the Consolidated Statements of Earnings. During the years ended June 30, 2016, 2015 and 2014 the Company recorded dividends from this equity investment of $0.6 million, $0.6 million and $0.3 million, respectively.
Commitments and Contingencies. Liabilities for loss contingencies arising from claims, assessments, litigation, fines, and penalties and other sources are recorded when it is probable that a liability has been incurred and the amount of the assessment and/or remediation can be reasonably estimated. Legal costs incurred in connection with loss contingencies are expensed as incurred. Such accruals are adjusted as further information develops or circumstances change. The Company had no loss contingency liabilities at June 30, 2016 related to commitments and contingencies.
Accrued Bonus and Profit Sharing Contribution. The Company records bonus and profit sharing estimates as a charge against earnings. These estimates are adjusted to actual based on final results of operations achieved during the fiscal year. Certain partial bonus amounts are paid on an interim basis, and the remainder is paid after the fiscal year end after the final determination of the applicable percentage or amounts. Other bonuses are paid annually.
Warranty Reserve. The Company records a warranty reserve as a charge against earnings based on a percentage of revenues utilizing actual returns over a period that approximates historical warranty experience with adjustments possible for changes in product lines or unusual conditions that come to the Company’s attention.
Income Taxes. Deferred income tax assets and liabilities are determined based on the differences between the consolidated financial statement and tax basis of assets and liabilities using enacted tax rates in effect in the years in which the differences are expected to reverse. Valuation allowances are established when necessary to reduce deferred income tax assets to the amount more likely than not
9500_10Kc1.pdf August 30, 2016 pg 52

53
to be realized. The Company adopted an accounting policy to apply acquired deferred tax liabilities to pre-existing deferred tax assets before evaluating the need for a valuation allowance for acquired deferred tax assets.
The Company recognizes the tax benefit from an uncertain tax position only if it is more likely than not that the tax position will be sustained on examination by the taxing authorities, based on the technical merits of the position. The tax benefits recognized in the financial statements from such a position are measured based on the largest benefit that has a greater than 50% likelihood of being realized upon ultimate resolution. The amount of unrecognized tax benefits is adjusted for changes in facts and circumstances. For example, adjustments could result from significant amendments to existing tax law and the issuance of regulations or interpretations by the taxing authorities, new information obtained during a tax examination, or resolution of an examination. The Company believes that its estimates for uncertain tax positions are appropriate and sufficient to pay assessments that may result from examinations of its tax returns. The Company recognizes both accrued interest and penalties related to unrecognized tax benefits in income tax expense.
Revenue Recognition. The Company recognizes revenues for product shipments when persuasive evidence of a sales arrangement exists, the product has been shipped or delivered, the sale price is fixed or determinable and collectability is reasonably assured. Title and risk of loss passes from the Company to its customer at the time of shipment in most cases with the exception of certain customers. For these customers, title does not pass and revenue is not recognized until the customer has received the product at its physical location.
We establish an allowance for doubtful accounts based on historical experience and believe the collection of revenues, net of this reserve, is reasonably assured. Our reserve estimate has historically been proven to be materially correct based upon actual charges incurred.
The Company’s revenue recognition policy is consistently applied across the Company’s segments, product lines and geographical locations. Further for the periods covered herein, we did not have post shipment obligations such as training or installation, customer acceptance provisions, credits and discounts, rebates and price protection, or other similar privileges. Our distributors and agents are not granted price protection. Our distributors and agents, which comprise less than 10% of consolidated revenues, have no additional product return rights beyond the right to return defective products covered by our warranty policy. Revenues generated from transactions other than product shipments are contract related and have historically accounted for less than 2% of consolidated revenues. We believe our revenue recognition practices have adequately considered the requirements under U.S. GAAP.
Shipping and Handling Costs. Shipping and handling costs billed to customers are included in revenues. Shipping and handling costs incurred by the Company are included in selling, general and administrative expenses in the accompanying Consolidated Statements of Earnings. Total shipping and handling revenue and costs included in revenues and in selling, general and administrative expenses were not significant for the fiscal years ended June 30, 2016, 2015 and 2014.
Research and Development. Internal research and development costs and costs not related to customer and government funded research and development contracts are expensed as incurred.
Share-Based Compensation. Share-based compensation arrangements requires the recognition of the grant-date fair value of stock compensation in net earnings. The Company recognizes the share-based compensation expense over the requisite service period of the individual grantees, which generally equals the vesting period.
Workers’ Compensation. The Company is self-insured for certain losses related to workers’ compensation for the majority of its U.S. employees. When estimating the self-insurance liability, the Company considers a number of factors, including historical claims experience, demographic and severity factors and valuations provided by independent third-party consultants. At least annually, management reviews its assumptions and valuations to determine the adequacy of the self-insurance liability.
Accumulated Other Comprehensive Income. Accumulated other comprehensive income is a measure of all changes in shareholders’ equity that result from transactions and other economic events in the period other than transactions with owners. Accumulated other comprehensive income is a component of shareholders’ equity and consists of accumulated foreign currency translation adjustments of ($6.2) million and $9.5 million as of June 30, 2016 and 2015, respectively, and pension adjustments of ($7.8) million and ($0.8) million as of June 30, 2016 and 2015, respectively.
Fair Value Measurements. The Company applies fair value accounting for all financial assets and liabilities that are required to be recognized or disclosed at fair value in the financial statements. Fair value is defined as the price that would be received from selling an asset or paid to transfer a liability in an orderly transaction between market participants at the measurement date. When determining the fair value measurements for assets and liabilities, the Company considers the principal or most advantageous market in which the Company would transact, and the market-based risk measurements or assumptions that market participants would use in pricing the asset or liability, such as inherent risk, transfer restrictions and credit risk.
9500_10Kc1.pdf August 30, 2016 pg 53

54
Leases. The Company classifies leases as operating in accordance with the provisions of lease accounting. Rent expense under noncancelable operating leases with scheduled rent increases or rent holidays is accounted for on a straight-line basis over the lease term, beginning on the date of initial possession or the effective date of the lease agreement. The amount of the excess of straight-line rent expense over scheduled payments is recorded as a deferred liability. The current portion of unamortized deferred lease costs is included in other accrued liabilities and the long-term portion is included in other liabilities in the Consolidated Balance Sheets.
Recently Issued Financial Accounting Standards
Adopted Pronouncements
In November 2015, the Financial Accounting Standards Board (“FASB”) issued Accounting Standard Update (“ASU”) 2015-17, Income Taxes (Topic 740): Balance Sheet Classification of Deferred Taxes. This update requires all deferred tax assets and liabilities, and any related valuation allowance, to be classified as noncurrent on the balance sheet. The classification change for all deferred taxes as noncurrent simplifies the Company’s processes as it eliminates the need to separately identify the net current and net noncurrent deferred tax asset or liability in each jurisdiction and allocate valuation allowances. The Company early adopted this standard and has elected to prospectively adopt the accounting standard in the quarter ended December 31, 2015. The adoption of this standard resulted in the reclassification of $13.3 million from current deferred income tax assets in the Consolidated Balance Sheet as of December 31, 2015 to noncurrent deferred income tax assets and $1.0 million from current deferred income tax liabilities to noncurrent deferred income tax liabilities. Prior periods in the Company’s Consolidated Financial Statements were not retrospectively adjusted.
Pronouncements Currently Under Evaluation
In May 2016, the FASB issued ASU 2016-12, Revenue from Contracts with Customers (Topic 606): Narrow-Scope Improvements and Practical Expedients. The amendments in the update do not change the core principle of the guidance in Topic 606. Rather, the amendments in this update affect only narrow aspects of Topic 606. The update will be effective for the Company’s 2019 fiscal year. The Company is evaluating the impact of this guidance on the Company’s Consolidated Financial Statements.
In March 2016, the FASB issued ASU 2016-09, Compensation – Stock Compensation (Topic 718): Improvements to Employee Share-Based Payment Accounting. This update simplifies several aspects of the accounting for employee share-based payment transactions, including the accounting for income taxes, forfeitures, statutory tax withholding requirements, and classification in the statement of cash flows. The standard will be effective for the Company’s 2017 fiscal year. Early adoption is permitted. The Company is evaluating the impact of this guidance on the Company’s Consolidated Financial Statements.
In March 2016, the FASB issued ASU 2016-07, Investments – Equity Method and Joint Ventures (Topic 323): Simplifying the Transition to the Equity Method of Accounting. This update eliminates the requirement to retrospectively apply the equity method as a result of an increase in the level of ownership interest. The ASU also requires unrealized holding gains or losses in accumulated other comprehensive income related to an available for sale security that becomes eligible for the equity method to be recognized in earnings when it qualifies for the equity method. The standard will be effective for the Company’s 2018 fiscal year. The adoption of this ASU is not expected to have a material effect on the Company’s Consolidated Financial Statements.
In February 2016, the FASB issued ASU 2016-02, Leases (Topic 842): This update requires that a lessee recognize leased assets with terms greater than 12 months on the balance sheet for the rights and obligations created by those leases. The standard will be effective for the Company’s 2019 fiscal year. Early adoption is permitted. The Company is evaluating the impact of this guidance on the Company’s Consolidated Financial Statements.
In September 2015, the FASB issued ASU 2015-16, Business Combinations (Topic 805): Simplifying the Accounting for Measurement-Period Adjustments. This update requires that an acquirer recognize adjustments to provisional amounts that are identified during the measurement period in the reporting period in which the adjustment amounts are determined. The standard will be effective for the Company’s 2017 fiscal year. Early adoption is permitted. The adoption of this ASU is not expected to have a material effect on the Company’s Consolidated Financial Statements.
In July 2015, the FASB issued ASU 2015-11, Inventory (Topic 330): Simplifying the Measurement of Inventory. This update simplifies the measurement of inventory valuation at the lower of cost or net realizable value. Net realizable value is the estimated selling price in the ordinary course of business, less reasonably predictable costs of completion, disposal and transportation. The new inventory measurement requirements will be effective for the Company’s 2018 fiscal year and will replace the current inventory valuation guidance that requires the use of a lower of cost or market framework. The adoption of this ASU is not expected to have a material effect on the Company’s Consolidated Financial Statements.
In April 2015, the FASB issued ASU 2015-05, Intangibles - Goodwill and Other - Internal-Use Software (Subtopic 350-40): Customer’s Accounting for Fees Paid in a Cloud Computing Arrangement. This update provides guidance about whether a cloud
9500_10Kc1.pdf August 30, 2016 pg 54

55
computing arrangement includes a software license. The update will be effective for the Company’s 2017 fiscal year. Early adoption is permitted. The update allows for the use of either a prospective or retrospective adoption approach. The adoption of this ASU is not expected to have a material effect on the Company’s Consolidated Financial Statements.
In April 2015, the FASB issued ASU 2015-03, Interest – Imputation of Interest (Subtopic 835-30): Simplifying the Presentation of Debt Issuance Costs. This ASU requires entities to present debt issuance costs in the balance sheet as a direct deduction from the carrying amount of the corresponding debt liability, consistent with debt discounts. The update will be effective for the Company’s 2017 fiscal year. The adoption of this ASU is not expected to have a material effect on the Company’s Consolidated Financial Statements.
In February 2015, the FASB issued ASU 2015-02, Consolidation (Topic 810): Amendments to the Consolidation Analysis, which affects reporting organizations that are required to evaluate whether they should consolidate certain legal entities. The update will be effective for the Company’s 2017 fiscal year. Early adoption is permitted, including adoption in an interim period. The update allows for the use of either a full retrospective or a modified retrospective adoption approach. The adoption of this ASU is not expected to have a material effect on the Company’s Consolidated Financial Statements.
In May 2014, the FASB issued ASU 2014-09: Revenue from Contracts with Customers (Topic 606) which supersedes virtually all existing revenue recognition guidance under U.S. GAAP. The update's core principle is that an entity should recognize revenue to depict the transfer of promised goods or services to customers in an amount that reflects the consideration to which the entity expects to be entitled in exchange for those goods or services. The update allows for the use of either the retrospective or modified retrospective approach of adoption. On July 9, 2015 the FASB approved a one year deferral of the effective date of the update. The update will be effective for the Company’s 2019 fiscal year. The Company has not yet selected a transition method and are currently evaluating the impact of this guidance on the Company’s Consolidated Financial Statements. Note 2. Acquisitions/Divesture
Acquisition of EpiWorks, Inc.
In February 2016, the Company acquired all the outstanding shares of EpiWorks, Inc. (“EpiWorks”) a privately held company based in Illinois. Under the terms of the merger agreement, the consideration consisted of initial cash paid at the acquisition date of $43.0 million, net of cash acquired and a working capital adjustment of $0.2 million. In addition, the agreement provides up to a maximum of $6.0 million of additional cash earnout opportunities based upon EpiWorks achieving certain agreed upon financial and operational targets for capacity, wafer output and gross margin, which if earned would be payable in the amount of $2.0 million for the achievement of each specific annual target over the next three years. EpiWorks develops and manufactures compound semiconductor epitaxial wafers for applications in optical components, wireless devices and high-speed communication systems. EpiWorks is a business unit of the Company’s II-VI Laser Solutions operating segment for financial reporting purposes. Due to the timing of the acquisition, the Company is still in the process of completing its fair market valuation, primarily relating to the valuation of the earnout arrangement as well as deferred income taxes.
The following table presents the allocation of the purchase price at the date of acquisition ($000):
Net cash paid at acquisition $ 42,981 Cash paid for working capital adjustment 163 Fair value of cash earnout arrangement 4,352 Purchase price $ 47,496
The following table presents the preliminary allocation of the purchase price of the assets acquired and liabilities assumed at the date of acquisition, as the Company intends to finalize its accounting for the acquisition of EpiWorks within one year from the date of acquisition ($000):
9500_10Kc1.pdf August 30, 2016 pg 55

56
Assets Accounts receivable $ 2,121 Inventories 2,435 Prepaid and other assets 68 Property, plant & equipment 9,043 Intangible assets 14,124 Goodwill 27,588 Total assets acquired $ 55,379
Liabilities
Accounts payable $ 605 Other accrued liabilities 859 Deferred tax liabilities 6,419 Total liabilities assumed 7,883 Net assets acquired $ 47,496
The goodwill of $27.6 million is included in the II-VI Laser Solutions segment and is attributed to the expected synergies and the assembled workforce of EpiWorks. None of the goodwill is deductible for income tax purposes. The fair value of accounts receivable acquired was $2.1 million with the gross contractual amount being $2.1 million. At the time of acquisition, the Company expected to collect all of the accounts receivable. The Company expensed transaction costs of $0.4 million for the year ended June 30, 2016.
The amount of revenues and net loss of EpiWorks included in the Company’s Consolidated Statement of Earnings were $2.5 million and $1.8 million, respectively, for the year ended June 30, 2016.
Acquisition of ANADIGICS, Inc.
In March 2016, the Company acquired all the outstanding shares of ANADIGICS (Nasdaq:ANAD), which was a publicly traded company based in New Jersey. Under the terms of the merger agreement, the consideration consisted of both a working capital advance of $3.5 million and cash paid of $78.2 million at the acquisition date, net of cash acquired of $2.7 million. ANADIGICS has a 6-inch gallium arsenide wafer fabrication capability allowing for the production of high performance lasers and integrated circuits in high volume. In addition, at the time of the acquisition, ANADIGICS designed and manufactured innovative radio frequency (RF) solutions for CATV infrastructure, small-cell, WIFI and cellular markets. The Company divested this portion of the business in June 2016. In conjunction with the sale of the RF business, the Company renamed ANADIGICS as II-VI Optoelectronic Devices Division. OED is a business unit of the Company’s II-VI Laser Solutions operating segment for financial reporting purposes. Due to the timing of the acquisition, the Company is still in the process of completing its fair market valuation, primarily relating to the valuation of property, plant and equipment as well as deferred income taxes.
The following table presents the preliminary allocation of the purchase price of the assets acquired and liabilities assumed at the date of acquisition as the Company intends to finalize its accounting for the acquisition of ANADIGICS within one year from the date of acquisition ($000):
Assets Accounts receivable $ 3,973 Inventories 8,322 Prepaid and other assets 2,347 Property, plant & equipment 25,810 Intangible assets 1,060 Goodwill 48,312 Total assets acquired $ 89,824
Liabilities Accounts payable $ 3,586 Other accrued liabilities 7,226 Total liabilities assumed 10,812 Net assets acquired $ 79,012
The following adjustments were made at June 30, 2016 to ANADIGICS’ preliminary opening balance sheet from the preliminary balances recorded at March 31, 2016:
9500_10Kc1.pdf August 30, 2016 pg 56

57
The carrying amount of property, plant & equipment decreased $15.7 million to reflect further refinement of the valuation procedures employed and reflected increased levels of economic obsolescence.
The identifiable intangible assets decreased $22.5 million.
The carrying amount of goodwill increased $27.3 million.
The impact of the changes was not material to either depreciation expense or amortization expense as the acquisition occurred on March 15, 2016.
The goodwill of $48.3 million is included in the II-VI Laser Solutions segment and is attributed to the expected synergies and the assembled workforce of ANADIGICS. None of the goodwill is deductible for income tax purposes. In conjunction with the June 3, 2016 sale of the RF business noted below, the Company disposed of $35.4 million of goodwill. The fair value of accounts receivable acquired was $4.0 million with the gross contractual amount being $4.0 million. At the time of acquisition, the Company expected to collect all of the accounts receivable. The Company expensed transaction costs of $2.9 million for the year ended June 30, 2016.
The amount of revenues and net loss of ANADIGICS included in the Company’s Consolidated Statement of Earnings were $11.4 million and $9.2 million, respectively, for the year ended June 30, 2016.
Deferred Income Taxes
In connection with above acquisitions, the Company adopted an accounting policy to apply acquired deferred tax liabilities to pre-existing deferred tax assets before evaluating the need for a valuation allowance for acquired deferred tax assets. During fiscal year 2016, the Company recorded a $36.2 million valuation allowance within purchase accounting as a result of the Company incurring a cumulative U.S. three year loss.
Pro Forma Information (Unaudited)
The following unaudited pro forma consolidated results of operations for the year ended June 30, 2016 and 2015 have been prepared as if the acquisitions of EpiWorks and ANADIGICS had occurred on July 1, 2014, the beginning of the Company’s fiscal year 2015, which is the fiscal year prior to the acquisitions. As a result, certain transaction related expenses of $3.3 million (net of tax) recorded in Selling, general and administrative in the Company’s Consolidated Statement of Earnings for the year ended June 30, 2016 were only included in the earliest period presented below ($000 except per share data).
Year Ended June 30, 2016 2015 Net revenues $ 866,349 $ 831,050 Net earnings $ 39,762 $ 32,053 Basic earnings per share $ 0.65 $ 0.52 Diluted earnings per share $ 0.63 $ 0.51
The pro forma results are not necessarily indicative of what actually would have occurred if the transactions had occurred as described above. The pro forma results are not intended to be a projection of future results and do not reflect any cost savings that might be achieved from the combined operations.
Divesture of the RF Business of ANADIGICS
On June 3, 2016, the Company sold the RF business of ANADIGICS that it acquired on March 15, 2016. The consideration consisted of $45.0 million of cash received at closing, a working capital adjustment of $0.6 million to be received within 60 days after closing and $5.0 million contingent consideration to be earned based upon supplying minimum volumes of wafers to the purchaser over an 18-month period through December 2017. The $5.0 million contingent consideration will be recognized in net earnings when earned and received from the purchaser. The Company believes the sale of this non-strategic business will allow the Company to focus its financial resources and devote greater attention to the 6-inch wafer fab business. The Company incurred approximately $0.4 million in transaction expenses and recorded an immaterial gain of less than $0.1 million on the sale of the RF business.
The following table presents the carrying value of the assets and liabilities included as part of the disposal of the RF business of ANADIGICS ($000):
9500_10Kc1.pdf August 30, 2016 pg 57

58
Assets Inventories $ 5,378 Equipment 5,813 Goodwill 35,352 $ 46,543
Liabilities Accounts payable $ 963 Total Consideration $ 45,580
In conjunction with the sale of the RF business, the Company recorded approximately $7.5 million of severance expense for employees of the business. The amount of revenue and net loss from the RF business of ANADIGICS from the acquisition date to the date of sale included in the Company’s Consolidated Statements of Earnings were $10.1 million and $8.4 million, respectively, for the year ended June 30, 2016.
Note 3. Inventories
The components of inventories, net of reserves, were as follows:
June 30, 2016 2015 ($000) Raw materials $ 70,623 $ 71,210 Work in progress 57,566 52,726 Finished goods 46,944 40,452 $ 175,133 $ 164,388
Note 4. Property, Plant and Equipment
Property, plant and equipment consist of the following:
June 30, 2016 2015 ($000) Land and land improvements $ 4,990 $ 4,566 Buildings and improvements 110,219 91,171 Machinery and equipment 409,551 366,560 Construction in progress 34,602 17,749 559,362 480,046 Less accumulated depreciation (316,505) (276,234) $ 242,857 $ 203,812
During the quarter ended March 31, 2016, the Company’s one year timeframe to sell its manufacturing facility in New Port Ritchey, Florida under U.S. GAAP accounting for assets held for sale expired. The Company reclassified the carrying value of the land and building of approximately $1.2 million from Prepaid and other current assets to Property, plant & equipment in the Consolidated Balance Sheet at June 30, 2016. The Company cumulatively adjusted suspended depreciation for the period in which the asset was classified as held for sale. The depreciation adjustment was insignificant.
Depreciation expense was $44.3 million, $41.1 million and $41.8 million for the fiscal years ended June 30, 2016, 2015 and 2014, respectively.
Included in the cost and accumulated depreciation of property, plant and equipment is the effect of foreign currency translation on the portion relating to the Company’s foreign subsidiaries.
Note 5. Goodwill and Other Intangible Assets
Goodwill represents the excess of the cost over the net tangible and identifiable intangible assets of acquired businesses. Identifiable intangible assets acquired in business combinations are recorded based upon fair market value at the date of acquisition.
9500_10Kc1.pdf August 30, 2016 pg 58

59
In connection with the two acquisitions completed in fiscal year 2016, the Company recorded the excess purchase price over the net assets of the business acquired as goodwill in the accompanying Consolidated Balance Sheets, based on the preliminary purchase price allocation.
In connection with the sale of ANADIGICS’ RF business on June 3, 2016, the Company disposed of $35.4 million of goodwill attributed to the RF business that was sold. The goodwill allocated to the RF business of ANADIGICS was based on a relative fair value allocation approach in accordance with authoritative accounting guidance.
Changes in the carrying amount of goodwill were as follows ($000): Year Ended June 30, 2016 II-VI Laser II-VI II- VI Performance Solutions Photonics Products Total Balance-beginning of period $ 43,578 $ 99,426 $ 52,890 $ 195,894 Goodwill acquired 75,900 - - 75,900 Goodwill attributed to the RF business sold (35,352) - - (35,352)Foreign currency translation (21) (2,666) - (2,687)Balance-end of period $ 84,105 $ 96,760 $ 52,890 $ 233,755
Year Ended June 30, 2015 II-VI Laser II-VI II- VI Performance Solutions Photonics Products Total Balance-beginning of period $ 44,041 $ 99,214 $ 52,890 $ 196,145 Foreign currency translation (463) 212 - (251)Balance-end of period $ 43,578 $ 99,426 $ 52,890 $ 195,894
The Company reviews the recoverability of goodwill at least annually and any time business conditions indicate a potential change in recoverability. The measurement of a potential impairment begins with comparing the current fair value of the Company’s reporting units to the recorded value (including goodwill). The Company used a discounted cash flow (DCF) model and a market analysis to determine the current fair value of all its reporting units. A number of significant assumptions and estimates are involved in estimating the forecasted cash flows used in the DCF model, including markets and market shares, sales volume and pricing, costs to produce, working capital changes and income tax rates. Management considers historical experience and all available information at the time the fair values of the reporting units are estimated. The Company has the option to perform a qualitative assessment of goodwill to determine whether it is more likely than not that the fair value of a reporting unit is less than its carrying amount, including goodwill and other intangible assets. As of April 1 of fiscal years 2016 and 2015, the Company completed its annual impairment tests of its reporting units. Based on the results of these analyses, the Company’s goodwill was not impaired.
The gross carrying amount and accumulated amortization of the Company’s intangible assets other than goodwill as of June 30, 2016 and 2015 were as follows ($000): June 30, 2016 June 30, 2015 Gross Net Gross Net Carrying Accumulated Book Carrying Accumulated Book Amount Amortization Value Amount Amortization Value Technology and Patents $ 54,344 $ (22,724) $ 31,620 $ 50,520 $ (18,838) $ 31,682 Trade Names 15,869 (1,209) 14,660 15,869 (1,111) 14,758 Customer Lists 112,141 (33,912) 78,229 102,489 (26,583) 75,906 Other 1,571 (1,490) 81 1,572 (1,456) 116 Total $ 183,925 $ (59,335) $ 124,590 $ 170,450 $ (47,988) $ 122,462
Amortization expense recorded on the intangible assets for the fiscal years ended June 30, 2016, 2015 and 2014 was $12.3 million, $12.0 million, and $11.3 million, respectively. The technology and patents are being amortized over a range of 60 to 240 months with a weighted-average remaining life of approximately 101 months. The customer lists are being amortized over 60 to 240 months with a weighted-average remaining life of approximately 144 months.
In conjunction with the acquisitions of EpiWorks and ANADIGICS, the Company recorded $4.6 million of technology and patents, $10.3 million of customer lists, and $0.3 million of trade names. The intangibles were recorded based on the Company’s preliminary purchase price allocation which is expected to be finalized within one year from the date of acquisitions.
9500_10Kc1.pdf August 30, 2016 pg 59

60
In connection with past acquisitions, the Company acquired trade names with indefinite lives. The carrying amount of these trade names of $14.1 million as of June 30, 2016 is not amortized but tested annually for impairment. The Company completed its impairment test of these trade names with indefinite lives in the fourth quarter of fiscal years 2016 and 2015. Based on the results of these tests, the trade names were not impaired in fiscal year 2016.
During the year ended June 30, 2015, the Company recognized an impairment charge on two of its indefinite lived trade names in the II-VI Photonics reporting unit as these trade names were abandoned as a result of the Company’s rebranding efforts. Total impairment recorded during the year ended June 30, 2015 was $2.0 million, which represented the entire carrying value of these two trade names and was recorded in other expense (income), net in the Consolidated Statements of Earnings.
Included in the gross carrying amount and accumulated amortization of the Company’s technology and patents, customer list and other component of intangible assets and goodwill is the effect of the foreign currency translation on the portion relating to the Company’s German and China subsidiaries. The estimated amortization expense for existing intangible assets for each of the five succeeding years is as follows ($000):
Year Ending June 30, 2017 $ 12,515 2018 12,108 2019 11,789 2020 11,048 2021 10,181
Note 6. Debt
The components of debt were as follows ($000):
June 30, 2016 2015 Line of credit, interest at LIBOR, as defined, plus 1.5% and 1.25%, respectively $ 188,000 $ 108,500 Term loan, interest at LIBOR, as defined, plus 1.5% and 1.25%, respectively 45,000 65,000 Yen denominated line of credit, interest at LIBOR, as defined, plus 0.625% 2,917 2,457 Total debt 235,917 175,957 Current portion of long-term debt (20,000) (20,000)Long-term debt, less current portion $ 215,917 $ 155,957
The Company’s Second Amended and Restated Credit Agreement (the “Credit Facility”) provides for a revolving credit facility of $225 million, as well as a $100 million Term Loan (“the Term Loan”). The Term Loan is being repaid in consecutive quarterly principal payments on the first business day of each January, April, July and October, with the first payment having commenced on October 1, 2013, as follows: (i) twenty consecutive quarterly installments of $5 million and (ii) a final installment of all remaining principal due and payable on the maturity date. The Credit Facility is unsecured, but is guaranteed by each existing and subsequently acquired or organized wholly-owned domestic subsidiaries of the Company. The Company has the option to request an increase to the size of the Amended Credit Facility in an aggregate additional amount not to exceed $100 million. The Credit Facility has a five-year term through September 10, 2018. Amounts borrowed under the revolving credit facility are due and payable on the maturity date and has an interest rate of either a Base Rate Option or a Euro-Rate Option, plus an Applicable Margin, as defined in the agreement governing the Credit Facility. If the Base Rate option is selected for a borrowing, the Applicable Margin is 0.00% to 0.075% and if the Euro-Rate Option is selected for a borrowing, the Applicable Margin is 0.75% to 1.75%. The Applicable Margin is based on the Company’s ratio of consolidated indebtedness to consolidated EBITDA. Additionally, the Credit facility is subject to certain covenants, including those relating to minimum interest coverage and maximum leverage ratios. As of June 30, 2016, the Company was in compliance with all financial covenants under the Credit Facility.
The Company’s Yen denominated line of credit is a 500 million Yen ($4.9 million) facility. The Yen line of credit was extended in September 2015 through August 2020 on substantially the same terms. The interest rate equal to LIBOR, as defined in the loan agreement, plus 0.625% to 1.50%. At June 30, 2016 the Company had 300 million yen outstanding under the line of credit. Additionally, the facility is subject to certain covenants, including those relating to minimum interest coverage and maximum leverage ratios. As of June 30, 2016, the Company had $2.9 million outstanding and was in compliance with all financial covenants under its Yen facility.
9500_10Kc1.pdf August 30, 2016 pg 60

61
The Company had aggregate availability of $37.7 million and $116.6 million under its lines of credit as of June 30, 2016 and 2015, respectively. The amounts available under the Company’s lines of credit are reduced by outstanding letters of credit. As of June 30, 2016 and 2015, total outstanding letters of credit supported by the credit facilities were $1.2 million and $1.5 million, respectively.
The weighted-average interest rate of total borrowings for each of the years ended June 30, 2016 and 2015 was 1.6% and 1.8%, respectively. The weighted-average of total borrowings for the fiscal years ended June 30, 2016 and 2015 was $193.7 million and $210.0 million, respectively.
The Company has a line of credit facility with a Singapore bank which permits maximum borrowings in the local currency of approximately $0.6 million and $0.3 million for the fiscal years ended June 30, 2016 and 2015. Borrowings are payable upon demand with interest charged at the rate of 1.00% above the bank’s prevailing prime lending rate. The interest rate was 5.25% at June 30, 2016 and June 30, 2015. At June 30, 2016 and 2015, there were no outstanding borrowings under this facility. The Company had $0.2 million of letters of credit supported by the Singapore line of credit facility as of June 30, 2016 and 2015.
There are no interim maturities or minimum payment requirements related to the credit facilities before their respective expiration dates. Interest and commitment fees paid during the fiscal year ended June 30, 2016, 2015 and 2014 were $3.1 million and $4.0 million and $4.2 million, respectively.
Remaining annual principal payments under the Company’s existing credit facilities as of June 30, 2016 were as follows ($000):
U.S. Dollar
Term Yen Line Line of Period Loan of Credit Credit Total Year 1 $ 20,000 $ - $ - $ 20,000 Year 2 20,000 - - 20,000 Year 3 5,000 - 188,000 193,000 Year 4 - - - - Year 5 - 2,917 - 2,917
Thereafter - - - - Total $ 45,000 $ 2,917 $ 188,000 $ 235,917
Note 7. Income Taxes
The components of earnings (losses) from continuing operations before income taxes were as follows:
Year Ended June 30, 2016 2015 2014 ($000)
U.S. loss $ (5,809) $ (5,326) $ (2,863)Non-U.S. income 95,764 84,438 48,504
Earnings from continuing operations before income taxes $ 89,955 $ 79,112 $ 45,641
9500_10Kc1.pdf August 30, 2016 pg 61

62
The components of income tax expense from continuing operations were as follows:
Year Ended June 30, 2016 2015 2014 ($000) Current:
Federal $ 3,704 $ (146) $ (1,067)State 5 86 152 Foreign 19,783 16,978 12,675
Total Current $ 23,492 $ 16,918 $ 11,760 Deferred:
Federal $ 2,759 $ (2,762) $ (16)State 1,302 (251) 148 Foreign (3,084) (768) (4,567)
Total Deferred $ 977 $ (3,781) $ (4,435)Total Income Tax Expense $ 24,469 $ 13,137 $ 7,325
Principal items comprising deferred income taxes were as follows:
June 30, 2016 2015 ($000) Deferred income tax assets Inventory capitalization $ 6,814 $ 6,614 Non-deductible accruals 2,212 1,902 Accrued employee benefits 15,543 10,297 Net-operating loss and credit carryforwards 43,516 22,232 Share-based compensation expense 11,693 13,222 Other 1,770 1,468 Valuation allowances (42,641) (2,713)Total deferred income tax assets $ 38,907 $ 53,022 Deferred income tax liabilities Tax over book accumulated depreciation $ (9,759) $ (15,937)Intangible assets (29,628) (25,132)Tax on unremitted earnings (797) (1,753)Other (1,978) (2,520)Total deferred income tax liabilities $ (42,162) $ (45,342)Net deferred income taxes $ (3,255) $ 7,680
The reconciliation of income tax expense at the statutory federal rate to the reported income tax expense is as follows: Year Ended June 30, 2016 % 2015 % 2014 % ($000) Taxes at statutory rate $ 31,484 35 $ 27,689 35 $15,974 35 Increase (decrease) in taxes resulting from: State income taxes-net of federal benefit 864 1 (196) - 254 1 Taxes on non U.S. earnings (13,860) (15) (11,687) (15) (6,672) (15)Valuation allowance 8,464 9 678 1 (595) (1)Research and manufacturing incentive deductions (3,074) (3) (2,573) (3) (2,190) (5)Other 591 - (774) (1) 554 1
$ 24,469 27 $ 13,137 17 $ 7,325 16
During the fiscal years ended June 30, 2016, 2015, and 2014, net cash paid by the Company for income taxes was $18.5 million, $13.0 million, and $17.2 million, respectively.
Our foreign subsidiaries in the Philippines operate under various tax holiday arrangements. The benefits of such arrangements phase out through the fiscal year ended June 30, 2019. The impact of the tax holidays on our effective rate is a reduction in the rate of 0.37%, 0.22% and 0.12% for the fiscal years ended June 30, 2016, 2015 and 2014, respectively.
9500_10Kc1.pdf August 30, 2016 pg 62

63
The cumulative amount of the Company’s foreign undistributed net earnings for which no deferred taxes have been provided was approximately $479 million at June 30, 2016. If the earnings of such foreign subsidiaries were not indefinitely reinvested, an additional deferred tax liability of approximately $89 million would have been required as of June 30, 2016. It is the Company’s intention to permanently reinvest substantially all of its undistributed earnings of its foreign subsidiaries; therefore, no provision has been made for future income taxes on the undistributed earnings of the majority of foreign subsidiaries, as they are considered indefinitely reinvested. The Company has provided a deferred tax liability for future income taxes on the earnings of certain foreign subsidiaries as these earnings are planned to be repatriated.
The Company has the following gross operating loss carryforwards and tax credit carryforwards as of June 30, 2016:
Type Amount Expiration Date($000) Tax credit carryforwards:
Federal research and development credits $ 8,479 June 2019-June 2036Foreign tax credits 2,594 June 2024-June 2026State tax credits 3,218 June 2017-June 2036
Operating loss carryforwards: Loss carryforwards - federal $ 93,081 June 2021-June 2036Loss carryforwards - state 48,934 June 2017-June 2036Loss carryforwards - foreign 2,049 June 2017-June 2024
The Company has recorded a valuation allowance against the majority of the loss and credit carryforwards. The Company’s federal loss carryforwards, federal research and development credit carryforwards, and certain state tax credits resulted from the Company’s acquisitions of Photop, Aegis, M Cubed, EpiWorks, and ANADIGICS are subject to various annual limitations under Section 382 of the Internal Revenue Code.
Changes in the liability for unrecognized tax benefits for the fiscal years ended June 30, 2016, 2015 and 2014 were as follows:
2016 2015 2014 ($000) Balance at Beginning of Year $ 4,022 $ 2,775 $ 3,181 Increases in current year tax positions 2,146 2,450 298 Increases in prior year tax positions 190 203 2 Decreases in prior year tax positions (67) - - Settlements - - - Expiration of statute of limitations (732) (1,406) (706)Balance at End of Year $ 5,559 $ 4,022 $ 2,775
The Company classifies all estimated and actual interest and penalties as income tax expense. During the fiscal years 2016 and 2014, there were no interest and penalties within income tax expense. During the fiscal year 2015, there was a benefit of $0.1 million of interest and penalties within tax expense. The Company had $0.1 million, $0.1 million, and $0.2 million of interest and penalties accrued at June 30, 2016, 2015, and 2014, respectively. The increase in the Company’s current year tax positions are the result of certain unrecognized tax benefits associated with transfer pricing. The Company has classified the uncertain tax positions as non-current income tax liabilities as the amounts are not expected to be paid within one year. Including tax positions for which the Company determined that the tax position would not meet the more likely than not recognition threshold upon examination by the tax authorities based upon the technical merits of the position, the total estimated unrecognized tax benefit that, if recognized, would affect our effective tax rate was approximately $4.6 million and $3.6 million at June 30, 2016 and 2015, respectively. The Company expects a decrease of $0.3 million of unrecognized tax benefits during the next twelve months due to the expiration of statutes of limitation.
Fiscal years 2013 to 2016 remain open to examination by the Internal Revenue Service, fiscal years 2011 to 2016 remain open to examination by certain state jurisdictions, and fiscal years 2007 to 2016 remain open to examination by certain foreign taxing jurisdictions. The Company’s fiscal years 2011 and 2012 California and fiscal years 2012 through 2015 New Jersey state income tax returns are currently under examination. The Company’s Vietnam subsidiary has been notified of an examination to start in fiscal year 2017.
9500_10Kc1.pdf August 30, 2016 pg 63

64
Note 8. Earnings Per Share
The following table sets forth the computation of earnings per share for the periods indicated. Weighted-average shares issuable upon the exercise of stock options that were not included in the calculation were 153,000, 576,000 and 507,000 for the fiscal years ended June 30, 2016, 2015 and 2014, respectively, because they were anti-dilutive.
Year Ended June 30, 2016 2015 2014 ($000 except per share) Earnings from continuing operations $ 65,486 $ 65,975 $ 38,316 Earnings from discontinued operation - - 133 Net earnings from continuing operations $ 65,486 $ 65,975 $ 38,449 Divided by:
Weighted average shares 61,366 61,219 62,248 Basic earnings per common share:
Continuing operations $ 1.07 $ 1.08 $ 0.62 Discontinued operation $ - $ - $ - Consolidated $ 1.07 $ 1.08 $ 0.62
Earnings from continuing operations $ 65,486 $ 65,975 $ 38,316 Earnings from discontinued operation - - 133 Net earnings from continuing operations $ 65,486 $ 65,975 $ 38,449 Divided by:
Weighted average shares 61,366 61,219 62,248 Dilutive effect of common stock equivalents 1,543 1,367 1,438 Diluted weighted average common shares 62,909 62,586 63,686
Diluted earnings per common share:
Continuing operations $ 1.04 $ 1.05 $ 0.60 Discontinued operation $ - $ - $ - Consolidated $ 1.04 $ 1.05 $ 0.60
Note 9. Operating Leases
The Company leases certain property under operating leases that expire at various dates. Future rental commitments applicable to the operating leases at June 30, 2016 are as follows:
Year Ending June 30, ($000) 2017 $ 13,166 2018 10,301 2019 8,622 2020 7,610 2021 5,071 Thereafter 22,403
Rent expense was approximately $14.2 million, $15.0 million, and $13.6 million for the fiscal years ended June 30, 2016, 2015 and 2014, respectively.
Note 10. Share-Based Compensation Plans
The Company’s Board of Directors adopted the II-VI Incorporated Amended and Restated 2012 Omnibus Incentive Plan (the “Plan”) which was approved by the shareholders at the Annual Meeting in November 2014. The Plan provides for the grant of non-qualified stock options, stock appreciation rights, restricted shares, restricted share units, deferred shares, performance shares and performance share units to employees, officers and directors of the Company. The maximum number of shares of the Company’s Common Stock authorized for issuance under the Plan is limited to 4,900,000 shares of Common Stock, not including any remaining shares forfeited under the predecessor plans that may be rolled into the Plan. The Plan has vesting provisions predicated upon the death, retirement or
9500_10Kc1.pdf August 30, 2016 pg 64

65
disability of the grantee. As of June 30, 2016, there were approximately 2,805,911 shares available to be issued under the Plan, including forfeited shares from predecessor plans.
The Company records share-based compensation expense for these awards which requires the recognition of the grant-date fair value of share-based compensation in net earnings. The Company recognizes the share-based compensation expense over the requisite service period of the individual grantees, which generally equals the vesting period. The Company accounts for cash-based stock appreciation rights, cash-based restricted share unit awards and cash-based performance share unit awards as liability awards, in accordance with applicable accounting standards.
Share-based compensation expense for the fiscal years ended June 30, 2016, 2015 and 2014 is as follows ($000): Year Ended June 30, 2016 2015 2014 Stock Options and Cash-Based Stock Appreciation Rights $ 4,309 $ 5,158 $ 5,818 Restricted Share Awards and Cash-Based Restricted Share Unit Awards 4,401 5,182 4,868 Performance Share Awards and Cash-Based Performance Share Unit Awards 2,196 2,649 2,311 $ 10,906 $ 12,989 $ 12,997
The share-based compensation expense is allocated approximately 20% to cost of goods sold and 80% to selling, general and administrative expense in the Consolidated Statements of Earnings, based on the employee classification of the grantees. Share-based compensation expense associated with liability awards was $1.2 million in fiscal year 2016 and $1.6 million in both fiscal years 2015 and 2014.
Stock Options and Cash-Based Stock Appreciation Rights:
The Company utilized the Black-Scholes valuation model for estimating the fair value of stock option expense. During the fiscal years ended June 30, 2016, 2015 and 2014, the weighted-average fair value of options granted under the stock option plan was $7.35, $5.76 and $8.21, respectively, per option using the following assumptions:
Year Ended June 30, 2016 2015 2014 Risk-free interest rate 1.68% 1.71% 1.71%Expected volatility 38% 41% 47%Expected life of options 6.43 years 5.94 years 5.56 years Dividend yield None None None
The risk-free interest rate is derived from the average U.S. Treasury Note rate during the period, which approximates the rate in effect at the time of grant related to the expected life of the options. The risk-free interest rate shown above is the weighted average rate for all options granted during the fiscal year. Expected volatility is based on the historical volatility of the Company’s Common Stock over the period commensurate with the expected life of the options. The expected life calculation is based on the observed time to post-vesting exercise and/or forfeitures of options by our employees. The dividend yield of zero is based on the fact that the Company has never paid cash dividends and has no current intention to pay cash dividends in the future. The estimated annualized forfeitures are based on the Company’s historical experience of option pre-vesting cancellations and are estimated at a rate of 17.43%. The Company will record additional expense in future periods if the actual forfeiture rate is lower than estimated, and will adjust expense in future periods if the actual forfeitures are higher than estimated.
9500_10Kc1.pdf August 30, 2016 pg 65

66
Stock option and cash-based stock appreciation rights activity during the fiscal year ended June 30, 2016 was as follows:
Stock Options Cash-Based Stock Appreciation
Rights
Number of Weighted Average Number of
Weighted Average
Shares Exercise Price Rights Exercise Price Outstanding - July 1, 2015 4,564,824 $ 16.54 167,172 $ 16.80 Granted 686,100 $ 18.20 51,400 $ 17.96 Exercised (700,816) $ 13.77 (15,330) $ 17.10 Forfeited and Expired (298,182) $ 18.11 (25,008) $ 16.59 Outstanding - June 30, 2016 4,251,926 $ 17.15 178,234 $ 17.13 Exercisable - June 30, 2016 2,613,008 $ 17.14 41,192 $ 17.84
As of June 30, 2016, 2015 and 2014, the aggregate intrinsic value of stock options and cash-based stock appreciation rights outstanding and exercisable was $10.1 million, $14.3 million and $5.2 million, respectively. Aggregate intrinsic value represents the total pretax intrinsic value (the difference between the Company’s closing stock price on the last trading day of the year ended June 30, 2016, and the option’s exercise price, multiplied by the number of in-the-money options) that would have been received by the option holders had all option holders exercised their options on June 30, 2016. This amount varies based on the fair market value of the Company’s stock. The total intrinsic value of stock options and cash-based stock appreciation rights exercised during the fiscal years ended June 30, 2016, 2015, and 2014 was $4.5 million, $2.9 million, and $3.1 million, respectively. As of June 30, 2016, total unrecognized compensation cost related to non-vested stock options and cash-based stock appreciation rights was $7.2 million. This cost is expected to be recognized over a weighted-average period of approximately three years. Outstanding and exercisable stock options at June 30, 2016 were as follows: Stock Options and Cash-Based Stock Stock Options and Cash-Based Stock Appreciation Rights Outstanding Appreciation Rights Exercisable Weighted Weighted Weighted Weighted Number of Average Remaining Average Number of Average Remaining Average Range of Shares or Contractual Term Exercise Shares or Contractual Term Exercise Exercise Prices Rights (Years) Price Rights (Years) Price $10.04 - $15.38 1,418,876 5.14 $ 13.09 890,384 3.39 $ 12.54 $15.41 - $23.45 2,528,354 6.48 $ 18.19 1,284,294 4.97 $ 17.92 $23.49 - $27.18 482,930 2.27 $ 23.67 479,522 2.25 $ 23.65 4,430,160 5.59 $ 17.15 2,654,200 $ 3.95 $ 17.15
Restricted Share Awards and Cash-Based Restricted Share Unit Awards:
Restricted share awards and cash-based restricted share unit awards compensation expense was calculated based on the number of shares or units expected to be earned by the grantee multiplied by the stock price at the date of grant (for restricted share awards) or the stock price at the period end date (for cash-based restricted share unit awards), and is being recognized over the vesting period. Generally, the restricted share awards and restricted share unit awards have a three year cliff-vesting provision and an estimated forfeiture rate of 12.0%.
Restricted share and cash-based restricted share unit activity during the fiscal year ended June 30, 2016, was as follows: Restricted Share Awards Cash-Based Restricted Share Units Number of Weighted Average Number of Weighted Average Shares Grant Date Fair Value Units Grant Date Fair Value Nonvested - June 30, 2015 791,010 $ 16.94 98,995 $ 16.57 Granted 298,740 $ 18.74 40,945 $ 17.97 Vested (283,345) $ 18.47 (23,845) $ 18.81 Forfeited (45,490) $ 17.08 (10,160) $ 15.85 Nonvested - June 30, 2016 760,915 $ 17.49 105,935 $ 16.67
As of June 30, 2016, total unrecognized compensation cost related to non-vested restricted share and cash-based restricted share unit awards was $6.4 million. This cost is expected to be recognized over a weighted-average period of approximately two years. The
9500_10Kc1.pdf August 30, 2016 pg 66

67
restricted share compensation expense was calculated based on the number of shares expected to be earned multiplied by the stock price at the date of grant and is being recognized over the vesting period. The cash-based restricted share unit compensation expense was calculated based on the number of shares expected to be earned multiplied by the stock price at the period-end date and is being recognized over the vesting period. The total fair value of the restricted share and cash-based restricted share unit awards granted during the years ended June 30, 2016, 2015 and 2014, was $6.3 million, $5.9 million and $4.5 million, respectively. The total fair value of restricted shares vested was $5.5 million, $5.1 million and $3.8 million during fiscal years 2016, 2015 and 2014, respectively.
Performance Share Awards and Cash-Based Performance Share Unit Awards:
The Compensation Committee of the Board of Directors of the Company has granted certain executive officers and employees performance share awards and performance share unit awards under the Plan. As of June 30, 2016, the Company had outstanding grants covering performance periods ranging from 24 to 36 months. These awards are intended to provide continuing emphasis on specified financial performance goals that the Company considers important contributors to the creation of long-term shareholder value. These awards are payable only if the Company achieves specified levels of financial performance during the performance periods.
The performance share compensation expense was calculated based on the number of shares expected to be earned multiplied by the stock price at the date of grant, and is being recognized over the vesting period. The cash-based performance share unit compensation expense was calculated based on the number of shares expected to be earned multiplied by the stock price at the period-end date, and is being recognized over the vesting period. Performance share and cash-based performance share unit award activity relating to the plan during the year ended June 30, 2016, was as follows:
Performance Share Awards Cash-Based Performance Share Units Number of Weighted Average Number of Weighted Average Shares Grant Date Fair Value Units Grant Date Fair Value Nonvested - June 30, 2015 307,445 $ 15.99 101,434 $ 18.52 Granted 127,730 $ 17.84 7,329 $ 17.84 Vested (83,842) $ 17.90 (1,907) $ 17.84 Forfeited (57,792) $ 16.65 (8,197) $ 18.95 Nonvested - June 30, 2016 293,541 $ 16.12 98,659 $ 18.44
As of June 30, 2016, total unrecognized compensation cost related to non-vested performance share and cash-based performance share unit awards was $1.7 million. This cost is expected to be recognized over a weighted-average period of approximately one year. The total fair value of the performance share and cash-based performance share unit awards granted during the fiscal years ended June 30, 2016, 2015 and 2014 was $2.4 million, $2.3 million and $2.1 million, respectively. The total fair value of performance shares vested during the fiscal years ended June 30, 2016, 2015 and 2014 was $1.5 million, $1.6 million and $1.3 million, respectively.
For our relative Total Shareholder Return, or TSR, performance-based awards, which are based on market performance of our stock as compared to the Russel 2000 Index, the compensation cost is recognized over the performance period on a straight-line basis net of forfeitures, because the awards vest only at the end of the measurement period and the probability of actual shares expected to be earned is considered in the grant date valuation. As a result, the expense is not adjusted to reflect the actual shares earned. We estimate the fair value of the TSR performance-based awards using the Monte-Carlo simulation model.
Note 11. Segment and Geographic Reporting
The Company reports its business segments using the “management approach” model for segment reporting. This means that the Company determines its reportable business segments based on the way the chief operating decision maker organizes business segments within the Company for making operating decisions and assessing performance.
The Company reports its financial results in the following three segments: (i) II-VI Laser Solutions, (ii) II-VI Photonics, and (iii) II-VI Performance Products, and the Company’s chief operating decision maker receives and reviews financial information based on these segments. The Company evaluates business segment performance based upon segment operating income, which is defined as earnings before income taxes, interest and other income or expense. The segments are managed separately due to the market, production requirements and facilities unique to each segment.
The II-VI Laser Solutions segment is located in the U.S., Singapore, China, Germany, Switzerland, Japan, Belgium, the U.K., Italy, South Korea and the Philippines. II-VI Laser Solutions is directed by the President of II-VI Laser Solutions, while each geographic location is directed by a general manager, and is further divided into production and administrative units that are directed by managers. II-VI Laser Solutions designs, manufactures and markets optical and electro-optical components and materials sold under the II-VI
9500_10Kc1.pdf August 30, 2016 pg 67
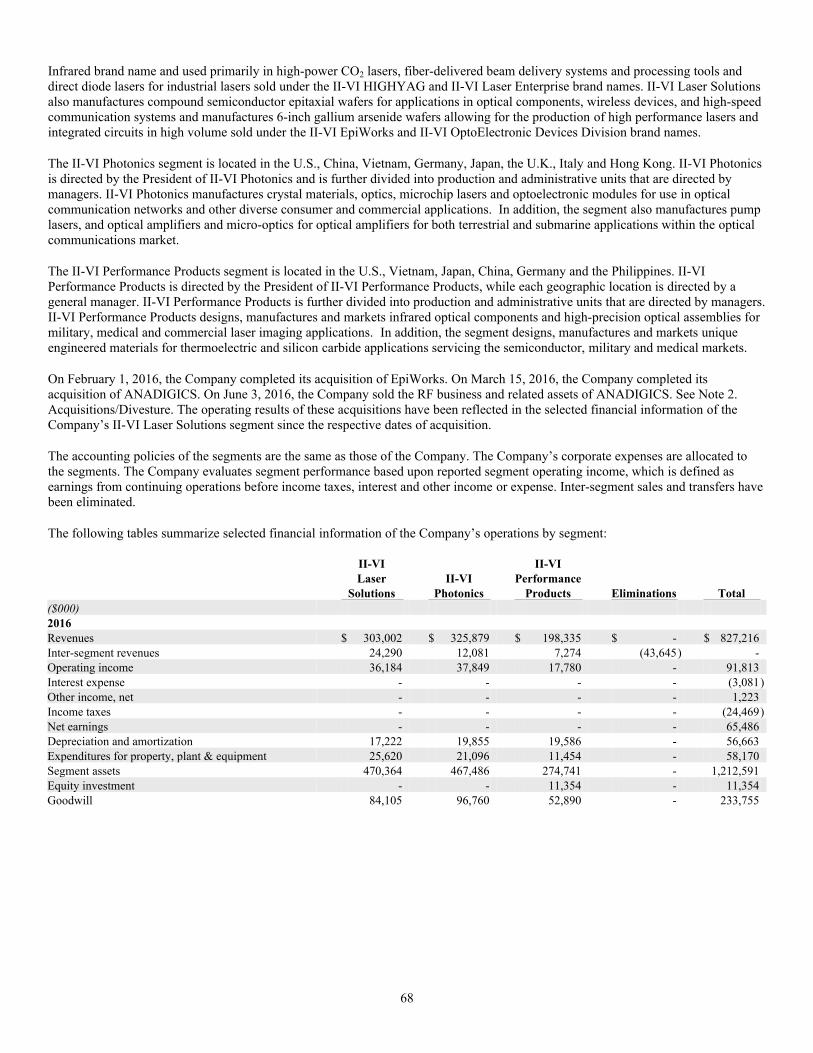
68
Infrared brand name and used primarily in high-power CO2 lasers, fiber-delivered beam delivery systems and processing tools and direct diode lasers for industrial lasers sold under the II-VI HIGHYAG and II-VI Laser Enterprise brand names. II-VI Laser Solutions also manufactures compound semiconductor epitaxial wafers for applications in optical components, wireless devices, and high-speed communication systems and manufactures 6-inch gallium arsenide wafers allowing for the production of high performance lasers and integrated circuits in high volume sold under the II-VI EpiWorks and II-VI OptoElectronic Devices Division brand names.
The II-VI Photonics segment is located in the U.S., China, Vietnam, Germany, Japan, the U.K., Italy and Hong Kong. II-VI Photonics is directed by the President of II-VI Photonics and is further divided into production and administrative units that are directed by managers. II-VI Photonics manufactures crystal materials, optics, microchip lasers and optoelectronic modules for use in optical communication networks and other diverse consumer and commercial applications. In addition, the segment also manufactures pump lasers, and optical amplifiers and micro-optics for optical amplifiers for both terrestrial and submarine applications within the optical communications market.
The II-VI Performance Products segment is located in the U.S., Vietnam, Japan, China, Germany and the Philippines. II-VI Performance Products is directed by the President of II-VI Performance Products, while each geographic location is directed by a general manager. II-VI Performance Products is further divided into production and administrative units that are directed by managers. II-VI Performance Products designs, manufactures and markets infrared optical components and high-precision optical assemblies for military, medical and commercial laser imaging applications. In addition, the segment designs, manufactures and markets unique engineered materials for thermoelectric and silicon carbide applications servicing the semiconductor, military and medical markets.
On February 1, 2016, the Company completed its acquisition of EpiWorks. On March 15, 2016, the Company completed its acquisition of ANADIGICS. On June 3, 2016, the Company sold the RF business and related assets of ANADIGICS. See Note 2. Acquisitions/Divesture. The operating results of these acquisitions have been reflected in the selected financial information of the Company’s II-VI Laser Solutions segment since the respective dates of acquisition.
The accounting policies of the segments are the same as those of the Company. The Company’s corporate expenses are allocated to the segments. The Company evaluates segment performance based upon reported segment operating income, which is defined as earnings from continuing operations before income taxes, interest and other income or expense. Inter-segment sales and transfers have been eliminated.
The following tables summarize selected financial information of the Company’s operations by segment: II-VI II-VI Laser II-VI Performance Solutions Photonics Products Eliminations Total ($000) 2016 Revenues $ 303,002 $ 325,879 $ 198,335 $ - $ 827,216 Inter-segment revenues 24,290 12,081 7,274 (43,645) - Operating income 36,184 37,849 17,780 - 91,813 Interest expense - - - - (3,081)Other income, net - - - - 1,223 Income taxes - - - - (24,469)Net earnings - - - - 65,486 Depreciation and amortization 17,222 19,855 19,586 - 56,663 Expenditures for property, plant & equipment 25,620 21,096 11,454 - 58,170 Segment assets 470,364 467,486 274,741 - 1,212,591 Equity investment - - 11,354 - 11,354 Goodwill 84,105 96,760 52,890 - 233,755
9500_10Kc1.pdf August 30, 2016 pg 68

69
II-VI II-VI Laser II-VI Performance Solutions Photonics Products Eliminations Total ($000) 2015 Revenues $ 287,881 $ 260,825 $ 193,255 $ - $ 741,961 Inter-segment revenues 21,021 13,210 9,325 (43,556) - Operating income 55,039 7,208 14,552 - 76,799 Interest expense - - - - (3,863)Other income, net - - - - 6,176 Income taxes - - - - (13,137)Net earnings - - - - 65,975 Depreciation and amortization 14,127 21,073 17,883 - 53,083 Expenditures for property, plant & equipment 27,349 11,324 13,640 - 52,313 Segment assets 330,308 450,763 277,093 - 1,058,164 Equity investment - - 11,914 - 11,914 Goodwill 43,578 99,426 52,890 - 195,894
II-VI II-VI Laser II-VI Performance Solutions Photonics Products Eliminations Total ($000) 2014 Revenues $ 254,342 $ 216,493 $ 212,426 $ - $ 683,261 Inter-segment revenues 9,825 9,533 12,000 (31,358) - Operating income (loss) 24,457 (113) 22,142 - 46,486 Interest expense - - - - (4,479)Other income, net - - - - 3,634 Income taxes - - - - (7,325)Loss from discontinued operation - - - - 133 Net earnings - - - - 38,449 Depreciation and amortization 15,018 20,123 17,957 - 53,098 Expenditures for property, plant & equipment 11,797 8,359 9,064 - 29,220
Geographic information for revenues from the country of origin (shipped from), and long-lived assets from the country of origin, which include property, plant and equipment, net of related depreciation, and certain other long-term assets, were as follows:
Revenues Year Ended June 30, 2016 2015 2014 ($000) United States $ 266,347 $ 241,974 $ 263,493 Non-United States
China 172,292 140,586 114,247 Hong Kong 140,821 109,428 54,602 Germany 72,070 77,524 69,983 Japan 57,287 52,864 38,110 Switzerland 54,760 56,940 70,260 Vietnam 24,267 24,307 23,141 Italy 10,160 9,313 8,897 United Kingdom 8,154 7,749 7,148 Philippines 8,106 11,334 14,959 Belgium 6,026 5,731 6,578 Korea 3,887 - - Singapore 3,039 3,897 8,273 Australia - 314 3,570 Total Non-United States 560,869 499,987 419,768
$ 827,216 $ 741,961 $ 683,261
9500_10Kc1.pdf August 30, 2016 pg 69

70
Long-Lived Assets June 30, 2016 2015 2014 ($000) United States $ 137,521 $ 102,171 $ 109,138 Non-United States
China 51,824 46,794 45,667 Switzerland 38,202 26,384 22,524 Germany 15,162 15,790 16,129 Vietnam 8,895 7,985 9,107 Philippines 4,399 6,003 6,205 Hong Kong 1,765 2,476 5,111 Other 1,146 1,282 2,218 Total Non-United States 121,393 106,714 106,961
$ 258,914 $ 208,885 $ 216,099
Note 12. Fair Value of Financial Instruments
The FASB defines fair value as the exchange price that would be received for an asset or paid to transfer a liability (an exit price) in the principal or most advantageous markets for the asset and liability in an orderly transaction between market participants at the measurement date. The Company estimates fair value of its financial instruments utilizing an established three-level hierarchy in accordance with U.S. GAAP. The hierarchy is based upon the transparency of inputs to the valuation of an asset or liability as of the measurement date as follows:
Level 1 – Valuation is based upon unadjusted quoted prices for identical assets or liabilities in active markets.
Level 2 – Valuation is based upon quoted prices for similar assets and liabilities in active markets, or other inputs that are observable for the asset or liability, either directly or indirectly, for substantially the full term of the financial instruments.
Level 3 – Valuation is based upon other unobservable inputs that are significant to the fair value measurements.
The classification of fair value measurements within the hierarchy is based upon the lowest level of input that is significant to the measurement. At June 30, 2016, the Company had foreign currency forward contracts recorded at fair value. The fair values of these instruments were measured using valuations based upon quoted prices for similar assets and liabilities in active markets (Level 2) and are valued by reference to similar financial instruments, adjusted for credit risk and restrictions and other terms specific to the contracts. The Company also had a contingent earnout arrangement which provides up to a maximum of $6.0 million of additional cash earnout opportunities based upon EpiWorks achieving certain agreed upon financial and operational targets for capacity, wafer output and gross margin, which if earned would be payable for the achievement of each specific annual target over the next three years. The fair value of the contingent earnout arrangement was measured using valuations based upon other unobservable inputs that are significant to the fair value measurement (Level 3).
The following tables provide a summary by level of the fair value of financial instruments that are measured on a recurring basis as of June 30, 2016 and 2015 ($000):
Fair Value Measurements at June 30, 2016 Using: Quoted Prices in Significant Active Markets Other Significant for Identical Observable Unobservable Assets Inputs Inputs June 30, 2016 (Level 1) (Level 2) (Level 3) Liabilities: Foreign currency forward contracts $ 511 $ - $ 511 $ - Contingent earnout arrangement $ 4,352 $ - $ - $ 4,352
9500_10Kc1.pdf August 30, 2016 pg 70

71
Fair Value Measurements at June 30, 2015 Using: Quoted Prices in Significant Active Markets Other Significant for Identical Observable Unobservable Assets Inputs Inputs June 30, 2015 (Level 1) (Level 2) (Level 3) Assets: Foreign currency forward contracts $ 130 $ - $ 130 $ -
The Company’s policy is to report transfers into and out of Levels 1 and 2 of the fair value hierarchy at fair values as of the beginning of the period in which the transfers occur. There were no transfers in and out of Levels 1 and 2 of the fair value hierarchy during fiscal years 2016 and 2015.
The following table presents a reconciliation of the beginning and ending fair value measurements of the Company’s level 3 contingent earnout arrangement related to the acquisition of II-VI EpiWorks ($000):
Significant Unobservable Inputs (Level 3) Balance at July 1, 2015 $ - Contingent earnout arrangement 4,352
Payments - Changes in fair value -
Balance at June 30, 2016 $ 4,352
The fair values of cash and cash equivalents are considered Level 1 among the fair value hierarchy and approximate fair value because of the short-term maturity of those instruments. The Company’s borrowings are considered Level 2 among the fair value hierarchy and are variable interest rates and accordingly their carrying amounts approximate fair value.
Note 13. Derivative Instruments
The Company, from time to time, purchases foreign currency forward exchange contracts, primarily in Japanese Yen, that permit it to sell specified amounts of these foreign currencies expected to be received from its export sales for pre-established U.S. dollar amounts at specified dates. These contracts are entered into to limit transactional exposure to changes in currency exchange rates of export sales transactions in which settlement will occur in future periods and which otherwise would expose the Company, on the basis of its aggregate net cash flows in respective currencies, to foreign currency risk.
The Company has recorded the fair market value of these contracts in the Company’s financial statements. These contracts had a total notional amount of $9.2 million and $10.8 million at June 30, 2016 and June 30, 2015, respectively. As of June 30, 2016, these forward contracts had expiration dates ranging from July 2016 through October 2016, with Japanese Yen denominations individually between 200 million and 300 million Yen. The Company does not account for these contracts as hedges as defined by U.S. GAAP and records the change in the fair value of these contracts in Other expense (income), net in the Consolidated Statements of Earnings as they occur. The fair value measurement takes into consideration foreign currency rates and the current creditworthiness of the counterparties to these contracts, as applicable, and is based upon quoted prices for similar assets and liabilities in active markets, or other inputs that are observable for the asset or liability, either directly or indirectly, for substantially the full term of the financial instruments and thus represents a Level 2 measurement. These contracts are recorded in other accrued liabilities in the Company’s Consolidated Balance Sheets. The change in the fair value of these contracts for the fiscal years ended June 30, 2016, 2015 and 2014 was insignificant.
Note 14. Employee Benefit Plans
Eligible U.S. employees of the Company participate in a profit sharing retirement plan. Contributions accrued for the plan are made at the discretion of the Company’s board of directors and were $3.4 million, $2.8 million, and $2.5 million for the years ended June 30, 2016, 2015 and 2014, respectively.
9500_10Kc1.pdf August 30, 2016 pg 71

72
The Company has an employee stock purchase plan available for employees who have completed six months of continuous employment with the Company. The employee may purchase the Company’s Common Stock at 5% below the prevailing market price. The amount of shares which may be bought by an employee during each fiscal year is limited to 10% of the employee’s base pay. This plan, as amended, limits the number of shares of Common Stock available for purchase to 1,600,000 shares. There were 492,913 and 514,031 shares of Common Stock available for purchase under the plan at June 30, 2016 and 2015, respectively.
Switzerland Defined Benefit Plan
In conjunction with the acquisition of II-VI Laser Enterprise in fiscal year 2014, the Company assumed a pension plan covering employees of our Swiss subsidiary (the “Swiss Plan”). Employer and employee contributions are made to the Swiss Plan based on various percentages of salary and wages that vary according to employee age and other factors. Employer contributions to the Swiss Plan for year ended June 30, 2016 were $2.0 million. Expected employer contributions in fiscal year 2017 are $2.5 million.
The funded status of the Swiss Plan in the fiscal years ended June 30, 2016 and 2015 were as follows:
Year Ended June 30, 2016 2015 Change in projected benefit obligation:
Projected benefit obligation, beginning of period $ 42,575 $ 39,390 Service cost 2,680 2,791 Interest cost 434 744 Participant contributions 1,046 965 Benefits received (paid) 1,567 (1,279)Actuarial loss on obligation 8,071 1,520 Currency translation adjustment (2,279) (1,556)
Projected benefit obligation, end of period $ 54,094 $ 42,575 Change in plan assets:
Plan assets at fair value, beginning of period 32,509 31,965 Actual return on plan assets 431 207 Employer contributions 2,043 1,914 Participant contributions 1,046 965 Benefits received (paid) 1,567 (1,279)Currency translation adjustment (1,739) (1,263)
Plan assets at fair value, end of period $ 35,857 $ 32,509 Amounts recognized in consolidated balance sheets:
Other non-current assets: Deferred tax asset $ 3,857 $ 2,129
Other non-current liabilities: Underfunded pension liability $ 18,237 10,066
Amounts recognized in accumulated other comprehensiveincome, net of tax:
Pension adjustment $ (7,031) $ (2,244)Accumulated benefit obligation, end of period $ 50,772 $ 38,734
Net periodic pension cost associated with the Swiss Plan included the following components:
Year Ended June 30, 2016 2015 Service cost 2,680 $ 2,791 Interest cost 434 744 Expected return on plan assets (1,097) (1,106)Net period pension cost $ 2,017 $ 2,429
9500_10Kc1.pdf August 30, 2016 pg 72

73
The projected and accumulated benefit obligations for the Swiss Plan were calculated as of June 30, 2016 and 2015 using the following assumptions:
Year Ended June 30, 2016 2015 Discount rate 0.3% 1.1%Salary increase rate 2.0% 2.0%Expected return on plan assets 2.0% 3.5%Expected average remaining working life (in years) 10.2 13.1
The discount rate is based on assumed pension benefit maturity and estimates developed using the rate of return and yield curves for high quality Swiss corporate and government bonds. The fiscal year 2016 decrease in the discount rate was a result of a decrease in the yield on the 20-year Swiss government bond. As a result of the decrease in the Swiss Plan’s discount rate utilized in the current fiscal year the underfunded pension liability increased from the $10.1 million at the beginning of the fiscal year to $18.2 million at June 30, 2016. The salary increase rate is based on our best assessment for on-going increases over time. The expected long-term rate of return on plan assets is based on the expected asset allocation and taking into consideration historical long-term rates of return for the relevant asset categories.
As is customary with Swiss pension plans, the assets of the plan are invested in a collective fund with multiple employers. We have no investment authority over the assets of the plan that are held and invested by a Swiss insurance company. The Swiss Plan assets are measured at fair value and are classified within Level 2 of the fair value hierarchy. The investment strategy of the Swiss Plan is managed by an independent asset manager with the objective of achieving a consistent long-term return which will provide sufficient funding for future pension obligations while limiting risk.
The Swiss Plan is legally separate from II-VI, as are the assets of the plan. As of June 30, 2016, the Swiss Plan’s asset allocation was as follows:
Year Ended June 30, 2016 2015 Fixed income investments 15.0% 22.0%Equity investments 51.0% 52.0%Real estate 28.0% 16.0%Cash 3.0% 8.0%Alternative investments 3.0% 2.0% 100.0% 100.0%
Estimated future benefit payments under the Swiss Plan are estimated to be as follows:
Year Ending June 30, ($000) 2017 $ 2,521 2018 1,419 2019 3,661 2020 1,312 2021 2,222 Next five years 16,549
Other Employee Benefit Plans
The Company has no program for post-retirement health and welfare benefits.
The II-VI Incorporated Deferred Compensation Plan (the “Compensation Plan”) is designed to allow officers and key employees of the Company to defer receipt of compensation into a trust fund for retirement purposes. Under the Compensation Plan, as it is currently implemented by the Company, eligible participants can elect to defer up to 100% of certain discretionary incentive compensation and certain equity awards into the Compensation Plan. The Compensation Plan is a nonqualified, defined contribution employees’ retirement plan. At the Company’s discretion, the Compensation Plan may be funded by the Company making contributions based on compensation deferrals, matching contributions and discretionary contributions. Compensation deferrals will be based on an election by the participant to defer a percentage of compensation under the Compensation Plan. All assets in the Compensation Plan are subject to claims of the Company’s creditors until such amounts are paid to the Compensation Plan participants. Employees of the Company made contributions to the Compensation Plan in the amounts of approximately $1.2 million,
9500_10Kc1.pdf August 30, 2016 pg 73

74
$0.7 million, and $1.9 million for the fiscal years ended June 30, 2016, 2015, and 2014, respectively. There were no employer contributions made to the Compensation Plan for the fiscal years ended June 30, 2016, 2015 and 2014.
Note 15. Other Accrued Liabilities
The components of other accrued liabilities were as follows:
Year Ended June 30, 2016 2015 ($000) Deferred revenue $ 4,014 $ 8,767 Warranty reserve 3,908 3,251 Current portion of earnout arrangement 1,935 - Other accrued liabilities 15,989 12,558 $ 25,846 $ 24,576
The following table summarizes the change in the carrying value of the Company’s warranty reserve included in Other Accrued Liabilities as of and for the year ended June 30, 2016.
Year Ended June 30, 2016 ($000) Balance-Beginning of Year $ 3,251 Settlements during the period (4,073)Additional warranty liability recorded 4,730 Balance-End of Year $ 3,908
Note 16. Commitments and Contingencies
The Company has purchase commitments for materials and supplies as part of the ordinary conduct of business. A portion of the commitments are long-term and are based on minimum purchase requirements. Certain short-term raw material purchase commitments have a variable price component which is based on market pricing at the time of purchase. Due to the proprietary nature of some of the Company’s materials and processes, certain contracts may contain penalty provisions for early termination. The Company does not believe that a significant amount of penalties are reasonably likely to be incurred under these commitments based upon historical experience and current expectation. Total future commitments are as follows:
Year Ending June 30, ($000) 2017 $ 23,382 2018 2,065 2019 2,065 2020 - 2021 -
Note 17. Share Repurchase Programs
In August 2014, the Board of Directors authorized the Company to purchase up to $50 million of its Common Stock. The repurchase program has no expiration and calls for shares to be purchased in the open market or in private transactions from time to time. Shares purchased by the Company will be retained as treasury stock and available for general corporate purposes. During the fiscal years ended June 30, 2016 and 2015, the Company purchased 380,538 and 936,049 shares of its Common Stock for $6.3 million and $12.7 million respectively, under this repurchase program.
9500_10Kc1.pdf August 30, 2016 pg 74

75
Note 18. Accumulated Other Comprehensive Income (Loss)
The changes in accumulated other comprehensive income (“AOCI”) by component, net of tax, for the years ended June 30, 2016, 2015, and 2014 were as follows ($000):
Foreign Total Currency Defined Accumulated Other Translation Benefit Comprehensive Adjustment Pension Plan Income
AOCI - June 30, 2013 $ 15,600 $ - $ 15,600 Other comprehensive income (loss) before reclassifications 2,363 1,443 3,806 Amounts reclassified from AOCI - - -
Net current-period other comprehensive income 2,363 1,443 3,806 AOCI - June 30, 2014 17,963 1,443 19,406
Other comprehensive income (loss) before reclassifications (8,497) (2,244) (10,741)Amounts reclassified from AOCI - - -
Net current-period other comprehensive income (8,497) (2,244) (10,741)AOCI - June 30, 2015 $ 9,466 $ (801) $ 8,665
Other comprehensive income (loss) before reclassifications (15,651) (6,805) (22,456)Amounts reclassified from AOCI - (226) (226)
Net current-period other comprehensive income (15,651) (7,031) (22,682)AOCI - June 30, 2016 $ (6,185) $ (7,832) $ (14,017)
Note 19. Subsequent Events
On July 28, 2016, the Company entered into a Third Amended and Restated Credit Agreement (the “Amended Credit Facility”) which amended the related existing credit facility. The Amended Credit Facility provides for a revolving credit facility of $325 million (increased from $225 million), as well as a $100 million term loan, which mature, on July 27, 2021. The term loan is to be re-paid in quarterly principal payments commencing in October 2016, with any remaining principal due on the maturity date. The Amended Credit Facility is unsecured, but is guaranteed by each of the Company’s existing or subsequently acquired or organized wholly-owned domestic subsidiaries. The Company may request an increase to the size of the Amended Credit Facility in an aggregate additional amount not to exceed $100.0 million. Amounts outstanding under the Amended Credit Facility bear interest at LIBOR plus 1.00% to 2.25% based on the Company’s ratio of consolidated indebtedness to consolidated EBITDA.
The Amended Credit Facility contains customary affirmative and negative covenants for credit facilities of this type, including limitations on the Company and its subsidiaries with respect to indebtedness, liens, investments, distributions, mergers and acquisitions, disposition of assets, repurchases of the Company’s common stock and transactions with affiliates. The covenants permit the Company to use proceeds of the Amended Credit Facility for the repayment of existing indebtedness, permitted acquisitions, working capital and capital expenditures and other lawful corporate purposes. The Amended Credit Facility also contains financial covenants that require the Company to maintain a minimum consolidated interest coverage ratio of 4.0 and a maximum consolidated leverage ratio of 3.25.
9500_10Kc1.pdf August 30, 2016 pg 75

76
Quarterly Financial Data (unaudited)
Fiscal Year 2016 September 30, December 31, March 31, June 30, Quarter Ended 2015 2015 2016 2016 ($000) 2016 Net revenues $ 189,207 $ 191,434 $ 205,105 $ 241,470 Cost of goods sold 118,018 120,090 127,436 148,859 Internal research and development 13,151 12,155 14,946 20,102 Selling, general and administrative 36,310 37,408 43,333 43,595 Interest expense 649 597 769 1,066 Other expense (income) - net (1,057) (994) 1,257 (429)Earnings before income taxes 22,136 22,178 17,364 28,277 Income taxes 4,922 3,187 2,426 13,934 Net Earnings $ 17,214 $ 18,991 $ 14,938 $ 14,343 Basic earnings per share: $ 0.28 $ 0.31 $ 0.24 $ 0.23 Diluted earnings per share: $ 0.27 $ 0.30 $ 0.24 $ 0.23
Fiscal Year 2015
September 30, December 31, March 31, June 30, Quarter Ended 2014 2014 2015 2015 ($000) 2015 Net revenues $ 185,833 $ 176,736 $ 182,709 $ 196,683 Cost of goods sold 117,974 113,718 116,984 121,687 Internal research and development 12,943 12,845 12,874 12,598 Selling, general and administrative 35,520 33,642 35,192 39,185 Interest expense 1,204 1,038 844 777 Other expense (income) - net 1,682 (9,295) 1,534 (97)Earnings before income taxes 16,510 24,788 15,281 22,533 Income taxes 4,208 2,692 773 5,464 Net Earnings $ 12,302 $ 22,096 $ 14,508 $ 17,069 Basic earnings per share: $ 0.20 $ 0.36 $ 0.24 $ 0.28
Diluted earnings per share: $ 0.20 $ 0.35 $ 0.23 $ 0.27
9500_10Kc1.pdf August 30, 2016 pg 76

77
SCHEDULE II
II-VI INCORPORATED AND SUBSIDIARIES
VALUATION AND QUALIFYING ACCOUNTS YEARS ENDED JUNE 30, 2016, 2015, 2014 AND
(IN THOUSANDS OF DOLLARS)
Additions Balance at Charged Charged Deduction Balance Beginning to to Other from at End of Year Expense Accounts Reserves of Year YEAR ENDED JUNE 30, 2016: Allowance for doubtful accounts $ 1,048 $ 1,123 $ - $ (155) (2 ) $ 2,016 Warranty reserves $ 3,251 $ 4,648 $ 82 (1 ) $ (4,073) $ 3,908 Deferred tax asset valuation allowance $ 2,713 $ 8,464 $ 36,240 (3 ) $ (4,776) (4 ) $ 42,641 YEAR ENDED JUNE 30, 2015: Allowance for doubtful accounts $ 1,852 $ (482) $ - $ (322) (2 ) $ 1,048 Warranty reserves $ 2,859 $ 5,047 $ - $ (4,655) $ 3,251 YEAR ENDED JUNE 30, 2014: Allowance for doubtful accounts $ 1,479 $ 993 $ - $ (620) (2 ) $ 1,852 Warranty reserves $ 1,661 $ 1,868 $ 1,173 (1 ) $ (1,843) $ 2,859
(1) Relates to the warranty reserve acquired from the acquisitions.
(2) Primarily relates to write-offs of accounts receivable.
(3) Valuation allowance recorded through goodwill.
(4) Reduction in valuation allowance as a result of divesture of portion of business.
Item 9. CHANGES IN AND DISAGREEMENTS WITH ACCOUNTANTS ON ACCOUNTING AND FINANCIAL DISCLOSURE
None.
Item 9A. CONTROLS AND PROCEDURES
Evaluation of Disclosure Controls and Procedures
The Company’s management evaluated, with the participation of the Company’s Chief Executive Officer, and the Company’s Chief Financial Officer and Treasurer, the effectiveness of the Company’s disclosure controls and procedures (as defined in Rules 13a-15(e) and 15d-15(e) of the Securities Exchange Act of 1934, as amended (the “Exchange Act”)) as of the end of the period covered by this Annual Report on Form 10-K. The Company’s disclosure controls were designed to provide reasonable assurance that information required to be disclosed in reports that we file or submit under the Exchange Act is recorded, processed, summarized and reported within the time periods specified in the rules and forms of the SEC. It should be noted that the design of any system of controls is based in part upon certain assumptions about the likelihood of future events, and there can be no assurance that any design will succeed in achieving its stated goals under all potential future conditions, regardless of how remote. However, the controls have been designed to provide reasonable assurance of achieving the controls’ stated goals. Based on that evaluation, the Chief Executive Officer and Chief Financial Officer concluded that, as of June 30, 2016, the Company’s disclosure controls and procedures are effective.
Management’s Report on Internal Control Over Financial Reporting
Our management is responsible for establishing and maintaining adequate internal control over financial reporting, as such term is defined in Rule 13a-15(f) and 15d-15(f) under the Exchange Act. The Company’s internal control system is designed to provide reasonable assurance concerning the reliability of the financial data used in the preparation of the Company’s financial statements, as well as reasonable assurance with respect to safeguarding the Company’s assets from unauthorized use or disposition. All internal control systems, no matter how well designed, have inherent limitations. Therefore, even those systems determined to be effective can provide only reasonable assurance with respect to financial statement presentation and other results of such systems. Under the supervision and with the participation of our management, including our Chief Executive Officer and Chief Financial Officer, we
9500_10Kc1.pdf August 30, 2016 pg 77

78
conducted an evaluation of the effectiveness of our internal control over financial reporting as of June 30, 2016. In making this evaluation, management used the criteria set forth by the Committee of Sponsoring Organizations of the Treadway Commission (COSO) in Internal Control – Integrated Framework (2013). Management excluded from the scope of its assessment of internal control over financial reporting, the operations and related assets of II-VI EpiWorks which was acquired on February 1, 2016, and ANADIGICS which was acquired on March 15, 2016. The recent acquisitions excluded from management’s assessment of internal controls over financial reporting represented approximately $101.4 million and $81.3 million of total assets and net assets, respectively, as of June 30, 2016 and approximately $13.9 million and $11.0 million of total revenues and net losses, respectively, for the fiscal year then ended. Based on the evaluation, management concluded that as of June 30, 2016, the Company’s internal controls over financial reporting were effective and provides reasonable assurance that the accompanying financial statements do not contain any material misstatement.
Report of the Registered Public Accounting Firm
The report of Ernst & Young LLP, an independent registered public accounting firm, with respect to our internal control over financial reporting is included in Item 8 of this Annual Report on Form 10-K.
Changes in Internal Control over Financial Reporting
There have been no changes in the Company’s internal controls over financial reporting that occurred during our most recent quarter that have materially affected, or are reasonably likely to materially affect, our internal control over financial reporting.
Item 9B. OTHER INFORMATION
None.
PART III
Item 10. DIRECTORS AND EXECUTIVE OFFICERS OF THE REGISTRANT
The information set forth above in Part I of this Annual Report on Form 10-K under the caption “Executive Officers of the Registrant” is incorporated herein by reference. The other information required by this item is incorporated herein by reference to the information set forth under the captions “Election of Directors Section 16(a) Beneficial Ownership Reporting Compliance” in the Company’s definitive proxy statement for the 2016 Annual Meeting of Shareholders to be filed pursuant to Regulation 14A of the Exchange Act (the “Proxy Statement”).
Audit Committee Financial Expert
The information as to the Audit Committee and the Audit Committee Financial Expert is incorporated herein by reference to the information set forth in the Company’s Proxy Statement.
Code of Ethics
The Company has adopted its Code of Business Conduct and Ethics for all of its employees and its Code of Ethics for Senior Financial Officers including the principal executive officer and principal financial officer. The Code of Business Conduct and Ethics and Code of Ethics for Senior Financial Officers can be found on the Company’s Internet web site at www.ii-vi.com under “Investors Information – Corporate Governance Documents.” The Company will promptly disclose on its web site (i) any amendments or waivers with respect to a director’s or executive officer’s compliance with the Code of Business Conducts and Ethics and (ii) any amendments or waivers with respect to any provision of the Code of Ethics for Senior Financial Officers. Any person may also obtain a copy of the Code of Business Conduct and Ethics and/or the Code of Ethics for Senior Financial Officer without charge by submitting their request to the Chief Financial Officer and Treasurer of II-VI Incorporated, 375 Saxonburg Boulevard, Saxonburg, Pennsylvania 16056 or by calling (724) 352-4455.
The web site and information contained on it or incorporated in it are not intended to be incorporated in this Annual Report on Form 10-K or other filings with the SEC.
9500_10Kc1.pdf August 30, 2016 pg 78

79
Item 11. EXECUTIVE COMPENSATION
The information required by this item is incorporated herein by reference to the information set forth under the caption “Director Compensation in Fiscal Year 2016,” “Executive Compensation,” “Compensation Committee Report” and “Compensation and Risk” in the Company’s Proxy Statement.
Item 12. SECURITY OWNERSHIP OF CERTAIN BENEFICIAL OWNERS AND MANAGEMENT AND RELATED STOCKHOLDER MATTERS
The information required by this item is incorporated herein by reference to the information set forth under the captions “Equity Compensation Plan Information” and “Security Owners of Certain Beneficial Owners and Management” in the Company’s Proxy Statement.
Item 13. CERTAIN RELATIONSHIPS AND RELATED TRANSACTIONS AND DIRECTOR INDEPENDENCE
The information required by this item is incorporated herein by reference to the information set forth under the caption “Director Independence and Corporate Governance Policies” in the Company’s Proxy Statement.
Item 14. PRINCIPAL ACCOUNTANT FEES AND SERVICES
The information required by this item is incorporated herein by reference to the information set forth under the caption “Ratification of Selection of Independent Registered Public Accounting Firm” in the Company’s Proxy Statement.
PART IV
Item 15. EXHIBITS AND FINANCIAL STATEMENT SCHEDULES
(a) (1) Financial Statements
The financial statements are set forth under Item 8 of this Annual Report on Form 10-K.
(2) Schedules
Schedule II – Valuation and Qualifying Accounts for each of the three fiscal years in the period ended June 30, 2016 is set forth under Item 8 of this Annual Report on Form 10-K.
Financial statements, financial statement schedules and exhibits not listed have been omitted where the required information is included in the Consolidated Financial Statements or notes thereto, or is not applicable or required.
9500_10Kc1.pdf August 30, 2016 pg 79

80
Exhibit No. Description Location
2.01 Share and Asset Purchase Agreement dated as of September 12, 2013, between II-VI Holdings B.V. and Oclaro Technology Limited
Incorporated herein by reference to Exhibit 2.1 to II-VI’s Current Report on Form 8-K (File No. 000-16195) filed on September 12, 2013.
2.02 Asset Purchase Agreement dated as of October 10, 2013, between II-VI Incorporated and Oclaro Technology Limited
Incorporated herein by reference to Exhibit 2.1 to II-VI’s Current Report on Form 8-K (File No. 000-16195) filed on October 11, 2013.
3.01
Amended and Restated Articles of Incorporation of II-VI Incorporated
Incorporated herein by reference to Exhibit 3.1 to II-VI’s Current Report on Form 8-K (File No. 000-16195) filed on November 8, 2011.
3.02
Amended and Restated By-Laws of II-VI Incorporated
Incorporated herein by reference to Exhibit 3.1 to II-VI’s Current Report on Form 8-K (File No. 000-16195) filed on November 14, 2014.
10.01 Second Amended and Restated Credit Agreement, dated as of September 10, 2013, by and among II-VI Incorporated, each of the Guarantors party thereto, each of the Lenders party thereto, and PNC Bank, National Association, as administrative agent ($225,000,000 Revolving Credit Facility and $100,000,000 Term Loan Facility)
Incorporated herein by reference to Exhibit 10.1 to II-VI’s Current Report on Form 8-K (File No. 000-16195) filed on September 12, 2013.
10.02
Credit Agreement, dated as of January 31, 2012, by and among II-VI Japan Incorporated, each of the Guarantors party thereto, PNC Bank, National Association, the other Banks party thereto, and PNC Bank, National Association, in its capacity as agent for the Banks thereunder (500,000,000 Yen Revolving Credit Facility)
Incorporated herein by reference to Exhibit 10.02 to II-VI’s Annual Report on Form 10-K (File No. 000-16195) for the fiscal year ended June 30, 2015.
10.03
First Amendment to Credit Agreement, dated as of September 18, 2015, by and among II-VI Japan Incorporated, the Guarantors party thereto, the Banks party thereto, and PNC Bank, National Association, as agent.
Incorporated herein by reference to Exhibit 10.01 to II-VI’s Quarterly Report on Form 10-Q (File No. 000-16195) for the quarter ended September 30, 2015.
10.04
Amended and Restated Employment Agreement, dated September 19, 2008, by and between II-VI and Francis J. Kramer*
Incorporated herein by reference to Exhibit 10.1 to II-VI’s Current Report on Form 8-K (File No. 000-16195) filed on September 24, 2008.
10.05
Employment Agreement, dated August 1, 2016, by and between II-VI and Vincent D. Mattera, Jr.*
Incorporated herein by reference to Exhibit 10.1 to II-VI’s Current Report on Form 8-K (File No. 000-16195) filed on August 2, 2016.
10.06 Employment Agreement, dated March 6, 2014, by and between II-VI Incorporated and Mary Jane Raymond*
Incorporated herein by reference to Exhibit 10.1 to II-VI’s Current Report on Form 10-Q (File No. 000-16195) for the quarter ended March 31, 2014.
10.07 Consulting Agreement, dated June 10, 2015, by and between II-VI Incorporated and James Martinelli*
Incorporated Herein by reference to Exhibit 10.06 to II-VI’s Annual Report on Form 10-K (File No. 000-16195) for the fiscal year ended June 30, 2015.
10.08 Employment Agreement, dated October 3, 2012, by and between II-VI Incorporated and Giovanni Barbarossa*
Incorporated herein by reference to Exhibit 10.07 to II-VI’s Annual Report on Form 10-K (File No. 000-16195) for the fiscal year ended June 30, 2015.
10.09 Employment Agreement, dated November 10, 2008, by and between II-VI Incorporated and David G. Wagner*
Incorporated herein by reference to Exhibit 10.08 to II-VI’s Annual Report on Form 10-K (File No. 000-16195) for the fiscal year ended June 30, 2015.
10.10 Secondment Engagement Letter, dated November 6, 2015, among Sherrard, German & Kelly, P.C., II-VI Incorporated, and Walter R. Bashaw II*
Incorporated herein by reference to Exhibit 10.02 to II-VI’s Current Report on Form 10-Q (File No. 000-16195) for the fiscal Quarter ended December 31, 2015.
9500_10Kc1.pdf August 30, 2016 pg 80

81
10.11 Employment Agreement, dated February 1, 2016, by and between II-VI Incorporated and Gary A. Kapusta*
Incorporated herein by reference to Exhibit 10.01 to II-VI’s Current Report on Form 8-K (File No. 000-16195) filed on February 1, 2016.
10.12
Form of Employment Agreement*
Incorporated herein by reference to Exhibit 10.16 to II-VI’s Registration Statement on Form S-1 (File No. 33-16389).
10.13
Form of Representative Agreement between II-VI and its foreign representatives
Incorporated herein by reference to Exhibit 10.15 to II-VI’s Registration Statement on Form S-1 (File No. 33-16389).
10.14
II-VI Incorporated Amended and Restated Employees’ Stock Purchase Plan
Incorporated herein by reference to Exhibit 10.04 to II-VI’s Registration Statement on Form S-1 (File No. 33-16389).
10.15
First Amendment to the II-VI Incorporated Amended and Restated Employees’ Stock Purchase Plan
Incorporated herein by reference to Exhibit 10.01 to II-VI’s Quarterly Report on Form 10-Q (File No. 000-16195) for the quarter ended March 31, 1996.
10.16
II-VI Incorporated Amended and Restated Employees’ Profit-Sharing Plan and Trust Agreement, as amended
Incorporated herein by reference to Exhibit 10.05 to II-VI’s Registration Statement on Form S-1 (File No. 33-16389).
10.17
Description of Bonus Incentive Plan*
Incorporated herein by reference to Exhibit 10.14 to II-VI’s Annual Report on Form 10-K (File No. 000-16195) for the fiscal year ended June 30, 1996.
10.18
Description of Discretionary Incentive Plan (now known as the Goal/ Results Incentive Program)*
Incorporated herein by reference to Exhibit 10.27 to II-VI’s Annual Report on Form 10-K (File No. 000-16195) for the fiscal year ended June 30, 2009.
10.19
Description of Management-By-Objective Plan*
Incorporated herein by reference to Exhibit 10.09 to II-VI’s Annual Report on Form 10-K (File No. 000-16195) for the fiscal year ended June 30, 1993.
10.20
Amended and Restated II-VI Incorporated Deferred Compensation Plan (applicable to periods prior to January 1, 2015)*
Incorporated herein by reference to Exhibit 10.17 to II-VI’s Annual Report on Form 10-K (File No. 000-16195) for the fiscal year ended June 30, 2015.
10.21
Amended and Restated II-VI Incorporated Deferred Compensation Plan (applicable to periods after January 1, 2015)*
Incorporated herein by reference to Exhibit 10.18 to II-VI’s Annual Report on Form 10-K (File No. 000-16195) for the fiscal year ended June 30, 2015.
10.22
Trust Under the II-VI Incorporated Deferred Compensation Plan*
Incorporated herein by reference is Exhibit 10.13 to II-VI’s Annual Report on Form 10-K (File No. 000-16195) for the fiscal year ended June 30, 1996.
10.23
II-VI Incorporated 2009 Omnibus Incentive Plan*
Incorporated herein by reference to Exhibit A to II-VI’s Definitive Proxy Statement on Schedule 14A (File No. 000-16195) filed on September 25, 2009.
10.24
Form of Nonqualified Stock Option Agreement under the II-VI Incorporated 2009 Omnibus Incentive Plan*
Incorporated herein by reference to Exhibit 10.27 to II-VI’s Current Report on Form 10-Q (File No. 000-16195) for the quarter ended December 31, 2011.
9500_10Kc1.pdf August 30, 2016 pg 81
82
10.25
Form of Restricted Share Award Agreement under the II-VI Incorporated 2009 Omnibus Incentive Plan*
Incorporated herein by reference to Exhibit 10.28 to II-VI’s Current Report on Form 10-Q (File No. 000-16195) for the quarter ended December 31, 2011.
10.26
Form of Performance Share Award Agreement under the II-VI Incorporated 2009 Omnibus Incentive Plan*
Incorporated herein by reference to Exhibit 10.29 to II-VI’s Current Report on Form 10-Q (File No. 000-16195) for the quarter ended December 31, 2011.
10.27
Form of Stock Appreciation Rights Agreement under the II-VI Incorporated 2009 Omnibus Incentive Plan*
Incorporated herein by reference to Exhibit 10.30 to II-VI’s Current Report on Form 10-Q (File No. 000-16195) for the quarter ended December 31, 2011.
10.28
Form of Performance Unit Award Agreement under the II-VI Incorporated 2009 Omnibus Incentive Plan*
Incorporated herein by reference to Exhibit 10.31 to II-VI’s Current Report on Form 10-Q (File No. 000-16195) for the quarter ended March 31, 2012.
10.29
Form of Restricted Share Unit Award Agreement under the II-VI Incorporated 2009 Omnibus Incentive Plan*
Incorporated herein by reference to Exhibit 10.32 to II-VI’s Current Report on Form 10-Q (File No. 000-16195) for the quarter ended March 31, 2012.
10.30
II-VI Incorporated Amended and Restated 2012 Omnibus Incentive Plan*
Incorporated herein by reference to Exhibit 10.01 to II-VI’s Registration Statement on Form S-8 (File No. 333-199855) filed on November 4, 2014.
10.31
Form of Nonqualified Stock Option Agreement under the II-VI Incorporated Amended and Restated 2012 Omnibus Incentive Plan*
Incorporated herein by reference to Exhibit 10.30 to II-VI’s Annual Report on Form 10-K (File No. 000-16195) for the fiscal year ended June 30, 2013.
10.32
Form of Restricted Share Award Agreement under the II-VI Incorporated Amended and Restated 2012 Omnibus Incentive Plan*
Incorporated herein by reference to Exhibit 10.31 to II-VI’s Annual Report on Form 10-K (File No. 000-16195) for the fiscal year ended June 30, 2013.
10.33
Form of Performance Share Award Agreement (Consolidated Revenue) under the II-VI Incorporated Amended and Restated 2012 Omnibus Incentive Plan*
Incorporated herein by reference to Exhibit 10.32 to II-VI’s Annual Report on Form 10-K (File No. 000-16195) for the fiscal year ended June 30, 2013.
10.34
Form of Stock Appreciation Rights Agreement under the II-VI Incorporated Amended and Restated 2012 Omnibus Incentive Plan*
Incorporated herein by reference to Exhibit 10.33 to II-VI’s Annual Report on Form 10-K (File No. 000-16195) for the fiscal year ended June 30, 2013.
10.35
Form of Performance Unit Award Agreement under the II-VI Incorporated Amended and Restated 2012 Omnibus Incentive Plan*
Incorporated herein by reference to Exhibit 10.34 to II-VI’s Annual Report on Form 10-K (File No. 000-16195) for the fiscal year ended June 30, 2013.
10.36
Form of Restricted Share Unit Award Agreement under the II-VI Incorporated Amended and Restated 2012 Omnibus Incentive Plan*
Incorporated herein by reference to Exhibit 10.35 to II-VI’s Annual Report on Form 10-K (File No. 000-16195) for the fiscal year ended June 30, 2013.
10.37 Form of Performance Share Award Agreement (Total Shareholder Return) under the II-VI Incorporated Amended and Restated 2012 Omnibus Incentive Plan*
Incorporated herein by reference to Exhibit 10.38 to II-VI’s Annual Report on Form 10-K (File No. 000-16195) for the fiscal year ended June 30, 2014.
10.38 Form of Performance Unit Award Agreement (Total Shareholder Return) under the II-VI Incorporated Amended and Restated 2012 Omnibus Incentive Plan*
Incorporated herein by reference to Exhibit 10.39 to II-VI’s Annual Report on Form 10-K (File No. 000-16195) for the fiscal year ended June 30, 2014.
9500_10Kc1.pdf August 30, 2016 pg 82

83
10.39 Form of Performance Share Award Agreement (Cash Flow From Operations) under the II-VI Incorporated Amended and Restated 2012 Omnibus Incentive Plan*
Incorporated herein by reference to Exhibit 10.36 to II-VI’s Annual Report on Form 10-K (File No. 000-16195) for the fiscal year ended June 30, 2015.
10.40 Form of Performance Unit Award Agreement (Cash Flow From Operations) under the II-VI Incorporated Amended and Restated 2012 Omnibus Incentive Plan*
Incorporated herein by reference to Exhibit 10.37 to II-VI’s Annual Report on Form 10-K (File No. 000-16195) for the fiscal year ended June 30, 2015.
10.41 II-VI Incorporated Second Amended and Restated Omnibus Incentive Plan*
Incorporated herein by reference to Exhibit 10.1to II-VI’s Current Report on Form 10-Q (File No. 000-16195) for the quarter ended December 31, 2015.
21.01
List of Subsidiaries of II-VI Incorporated
Filed herewith.
23.01
Consent of Ernst & Young LLP
Filed herewith.
31.01
Certification of the Chief Executive Officer pursuant to Rule 13a-14(a) of the Securities Exchange Act of 1934, as amended, and Section 302 of the Sarbanes-Oxley Act of 2002
Filed herewith.
31.02
Certification of the Chief Financial Officer pursuant to Rule 13a-14(a) of the Securities Exchange Act of 1934, as amended, and Section 302 of the Sarbanes-Oxley Act of 2002
Filed herewith.
32.01
Certification of the Chief Executive Officer pursuant to Rule 13a-14(b) of the Securities Exchange Act of 1934, as amended, and 18 U.S.C. § 1350 as adopted pursuant to Section 906 of the Sarbanes-Oxley Act of 2002
Furnished herewith.
32.02 Certification of the Chief Financial Officer pursuant to Rule 13a-14(b) of the Securities Exchange Act of 1934, as amended, and 18 U.S.C. § 1350 as adopted pursuant to Section 906 of the Sarbanes-Oxley Act of 2002
Furnished herewith.
101
Interactive Data File
(101.INS)
XBRL Instance Document
Filed herewith.
(101.SCH)
XBRL Taxonomy Extension Schema Document
Filed herewith.
(101.CAL)
XBRL Taxonomy Extension Calculation Linkbase Document
Filed herewith.
(101.DEF)
XBRL Taxonomy Definition Linkbase
Filed herewith.
(101.LAB)
XBRL Taxonomy Extension Label Linkbase Document
Filed herewith.
(101.PRE)
XBRL Taxonomy Extension Presentation Linkbase Document
Filed herewith. * Denotes management contract or compensatory plan, contract or arrangement.
The Registrant will furnish to the Commission upon request copies of any instruments not filed herewith which authorize the issuance of long-term obligations of the Registrant not in excess of 10% of the Registrant’s total assets on a consolidated basis.
Item 16. FORM 10-K SUMMARY
None.
9500_10Kc1.pdf August 30, 2016 pg 83

84
SIGNATURES
Pursuant to the requirements of Section 13 or 15(d) of the Securities Exchange Act of 1934, the registrant has duly caused this report to be signed on its behalf by the undersigned, thereunto duly authorized. II-VI INCORPORATED
Date: August 26, 2016 By: /s/ Francis J. Kramer Francis J. Kramer
Chairman and Chief Executive Officer and
Director
Pursuant to the requirements of the Securities Exchange Act of 1934, this report has been signed below by the following persons on behalf of the registrant and in the capacities and on the dates indicated. Principal Executive Officer:
Date: August 26, 2016 By: /s/ Francis J. Kramer Francis J. Kramer
Chairman and Chief Executive Officer and
Director
Principal Financial and Accounting Officer:
Date: August 26, 2016 By: /s/ Mary Jane Raymond Mary Jane Raymond Chief Financial Officer and Treasurer
Date: August 26, 2016 By: /s/ Joseph J. Corasanti Joseph J. Corasanti Director
Date: August 26, 2016 By: /s/ Wendy F. DiCicco Wendy F. DiCicco Director
Date: August 26, 2016 By: /s/ Thomas E. Mistler Thomas E. Mistler Director
Date: August 26, 2016 By: /s/ RADM Marc Y. E. Pelaez (retired) RADM Marc Y. E. Pelaez (retired) Director
Date: August 26, 2016 By: /s/ Howard H. Xia Howard H. Xia Director
Date: August 26, 2016 By: /s/ Vincent D. Mattera, Jr. Vincent D. Mattera, Jr. President and Director
Date: August 26, 2016 By: /s/ William Schromm William Schromm Director
9500_10Kc1.pdf August 30, 2016 pg 84

85
Date: August 26, 2016 By: /s/ Shaker Sadasivam Shaker Sadasivam Director
9500_10Kc1.pdf August 30, 2016 pg 85
86
EXHIBIT INDEX
Exhibit No. Description Location
2.01 Share and Asset Purchase Agreement dated as of September 12, 2013, between II-VI Holdings B.V. and Oclaro Technology Limited
Incorporated herein by reference to Exhibit 2.1 to II-VI’s Current Report on Form 8-K (File No. 000-16195) filed on September 12, 2013.
2.02 Asset Purchase Agreement dated as of October 10, 2013, between II-VI Incorporated and Oclaro Technology Limited
Incorporated herein by reference to Exhibit 2.1 to II-VI’s Current Report on Form 8-K (File No. 000-16195) filed on October 11, 2013.
3.01
Amended and Restated Articles of Incorporation of II-VI Incorporated
Incorporated herein by reference to Exhibit 3.1 to II-VI’s Current Report on Form 8-K (File No. 000-16195) filed on November 8, 2011.
3.02
Amended and Restated By-Laws of II-VI Incorporated
Incorporated herein by reference to Exhibit 3.1 to II-VI’s Current Report on Form 8-K (File No. 000-16195) filed on November 14, 2014.
10.01 Second Amended and Restated Credit Agreement, dated as of September 10, 2013, by and among II-VI Incorporated, each of the Guarantors party thereto, each of the Lenders party thereto, and PNC Bank, National Association, as administrative agent ($225,000,000 Revolving Credit Facility and $100,000,000 Term Loan Facility)
Incorporated herein by reference to Exhibit 10.1 to II-VI’s Current Report on Form 8-K (File No. 000-16195) filed on September 12, 2013.
10.02
Credit Agreement, dated as of January 31, 2012, by and among II-VI Japan Incorporated, each of the Guarantors party thereto, PNC Bank, National Association, the other Banks party thereto, and PNC Bank, National Association, in its capacity as agent for the Banks thereunder (500,000,000 Yen Revolving Credit Facility)
Incorporated herein by reference to Exhibit 10.02 to II-VI’s Annual Report on Form 10-K (File No. 000-16195) for the fiscal year ended June 30, 2015.
10.03
First Amendment to Credit Agreement, dated as of September 18, 2015, by and among II-VI Japan Incorporated, the Guarantors party thereto, the Banks party thereto, and PNC Bank, National Association, as agent.
Incorporated herein by reference to Exhibit 10.01 to II-VI’s Quarterly Report on Form 10-Q (File No. 000-16195) for the quarter ended September 30, 2015.
10.04
Amended and Restated Employment Agreement, dated September 19, 2008, by and between II-VI and Francis J. Kramer*
Incorporated herein by reference to Exhibit 10.1 to II-VI’s Current Report on Form 8-K (File No. 000-16195) filed on September 24, 2008.
10.05
Employment Agreement, dated August 1, 2016, by and between II-VI and Vincent D. Mattera, Jr.*
Incorporated herein by reference to Exhibit 10.1 to II-VI’s Current Report on Form 8-K (File No. 000-16195) filed on August 2, 2016.
10.06 Employment Agreement, dated March 6, 2014, by and between II-VI Incorporated and Mary Jane Raymond*
Incorporated herein by reference to Exhibit 10.1 to II-VI’s Current Report on Form 10-Q (File No. 000-16195) for the quarter ended March 31, 2014.
10.07 Consulting Agreement, dated June 10, 2015, by and between II-VI Incorporated and James Martinelli*
Incorporated Herein by reference to Exhibit 10.06 to II-VI’s Annual Report on Form 10-K (File No. 000-16195) for the fiscal year ended June 30, 2015.
10.08 Employment Agreement, dated October 3, 2012, by and between II-VI Incorporated and Giovanni Barbarossa*
Incorporated herein by reference to Exhibit 10.07 to II-VI’s Annual Report on Form 10-K (File No. 000-16195) for the fiscal year ended June 30, 2015.
10.09 Employment Agreement, dated November 10, 2008, by and between II-VI Incorporated and David G. Wagner*
Incorporated herein by reference to Exhibit 10.08 to II-VI’s Annual Report on Form 10-K (File No. 000-16195) for the fiscal year ended June 30, 2015.
9500_10Kc1.pdf August 30, 2016 pg 86

87
10.10 Secondment Engagement Letter, dated November 6, 2015, among Sherrard, German & Kelly, P.C., II-VI Incorporated, and Walter R. Bashaw II*
Incorporated herein by reference to Exhibit 10.02 to II-VI’s Current Report on Form 10-Q (File No. 000-16195) for the fiscal Quarter ended December 31, 2015.
10.11 Employment Agreement, dated February 1, 2016, by and between II-VI Incorporated and Gary A. Kapusta*
Incorporated herein by reference to Exhibit 10.01 to II-VI’s Current Report on Form 8-K (File No. 000-16195) filed on February 1, 2016.
10.12
Form of Employment Agreement*
Incorporated herein by reference to Exhibit 10.16 to II-VI’s Registration Statement on Form S-1 (File No. 33-16389).
10.13
Form of Representative Agreement between II-VI and its foreign representatives
Incorporated herein by reference to Exhibit 10.15 to II-VI’s Registration Statement on Form S-1 (File No. 33-16389).
10.14
II-VI Incorporated Amended and Restated Employees’ Stock Purchase Plan
Incorporated herein by reference to Exhibit 10.04 to II-VI’s Registration Statement on Form S-1 (File No. 33-16389).
10.15
First Amendment to the II-VI Incorporated Amended and Restated Employees’ Stock Purchase Plan
Incorporated herein by reference to Exhibit 10.01 to II-VI’s Quarterly Report on Form 10-Q (File No. 000-16195) for the quarter ended March 31, 1996.
10.16
II-VI Incorporated Amended and Restated Employees’ Profit-Sharing Plan and Trust Agreement, as amended
Incorporated herein by reference to Exhibit 10.05 to II-VI’s Registration Statement on Form S-1 (File No. 33-16389).
10.17
Description of Bonus Incentive Plan*
Incorporated herein by reference to Exhibit 10.14 to II-VI’s Annual Report on Form 10-K (File No. 000-16195) for the fiscal year ended June 30, 1996.
10.18
Description of Discretionary Incentive Plan (now known as the Goal/ Results Incentive Program)*
Incorporated herein by reference to Exhibit 10.27 to II-VI’s Annual Report on Form 10-K (File No. 000-16195) for the fiscal year ended June 30, 2009.
10.19
Description of Management-By-Objective Plan*
Incorporated herein by reference to Exhibit 10.09 to II-VI’s Annual Report on Form 10-K (File No. 000-16195) for the fiscal year ended June 30, 1993.
10.20
Amended and Restated II-VI Incorporated Deferred Compensation Plan (applicable to periods prior to January 1, 2015)*
Incorporated herein by reference to Exhibit 10.17 to II-VI’s Annual Report on Form 10-K (File No. 000-16195) for the fiscal year ended June 30, 2015.
10.21
Amended and Restated II-VI Incorporated Deferred Compensation Plan (applicable to periods after January 1, 2015)*
Incorporated herein by reference to Exhibit 10.18 to II-VI’s Annual Report on Form 10-K (File No. 000-16195) for the fiscal year ended June 30, 2015.
10.22
Trust Under the II-VI Incorporated Deferred Compensation Plan*
Incorporated herein by reference is Exhibit 10.13 to II-VI’s Annual Report on Form 10-K (File No. 000-16195) for the fiscal year ended June 30, 1996.
10.23
II-VI Incorporated 2009 Omnibus Incentive Plan*
Incorporated herein by reference to Exhibit A to II-VI’s Definitive Proxy Statement on Schedule 14A (File No. 000-16195) filed on September 25, 2009.
9500_10Kc1.pdf August 30, 2016 pg 87

88
10.24
Form of Nonqualified Stock Option Agreement under the II-VI Incorporated 2009 Omnibus Incentive Plan*
Incorporated herein by reference to Exhibit 10.27 to II-VI’s Current Report on Form 10-Q (File No. 000-16195) for the quarter ended December 31, 2011.
10.25
Form of Restricted Share Award Agreement under the II-VI Incorporated 2009 Omnibus Incentive Plan*
Incorporated herein by reference to Exhibit 10.28 to II-VI’s Current Report on Form 10-Q (File No. 000-16195) for the quarter ended December 31, 2011.
10.26
Form of Performance Share Award Agreement under the II-VI Incorporated 2009 Omnibus Incentive Plan*
Incorporated herein by reference to Exhibit 10.29 to II-VI’s Current Report on Form 10-Q (File No. 000-16195) for the quarter ended December 31, 2011.
10.27
Form of Stock Appreciation Rights Agreement under the II-VI Incorporated 2009 Omnibus Incentive Plan*
Incorporated herein by reference to Exhibit 10.30 to II-VI’s Current Report on Form 10-Q (File No. 000-16195) for the quarter ended December 31, 2011.
10.28
Form of Performance Unit Award Agreement under the II-VI Incorporated 2009 Omnibus Incentive Plan*
Incorporated herein by reference to Exhibit 10.31 to II-VI’s Current Report on Form 10-Q (File No. 000-16195) for the quarter ended March 31, 2012.
10.29
Form of Restricted Share Unit Award Agreement under the II-VI Incorporated 2009 Omnibus Incentive Plan*
Incorporated herein by reference to Exhibit 10.32 to II-VI’s Current Report on Form 10-Q (File No. 000-16195) for the quarter ended March 31, 2012.
10.30
II-VI Incorporated Amended and Restated 2012 Omnibus Incentive Plan*
Incorporated herein by reference to Exhibit 10.01 to II-VI’s Registration Statement on Form S-8 (File No. 333-199855) filed on November 4, 2014.
10.31
Form of Nonqualified Stock Option Agreement under the II-VI Incorporated Amended and Restated 2012 Omnibus Incentive Plan*
Incorporated herein by reference to Exhibit 10.30 to II-VI’s Annual Report on Form 10-K (File No. 000-16195) for the fiscal year ended June 30, 2013.
10.32
Form of Restricted Share Award Agreement under the II-VI Incorporated Amended and Restated 2012 Omnibus Incentive Plan*
Incorporated herein by reference to Exhibit 10.31 to II-VI’s Annual Report on Form 10-K (File No. 000-16195) for the fiscal year ended June 30, 2013.
10.33
Form of Performance Share Award Agreement (Consolidated Revenue) under the II-VI Incorporated Amended and Restated 2012 Omnibus Incentive Plan*
Incorporated herein by reference to Exhibit 10.32 to II-VI’s Annual Report on Form 10-K (File No. 000-16195) for the fiscal year ended June 30, 2013.
10.34
Form of Stock Appreciation Rights Agreement under the II-VI Incorporated Amended and Restated 2012 Omnibus Incentive Plan*
Incorporated herein by reference to Exhibit 10.33 to II-VI’s Annual Report on Form 10-K (File No. 000-16195) for the fiscal year ended June 30, 2013.
10.35
Form of Performance Unit Award Agreement under the II-VI Incorporated Amended and Restated 2012 Omnibus Incentive Plan*
Incorporated herein by reference to Exhibit 10.34 to II-VI’s Annual Report on Form 10-K (File No. 000-16195) for the fiscal year ended June 30, 2013.
10.36
Form of Restricted Share Unit Award Agreement under the II-VI Incorporated Amended and Restated 2012 Omnibus Incentive Plan*
Incorporated herein by reference to Exhibit 10.35 to II-VI’s Annual Report on Form 10-K (File No. 000-16195) for the fiscal year ended June 30, 2013.
10.37 Form of Performance Share Award Agreement (Total Shareholder Return) under the II-VI Incorporated Amended and Restated 2012 Omnibus Incentive Plan*
Incorporated herein by reference to Exhibit 10.38 to II-VI’s Annual Report on Form 10-K (File No. 000-16195) for the fiscal year ended June 30, 2014.
9500_10Kc1.pdf August 30, 2016 pg 88

89
10.38 Form of Performance Unit Award Agreement (Total Shareholder Return) under the II-VI Incorporated Amended and Restated 2012 Omnibus Incentive Plan*
Incorporated herein by reference to Exhibit 10.39 to II-VI’s Annual Report on Form 10-K (File No. 000-16195) for the fiscal year ended June 30, 2014.
10.39 Form of Performance Share Award Agreement (Cash Flow From Operations) under the II-VI Incorporated Amended and Restated 2012 Omnibus Incentive Plan*
Incorporated herein by reference to Exhibit 10.36 to II-VI’s Annual Report on Form 10-K (File No. 000-16195) for the fiscal year ended June 30, 2015.
10.40 Form of Performance Unit Award Agreement (Cash Flow From Operations) under the II-VI Incorporated Amended and Restated 2012 Omnibus Incentive Plan*
Incorporated herein by reference to Exhibit 10.37 to II-VI’s Annual Report on Form 10-K (File No. 000-16195) for the fiscal year ended June 30, 2015.
10.41 II-VI Incorporated Second Amended and Restated Omnibus Incentive Plan*
Incorporated herein by reference to Exhibit 10.1to II-VI’s Current Report on Form 10-Q (File No. 000-16195) for the quarter ended December 31, 2015.
21.01
List of Subsidiaries of II-VI Incorporated
Filed herewith.
23.01
Consent of Ernst & Young LLP
Filed herewith.
31.01
Certification of the Chief Executive Officer pursuant to Rule 13a-14(a) of the Securities Exchange Act of 1934, as amended, and Section 302 of the Sarbanes-Oxley Act of 2002
Filed herewith.
31.02
Certification of the Chief Financial Officer pursuant to Rule 13a-14(a) of the Securities Exchange Act of 1934, as amended, and Section 302 of the Sarbanes-Oxley Act of 2002
Filed herewith.
32.01
Certification of the Chief Executive Officer pursuant to Rule 13a-14(b) of the Securities Exchange Act of 1934, as amended, and 18 U.S.C. § 1350 as adopted pursuant to Section 906 of the Sarbanes-Oxley Act of 2002
Furnished herewith.
32.02 Certification of the Chief Financial Officer pursuant to Rule 13a-14(b) of the Securities Exchange Act of 1934, as amended, and 18 U.S.C. § 1350 as adopted pursuant to Section 906 of the Sarbanes-Oxley Act of 2002
Furnished herewith.
101
Interactive Data File
(101.INS)
XBRL Instance Document
Filed herewith.
(101.SCH)
XBRL Taxonomy Extension Schema Document
Filed herewith.
(101.CAL)
XBRL Taxonomy Extension Calculation Linkbase Document
Filed herewith.
(101.DEF)
XBRL Taxonomy Definition Linkbase
Filed herewith.
(101.LAB)
XBRL Taxonomy Extension Label Linkbase Document
Filed herewith.
(101.PRE)
XBRL Taxonomy Extension Presentation Linkbase Document
Filed herewith. * Denotes management contract or compensatory plan, contract or arrangement.
The Registrant will furnish to the Commission upon request copies of any instruments not filed herewith which authorize the issuance of long-term obligations of the Registrant not in excess of 10% of the Registrant’s total assets on a consolidated basis.
Item 16. FORM 10-K SUMMARY
None.
9500_10Kc1.pdf August 30, 2016 pg 89
Exhibit 31.01
CERTIFICATIONS
I, Francis J. Kramer, certify that: 1. I have reviewed this Annual Report on Form 10-K of II-VI Incorporated; 2. Based on my knowledge, this report does not contain any untrue statement of a material fact or omit to state a material
fact necessary to make the statements made, in light of the circumstances under which such statements were made, not misleading with respect to the period covered by this report;
3. Based on my knowledge, the financial statements, and other financial information included in this report, fairly present in all material respects the financial condition, results of operations and cash flows of the registrant as of, and for, the periods presented in this report;
4. The registrant’s other certifying officers and I are responsible for establishing and maintaining disclosure controls and procedures (as defined in Exchange Act Rules 13a-15(e) and 15d-15(e)) and internal control over financial reporting (as defined in Exchange Act Rules 13a-15(f) and 15d-15(f)) for the registrant and have: a) Designed such disclosure controls and procedures, or caused such disclosure controls and procedures to be designed under our supervision, to ensure that material information relating to the registrant, including its consolidated subsidiaries, is made known to us by others within those entities, particularly during the period in which this report is being prepared; b) Designed such internal control over financial reporting, or caused such internal control over financial reporting to be designed under our supervision, to provide reasonable assurance regarding the reliability of financial reporting and the preparation of financial statements for external purposes in accordance with generally accepted accounting principles; c) Evaluated the effectiveness of the registrant’s disclosure controls and procedures and presented in this report our conclusions about the effectiveness of the disclosure controls and procedures, as of the end of the period covered by this report based on such evaluation; and d) Disclosed in this report any change in the registrant’s internal control over financial reporting that occurred during the registrant’s most recent fiscal quarter (the registrant’s fourth fiscal quarter in case of an annual report) that has materially affected, or is reasonably likely to materially affect, the registrant’s internal control over financial reporting; and
5. The registrant’s other certifying officers and I have disclosed, based on our most recent evaluation of internal control over financial reporting, to the registrant’s auditors and the audit committee of the registrant’s board of directors (or persons performing the equivalent functions): a) All significant deficiencies and material weaknesses in the design or operation of internal control over financial reporting which are reasonably likely to adversely affect the registrant’s ability to record, process, summarize and report financial information; and b) Any fraud, whether or not material, that involves management or other employees who have a significant role in the registrant’s internal control over financial reporting.
August 26, 2016 By: /s/ Francis J. Kramer Francis J. Kramer
Chairman and Chief Executive Officer and
Director
9500_10Kc1.pdf August 30, 2016 pg 90

Exhibit 31.02
CERTIFICATIONS
I, Mary Jane Raymond, certify that: 1. I have reviewed this Annual Report on Form 10-K of II-VI Incorporated; 2. Based on my knowledge, this report does not contain any untrue statement of a material fact or omit to state a material
fact necessary to make the statements made, in light of the circumstances under which such statements were made, not misleading with respect to the period covered by this report;
3. Based on my knowledge, the financial statements, and other financial information included in this report, fairly present in all material respects the financial condition, results of operations and cash flows of the registrant as of, and for, the periods presented in this report;
4. The registrant’s other certifying officers and I are responsible for establishing and maintaining disclosure controls and procedures (as defined in Exchange Act Rules 13a-15(e) and 15d-15(e)) and internal control over financial reporting (as defined in Exchange Act Rules 13a-15(f) and 15d-15(f)) for the registrant and have: a) Designed such disclosure controls and procedures, or caused such disclosure controls and procedures to be designed under our supervision, to ensure that material information relating to the registrant, including its consolidated subsidiaries, is made known to us by others within those entities, particularly during the period in which this report is being prepared; b) Designed such internal control over financial reporting, or caused such internal control over financial reporting to be designed under our supervision, to provide reasonable assurance regarding the reliability of financial reporting and the preparation of financial statements for external purposes in accordance with generally accepted accounting principles; c) Evaluated the effectiveness of the registrant’s disclosure controls and procedures and presented in this report our conclusions about the effectiveness of the disclosure controls and procedures, as of the end of the period covered by this report based on such evaluation; and d) Disclosed in this report any change in the registrant’s internal control over financial reporting that occurred during the registrant’s most recent fiscal quarter (the registrant’s fourth fiscal quarter in case of an annual report) that has materially affected, or is reasonably likely to materially affect, the registrant’s internal control over financial reporting; and
5. The registrant’s other certifying officers and I have disclosed, based on our most recent evaluation of internal control over financial reporting, to the registrant’s auditors and the audit committee of the registrant’s board of directors (or persons performing the equivalent functions): a) All significant deficiencies and material weaknesses in the design or operation of internal control over financial reporting which are reasonably likely to adversely affect the registrant’s ability to record, process, summarize and report financial information; and b) Any fraud, whether or not material, that involves management or other employees who have a significant role in the registrant’s internal control over financial reporting.
August 26, 2016 By: /s/ Mary Jane Raymond Mary Jane Raymond Chief Financial Officer and Treasurer
9500_10Kc1.pdf August 30, 2016 pg 91

Exhibit 32.01
CERTIFICATION PURSUANT TO 18 U.S.C. SECTION 1350,
AS ADOPTED PURSUANT TO SECTION 906 OF THE SARBANES-OXLEY ACT OF 2002
In connection with the Annual Report of II-VI Incorporated (the “Corporation”) on Form 10-K for the year ended June 30, 2016 as filed with the Securities and Exchange Commission on the date hereof (the “Report”), the undersigned officer of the Corporation certifies, pursuant to 18 U.S.C. § 1350, as adopted pursuant to Section 906 of the Sarbanes-Oxley Act of 2002, that, to his knowledge:
(1) The Report fully complies with the requirements of Section 13(a) or 15(d) of the Securities Exchange Act of 1934; and (2) The information contained in the Report fairly presents, in all material respects, the financial condition and results of
operations of the Corporation. Date: August 26, 2016 /s/ Francis J. Kramer Francis J. Kramer Chairman and Chief Executive Officer and Director
* This certification is made solely for purposes of 18 U.S.C. Section 1350, subject to the knowledge standard contained therein, and not for any other purpose.
9500_10Kc1.pdf August 30, 2016 pg 92

Exhibit 32.02
CERTIFICATION PURSUANT TO 18 U.S.C. SECTION 1350,
AS ADOPTED PURSUANT TO SECTION 906 OF THE SARBANES-OXLEY ACT OF 2002
In connection with the Annual Report of II-VI Incorporated (the “Corporation”) on Form 10-K for the year ended June 30, 2016 as filed with the Securities and Exchange Commission on the date hereof (the “Report”), the undersigned officer of the Corporation certifies, pursuant to 18 U.S.C. § 1350, as adopted pursuant to Section 906 of the Sarbanes-Oxley Act of 2002, that, to his knowledge:
(1) The Report fully complies with the requirements of Section 13(a) or 15(d) of the Securities Exchange Act of 1934; and (2) The information contained in the Report fairly presents, in all material respects, the financial condition and results of
operations of the Corporation. Date: August 26, 2016 /s/ Mary Jane Raymond Mary Jane Raymond Chief Financial Officer and Treasurer
* This certification is made solely for purposes of 18 U.S.C. Section 1350, subject to the knowledge standard contained therein, and not for any other purpose.
9500_10Kc1.pdf August 30, 2016 pg 93

THIS PAGE INTENTIONALLY LEFT BLANK
9500_10Kc1.pdf August 30, 2016 pg 94

About II-VIII-VI Incorporated, a global leader in engineered materials and optoelectronic devices and components, is a vertically integrated manufacturing company that develops innovative products for diversified applications in the industrial, optical communications, military, life sciences, semiconductor equipment and consumer markets. Headquartered in Saxonburg, Pennsylvania, with research and development, manufacturing, sales, service and distribution facilities worldwide, the Company produces a wide variety of application-specific photonic and electronic materials and components and deploys them in various forms, including integrated with advanced software, to enable our customers’ success.
II-VI stock appreciation since IPO under Fran’s tenure with the Company
TRIBUTE TO FRANCIS J. KRAMERAfter a 33-year career that shaped the II-VI we know today, Francis J. Kramer has retired as the CEO of II-VI. He joined II-VI with the goal to build a profitable global company that would endure. His commitment to ensuring that our Company was not just about him but about all of us, and all of us who would come after him, has been inspiring and elevating. His focus on directing our research and development to identify materials with a 50-year or even a 100-year life was all about creating a lasting foundation of competitive advantage. Fran treated everyone as a partner, whether a long-serving employee who joined the same year he did, or someone who joined in the last year. He always demonstrated that he had something to learn from each one of us.
During Fran’s tenure with the Company, II-VI grew from $5 million in revenue to over $800 million, a 16 percent compound annual growth rate. He successfully completed 20 acquisitions in 20 years, drove the global manufacturing and sales footprint, diversified the Company’s product portfolio and established a culture that focuses on the consistent delivery of strategic, profitable growth worldwide.
We thank Fran for his leadership, his fine example of respect and appreciation, his pride in everything that is II-VI and his willingness to share his wisdom and experience with us for so many years. We look forward to his continued strategic guidance as our Chairman of the Board of Directors. Fran said on his last earnings call that he has loved what he did at II-VI. We are all the grateful beneficiaries of his love and dedication to our Company.
Francis J. Kramer
>5,000%6000%
0%1988 2016
CORPORATE INFORMATION
II-VI Incorporated is an Equal Opportunity Employer. As such, it is the Company’s policy to promote equal employment opportunities and to prohibit discrimination on the basis of race, color, religion, sex, age, national origin, disability, status as a veteran or other legally protected class in all aspects of employment, including recruiting, hiring, training and promoting personnel. In fulfilling this commitment, the Company shall comply with the letter and spirit of all applicable laws, regulations and Executive Orders governing equal opportunity in employment.
Board of DirectorsJoseph J. CorasantiRetired President, CEO and Director CONMED Corporation
Wendy F. DiCiccoPresident and Chief Operating Officer Camber Spine Technologies
Francis J. KramerChairman II-VI Incorporated
Vincent D. Mattera, Jr.President and Chief Executive Officer II-VI Incorporated
Thomas E. MistlerRetired Executive Westinghouse Electric Corporation
Marc Y. E. PelaezRear AdmiralUnited States Navy (retired)
William A. SchrommExecutive Vice President and Chief Operating Officer ON Semiconductor Corporation
Shaker SadasivamPresident and Chief Executive Officer SunEdison Semiconductor LLC
Howard H. XiaRetired Executive Vodafone China
Executive OfficersVincent D. Mattera, Jr.President and Chief Executive Officer
Gary A. KapustaChief Operating Officer
Mary Jane RaymondChief Financial Officer
Giovanni BarbarossaChief Technology Officer
David G. WagnerVice President, Human Resources
Walter R. Bashaw IIInterim General Counsel and Secretary
Annual MeetingFriday, November 4, 2016 At 1:30 PM ESTMarriott Pittsburgh North 100 Cranberry Woods Drive Cranberry Township, PA 16066
Stock ListingThe common stock of II-VI Incorporated is traded on Nasdaq under the trading symbol “IIVI.”
Transfer AgentAmerican Stock Transfer & Trust Company6201 15th Ave. Brooklyn, NY 11219 1.800.937.5449
Independent Registered Public AccountantsErnst & Young LLP2100 One PPG Place Pittsburgh, PA 15222
Corporate CounselSherrard, German & Kelly, P.C.535 Smithfield Street, Ste. 300 Pittsburgh, PA 15222
Securities CounselK&L Gates LLPK&L Gates Center 210 Sixth Avenue Pittsburgh, PA 15222

2016 ANNUAL REPORT375 Saxonburg Boulevard, Saxonburg, PA 16056
724.352.4455
www.ii-vi.com