Embed Size (px)
DESCRIPTION
eng
Citation preview
National Renewable Energy Laboratory Innovation for Our Energy Future
A national laboratory of the U.S. Department of EnergyOffice of Energy Efficiency & Renewable Energy
NREL is operated by Midwest Research Institute ● Battelle Contract No. DE-AC36-99-GO10337
Development of an Energy-Savings Calculation Methodology for Residential Miscellaneous Electric Loads Preprint R. Hendron and M. Eastment
To be presented at the 2006 ACEEE Summer Study on Energy Efficiency in Buildings Pacific Grove, California August 13–18, 2006
Conference Paper NREL/CP-550-39551 August 2006
NOTICE
The submitted manuscript has been offered by an employee of the Midwest Research Institute (MRI), a contractor of the US Government under Contract No. DE-AC36-99GO10337. Accordingly, the US Government and MRI retain a nonexclusive royalty-free license to publish or reproduce the published form of this contribution, or allow others to do so, for US Government purposes.
This report was prepared as an account of work sponsored by an agency of the United States government. Neither the United States government nor any agency thereof, nor any of their employees, makes any warranty, express or implied, or assumes any legal liability or responsibility for the accuracy, completeness, or usefulness of any information, apparatus, product, or process disclosed, or represents that its use would not infringe privately owned rights. Reference herein to any specific commercial product, process, or service by trade name, trademark, manufacturer, or otherwise does not necessarily constitute or imply its endorsement, recommendation, or favoring by the United States government or any agency thereof. The views and opinions of authors expressed herein do not necessarily state or reflect those of the United States government or any agency thereof.
Available electronically at http://www.osti.gov/bridge
Available for a processing fee to U.S. Department of Energy and its contractors, in paper, from:
U.S. Department of Energy Office of Scientific and Technical Information P.O. Box 62 Oak Ridge, TN 37831-0062 phone: 865.576.8401 fax: 865.576.5728 email: mailto:[email protected]
Available for sale to the public, in paper, from: U.S. Department of Commerce National Technical Information Service 5285 Port Royal Road Springfield, VA 22161 phone: 800.553.6847 fax: 703.605.6900 email: [email protected] online ordering: http://www.ntis.gov/ordering.htm
Printed on paper containing at least 50% wastepaper, including 20% postconsumer waste

Development of an Energy-Savings Calculation Methodology for Residential Miscellaneous Electric Loads1
Robert Hendron and Mark Eastment, National Renewable Energy Laboratory
ABSTRACT
To meet whole-house energy savings targets beyond 50% in residential buildings, new technologies and systems approaches must be developed to address miscellaneous electric loads (MELs). MELs are the small and diverse collection of energy-consuming devices found in homes, including what are commonly known as plug loads (televisions, stereos, microwaves), along with all hard-wired loads (doorbells, security systems, garage door openers) that do not fit into other major end-use categories (space conditioning, domestic hot water, ventilation, major appliances, and lighting). MELs present special challenges because their purchase and operation are largely under the control of the occupants. If no steps are taken to address MELs, they can constitute 40%-50% of the remaining source energy use in homes that achieve 60-70% whole-house energy savings, and this percentage is likely to increase in the future as home electronics become even more sophisticated and their use becomes more widespread. Building America (BA), a U.S. Department of Energy research program that targets 50% energy savings in new homes by 2015 and 100% savings (zero net energy) by 2020, has begun to identify and develop advanced solutions that can significantly reduce MELs.
As part of the ongoing efforts by Building America to create a consistent set of guidelines for the analysis of whole-house energy use, the National Renewable Energy Laboratory (NREL) has disaggregated the MEL end-use category and developed a methodology to calculate energy savings for measures that have the potential to reduce these loads. This disaggregation includes electricity use for more than 100 individual MELs, active vs. low-power draw, hours in each operating mode, market penetration, correlation with house size and occupancy, and impacts on latent and sensible heat loads. The MEL Analysis Spreadsheet posted on the BA website (www.eere.energy.gov/buildings/building_america/pa_resources.html) documents this disaggregation and provides the framework for calculating energy savings for prototype houses with specific MEL improvements.
Introduction
Miscellaneous electric loads are composed of the diverse assortment of products, devices,
and electrical equipment found in some combination in every household. MELs are usually either small end-uses found in a large percentage of homes (such as toasters, televisions, and coffee makers) or large end-uses that are only found in a small fraction of homes (such as well pumps, waterbed heaters, and aquariums). This variety makes it very difficult to find systems-based solutions that can have a significant impact on the total energy use of MELs in a typical home, especially when one takes into account the role of the occupants in choosing and operating these devices.
1 This work has been authored by an employee or employees of the Midwest Research Institute under
Contract No. DE-AC36-99GO10337 with the U.S. Department of Energy. The United States Government retains and the publisher, by accepting the article for publication, acknowledges that the United States Government retains a non-exclusive, paid-up, irrevocable, worldwide license to publish or reproduce the published form of this work, or allow others to do so, for United States Government purposes.
1
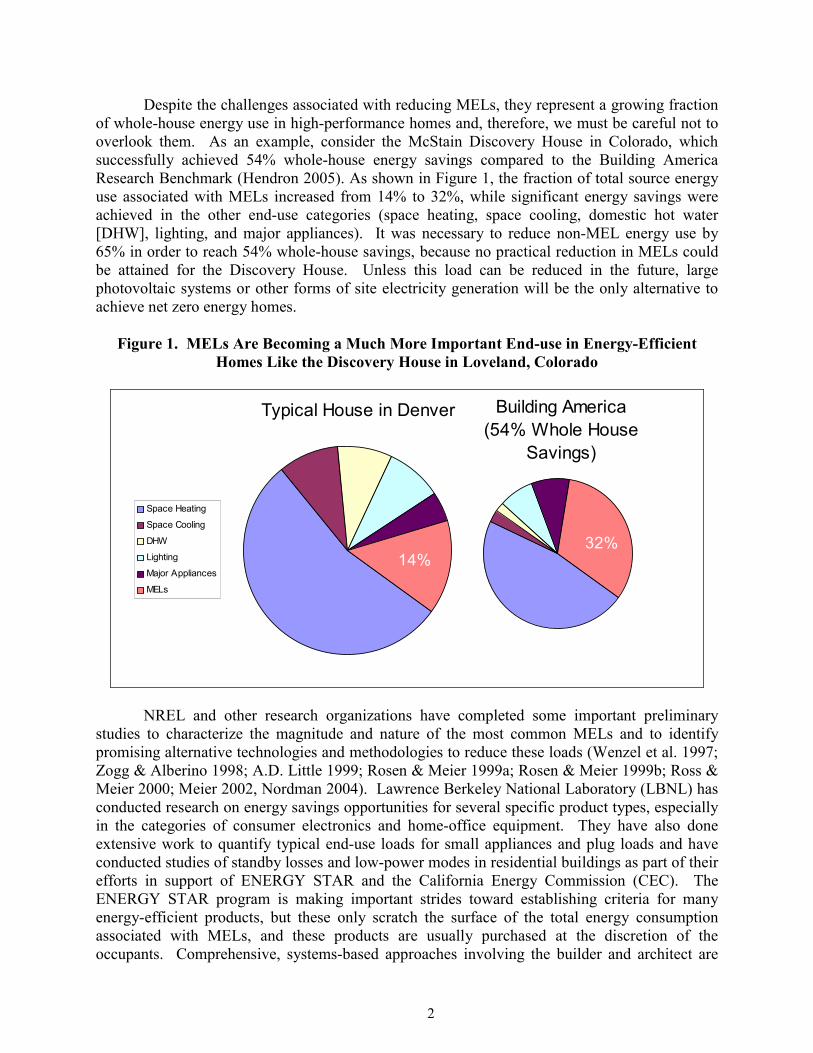
Despite the challenges associated with reducing MELs, they represent a growing fraction of whole-house energy use in high-performance homes and, therefore, we must be careful not to overlook them. As an example, consider the McStain Discovery House in Colorado, which successfully achieved 54% whole-house energy savings compared to the Building America Research Benchmark (Hendron 2005). As shown in Figure 1, the fraction of total source energy use associated with MELs increased from 14% to 32%, while significant energy savings were achieved in the other end-use categories (space heating, space cooling, domestic hot water [DHW], lighting, and major appliances). It was necessary to reduce non-MEL energy use by 65% in order to reach 54% whole-house savings, because no practical reduction in MELs could be attained for the Discovery House. Unless this load can be reduced in the future, large photovoltaic systems or other forms of site electricity generation will be the only alternative to achieve net zero energy homes.
Figure 1. MELs Are Becoming a Much More Important End-use in Energy-Efficient
Homes Like the Discovery House in Loveland, Colorado
Typical House in Denver
Space Heating
Space Cooling
DHW
Lighting
Major Appliances
MELs
Building America(54% Whole House
Savings)
32%14%
NREL and other research organizations have completed some important preliminary
studies to characterize the magnitude and nature of the most common MELs and to identify promising alternative technologies and methodologies to reduce these loads (Wenzel et al. 1997; Zogg & Alberino 1998; A.D. Little 1999; Rosen & Meier 1999a; Rosen & Meier 1999b; Ross & Meier 2000; Meier 2002, Nordman 2004). Lawrence Berkeley National Laboratory (LBNL) has conducted research on energy savings opportunities for several specific product types, especially in the categories of consumer electronics and home-office equipment. They have also done extensive work to quantify typical end-use loads for small appliances and plug loads and have conducted studies of standby losses and low-power modes in residential buildings as part of their efforts in support of ENERGY STAR and the California Energy Commission (CEC). The ENERGY STAR program is making important strides toward establishing criteria for many energy-efficient products, but these only scratch the surface of the total energy consumption associated with MELs, and these products are usually purchased at the discretion of the occupants. Comprehensive, systems-based approaches involving the builder and architect are
2
necessary to ensure some degree of energy savings regardless of occupant purchasing decisions and usage patterns.
A consistent approach for calculating annual energy savings, including systems interactions caused by sensible and latent loads, has been a missing component of MEL research in the past. Such an approach is essential if programs like BA are to achieve significant defensible savings in the MEL end-use category. To this end, NREL developed an MEL Analysis Spreadsheet in consultation with the BA industry team analysts. This spreadsheet is now available as an optional method for analyzing MEL, and is posted on the BA website (http://www.eere.energy.gov/buildings/building_america/docs/bench_mels_012406.xls). Methodology Development
Past Treatment of MELs in the Benchmark
The 2005 Building America Benchmark (Hendron 2005) and the Building America
Performance Analysis Procedures (Hendron et al. 2004) form the framework for calculating whole-house source energy savings for Building America prototype houses. However, until 2006, MELs have been treated in a fairly simplistic way, and no standard methodology existed to allow the analyst to calculate energy savings for MEL improvements. Site electricity use associated with MELs was defined as a simple function of finished floor area for both the Benchmark and the prototype using Equation 1. A multiplier was applied if the prototype was located in one of the four most populated states as defined in the 2001 Energy Information Administration (EIA) Residential Energy Consumption Survey (RECS) (EIA 2001).2 This multiplier was important because the magnitude of the electricity use for MELs in a particular state could have a significant effect on the size of the photovoltaic system necessary to achieve net zero energy. A multiplier of 1.0 was used for all states not listed in Table 1 because insufficient information was available about the magnitude of MELs in those states. The derivation of state multipliers will be described in more detail later in this paper.
EMEL = 1.67 x FFA x FS (1)
where EMEL = site electricity for MELs in the 2005 Benchmark (kWh/yr) FFA = finished floor area, including finished basements (ft2) FS = state multiplier from Table 1.
2 It is important to note that the RECS analysis process uses a nonlinear regression technique to quantify
each end-use, including MELs. Because of potential interactions between independent variables, for example between MELs and cooling energy, it is possible that systematic errors in the regression analysis can result in overestimation or underestimation of the MELs in a particular state. RECS also includes an independent variable driven by the number of household members and their ages. This catch-all variable represents electricity consuming products that cannot be quantified individually and equals about 48% of total MEL energy. Our assumption is that this variable includes only MELs, but it may also include errors in the estimation of other end-uses.
3
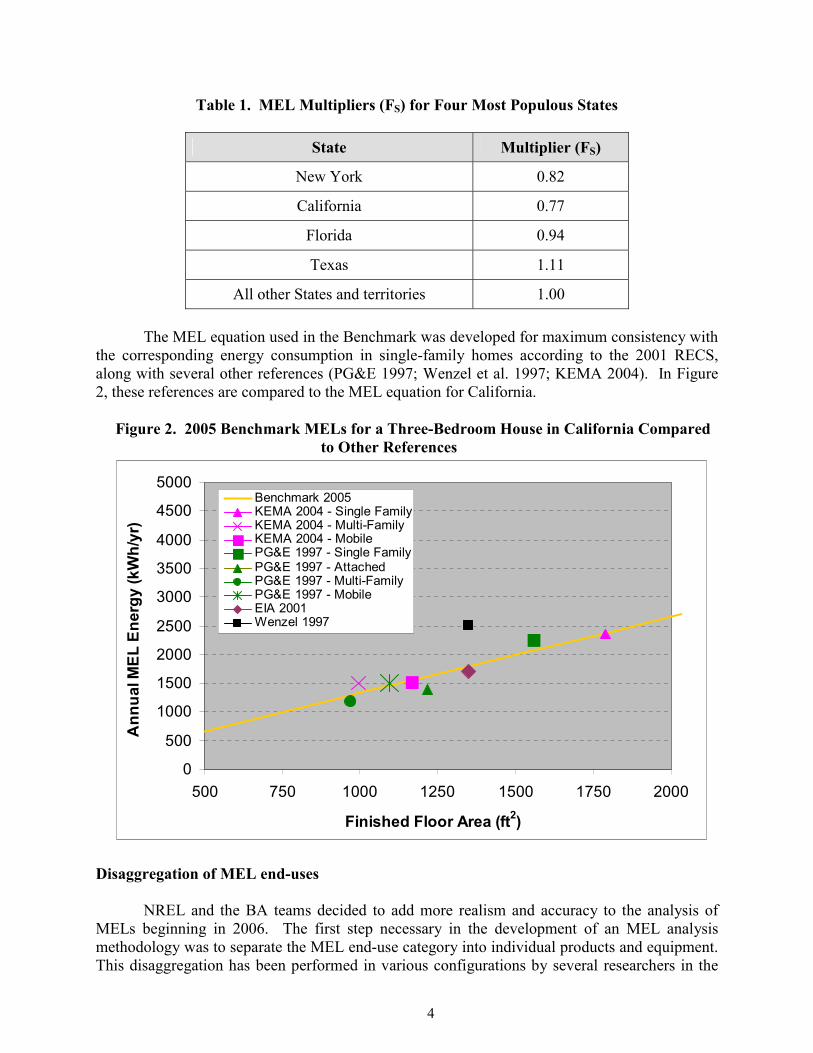
Table 1. MEL Multipliers (FS) for Four Most Populous States
State Multiplier (FS)
New York 0.82
California 0.77
Florida 0.94
Texas 1.11
All other States and territories 1.00
The MEL equation used in the Benchmark was developed for maximum consistency with the corresponding energy consumption in single-family homes according to the 2001 RECS, along with several other references (PG&E 1997; Wenzel et al. 1997; KEMA 2004). In Figure 2, these references are compared to the MEL equation for California.
Figure 2. 2005 Benchmark MELs for a Three-Bedroom House in California Compared
to Other References
0
500
1000
1500
2000
2500
3000
3500
4000
4500
5000
500 750 1000 1250 1500 1750 2000
Finished Floor Area (ft2)
Ann
ual M
EL E
nerg
y (k
Wh/
yr)
Benchmark 2005KEMA 2004 - Single FamilyKEMA 2004 - Multi-FamilyKEMA 2004 - MobilePG&E 1997 - Single FamilyPG&E 1997 - AttachedPG&E 1997 - Multi-FamilyPG&E 1997 - MobileEIA 2001Wenzel 1997
Disaggregation of MEL end-uses NREL and the BA teams decided to add more realism and accuracy to the analysis of MELs beginning in 2006. The first step necessary in the development of an MEL analysis methodology was to separate the MEL end-use category into individual products and equipment. This disaggregation has been performed in various configurations by several researchers in the
4
past (EIA 1993; Krigger & Dorsi 1994; EIA 1999; PG&E 1997; Sanchez & Meier 1997; Wenzel et al. 1997; Thorne & Suozzo 1998; Rosen & Meier 1999a; Rosen & Meier 1999b; CREEDAC 2001; EIA 2001; Pinckard et al. 2003; KEMA 2004; Nordman 2004). NREL decided to take maximum advantage of these previous studies in the development of an MEL breakdown for use with the Benchmark. The study by Wenzel was the primary reference for values of Unit Energy Consumption (UEC), and the RECS studies from 2001, 1997, and 1993 (EIA 2001, 1999, 1993) were the principal sources of data on market penetration. Other studies were used to fill in the gaps, and more recent data took precedence over older and possibly out-dated information. Finally, an “Other” category was added to force the total built-up MEL energy use to match the current 2005 Benchmark MEL energy use for an average size 1920-ft2, three-bedroom house. The “Other” MEL category only constitutes 9.5 kWh/yr, or less that half of one percent of the total MEL end-use, which is a good indication that our disaggregated MELs are fairly comprehensive and realistic. The resulting breakdown of 119 individual MELs is summarized in Table 2 for a typical 1920-ft2, three-bedroom house. The categorization of loads is largely based on the taxonomoy developed by LBNL (Nordman and McWhinney 2006), with a few minor adaptations to meet the needs of BA. For programs like BA that focus on new residential construction, the highest priority items in the MEL category are likely to be those where the builder has some degree of control, such as hard-wired loads (certain standby losses, garbage disposals, doorbells, ceiling fans) and certain large appliances that could potentially be provided with a new house (freezers, second refrigerators, microwaves). An effort was made to capture the collection of MELs that were most common in the late 1990s time frame for consistency with the theoretical vintage of the Benchmark. The mix of MELs and associated energy consumption will evolve over time as new products enter the market and old ones become obsolete. Standby Versus Active Power Electricity use for most MELs can occur at several different power levels. The three most common power levels are “active”, “ready”, and “standby”. Active mode occurs while the product is being used for its primary purpose. Ready status occurs while a product is turned on, but is not in use. Standby is defined as the lowest energy state of a product while remaining connected to a power supply (IEC 2005). For the sake of simplicity, we grouped “standby” and “ready” together as “low-power modes”. An MEL may also have other intermediate states (such as “idle” or “sleep”) that we have also included in the “low-power” category. If the lowest power level is the same as the active state for a certain product (a freezer, for example), then we don’t view the product as having any low-power modes. A number of previous studies were of great value as we tried to quantify typical power consumption rates for each MEL in each mode of operation (Huber 1997; Thorne & Suozzo 1998; Zogg & Alberino 1998; Rosen & Meier 1999a; Rosen & Meier 1999b; CREEDAC 2001; Roberson et al. 2002; Nordman 2004; Rainer et al. 2004). A few gaps were filled in by back-calculating the power levels necessary to produce the known average UEC (from Table 2) based on an estimated number of operating hours in each mode. Figure 3 shows the average household energy use for a few of the high-impact MELs in the Benchmark, along with the fractions attributable to low-power vs. active mode. It is noteworthy that many MELs are dominated by energy in low-power mode, and many consume electricity only in active mode. Our estimate of the overall fraction of MEL energy associated with low-power modes is approximately 24% for the Benchmark.
5
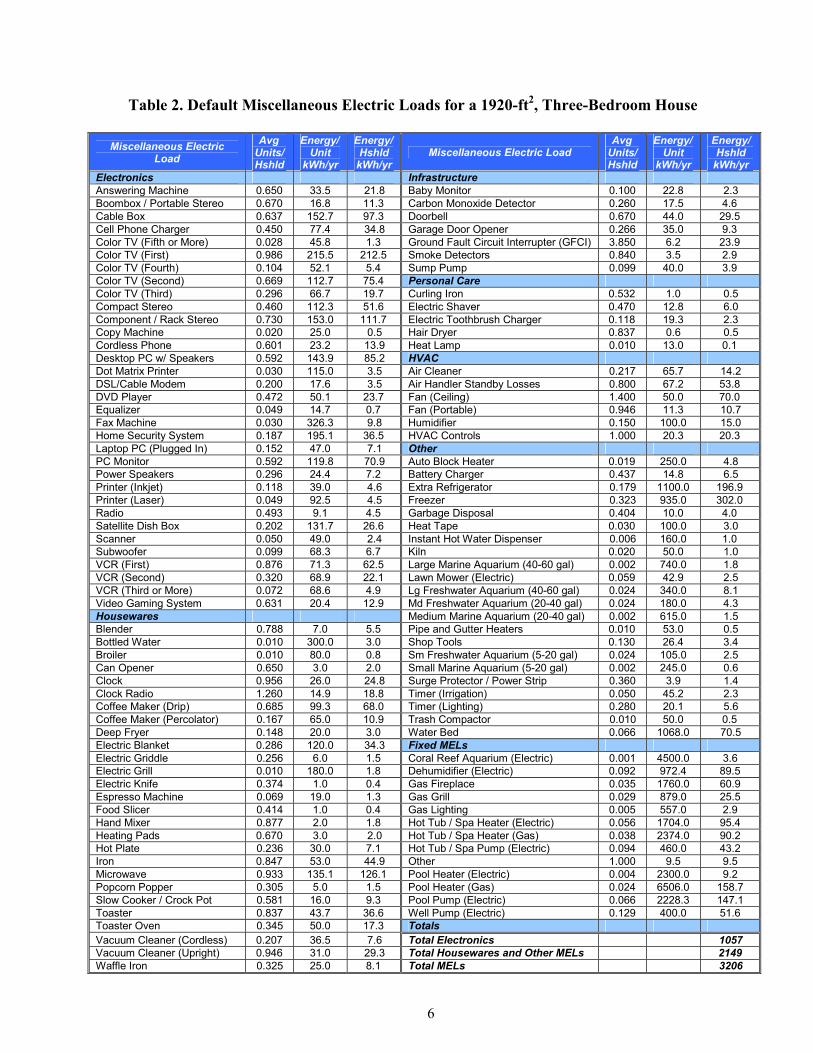
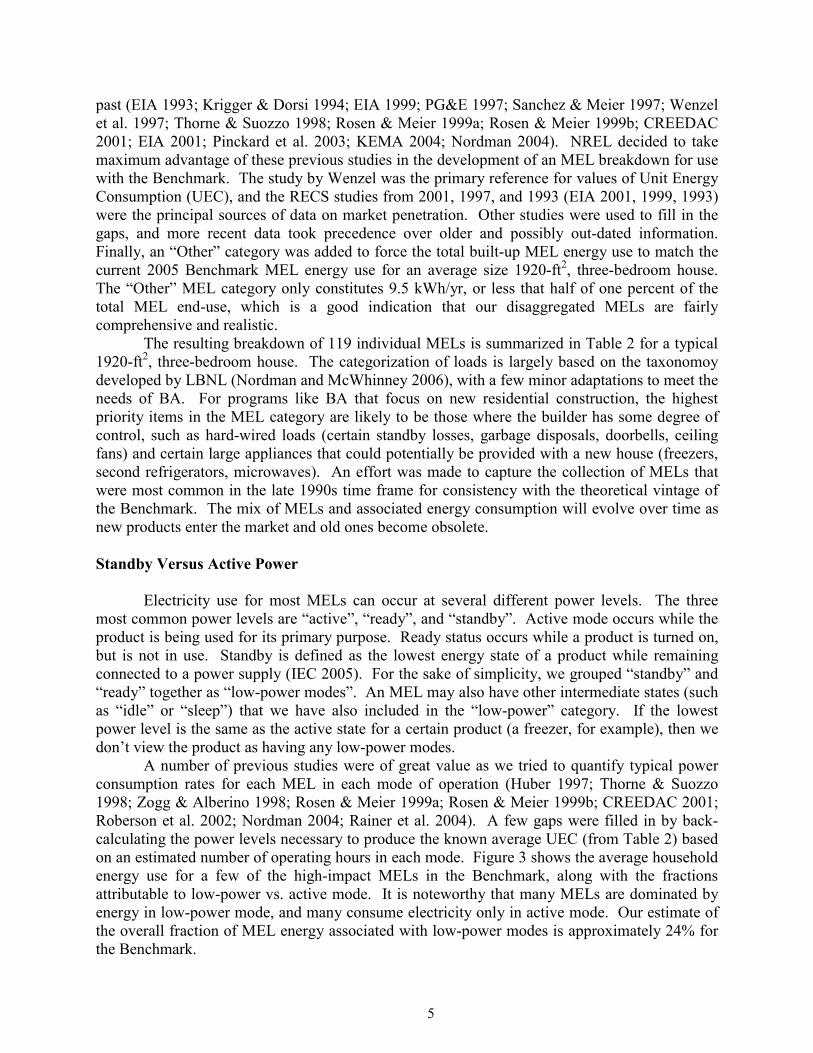
Table 2. Default Miscellaneous Electric Loads for a 1920-ft2, Three-Bedroom House
Miscellaneous Electric Load
Avg Units/ Hshld
Energy/ Unit
kWh/yr
Energy/ Hshld
kWh/yr Miscellaneous Electric Load
Avg Units/ Hshld
Energy/ Unit
kWh/yr
Energy/ Hshld
kWh/yr Electronics Infrastructure Answering Machine 0.650 33.5 21.8 Baby Monitor 0.100 22.8 2.3 Boombox / Portable Stereo 0.670 16.8 11.3 Carbon Monoxide Detector 0.260 17.5 4.6 Cable Box 0.637 152.7 97.3 Doorbell 0.670 44.0 29.5 Cell Phone Charger 0.450 77.4 34.8 Garage Door Opener 0.266 35.0 9.3 Color TV (Fifth or More) 0.028 45.8 1.3 Ground Fault Circuit Interrupter (GFCI) 3.850 6.2 23.9 Color TV (First) 0.986 215.5 212.5 Smoke Detectors 0.840 3.5 2.9 Color TV (Fourth) 0.104 52.1 5.4 Sump Pump 0.099 40.0 3.9 Color TV (Second) 0.669 112.7 75.4 Personal Care Color TV (Third) 0.296 66.7 19.7 Curling Iron 0.532 1.0 0.5 Compact Stereo 0.460 112.3 51.6 Electric Shaver 0.470 12.8 6.0 Component / Rack Stereo 0.730 153.0 111.7 Electric Toothbrush Charger 0.118 19.3 2.3 Copy Machine 0.020 25.0 0.5 Hair Dryer 0.837 0.6 0.5 Cordless Phone 0.601 23.2 13.9 Heat Lamp 0.010 13.0 0.1 Desktop PC w/ Speakers 0.592 143.9 85.2 HVAC Dot Matrix Printer 0.030 115.0 3.5 Air Cleaner 0.217 65.7 14.2 DSL/Cable Modem 0.200 17.6 3.5 Air Handler Standby Losses 0.800 67.2 53.8 DVD Player 0.472 50.1 23.7 Fan (Ceiling) 1.400 50.0 70.0 Equalizer 0.049 14.7 0.7 Fan (Portable) 0.946 11.3 10.7 Fax Machine 0.030 326.3 9.8 Humidifier 0.150 100.0 15.0 Home Security System 0.187 195.1 36.5 HVAC Controls 1.000 20.3 20.3 Laptop PC (Plugged In) 0.152 47.0 7.1 Other PC Monitor 0.592 119.8 70.9 Auto Block Heater 0.019 250.0 4.8 Power Speakers 0.296 24.4 7.2 Battery Charger 0.437 14.8 6.5 Printer (Inkjet) 0.118 39.0 4.6 Extra Refrigerator 0.179 1100.0 196.9 Printer (Laser) 0.049 92.5 4.5 Freezer 0.323 935.0 302.0 Radio 0.493 9.1 4.5 Garbage Disposal 0.404 10.0 4.0 Satellite Dish Box 0.202 131.7 26.6 Heat Tape 0.030 100.0 3.0 Scanner 0.050 49.0 2.4 Instant Hot Water Dispenser 0.006 160.0 1.0 Subwoofer 0.099 68.3 6.7 Kiln 0.020 50.0 1.0 VCR (First) 0.876 71.3 62.5 Large Marine Aquarium (40-60 gal) 0.002 740.0 1.8 VCR (Second) 0.320 68.9 22.1 Lawn Mower (Electric) 0.059 42.9 2.5 VCR (Third or More) 0.072 68.6 4.9 Lg Freshwater Aquarium (40-60 gal) 0.024 340.0 8.1 Video Gaming System 0.631 20.4 12.9 Md Freshwater Aquarium (20-40 gal) 0.024 180.0 4.3 Housewares Medium Marine Aquarium (20-40 gal) 0.002 615.0 1.5 Blender 0.788 7.0 5.5 Pipe and Gutter Heaters 0.010 53.0 0.5 Bottled Water 0.010 300.0 3.0 Shop Tools 0.130 26.4 3.4 Broiler 0.010 80.0 0.8 Sm Freshwater Aquarium (5-20 gal) 0.024 105.0 2.5 Can Opener 0.650 3.0 2.0 Small Marine Aquarium (5-20 gal) 0.002 245.0 0.6 Clock 0.956 26.0 24.8 Surge Protector / Power Strip 0.360 3.9 1.4 Clock Radio 1.260 14.9 18.8 Timer (Irrigation) 0.050 45.2 2.3 Coffee Maker (Drip) 0.685 99.3 68.0 Timer (Lighting) 0.280 20.1 5.6 Coffee Maker (Percolator) 0.167 65.0 10.9 Trash Compactor 0.010 50.0 0.5 Deep Fryer 0.148 20.0 3.0 Water Bed 0.066 1068.0 70.5 Electric Blanket 0.286 120.0 34.3 Fixed MELs Electric Griddle 0.256 6.0 1.5 Coral Reef Aquarium (Electric) 0.001 4500.0 3.6 Electric Grill 0.010 180.0 1.8 Dehumidifier (Electric) 0.092 972.4 89.5 Electric Knife 0.374 1.0 0.4 Gas Fireplace 0.035 1760.0 60.9 Espresso Machine 0.069 19.0 1.3 Gas Grill 0.029 879.0 25.5 Food Slicer 0.414 1.0 0.4 Gas Lighting 0.005 557.0 2.9 Hand Mixer 0.877 2.0 1.8 Hot Tub / Spa Heater (Electric) 0.056 1704.0 95.4 Heating Pads 0.670 3.0 2.0 Hot Tub / Spa Heater (Gas) 0.038 2374.0 90.2 Hot Plate 0.236 30.0 7.1 Hot Tub / Spa Pump (Electric) 0.094 460.0 43.2 Iron 0.847 53.0 44.9 Other 1.000 9.5 9.5 Microwave 0.933 135.1 126.1 Pool Heater (Electric) 0.004 2300.0 9.2 Popcorn Popper 0.305 5.0 1.5 Pool Heater (Gas) 0.024 6506.0 158.7 Slow Cooker / Crock Pot 0.581 16.0 9.3 Pool Pump (Electric) 0.066 2228.3 147.1 Toaster 0.837 43.7 36.6 Well Pump (Electric) 0.129 400.0 51.6 Toaster Oven 0.345 50.0 17.3 Totals Vacuum Cleaner (Cordless) 0.207 36.5 7.6 Total Electronics 1057 Vacuum Cleaner (Upright) 0.946 31.0 29.3 Total Housewares and Other MELs 2149 Waffle Iron 0.325 25.0 8.1 Total MELs 3206
6
Figure 3. Low-Power and Active Energy per Household for the 20 Most Important MELs
0 50 100 150 200 250 300 350
Air Handler Standby Losses
Gas Fireplace
First VCR
Coffee Maker (Drip)
Fan (Ceiling)
Water Bed
PC Monitor
Second Color TV
Desktop PC w/ Speakers
Dehumidifier (Electric)
Hot Tub / Spa Heater (Gas)
Hot Tub / Spa Heater (Electric)
Cable Box, DVR, or TIVO
Component / Rack Stereo
Microwave
Pool Pump (Electric)
Pool Heater (Gas)
Extra Fridge
First Color TV
Freezer
kWh/yr
Low-Power ModeActive Mode
Hours Per Day in Each Operating Mode Daily operating hours for each MEL, including average hours per day where the MEL is disconnected from any power supply, were estimated using most of the same references that were used to determine typical power levels in each mode of operation. However, much less information was available on this topic. Ultimately, about two-thirds of the values for hours per day in each mode were either derived based on known values of annual energy use and power consumption, or estimated based on the personal experience of the authors. The MEL Analysis Spreadsheet does not allow the analyst to modify the hours of operation in each mode. To keep the spreadsheet manageable in the near-term, it was assumed that most MEL improvements would involve reductions to the power levels in each mode, not a change to the length of time the MEL spent in each mode. But there are certainly important exceptions, such as control systems that switch electronics into a “hard” off mode instead of
7
standby mode, or “sleep” features that switch computers from active to low-power mode. The spreadsheet may also be used for existing homes where the actual operating hours for a given MEL may be quite different from the typical values. For these situations, the analyst must calculate “effective” power levels that account for the shift in the number of hours spent in each operating mode. The authors intend to allow operating hours to be changed in the next iteration of the spreadsheet. Correlation with Floor Area and Number of Bedrooms The energy used by most MELs tends to be a function of both the size of the house and the number of occupants. For BA analysis, the number of bedrooms is used as a surrogate for number of occupants, which cannot be predicted with much accuracy for a new house. We expect that some MELs are primarily driven by house size, such as vacuum cleaners, smoke detectors, and ground-fault circuit interrupters (GFCIs). Others are driven mainly by the number of occupants, such as microwave ovens, coffee makers, and irons. There are also a few MELs that typically use about the same amount of energy in every home regardless of size and occupancy, such as carbon-monoxide detectors, doorbells, and irrigation timers. These relationships were assumed to take the form shown in Equation 2 and were developed for the Benchmark based on engineering judgment supplemented by RECS data whenever there were explicit drivers of MEL energy documented in the regression results. The resulting relationship between total Benchmark MEL energy, house size, number of bedrooms, and geographic location is described by Equation 3. The characteristics of the house tend to be significant, but not particularly strong, drivers of MEL energy use. This trend is fairly consistent with the results of recent RECS studies (EIA 1999; EIA 2001).
EMEL = C1 + C2 x FFA + C3 x Nbr (2)
where EMEL = site electricity for an individual MEL in the Benchmark (kWh/yr) FFA = finished floor area in the Prototype, including finished basement (ft2) Nbr = number of bedrooms in the Prototype C1 = constant base load associated with the MEL C2 = multiplier for floor area C3 = multiplier for number of bedrooms. EMEL, total = (1625 + 0.418 x FFA + 259 x Nbr) x FS (3)
where EMEL, total = total site electricity for all MELs in the Benchmark (kWh/yr) FS = state multiplier from Table 1.
Sensible and Latent Loads
The internal load contributions from MELs are very important from a whole-house
perspective because of their influence on space-conditioning energy use. Because these internal heat gains have not been studied extensively, NREL used engineering judgment to estimate the fraction of energy used by each MEL that is converted to either a sensible or latent internal load. A few end-uses are nearly always located outdoors and do not affect the internal loads, such as garage door openers, shop tools, and pool heaters. But most MELs deposit nearly all of their
8
energy use as a sensible load on the house. Certain MELs can contribute to the latent load as well, including aquaria, cooking devices, gas appliances, and heaters used for interior spas and hot tubs. Internal loads associated with cooking are particularly difficult to quantify because much of the energy deposited in the food is ingested by the occupants and is already accounted for as part of the occupant sensible and latent heat gains (Hendron 2004). Overall, we estimate that 66% of MEL energy is converted to sensible heat gain, and 2% is converted to latent heat gain.
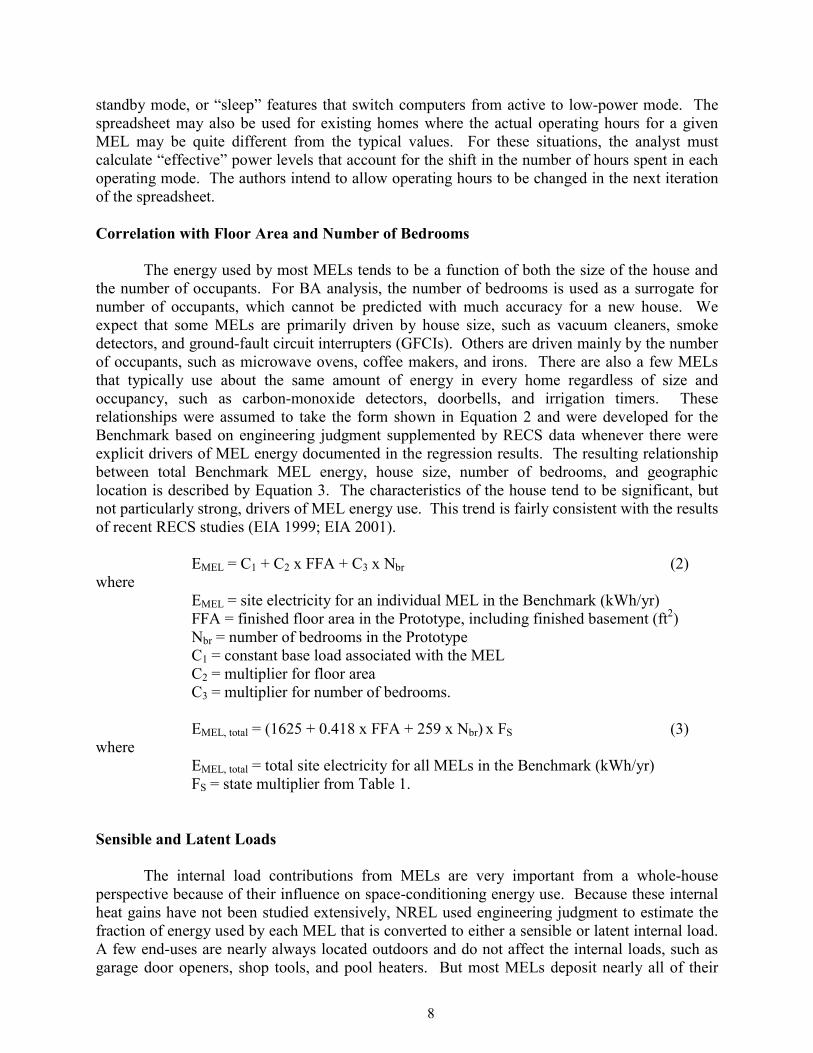
State Multipliers
Multipliers for the four most populous states were estimated based on the final electric
end-use regression equations developed for the 2001 RECS (EIA 2001). These multipliers are applied to the total MEL end-use consumption for both the prototype and Benchmark. Approximately 50 variables were found by EIA to be statistically significant for predicting MELs, but only 11 were deemed by the authors as appropriate adjustments to the MEL energy in the Benchmark. These variables represent external factors that are most likely associated with climatic differences, tax and code policies, and other variables that would tend to affect the same occupants in the same house differently in different states. The excluded variables represent either physical attributes of a prototype house that are known (such as year of construction and floor area) or physical or financial attributes of the occupants (such as age of homeowner or household income) that cannot be predicted for an individual house based on statewide averages. The final state multipliers were calculated by substituting national average values for the excluded variables, while using state averages for those variables that remained. The contributions from each of the remaining 11 variables toward the state-to-state differences in Benchmark MEL energy use are shown in Figure 4.
Figure 4. Contributors to Geographic Variations in Benchmark MELs
28.1%
23.6%
14.5%
11.5%
7.5%
3.1%
2.5%
2.2%
1.3%
0.7%
0.5%
0% 5% 10% 15% 20% 25% 30%
Freezer Presence andType (+)
Electricity Price (+)
West South Central (+)
California (-)
Extra Refrigerator Presence and Type (+)
Aquarium (+)
# Color TVs (+)
Use Frequency of Coffee Maker (+)
Northw est (+)
East South Central (+)
Dehumidif ier (+)
% o
f Sta
te to
Sta
te V
aria
tion
Expl
aine
d
RECS Regression Variable
(+) Positive correlation w ith MEL energy(-) Negative correlation w ith MEL energy
9
Calculating MEL Savings for a Prototype When calculating energy savings for a particular package of MELs in a prototype house, the Benchmark must include the same individual MELs that exist in the prototype, with the remainder of the MEL budget lumped into a fixed "Unspecified MEL" category based on national average units per household for both the prototype and Benchmark. For example, if the prototype has four ceiling fans and a home-security system, the Benchmark would have the same number, not 1.4 ceiling fans and 19% of a home-security system. This approach ensures that energy savings is based on the efficiency of MELs, not their presence or absence in a particular house. The MEL Analysis Spreadsheet developed by the authors automates this process. Conclusions and Next Steps
This paper summarized the development of a consistent methodology for calculating the
energy savings associated with efficiency improvements in the Miscellaneous Electric Loads end-use category for residential buildings. The most relevant existing studies by other research organizations were used to the greatest extent possible to ensure accuracy and completeness. Details of the methodology are more thoroughly documented in an analysis spreadsheet posted on the BA website (www.eere.energy.gov/buildings/building_america/pa_resources.html). Although this analysis approach was developed with the needs of BA in mind, it may serve as a useful technique for other energy efficiency programs that target MELs in residential buildings.
The accuracy and realism of the MEL methodology described in this paper may be significantly enhanced by NREL in future years. Research activities will be dictated by BA program requirements and may include the following:
• Treat hours of operation as a variable in the MEL Analysis Spreadsheet • Fully define the remaining large end-uses in the Benchmark that are currently in
the “Fixed MELs” category, such as pool heaters and pumps, hot tubs, well pumps, and gas fireplaces
• Separate dehumidification from the MEL category and treat it as part of space conditioning, if needed to maintain comfortable indoor humidity levels
• Identify the detailed energy drivers for MELs, such as TV screen size, computer monitor type (LCD vs. CRT), and freezer capacity
• Eliminate the state multipliers and develop a more sophisticated approach to the treatment of geographic location and climate
• Quantify the seasonal variation of operating hours for certain MELs, such as ceiling fans, coffee makers, and electric blankets
• Develop hourly profiles for individual MELs.
Acknowledgments The authors thank the analysts representing the seven Building America teams for their ideas and recommendations during the course of developing this methodology. In addition, we thank Ren Anderson, Craig Christensen, Paul Torcellini, Nancy Wells, and others in the NREL Buildings Group for their peer reviews of this work throughout the process. We also express our appreciation to Ed Pollock and George James of the U.S. Department of Energy for providing the necessary leadership and financial support for this research activity through the Building America program.
10
References Arthur D. Little. 1999. Opportunities for Energy Savings in the Residential and Commercial
Sectors with High-Efficiency Electric Motors. Cambridge, Mass.: Arthur D. Little. CREEDAC. 2001. Standby Power Consumption in the Canadian Residential Sector.
CREEDAC-2001-03-01. Halifax, NS, Canada: CREEDAC. EIA (Energy Information Administration). 2001. 2001 Residential Energy Consumption Survey:
Final Regression Results. Washington, D.C.: U.S. Department of Energy. EIA (Energy Information Administration). 1993. 1993 Residential Energy Consumption Survey.
Washington, D.C.: U.S. Department of Energy. EIA (Energy Information Administration). 1999. A Look at Residential Energy Consumption in
1997. DOE-EIA 0632. Washington, D.C.: U.S. Department of Energy. Hendron, Robert. 2005. Building America Research Benchmark Definition, Updated December
29, 2004. NREL Report No. 37529. Golden, Colo.: National Renewable Energy Laboratory. Hendron, Robert, Ren Anderson, Ron Judkoff, Craig Christensen, Mark Eastment, Paul Norton,
Paul Reeves, and Ed Hancock. 2004. Building America Performance Analysis Procedures, Rev. 1. NREL/TP-550-35567. Golden, Colo.: National Renewable Energy Laboratory.
Huber, Wolfgang. 1997. Standby Power Consumption in U.S. Residences. LBNL-41107.
Berkeley, Calif.: Lawrence Berkeley National Laboratory. International Electrotechnical Commission (IEC). 2005. Household Electrical Appliances –
Measurement of standby power. IEC 62301:2005. Geneva, Switzerland. KEMA Xenergy. 2004. California Statewide Residential Appliance Saturation Study. Prepared
for the California Energy Commission. Arnhem, Netherlands: KEMA Xenergy. Krigger, John, and Chris Dorsi. 1994. Residential Energy: Cost Savings and Comfort for
Existing Buildings. Helena, Mont.: Saturn Resource Management. Meier, Alan. 2002. Research Recommendations to Achieve Energy Savings for Electronic
Equipment Operating in Low Power Modes. LBNL-51546. Berkeley, Calif.: Lawrence Berkeley National Laboratory.
Nordman, Bruce. 2004. Developing and Testing Low Power Mode Measurement Methods.
California Energy Commission Report P500-04-057-A1. Berkeley, Calif.: Lawrence Berkeley National Laboratory.
Nordman, Bruce, and Marla McWhinney. 2006. Electronics Come of Age: A Taxonomy for
Miscellaneous and Low Power Products. ACEEE Summer Study on Energy Efficiency in Buildings. Washington, D.C.: ACEEE.
11
PG&E. 1997. Residential Energy Survey Report. San Francisco, Calif.: Pacific Gas & Electric Company.
Pinckard, Margaret, Richard Brown, James Lutz, Evan Mills, Mithra Moezzi, and Celina
Atkinson. 2003. Documentation of Calculation Methodology and Input Data for the Home Energy Saver Web Site. Berkeley, Calif.: Lawrence Berkeley National Laboratory.
Rainer, Leo, Jennifer Thorne Amann, Craig Hershberg, Alan Meier, and Bruce Nordman. 2004.
What's on the TV: Trends in U.S. Set-Top Box Energy Use, Design, and Regulation. IEA Paper. Paris, France: International Energy Agency.
Roberson, Judy, Gregory Homan, Akshay Mahajan, Burce Nordman, Carrie Webber, Richard
Brown, Marla McWhinney, and Jonathan Koomey. 2002. Energy Use and Power Levels in New Monitors and Personal Computers. LBNL-48581. Berkeley, Calif.: Lawrence Berkeley National Laboratory.
Rosen, Karen, and Alan Meier. 1999a. Energy Use of Home Audio Products in the U.S. LBNL-
43468. Berkeley, Calif.: Lawrence Berkeley National Laboratory. Rosen, Karen, and Alan Meier. 1999b. Energy Use of Televisions and Videocassette Recorders
in the U.S. LBNL-42393. Berkeley, Calif.: Lawrence Berkeley National Laboratory. Ross, J. P. and Alan Meier. 2000. “Whole-House Measurements of Standby Power
Consumption.” In Proceedings of the Second International Conference on Energy Efficiency in Household Appliances. Naples, Italy: Association of Italian Energy Economics (Rome). Also published as Lawrence Berkeley National Laboratory Report LBNL-45967.
Sanchez, Marla, and Alan Meier. 1997. “The Rage for Aquaria.” In Home Energy Magazine,
Sep/Oct 1997. Berkeley, Calif: Home Energy Magazine. Thorne, Jennifer, and Margaret Suozzo. 1998. Leaking Electricity: Standby and Off-Mode Power
Consumption in Consumer Electronics and Household Appliances, Washington, D.C.: American Council for an Energy-Efficient Economy.
Wenzel, Tim, Jonathan Koomey, Gregory Rosenquist, Marla Sanchez, and James Hanford. 1997.
Energy Data Sourcebook for the U.S. Residential Sector. Berkeley, Calif.: Lawrence Berkeley National Laboratory.
Zogg, Robert, and Deborah Alberino. 1998. Electricity Consumption by Small End Uses in
Residential Buildings. Cambridge, Mass.: Arthur D. Little, Inc.
12
REPORT DOCUMENTATION PAGE Form Approved OMB No. 0704-0188
The public reporting burden for this collection of information is estimated to average 1 hour per response, including the time for reviewing instructions, searching existing data sources, gathering and maintaining the data needed, and completing and reviewing the collection of information. Send comments regarding this burden estimate or any other aspect of this collection of information, including suggestions for reducing the burden, to Department of Defense, Executive Services and Communications Directorate (0704-0188). Respondents should be aware that notwithstanding any other provision of law, no person shall be subject to any penalty for failing to comply with a collection of information if it does not display a currently valid OMB control number. PLEASE DO NOT RETURN YOUR FORM TO THE ABOVE ORGANIZATION. 1. REPORT DATE (DD-MM-YYYY)
August 2006 2. REPORT TYPE
Conference paper 3. DATES COVERED (From - To)
5a. CONTRACT NUMBER
DE-AC36-99-GO10337
5b. GRANT NUMBER
4. TITLE AND SUBTITLE Development of an Energy-Savings Calculation Methodology for Residential Miscellaneous Electric Loads: Preprint
5c. PROGRAM ELEMENT NUMBER
5d. PROJECT NUMBER NREL/CP-550-39551
5e. TASK NUMBER BET6.8004
6. AUTHOR(S) R. Hendron and M. Eastment
5f. WORK UNIT NUMBER
7. PERFORMING ORGANIZATION NAME(S) AND ADDRESS(ES) National Renewable Energy Laboratory 1617 Cole Blvd. Golden, CO 80401-3393
8. PERFORMING ORGANIZATION REPORT NUMBER NREL/CP-550-39551
10. SPONSOR/MONITOR'S ACRONYM(S) NREL
9. SPONSORING/MONITORING AGENCY NAME(S) AND ADDRESS(ES)
11. SPONSORING/MONITORING AGENCY REPORT NUMBER
12. DISTRIBUTION AVAILABILITY STATEMENT National Technical Information Service U.S. Department of Commerce 5285 Port Royal Road Springfield, VA 22161
13. SUPPLEMENTARY NOTES
14. ABSTRACT (Maximum 200 Words) In order to meet whole-house energy savings targets beyond 50% in residential buildings, it will be essential that new technologies and systems approaches be developed to address miscellaneous electric loads (MELs). These MELs are comprised of the small and diverse collection of energy-consuming devices found in homes, including what are commonly known as plug loads (televisions, stereos, microwaves), along with all hard-wired loads that do not fit into other major end-use categories (doorbells, security systems, garage door openers). MELs present special challenges because their purchase and operation are largely under the control of the occupants. If no steps are taken to address MELs, they can constitute 40-50% of the remaining source energy use in homes that achieve 60-70% whole-house energy savings, and this percentage is likely to increase in the future as home electronics become even more sophisticated and their use becomes more widespread. Building America (BA), a U.S. Department of Energy research program that targets 50% energy savings by 2015 and 90% savings by 2025, has begun to identify and develop advanced solutions that can reduce MELs.
15. SUBJECT TERMS Building America; U.S. Department of Energy; whole-house energy savings; residential buildings; miscellaneous electric loads; MEL; energy-consuming appliances; end-use category
16. SECURITY CLASSIFICATION OF: 19a. NAME OF RESPONSIBLE PERSON a. REPORT
Unclassified b. ABSTRACT Unclassified
c. THIS PAGE Unclassified
17. LIMITATION OF ABSTRACT
UL
18. NUMBER OF PAGES
19b. TELEPONE NUMBER (Include area code)
Standard Form 298 (Rev. 8/98) Prescribed by ANSI Std. Z39.18