Embed Size (px)
Citation preview

3D SCANNING Photogrammetric survey of a gothic cloister – Oporto’s Cathedral
AFONSO GONÇALVES 1
1University of Lisbon– Faculdade de Arquitectura de Lisboa, Lisbon, Portugal
www.fa.utl.pt/~20130528, [email protected]
ABSTRACT: The work here presented was undertaken for the 3D Scanning course at the Faculty of Architecture of the University of Lisbon and aims at showcasing the experience acquired as well as serve as a comprehensive look at the possible uses and applications of photogrammetric survey methods in architecture. Taking a gothic cloister as the case study, the process covers all the steps required for producing useful data that may be used in an architectural context, starting with the photographical survey and acquisition of in-situ data, then approaching the point cloud generation and manipulation and finalizing with the necessary transformations required for properly scaling and orientating the point cloud. The final product is a collection of information that can be used to extract useful data such as ortho-images, architectural drawings or textured 3D models. Keywords: 3D digitization, photogrammetric survey,
INTRODUCTION For this end-of-term final exercise the main objective was to combine all previously acquired knowledge and skills of photogrammetric survey and use that information to produce something that might be useful to the architectural profession such as ortho images, technical drawings or 3D models. For this end we were asked to choose a medium/large scale object (a building or a block of buildings, part of a monument, a house, etc.), and produce a dense 3D point cloud that could be used for any desired purpose. For this project I decided to conduct a study of the cloister in Porto’s cathedral. It’s a relatively small cloister; built with granite stonework which that gives it a good rough texture that I knew would work well with the type or survey I was to conduct. The cloister also has several interesting details such as the decoration with tiles, the central Calvary and the combination of ogival ribbed vaults and arches in the inner galleries. In fact, there is a sense of rhythmic beauty and simplicity which
I found very compelling in this case study and since the gothic style has been one which I’ve always been interested in for a long time I thought this was a good opportunity to combine both my personal interests with the objective of the exercise. ARCHITECTURAL AND HISTORICAL CONTEXT The Porto Cathedral dates its construction back to the 12th century and it a clear example of Romanesque religious architecture of that period. The floor plan shows the traditional cross shape of two intersecting, relatively narrow, naves, flanked by two square towers at the entrance. The cathedral underwent several alterations and additions throughout the gothic and baroque eras and what we see nowadays is a blend of different architectural styles. The loggia, on the northern façade, is clearly baroque, designed by the prolific Italian architect Nicolau Nasoni. The main cloister, built between the 14th and 15th century and the funerary chapel of João Gordo is elegantly gothic.

2
Much like other monuments on the northern regions of Portugal, the main construction material is granite stone, very abundant in these parts of the country.
The cloister is square shaped and has two levels. The first level is formed by four galleries with five spans each and crowned with ribbed ogival vaults. Between spans there is a succession of arcs resting on small embedded columns in the outer walls of the galleries and on the columns of the inner arcade. This arcade is composed by three arches on each span, supported by a pair of coupled columns and topped by an oculus (fig. 1). On the outer walls we find several openings that connect the cloister to the rest of the cathedral and surrounding chapels, each of them framed by architectural compositions with two granite pilasters flanking each niche with a round arch. The central courtyard is accessed through the north and south wings of the galleries. This central space goes down one small step and converges on a central octagonal plinth on top of which stands a Calvary, featuring a figure of the Virgin Mary and Jesus on the cross. Along the outer arcades we also find the buttresses that support the inner ribbed vaults.
Figure 1 | General overview of the cloister
The upper level of the cloister, accessed through the southern gallery, offers a good view of the central courtyard from above. Around the inner edge there is a
simple iron railing, occasionally interrupted by oblong plinths on the same alignment as the bottom buttresses.
As said before, the cloister is entirely built resorting to granite stonework, including all the details and reliefs. The only difference in materials lies in the beautifully tin-glazed blue and white ceramic tiles that can be found decorating all the perimeter walls of the galleries and the southern and western wall of the level above. METHODOLOGY USED The process used in this survey can essentially be divided in four main stages. The process starts with the acquisition of all the data necessary to conduct the project. This includes both photographical data and additional measurements taken on site or from other sources (such as cartography). The objective with taking these measurements is to build a target reference frame from which we will calculate the necessary transformations (rotation, scaling and translation) for correctly orientating and scaling the point cloud model. With this acquired information we then create the point cloud and a simple diagram with the measurements collected on site. From these measurements, and using a CAD program like AutoCAD we can obtain a set of point coordinates that will work as our control points. Knowing these coordinates in the REAL object and the homologous coordinates in the MODEL object will provide us the necessary data to properly scale and orientated the MODEL object. The coordinates from the REAL object will therefore act as the TARGET and the coordinates from the MODEL as the SOURCE. The next step is to make use of the TARGET and the SOURCE files to obtain the necessary values to calculate the final transformation matrix. These include the translation parameters – Tx, Ty, Tz, the scaling parameters – Mx, My, Mz, and the rotation parameters – Rx, Ry, Rz. By multiplying the scaling, translation, rotation matrixes we obtain the final transformation matrix.
T = �
1 0 0 Tx0 1 0 Ty0 0 1 Tz0 0 0 1
� ; S = �
Sx 0 0 00 Sy 0 00 0 Sz 00 0 0 1
� ; R = �
r11 r12 r13 0r21 r22 r23 0r31 r32 r33 00 0 0 1
�
M = (T×S×R )= �
Sx.r11 Sx.r12 Sx.r13 TxSy.r21 Sy.r22 Sy.r23 TySz.r31 Sz.r32 Sz.r33 Tz
0 0 0 1
�
3
The final step is to take the calculated values and place them in the MODEL’s identity matrix. By doing this will apply the necessary transformations to the model, consequently scaling, moving and orientating it to match the REAL object. The process will now be explained in greater detail. PROCESS DESCRIPTION Stage 1 – Data Collection (Photographic survey and measurements) On the first exercise we covered the process of surveying a small object using the SFM (structure-from-motion) approach, i.e, walking around the object and progressively taking photos of it from different angles, making sure to guarantee some overlap between them. In this case the same approach needs to be used only this time, because we’re working on a larger scale, the survey needs to be carefully planned out beforehand to make sure the methods used are appropriate. This obviously depends largely on the nature of the object we are surveying.
After the first visit to the site I drafted out a simple diagram of the cloister so that I could plan out the process with which I would tackle the survey beforehand. I decided to conduct the photographic survey in several different series, some covering exclusively the facades and others being more general in nature and capturing the overall space. My plan was to use the façade photos to generate the actual point cloud and then, if it turned out to have too many gaps, use the more generic photos to fill in the areas with missing information.
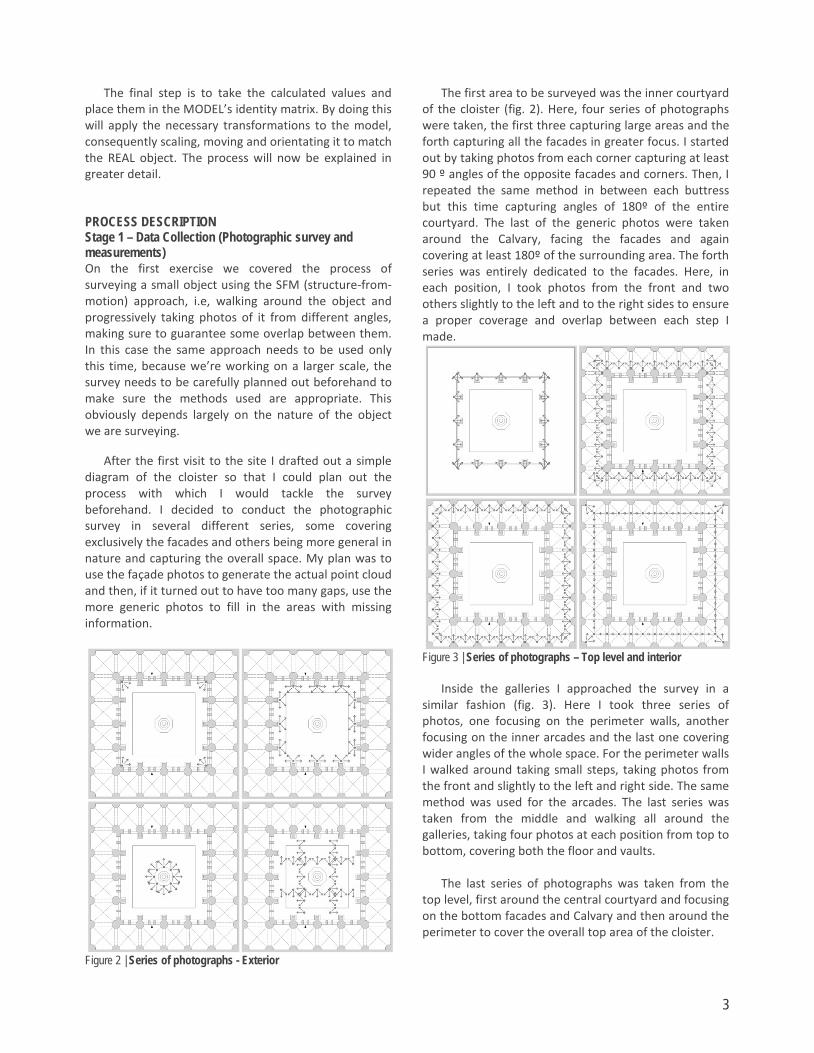
Figure 2 | Series of photographs - Exterior
The first area to be surveyed was the inner courtyard of the cloister (fig. 2). Here, four series of photographs were taken, the first three capturing large areas and the forth capturing all the facades in greater focus. I started out by taking photos from each corner capturing at least 90 º angles of the opposite facades and corners. Then, I repeated the same method in between each buttress but this time capturing angles of 180º of the entire courtyard. The last of the generic photos were taken around the Calvary, facing the facades and again covering at least 180º of the surrounding area. The forth series was entirely dedicated to the facades. Here, in each position, I took photos from the front and two others slightly to the left and to the right sides to ensure a proper coverage and overlap between each step I made.
Figure 3 | Series of photographs – Top level and interior
Inside the galleries I approached the survey in a
similar fashion (fig. 3). Here I took three series of photos, one focusing on the perimeter walls, another focusing on the inner arcades and the last one covering wider angles of the whole space. For the perimeter walls I walked around taking small steps, taking photos from the front and slightly to the left and right side. The same method was used for the arcades. The last series was taken from the middle and walking all around the galleries, taking four photos at each position from top to bottom, covering both the floor and vaults. The last series of photographs was taken from the top level, first around the central courtyard and focusing on the bottom facades and Calvary and then around the perimeter to cover the overall top area of the cloister.

4
The data collected with this photographic survey will be used to generate the dense point cloud in the following stage. Moreover, as explained in previous exercises, the point cloud won’t be properly scaled or orientated. To accomplish this it is also necessary that measurements be taken on site so that it is possible to create a reference frame for those transformations. Stage 2 – Point cloud generation and editing The process of generating the dense point cloud is similar to the one used before in the first exercise and so won’t be described in great detail here. Please refer to the report of the first exercise for a more extensive overview of the point cloud generation process. Briefly explained, the photos were all uploaded to VisualSFM, the matching was done and the dense point cloud was generated and saved. In this case, due to how the images we processed, several point clouds were created. After creating the point clouds they were opened in MeshLab for further editing. The first step was the cleanup process where all spurious information was deleted from the point cloud. It was a laborious, slow and long process, involving turning each point cloud off and on to see where errors had occurred and getting rid of them. Some point clouds even had to be completely discarded since they contained too many errors. After the clean up, all point clouds were merged together to form a single mesh. The second step is to orientate it vertically, since the vertical axis came associated with the Y-axis and not the Z-axis as it is normal. To do this we need to rotate the point cloud along the X-axis by 90º (fig. 4).The rotation needs to be along the X-axis with an angle of -90º. Checking “Freeze Matrix” in the dialogue box will make sure the transformation is applied to the point cloud directly and not simply stored it in a matrix, leaving the original point cloud untouched.
Figure 4 | Rotation transformation of the point cloud
Afterwards we save the mesh, giving it a name that differentiates it from the original point cloud. Stage 3 – Creating the TARGET file Using a simple measuring tape and, for greater distances, measuring in steps, several measurements were taken of the cloister. The idea is to use these measurements to build a reference frame, formed by points with known coordinates, and then match the generated point cloud - the SOURCE file, with that reference frame - the TARGET file. The simplest way is to collect measurements in orthogonal directions and then resorting to a CAD program such as AutoCAD we can easily calculate the coordinates in each vertex (fig. 5). The Z-coordinates can be discarded or set to 0 since we are working in a 2D plane. These coordinates can be stored in a .txt file and given the name “Target.txt”.
Figure 5 | Measurements diagram with marked points Stage 4 – Creating the SOURCE file After creating the TARGET file, we need to obtain the coordinates of the homologous points in order to create the SOURCE file. To do this we first start by dragging the point cloud into CloudCompare. Selecting the point cloud in the “Db Tree” panel we choose the option

5
“Point List Picking”. The idea now is to roughly pick the same points of the TARGET file. Afterwards, and still in the point list picking panel, we choose the option “Local index x, y, z” and save the file, naming it an identifiable name such as “Source.txt”.
Figure 6 | Point list picking in CloudCompare
By now, both the TARGET file and the SOURCE file have been created. Before moving on to the next step we first need to make sure the information in both files is in the same format, i.e., corresponding points must have the same ID, the coordinates need to have a dot as the decimal marker and no character separating each coordinate.
Stage 5 – Calculating the 2D Transformation Once we have the SOURCE and TARGET files the next step will be to open them both in JAG3D. When we open JAG3D we start by choosing “Coordinate Transformation” and then opening both the SOURCE and TARGET files. We need to be mindful that, if previously we discarded the Z-coordinates, then we have to choose “2D-Transformation” as the dimension of the transformation; otherwise we should leave it on “3D-Transformation”. Clicking “Transform” will calculate the coordinate transformation between both files and a report will be generated, which can be saved. This report contains several data regarding the transformation, among which are the transformation values for the rotation, translation and scaling. All we need to do now is take those values and calculate the final transformation matrix:
T = �
1.000000 0.000000 0.000000 12.5596878370.000000 1.000000 0.000000 2.4103151210.000000 0.000000 1.000000 0.0000000.000000 0.000000 0.000000 1.000000
�
S = �
2.646717672 0.000000 0.000000 0.0000000.000000 2.646717672 0.000000 0.0000000.000000 0.000000 2.646717672 0.0000000.000000 0.000000 0.000000 1.000000
�
R = �
0.94209844 -0.33533644 0.000000 0.0000000.33533644 0.94209844 0.000000 0.000000
0.000000 0.000000 1.000000 0.0000000.000000 0.000000 0.000000 1.000000
�
M = �
2.493469 -0.887541 0.000000 12.5596880.887541 2.493469 0.000000 2.4103150.000000 0.000000 0.820901 0.0000000.000000 0.000000 0.000000 1.000000
�
Stage 6 – Applying the transformation To apply the 2D, or 3D transformation whichever the case, to our point cloud we must first save it in MeshLab as an Align Project (*.aln) file. By doing so an identity matrix is assigned to our point cloud. We then open the file in a text editor and replace that identity matrix with the one we calculated.
If we reopen the project file after replacing the identity matrix we will notice a small matrix in the bottom right corner (fig. 7). This matrix should show the same values we calculated before. This means the transformation hasn’t yet been permanently applied to the point cloud. To do that we must “Freeze Current Matrix” in the layers panel and export the mesh.
Figure 7 | Saving the transformation matrix FURTHER WORK With our point cloud now scaled and orientated we can choose what use we will give to it. From it we can extract information that might be useful in an architectural context such as ortho images, CAD drawings or 3D models. For this project I decided to use
6
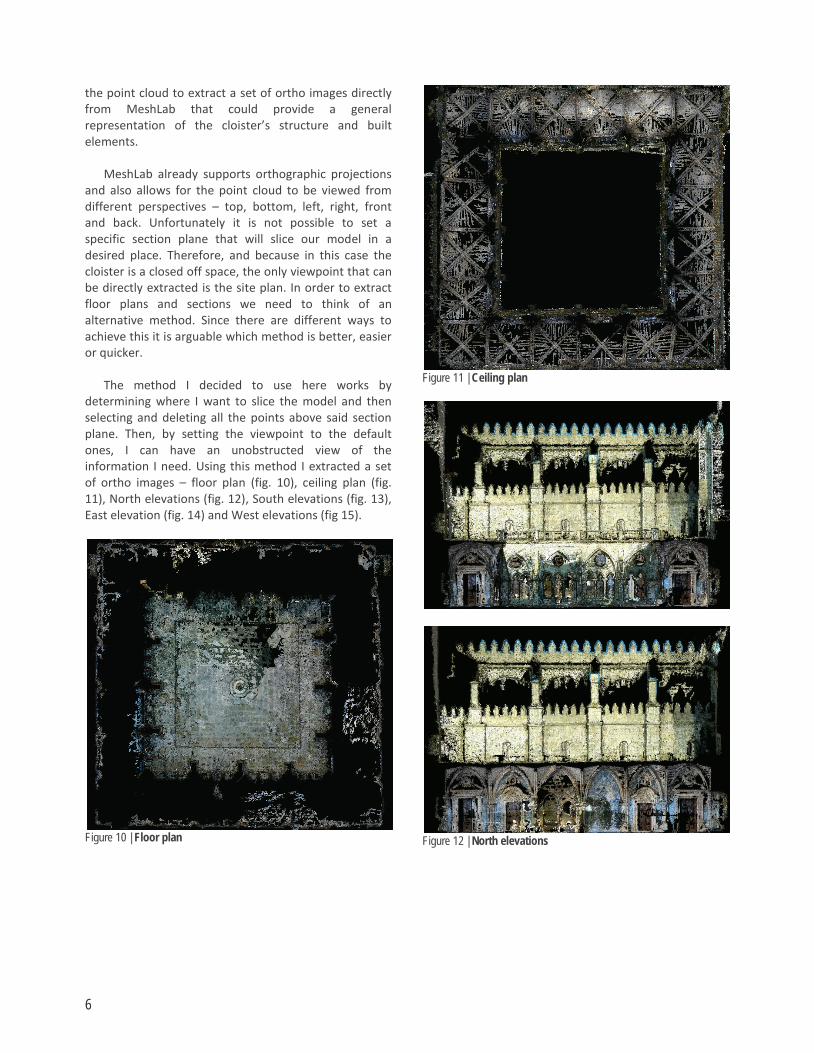
the point cloud to extract a set of ortho images directly from MeshLab that could provide a general representation of the cloister’s structure and built elements. MeshLab already supports orthographic projections and also allows for the point cloud to be viewed from different perspectives – top, bottom, left, right, front and back. Unfortunately it is not possible to set a specific section plane that will slice our model in a desired place. Therefore, and because in this case the cloister is a closed off space, the only viewpoint that can be directly extracted is the site plan. In order to extract floor plans and sections we need to think of an alternative method. Since there are different ways to achieve this it is arguable which method is better, easier or quicker.
The method I decided to use here works by determining where I want to slice the model and then selecting and deleting all the points above said section plane. Then, by setting the viewpoint to the default ones, I can have an unobstructed view of the information I need. Using this method I extracted a set of ortho images – floor plan (fig. 10), ceiling plan (fig. 11), North elevations (fig. 12), South elevations (fig. 13), East elevation (fig. 14) and West elevations (fig 15).
Figure 10 | Floor plan
Figure 11 | Ceiling plan
Figure 12 | North elevations

7
Figure 13 | South elevations
Figure 14 | East elevations
Figure 15 | West elevations CONCLUSION The methods here discussed provide an overview of potential that this type of technology has in the field of architecture. Depending on the object we are studying a slightly different approach may be necessary but the overall methods remain the same. The process starts with acquisition of photographic data that will then be processed and coupled with other collected information to produce a final result which can be used for many different proposes. It’s worth recognising that the end results here presented still require some work. Collecting more data on site will eventually result in a more refined and accurate model. It is very perceptive the lack of information in some areas of the cloister that would have to be filled in by collecting more or better quality photos. ACKNOWLEDGMENTS The author would like to thank both Luis Mateus and Victor Ferreira, professors at the University of Lisbon – Faculdade de Arquitectura de Lisboa and members at the Research Centre for Architecture, Urban Planning and Design (CIAUD), for all the help and guidance provided throughout the making of this project.


![20130528決算説明会 補足資料 20130528(V03) ppt [ …...Title 20130528決算説明会_補足資料_20130528(V03)_ppt [互換モード] Created Date 20130603092307Z](https://img.pdfslide.net/doc/110x75/5f45632b8ce30553281f0082/20130528ce-eoeee-20130528v03-ppt-title-20130528ceeoeee20130528v03ppt.jpg)