Embed Size (px)
Citation preview

1
3G+ Wireless QoS Performance 3G+ Wireless QoS Performance SimulatorSimulator
(Modeling and Case studies)(Modeling and Case studies)
FebruaryFebruary 2626, 200, 20044
김김재재현현
Wireless Internet Wireless Internet && Network Engineering Research Lab Network Engineering Research Lab ((WIWINNNERNER’’ss Lab)Lab)
전자공학부전자공학부, , 아주대학교아주대학교[email protected]@ajou.ac.kr
031031--219219--24772477
KJH 2
AgendaAgenda
Introduction3G+ Wireless QoS Performance Simulator
Simulation ModelReference Architecture Protocol StacksService Traffic Model Network Element Model Cross Layer Modeling
Case Studies Performance : End-to-End PerformanceNetwork Architecture : 3G+ Wireless Technology EvolutionOptimization & Algorithm: System Parameters and Algorithm
ConclusionResearch Issues Reference
2
KJH 3
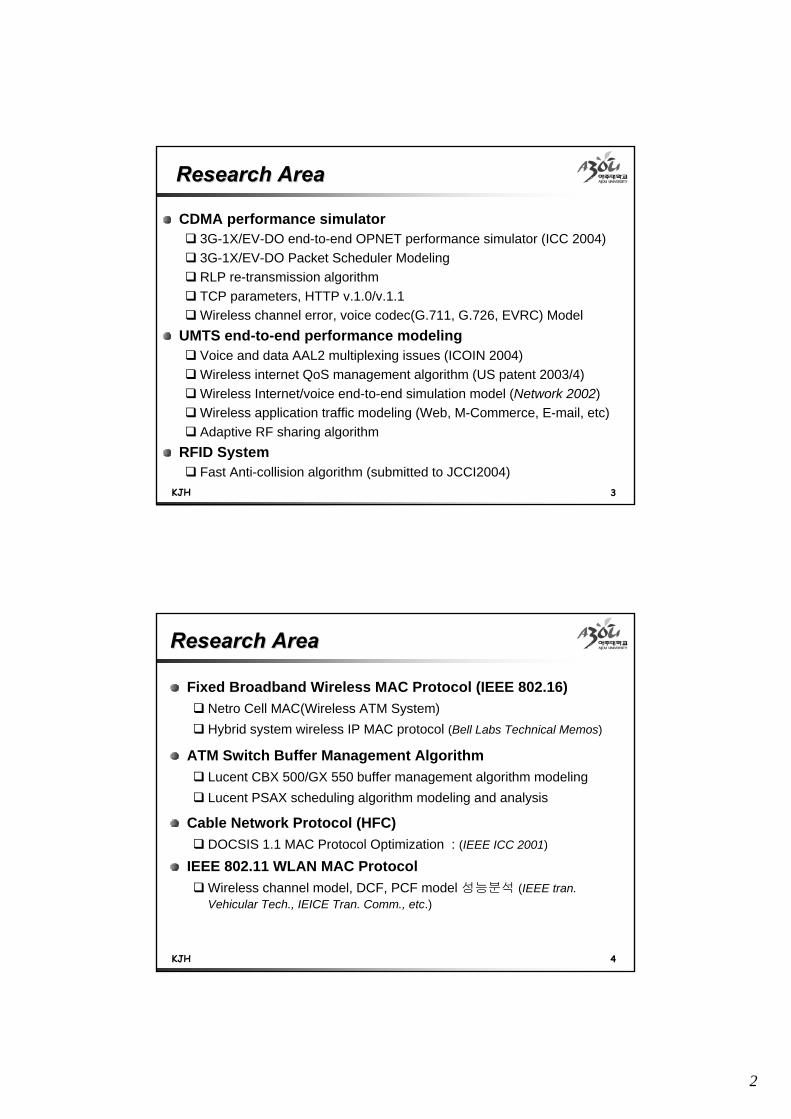
Research Area Research Area
CDMA performance simulator 3G-1X/EV-DO end-to-end OPNET performance simulator (ICC 2004)3G-1X/EV-DO Packet Scheduler ModelingRLP re-transmission algorithm TCP parameters, HTTP v.1.0/v.1.1 Wireless channel error, voice codec(G.711, G.726, EVRC) Model
UMTS end-to-end performance modeling Voice and data AAL2 multiplexing issues (ICOIN 2004)Wireless internet QoS management algorithm (US patent 2003/4)Wireless Internet/voice end-to-end simulation model (Network 2002)Wireless application traffic modeling (Web, M-Commerce, E-mail, etc)Adaptive RF sharing algorithm
RFID System Fast Anti-collision algorithm (submitted to JCCI2004)
KJH 4
Research AreaResearch Area
Fixed Broadband Wireless MAC Protocol (IEEE 802.16)Netro Cell MAC(Wireless ATM System) Hybrid system wireless IP MAC protocol (Bell Labs Technical Memos)
ATM Switch Buffer Management Algorithm Lucent CBX 500/GX 550 buffer management algorithm modelingLucent PSAX scheduling algorithm modeling and analysis
Cable Network Protocol (HFC)DOCSIS 1.1 MAC Protocol Optimization : (IEEE ICC 2001)
IEEE 802.11 WLAN MAC ProtocolWireless channel model, DCF, PCF model 성능분석 (IEEE tran. Vehicular Tech., IEICE Tran. Comm., etc.)

3
KJH 5
33GG++ WirelessWireless QoSQoS Performance SimulatorPerformance Simulator
Objectives of Simulator Integrate with network design processnetwork design process to validate performance Obtain performance results based on given application characteristics and network configuration parameters
Application layer performanceApplication layer performance parametersPage and object response time, packet delay, jitter, throughput,etc
Select optimal system configuration parametersoptimal system configuration parameters or algorithmalgorithm based on QoS requirements
Validate and optimize tunable parameters and algorithmsScheduler, Inactivity Timeout, AAL2 MUX, RLP PU_size, etc.
Evaluate tradeoff between application performance and network utilization
Identify system performance bottleneckbottleneck and seek improvementimprovement
KJH 6
Simulation ModelSimulation Model
Reference Architecture CDMA 2000 UMTS
Protocol StacksCDMA 2000UMTS
Service Traffic Model Foreground /BackgroundQueuing Impact Model
Network Element Model Cross Layer Modeling
CDMA 2000 3G 1X-RTT/ EV

4
KJH 7Can model reference connections including applications and data center
Reference Architecture Reference Architecture : CDMA 2000: CDMA 2000
KJH 8
Data Center
Reference Architecture Reference Architecture : : UMTS Rel99UMTS Rel99

5
KJH 9
Protocol Stack Protocol Stack :: 3G3G--1X Data (ATM) 1X Data (ATM)
AT 3G-1XCell
PC 3G-1X MSC Host
10 Base TRS-232
Cable
3com
3G3G--1x1xBTSBTS
Ethernet
MAC
IP
TCP/UDP
PPP
Ethernet
MAC
Airlink
MAC
RLP
Airlink
MAC
T1
ATM
PP/T1
ATM
T1
FR
IPRMI
ServersServers
IP - Internet Protocol TCP - Transmission Control Protocol RLP- Radio Link Protocol
UDP- User Datagram Protocol PPP - Point-to-Point Protocol FR – Frame Relay
3G3G--1x1xMSCMSC
PCF
PCFPCF
T1
FR
Phys
GRE
L2 L2
Phys
IP
TCP/UDP
PDSNPDSN
Air
AAL2
T1
FR
T1
ATM/AAL5
OC3
Airlink
ATM
T1
ATM
ATM SwitchATM Switch
PSAX
AAL2
T1
RLP
Application Application
Phys
L2 L2
Phys
IP
GREPPP
IP
KJH 10
Protocol Stack Protocol Stack :: 3G EVDO (HDLC)3G EVDO (HDLC)
AT 1xEV-DOCell
PC RAN Router 1xEV-DO FMS Host
10 Base T
Cable Backhaul
R-P (A10/A11) IP NetworkRouter
PCF PDSN
PDSNPDSN1xEV1xEV--DODO
BTSBTSRouterRouter
Ethernet
MAC
IP
TCP/UDP
PPP
Ethernet
MAC
Airlink
MAC
RLP
Airlink
MAC
T1/E1
HDLC
IP
TCP/ UDP
RMI
T1/E1
HDLC
Ethernet
MAC
IP
Ethernet
MAC
T1/E1
L2
IP
TCP/ UDP
IP
GRE
RMI
RLP
T1/E1
L2 L2
Phys
IP
GRE
PPP
IP
L2
Phys
IP
TCP/UDP
1xEV1xEV--DODOControllerController
PCFPCF
ServersServers
GRE - Generic Routing Encapsulation (protocol) RMI - Remote Method Invocation IP - Internet Protocol TCP - Transmission Control Protocol UDP- User Datagram Protocol PPP - Point-to-Point ProtocolHDLC – High Level Data Link Control
Application Application

6
KJH 11
PHY
Protocol Stack Protocol Stack : : UMTS PS service (Data)UMTS PS service (Data)
UE
Air
SGSNSGSNUMTSUMTSNodeNode--BB
PHY
TCP/UDP
ATM
AAL2
DchFP
Phys
IP
PDCP – Packet Data Convergence Protocol Iu-UP – Iu User Plane GTP – GPRS Tunneling ProtocolDch-FP - Dedicated Channel Framing Protocol PHY-UP- Physical Layer User Plane MAC_d – Media Access Control for DCH IP - Internet Protocol TCP - Transmission Control Protocol UDP- User Datagram Protocol
Application
PHY_UP
MAC_d
RLC
PDCP
IP
ATM
AAL2
DchFP
ATM
AAL2
DchFP
ATM
AAL2
DchFP
PHY_UP
MAC_d
RLC
PDCP
ATM
AAL5
UDP/IP
GTP_U
Iu-UP
ATM
AAL5
UDP/IP
GTP_U
Iu-UP
ATM
L2(AAL5)
UDP/IP
GTP_U
GGSNGGSN
ATM
L2(AAL5)
UDP/IP
GTP_U
External
ATM AAL2 ATM AAL2ATM AAL5
IubUu Iur Iu-ps Gn
UMTSUMTSCRNCCRNC
UMTSUMTSSRNCSRNC
ATM AAL5
KJH 12
PHY
Protocol Stack Protocol Stack :: UMTS CS Service (voice)UMTS CS Service (voice)
UE
Air
WAGWAGUMTSUMTSNodeNode--BB
PHY
ATM
AAL2
DchFP
Phys
PHY_UP
MAC_d
RLC
ATM
AAL2
DchFP
ATM
AAL2
DchFP
ATM
AAL2
DchFP
PHY_UP
MAC_d
RLC
ATM
AAL5
Iu-UP
ATM
AAL5
Iu-UP
Ethernet
UDP/IP
TAGTAG
Ethernet
ATM AAL2 ATM AAL2ATM PVC
IubUu Iur Iu-cs Gn
UMTSUMTSCRNCCRNC
UMTSUMTSSRNCSRNC
ATM AAL5
AMR
Application
PDCP – Packet Data Convergence Protocol Iu-UP – Iu User Plane Dch-FP - Dedicated Channel Framing ProtocolPHY-UP- Physical Layer User Plane MAC_d – Media Access Control for DCH IP - Internet Protocol TCP - Transmission Control Protocol UDP- User Datagram Protocol
AMR G.711
ATM
UDP/IPAAL1

7
KJH 13
Service Service Traffic ModelsTraffic Models
Foreground trafficApplication traffic modeled in detailEach application is generated at the UE and transmitted along a reference connectionEnd-to-end application performance can be measured
Background traffic (traffic load for each NE’s)Background traffic depicts characteristics of the actual application trafficVary network load and impact to the performance of the foreground trafficBackground traffic model may be defined consistently with product planning assumptions or to represent a specific customer network
Model background traffic with application characteristics and foreground traffic in detail.
KJH 14
Service Traffic Model Service Traffic Model ::Voice Call and Web Browsing Application ModelVoice Call and Web Browsing Application Model
Call-Level Generator
PacketsInterarrival
Duration
CallsDuration
Interarrival
Packet-Level Generator
DurationInterarrival
Sessions
PagesDuration
Interarrival
ObjectsInterarrival
Duration
Session-Level Generator
Packet-Level Generator
Application models include distribution information about call/session arrivals, packet arrivals within a call, and packet sizes.

8
KJH 15
Voice Traffic Model CDMA2000 : 13Kbps, 8 Kbps EVRC (Qualcomm Model)UMTS : 12.2 Kbps AMR Codec
Data Traffic Model (3GPP2-C50-EVAL-2001022)PPP/RLP/MAC Overhead, 4%/10% air interface error, RLP re-transmitWeb traffic : Avg. Page size = 43056 Bytes
Exponential Mean = 30 sec
Reading Time
Lognormal DistributionMean = 7758 B Std. Deviation = 126168 B
Object Size
Pareto DistributionMean 5.55 MAX 55
No. of Objects per Page
Lognormal DistributionMean = 17, Standard Deviation = 22
No. of Pages
Web BrowsingService
Service Traffic MService Traffic Model : odel : Voice Call and Web Browsing Application ModelVoice Call and Web Browsing Application Model
KJH 16
Service Traffic Model : Service Traffic Model : Background Traffic Load Queueing impactBackground Traffic Load Queueing impact
Lindley recursion equationSame impact for end-to-end packet delay with discrete event simulationMultiple priority traffic queueing model Reduce discrete event simulation processing time for queueingimpact
( )( )
( )
( )
( )
( ) packets )1( and between timearrival-inter :packet of timeservice :
packet theof time waiting:
packet )1( theof time waiting:
00
0
1
)()()(
)()()()()()()1(
ththn
thn
thnq
thnq
nnnq
nnnq
nnnqn
q
nnTnS
nW
nW
TSW
TSWTSWW
+−
−
−
+−
⎪⎩
⎪⎨⎧
≤−+
>−+−+=
+
+

9
KJH 17
Network Elements ModelsNetwork Elements Models: CDMA2000 MT: CDMA2000 MT
Mobile Terminal ModelInput parameters
Traffic and RLP parametersOutput Parameters
End–to-end Service statisticsCDMA transport statistics
FunctionsTraffic GenerationTCP/UDP and IP (for Data UE)RLP/MAC protocol stackPHY layer
Detailed simulation model for each network element
ModifiedOPNETModule
Built-inModule
KJH 18
Cross Layer Modeling:Cross Layer Modeling:3G3G--1X RTT,(L11X RTT,(L1-- L7)L7)
Model ArchitectureUser mobilityassumption
Physical Layer Spec
Power Requirement of each rateEc/Ior Curve
Link Level Simulation
Static System Level Simulation
C/I DistributionCurve
3G3G--1X Performance Simulator (OPNET)1X Performance Simulator (OPNET)- Dynamic Application Performance- Scheduling Algorithm - Sector throughput - Optimal system configurable parameters
Walsh Code
Backlogged Packet size
3G-1X RTT Scheduler model for Rel. 19 (OPNET)
Protocol Stacks :
TCP/IP, RLPTransmission :
Packet Pipe, Ethernet,
ATMNetwork Elements
Application Profile
Web, E-mail, FTP, etc.
From Physical Data
OPNET Model

10
KJH 19
Cross Layer Modeling: Cross Layer Modeling: 3G 1X EV3G 1X EV--DO model (Scheduler)DO model (Scheduler)
Model Approach
IS-856 (1xEV-DO Spec)
OPNET SystemSimulation
ChannelPrediction
System & ApplicationPerformance
C/I distribution
DRC Length
Scheduler
Channel Model
Traffic Model
KJH 20
Case StudyCase Study
Performance : End-to-End PerformanceTraffic Engineering Queueing Impact Performance improvement HTTP protocol
Network Architecture : 3G+ Wireless Technology EvolutionVoice performance Backhaul Network Evolution Backbone Network Evolution 3G-1X RTT vs. 3G-1X EV-DO
Optimization & Algorithm: System Parameters and AlgorithmAAL2 Multiplexing StudyRF Channel Sharing Algorithm Study Resource Sharing AlgorithmNetwork Bottleneck Point Study (Network Design)

11
KJH 21
EndEnd--toto--End Performance:End Performance:WWeb Browsingeb Browsing endend--toto--end performanceend performance
Page response time
(sec)
Object response time
(sec)
Traffic received (bits/sec)
KJH 22
Simulation Time (min)
Channel Throughput (bits/sec)
EndEnd--toto--End Performance:End Performance:Traffic Engineering (Traffic Engineering (Web Protocol OverheadWeb Protocol Overhead))
TCP/IP O.H Included
ATM Overhead Included
Received bytes in Client
Application Goodput

12
KJH 23
EndEnd--toto--End Performance: End Performance: Lindley Lindley QueueingQueueing Impact Impact Runtime ComparisonRuntime Comparison
Number of Foreground
Users
Number of background
Users
Download File size
Simulation Time (sec)
1 0 1 Mbytes 120 sec
2 0 1 Mbytes 237 sec
3 0 1 Mbytes 355 sec
4 0 1 Mbytes 478 sec
5 0 1 Mbytes 596 sec
1 1400 1 Mbytes 190 sec190 sec
1 1670 1 Mbytes 205 sec205 sec
• Run time approximately linear in number of foreground users. • Efficient in number of background users.
KJH 24
HTTP 1.1 supports persistent connection and pipelineHTTP 1.1 shows 12% and 16% mean delay performance improvement for 4% and 10% BLER respectively.
5.684.98
11.7
10.1
6.75.6
16.7
14.5
0
2
4
6
8
10
12
14
16
18
page
resp
onse
tim
e(se
c)
4% FER Mean 4% FER 95%delay
10% FERMean
10% FER 95%delay
HTTP 1.0 HTTP1.1
EndEnd--toto--End Performance: End Performance: Web Browsing protocol Web Browsing protocol HTTP 1.0 HTTP 1.0 vsvs HTTP1.1HTTP1.1

13
KJH 25
3G+ Wireless Technology Evolution3G+ Wireless Technology Evolution ::Reference Architecture for Voice TrafficReference Architecture for Voice Traffic
IP
64k PCM/32K ADPCM
PCM
BTS
ATMAAL2
ATM
Packet Pipes ATM
PCM/ Channelized T1
PSAXPSAXPSAX
MSCPSTN
Media Gateway
PSAXPSAXPSAX
MSC
BTS
ATMAAL2
ATM
Packet Pipes
PCM
Media Gateway
APX8000
Voice call Flow
64k PCM/32K ADPCM100BT
Ethernet
GX550 GX550
1
2 3
1
1 TDM
2
3
ATM :PCM 64 kbps
ATM :ADPCM 32 kbps
Tandem Tandem
4
4 IP :G.726 32 kbps
100BTEthernet
TMX880 TMX880
APX8000
RNCRNC5
5 IP :Vocoder bypass
2.5G2.5G
3G3G
3G+3G+
KJH 26
0
50
100
150
200
250
mse
c
TDM tandemG.711 (64kbps)
ATM BackboneG.711 (64kbps)
AAL1
ATM BackboneG.726 (32kbps)
AAL2
IP BackboneG.726 (32kbps)
IP backboneVocoder Bypass
Technologies
Uplink Avg. Delay BackBone Avg. Delay Downlink Avg. Delay
3G+ Wireless Technology Evolution3G+ Wireless Technology Evolution ::EndEnd--toto--end voice packet delayend voice packet delay
No significant difference between ATM and IP backbone Vocoder bypass : delay decrease and better voice quality due to no trans-vocoder
E2E One Way Delay (ms)
64 kbps (G.711)
32 kbps(G.726) 16kbps(G.728)
0 94 87 50 93 86 100 92 85 150 90 83 200 87 80 250 80 73 300 74 67 350 68 61 400 63 56 450 59 52
45 0
9 0 - 1 0 0 B e s t q u a li t y ; u s e rs v e r y s a t is f ie d
8 0 -9 0 H ig h q u a l it y ; u s e rs s a t is f ie d
7 0 -8 0 M e d iu m q u a l i t y ; s o m e u s e rs d is s a t is f ie d
6 0 -7 0 L o w q u a l i t y ; m a n y u s e rs d is s a t is f ie d
5 0 -6 0 P o o r q u a l i t y ; n e a r ly a ll u s e r s d is s a t is f ie d
L e s s th a n 5 0
U n a c c e p t a b le q u a l i t y
Source: IEEE Communications Magazine, July 1999
Voice Quality Scores (R value)
Uplink : MT – BTS – MSC/RNCBackbone : MG – Switch/Router – MGDownlink : MSC/RNC - BTS - MT

14
KJH 27
3G+ Wireless Technology Evolution3G+ Wireless Technology Evolution : : Voice : Background load vs. JitterVoice : Background load vs. Jitter
Scenarios IP backbone voice scenarioWeb browsing background traffic in links Web data rate fixed to uplink 64 Kbps and downlink 153 KbpsNo QoS mechanism implemented
QoS mechanism should be support in the backhaul and backbone(end-to-end).
1.99261.823340%
0.0043219.82190%
0.426222.722110%
1.51246.522930%
12.4425.930180%
6.4360.426670%
Avg. Jitter
(msec)
P( x < X) = 0.95Avg. pkt. delay(msec)
Avg. End-to-end packet delay (msec)
Back-groundTraffic Load
0
50
100
150
200
250
300
350
400
450
mse
c
0% 10% 30% 40% 70% 80%
Backgorund traffic
Avg. End-toend delay 95% delay Avg. Jitter
KJH 28
3G+ Wireless Technology Evolution3G+ Wireless Technology Evolution ::Backhaul Network Evolution (ATM,HDLC, Ethernet)Backhaul Network Evolution (ATM,HDLC, Ethernet)
Web page response time for the different backhaul (IP backbone)HDLC (15.6%), 100BT Ethernet (21.7 %) show web browsing delay performance improvement for 10% FERIP technology reduce packet overhead and provide higher transmission speed
9.2 9.18.3
14.7
12.411.5
0
2
4
6
8
10
12
14
16
18
Mea
n pa
ge re
spon
se ti
me
(mse
c)
4% 10%
FER
ATM (T1) HDLC (T1) Ethernet (100BT)

15
KJH 29
Web page response time for the different backboneIP backbone reduced little end-to-end delay due to lower header overhead and SAR delay compared to ATM backbone (5.2%, 7.7 %)Other Performance Issues : Mobile Terminal interface (serial port vs. PCMCIA), TCP Window sizes (UNIX vs. MS Server), HTTP version, etc.
9.69 9.1
8.3
0
2
4
6
8
10
12
mea
n pa
ge re
spon
se ti
me
(mse
c)
ATM IP
Backbone transport technologies
EVDO HDLC(T1) Ethernet (100BT)
3G+ Wireless Technology Evolution3G+ Wireless Technology Evolution ::Backbone Network Evolution (ATM vs. IP)Backbone Network Evolution (ATM vs. IP)
KJH 30
3G+ Wireless Technology Evolution3G+ Wireless Technology Evolution : : 3G3G--11XX, EVDO vs. EVDV, EVDO vs. EVDV
Web page response time for the technologies phaseDelay is reduced 46% from 3G-1X trial to EVDV technology in 10% BLERImprovement not proportional to difference in air interface speedsHigher speed air interface is expected to see higher BLER - improvement may not be good as 46%.
3.5 3.42.6 2.5
9.18.3
7
5
15.1
11.5
9.38.1
0
2
4
6
8
10
12
14
16
page
resp
onse
tim
e (s
ec)
No FER 4% FER 10% FER
FER
3G-1X RTT (F:153 Kbps, R:64 Kbps)3G-1X (F:153 Kbps, R:153 Kbps)EV-DO (F:2.4 Mbps, R:153Kbps)EV-DV (F:2.4 Mbps, R:2Mbps)

16
KJH 31
AssumptionsBased on 3GPP UMTS Release 99 standards Voice traffic
mobile-to-mobile modelsWeb browsing
client-server modelsThe Node-B to concentrator link: E1The concentrator to RNC link: STM-1
System Parameter & Algorithm :System Parameter & Algorithm :AAL2 Multiplexing StudyAAL2 Multiplexing Study
KJH 32
B(τ,n) is average user payload in a cell. depend of the remainder in a cellThe remainder in a cell has a Markovian property
given n packet arrivals, the probability of i talkspurt packets and j silence packets among nDefine
The packing density:
The bandwidth gain:
( , )(%) 100 ,(1 47)47
B n Bτψ = × ≤ ≤
[ ]1
,
1(1 ) ,
ij talk silence
i jN ntalk silence talk silence
p P N i N j
N nP P P P i j n
n i− −
= = =
−⎡ ⎤ ⎡ ⎤= − − + =⎢ ⎥ ⎢ ⎥⎣ ⎦ ⎣ ⎦
( , ) (0, )( , )(%) 100(0, ) 5
B n B nnB nτγ τ −
= ×+
(n-1)thpacket nth packet (n+1)th packetnth packet
(n-1)th cell nth cell
( ) ( ) ( )
( ) ( )
4 1 3 2 1 7 2
0 0 0 1 0 2 0 30 0 0 0
5
1 0 0 0 0 1 0 2 0 3 1 00
1 5 3 0 4 5
4 2 4 7 1
i i i ii i i i
ii
B p i p i p i p i
p i p p p p p
π π π π
π
= = = =
=
= + + + + + +
+ + + − − − − −
∑ ∑ ∑ ∑
∑
System Parameter & Algorithm :System Parameter & Algorithm :AAL2 Multiplexing (PD, BW Gain)AAL2 Multiplexing (PD, BW Gain)

17
KJH 33
1 10 20 30 40 50 60 70 80 90 100 120 140 1600
2
4
6
8
10
12
14
16
Number of concurrnt voice users
Ave
rage
ban
dwid
th g
ain(
%)
Timer CU= 0 ms (Analysis)Timer CU= 1 ms (Analysis)Timer CU= 2 ms (Analysis)Timer CU= 3 ms (Analysis)Timer CU= 4 ms (Analysis)Timer CU= 5 ms (Analysis)Timer CU= 6 ms (Analysis)Timer CU= 7 ms (Analysis)Timer CU= 0 ms (Simulation)Timer CU= 1 ms (Simulation)Timer CU= 2 ms (Simulation)Timer CU= 3 ms (Simulation)Timer CU= 4 ms (Simulation)Timer CU= 5 ms (Simulation)Timer CU= 6 ms (Simulation)Timer CU= 7 ms (Simulation)
Voice Traffic ScenariosPacking Density Bandwidth gain
The symbols present simulation results and the curves mean analytical results. The analytic results are very close to simulation ones. Maximum bandwidth gain with AAL2 is about 18% higher than the bandwidth gain without AAL2
1 10 20 30 40 50 60 70 80 90 100 120 140 160
84
86
88
90
92
94
96
98
100
Number of concurrent voice user
Pac
king
den
sity
in N
ode-
B(%
)
Timer CU=0 ms (Analysis)Timer CU=1 ms (Analysis)Timer CU=2 ms (Analysis)Timer CU=3 ms (Analysis)Timer CU=4 ms (Analysis)Timer CU=5 ms (Analysis)Timer CU=6 ms (Analysis)Timer CU=7 ms (Analysis)Timer CU=0 ms (Simulation)Timer CU=1 ms (Simulation)Timer CU=2 ms (Simulation)Timer CU=3 ms (Simulation)Timer CU=4 ms (Simulation)Timer CU=5 ms (Simulation)Timer CU=6 ms (Simulation)Timer CU=7 ms (Simulation)
System Parameter & Algorithm :System Parameter & Algorithm :AAL2 Multiplexing (PD, BW Gain)AAL2 Multiplexing (PD, BW Gain)
KJH 34
0.51
2
3
4
5
6
7
8
9
10
0 10 20 30 40 60 80 100 150 200 248
Tim
er C
U (m
s)
Number of concurrent voice users
maximum bandwidth gain*95%maximum bandwidth gain*90%maximum bandwidth gain*85%maximum bandwidth gain*80%
Timer_CU decreases rapidly when the number of concurrent user issmall It is closed to asymptotic value over 80 concurrent voice calls.This graph can be used to select the optimal Timer_CU.
System Parameter & Algorithm :System Parameter & Algorithm :AAL2 Multiplexing (PD, BW Gain)AAL2 Multiplexing (PD, BW Gain)
Timer_CU vs. Concurrent voice users (Node-B)
18
KJH 35
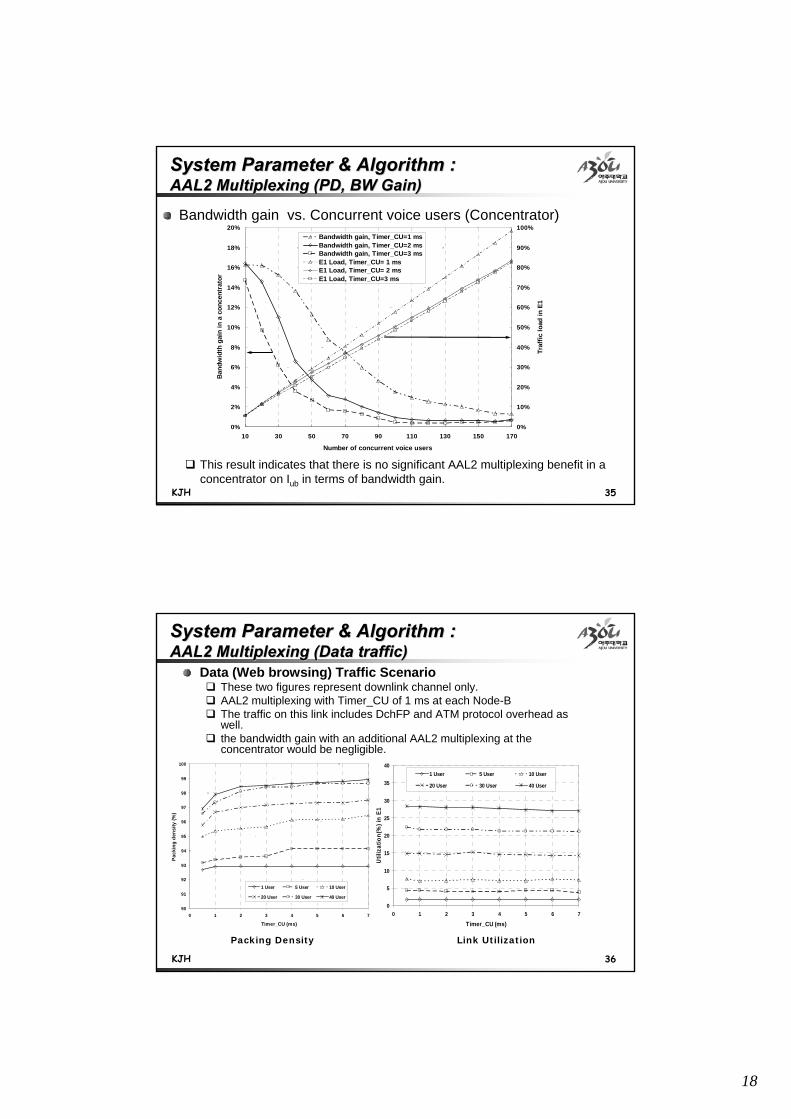
This result indicates that there is no significant AAL2 multiplexing benefit in a concentrator on Iub in terms of bandwidth gain.
0%
2%
4%
6%
8%
10%
12%
14%
16%
18%
20%
10 30 50 70 90 110 130 150 170
Number of concurrent voice users
Ban
dwid
th g
ain
in a
con
cent
rato
r
0%
10%
20%
30%
40%
50%
60%
70%
80%
90%
100%
Traf
fic lo
ad in
E1
Bandwidth gain, Timer_CU=1 msBandwidth gain, Timer_CU=2 msBandwidth gain, Timer_CU=3 msE1 Load, Timer_CU= 1 msE1 Load, Timer_CU= 2 msE1 Load, Timer_CU=3 ms
Bandwidth gain vs. Concurrent voice users (Concentrator)
System Parameter & Algorithm :System Parameter & Algorithm :AAL2 Multiplexing (PD, BW Gain)AAL2 Multiplexing (PD, BW Gain)
KJH 36
Data (Web browsing) Traffic Scenario These two figures represent downlink channel only. AAL2 multiplexing with Timer_CU of 1 ms at each Node-BThe traffic on this link includes DchFP and ATM protocol overhead as well.the bandwidth gain with an additional AAL2 multiplexing at the concentrator would be negligible.
90
91
92
93
94
95
96
97
98
99
100
0 1 2 3 4 5 6 7
Timer_CU (ms)
Pack
ing
dens
ity (%
)
1 User 5 User 10 User
20 User 30 User 40 User
0
5
10
15
20
25
30
35
40
0 1 2 3 4 5 6 7
Timer_CU (ms)
Util
izat
ion(
%) i
n E1
1 User 5 User 10 User
20 User 30 User 40 User
Packing Density Link Utilization
System Parameter & Algorithm :System Parameter & Algorithm :AAL2 Multiplexing (Data traffic)AAL2 Multiplexing (Data traffic)

19
KJH 37
Comparison Fixed and Adaptive algorithmFixed algorithm : inactivity timer 5 sec fixedProposed Adaptive algorithmProposed Adaptive algorithm : 100 msec and 40 msec interval
Use backlogged packet size and data rate (Lucent proprietary information)Number of DCH used/ Averaged Number of DCH
System Parameter & Algorithm :System Parameter & Algorithm :RF Channel Sharing Algorithm StudyRF Channel Sharing Algorithm Study
FIXED: 5 secFIXED: 5 sec
Proposed : 100 msecProposed : 100 msec
Proposed : 40 msecProposed : 40 msec
KJH 38
System Parameter & Algorithm :System Parameter & Algorithm :QoS based Processor Resource Management QoS based Processor Resource Management
Processor Resource Management in RNC/Node-B/…
Class1 Queue
Class2 Queue
Class3 Queue
Class4 Queue
processor resource
Give priority to Class 1 QueueIf accumulated service time >
T1, then no more new call allowed
Weighted round robin with Ti, i = 2,3, when Class 1 queue is empty
Best effort service when other queues are empty
New traffic for class 1 and 2 can preempt class 4 traffic

20
KJH 39
Network topologyPt.-Pt. Demands by serviceRoutingReference connection to be modeled
Background traffic - All network traffic that crosses referenceconnection mapped to appropriate network elements.
Translation of all network info into simulation format.
User plane Key Performance Indicators
Network Design
Simulator Preprocessor
Performance Simulator
Test additional reference connections?Modify network design?
Satisfied !!
Specific application to be modeled along reference connection
Network design process to include performance model
System Parameter & Algorithm :System Parameter & Algorithm :Network Bottleneck Point Study (Network Design)Network Bottleneck Point Study (Network Design)
KJH 40
OPNET View after importing the network topology
•120 Nodes
–15 Backbone Nodes (GX550)
–105 Access Nodes (ATM Clients)
•119 Links
System Parameter & Algorithm :System Parameter & Algorithm :Network Bottleneck Point Study (Network Design)Network Bottleneck Point Study (Network Design)

21
KJH 41
• No performance problems over large range of loads. • Ability to determine performance bottleneck.
Key network element causing
bottleneck
System Parameter & Algorithm :System Parameter & Algorithm :Network Bottleneck Point StudyNetwork Bottleneck Point Study
KJH 42
What you may get from this talk? What you may get from this talk? Wireless Network Performance Modeling
Wireless Service Traffic Model (Voice, Web, Calendaring, M-commerce, SMS, MMS, etc)Cross Layer Protocol Integration Model Network Element Model Reference Architecture and Connection Model
Wireless Application Perspective Performance QoS Mechanism should be provided for the end-to-end connectionsQoS Definition and end-to-end Mapping
3G+ Wireless QoS Performance End-to-end Network Architecture Issues (Backhaul and Backbone)System Parameters issues (TCP, RLP PU, MUX, TTI, Inactivity Timer, etc.) Wireless Protocols Issues (Flow control, Scheduling, Process Sharing)Technology Evolution ( 3G-1X, EVDO, EVDV, ALL IP, MIP)

22
KJH 43
Future Research IssuesFuture Research Issues
Wireless Terminal ResearchUser application/service traffic Modeling & Performance Performance improvement in UE
Wireless System Research 3G Wireless Algorithms : MAC, Scheduling, Process SharingProtocols issues : HTTP, TCP/IP, RLP,RLC, HARQ, HandoffOptimal configuration parameters
Network Research AlI IP scenarios QoS problemQoS IP routing protocols : MPLS, Diffserv, etc. 4G Mobile IP network (WLAN, WMAN, WPAN + 3G)End-to-end Network Solution Portfolio
KJH 44
ReferenceReference
J. H. Kim and C. W. Lee, "End-to-end User Perceived Application Performance in 3G+ Networks" to appear in Proc. IEEE ICC'04, Paris, France, June. 2004 H. J. Lee and J. H. Kim, "Decision Point of AAL2 Multiplexing for Voice and Data Services in 3G WCDMA Network" in Proc. ICOIN2004, Pusan, Korea, FEB. 2004D. Houck, B.H. Kim and J.H. Kim “End-to-end UMTS network Performance modeling” Networks 2002, Jun 23-27, Munich ,GermanyUS Patent: N. Khrais, C. Chou and J. H. Kim,, “A Method and System For Management of Traffic Processor Resource Supporting UMTS QoS Classes”Submitted on April 16 2003S. H. Cho, J. H. Kim, and S. H. Park, “Performance Evaluation of the DOCSIS 1.1 MAC Protocol according to the structure of a MAP Message,” IEEE ICC2001, vol.6, pp. 1786-1791, Helsinki, Finland. June 11-15, 2001.J. H. Kim and J. K. Lee, "Throughput and Packet Delay Analysis of IEEE 802.11 MAC Protocol for Wireless LAN's," Wireless Personal Communications vol. 11, pp.161-183, Nov. 1999.J. H. Kim and J. K. Lee, “Performance Analysis of CSMA/CA in multipath, shadowing and capture effect,” IEEE Tran. on Vehicular Technology, vol. 48. No.4, pp. 1277-1286, July 1999.

23
Thank you !!Thank you !!Question or Comments?Question or Comments?

![Operator QoS and QoE Aspects affecting OTT Applications ...7 [Add disclaimer text in slide master mode] East QoS TRENDS –3G Data Growth 2.7 x YoY (from 24TB to 65TB) Data Volume](https://img.pdfslide.net/doc/110x75/5e9e82c7884e626f064d5e63/operator-qos-and-qoe-aspects-affecting-ott-applications-7-add-disclaimer-text.jpg)