Embed Size (px)
Citation preview

To help people achieve a lifetime of financial security
The Hague, November 9, 2017
Financial Supplement 3Q 2017

Unaudited
1
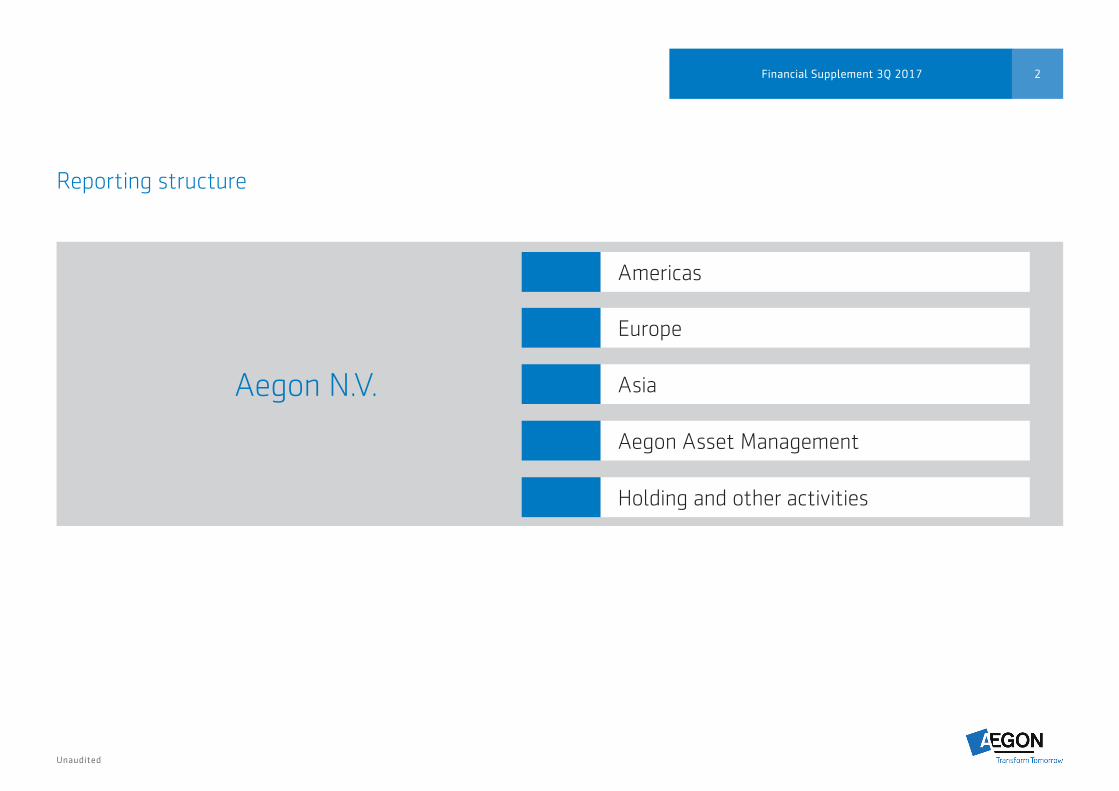
Table of contents
Aegon N.V.2 Reporting structure
3 Results overview geographically
4 Summary financial and market highlights
5 Sales
6 Consolidated income statement
7 Fair value items geographically
8 Return on capital and Return on equity - net underlying
earnings YTD
9 Return on capital and Return on equity - net underlying
earnings QTD
10 Consolidated balance sheet
11 Revenue generating investments
11 Investments general account
11 Structured assets and corporate bonds
12 Capital structure
Aegon Americas13 Reporting structure
14 Earnings & sales - in USD
15 Earnings & sales - in EUR
16 Deposits & account balances - in USD
17 Deposits & account balances - in EUR
18 Life
19 Accident & Health
20 Retirement Plans
21 Mutual Funds
22 Variable Annuities
23 Variable Annuites - continued
24 Fixed Annuities
25 Latin America
26 Investments general account
26 Structured assets and corporate bonds
27 Investments general account
28 Investments portfolio
Europe29 Reporting structure
30 Earnings & sales
31 Investments general account
31 Structured assets and corporate bonds
Aegon the Netherlands
32 Earnings & sales
33 Life & savings
34 Pensions
35 Non-life
35 Distribution
36 Investments general account
36 Structured assets and corporate bonds
Aegon United Kingdom
37 Earnings & sales - in GBP
38 Earnings & sales - in EUR
39 Life - in GBP
40 Life - in EUR
41 Pensions - in GBP
42 Pensions - in EUR
43 Investments general account
43 Structured assets and corporate bonds
Aegon Central & Eastern Europe
44 Earnings & revenues
Aegon Spain & Portugal
45 Earnings & revenues
Aegon Asia46 Earnings & revenues & account balances - in USD
47 Earnings & revenues & account balances - in EUR
48 Investments general account
48 Structured assets and corporate bonds
Aegon Asset Management49 Earnings & expenses
50 Account balances
51 Other third-party flows
Other corporate information52 Public ratings
53 Glossary on business lines
54 Disclaimers
55 Corporate and shareholder information
Unaudited
2Financial Supplement 3Q 2017
Reporting structure
Aegon N.V.
Aegon Asset Management
Holding and other activities
Asia
Europe
Americas
Unaudited
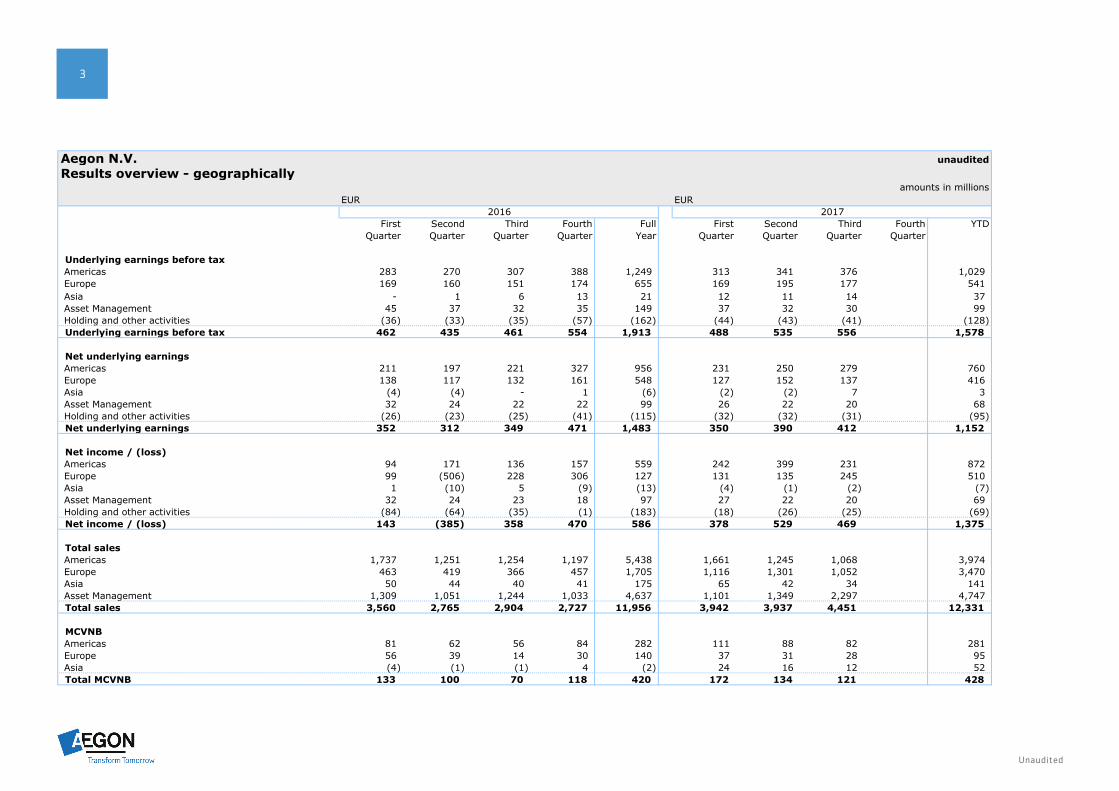
3
Aegon N.V. unauditedResults overview - geographically
amounts in millionsEUR EUR
First Second Third Fourth Full First Second Third Fourth YTDQuarter Quarter Quarter Quarter Year Quarter Quarter Quarter Quarter
Underlying earnings before taxAmericas 283 270 307 388 1,249 313 341 376 1,029 Europe 169 160 151 174 655 169 195 177 541 Asia - 1 6 13 21 12 11 14 37 Asset Management 45 37 32 35 149 37 32 30 99 Holding and other activities (36) (33) (35) (57) (162) (44) (43) (41) (128)
Underlying earnings before tax 462 435 461 554 1,913 488 535 556 1,578
Net underlying earningsAmericas 211 197 221 327 956 231 250 279 760 Europe 138 117 132 161 548 127 152 137 416 Asia (4) (4) - 1 (6) (2) (2) 7 3 Asset Management 32 24 22 22 99 26 22 20 68 Holding and other activities (26) (23) (25) (41) (115) (32) (32) (31) (95) Net underlying earnings 352 312 349 471 1,483 350 390 412 1,152
Net income / (loss)Americas 94 171 136 157 559 242 399 231 872 Europe 99 (506) 228 306 127 131 135 245 510 Asia 1 (10) 5 (9) (13) (4) (1) (2) (7) Asset Management 32 24 23 18 97 27 22 20 69 Holding and other activities (84) (64) (35) (1) (183) (18) (26) (25) (69) Net income / (loss) 143 (385) 358 470 586 378 529 469 1,375
Total salesAmericas 1,737 1,251 1,254 1,197 5,438 1,661 1,245 1,068 3,974 Europe 463 419 366 457 1,705 1,116 1,301 1,052 3,470 Asia 50 44 40 41 175 65 42 34 141 Asset Management 1,309 1,051 1,244 1,033 4,637 1,101 1,349 2,297 4,747 Total sales 3,560 2,765 2,904 2,727 11,956 3,942 3,937 4,451 12,331
MCVNBAmericas 81 62 56 84 282 111 88 82 281 Europe 56 39 14 30 140 37 31 28 95 Asia (4) (1) (1) 4 (2) 24 16 12 52 Total MCVNB 133 100 70 118 420 172 134 121 428
2016 2017

Unaudited
4Financial Supplement 3Q 2017
Aegon N.V. unauditedSummary financial and market highlights amounts in millions
except per share dataEUR EUR
First Second Third Fourth Full First Second Third Fourth YTDEarnings summary Quarter Quarter Quarter Quarter Year Quarter Quarter Quarter Quarter
Underlying earnings before taxLife 192 143 178 266 779 203 224 263 691 Individual savings and retirement 125 131 142 136 534 131 139 132 402 Pensions 122 145 136 153 555 142 156 155 453 Non-life 6 5 3 21 34 12 23 15 50 Asset Management 45 37 32 35 149 37 32 30 99 Other (28) (25) (30) (56) (139) (37) (40) (39) (117) Underlying earnings before tax 462 435 461 554 1,913 488 535 556 1,578
Fair value items (358) (358) 84 (13) (645) (53) (191) 159 (85) Realized gains/(losses) on investments 54 229 21 36 340 76 111 135 321 Net impairments (36) (23) 6 (1) (54) (11) 2 4 (5) Other income/(charges) (6) (656) (72) (38) (771) 6 291 (233) 64 Run-off businesses 28 18 8 (1) 54 31 10 (3) 38 Income before tax 145 (355) 510 536 836 536 757 618 1,911 Income tax (1) (30) (152) (66) (250) (159) (228) (149) (536) Net income / (loss) 143 (385) 358 470 586 378 529 469 1,375
Net underlying earnings 352 312 349 471 1,483 350 390 412 1,152
SharesShares outstanding 2,076 2,069 2,071 2,040 2,040 2,040 2,071 2,096 2,096 Weighted average shares outstanding 2,098 2,052 2,052 2,047 2,062 2,040 2,044 2,076 2,054
Per share dataUnderlying earnings before tax 0.22 0.21 0.22 0.27 0.93 0.24 0.26 0.27 0.77 Net underlying earnings 0.17 0.15 0.17 0.23 0.72 0.17 0.19 0.20 0.56 Net income / (loss) 0.07 (0.19) 0.17 0.23 0.28 0.19 0.26 0.23 0.67 Basic earnings 0.05 (0.20) 0.16 0.21 0.22 0.17 0.24 0.21 0.62 Dividends - 0.13 - 0.13 0.26 - 0.13 - 0.13 Shareholders' equity 11.01 10.62 10.21 10.25 10.25 10.54 9.85 9.59 9.59 Shareholders' equity excl. revaluation reserves and DB remeasurements 8.13 7.91 7.84 8.51 8.51 8.59 8.21 8.04 8.04
Trading statistics (Amsterdam Stock Exchange)High 5.43 5.39 3.85 5.28 5.43 5.38 4.91 5.19 5.38 Low 4.07 3.53 3.04 3.41 3.04 4.75 4.30 4.62 4.30 Close 4.83 3.53 3.41 5.23 5.23 4.77 4.47 4.93 4.93 Volume (average daily) 10,366,731 10,554,651 11,103,620 11,763,000 10,951,208 9,106,453 11,360,342 9,373,707 9,924,748
2016 2017
Unaudited
5
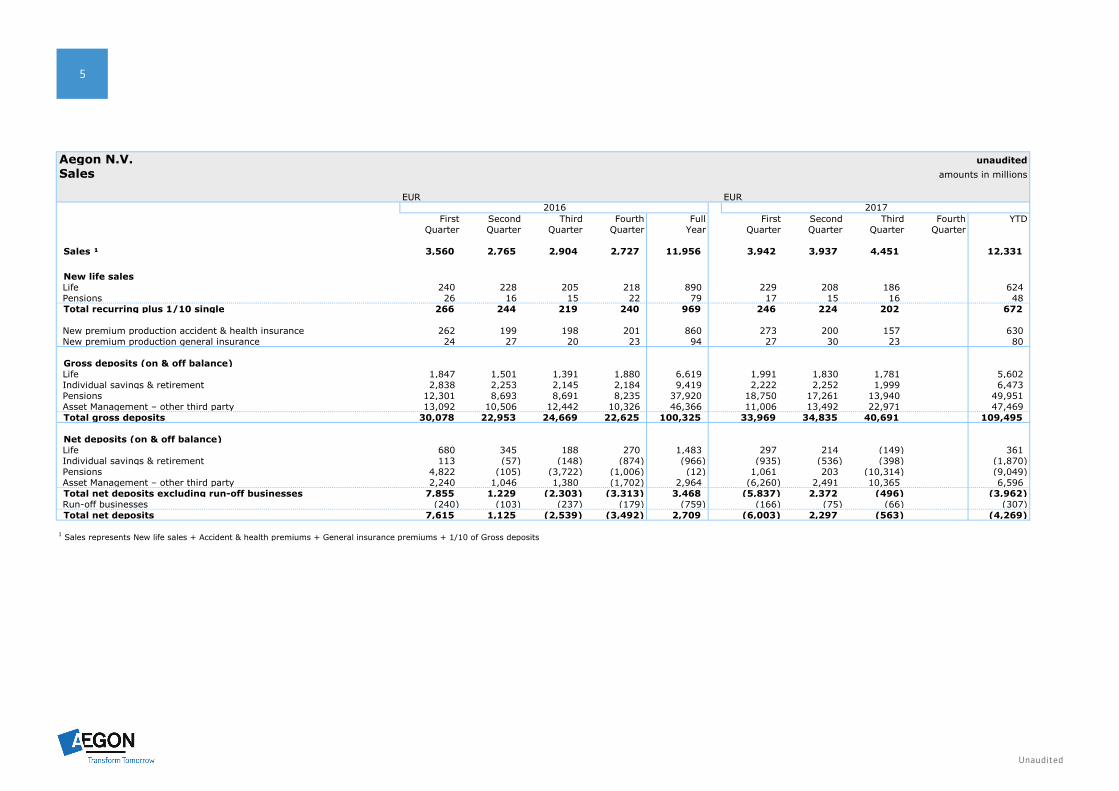
Aegon N.V. unauditedSales amounts in millions
EUR EUR
First Second Third Fourth Full First Second Third Fourth YTDQuarter Quarter Quarter Quarter Year Quarter Quarter Quarter Quarter
Sales ¹ 3,560 2,765 2,904 2,727 11,956 3,942 3,937 4,451 12,331
New life salesLife 240 228 205 218 890 229 208 186 624 Pensions 26 16 15 22 79 17 15 16 48 Total recurring plus 1/10 single 266 244 219 240 969 246 224 202 672
New premium production accident & health insurance 262 199 198 201 860 273 200 157 630 New premium production general insurance 24 27 20 23 94 27 30 23 80
Gross deposits (on & off balance)Life 1,847 1,501 1,391 1,880 6,619 1,991 1,830 1,781 5,602 Individual savings & retirement 2,838 2,253 2,145 2,184 9,419 2,222 2,252 1,999 6,473 Pensions 12,301 8,693 8,691 8,235 37,920 18,750 17,261 13,940 49,951 Asset Management – other third party 13,092 10,506 12,442 10,326 46,366 11,006 13,492 22,971 47,469 Total gross deposits 30,078 22,953 24,669 22,625 100,325 33,969 34,835 40,691 109,495
Net deposits (on & off balance)Life 680 345 188 270 1,483 297 214 (149) 361 Individual savings & retirement 113 (57) (148) (874) (966) (935) (536) (398) (1,870) Pensions 4,822 (105) (3,722) (1,006) (12) 1,061 203 (10,314) (9,049) Asset Management – other third party 2,240 1,046 1,380 (1,702) 2,964 (6,260) 2,491 10,365 6,596 Total net deposits excluding run-off businesses 7,855 1,229 (2,303) (3,313) 3,468 (5,837) 2,372 (496) (3,962) Run-off businesses (240) (103) (237) (179) (759) (166) (75) (66) (307) Total net deposits 7,615 1,125 (2,539) (3,492) 2,709 (6,003) 2,297 (563) (4,269)
1 Sales represents New life sales + Accident & health premiums + General insurance premiums + 1/10 of Gross deposits
2016 2017
Unaudited
6Financial Supplement 3Q 2017
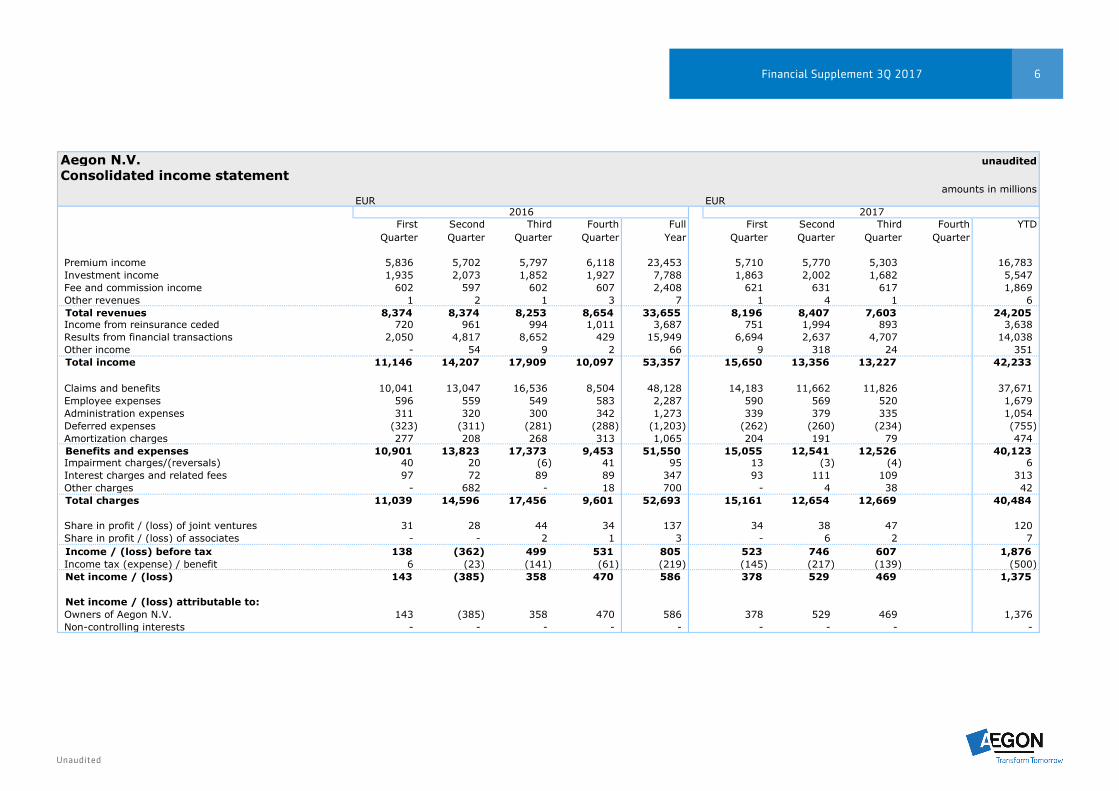
Aegon N.V. unauditedConsolidated income statement
amounts in millionsEUR EUR
First Second Third Fourth Full First Second Third Fourth YTDQuarter Quarter Quarter Quarter Year Quarter Quarter Quarter Quarter
Premium income 5,836 5,702 5,797 6,118 23,453 5,710 5,770 5,303 16,783 Investment income 1,935 2,073 1,852 1,927 7,788 1,863 2,002 1,682 5,547 Fee and commission income 602 597 602 607 2,408 621 631 617 1,869 Other revenues 1 2 1 3 7 1 4 1 6 Total revenues 8,374 8,374 8,253 8,654 33,655 8,196 8,407 7,603 24,205 Income from reinsurance ceded 720 961 994 1,011 3,687 751 1,994 893 3,638 Results from financial transactions 2,050 4,817 8,652 429 15,949 6,694 2,637 4,707 14,038 Other income - 54 9 2 66 9 318 24 351 Total income 11,146 14,207 17,909 10,097 53,357 15,650 13,356 13,227 42,233
Claims and benefits 10,041 13,047 16,536 8,504 48,128 14,183 11,662 11,826 37,671 Employee expenses 596 559 549 583 2,287 590 569 520 1,679 Administration expenses 311 320 300 342 1,273 339 379 335 1,054 Deferred expenses (323) (311) (281) (288) (1,203) (262) (260) (234) (755) Amortization charges 277 208 268 313 1,065 204 191 79 474 Benefits and expenses 10,901 13,823 17,373 9,453 51,550 15,055 12,541 12,526 40,123 Impairment charges/(reversals) 40 20 (6) 41 95 13 (3) (4) 6 Interest charges and related fees 97 72 89 89 347 93 111 109 313 Other charges - 682 - 18 700 - 4 38 42 Total charges 11,039 14,596 17,456 9,601 52,693 15,161 12,654 12,669 40,484
Share in profit / (loss) of joint ventures 31 28 44 34 137 34 38 47 120 Share in profit / (loss) of associates - - 2 1 3 - 6 2 7 Income / (loss) before tax 138 (362) 499 531 805 523 746 607 1,876 Income tax (expense) / benefit 6 (23) (141) (61) (219) (145) (217) (139) (500) Net income / (loss) 143 (385) 358 470 586 378 529 469 1,375
Net income / (loss) attributable to:Owners of Aegon N.V. 143 (385) 358 470 586 378 529 469 1,376 Non-controlling interests - - - - - - - - -
2016 2017
Unaudited
7
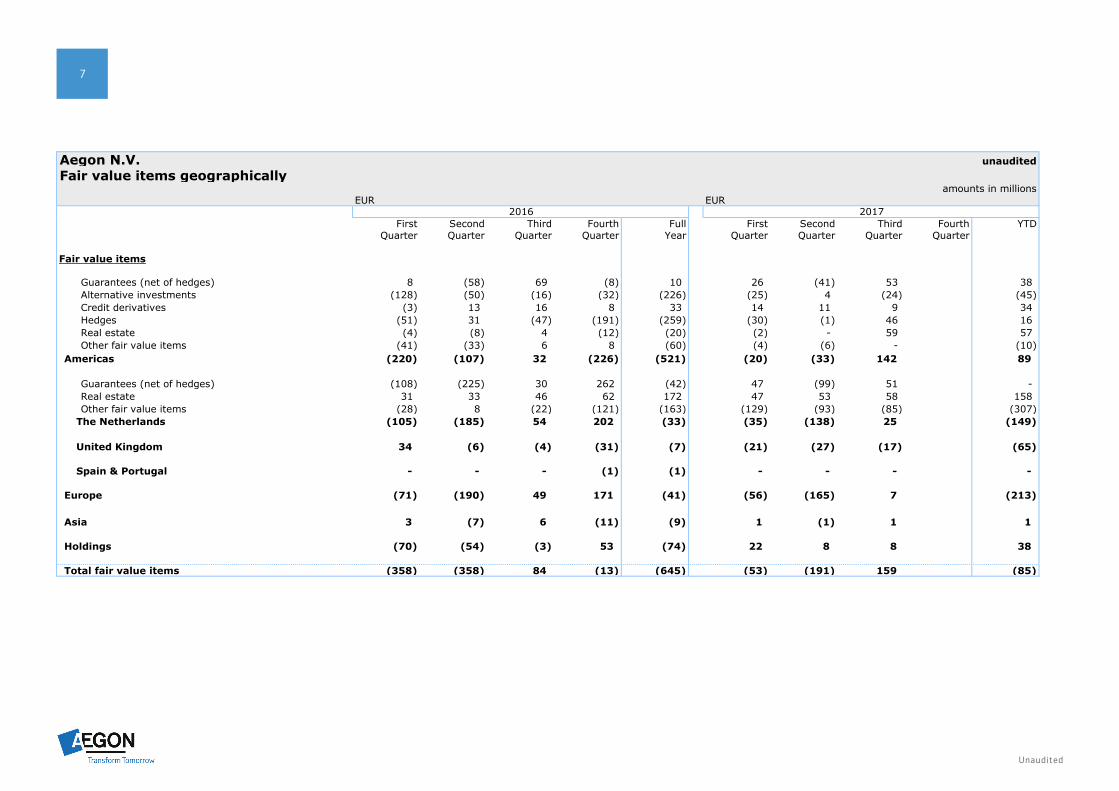
Aegon N.V. unauditedFair value items geographically
amounts in millionsEUR EUR
First Second Third Fourth Full First Second Third Fourth YTDQuarter Quarter Quarter Quarter Year Quarter Quarter Quarter Quarter
Fair value items
Guarantees (net of hedges) 8 (58) 69 (8) 10 26 (41) 53 38 Alternative investments (128) (50) (16) (32) (226) (25) 4 (24) (45) Credit derivatives (3) 13 16 8 33 14 11 9 34 Hedges (51) 31 (47) (191) (259) (30) (1) 46 16 Real estate (4) (8) 4 (12) (20) (2) - 59 57 Other fair value items (41) (33) 6 8 (60) (4) (6) - (10)
Americas (220) (107) 32 (226) (521) (20) (33) 142 89
Guarantees (net of hedges) (108) (225) 30 262 (42) 47 (99) 51 - Real estate 31 33 46 62 172 47 53 58 158 Other fair value items (28) 8 (22) (121) (163) (129) (93) (85) (307) The Netherlands (105) (185) 54 202 (33) (35) (138) 25 (149)
United Kingdom 34 (6) (4) (31) (7) (21) (27) (17) (65)
Spain & Portugal - - - (1) (1) - - - -
Europe (71) (190) 49 171 (41) (56) (165) 7 (213)
Asia 3 (7) 6 (11) (9) 1 (1) 1 1
Holdings (70) (54) (3) 53 (74) 22 8 8 38
Total fair value items (358) (358) 84 (13) (645) (53) (191) 159 (85)
2016 2017
Unaudited
8Financial Supplement 3Q 2017
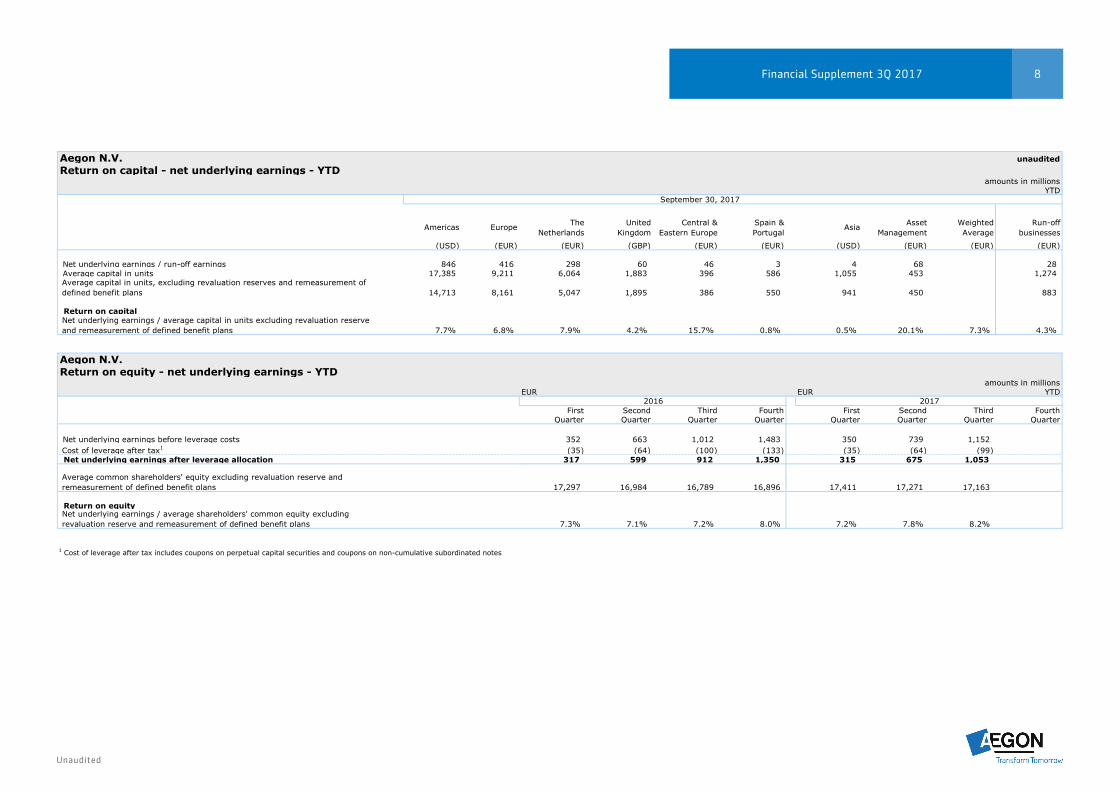
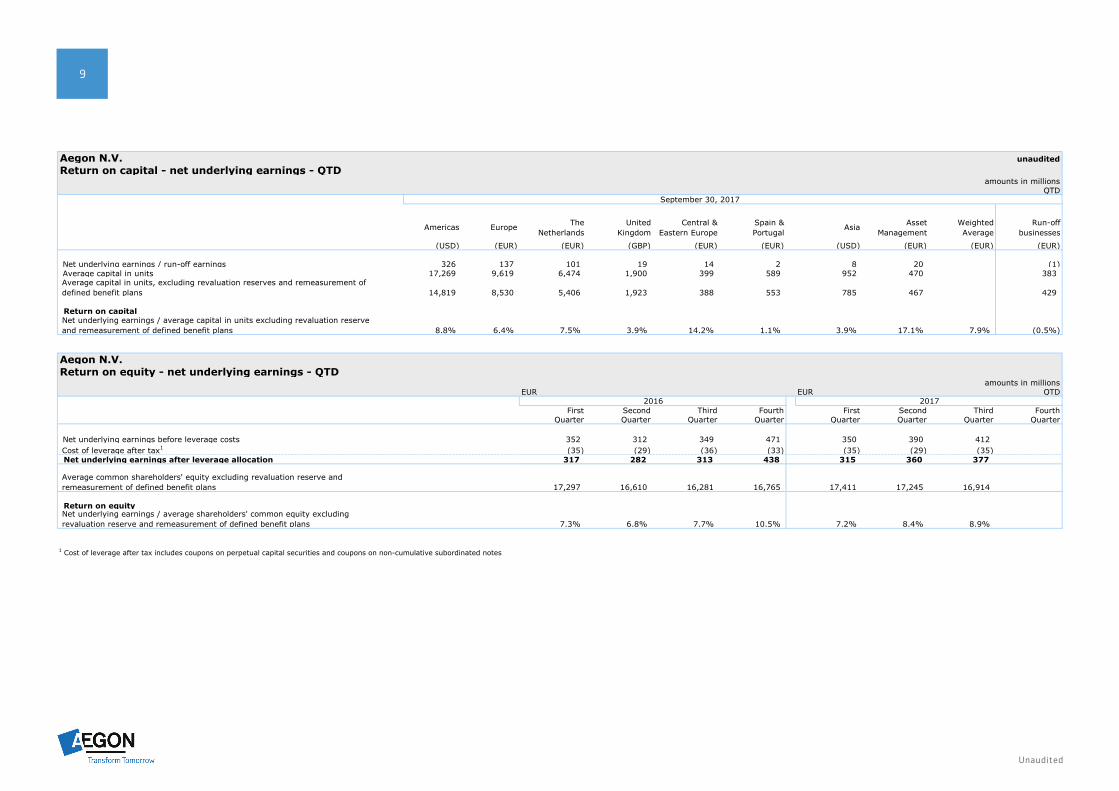
Aegon N.V. unauditedReturn on capital - net underlying earnings - YTD
amounts in millionsYTD
Americas Europe The Netherlands
UnitedKingdom
Central &Eastern Europe
Spain & Portugal
Asia Asset Management
Weighted Average
Run-off businesses
(USD) (EUR) (EUR) (GBP) (EUR) (EUR) (USD) (EUR) (EUR) (EUR)
Net underlying earnings / run-off earnings 846 416 298 60 46 3 4 68 28 Average capital in units 17,385 9,211 6,064 1,883 396 586 1,055 453 1,274
Average capital in units, excluding revaluation reserves and remeasurement of defined benefit plans 14,713 8,161 5,047 1,895 386 550 941 450 883
Return on capital Net underlying earnings / average capital in units excluding revaluation reserve and remeasurement of defined benefit plans 7.7% 6.8% 7.9% 4.2% 15.7% 0.8% 0.5% 20.1% 7.3% 4.3%
Aegon N.V.Return on equity - net underlying earnings - YTD
amounts in millionsEUR EUR YTD
First Second Third Fourth First Second Third FourthQuarter Quarter Quarter Quarter Quarter Quarter Quarter Quarter
Net underlying earnings before leverage costs 352 663 1,012 1,483 350 739 1,152 Cost of leverage after tax1 (35) (64) (100) (133) (35) (64) (99) Net underlying earnings after leverage allocation 317 599 912 1,350 315 675 1,053
Average common shareholders' equity excluding revaluation reserve and remeasurement of defined benefit plans 17,297 16,984 16,789 16,896 17,411 17,271 17,163
Return on equity Net underlying earnings / average shareholders' common equity excluding revaluation reserve and remeasurement of defined benefit plans 7.3% 7.1% 7.2% 8.0% 7.2% 7.8% 8.2%
20172016
1 Cost of leverage after tax includes coupons on perpetual capital securities and coupons on non-cumulative subordinated notes
September 30, 2017
Unaudited
9
Aegon N.V. unauditedReturn on capital - net underlying earnings - QTD
amounts in millionsQTD
Americas Europe The Netherlands
UnitedKingdom
Central &Eastern Europe
Spain & Portugal
Asia Asset Management
Weighted Average
Run-off businesses
(USD) (EUR) (EUR) (GBP) (EUR) (EUR) (USD) (EUR) (EUR) (EUR)
Net underlying earnings / run-off earnings 326 137 101 19 14 2 8 20 (1) Average capital in units 17,269 9,619 6,474 1,900 399 589 952 470 383
Average capital in units, excluding revaluation reserves and remeasurement of defined benefit plans 14,819 8,530 5,406 1,923 388 553 785 467 429
Return on capital Net underlying earnings / average capital in units excluding revaluation reserve and remeasurement of defined benefit plans 8.8% 6.4% 7.5% 3.9% 14.2% 1.1% 3.9% 17.1% 7.9% (0.5%)
Aegon N.V.Return on equity - net underlying earnings - QTD
amounts in millionsEUR EUR QTD
First Second Third Fourth First Second Third FourthQuarter Quarter Quarter Quarter Quarter Quarter Quarter Quarter
Net underlying earnings before leverage costs 352 312 349 471 350 390 412 Cost of leverage after tax1 (35) (29) (36) (33) (35) (29) (35) Net underlying earnings after leverage allocation 317 282 313 438 315 360 377
Average common shareholders' equity excluding revaluation reserve and remeasurement of defined benefit plans 17,297 16,610 16,281 16,765 17,411 17,245 16,914
Return on equity Net underlying earnings / average shareholders' common equity excluding revaluation reserve and remeasurement of defined benefit plans 7.3% 6.8% 7.7% 10.5% 7.2% 8.4% 8.9%
2016 2017
1 Cost of leverage after tax includes coupons on perpetual capital securities and coupons on non-cumulative subordinated notes
September 30, 2017
Unaudited
10Financial Supplement 3Q 2017
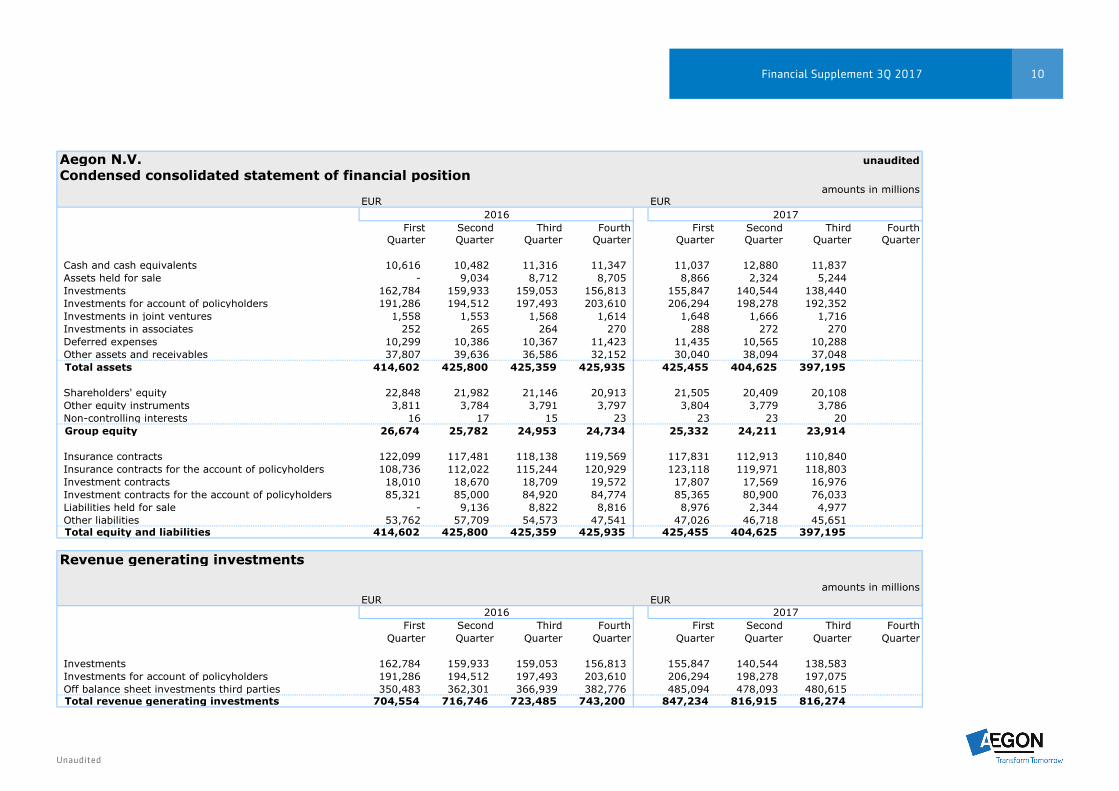
Aegon N.V. unauditedCondensed consolidated statement of financial position
amounts in millionsEUR EUR
First Second Third Fourth First Second Third FourthQuarter Quarter Quarter Quarter Quarter Quarter Quarter Quarter
Cash and cash equivalents 10,616 10,482 11,316 11,347 11,037 12,880 11,837 Assets held for sale - 9,034 8,712 8,705 8,866 2,324 5,244 Investments 162,784 159,933 159,053 156,813 155,847 140,544 138,440 Investments for account of policyholders 191,286 194,512 197,493 203,610 206,294 198,278 192,352 Investments in joint ventures 1,558 1,553 1,568 1,614 1,648 1,666 1,716 Investments in associates 252 265 264 270 288 272 270 Deferred expenses 10,299 10,386 10,367 11,423 11,435 10,565 10,288 Other assets and receivables 37,807 39,636 36,586 32,152 30,040 38,094 37,048 Total assets 414,602 425,800 425,359 425,935 425,455 404,625 397,195
Shareholders' equity 22,848 21,982 21,146 20,913 21,505 20,409 20,108 Other equity instruments 3,811 3,784 3,791 3,797 3,804 3,779 3,786 Non-controlling interests 16 17 15 23 23 23 20 Group equity 26,674 25,782 24,953 24,734 25,332 24,211 23,914
Insurance contracts 122,099 117,481 118,138 119,569 117,831 112,913 110,840 Insurance contracts for the account of policyholders 108,736 112,022 115,244 120,929 123,118 119,971 118,803 Investment contracts 18,010 18,670 18,709 19,572 17,807 17,569 16,976 Investment contracts for the account of policyholders 85,321 85,000 84,920 84,774 85,365 80,900 76,033 Liabilities held for sale - 9,136 8,822 8,816 8,976 2,344 4,977 Other liabilities 53,762 57,709 54,573 47,541 47,026 46,718 45,651 Total equity and liabilities 414,602 425,800 425,359 425,935 425,455 404,625 397,195
Revenue generating investments
amounts in millionsEUR EUR
First Second Third Fourth First Second Third FourthQuarter Quarter Quarter Quarter Quarter Quarter Quarter Quarter
Investments 162,784 159,933 159,053 156,813 155,847 140,544 138,583 Investments for account of policyholders 191,286 194,512 197,493 203,610 206,294 198,278 197,075 Off balance sheet investments third parties 350,483 362,301 366,939 382,776 485,094 478,093 480,615 Total revenue generating investments 704,554 716,746 723,485 743,200 847,234 816,915 816,274
2016 2017
2016 2017

Unaudited
11
Aegon N.V. unauditedInvestments general account
amounts in millions, except for the impairment data amounts in millionsEUR EUR
Jun. 30, 2017 Mar. 31, 2017 Dec. 31, 2016 Sep. 30, 2016Asset Holdings and
Americas Europe Asia Management other Total Total Total Total Total
Cash / Treasuries / Agencies 17,630 16,803 480 146 20 35,079 35,517 35,448 35,841 38,967 Investment grade corporates 31,890 3,952 3,427 - - 39,270 40,307 50,869 51,034 51,213 High yield (and other) corporates 2,384 22 168 - - 2,573 2,658 3,151 3,112 3,252 Emerging markets debt 1,505 1,005 144 - - 2,654 2,590 3,003 3,105 3,011 Commercial MBS 3,588 178 526 - - 4,292 4,411 5,821 6,155 5,837 Residential MBS 3,142 597 35 - - 3,774 3,965 4,262 4,331 5,029 Non-housing related ABS 2,835 1,672 361 - - 4,867 5,343 6,304 6,566 5,811 Housing related ABS - 35 - - - 35 38 40 38 39 Subtotal 62,973 24,264 5,140 146 20 92,544 94,830 108,898 110,183 113,159
Residential mortgage loans 18 26,699 - - - 26,717 26,256 25,811 25,527 25,839 Commercial mortgage loans 6,814 56 - - - 6,870 7,002 8,400 8,679 7,840 Total mortgages 6,832 26,755 - - - 33,586 33,258 34,211 34,206 33,680
Convertibles & preferred stock 256 - - - - 256 267 309 308 291 Common equity & bond funds 374 615 - - 58 1,047 1,273 1,303 1,305 1,263 Private equity & hedge funds 1,540 533 - 2 - 2,075 2,030 2,141 1,836 1,926 Total equity like 2,170 1,148 - 2 58 3,379 3,570 3,753 3,450 3,479 Real estate 1,176 1,398 - - - 2,574 2,572 2,536 2,553 2,452 Other 687 3,738 1 1 - 4,428 4,309 4,286 4,214 4,206 Investments general account (excluding policy loans) 73,838 57,303 5,141 150 79 136,511 138,538 153,685 154,606 156,976
Policyholder loans 1,912 11 6 - - 1,929 2,006 2,162 2,207 2,077 Investments general account 75,750 57,315 5,147 150 79 138,440 140,544 155,847 156,813 159,053
Impairments as bps (quarterly) (1) - - - - (1) - 1 - -
Aegon N.V.Structured assets and corporate bonds
amounts in millionsEUR
AAA AA A BBB <BBB NR TotalStructured assets by ratingCommercial MBS 3,333 673 100 88 98 - 4,292 Residential MBS 1,372 534 111 44 1,713 - 3,774 Non-housing related ABS 2,735 591 1,167 228 145 - 4,867 Housing related ABS - 3 32 - - - 35 Total 7,440 1,801 1,411 360 1,956 - 12,968
Credits by ratingIG Corporates 781 3,192 17,031 18,246 19 - 39,270 High yield corporate - - 2 3 2,568 - 2,573 Emerging Markets debt 23 119 664 1,252 593 3 2,654 Total 804 3,311 17,698 19,501 3,180 3 44,497
Cash / Treasuries / Agencies 35,079 Total 8,244 5,112 19,108 19,861 5,137 3 92,544
September 30, 2017
September 30, 2017
Unaudited
12Financial Supplement 3Q 2017
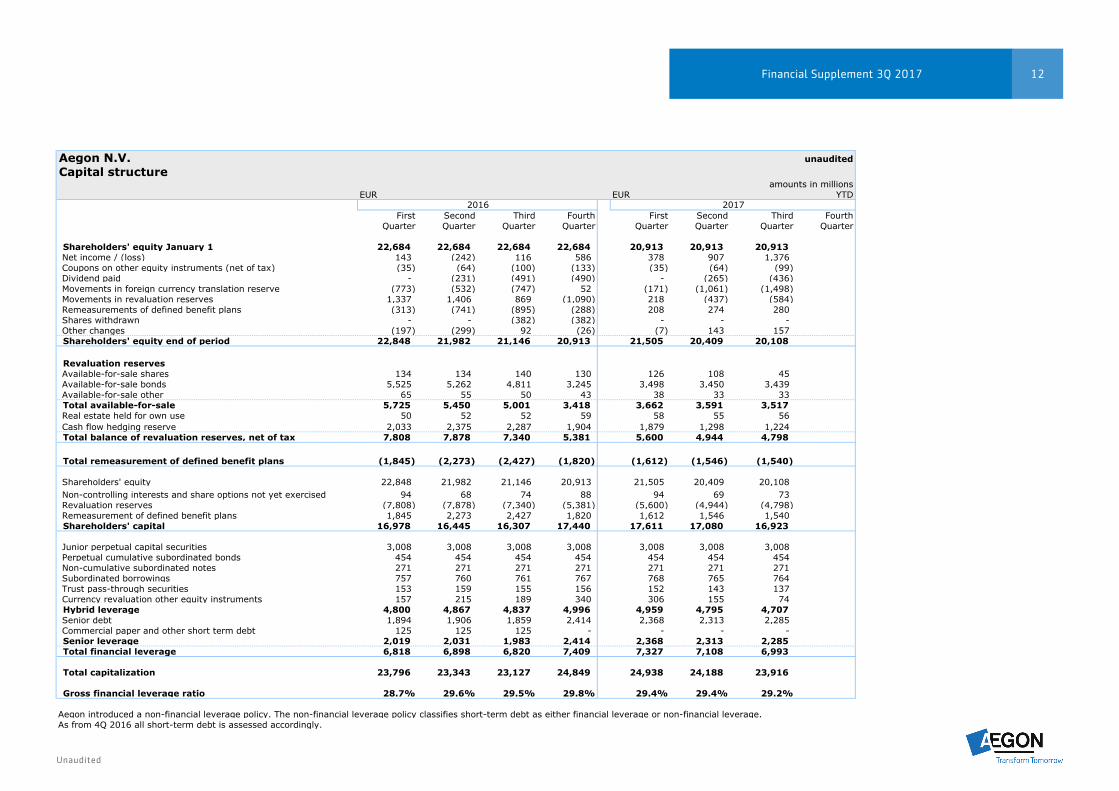
Aegon N.V. unauditedCapital structure
amounts in millionsEUR EUR YTD
First Second Third Fourth First Second Third FourthQuarter Quarter Quarter Quarter Quarter Quarter Quarter Quarter
Shareholders' equity January 1 22,684 22,684 22,684 22,684 20,913 20,913 20,913 Net income / (loss) 143 (242) 116 586 378 907 1,376 Coupons on other equity instruments (net of tax) (35) (64) (100) (133) (35) (64) (99) Dividend paid - (231) (491) (490) - (265) (436) Movements in foreign currency translation reserve (773) (532) (747) 52 (171) (1,061) (1,498) Movements in revaluation reserves 1,337 1,406 869 (1,090) 218 (437) (584) Remeasurements of defined benefit plans (313) (741) (895) (288) 208 274 280 Shares withdrawn - - (382) (382) - - -Other changes (197) (299) 92 (26) (7) 143 157 Shareholders' equity end of period 22,848 21,982 21,146 20,913 21,505 20,409 20,108
Revaluation reservesAvailable-for-sale shares 134 134 140 130 126 108 45 Available-for-sale bonds 5,525 5,262 4,811 3,245 3,498 3,450 3,439 Available-for-sale other 65 55 50 43 38 33 33 Total available-for-sale 5,725 5,450 5,001 3,418 3,662 3,591 3,517 Real estate held for own use 50 52 52 59 58 55 56 Cash flow hedging reserve 2,033 2,375 2,287 1,904 1,879 1,298 1,224 Total balance of revaluation reserves, net of tax 7,808 7,878 7,340 5,381 5,600 4,944 4,798
Total remeasurement of defined benefit plans (1,845) (2,273) (2,427) (1,820) (1,612) (1,546) (1,540)
Shareholders' equity 22,848 21,982 21,146 20,913 21,505 20,409 20,108 Non-controlling interests and share options not yet exercised 94 68 74 88 94 69 73 Revaluation reserves (7,808) (7,878) (7,340) (5,381) (5,600) (4,944) (4,798) Remeasurement of defined benefit plans 1,845 2,273 2,427 1,820 1,612 1,546 1,540 Shareholders' capital 16,978 16,445 16,307 17,440 17,611 17,080 16,923
Junior perpetual capital securities 3,008 3,008 3,008 3,008 3,008 3,008 3,008 Perpetual cumulative subordinated bonds 454 454 454 454 454 454 454 Non-cumulative subordinated notes 271 271 271 271 271 271 271 Subordinated borrowings 757 760 761 767 768 765 764 Trust pass-through securities 153 159 155 156 152 143 137 Currency revaluation other equity instruments 157 215 189 340 306 155 74 Hybrid leverage 4,800 4,867 4,837 4,996 4,959 4,795 4,707 Senior debt 1,894 1,906 1,859 2,414 2,368 2,313 2,285 Commercial paper and other short term debt 125 125 125 - - - -Senior leverage 2,019 2,031 1,983 2,414 2,368 2,313 2,285 Total financial leverage 6,818 6,898 6,820 7,409 7,327 7,108 6,993
Total capitalization 23,796 23,343 23,127 24,849 24,938 24,188 23,916
Gross financial leverage ratio 28.7% 29.6% 29.5% 29.8% 29.4% 29.4% 29.2%
Aegon introduced a non-financial leverage policy. The non-financial leverage policy classifies short-term debt as either financial leverage or non-financial leverage.As from 4Q 2016 all short-term debt is assessed accordingly.
2016 2017
Unaudited
13
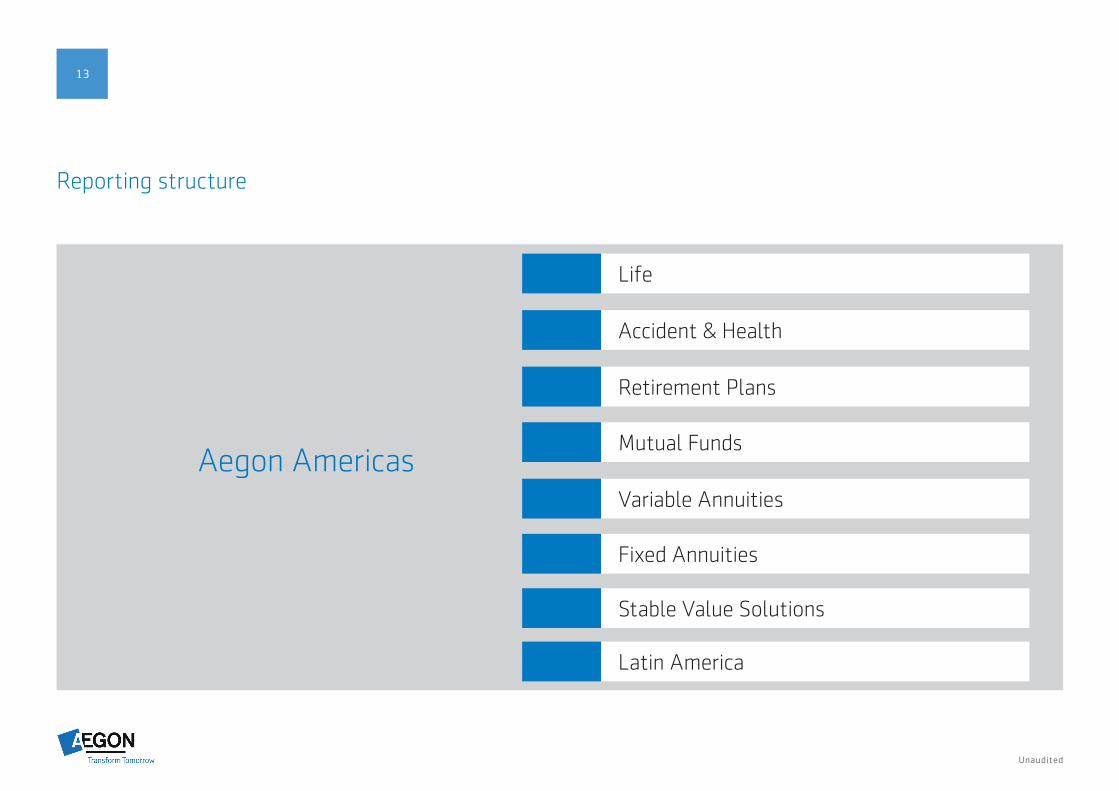
Reporting structure
Aegon Americas
Life
Accident & Health
Retirement Plans
Mutual Funds
Variable Annuities
Fixed Annuities
Stable Value Solutions
Latin America
Unaudited
14Financial Supplement 3Q 2017
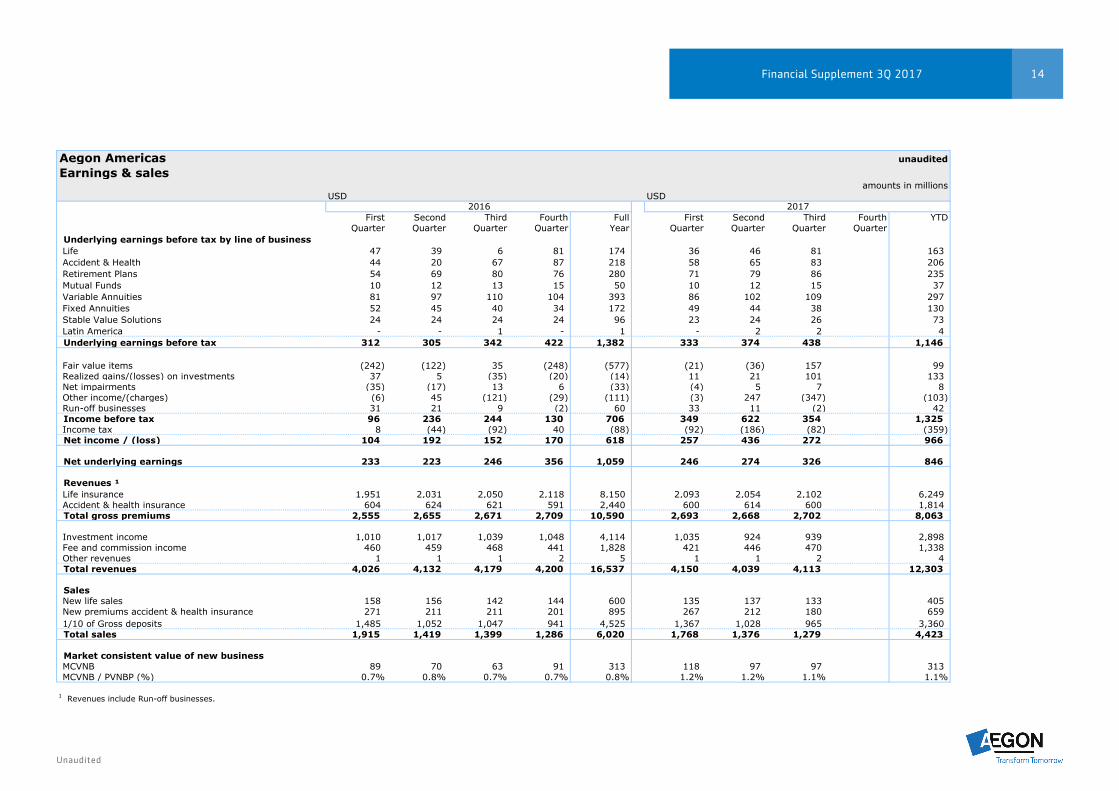
Aegon Americas unauditedEarnings & sales
amounts in millionsUSD USD
First Second Third Fourth Full First Second Third Fourth YTDQuarter Quarter Quarter Quarter Year Quarter Quarter Quarter Quarter
Underlying earnings before tax by line of businessLife 47 39 6 81 174 36 46 81 163 Accident & Health 44 20 67 87 218 58 65 83 206 Retirement Plans 54 69 80 76 280 71 79 86 235 Mutual Funds 10 12 13 15 50 10 12 15 37 Variable Annuities 81 97 110 104 393 86 102 109 297 Fixed Annuities 52 45 40 34 172 49 44 38 130 Stable Value Solutions 24 24 24 24 96 23 24 26 73 Latin America - - 1 - 1 - 2 2 4 Underlying earnings before tax 312 305 342 422 1,382 333 374 438 1,146
Fair value items (242) (122) 35 (248) (577) (21) (36) 157 99 Realized gains/(losses) on investments 37 5 (35) (20) (14) 11 21 101 133 Net impairments (35) (17) 13 6 (33) (4) 5 7 8 Other income/(charges) (6) 45 (121) (29) (111) (3) 247 (347) (103) Run-off businesses 31 21 9 (2) 60 33 11 (2) 42 Income before tax 96 236 244 130 706 349 622 354 1,325 Income tax 8 (44) (92) 40 (88) (92) (186) (82) (359) Net income / (loss) 104 192 152 170 618 257 436 272 966
Net underlying earnings 233 223 246 356 1,059 246 274 326 846
Revenues ¹Life insurance 1,951 2,031 2,050 2,118 8,150 2,093 2,054 2,102 6,249 Accident & health insurance 604 624 621 591 2,440 600 614 600 1,814 Total gross premiums 2,555 2,655 2,671 2,709 10,590 2,693 2,668 2,702 8,063
Investment income 1,010 1,017 1,039 1,048 4,114 1,035 924 939 2,898 Fee and commission income 460 459 468 441 1,828 421 446 470 1,338 Other revenues 1 1 1 2 5 1 1 2 4 Total revenues 4,026 4,132 4,179 4,200 16,537 4,150 4,039 4,113 12,303
SalesNew life sales 158 156 142 144 600 135 137 133 405 New premiums accident & health insurance 271 211 211 201 895 267 212 180 659 1/10 of Gross deposits 1,485 1,052 1,047 941 4,525 1,367 1,028 965 3,360 Total sales 1,915 1,419 1,399 1,286 6,020 1,768 1,376 1,279 4,423
Market consistent value of new businessMCVNB 89 70 63 91 313 118 97 97 313 MCVNB / PVNBP (%) 0.7% 0.8% 0.7% 0.7% 0.8% 1.2% 1.2% 1.1% 1.1%
1 Revenues include Run-off businesses.
2016 2017
Unaudited
15
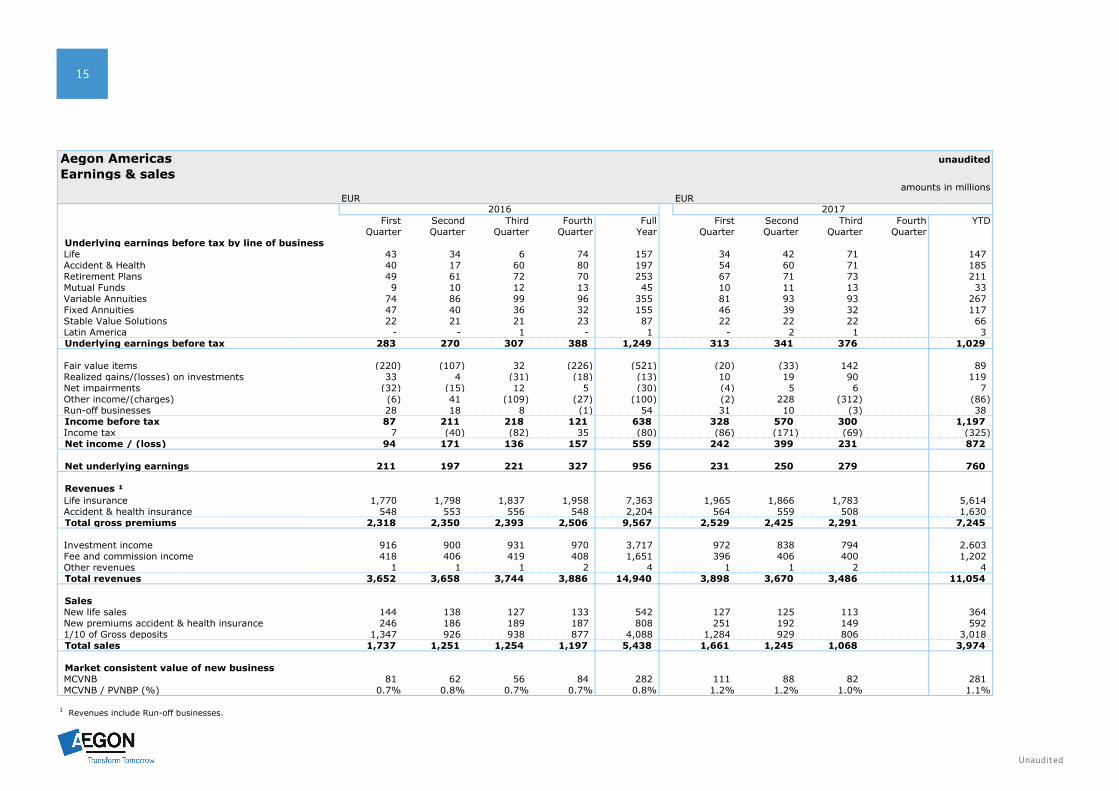
Aegon Americas unauditedEarnings & sales
amounts in millionsEUR EUR
First Second Third Fourth Full First Second Third Fourth YTDQuarter Quarter Quarter Quarter Year Quarter Quarter Quarter Quarter
Underlying earnings before tax by line of businessLife 43 34 6 74 157 34 42 71 147 Accident & Health 40 17 60 80 197 54 60 71 185 Retirement Plans 49 61 72 70 253 67 71 73 211 Mutual Funds 9 10 12 13 45 10 11 13 33 Variable Annuities 74 86 99 96 355 81 93 93 267 Fixed Annuities 47 40 36 32 155 46 39 32 117 Stable Value Solutions 22 21 21 23 87 22 22 22 66 Latin America - - 1 - 1 - 2 1 3 Underlying earnings before tax 283 270 307 388 1,249 313 341 376 1,029
Fair value items (220) (107) 32 (226) (521) (20) (33) 142 89 Realized gains/(losses) on investments 33 4 (31) (18) (13) 10 19 90 119 Net impairments (32) (15) 12 5 (30) (4) 5 6 7 Other income/(charges) (6) 41 (109) (27) (100) (2) 228 (312) (86) Run-off businesses 28 18 8 (1) 54 31 10 (3) 38 Income before tax 87 211 218 121 638 328 570 300 1,197 Income tax 7 (40) (82) 35 (80) (86) (171) (69) (325) Net income / (loss) 94 171 136 157 559 242 399 231 872
Net underlying earnings 211 197 221 327 956 231 250 279 760
Revenues ¹Life insurance 1,770 1,798 1,837 1,958 7,363 1,965 1,866 1,783 5,614 Accident & health insurance 548 553 556 548 2,204 564 559 508 1,630 Total gross premiums 2,318 2,350 2,393 2,506 9,567 2,529 2,425 2,291 7,245
Investment income 916 900 931 970 3,717 972 838 794 2,603 Fee and commission income 418 406 419 408 1,651 396 406 400 1,202 Other revenues 1 1 1 2 4 1 1 2 4 Total revenues 3,652 3,658 3,744 3,886 14,940 3,898 3,670 3,486 11,054
SalesNew life sales 144 138 127 133 542 127 125 113 364 New premiums accident & health insurance 246 186 189 187 808 251 192 149 592 1/10 of Gross deposits 1,347 926 938 877 4,088 1,284 929 806 3,018 Total sales 1,737 1,251 1,254 1,197 5,438 1,661 1,245 1,068 3,974
Market consistent value of new businessMCVNB 81 62 56 84 282 111 88 82 281 MCVNB / PVNBP (%) 0.7% 0.8% 0.7% 0.7% 0.8% 1.2% 1.2% 1.0% 1.1%
1 Revenues include Run-off businesses.
2016 2017
Unaudited
16Financial Supplement 3Q 2017
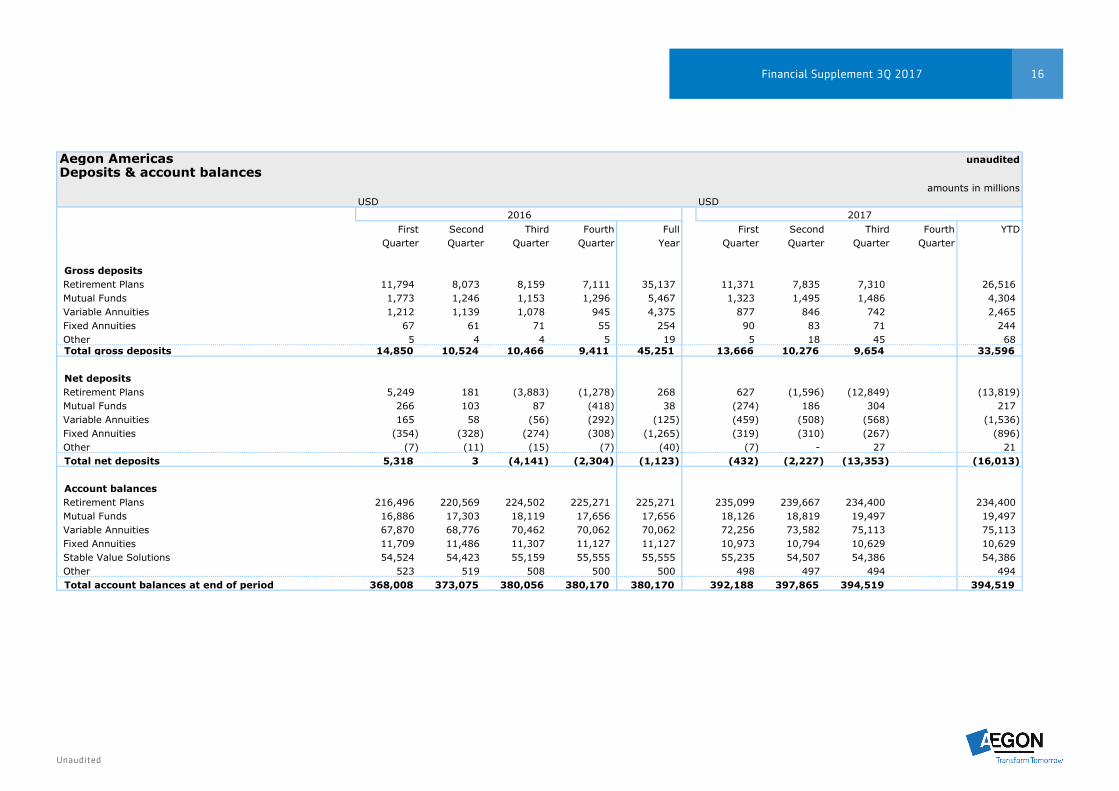
Aegon Americas unauditedDeposits & account balances
amounts in millionsUSD USD
First Second Third Fourth Full First Second Third Fourth YTDQuarter Quarter Quarter Quarter Year Quarter Quarter Quarter Quarter
Gross depositsRetirement Plans 11,794 8,073 8,159 7,111 35,137 11,371 7,835 7,310 26,516 Mutual Funds 1,773 1,246 1,153 1,296 5,467 1,323 1,495 1,486 4,304 Variable Annuities 1,212 1,139 1,078 945 4,375 877 846 742 2,465 Fixed Annuities 67 61 71 55 254 90 83 71 244 Other 5 4 4 5 19 5 18 45 68 Total gross deposits 14,850 10,524 10,466 9,411 45,251 13,666 10,276 9,654 33,596
Net depositsRetirement Plans 5,249 181 (3,883) (1,278) 268 627 (1,596) (12,849) (13,819) Mutual Funds 266 103 87 (418) 38 (274) 186 304 217 Variable Annuities 165 58 (56) (292) (125) (459) (508) (568) (1,536) Fixed Annuities (354) (328) (274) (308) (1,265) (319) (310) (267) (896) Other (7) (11) (15) (7) (40) (7) - 27 21 Total net deposits 5,318 3 (4,141) (2,304) (1,123) (432) (2,227) (13,353) (16,013)
Account balancesRetirement Plans 216,496 220,569 224,502 225,271 225,271 235,099 239,667 234,400 234,400 Mutual Funds 16,886 17,303 18,119 17,656 17,656 18,126 18,819 19,497 19,497 Variable Annuities 67,870 68,776 70,462 70,062 70,062 72,256 73,582 75,113 75,113 Fixed Annuities 11,709 11,486 11,307 11,127 11,127 10,973 10,794 10,629 10,629 Stable Value Solutions 54,524 54,423 55,159 55,555 55,555 55,235 54,507 54,386 54,386 Other 523 519 508 500 500 498 497 494 494 Total account balances at end of period 368,008 373,075 380,056 380,170 380,170 392,188 397,865 394,519 394,519
2016 2017
Unaudited
17
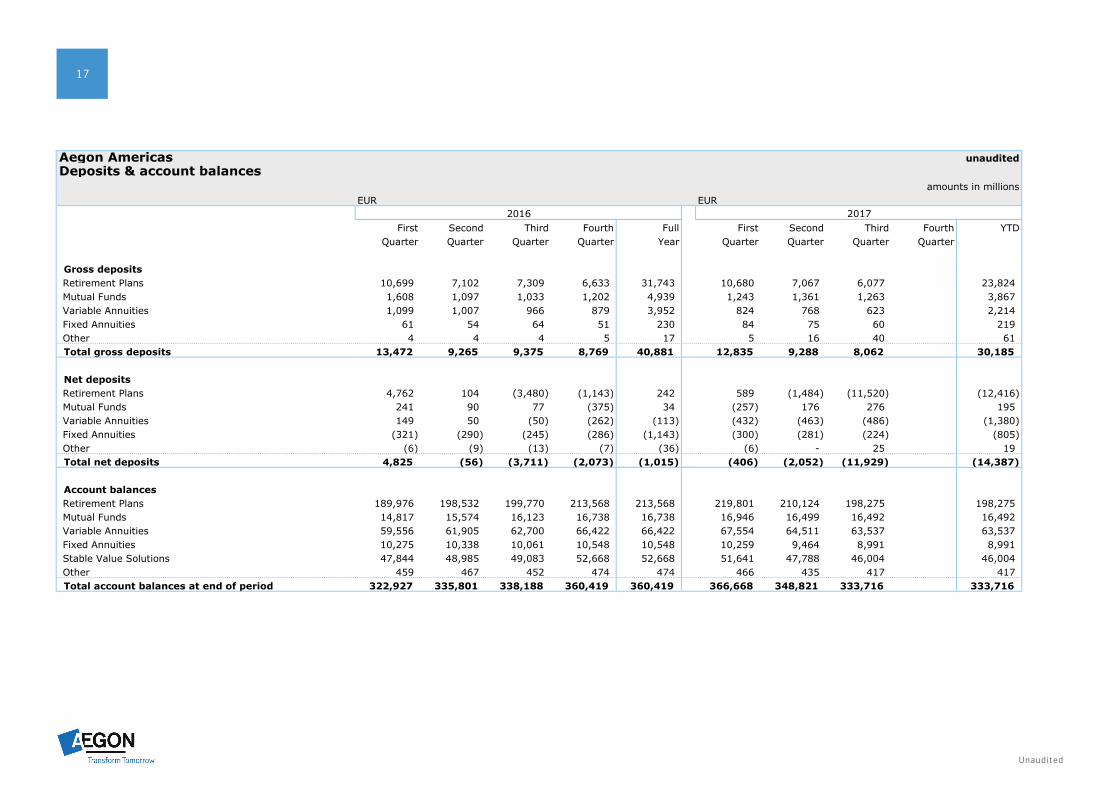
Aegon Americas unauditedDeposits & account balances
amounts in millionsEUR EUR
First Second Third Fourth Full First Second Third Fourth YTDQuarter Quarter Quarter Quarter Year Quarter Quarter Quarter Quarter
Gross depositsRetirement Plans 10,699 7,102 7,309 6,633 31,743 10,680 7,067 6,077 23,824 Mutual Funds 1,608 1,097 1,033 1,202 4,939 1,243 1,361 1,263 3,867 Variable Annuities 1,099 1,007 966 879 3,952 824 768 623 2,214 Fixed Annuities 61 54 64 51 230 84 75 60 219 Other 4 4 4 5 17 5 16 40 61 Total gross deposits 13,472 9,265 9,375 8,769 40,881 12,835 9,288 8,062 30,185
Net depositsRetirement Plans 4,762 104 (3,480) (1,143) 242 589 (1,484) (11,520) (12,416) Mutual Funds 241 90 77 (375) 34 (257) 176 276 195 Variable Annuities 149 50 (50) (262) (113) (432) (463) (486) (1,380) Fixed Annuities (321) (290) (245) (286) (1,143) (300) (281) (224) (805) Other (6) (9) (13) (7) (36) (6) - 25 19 Total net deposits 4,825 (56) (3,711) (2,073) (1,015) (406) (2,052) (11,929) (14,387)
Account balancesRetirement Plans 189,976 198,532 199,770 213,568 213,568 219,801 210,124 198,275 198,275 Mutual Funds 14,817 15,574 16,123 16,738 16,738 16,946 16,499 16,492 16,492 Variable Annuities 59,556 61,905 62,700 66,422 66,422 67,554 64,511 63,537 63,537 Fixed Annuities 10,275 10,338 10,061 10,548 10,548 10,259 9,464 8,991 8,991 Stable Value Solutions 47,844 48,985 49,083 52,668 52,668 51,641 47,788 46,004 46,004 Other 459 467 452 474 474 466 435 417 417 Total account balances at end of period 322,927 335,801 338,188 360,419 360,419 366,668 348,821 333,716 333,716
2016 2017
Unaudited
18Financial Supplement 3Q 2017
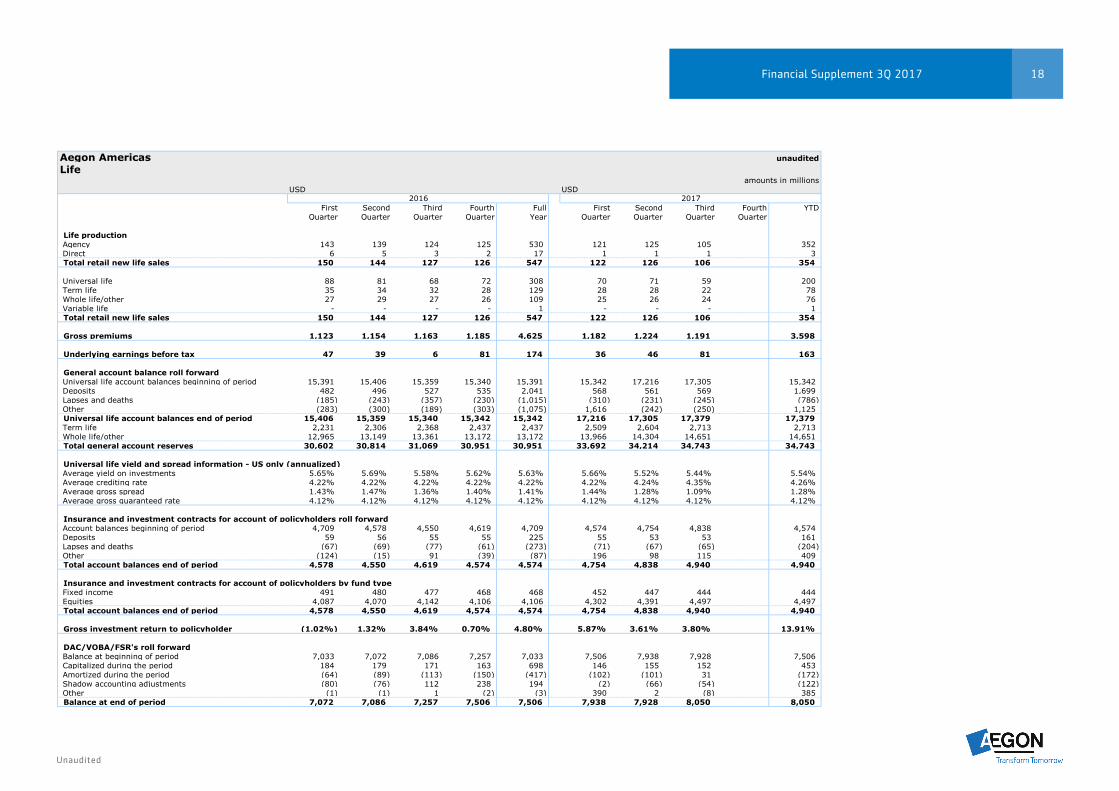
Aegon Americas unauditedLife
amounts in millionsUSD USD
First Second Third Fourth Full First Second Third Fourth YTDQuarter Quarter Quarter Quarter Year Quarter Quarter Quarter Quarter
Life productionAgency 143 139 124 125 530 121 125 105 352 Direct 6 5 3 2 17 1 1 1 3 Total retail new life sales 150 144 127 126 547 122 126 106 354
Universal life 88 81 68 72 308 70 71 59 200 Term life 35 34 32 28 129 28 28 22 78 Whole life/other 27 29 27 26 109 25 26 24 76 Variable life - - - - 1 - - - 1 Total retail new life sales 150 144 127 126 547 122 126 106 354
Gross premiums 1,123 1,154 1,163 1,185 4,625 1,182 1,224 1,191 3,598
Underlying earnings before tax 47 39 6 81 174 36 46 81 163
General account balance roll forwardUniversal life account balances beginning of period 15,391 15,406 15,359 15,340 15,391 15,342 17,216 17,305 15,342 Deposits 482 496 527 535 2,041 568 561 569 1,699 Lapses and deaths (185) (243) (357) (230) (1,015) (310) (231) (245) (786) Other (283) (300) (189) (303) (1,075) 1,616 (242) (250) 1,125 Universal life account balances end of period 15,406 15,359 15,340 15,342 15,342 17,216 17,305 17,379 17,379 Term life 2,231 2,306 2,368 2,437 2,437 2,509 2,604 2,713 2,713 Whole life/other 12,965 13,149 13,361 13,172 13,172 13,966 14,304 14,651 14,651 Total general account reserves 30,602 30,814 31,069 30,951 30,951 33,692 34,214 34,743 34,743
Universal life yield and spread information - US only (annualized)Average yield on investments 5.65% 5.69% 5.58% 5.62% 5.63% 5.66% 5.52% 5.44% 5.54% Average crediting rate 4.22% 4.22% 4.22% 4.22% 4.22% 4.22% 4.24% 4.35% 4.26% Average gross spread 1.43% 1.47% 1.36% 1.40% 1.41% 1.44% 1.28% 1.09% 1.28% Average gross guaranteed rate 4.12% 4.12% 4.12% 4.12% 4.12% 4.12% 4.12% 4.12% 4.12%
Insurance and investment contracts for account of policyholders roll forwardAccount balances beginning of period 4,709 4,578 4,550 4,619 4,709 4,574 4,754 4,838 4,574 Deposits 59 56 55 55 225 55 53 53 161 Lapses and deaths (67) (69) (77) (61) (273) (71) (67) (65) (204) Other (124) (15) 91 (39) (87) 196 98 115 409 Total account balances end of period 4,578 4,550 4,619 4,574 4,574 4,754 4,838 4,940 4,940
Insurance and investment contracts for account of policyholders by fund typeFixed income 491 480 477 468 468 452 447 444 444 Equities 4,087 4,070 4,142 4,106 4,106 4,302 4,391 4,497 4,497 Total account balances end of period 4,578 4,550 4,619 4,574 4,574 4,754 4,838 4,940 4,940
Gross investment return to policyholder (1.02%) 1.32% 3.84% 0.70% 4.80% 5.87% 3.61% 3.80% 13.91%
DAC/VOBA/FSR's roll forwardBalance at beginning of period 7,033 7,072 7,086 7,257 7,033 7,506 7,938 7,928 7,506 Capitalized during the period 184 179 171 163 698 146 155 152 453 Amortized during the period (64) (89) (113) (150) (417) (102) (101) 31 (172) Shadow accounting adjustments (80) (76) 112 238 194 (2) (66) (54) (122) Other (1) (1) 1 (2) (3) 390 2 (8) 385 Balance at end of period 7,072 7,086 7,257 7,506 7,506 7,938 7,928 8,050 8,050
2016 2017
Unaudited
19
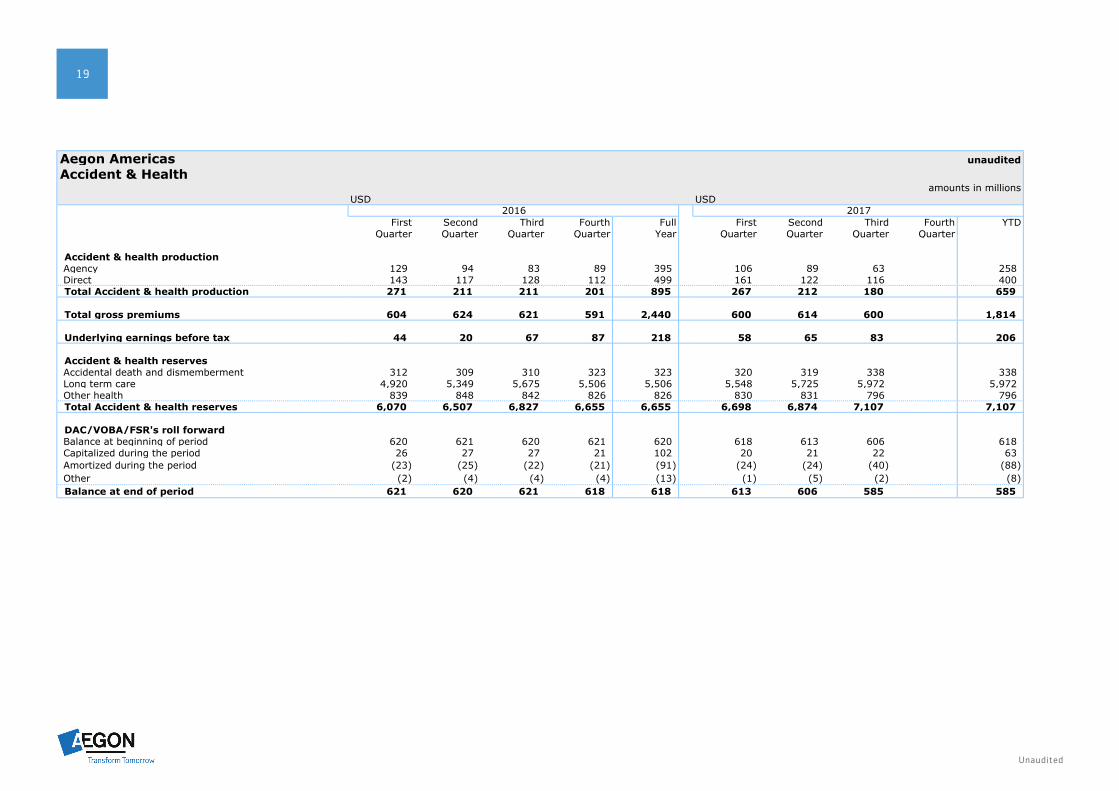
Aegon Americas unauditedAccident & Health
amounts in millionsUSD USD
First Second Third Fourth Full First Second Third Fourth YTDQuarter Quarter Quarter Quarter Year Quarter Quarter Quarter Quarter
Accident & health productionAgency 129 94 83 89 395 106 89 63 258 Direct 143 117 128 112 499 161 122 116 400 Total Accident & health production 271 211 211 201 895 267 212 180 659
Total gross premiums 604 624 621 591 2,440 600 614 600 1,814
Underlying earnings before tax 44 20 67 87 218 58 65 83 206
Accident & health reservesAccidental death and dismemberment 312 309 310 323 323 320 319 338 338 Long term care 4,920 5,349 5,675 5,506 5,506 5,548 5,725 5,972 5,972 Other health 839 848 842 826 826 830 831 796 796 Total Accident & health reserves 6,070 6,507 6,827 6,655 6,655 6,698 6,874 7,107 7,107
DAC/VOBA/FSR's roll forwardBalance at beginning of period 620 621 620 621 620 618 613 606 618 Capitalized during the period 26 27 27 21 102 20 21 22 63 Amortized during the period (23) (25) (22) (21) (91) (24) (24) (40) (88) Other (2) (4) (4) (4) (13) (1) (5) (2) (8) Balance at end of period 621 620 621 618 618 613 606 585 585
2016 2017
Unaudited
20Financial Supplement 3Q 2017
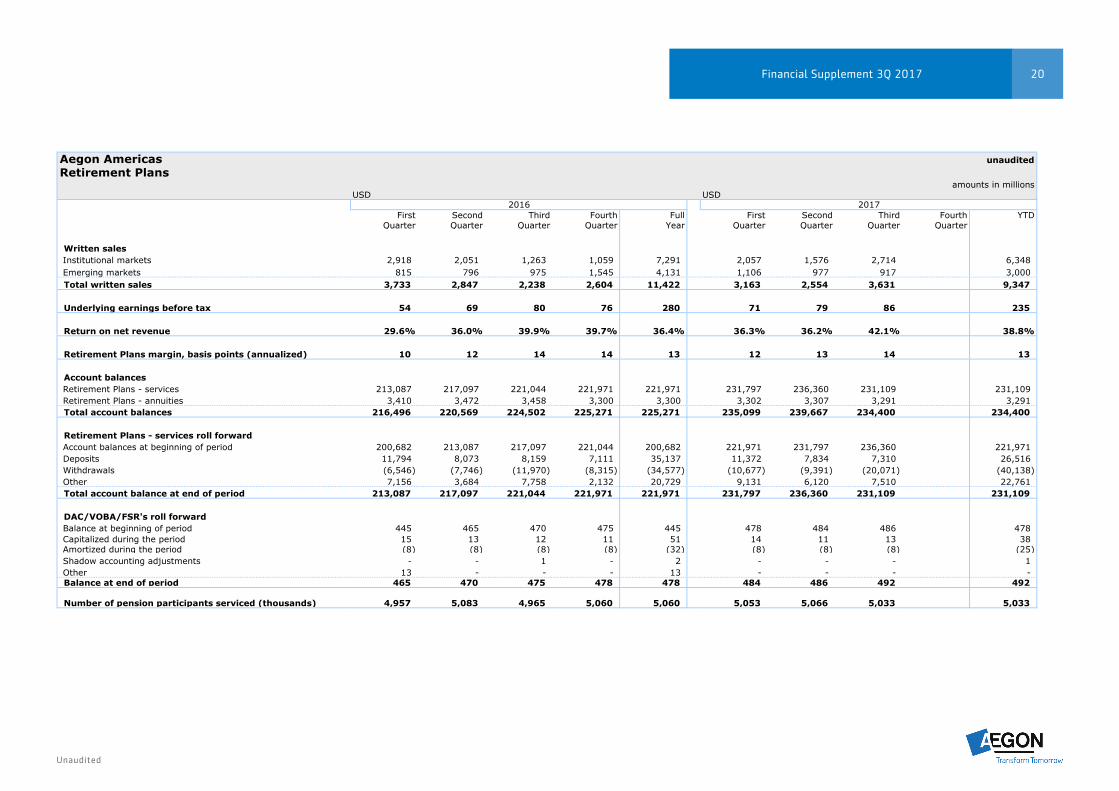
Aegon Americas unauditedRetirement Plans
amounts in millionsUSD USD
First Second Third Fourth Full First Second Third Fourth YTDQuarter Quarter Quarter Quarter Year Quarter Quarter Quarter Quarter
Written salesInstitutional markets 2,918 2,051 1,263 1,059 7,291 2,057 1,576 2,714 6,348 Emerging markets 815 796 975 1,545 4,131 1,106 977 917 3,000 Total written sales 3,733 2,847 2,238 2,604 11,422 3,163 2,554 3,631 9,347
Underlying earnings before tax 54 69 80 76 280 71 79 86 235
Return on net revenue 29.6% 36.0% 39.9% 39.7% 36.4% 36.3% 36.2% 42.1% 38.8%
Retirement Plans margin, basis points (annualized) 10 12 14 14 13 12 13 14 13
Account balancesRetirement Plans - services 213,087 217,097 221,044 221,971 221,971 231,797 236,360 231,109 231,109 Retirement Plans - annuities 3,410 3,472 3,458 3,300 3,300 3,302 3,307 3,291 3,291 Total account balances 216,496 220,569 224,502 225,271 225,271 235,099 239,667 234,400 234,400
Retirement Plans - services roll forwardAccount balances at beginning of period 200,682 213,087 217,097 221,044 200,682 221,971 231,797 236,360 221,971 Deposits 11,794 8,073 8,159 7,111 35,137 11,372 7,834 7,310 26,516 Withdrawals (6,546) (7,746) (11,970) (8,315) (34,577) (10,677) (9,391) (20,071) (40,138) Other 7,156 3,684 7,758 2,132 20,729 9,131 6,120 7,510 22,761 Total account balance at end of period 213,087 217,097 221,044 221,971 221,971 231,797 236,360 231,109 231,109
DAC/VOBA/FSR's roll forwardBalance at beginning of period 445 465 470 475 445 478 484 486 478 Capitalized during the period 15 13 12 11 51 14 11 13 38 Amortized during the period (8) (8) (8) (8) (32) (8) (8) (8) (25) Shadow accounting adjustments - - 1 - 2 - - - 1 Other 13 - - - 13 - - - - Balance at end of period 465 470 475 478 478 484 486 492 492
Number of pension participants serviced (thousands) 4,957 5,083 4,965 5,060 5,060 5,053 5,066 5,033 5,033
2016 2017
Unaudited
21
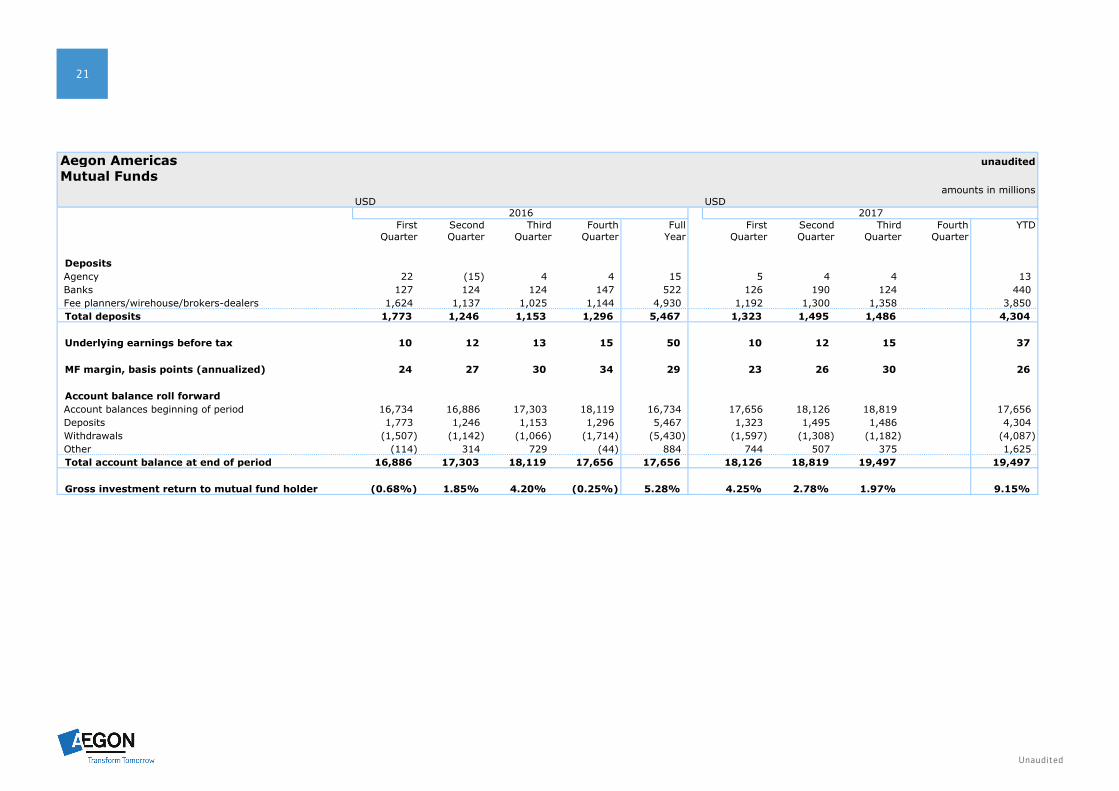
Aegon Americas unauditedMutual Funds
amounts in millionsUSD USD
First Second Third Fourth Full First Second Third Fourth YTDQuarter Quarter Quarter Quarter Year Quarter Quarter Quarter Quarter
DepositsAgency 22 (15) 4 4 15 5 4 4 13 Banks 127 124 124 147 522 126 190 124 440 Fee planners/wirehouse/brokers-dealers 1,624 1,137 1,025 1,144 4,930 1,192 1,300 1,358 3,850 Total deposits 1,773 1,246 1,153 1,296 5,467 1,323 1,495 1,486 4,304
Underlying earnings before tax 10 12 13 15 50 10 12 15 37
MF margin, basis points (annualized) 24 27 30 34 29 23 26 30 26
Account balance roll forwardAccount balances beginning of period 16,734 16,886 17,303 18,119 16,734 17,656 18,126 18,819 17,656 Deposits 1,773 1,246 1,153 1,296 5,467 1,323 1,495 1,486 4,304 Withdrawals (1,507) (1,142) (1,066) (1,714) (5,430) (1,597) (1,308) (1,182) (4,087) Other (114) 314 729 (44) 884 744 507 375 1,625 Total account balance at end of period 16,886 17,303 18,119 17,656 17,656 18,126 18,819 19,497 19,497
Gross investment return to mutual fund holder (0.68%) 1.85% 4.20% (0.25%) 5.28% 4.25% 2.78% 1.97% 9.15%
2016 2017
Unaudited
22Financial Supplement 3Q 2017
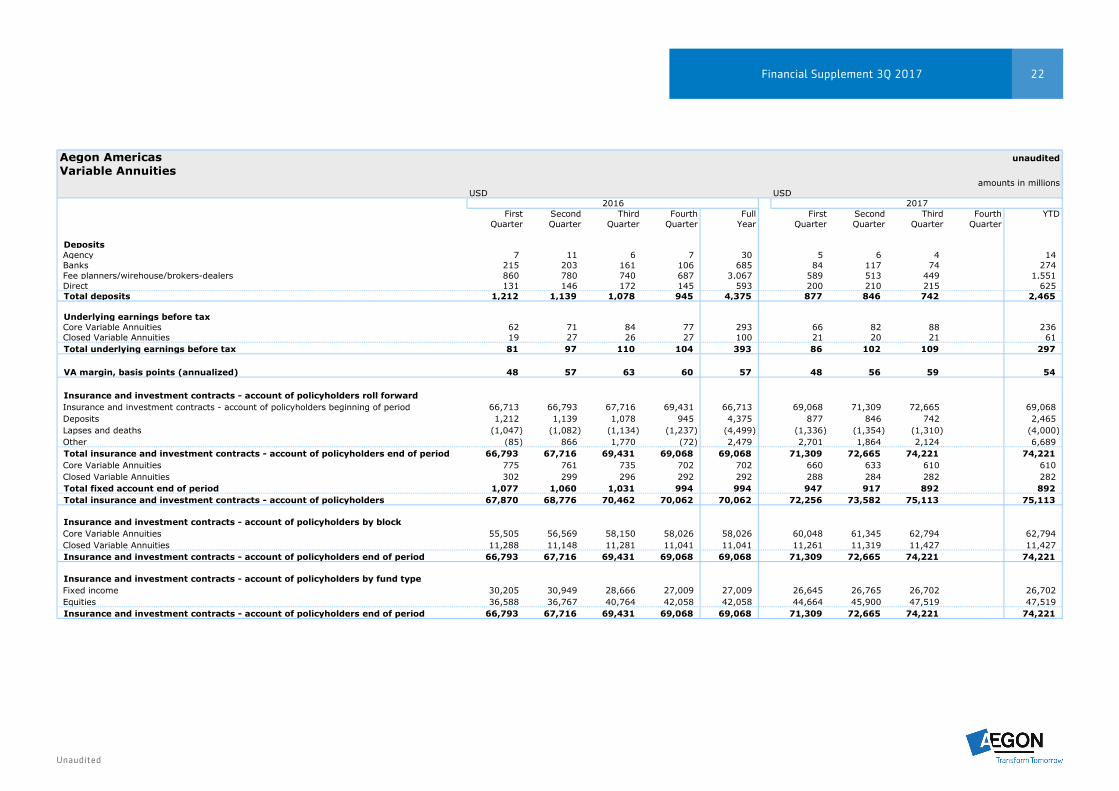
Aegon Americas unauditedVariable Annuities
amounts in millionsUSD USD
First Second Third Fourth Full First Second Third Fourth YTDQuarter Quarter Quarter Quarter Year Quarter Quarter Quarter Quarter
DepositsAgency 7 11 6 7 30 5 6 4 14 Banks 215 203 161 106 685 84 117 74 274 Fee planners/wirehouse/brokers-dealers 860 780 740 687 3,067 589 513 449 1,551 Direct 131 146 172 145 593 200 210 215 625 Total deposits 1,212 1,139 1,078 945 4,375 877 846 742 2,465
Underlying earnings before taxCore Variable Annuities 62 71 84 77 293 66 82 88 236 Closed Variable Annuities 19 27 26 27 100 21 20 21 61 Total underlying earnings before tax 81 97 110 104 393 86 102 109 297
VA margin, basis points (annualized) 48 57 63 60 57 48 56 59 54
Insurance and investment contracts - account of policyholders roll forwardInsurance and investment contracts - account of policyholders beginning of period 66,713 66,793 67,716 69,431 66,713 69,068 71,309 72,665 69,068 Deposits 1,212 1,139 1,078 945 4,375 877 846 742 2,465 Lapses and deaths (1,047) (1,082) (1,134) (1,237) (4,499) (1,336) (1,354) (1,310) (4,000) Other (85) 866 1,770 (72) 2,479 2,701 1,864 2,124 6,689 Total insurance and investment contracts - account of policyholders end of period 66,793 67,716 69,431 69,068 69,068 71,309 72,665 74,221 74,221 Core Variable Annuities 775 761 735 702 702 660 633 610 610 Closed Variable Annuities 302 299 296 292 292 288 284 282 282 Total fixed account end of period 1,077 1,060 1,031 994 994 947 917 892 892 Total insurance and investment contracts - account of policyholders 67,870 68,776 70,462 70,062 70,062 72,256 73,582 75,113 75,113
Insurance and investment contracts - account of policyholders by blockCore Variable Annuities 55,505 56,569 58,150 58,026 58,026 60,048 61,345 62,794 62,794 Closed Variable Annuities 11,288 11,148 11,281 11,041 11,041 11,261 11,319 11,427 11,427 Insurance and investment contracts - account of policyholders end of period 66,793 67,716 69,431 69,068 69,068 71,309 72,665 74,221 74,221
Insurance and investment contracts - account of policyholders by fund typeFixed income 30,205 30,949 28,666 27,009 27,009 26,645 26,765 26,702 26,702 Equities 36,588 36,767 40,764 42,058 42,058 44,664 45,900 47,519 47,519 Insurance and investment contracts - account of policyholders end of period 66,793 67,716 69,431 69,068 69,068 71,309 72,665 74,221 74,221
2016 2017
Unaudited
23
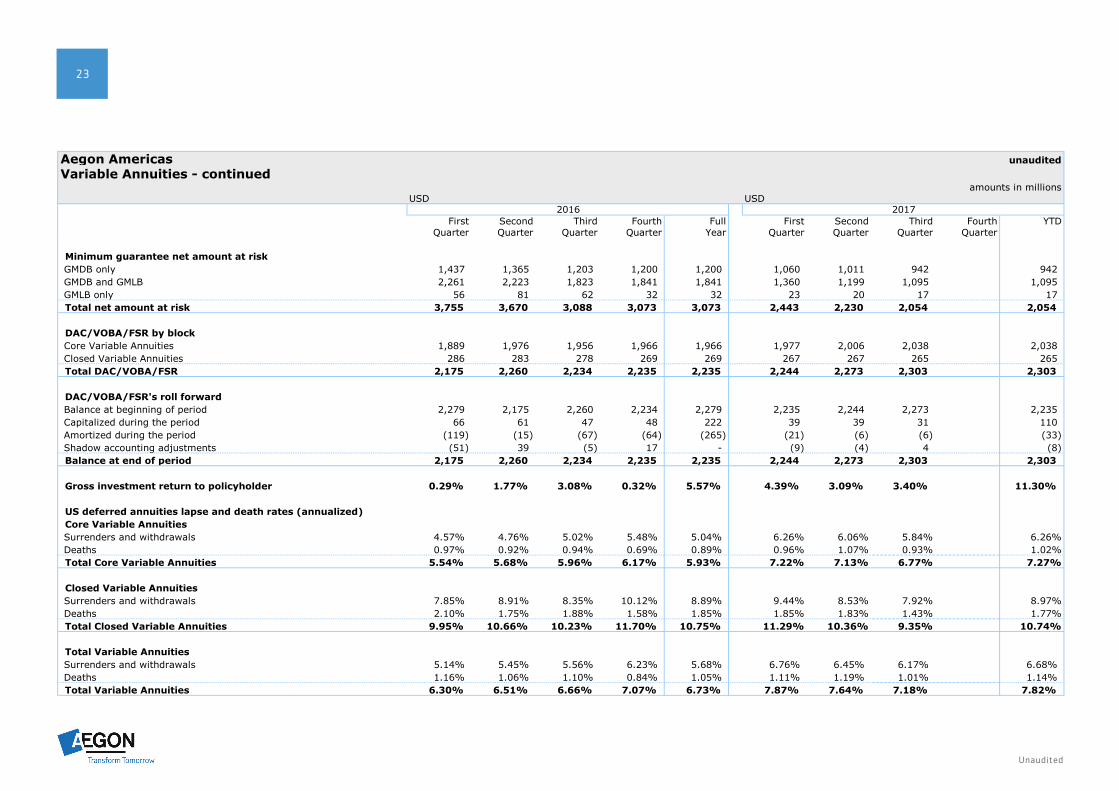
Aegon Americas unauditedVariable Annuities - continued
amounts in millionsUSD USD
First Second Third Fourth Full First Second Third Fourth YTDQuarter Quarter Quarter Quarter Year Quarter Quarter Quarter Quarter
Minimum guarantee net amount at riskGMDB only 1,437 1,365 1,203 1,200 1,200 1,060 1,011 942 942 GMDB and GMLB 2,261 2,223 1,823 1,841 1,841 1,360 1,199 1,095 1,095 GMLB only 56 81 62 32 32 23 20 17 17 Total net amount at risk 3,755 3,670 3,088 3,073 3,073 2,443 2,230 2,054 2,054
DAC/VOBA/FSR by blockCore Variable Annuities 1,889 1,976 1,956 1,966 1,966 1,977 2,006 2,038 2,038 Closed Variable Annuities 286 283 278 269 269 267 267 265 265 Total DAC/VOBA/FSR 2,175 2,260 2,234 2,235 2,235 2,244 2,273 2,303 2,303
DAC/VOBA/FSR's roll forwardBalance at beginning of period 2,279 2,175 2,260 2,234 2,279 2,235 2,244 2,273 2,235 Capitalized during the period 66 61 47 48 222 39 39 31 110 Amortized during the period (119) (15) (67) (64) (265) (21) (6) (6) (33) Shadow accounting adjustments (51) 39 (5) 17 - (9) (4) 4 (8) Balance at end of period 2,175 2,260 2,234 2,235 2,235 2,244 2,273 2,303 2,303
Gross investment return to policyholder 0.29% 1.77% 3.08% 0.32% 5.57% 4.39% 3.09% 3.40% 11.30%
US deferred annuities lapse and death rates (annualized)Core Variable AnnuitiesSurrenders and withdrawals 4.57% 4.76% 5.02% 5.48% 5.04% 6.26% 6.06% 5.84% 6.26%Deaths 0.97% 0.92% 0.94% 0.69% 0.89% 0.96% 1.07% 0.93% 1.02%Total Core Variable Annuities 5.54% 5.68% 5.96% 6.17% 5.93% 7.22% 7.13% 6.77% 7.27%
Closed Variable AnnuitiesSurrenders and withdrawals 7.85% 8.91% 8.35% 10.12% 8.89% 9.44% 8.53% 7.92% 8.97%Deaths 2.10% 1.75% 1.88% 1.58% 1.85% 1.85% 1.83% 1.43% 1.77%Total Closed Variable Annuities 9.95% 10.66% 10.23% 11.70% 10.75% 11.29% 10.36% 9.35% 10.74%
Total Variable AnnuitiesSurrenders and withdrawals 5.14% 5.45% 5.56% 6.23% 5.68% 6.76% 6.45% 6.17% 6.68% Deaths 1.16% 1.06% 1.10% 0.84% 1.05% 1.11% 1.19% 1.01% 1.14% Total Variable Annuities 6.30% 6.51% 6.66% 7.07% 6.73% 7.87% 7.64% 7.18% 7.82%
2016 2017

Unaudited
24Financial Supplement 3Q 2017
Aegon Americas unauditedFixed Annuities
amounts in millionsUSD USD
First Second Third Fourth Full First Second Third Fourth YTDQuarter Quarter Quarter Quarter Year Quarter Quarter Quarter Quarter
Underlying earnings before tax 52 45 40 34 172 49 44 38 130
US retail deferred annuities yield and spread information (annualized)Average yield on investments 3.92% 4.41% 4.67% 4.18% 4.29% 4.45% 4.15% 4.28% 4.32% Average crediting rate 2.90% 2.94% 2.91% 2.94% 2.93% 2.96% 2.92% 2.93% 2.93% Average crediting rate on new business 1.50% 1.25% 1.44% 1.38% 1.45% 1.43% 1.31% 1.25% 1.35% Average gross spread 1.02% 1.47% 1.76% 1.24% 1.36% 1.49% 1.23% 1.35% 1.39% Average underlying gross spread 1.57% 1.60% 1.53% 1.33% 1.51% 1.48% 1.37% 1.29% 1.39% Average gross guaranteed rate 2.67% 2.68% 2.68% 2.70% 2.70% 2.72% 2.73% 2.75% 2.75%
US retail deferred annuities lapse and death rates (annualized)Surrenders and withdrawals 8.84% 7.80% 7.50% 8.31% 8.18% 8.97% 8.96% 7.51% 8.53% Deaths 3.46% 3.83% 2.63% 2.73% 3.19% 3.71% 3.23% 3.04% 3.34% Total 12.30% 11.63% 10.13% 11.04% 11.37% 12.68% 12.19% 10.55% 11.87%
DepositsAgency 9 8 12 11 40 12 10 8 31 Banks 58 53 59 44 215 78 72 63 213 Fixed annuity deposits 67 61 71 55 254 90 83 71 244
Account balance roll forwardGeneral account annuities beginning of period 13,068 12,786 12,546 12,338 13,068 12,120 11,921 11,711 12,120 Deposits 66 62 71 55 254 77 69 64 210 Lapses and deaths (421) (390) (345) (363) (1,519) (397) (379) (330) (1,106) Interest credited 86 94 97 86 362 94 92 90 276 Other (13) (6) (30) 5 (45) 26 9 (14) 21 Total general account annuities end of period 12,786 12,546 12,338 12,120 12,120 11,921 11,711 11,521 11,521 Fixed account of variable annuities (1,077) (1,060) (1,031) (994) (994) (947) (917) (892) (892) Total Fixed Annuity balances 11,709 11,486 11,307 11,127 11,127 10,973 10,794 10,629 10,629
DAC/VOBA/FSR's roll forwardBalance at beginning of period 97 85 (18) (89) 97 37 28 25 37 Capitalized during the period - - - 1 1 - - - 1 Amortized during the period - (3) (3) (5) (11) (6) - (1) (7) Shadow accounting adjustments (12) (99) (69) 130 (49) (3) (3) (1) (7) Balance at end of period 85 (18) (89) 37 37 28 25 24 24
2016 2017
Unaudited
25
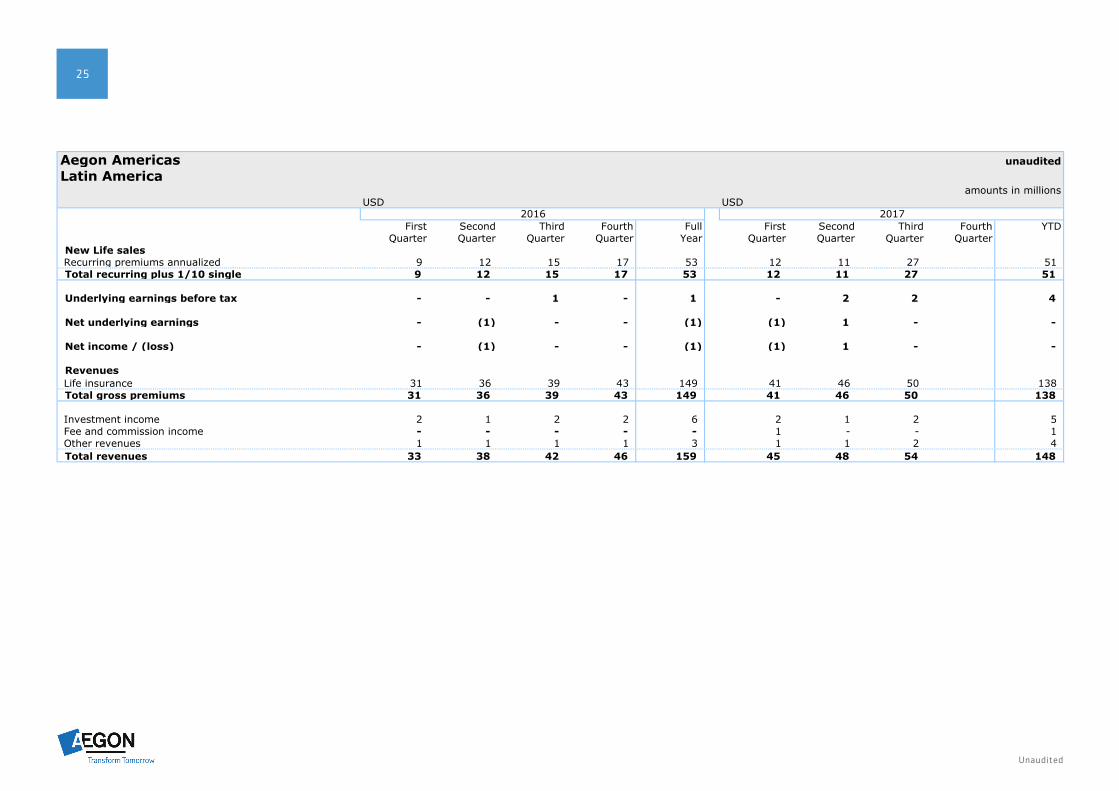
Aegon Americas unauditedLatin America
amounts in millionsUSD USD
First Second Third Fourth Full First Second Third Fourth YTDQuarter Quarter Quarter Quarter Year Quarter Quarter Quarter Quarter
New Life salesRecurring premiums annualized 9 12 15 17 53 12 11 27 51 Total recurring plus 1/10 single 9 12 15 17 53 12 11 27 51
Underlying earnings before tax - - 1 - 1 - 2 2 4
Net underlying earnings - (1) - - (1) (1) 1 - -
Net income / (loss) - (1) - - (1) (1) 1 - -
RevenuesLife insurance 31 36 39 43 149 41 46 50 138 Total gross premiums 31 36 39 43 149 41 46 50 138
Investment income 2 1 2 2 6 2 1 2 5 Fee and commission income - - - - - 1 - - 1 Other revenues 1 1 1 1 3 1 1 2 4 Total revenues 33 38 42 46 159 45 48 54 148
2016 2017
Unaudited
26Financial Supplement 3Q 2017
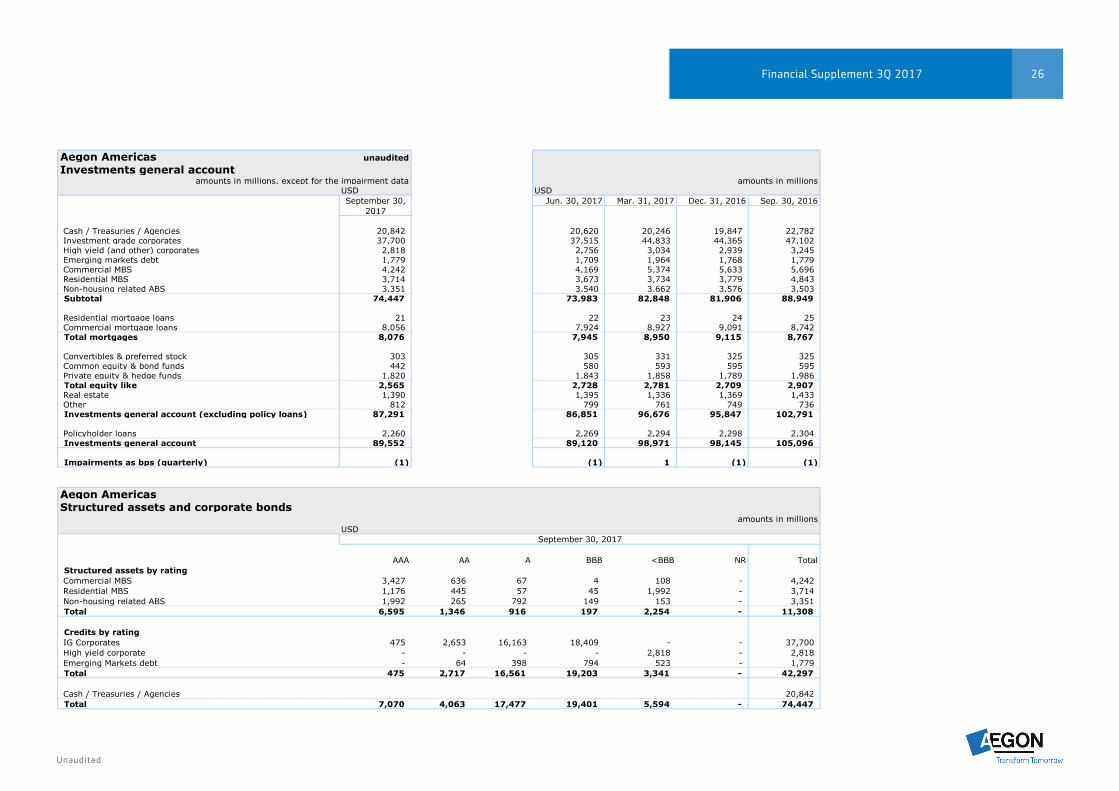
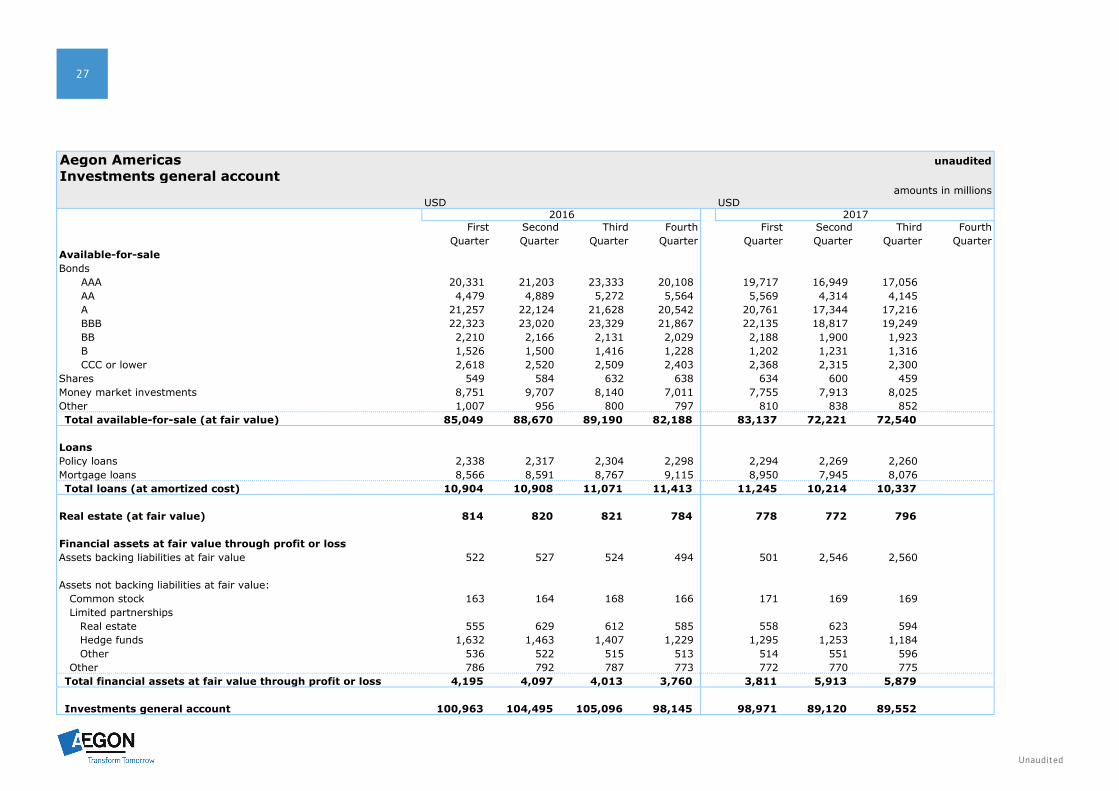
Aegon Americas unauditedInvestments general account
amounts in millions, except for the impairment data amounts in millionsUSD USDSeptember 30, Jun. 30, 2017 Mar. 31, 2017 Dec. 31, 2016 Sep. 30, 2016
2017
Cash / Treasuries / Agencies 20,842 20,620 20,246 19,847 22,782 Investment grade corporates 37,700 37,515 44,833 44,365 47,102 High yield (and other) corporates 2,818 2,756 3,034 2,939 3,245 Emerging markets debt 1,779 1,709 1,964 1,768 1,779 Commercial MBS 4,242 4,169 5,374 5,633 5,696 Residential MBS 3,714 3,673 3,734 3,779 4,843 Non-housing related ABS 3,351 3,540 3,662 3,576 3,503 Subtotal 74,447 73,983 82,848 81,906 88,949
Residential mortgage loans 21 22 23 24 25 Commercial mortgage loans 8,056 7,924 8,927 9,091 8,742 Total mortgages 8,076 7,945 8,950 9,115 8,767
Convertibles & preferred stock 303 305 331 325 325 Common equity & bond funds 442 580 593 595 595 Private equity & hedge funds 1,820 1,843 1,858 1,789 1,986 Total equity like 2,565 2,728 2,781 2,709 2,907 Real estate 1,390 1,395 1,336 1,369 1,433 Other 812 799 761 749 736 Investments general account (excluding policy loans) 87,291 86,851 96,676 95,847 102,791
Policyholder loans 2,260 2,269 2,294 2,298 2,304 Investments general account 89,552 89,120 98,971 98,145 105,096
Impairments as bps (quarterly) (1) (1) 1 (1) (1)
Aegon AmericasStructured assets and corporate bonds
amounts in millionsUSD
AAA AA A BBB <BBB NR TotalStructured assets by ratingCommercial MBS 3,427 636 67 4 108 - 4,242 Residential MBS 1,176 445 57 45 1,992 - 3,714 Non-housing related ABS 1,992 265 792 149 153 - 3,351 Total 6,595 1,346 916 197 2,254 - 11,308
Credits by ratingIG Corporates 475 2,653 16,163 18,409 - - 37,700 High yield corporate - - - - 2,818 - 2,818 Emerging Markets debt - 64 398 794 523 - 1,779 Total 475 2,717 16,561 19,203 3,341 - 42,297
Cash / Treasuries / Agencies 20,842 Total 7,070 4,063 17,477 19,401 5,594 - 74,447
September 30, 2017
Unaudited
27
Aegon Americas unauditedInvestments general account
amounts in millionsUSD USD
First Second Third Fourth First Second Third FourthQuarter Quarter Quarter Quarter Quarter Quarter Quarter Quarter
Available-for-saleBonds
AAA 20,331 21,203 23,333 20,108 19,717 16,949 17,056 AA 4,479 4,889 5,272 5,564 5,569 4,314 4,145 A 21,257 22,124 21,628 20,542 20,761 17,344 17,216 BBB 22,323 23,020 23,329 21,867 22,135 18,817 19,249 BB 2,210 2,166 2,131 2,029 2,188 1,900 1,923 B 1,526 1,500 1,416 1,228 1,202 1,231 1,316 CCC or lower 2,618 2,520 2,509 2,403 2,368 2,315 2,300
Shares 549 584 632 638 634 600 459 Money market investments 8,751 9,707 8,140 7,011 7,755 7,913 8,025 Other 1,007 956 800 797 810 838 852 Total available-for-sale (at fair value) 85,049 88,670 89,190 82,188 83,137 72,221 72,540
LoansPolicy loans 2,338 2,317 2,304 2,298 2,294 2,269 2,260 Mortgage loans 8,566 8,591 8,767 9,115 8,950 7,945 8,076 Total loans (at amortized cost) 10,904 10,908 11,071 11,413 11,245 10,214 10,337
Real estate (at fair value) 814 820 821 784 778 772 796
Financial assets at fair value through profit or lossAssets backing liabilities at fair value 522 527 524 494 501 2,546 2,560
Assets not backing liabilities at fair value: Common stock 163 164 168 166 171 169 169 Limited partnerships Real estate 555 629 612 585 558 623 594 Hedge funds 1,632 1,463 1,407 1,229 1,295 1,253 1,184 Other 536 522 515 513 514 551 596 Other 786 792 787 773 772 770 775 Total financial assets at fair value through profit or loss 4,195 4,097 4,013 3,760 3,811 5,913 5,879
Investments general account 100,963 104,495 105,096 98,145 98,971 89,120 89,552
2016 2017
Unaudited
28Financial Supplement 3Q 2017
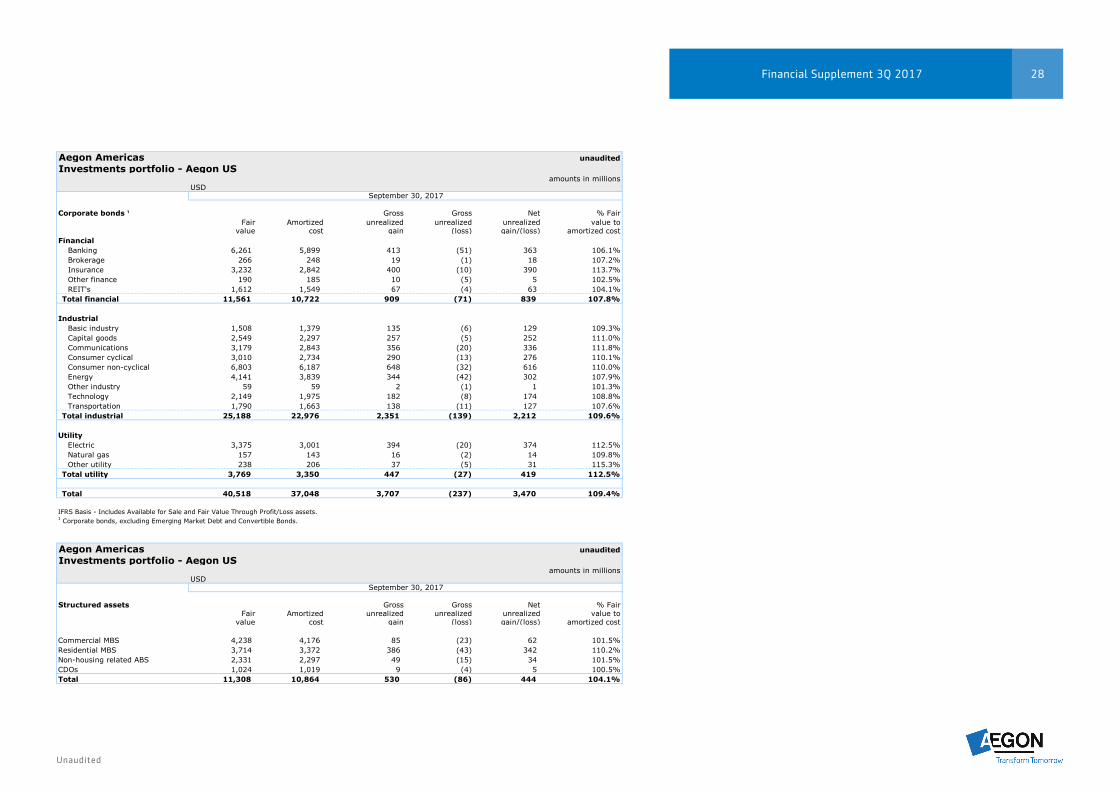
Aegon Americas unauditedInvestments portfolio - Aegon US
amounts in millionsUSD
Corporate bonds ¹ Gross Gross Net % FairFair Amortized unrealized unrealized unrealized value to
value cost gain (loss) gain/(loss) amortized costFinancial
Banking 6,261 5,899 413 (51) 363 106.1%Brokerage 266 248 19 (1) 18 107.2%Insurance 3,232 2,842 400 (10) 390 113.7%Other finance 190 185 10 (5) 5 102.5%REIT's 1,612 1,549 67 (4) 63 104.1%
Total financial 11,561 10,722 909 (71) 839 107.8%
IndustrialBasic industry 1,508 1,379 135 (6) 129 109.3%Capital goods 2,549 2,297 257 (5) 252 111.0%Communications 3,179 2,843 356 (20) 336 111.8%Consumer cyclical 3,010 2,734 290 (13) 276 110.1%Consumer non-cyclical 6,803 6,187 648 (32) 616 110.0%Energy 4,141 3,839 344 (42) 302 107.9%Other industry 59 59 2 (1) 1 101.3%Technology 2,149 1,975 182 (8) 174 108.8%Transportation 1,790 1,663 138 (11) 127 107.6%
Total industrial 25,188 22,976 2,351 (139) 2,212 109.6%
UtilityElectric 3,375 3,001 394 (20) 374 112.5%Natural gas 157 143 16 (2) 14 109.8%Other utility 238 206 37 (5) 31 115.3%
Total utility 3,769 3,350 447 (27) 419 112.5%
Total 40,518 37,048 3,707 (237) 3,470 109.4%
IFRS Basis - Includes Available for Sale and Fair Value Through Profit/Loss assets.1 Corporate bonds, excluding Emerging Market Debt and Convertible Bonds.
Aegon Americas unauditedInvestments portfolio - Aegon US
amounts in millionsUSD
Structured assets Gross Gross Net % FairFair Amortized unrealized unrealized unrealized value to
value cost gain (loss) gain/(loss) amortized cost
Commercial MBS 4,238 4,176 85 (23) 62 101.5%Residential MBS 3,714 3,372 386 (43) 342 110.2%Non-housing related ABS 2,331 2,297 49 (15) 34 101.5%CDOs 1,024 1,019 9 (4) 5 100.5%Total 11,308 10,864 530 (86) 444 104.1%
September 30, 2017
September 30, 2017
Unaudited
29
Reporting structure
EuropeUnited Kingdom
The Netherlands
Central & Eastern Europe
Spain & Portugal

Unaudited
30Financial Supplement 3Q 2017
Europe unauditedEarnings & sales
amounts in millionsEUR EUR
First Second Third Fourth Full First Second Third Fourth YTDQuarter Quarter Quarter Quarter Year Quarter Quarter Quarter Quarter
Underlying earnings before taxThe Netherlands 128 138 133 134 534 118 136 132 385 United Kingdom 23 7 5 23 59 33 35 25 93 Central & Eastern Europe 15 14 12 14 55 17 19 16 53 Spain & Portugal 3 - 1 3 8 1 5 4 10 Underlying earnings before tax 169 160 151 174 655 169 195 177 541
Underlying earnings before tax by line of businessLife 103 85 99 91 378 97 104 99 300 Pensions 51 62 43 60 216 53 63 60 176 Non-life 6 5 3 21 34 12 23 15 50 Other 9 9 7 3 27 7 4 3 15 Underlying earnings before tax 169 160 151 174 655 169 195 177 541
Fair value items (71) (190) 49 171 (41) (56) (165) 7 (213) Realized gains/(losses) on investments 17 223 49 52 342 67 89 41 197 Net impairments 1 (4) (6) (1) (10) (5) (3) (2) (9) Other income/(charges) 1 (701) 52 (9) (658) 8 64 98 170 Income before tax 116 (512) 296 387 288 183 180 322 685 Income tax (17) 6 (68) (81) (161) (53) (45) (77) (175) Net income / (loss) 99 (506) 228 306 127 131 135 245 510
Net underlying earnings 138 117 132 161 548 127 152 137 416
RevenuesLife insurance 3,020 3,021 3,152 3,299 12,493 2,737 3,098 2,788 8,623 Accident & health insurance 204 39 40 37 320 200 40 43 283 General insurance 184 137 112 103 536 118 119 113 350 Total gross premiums 3,408 3,197 3,304 3,439 13,348 3,055 3,257 2,944 9,256
Investment income 974 1,127 875 910 3,886 840 1,114 841 2,796 Fee and commission income 121 123 119 131 495 161 162 155 479 Other revenues 1 1 - 1 2 - 3 - 3 Total revenues 4,504 4,448 4,299 4,482 17,732 4,057 4,536 3,940 12,533
SalesNew life sales 85 75 64 75 299 67 65 63 195 New premiums accident & health insurance 10 9 5 11 34 17 6 5 28 New premiums general insurance 24 27 20 23 94 27 30 23 80 1/10 of Gross deposits 344 309 277 347 1,277 1,005 1,201 960 3,167 Total sales 463 419 366 457 1,705 1,116 1,301 1,052 3,470
Market consistent value of new businessMCVNB 56 39 14 30 140 37 31 28 95 MCVNB / PVNBP (%) 1.3% 1.2% 0.4% 0.4% 0.9% 1.0% 0.8% 0.8% 0.9%
2016 2017
Unaudited
31
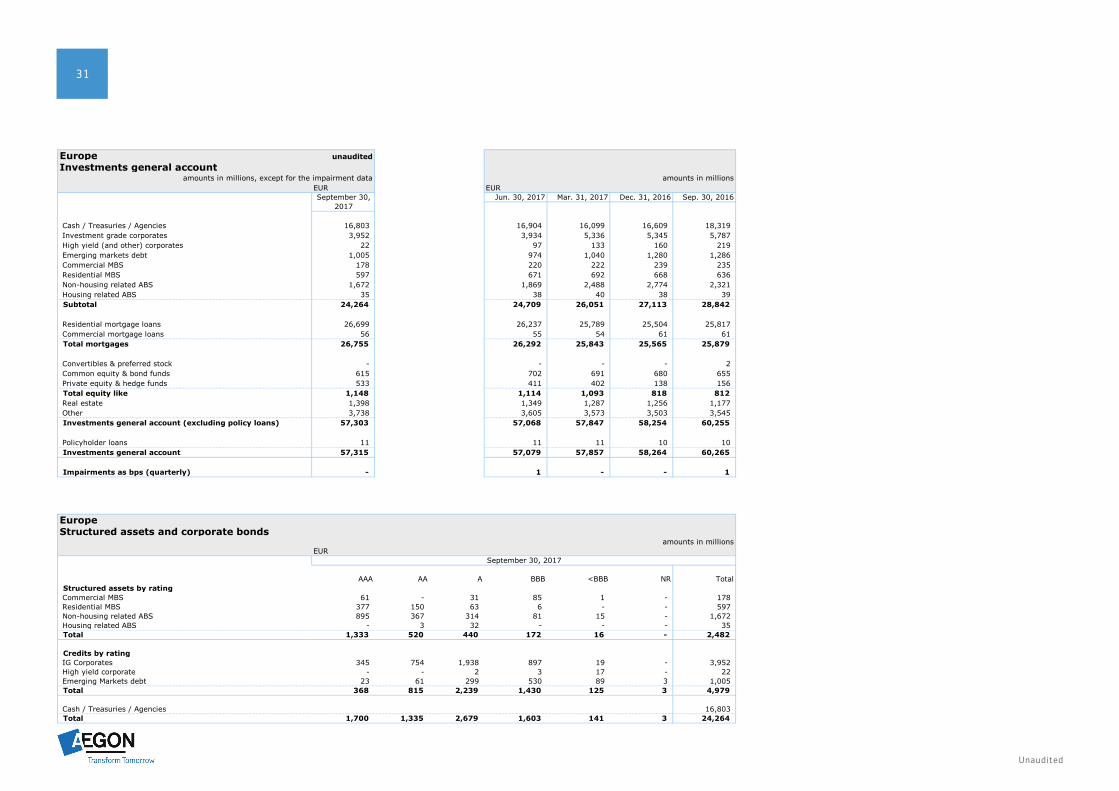
Europe unauditedInvestments general account
amounts in millions, except for the impairment data amounts in millionsEUR EURSeptember 30, Jun. 30, 2017 Mar. 31, 2017 Dec. 31, 2016 Sep. 30, 2016
2017
Cash / Treasuries / Agencies 16,803 16,904 16,099 16,609 18,319 Investment grade corporates 3,952 3,934 5,336 5,345 5,787 High yield (and other) corporates 22 97 133 160 219 Emerging markets debt 1,005 974 1,040 1,280 1,286 Commercial MBS 178 220 222 239 235 Residential MBS 597 671 692 668 636 Non-housing related ABS 1,672 1,869 2,488 2,774 2,321 Housing related ABS 35 38 40 38 39 Subtotal 24,264 24,709 26,051 27,113 28,842
Residential mortgage loans 26,699 26,237 25,789 25,504 25,817 Commercial mortgage loans 56 55 54 61 61 Total mortgages 26,755 26,292 25,843 25,565 25,879
Convertibles & preferred stock - - - - 2 Common equity & bond funds 615 702 691 680 655 Private equity & hedge funds 533 411 402 138 156 Total equity like 1,148 1,114 1,093 818 812 Real estate 1,398 1,349 1,287 1,256 1,177 Other 3,738 3,605 3,573 3,503 3,545 Investments general account (excluding policy loans) 57,303 57,068 57,847 58,254 60,255
Policyholder loans 11 11 11 10 10 Investments general account 57,315 57,079 57,857 58,264 60,265
Impairments as bps (quarterly) - 1 - - 1
EuropeStructured assets and corporate bonds
amounts in millionsEUR
AAA AA A BBB <BBB NR TotalStructured assets by ratingCommercial MBS 61 - 31 85 1 - 178 Residential MBS 377 150 63 6 - - 597 Non-housing related ABS 895 367 314 81 15 - 1,672 Housing related ABS - 3 32 - - - 35 Total 1,333 520 440 172 16 - 2,482
Credits by ratingIG Corporates 345 754 1,938 897 19 - 3,952 High yield corporate - - 2 3 17 - 22 Emerging Markets debt 23 61 299 530 89 3 1,005 Total 368 815 2,239 1,430 125 3 4,979
Cash / Treasuries / Agencies 16,803 Total 1,700 1,335 2,679 1,603 141 3 24,264
September 30, 2017

Unaudited
32Financial Supplement 3Q 2017
Aegon the Netherlands unauditedEarnings & sales
amounts in millionsEUR EUR
First Second Third Fourth Full First Second Third Fourth YTDQuarter Quarter Quarter Quarter Year Quarter Quarter Quarter Quarter
Underlying earnings before tax by line of businessLife & savings 79 74 85 71 309 78 74 71 223 Pensions 47 59 42 48 197 32 45 48 124 Non-life (6) (4) (1) 12 1 1 13 10 23 Distribution 9 9 7 3 27 7 4 3 15 Underlying earnings before tax 128 138 133 134 534 118 136 132 385
Fair value items (105) (185) 54 202 (33) (35) (138) 25 (149) Realized gains/(losses) on investments 18 93 31 47 189 62 85 16 163 Net impairments (1) (4) (6) - (12) (4) (1) (2) (7) Other income/(charges) - (20) 30 34 44 - (8) 98 90 Income before tax 40 22 241 418 721 141 74 268 483 Income tax (7) (4) (53) (91) (155) (30) (15) (62) (107) Net income / (loss) 33 19 188 326 566 111 59 206 376
Net underlying earnings 100 108 102 105 414 91 106 101 298
RevenuesLife insurance 858 358 398 400 2,015 693 359 364 1,416 Accident & health insurance 121 30 31 29 210 110 30 35 175 General insurance 115 69 46 36 266 40 37 35 112 Total gross premiums 1,094 458 475 465 2,491 843 427 434 1,704
Investment income 522 551 575 487 2,135 548 569 531 1,648 Fee and commission income 86 89 87 88 350 87 88 85 260 Total revenues 1,702 1,098 1,136 1,040 4,976 1,477 1,084 1,051 3,612
SalesNew life sales 38 23 21 28 111 28 21 21 70 New premiums accident & health insurance 4 6 2 2 14 11 3 2 15 New premiums general insurance 7 6 4 4 21 5 4 3 13 1/10 of Gross deposits 186 151 142 190 669 202 188 183 573 Total sales 236 186 169 225 815 246 216 208 670
Market consistent value of new businessMCVNB 29 13 15 27 84 21 9 11 41 MCVNB / PVNBP (%) 1.5% 1.0% 0.9% 0.9% 1.2% 1.5% 0.7% 0.7% 0.9%
2016 2017
Unaudited
33
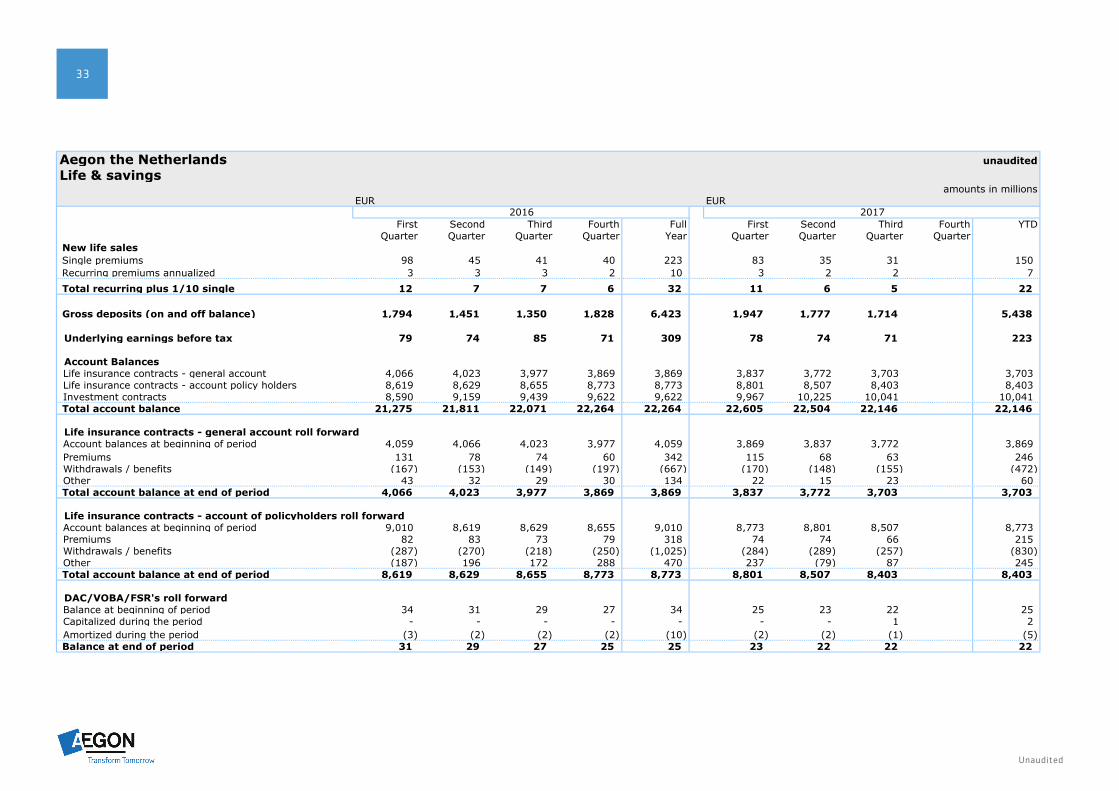
Aegon the Netherlands unauditedLife & savings
amounts in millionsEUR EUR
First Second Third Fourth Full First Second Third Fourth YTDQuarter Quarter Quarter Quarter Year Quarter Quarter Quarter Quarter
New life sales Single premiums 98 45 41 40 223 83 35 31 150 Recurring premiums annualized 3 3 3 2 10 3 2 2 7 Total recurring plus 1/10 single 12 7 7 6 32 11 6 5 22
Gross deposits (on and off balance) 1,794 1,451 1,350 1,828 6,423 1,947 1,777 1,714 5,438
Underlying earnings before tax 79 74 85 71 309 78 74 71 223
Account BalancesLife insurance contracts - general account 4,066 4,023 3,977 3,869 3,869 3,837 3,772 3,703 3,703 Life insurance contracts - account policy holders 8,619 8,629 8,655 8,773 8,773 8,801 8,507 8,403 8,403 Investment contracts 8,590 9,159 9,439 9,622 9,622 9,967 10,225 10,041 10,041
Total account balance 21,275 21,811 22,071 22,264 22,264 22,605 22,504 22,146 22,146
Life insurance contracts - general account roll forwardAccount balances at beginning of period 4,059 4,066 4,023 3,977 4,059 3,869 3,837 3,772 3,869 Premiums 131 78 74 60 342 115 68 63 246 Withdrawals / benefits (167) (153) (149) (197) (667) (170) (148) (155) (472) Other 43 32 29 30 134 22 15 23 60
Total account balance at end of period 4,066 4,023 3,977 3,869 3,869 3,837 3,772 3,703 3,703
Life insurance contracts - account of policyholders roll forwardAccount balances at beginning of period 9,010 8,619 8,629 8,655 9,010 8,773 8,801 8,507 8,773 Premiums 82 83 73 79 318 74 74 66 215 Withdrawals / benefits (287) (270) (218) (250) (1,025) (284) (289) (257) (830) Other (187) 196 172 288 470 237 (79) 87 245
Total account balance at end of period 8,619 8,629 8,655 8,773 8,773 8,801 8,507 8,403 8,403
DAC/VOBA/FSR's roll forwardBalance at beginning of period 34 31 29 27 34 25 23 22 25 Capitalized during the period - - - - - - - 1 2 Amortized during the period (3) (2) (2) (2) (10) (2) (2) (1) (5)
Balance at end of period 31 29 27 25 25 23 22 22 22
2016 2017
Unaudited
34Financial Supplement 3Q 2017
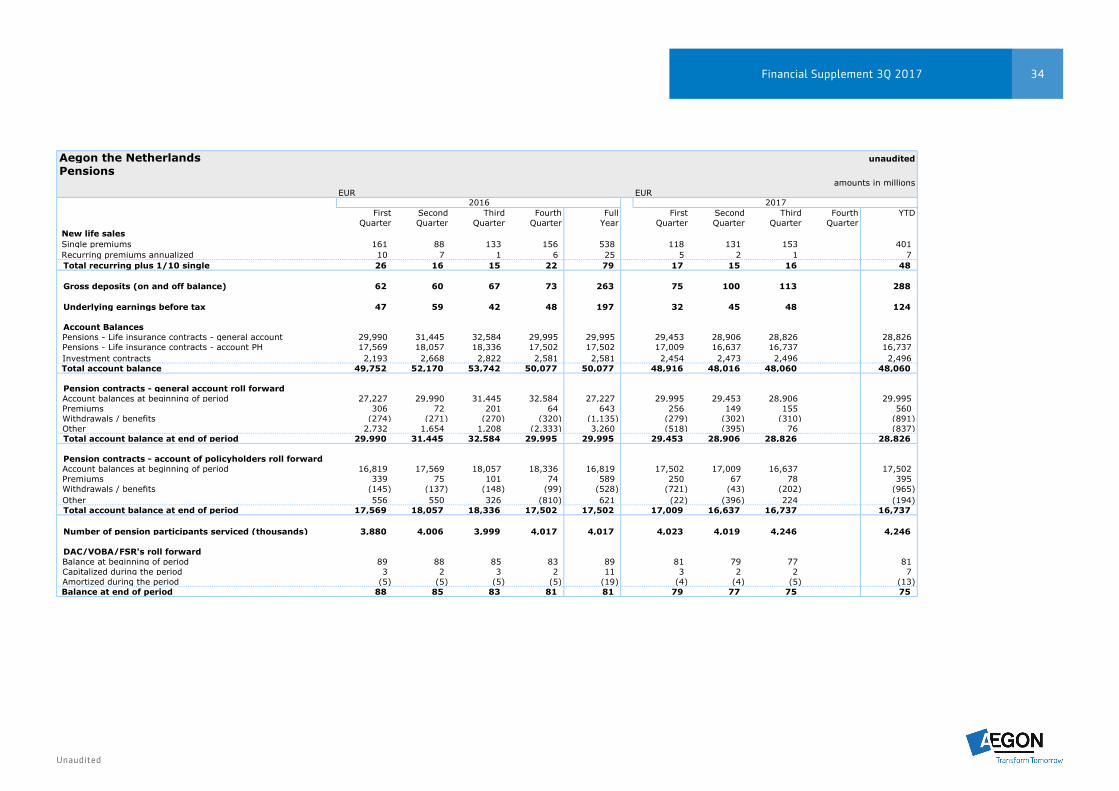
Aegon the Netherlands unauditedPensions
amounts in millionsEUR EUR
First Second Third Fourth Full First Second Third Fourth YTDQuarter Quarter Quarter Quarter Year Quarter Quarter Quarter Quarter
New life sales Single premiums 161 88 133 156 538 118 131 153 401 Recurring premiums annualized 10 7 1 6 25 5 2 1 7 Total recurring plus 1/10 single 26 16 15 22 79 17 15 16 48
Gross deposits (on and off balance) 62 60 67 73 263 75 100 113 288
Underlying earnings before tax 47 59 42 48 197 32 45 48 124
Account BalancesPensions - Life insurance contracts - general account 29,990 31,445 32,584 29,995 29,995 29,453 28,906 28,826 28,826 Pensions - Life insurance contracts - account PH 17,569 18,057 18,336 17,502 17,502 17,009 16,637 16,737 16,737 Investment contracts 2,193 2,668 2,822 2,581 2,581 2,454 2,473 2,496 2,496
Total account balance 49,752 52,170 53,742 50,077 50,077 48,916 48,016 48,060 48,060
Pension contracts - general account roll forwardAccount balances at beginning of period 27,227 29,990 31,445 32,584 27,227 29,995 29,453 28,906 29,995 Premiums 306 72 201 64 643 256 149 155 560 Withdrawals / benefits (274) (271) (270) (320) (1,135) (279) (302) (310) (891) Other 2,732 1,654 1,208 (2,333) 3,260 (518) (395) 76 (837) Total account balance at end of period 29,990 31,445 32,584 29,995 29,995 29,453 28,906 28,826 28,826
Pension contracts - account of policyholders roll forwardAccount balances at beginning of period 16,819 17,569 18,057 18,336 16,819 17,502 17,009 16,637 17,502 Premiums 339 75 101 74 589 250 67 78 395 Withdrawals / benefits (145) (137) (148) (99) (528) (721) (43) (202) (965) Other 556 550 326 (810) 621 (22) (396) 224 (194) Total account balance at end of period 17,569 18,057 18,336 17,502 17,502 17,009 16,637 16,737 16,737
Number of pension participants serviced (thousands) 3,880 4,006 3,999 4,017 4,017 4,023 4,019 4,246 4,246
DAC/VOBA/FSR's roll forwardBalance at beginning of period 89 88 85 83 89 81 79 77 81 Capitalized during the period 3 2 3 2 11 3 2 2 7 Amortized during the period (5) (5) (5) (5) (19) (4) (4) (5) (13)
Balance at end of period 88 85 83 81 81 79 77 75 75
2016 2017
Unaudited
35
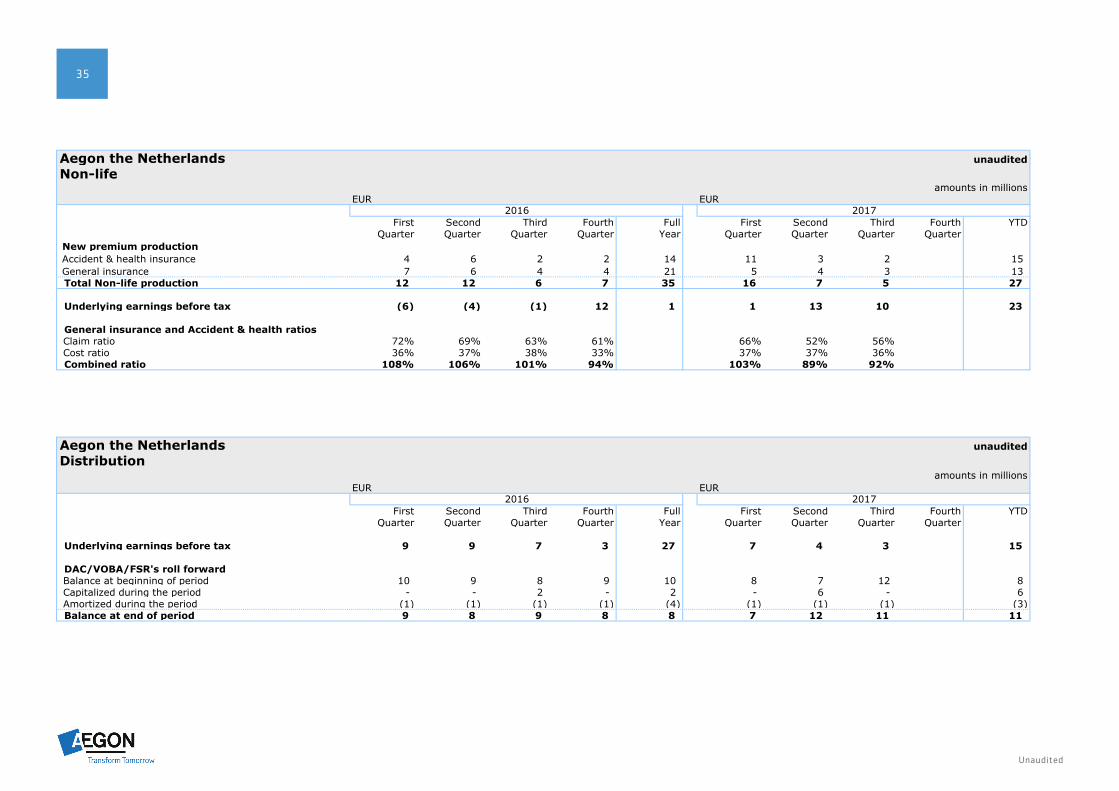
Aegon the Netherlands unauditedNon-life
amounts in millionsEUR EUR
First Second Third Fourth Full First Second Third Fourth YTDQuarter Quarter Quarter Quarter Year Quarter Quarter Quarter Quarter
New premium production Accident & health insurance 4 6 2 2 14 11 3 2 15 General insurance 7 6 4 4 21 5 4 3 13 Total Non-life production 12 12 6 7 35 16 7 5 27
Underlying earnings before tax (6) (4) (1) 12 1 1 13 10 23
General insurance and Accident & health ratiosClaim ratio 72% 69% 63% 61% 66% 52% 56%Cost ratio 36% 37% 38% 33% 37% 37% 36%Combined ratio 108% 106% 101% 94% 103% 89% 92%
Aegon the Netherlands unauditedDistribution
amounts in millionsEUR EUR
First Second Third Fourth Full First Second Third Fourth YTDQuarter Quarter Quarter Quarter Year Quarter Quarter Quarter Quarter
Underlying earnings before tax 9 9 7 3 27 7 4 3 15
DAC/VOBA/FSR's roll forwardBalance at beginning of period 10 9 8 9 10 8 7 12 8 Capitalized during the period - - 2 - 2 - 6 - 6 Amortized during the period (1) (1) (1) (1) (4) (1) (1) (1) (3) Balance at end of period 9 8 9 8 8 7 12 11 11
2016 2017
2016 2017
Unaudited
36Financial Supplement 3Q 2017
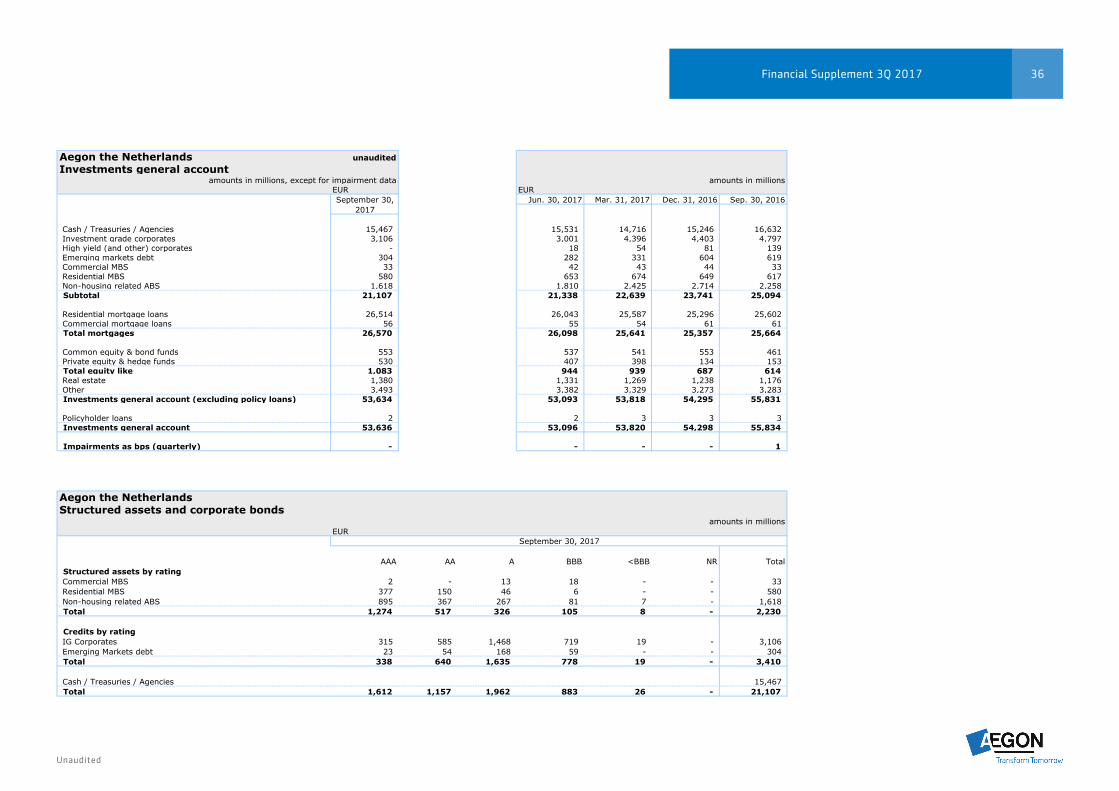
Aegon the Netherlands unauditedInvestments general account
amounts in millions, except for impairment data amounts in millionsEUR EURSeptember 30, Jun. 30, 2017 Mar. 31, 2017 Dec. 31, 2016 Sep. 30, 2016
2017
Cash / Treasuries / Agencies 15,467 15,531 14,716 15,246 16,632 Investment grade corporates 3,106 3,001 4,396 4,403 4,797 High yield (and other) corporates - 18 54 81 139 Emerging markets debt 304 282 331 604 619 Commercial MBS 33 42 43 44 33 Residential MBS 580 653 674 649 617 Non-housing related ABS 1,618 1,810 2,425 2,714 2,258 Subtotal 21,107 21,338 22,639 23,741 25,094
Residential mortgage loans 26,514 26,043 25,587 25,296 25,602 Commercial mortgage loans 56 55 54 61 61 Total mortgages 26,570 26,098 25,641 25,357 25,664
Common equity & bond funds 553 537 541 553 461 Private equity & hedge funds 530 407 398 134 153 Total equity like 1,083 944 939 687 614 Real estate 1,380 1,331 1,269 1,238 1,176 Other 3,493 3,382 3,329 3,273 3,283 Investments general account (excluding policy loans) 53,634 53,093 53,818 54,295 55,831
Policyholder loans 2 2 3 3 3 Investments general account 53,636 53,096 53,820 54,298 55,834
Impairments as bps (quarterly) - - - - 1
Aegon the NetherlandsStructured assets and corporate bonds
amounts in millionsEUR
AAA AA A BBB <BBB NR TotalStructured assets by ratingCommercial MBS 2 - 13 18 - - 33 Residential MBS 377 150 46 6 - - 580 Non-housing related ABS 895 367 267 81 7 - 1,618 Total 1,274 517 326 105 8 - 2,230
Credits by ratingIG Corporates 315 585 1,468 719 19 - 3,106 Emerging Markets debt 23 54 168 59 - - 304 Total 338 640 1,635 778 19 - 3,410
Cash / Treasuries / Agencies 15,467 Total 1,612 1,157 1,962 883 26 - 21,107
September 30, 2017
Unaudited
37
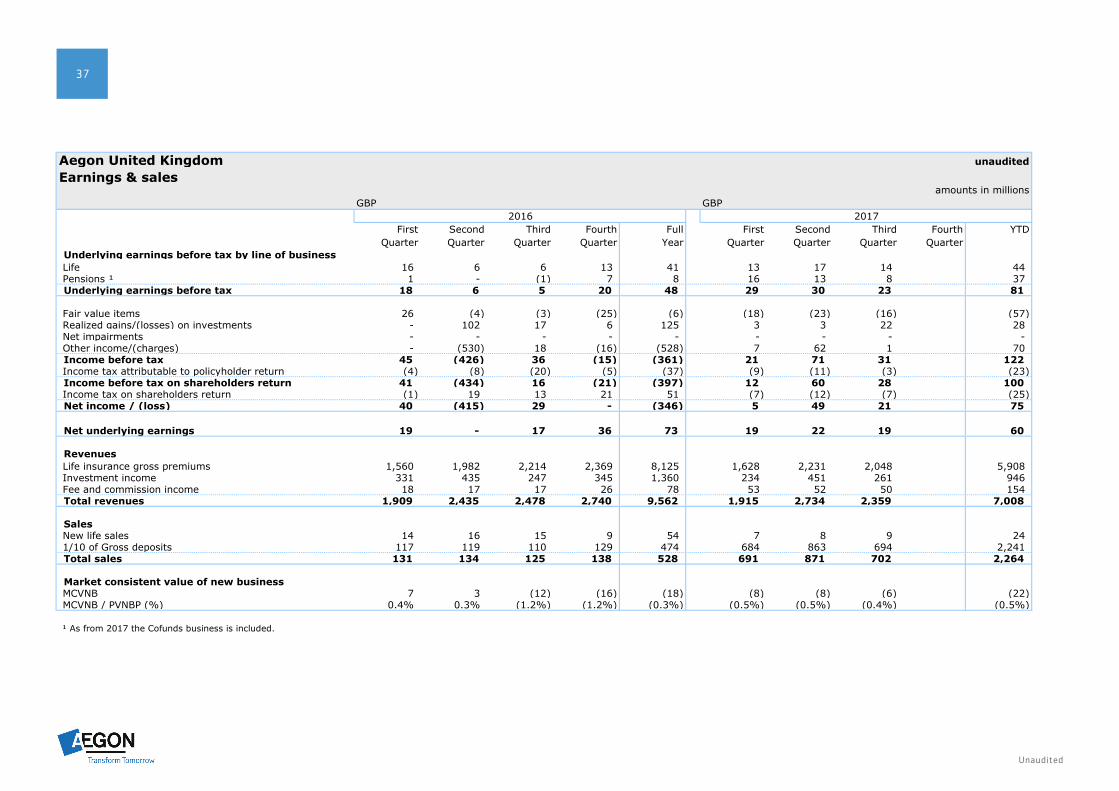
Aegon United Kingdom unaudited
Earnings & salesamounts in millions
GBP GBP
First Second Third Fourth Full First Second Third Fourth YTDQuarter Quarter Quarter Quarter Year Quarter Quarter Quarter Quarter
Underlying earnings before tax by line of businessLife 16 6 6 13 41 13 17 14 44 Pensions ¹ 1 - (1) 7 8 16 13 8 37 Underlying earnings before tax 18 6 5 20 48 29 30 23 81
Fair value items 26 (4) (3) (25) (6) (18) (23) (16) (57) Realized gains/(losses) on investments - 102 17 6 125 3 3 22 28 Net impairments - - - - - - - - - Other income/(charges) - (530) 18 (16) (528) 7 62 1 70 Income before tax 45 (426) 36 (15) (361) 21 71 31 122 Income tax attributable to policyholder return (4) (8) (20) (5) (37) (9) (11) (3) (23) Income before tax on shareholders return 41 (434) 16 (21) (397) 12 60 28 100 Income tax on shareholders return (1) 19 13 21 51 (7) (12) (7) (25) Net income / (loss) 40 (415) 29 - (346) 5 49 21 75
Net underlying earnings 19 - 17 36 73 19 22 19 60
RevenuesLife insurance gross premiums 1,560 1,982 2,214 2,369 8,125 1,628 2,231 2,048 5,908 Investment income 331 435 247 345 1,360 234 451 261 946 Fee and commission income 18 17 17 26 78 53 52 50 154 Total revenues 1,909 2,435 2,478 2,740 9,562 1,915 2,734 2,359 7,008
SalesNew life sales 14 16 15 9 54 7 8 9 24 1/10 of Gross deposits 117 119 110 129 474 684 863 694 2,241 Total sales 131 134 125 138 528 691 871 702 2,264
Market consistent value of new businessMCVNB 7 3 (12) (16) (18) (8) (8) (6) (22) MCVNB / PVNBP (%) 0.4% 0.3% (1.2%) (1.2%) (0.3%) (0.5%) (0.5%) (0.4%) (0.5%)
¹ As from 2017 the Cofunds business is included.
2016 2017
Unaudited
38Financial Supplement 3Q 2017
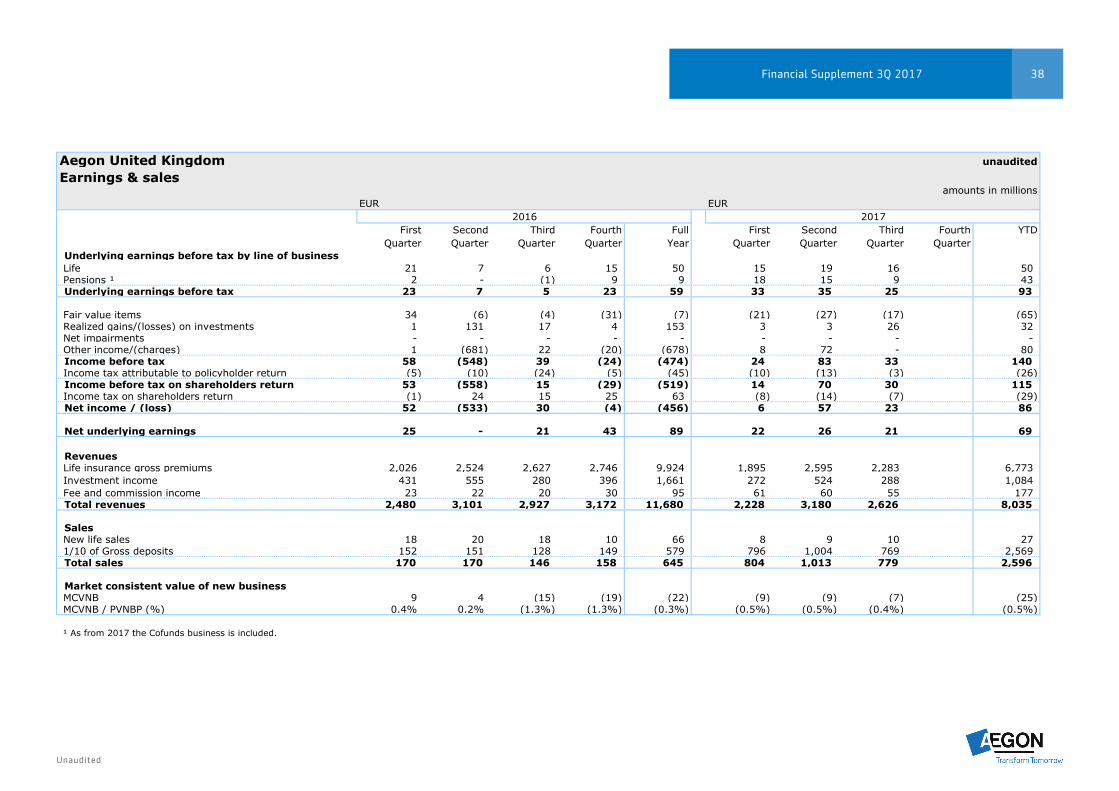
Aegon United Kingdom unaudited
Earnings & salesamounts in millions
EUR EUR
First Second Third Fourth Full First Second Third Fourth YTDQuarter Quarter Quarter Quarter Year Quarter Quarter Quarter Quarter
Underlying earnings before tax by line of businessLife 21 7 6 15 50 15 19 16 50 Pensions ¹ 2 - (1) 9 9 18 15 9 43 Underlying earnings before tax 23 7 5 23 59 33 35 25 93
Fair value items 34 (6) (4) (31) (7) (21) (27) (17) (65) Realized gains/(losses) on investments 1 131 17 4 153 3 3 26 32 Net impairments - - - - - - - - - Other income/(charges) 1 (681) 22 (20) (678) 8 72 - 80 Income before tax 58 (548) 39 (24) (474) 24 83 33 140 Income tax attributable to policyholder return (5) (10) (24) (5) (45) (10) (13) (3) (26) Income before tax on shareholders return 53 (558) 15 (29) (519) 14 70 30 115 Income tax on shareholders return (1) 24 15 25 63 (8) (14) (7) (29) Net income / (loss) 52 (533) 30 (4) (456) 6 57 23 86
Net underlying earnings 25 - 21 43 89 22 26 21 69
RevenuesLife insurance gross premiums 2,026 2,524 2,627 2,746 9,924 1,895 2,595 2,283 6,773 Investment income 431 555 280 396 1,661 272 524 288 1,084 Fee and commission income 23 22 20 30 95 61 60 55 177 Total revenues 2,480 3,101 2,927 3,172 11,680 2,228 3,180 2,626 8,035
SalesNew life sales 18 20 18 10 66 8 9 10 27 1/10 of Gross deposits 152 151 128 149 579 796 1,004 769 2,569 Total sales 170 170 146 158 645 804 1,013 779 2,596
Market consistent value of new businessMCVNB 9 4 (15) (19) (22) (9) (9) (7) (25) MCVNB / PVNBP (%) 0.4% 0.2% (1.3%) (1.3%) (0.3%) (0.5%) (0.5%) (0.4%) (0.5%)
¹ As from 2017 the Cofunds business is included.
2016 2017
Unaudited
39
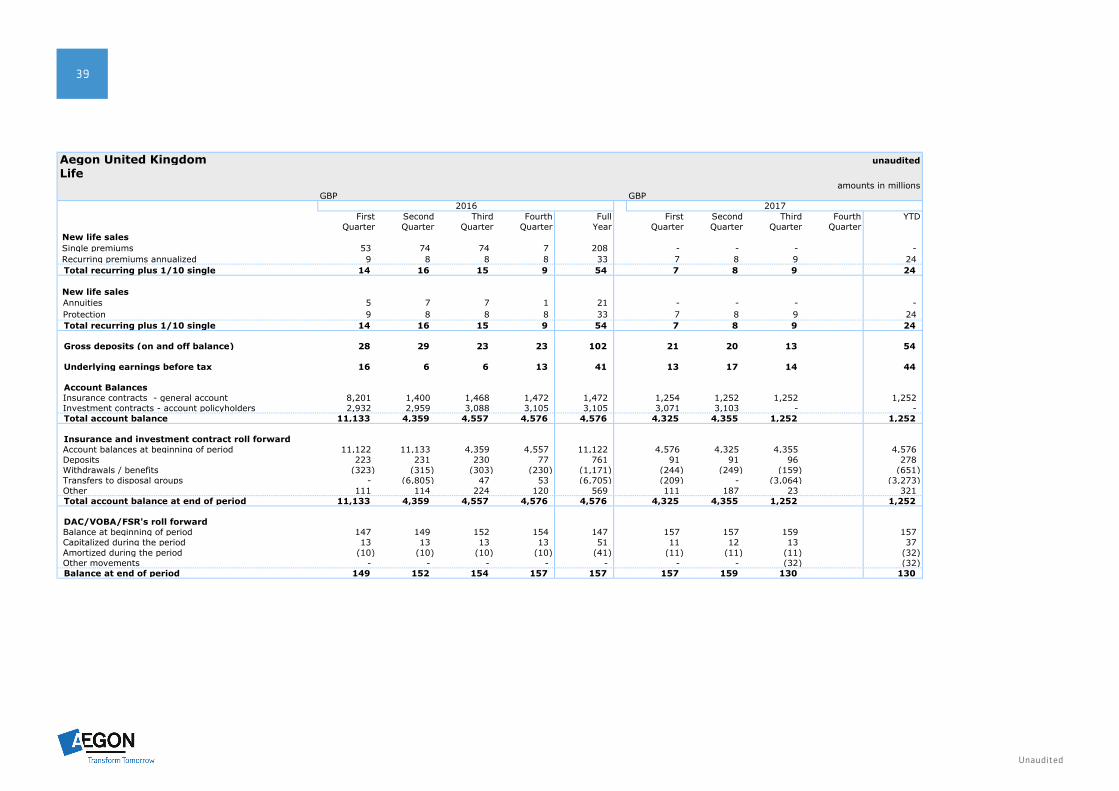
Aegon United Kingdom unauditedLife
amounts in millionsGBP GBP
First Second Third Fourth Full First Second Third Fourth YTDQuarter Quarter Quarter Quarter Year Quarter Quarter Quarter Quarter
New life sales Single premiums 53 74 74 7 208 - - - - Recurring premiums annualized 9 8 8 8 33 7 8 9 24 Total recurring plus 1/10 single 14 16 15 9 54 7 8 9 24
New life sales Annuities 5 7 7 1 21 - - - - Protection 9 8 8 8 33 7 8 9 24 Total recurring plus 1/10 single 14 16 15 9 54 7 8 9 24
Gross deposits (on and off balance) 28 29 23 23 102 21 20 13 54
Underlying earnings before tax 16 6 6 13 41 13 17 14 44
Account BalancesInsurance contracts - general account 8,201 1,400 1,468 1,472 1,472 1,254 1,252 1,252 1,252 Investment contracts - account policyholders 2,932 2,959 3,088 3,105 3,105 3,071 3,103 - - Total account balance 11,133 4,359 4,557 4,576 4,576 4,325 4,355 1,252 1,252
Insurance and investment contract roll forwardAccount balances at beginning of period 11,122 11,133 4,359 4,557 11,122 4,576 4,325 4,355 4,576 Deposits 223 231 230 77 761 91 91 96 278 Withdrawals / benefits (323) (315) (303) (230) (1,171) (244) (249) (159) (651) Transfers to disposal groups - (6,805) 47 53 (6,705) (209) - (3,064) (3,273) Other 111 114 224 120 569 111 187 23 321 Total account balance at end of period 11,133 4,359 4,557 4,576 4,576 4,325 4,355 1,252 1,252
DAC/VOBA/FSR's roll forwardBalance at beginning of period 147 149 152 154 147 157 157 159 157 Capitalized during the period 13 13 13 13 51 11 12 13 37 Amortized during the period (10) (10) (10) (10) (41) (11) (11) (11) (32) Other movements - - - - - - - (32) (32) Balance at end of period 149 152 154 157 157 157 159 130 130
2016 2017
Unaudited
40Financial Supplement 3Q 2017
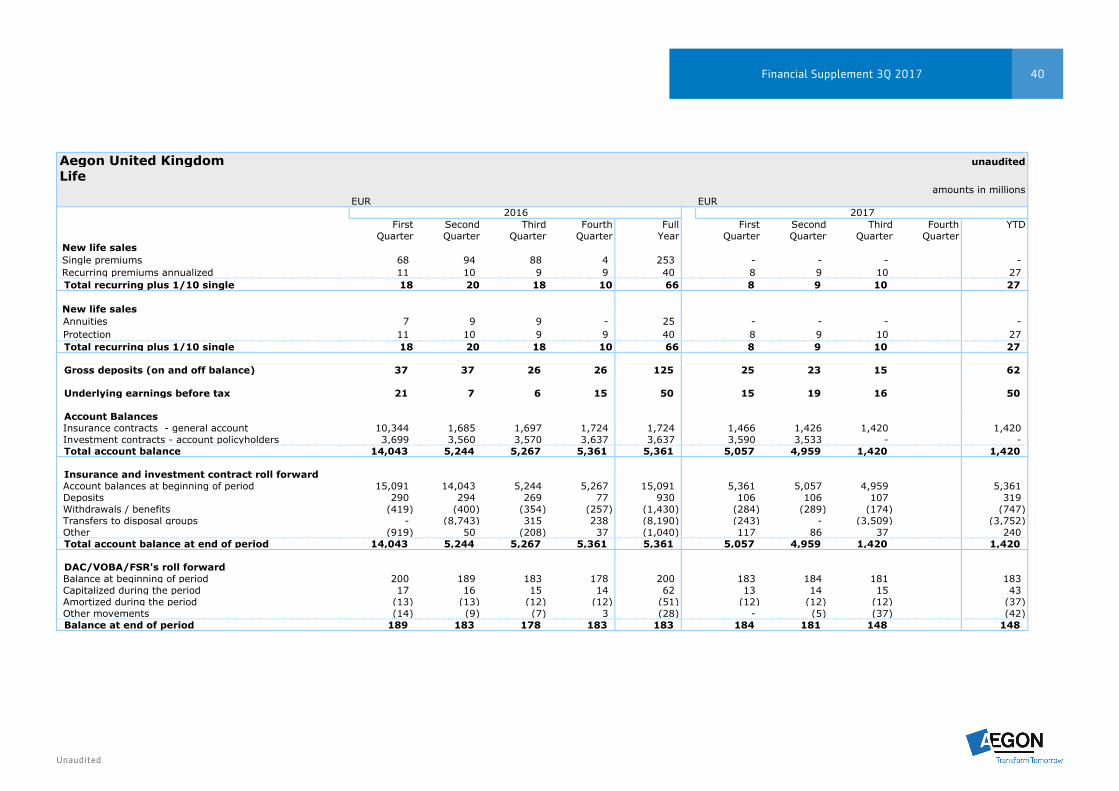
Aegon United Kingdom unauditedLife
amounts in millionsEUR EUR
First Second Third Fourth Full First Second Third Fourth YTDQuarter Quarter Quarter Quarter Year Quarter Quarter Quarter Quarter
New life sales Single premiums 68 94 88 4 253 - - - - Recurring premiums annualized 11 10 9 9 40 8 9 10 27 Total recurring plus 1/10 single 18 20 18 10 66 8 9 10 27
New life sales Annuities 7 9 9 - 25 - - - - Protection 11 10 9 9 40 8 9 10 27 Total recurring plus 1/10 single 18 20 18 10 66 8 9 10 27
Gross deposits (on and off balance) 37 37 26 26 125 25 23 15 62
Underlying earnings before tax 21 7 6 15 50 15 19 16 50
Account BalancesInsurance contracts - general account 10,344 1,685 1,697 1,724 1,724 1,466 1,426 1,420 1,420 Investment contracts - account policyholders 3,699 3,560 3,570 3,637 3,637 3,590 3,533 - - Total account balance 14,043 5,244 5,267 5,361 5,361 5,057 4,959 1,420 1,420
Insurance and investment contract roll forwardAccount balances at beginning of period 15,091 14,043 5,244 5,267 15,091 5,361 5,057 4,959 5,361 Deposits 290 294 269 77 930 106 106 107 319 Withdrawals / benefits (419) (400) (354) (257) (1,430) (284) (289) (174) (747) Transfers to disposal groups - (8,743) 315 238 (8,190) (243) - (3,509) (3,752) Other (919) 50 (208) 37 (1,040) 117 86 37 240 Total account balance at end of period 14,043 5,244 5,267 5,361 5,361 5,057 4,959 1,420 1,420
DAC/VOBA/FSR's roll forwardBalance at beginning of period 200 189 183 178 200 183 184 181 183 Capitalized during the period 17 16 15 14 62 13 14 15 43 Amortized during the period (13) (13) (12) (12) (51) (12) (12) (12) (37) Other movements (14) (9) (7) 3 (28) - (5) (37) (42) Balance at end of period 189 183 178 183 183 184 181 148 148
2016 2017
Unaudited
41
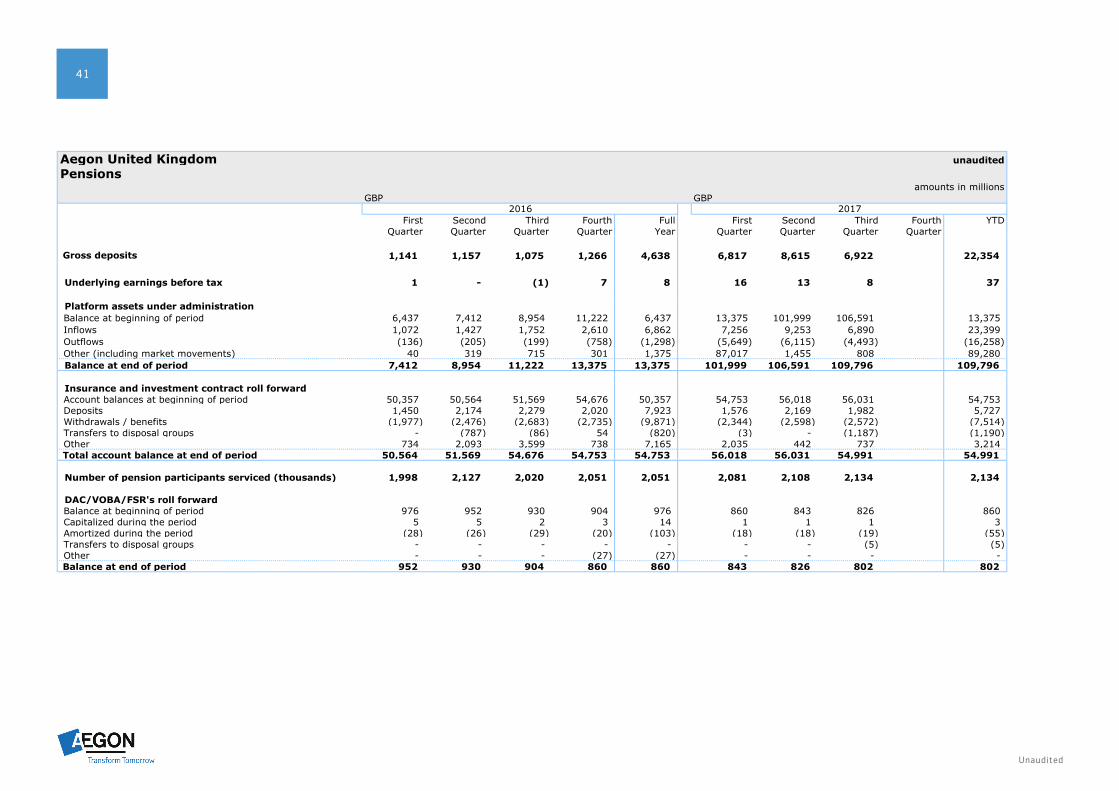
Aegon United Kingdom unauditedPensions
amounts in millionsGBP GBP
First Second Third Fourth Full First Second Third Fourth YTDQuarter Quarter Quarter Quarter Year Quarter Quarter Quarter Quarter
Gross deposits 1,141 1,157 1,075 1,266 4,638 6,817 8,615 6,922 22,354
Underlying earnings before tax 1 - (1) 7 8 16 13 8 37
Platform assets under administrationBalance at beginning of period 6,437 7,412 8,954 11,222 6,437 13,375 101,999 106,591 13,375 Inflows 1,072 1,427 1,752 2,610 6,862 7,256 9,253 6,890 23,399 Outflows (136) (205) (199) (758) (1,298) (5,649) (6,115) (4,493) (16,258) Other (including market movements) 40 319 715 301 1,375 87,017 1,455 808 89,280 Balance at end of period 7,412 8,954 11,222 13,375 13,375 101,999 106,591 109,796 109,796
Insurance and investment contract roll forwardAccount balances at beginning of period 50,357 50,564 51,569 54,676 50,357 54,753 56,018 56,031 54,753 Deposits 1,450 2,174 2,279 2,020 7,923 1,576 2,169 1,982 5,727 Withdrawals / benefits (1,977) (2,476) (2,683) (2,735) (9,871) (2,344) (2,598) (2,572) (7,514) Transfers to disposal groups - (787) (86) 54 (820) (3) - (1,187) (1,190) Other 734 2,093 3,599 738 7,165 2,035 442 737 3,214
Total account balance at end of period 50,564 51,569 54,676 54,753 54,753 56,018 56,031 54,991 54,991
Number of pension participants serviced (thousands) 1,998 2,127 2,020 2,051 2,051 2,081 2,108 2,134 2,134
DAC/VOBA/FSR's roll forwardBalance at beginning of period 976 952 930 904 976 860 843 826 860 Capitalized during the period 5 5 2 3 14 1 1 1 3 Amortized during the period (28) (26) (29) (20) (103) (18) (18) (19) (55) Transfers to disposal groups - - - - - - - (5) (5) Other - - - (27) (27) - - - -
Balance at end of period 952 930 904 860 860 843 826 802 802
2016 2017
Unaudited
42Financial Supplement 3Q 2017
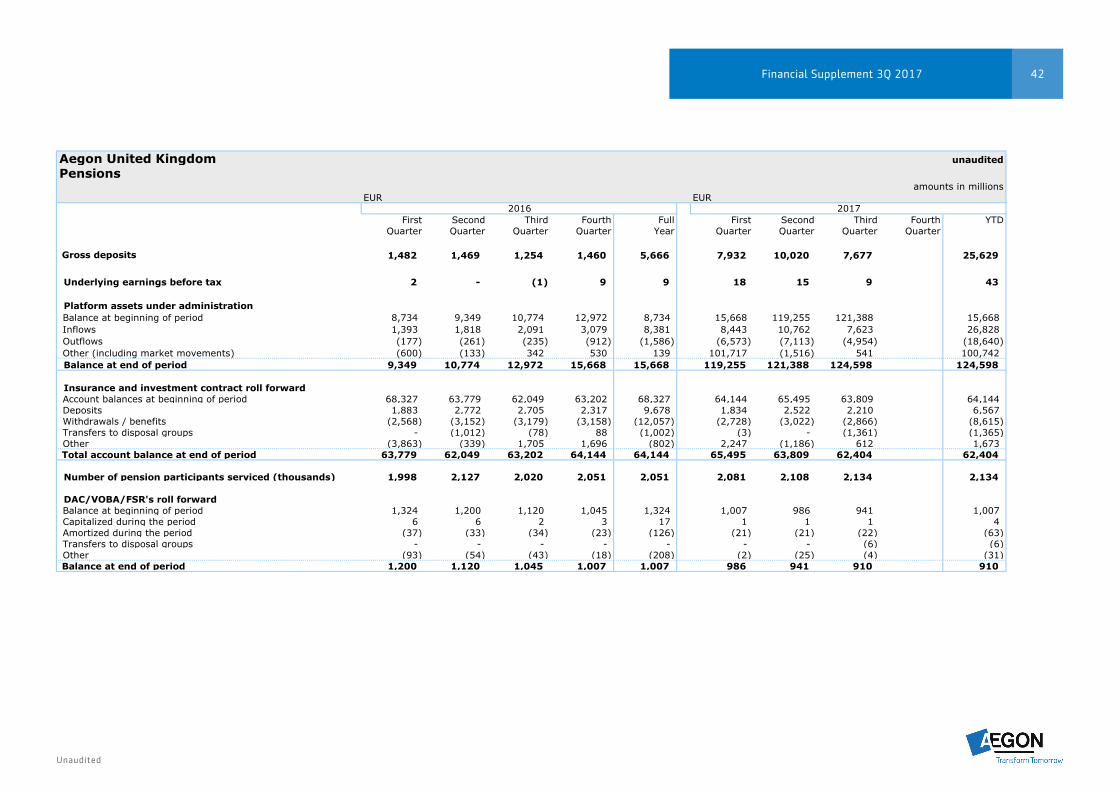
Aegon United Kingdom unauditedPensions
amounts in millionsEUR EUR
First Second Third Fourth Full First Second Third Fourth YTDQuarter Quarter Quarter Quarter Year Quarter Quarter Quarter Quarter
Gross deposits 1,482 1,469 1,254 1,460 5,666 7,932 10,020 7,677 25,629
Underlying earnings before tax 2 - (1) 9 9 18 15 9 43
Platform assets under administrationBalance at beginning of period 8,734 9,349 10,774 12,972 8,734 15,668 119,255 121,388 15,668 Inflows 1,393 1,818 2,091 3,079 8,381 8,443 10,762 7,623 26,828 Outflows (177) (261) (235) (912) (1,586) (6,573) (7,113) (4,954) (18,640) Other (including market movements) (600) (133) 342 530 139 101,717 (1,516) 541 100,742 Balance at end of period 9,349 10,774 12,972 15,668 15,668 119,255 121,388 124,598 124,598
Insurance and investment contract roll forwardAccount balances at beginning of period 68,327 63,779 62,049 63,202 68,327 64,144 65,495 63,809 64,144 Deposits 1,883 2,772 2,705 2,317 9,678 1,834 2,522 2,210 6,567 Withdrawals / benefits (2,568) (3,152) (3,179) (3,158) (12,057) (2,728) (3,022) (2,866) (8,615) Transfers to disposal groups - (1,012) (78) 88 (1,002) (3) - (1,361) (1,365) Other (3,863) (339) 1,705 1,696 (802) 2,247 (1,186) 612 1,673
Total account balance at end of period 63,779 62,049 63,202 64,144 64,144 65,495 63,809 62,404 62,404
Number of pension participants serviced (thousands) 1,998 2,127 2,020 2,051 2,051 2,081 2,108 2,134 2,134
DAC/VOBA/FSR's roll forwardBalance at beginning of period 1,324 1,200 1,120 1,045 1,324 1,007 986 941 1,007 Capitalized during the period 6 6 2 3 17 1 1 1 4 Amortized during the period (37) (33) (34) (23) (126) (21) (21) (22) (63) Transfers to disposal groups - - - - - - - (6) (6) Other (93) (54) (43) (18) (208) (2) (25) (4) (31)
Balance at end of period 1,200 1,120 1,045 1,007 1,007 986 941 910 910
2016 2017
Unaudited
43
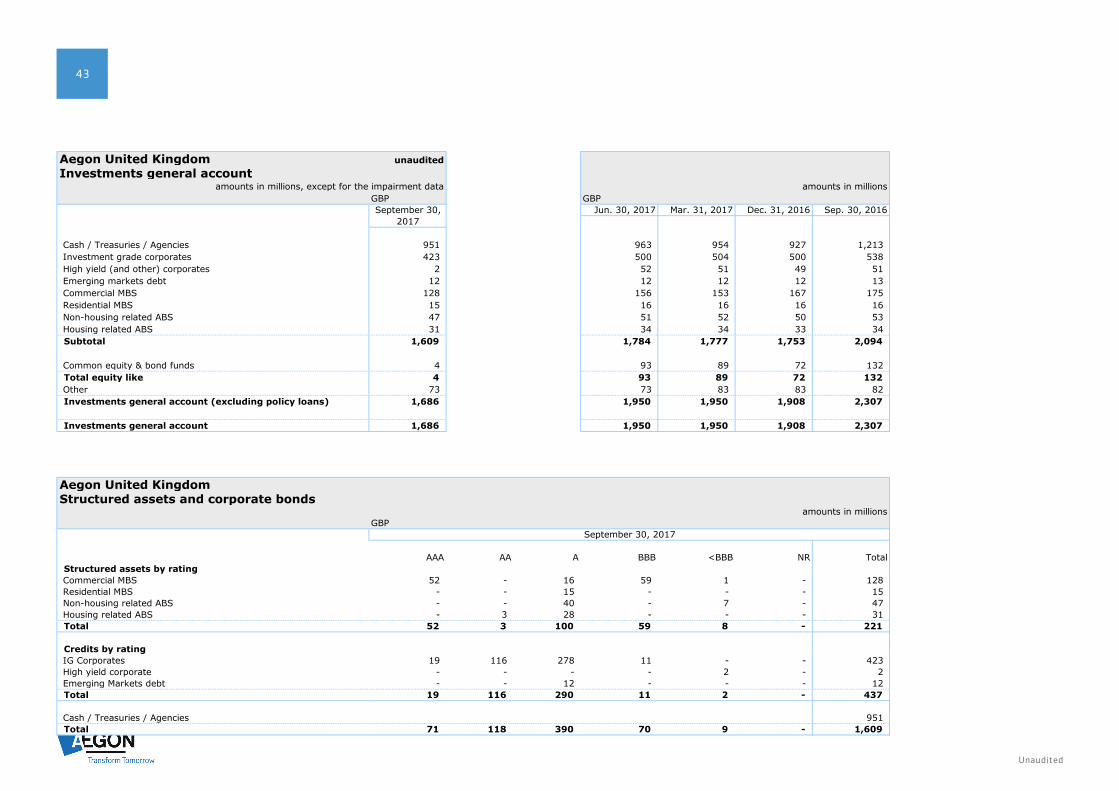
Aegon United Kingdom unauditedInvestments general account
amounts in millions, except for the impairment data amounts in millionsGBP GBPSeptember 30, Jun. 30, 2017 Mar. 31, 2017 Dec. 31, 2016 Sep. 30, 2016
2017
Cash / Treasuries / Agencies 951 963 954 927 1,213 Investment grade corporates 423 500 504 500 538 High yield (and other) corporates 2 52 51 49 51 Emerging markets debt 12 12 12 12 13 Commercial MBS 128 156 153 167 175 Residential MBS 15 16 16 16 16 Non-housing related ABS 47 51 52 50 53 Housing related ABS 31 34 34 33 34 Subtotal 1,609 1,784 1,777 1,753 2,094
Common equity & bond funds 4 93 89 72 132 Total equity like 4 93 89 72 132 Other 73 73 83 83 82 Investments general account (excluding policy loans) 1,686 1,950 1,950 1,908 2,307
Investments general account 1,686 1,950 1,950 1,908 2,307
Aegon United KingdomStructured assets and corporate bonds
amounts in millionsGBP
AAA AA A BBB <BBB NR TotalStructured assets by ratingCommercial MBS 52 - 16 59 1 - 128 Residential MBS - - 15 - - - 15 Non-housing related ABS - - 40 - 7 - 47 Housing related ABS - 3 28 - - - 31 Total 52 3 100 59 8 - 221
Credits by ratingIG Corporates 19 116 278 11 - - 423 High yield corporate - - - - 2 - 2 Emerging Markets debt - - 12 - - - 12 Total 19 116 290 11 2 - 437
Cash / Treasuries / Agencies 951 Total 71 118 390 70 9 - 1,609
September 30, 2017
Unaudited
44Financial Supplement 3Q 2017
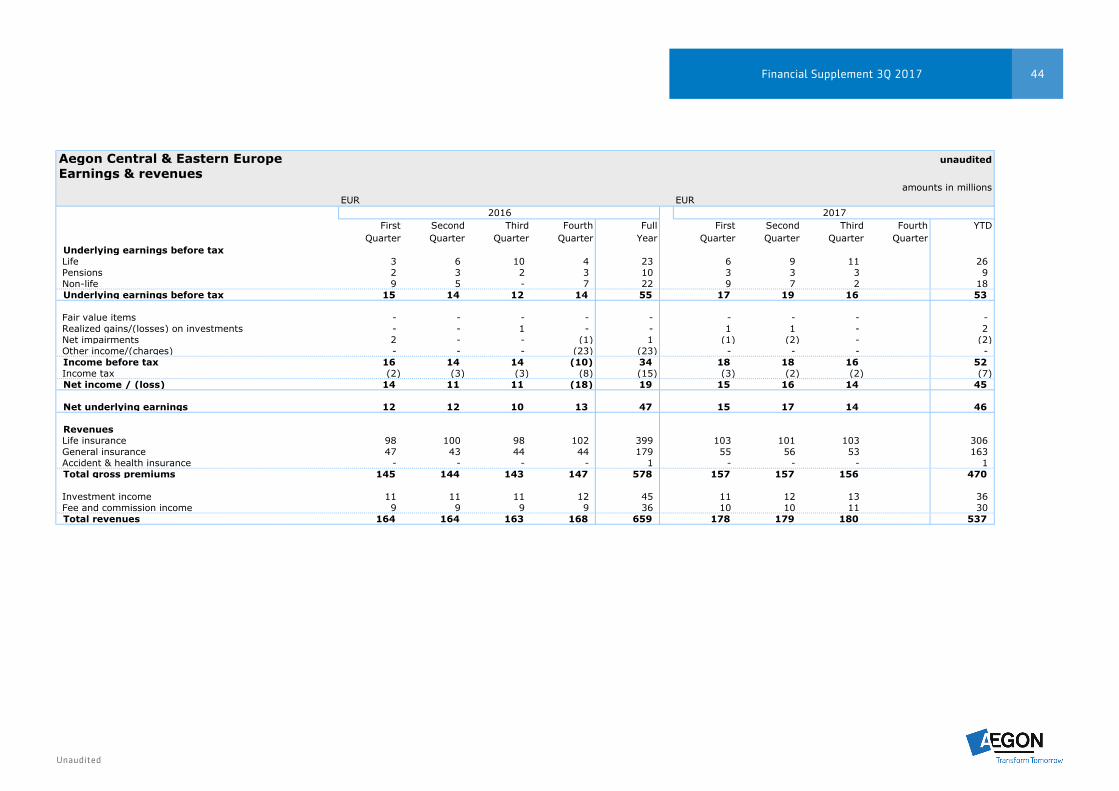
Aegon Central & Eastern Europe unauditedEarnings & revenues
amounts in millionsEUR EUR
First Second Third Fourth Full First Second Third Fourth YTDQuarter Quarter Quarter Quarter Year Quarter Quarter Quarter Quarter
Underlying earnings before taxLife 3 6 10 4 23 6 9 11 26 Pensions 2 3 2 3 10 3 3 3 9 Non-life 9 5 - 7 22 9 7 2 18 Underlying earnings before tax 15 14 12 14 55 17 19 16 53
Fair value items - - - - - - - - - Realized gains/(losses) on investments - - 1 - - 1 1 - 2 Net impairments 2 - - (1) 1 (1) (2) - (2) Other income/(charges) - - - (23) (23) - - - - Income before tax 16 14 14 (10) 34 18 18 16 52 Income tax (2) (3) (3) (8) (15) (3) (2) (2) (7) Net income / (loss) 14 11 11 (18) 19 15 16 14 45
Net underlying earnings 12 12 10 13 47 15 17 14 46
RevenuesLife insurance 98 100 98 102 399 103 101 103 306 General insurance 47 43 44 44 179 55 56 53 163 Accident & health insurance - - - - 1 - - - 1 Total gross premiums 145 144 143 147 578 157 157 156 470
Investment income 11 11 11 12 45 11 12 13 36 Fee and commission income 9 9 9 9 36 10 10 11 30 Total revenues 164 164 163 168 659 178 179 180 537
2016 2017

Unaudited
45
Aegon Spain & Portugal unauditedEarnings & revenues
amounts in millionsEUR EUR
First Second Third Fourth Full First Second Third Fourth YTDQuarter Quarter Quarter Quarter Year Quarter Quarter Quarter Quarter
Underlying earnings before tax Life - (3) (2) 1 (4) (2) 2 1 1 Non-life 3 3 4 1 11 3 3 3 9 Underlying earnings before tax 3 - 1 3 8 1 5 4 10
Fair value items - - - (1) (1) - - - - Realized gains/(losses) on investments (1) (1) - 1 (1) - - - - Net impairments - - - - - - - - - Other income/(charges) - - - - - - - - - Income before tax 2 - 1 3 6 1 5 4 10 Income tax (2) (2) (2) (2) (8) (2) (2) (2) (6) Net income / (loss) - (3) (1) 1 (2) (1) 3 2 4
Net underlying earnings 1 (2) (1) 1 (1) (1) 3 2 3
Revenues Life & Health insurance 121 47 37 58 263 135 52 46 234 General insurance 23 25 21 23 92 24 25 25 74 Total gross premiums 144 72 59 81 355 160 78 71 308
Investment income 10 10 10 16 45 9 9 9 27 Fee and commission income 3 4 3 4 14 4 4 4 11 Other revenues 1 1 - 1 2 1 2 - 3 Total revenues 157 86 72 101 416 173 93 84 349
2016 2017
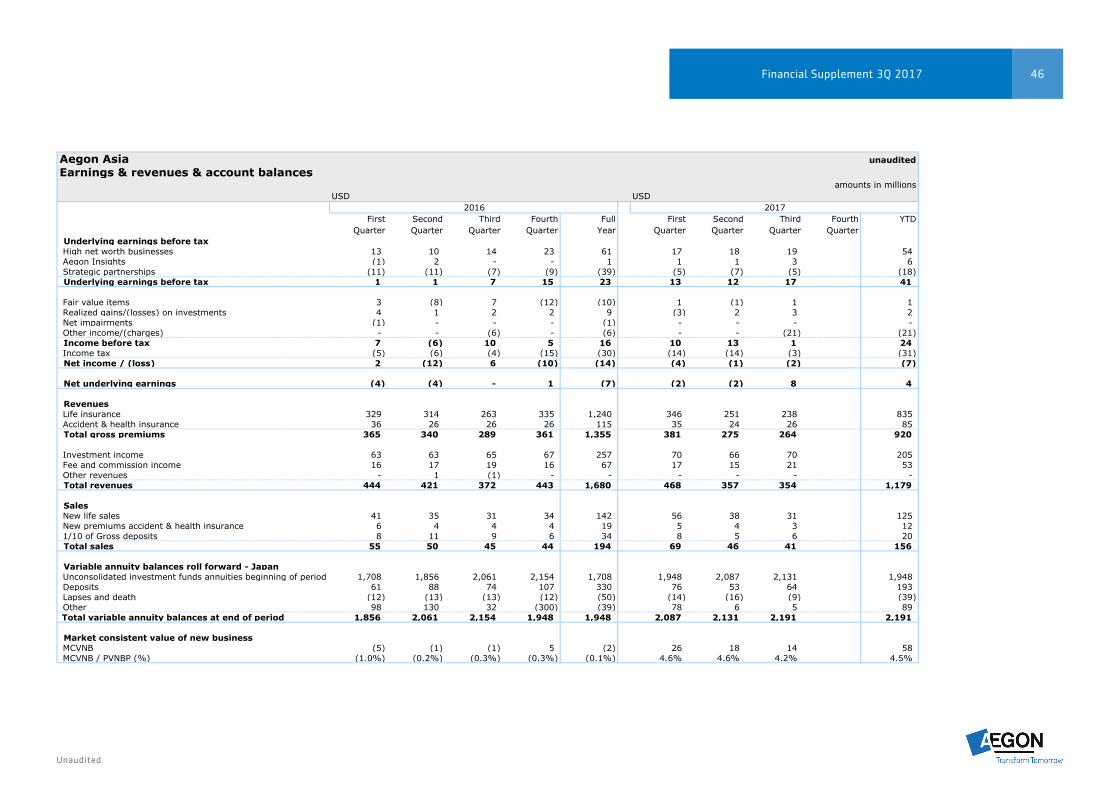
Unaudited
46Financial Supplement 3Q 2017
Aegon Asia unauditedEarnings & revenues & account balances
amounts in millionsUSD USD
First Second Third Fourth Full First Second Third Fourth YTDQuarter Quarter Quarter Quarter Year Quarter Quarter Quarter Quarter
Underlying earnings before taxHigh net worth businesses 13 10 14 23 61 17 18 19 54 Aegon Insights (1) 2 - - 1 1 1 3 6 Strategic partnerships (11) (11) (7) (9) (39) (5) (7) (5) (18) Underlying earnings before tax 1 1 7 15 23 13 12 17 41
Fair value items 3 (8) 7 (12) (10) 1 (1) 1 1 Realized gains/(losses) on investments 4 1 2 2 9 (3) 2 3 2 Net impairments (1) - - - (1) - - - - Other income/(charges) - - (6) - (6) - - (21) (21) Income before tax 7 (6) 10 5 16 10 13 1 24 Income tax (5) (6) (4) (15) (30) (14) (14) (3) (31) Net income / (loss) 2 (12) 6 (10) (14) (4) (1) (2) (7)
Net underlying earnings (4) (4) - 1 (7) (2) (2) 8 4
RevenuesLife insurance 329 314 263 335 1,240 346 251 238 835 Accident & health insurance 36 26 26 26 115 35 24 26 85 Total gross premiums 365 340 289 361 1,355 381 275 264 920
Investment income 63 63 65 67 257 70 66 70 205 Fee and commission income 16 17 19 16 67 17 15 21 53 Other revenues - 1 (1) - - - - - - Total revenues 444 421 372 443 1,680 468 357 354 1,179
SalesNew life sales 41 35 31 34 142 56 38 31 125 New premiums accident & health insurance 6 4 4 4 19 5 4 3 12 1/10 of Gross deposits 8 11 9 6 34 8 5 6 20 Total sales 55 50 45 44 194 69 46 41 156
Variable annuity balances roll forward - JapanUnconsolidated investment funds annuities beginning of period 1,708 1,856 2,061 2,154 1,708 1,948 2,087 2,131 1,948 Deposits 61 88 74 107 330 76 53 64 193 Lapses and death (12) (13) (13) (12) (50) (14) (16) (9) (39) Other 98 130 32 (300) (39) 78 6 5 89
Total variable annuity balances at end of period 1,856 2,061 2,154 1,948 1,948 2,087 2,131 2,191 2,191
Market consistent value of new businessMCVNB (5) (1) (1) 5 (2) 26 18 14 58 MCVNB / PVNBP (%) (1.0%) (0.2%) (0.3%) (0.3%) (0.1%) 4.6% 4.6% 4.2% 4.5%
2016 2017
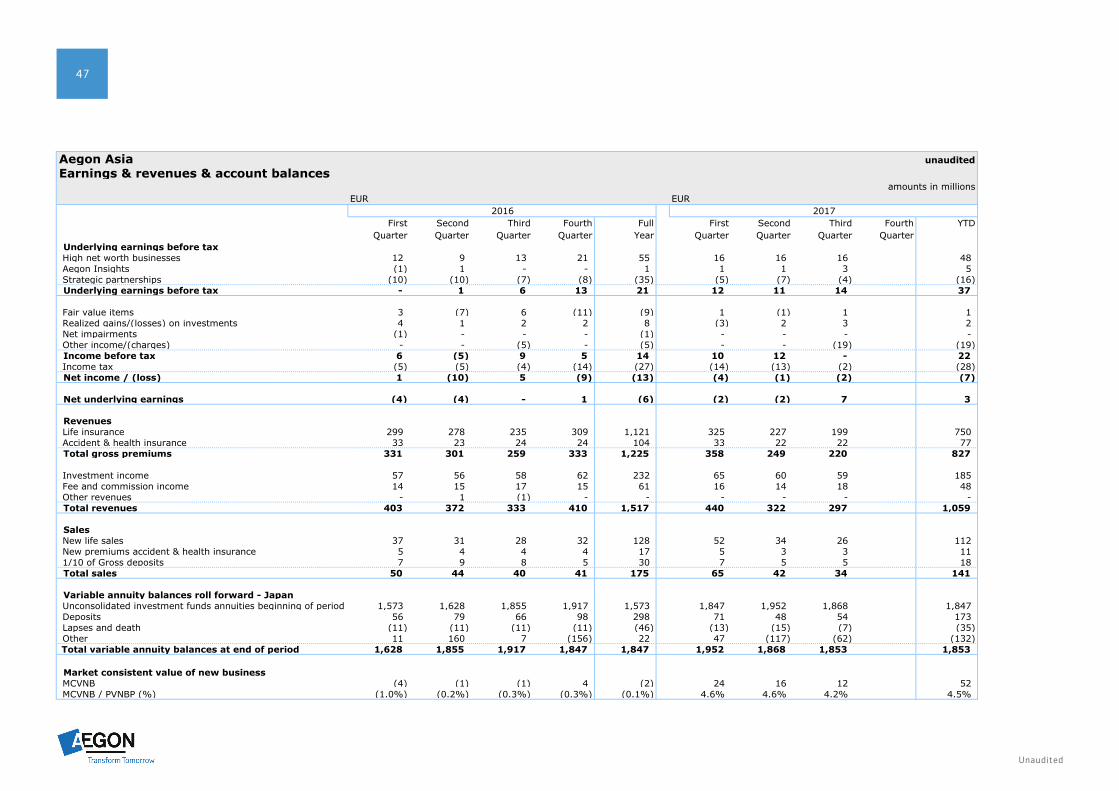
Unaudited
47
Aegon Asia unauditedEarnings & revenues & account balances
amounts in millionsEUR EUR
First Second Third Fourth Full First Second Third Fourth YTDQuarter Quarter Quarter Quarter Year Quarter Quarter Quarter Quarter
Underlying earnings before taxHigh net worth businesses 12 9 13 21 55 16 16 16 48 Aegon Insights (1) 1 - - 1 1 1 3 5 Strategic partnerships (10) (10) (7) (8) (35) (5) (7) (4) (16) Underlying earnings before tax - 1 6 13 21 12 11 14 37
Fair value items 3 (7) 6 (11) (9) 1 (1) 1 1 Realized gains/(losses) on investments 4 1 2 2 8 (3) 2 3 2 Net impairments (1) - - - (1) - - - - Other income/(charges) - - (5) - (5) - - (19) (19) Income before tax 6 (5) 9 5 14 10 12 - 22 Income tax (5) (5) (4) (14) (27) (14) (13) (2) (28) Net income / (loss) 1 (10) 5 (9) (13) (4) (1) (2) (7)
Net underlying earnings (4) (4) - 1 (6) (2) (2) 7 3
RevenuesLife insurance 299 278 235 309 1,121 325 227 199 750 Accident & health insurance 33 23 24 24 104 33 22 22 77 Total gross premiums 331 301 259 333 1,225 358 249 220 827
Investment income 57 56 58 62 232 65 60 59 185 Fee and commission income 14 15 17 15 61 16 14 18 48 Other revenues - 1 (1) - - - - - - Total revenues 403 372 333 410 1,517 440 322 297 1,059
SalesNew life sales 37 31 28 32 128 52 34 26 112 New premiums accident & health insurance 5 4 4 4 17 5 3 3 11 1/10 of Gross deposits 7 9 8 5 30 7 5 5 18 Total sales 50 44 40 41 175 65 42 34 141
Variable annuity balances roll forward - JapanUnconsolidated investment funds annuities beginning of period 1,573 1,628 1,855 1,917 1,573 1,847 1,952 1,868 1,847 Deposits 56 79 66 98 298 71 48 54 173 Lapses and death (11) (11) (11) (11) (46) (13) (15) (7) (35) Other 11 160 7 (156) 22 47 (117) (62) (132)
Total variable annuity balances at end of period 1,628 1,855 1,917 1,847 1,847 1,952 1,868 1,853 1,853
Market consistent value of new businessMCVNB (4) (1) (1) 4 (2) 24 16 12 52 MCVNB / PVNBP (%) (1.0%) (0.2%) (0.3%) (0.3%) (0.1%) 4.6% 4.6% 4.2% 4.5%
2016 2017
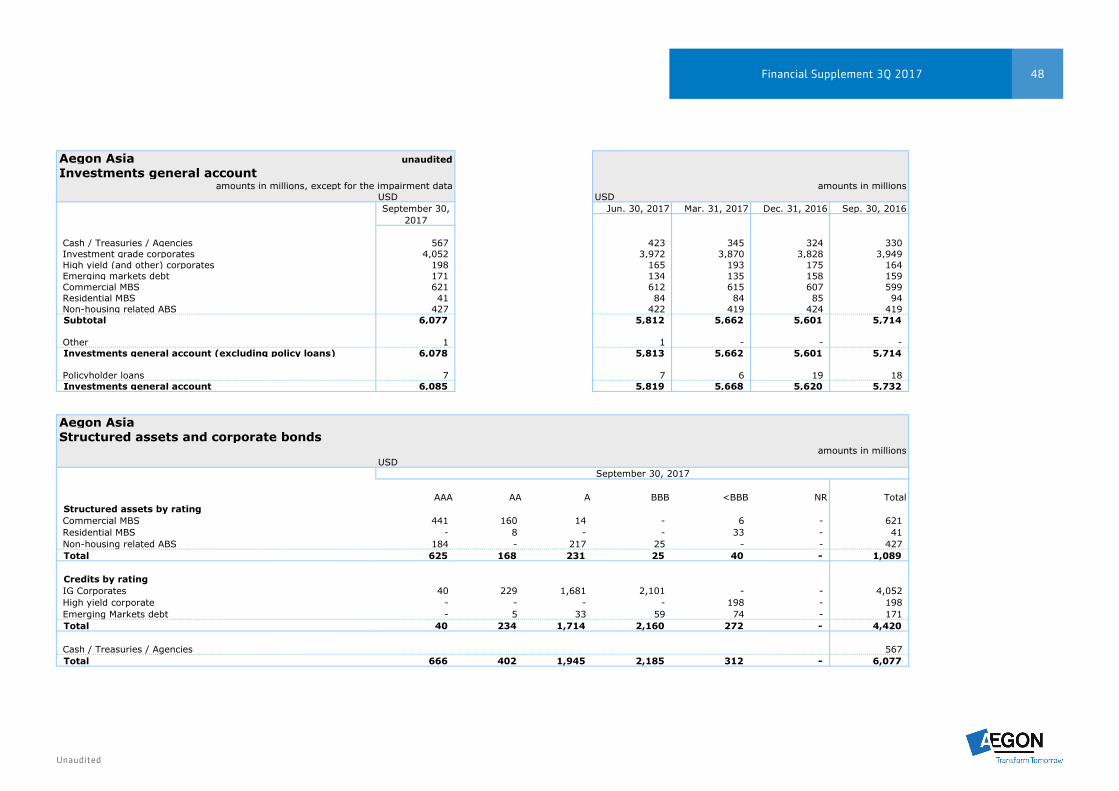
Unaudited
48Financial Supplement 3Q 2017
Aegon Asia unauditedInvestments general account
amounts in millions, except for the impairment data amounts in millionsUSD USDSeptember 30, Jun. 30, 2017 Mar. 31, 2017 Dec. 31, 2016 Sep. 30, 2016
2017
Cash / Treasuries / Agencies 567 423 345 324 330 Investment grade corporates 4,052 3,972 3,870 3,828 3,949 High yield (and other) corporates 198 165 193 175 164 Emerging markets debt 171 134 135 158 159 Commercial MBS 621 612 615 607 599 Residential MBS 41 84 84 85 94 Non-housing related ABS 427 422 419 424 419 Subtotal 6,077 5,812 5,662 5,601 5,714
Other 1 1 - - - Investments general account (excluding policy loans) 6,078 5,813 5,662 5,601 5,714
Policyholder loans 7 7 6 19 18 Investments general account 6,085 5,819 5,668 5,620 5,732
Aegon AsiaStructured assets and corporate bonds
amounts in millionsUSD
AAA AA A BBB <BBB NR TotalStructured assets by ratingCommercial MBS 441 160 14 - 6 - 621 Residential MBS - 8 - - 33 - 41 Non-housing related ABS 184 - 217 25 - - 427 Total 625 168 231 25 40 - 1,089
Credits by ratingIG Corporates 40 229 1,681 2,101 - - 4,052 High yield corporate - - - - 198 - 198 Emerging Markets debt - 5 33 59 74 - 171 Total 40 234 1,714 2,160 272 - 4,420
Cash / Treasuries / Agencies 567 Total 666 402 1,945 2,185 312 - 6,077
September 30, 2017
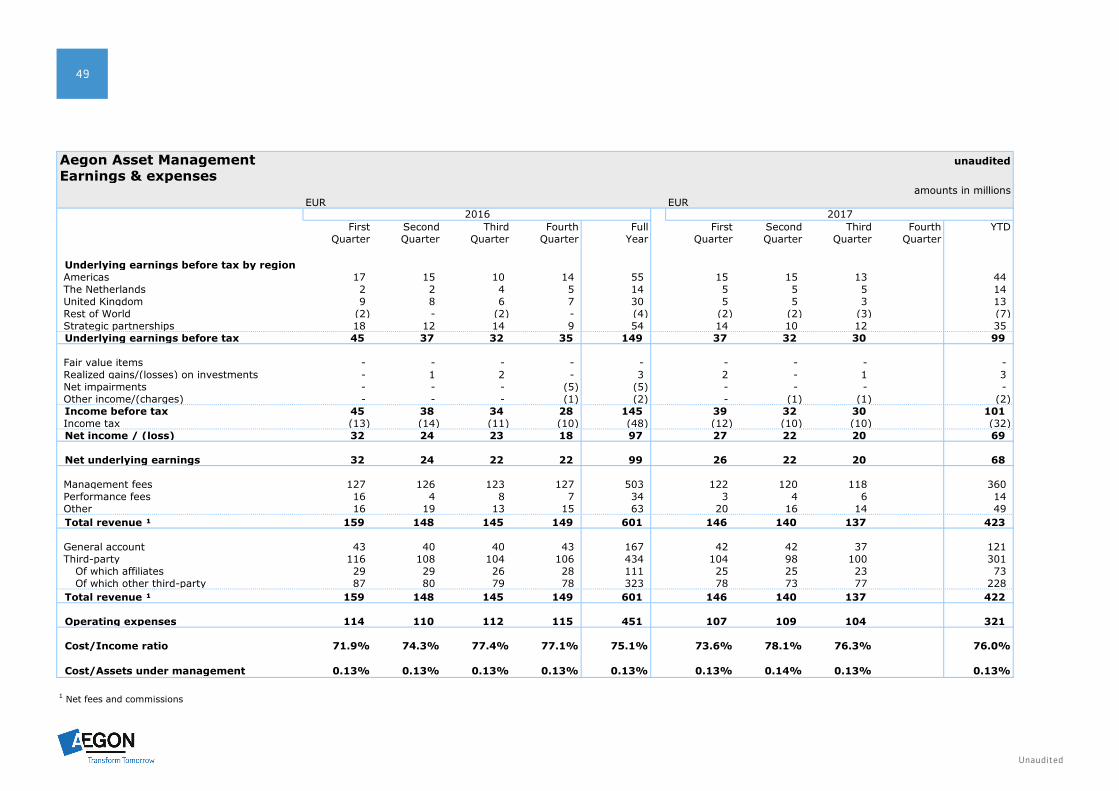
Unaudited
49
Aegon Asset Management unauditedEarnings & expenses
amounts in millionsEUR EUR
First Second Third Fourth Full First Second Third Fourth YTDQuarter Quarter Quarter Quarter Year Quarter Quarter Quarter Quarter
Underlying earnings before tax by regionAmericas 17 15 10 14 55 15 15 13 44 The Netherlands 2 2 4 5 14 5 5 5 14 United Kingdom 9 8 6 7 30 5 5 3 13 Rest of World (2) - (2) - (4) (2) (2) (3) (7) Strategic partnerships 18 12 14 9 54 14 10 12 35 Underlying earnings before tax 45 37 32 35 149 37 32 30 99
Fair value items - - - - - - - - - Realized gains/(losses) on investments - 1 2 - 3 2 - 1 3 Net impairments - - - (5) (5) - - - - Other income/(charges) - - - (1) (2) - (1) (1) (2) Income before tax 45 38 34 28 145 39 32 30 101 Income tax (13) (14) (11) (10) (48) (12) (10) (10) (32) Net income / (loss) 32 24 23 18 97 27 22 20 69
Net underlying earnings 32 24 22 22 99 26 22 20 68
Management fees 127 126 123 127 503 122 120 118 360 Performance fees 16 4 8 7 34 3 4 6 14 Other 16 19 13 15 63 20 16 14 49 Total revenue ¹ 159 148 145 149 601 146 140 137 423
General account 43 40 40 43 167 42 42 37 121 Third-party 116 108 104 106 434 104 98 100 301
Of which affiliates 29 29 26 28 111 25 25 23 73 Of which other third-party 87 80 79 78 323 78 73 77 228
Total revenue ¹ 159 148 145 149 601 146 140 137 422
Operating expenses 114 110 112 115 451 107 109 104 321
Cost/Income ratio 71.9% 74.3% 77.4% 77.1% 75.1% 73.6% 78.1% 76.3% 76.0%
Cost/Assets under management 0.13% 0.13% 0.13% 0.13% 0.13% 0.13% 0.14% 0.13% 0.13%
1 Net fees and commissions
2016 2017
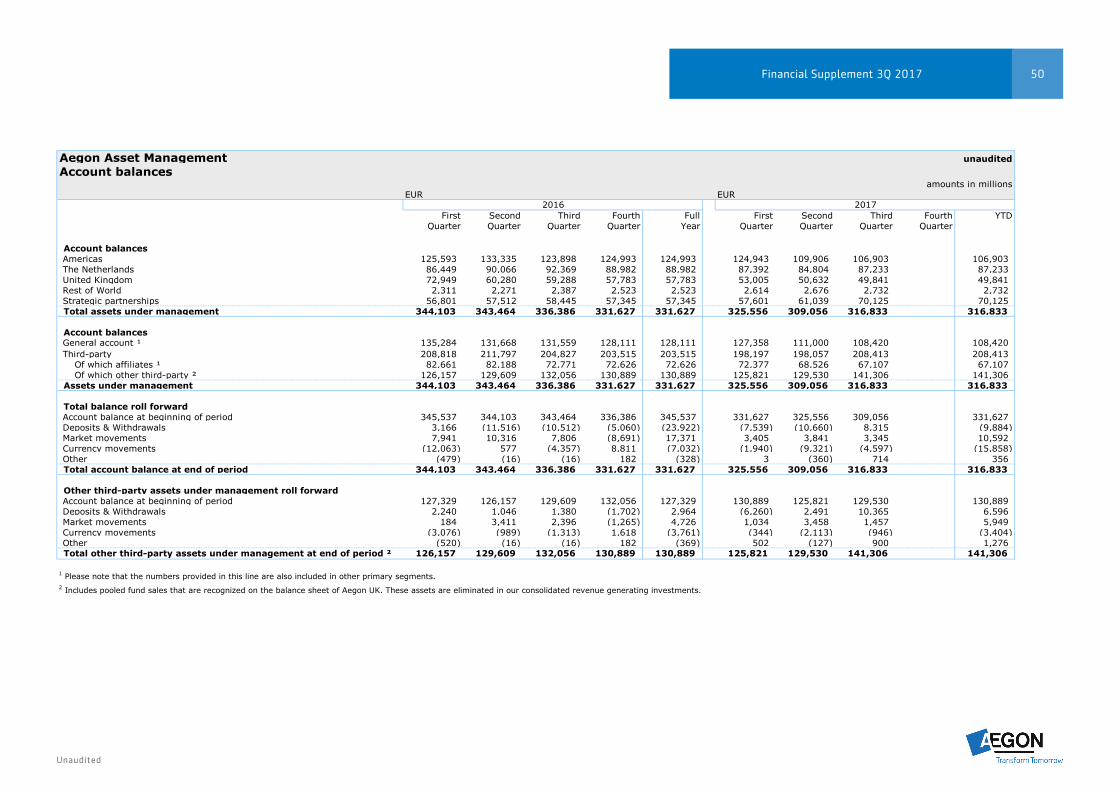
Unaudited
50Financial Supplement 3Q 2017
Aegon Asset Management unauditedAccount balances
amounts in millionsEUR EUR
First Second Third Fourth Full First Second Third Fourth YTDQuarter Quarter Quarter Quarter Year Quarter Quarter Quarter Quarter
Account balancesAmericas 125,593 133,335 123,898 124,993 124,993 124,943 109,906 106,903 106,903 The Netherlands 86,449 90,066 92,369 88,982 88,982 87,392 84,804 87,233 87,233 United Kingdom 72,949 60,280 59,288 57,783 57,783 53,005 50,632 49,841 49,841 Rest of World 2,311 2,271 2,387 2,523 2,523 2,614 2,676 2,732 2,732 Strategic partnerships 56,801 57,512 58,445 57,345 57,345 57,601 61,039 70,125 70,125 Total assets under management 344,103 343,464 336,386 331,627 331,627 325,556 309,056 316,833 316,833
Account balancesGeneral account ¹ 135,284 131,668 131,559 128,111 128,111 127,358 111,000 108,420 108,420 Third-party 208,818 211,797 204,827 203,515 203,515 198,197 198,057 208,413 208,413
Of which affiliates ¹ 82,661 82,188 72,771 72,626 72,626 72,377 68,526 67,107 67,107 Of which other third-party ² 126,157 129,609 132,056 130,889 130,889 125,821 129,530 141,306 141,306
Assets under management 344,103 343,464 336,386 331,627 331,627 325,556 309,056 316,833 316,833
Total balance roll forwardAccount balance at beginning of period 345,537 344,103 343,464 336,386 345,537 331,627 325,556 309,056 331,627 Deposits & Withdrawals 3,166 (11,516) (10,512) (5,060) (23,922) (7,539) (10,660) 8,315 (9,884) Market movements 7,941 10,316 7,806 (8,691) 17,371 3,405 3,841 3,345 10,592 Currency movements (12,063) 577 (4,357) 8,811 (7,032) (1,940) (9,321) (4,597) (15,858) Other (479) (16) (16) 182 (328) 3 (360) 714 356 Total account balance at end of period 344,103 343,464 336,386 331,627 331,627 325,556 309,056 316,833 316,833
Other third-party assets under management roll forwardAccount balance at beginning of period 127,329 126,157 129,609 132,056 127,329 130,889 125,821 129,530 130,889 Deposits & Withdrawals 2,240 1,046 1,380 (1,702) 2,964 (6,260) 2,491 10,365 6,596 Market movements 184 3,411 2,396 (1,265) 4,726 1,034 3,458 1,457 5,949 Currency movements (3,076) (989) (1,313) 1,618 (3,761) (344) (2,113) (946) (3,404) Other (520) (16) (16) 182 (369) 502 (127) 900 1,276 Total other third-party assets under management at end of period ² 126,157 129,609 132,056 130,889 130,889 125,821 129,530 141,306 141,306
1 Please note that the numbers provided in this line are also included in other primary segments.2 Includes pooled fund sales that are recognized on the balance sheet of Aegon UK. These assets are eliminated in our consolidated revenue generating investments.
2016 2017
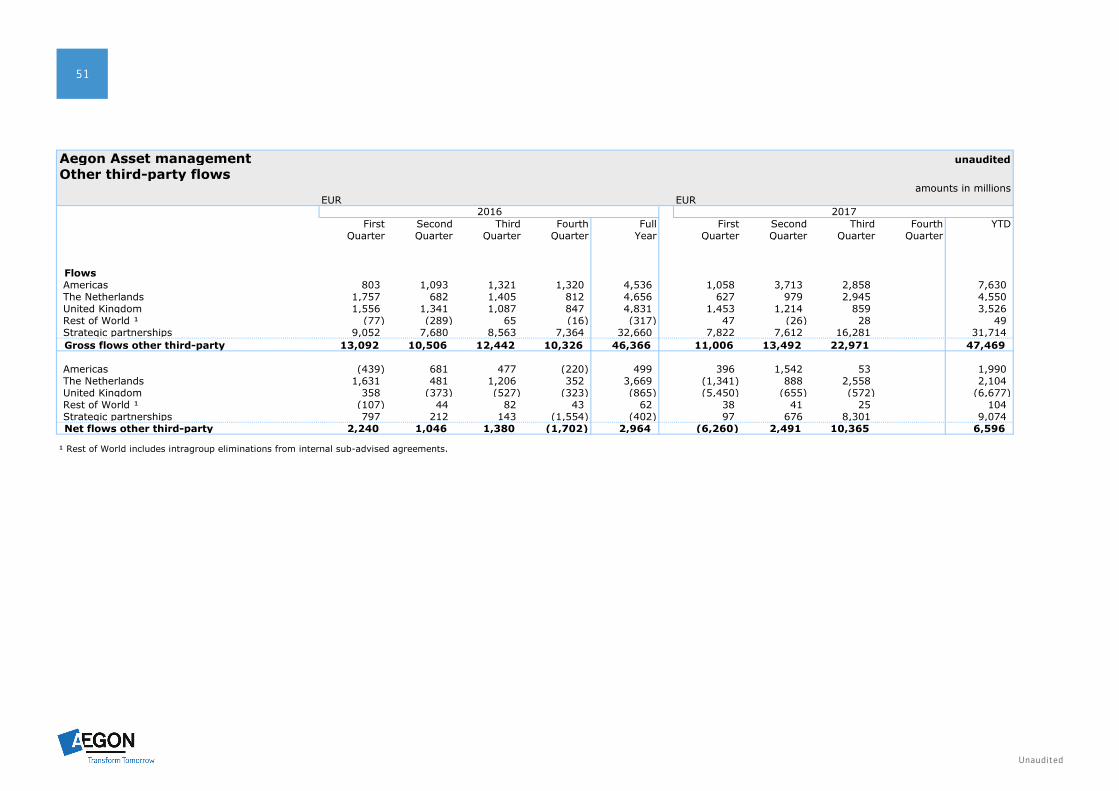
Unaudited
51
Aegon Asset management unauditedOther third-party flows
amounts in millionsEUR EUR
First Second Third Fourth Full First Second Third Fourth YTDQuarter Quarter Quarter Quarter Year Quarter Quarter Quarter Quarter
FlowsAmericas 803 1,093 1,321 1,320 4,536 1,058 3,713 2,858 7,630 The Netherlands 1,757 682 1,405 812 4,656 627 979 2,945 4,550 United Kingdom 1,556 1,341 1,087 847 4,831 1,453 1,214 859 3,526 Rest of World ¹ (77) (289) 65 (16) (317) 47 (26) 28 49 Strategic partnerships 9,052 7,680 8,563 7,364 32,660 7,822 7,612 16,281 31,714 Gross flows other third-party 13,092 10,506 12,442 10,326 46,366 11,006 13,492 22,971 47,469
Americas (439) 681 477 (220) 499 396 1,542 53 1,990 The Netherlands 1,631 481 1,206 352 3,669 (1,341) 888 2,558 2,104 United Kingdom 358 (373) (527) (323) (865) (5,450) (655) (572) (6,677) Rest of World ¹ (107) 44 82 43 62 38 41 25 104 Strategic partnerships 797 212 143 (1,554) (402) 97 676 8,301 9,074 Net flows other third-party 2,240 1,046 1,380 (1,702) 2,964 (6,260) 2,491 10,365 6,596
¹ Rest of World includes intragroup eliminations from internal sub-advised agreements.
2016 2017
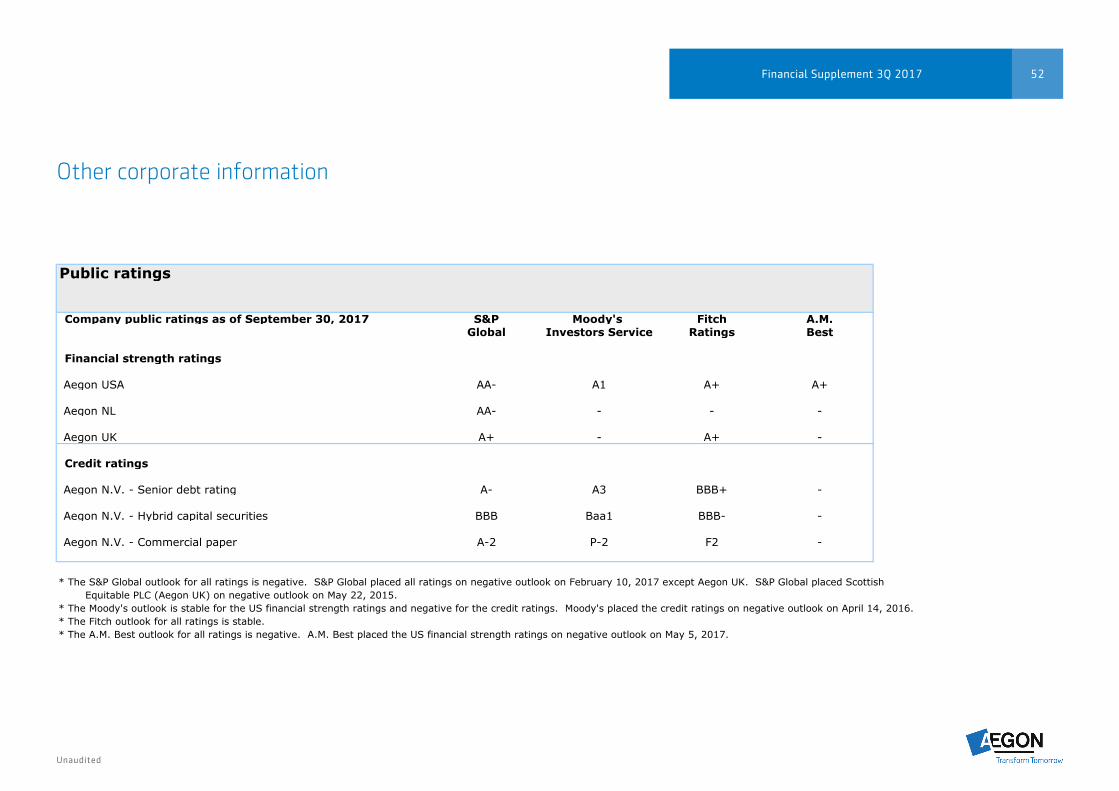
Unaudited
52Financial Supplement 3Q 2017
Other corporate information
Public ratings
Company public ratings as of September 30, 2017 S&P Moody's Fitch A.M.Global Investors Service Ratings Best
Financial strength ratings
Aegon USA AA- A1 A+ A+
Aegon NL AA- - - -
Aegon UK A+ - A+ -
Credit ratings
Aegon N.V. - Senior debt rating A- A3 BBB+ -
Aegon N.V. - Hybrid capital securities BBB Baa1 BBB- -
Aegon N.V. - Commercial paper A-2 P-2 F2 -
* The S&P Global outlook for all ratings is negative. S&P Global placed all ratings on negative outlook on February 10, 2017 except Aegon UK. S&P Global placed Scottish Equitable PLC (Aegon UK) on negative outlook on May 22, 2015.* The Moody's outlook is stable for the US financial strength ratings and negative for the credit ratings. Moody's placed the credit ratings on negative outlook on April 14, 2016.* The Fitch outlook for all ratings is stable.* The A.M. Best outlook for all ratings is negative. A.M. Best placed the US financial strength ratings on negative outlook on May 5, 2017.
Unaudited
53
Glossary on business lines
The description of each business line provides general guidance to the readerbut is not intended to be exhaustive and may change from time to time.
Life
Life includes products with mortality, morbidity and longevity risks. Reported in this line
are traditional life insurance products, including endowment, term and whole life, sold in
the Americas, the Netherlands, the UK, Central & Eastern Europe, Asia and Spain & Portugal.
Also included are annuity and long-term savings products sold in the Netherlands and the UK.
Accident and health business includes products with morbidity risk, such as accidental death and
dismemberment insurance, critical illness, cancer treatment, disability, income protection and long-
term care insurance in the Americas, the Netherlands, the UK and Spain & Portugal.
Individual savings and retirement products
Individual savings and retirement products consists primarily of fixed and variable annuity products
sold in the Americas. Products in this line are primarily in the accumulation phase but immediate
and payout annuities are also included. Retail mutual funds sold in the Americas are also included
in this line.
Pensions
Pensions includes defined benefit and defined contribution pension business sold both on an
individual and group basis. It comprises products in the accumulation phase as well as in the pay-
out phase. Also included in this line is the Stable Value Solutions business in the Americas. As from
2017 the Cofunds business in the UK is included in this line as well.
Non-life
Non-life includes mainly automotive insurance, liability insurance, household insurance and fire
protection sold both in the Netherlands and Central & Eastern Europe and Spain & Portugal.
Also included are disability and sick leave products sold in the Netherlands.
Distribution
Distribution includes the results from Aegon’s independent financial advisors in the Netherlands,
Unirobe Meeùs and Nedasco.
Asset Management
Asset Management includes equity and fixed income investment solutions for third party clients,
insurance-linked products and Aegon’s own insurance companies.
Run-off businesses
Business lines that Aegon has exited and has decided to wind down are included in the line Run-off
businesses. This includes institutional spread-based products such as Guaranteed Investment
Contracts (GICs) and funding agreements which were marketed to institutional clients, as well as
pay-out annuities, bank- and corporate-owned life insurance (BOLI/COLI), and life reinsurance.
All businesses currently in run-off were previously included in the results for Aegon Americas.
Other
Other is used to report any items which cannot be directly allocated to a specific line of business.
Results in this line are mainly related to Aegon’s holding companies and include the interest
expense associated with Aegon’s financial leverage.
Unaudited
54Financial Supplement 3Q 2017
Disclaimers Cautionary note regarding non-IFRS-EU measuresThis document includes the following non-IFRS-EU financial measures: underlying earnings before tax, income tax, income before tax, market consistent value of new business, and return on equity. These non-IFRS-EU measures are calculated by consolidating on a proportionate basis Aegon’s joint ventures and associated companies. The reconciliation of these measures, except for market consistent value of new business, to the most comparable IFRS-EU measure is provided in note 3 ‘Segment information’ of Aegon’s Condensed Consolidated Interim Financial Statements. Market consistent value of new business is not based on IFRS-EU, which are used to report Aegon’s primary financial statements and should not be viewed as a substitute for IFRS-EU financial measures. Aegon may define and calculate market consistent value of new business differently than other companies. Return on equity is a ratio using a non-IFRS-EU measure and is calculated by dividing the net underlying earnings after cost of leverage by the average shareholders’ equity excluding the preferred shares, the revaluation reserve and the reserves related to defined benefit plans. Aegon believes that these non-IFRS-EU measures, together with the IFRS-EU information, provide meaningful supplemental information about the underlying operating results of Aegon’s business including insight into the financial measures that senior management uses in managing the business.
Currency exchange ratesThis document contains certain information about Aegon’s results, financial condition and revenue generating investments presented in USD for the Americas and Asia and GBP for the United Kingdom, because those businesses operate and are managed primarily in those currencies. None of this information is a substitute for or superior to financial information about Aegon presented in EUR, which is the currency of Aegon’s primary financial statements.
Forward-looking statementsThe statements contained in this document that are not historical facts are forward-looking statements as defined in the US Private Securities Litigation Reform Act of 1995. The following are words that identify such forward-looking statements: aim, believe, estimate, target, intend, may, expect, anticipate, predict, project, counting on, plan, continue, want, forecast, goal, should, would, is confident, will, and similar expressions as they relate to Aegon. These statements are not guarantees of future performance and involve risks, uncertainties and assumptions that are difficult to predict. Aegon undertakes no obligation to publicly update or revise any forward-looking statements. Readers are cautioned not to place undue reliance on these forward-looking statements, which merely reflect company expectations at the time of writing. Actual results may differ materially from expectations conveyed in forward-looking statements due to changes caused by various risks and uncertainties. Such risks and uncertainties include but are not limited to the following:
� Changes in general economic conditions, particularly in the United States, the Netherlands and the United Kingdom; � Changes in the performance of financial markets, including emerging markets, such as with regard to:
- The frequency and severity of defaults by issuers in Aegon’s fixed income investment portfolios; - The effects of corporate bankruptcies and/or accounting restatements on the financial markets and the resulting
decline in the value of equity and debt securities Aegon holds; and - The effects of declining creditworthiness of certain public sector securities and the resulting decline in the value of
government exposure that Aegon holds; � Changes in the performance of Aegon’s investment portfolio and decline in ratings of Aegon’s counterparties; � Consequences of a potential (partial) break-up of the euro; � Consequences of the anticipated exit of the United Kingdom from the European Union; � The frequency and severity of insured loss events; � Changes affecting longevity, mortality, morbidity, persistence and other factors that may impact the profitability of
Aegon’s insurance products; � Reinsurers to whom Aegon has ceded significant underwriting risks may fail to meet their obligations; � Changes affecting interest rate levels and continuing low or rapidly changing interest rate levels; � Changes affecting currency exchange rates, in particular the EUR/USD and EUR/GBP exchange rates; � Changes in the availability of, and costs associated with, liquidity sources such as bank and capital markets funding, as
well as conditions in the credit markets in general such as changes in borrower and counterparty creditworthiness;
� Increasing levels of competition in the United States, the Netherlands, the United Kingdom and emerging markets; � Changes in laws and regulations, particularly those affecting Aegon’s operations’ ability to hire and retain key personnel,
taxation of Aegon companies, the products Aegon sells, and the attractiveness of certain products to its consumers; � Regulatory changes relating to the pensions, investment, and insurance industries in the jurisdictions in which Aegon
operates; � Standard setting initiatives of supranational standard setting bodies such as the Financial Stability Board and the
International Association of Insurance Supervisors or changes to such standards that may have an impact on regional (such as EU), national or US federal or state level financial regulation or the application thereof to Aegon, including the designation of Aegon by the Financial Stability Board as a Global Systemically Important Insurer (G-SII);
� Changes in customer behavior and public opinion in general related to, among other things, the type of products Aegon sells, including legal, regulatory or commercial necessity to meet changing customer expectations;
� Acts of God, acts of terrorism, acts of war and pandemics; � Changes in the policies of central banks and/or governments; � Lowering of one or more of Aegon’s debt ratings issued by recognized rating organizations and the adverse impact such
action may have on Aegon’s ability to raise capital and on its liquidity and financial condition; � Lowering of one or more of insurer financial strength ratings of Aegon’s insurance subsidiaries and the adverse impact
such action may have on the premium writings, policy retention, profitability and liquidity of its insurance subsidiaries; � The effect of the European Union’s Solvency II requirements and other regulations in other jurisdictions affecting the
capital Aegon is required to maintain; � Litigation or regulatory action that could require Aegon to pay significant damages or change the way Aegon does
business; � As Aegon’s operations support complex transactions and are highly dependent on the proper functioning of information
technology, a computer system failure or security breach may disrupt Aegon’s business, damage its reputation and adversely affect its results of operations, financial condition and cash flows;
� Customer responsiveness to both new products and distribution channels; � Competitive, legal, regulatory, or tax changes that affect profitability, the distribution cost of or demand for Aegon’s
products; � Changes in accounting regulations and policies or a change by Aegon in applying such regulations and policies, voluntarily
or otherwise, which may affect Aegon’s reported results and shareholders’ equity; � Aegon’s projected results are highly sensitive to complex mathematical models of financial markets, mortality, longevity,
and other dynamic systems subject to shocks and unpredictable volatility. Should assumptions to these models later prove incorrect, or should errors in those models escape the controls in place to detect them, future performance will vary from projected results;
� The impact of acquisitions and divestitures, restructurings, product withdrawals and other unusual items, including Aegon’s ability to integrate acquisitions and to obtain the anticipated results and synergies from acquisitions;
� Catastrophic events, either manmade or by nature, could result in material losses and significantly interrupt Aegon’s business;
� Aegon’s failure to achieve anticipated levels of earnings or operational efficiencies as well as other cost saving and excess capital and leverage ratio management initiatives; and
� This press release contains information that qualifies, or may qualify, as inside information within the meaning of Article 7(1) of the EU Market Abuse Regulation.
Further details of potential risks and uncertainties affecting Aegon are described in its filings with the Netherlands Authority for the Financial Markets and the US Securities and Exchange Commission, including the Annual Report. These forward-looking statements speak only as of the date of this document. Except as required by any applicable law or regulation, Aegon expressly disclaims any obligation or undertaking to release publicly any updates or revisions to any forward-looking statements contained herein to reflect any change in Aegon’s expectations with regard thereto or any change in events, conditions or circumstances on which any such statement is based.
Unaudited
55
HeadquartersAegon N.V.
P.O. Box 85
2501 CB The Hague
The Netherlands
+ 31 (0) 70 344 32 10
aegon.com
Group Corporate Communications & Investor Relations
Media relations+ 31 (0) 70 344 8344
Investor relations + 31 (0) 70 344 83 05
or 877 548 96 68 - toll free, USA only
Publication date quarterly results 2018 February 15, 2018 Results fourth quarter 2017
August 16, 2018 Results first half year 2018
Aegon’s 3Q 2017 press release and Condensed consolidated interim financial statements are
available on aegon.com.
Corporate and shareholder information

Aegon’s roots go back more than 170 years – to the first half of the nineteenth century. Since then, Aegon has grown into an international company, with businesses in more than 20 countries in the Americas,
Europe and Asia. Today, Aegon is one of the world’s leading financial services organizations, providing life insurance, pensions and asset management. Aegon’s purpose is to help people achieve a lifetime of
financial security. More information: aegon.com.
About Aegon