Embed Size (px)
Citation preview

1
KOREAN AIR
3Q17 FINANCIAL RESULTS

2
Disclaimer
This presentation is for informational purposes only, contains preliminary financial and other
information about Korean Air Lines Co., Ltd. and is subject to updating, revision, amendment and
completion. This presentation does not and is not intended to constitute or contain any offer of
securities for sale or a solicitation of an offer to purchase any securities of Korean Air Lines Co.,
Ltd. or any other company and neither this presentation nor anything contained herein shall form the
basis of any contract or commitment. Certain statements contained in this presentation may be
statements of future expectations and other forward-looking statements or trend information that are
based on management's current views and assumptions and involve known and unknown risks and
uncertainties that could cause actual results, performance or events to differ materially from those in
the forward-looking statements in this presentation. In addition to statements which are forward-
looking by reason of context, including without limitation, statements referring to risk limitations,
operational profitability, financial strength, performance targets, profitable growth opportunities, and
risk adequate pricing, the words "may, will, should, expects, plans, intends, anticipates, believes,
estimates, predicts, or continue", "potential, future, or further", and similar expressions are intended
to identify forward-looking statements. Korean Air Lines Co., Ltd. assumes no obligation to update
or revise any such statements or any other information contained herein to reflect events or
circumstances that may arise after the date of this presentation.

3
2016 Sep 30, 2017 Changes Rate
Current Assets 3,328 4,158 830 24.9%
Cash & Cash equivalent 1,090 1,109 19 1.8%
Non-Current Assets 20,629 21,034 406 2.0%
Aircraft related assets 13,728 14,180 452 3.3%
Investment in associates 24 38 14 57.4%
Total Assets 23,957 25,192 1,236 5.2%
Financial Liabilities 16,305 15,876 -428 -2.6%
Other Liabilities 5,778 6,278 500 8.7%
Total Liabilities 22,082 22,154 72 0.3%
Total Equity 1,874 3,038 1,164 62.1%
Financial Position (Consolidated)
(billion KRW)

4
2016
3Q
2017
3QChanges
2016
1~3Q
2017
1~3QChanges
Sales 3,118 3,214 3.1% 8,803 8,985 2.1%
Operating Expense 2,658 2,859 7.5% 7,861 8,265 5.2%
Operating Profit 460 355 -22.7% 942 720 -23.6%
Non Operating Profit 146 -246 -799 -137
Foreign currency
related gain, net638 -97 587 394
Interest Expense, net -93 -103 -273 -303
Income Before Tax 606 109 143 583
Net Income 511 62 85 420
Income Statement (Consolidated)
(billion KRW)

5
2016
3Q
2017
3QChanges
2016
1~3Q
2017
1~3QChanges
Sales 3,057 3,126 2.3% 8,635 8,788 1.8%
Operating Expense 2,609 2,747 5.3% 7,731 8,063 4.3%
Operating Profit 448 379 -15.4% 904 725 -19.7%
Non-Operating Profit 72 -260 -775 -142
Foreign currency related
gain/loss, net639 -98 588 405
Interest expense, net -92 -103 -270 -302
Income Before Tax 519 118 129 583
Net Income 428 76 80 429
Income Statement (Non-consolidated)
(billion KRW)
6
Balance
(billion)Ratio
Balance
(billion)Ratio
Balance
(billion)Ratio
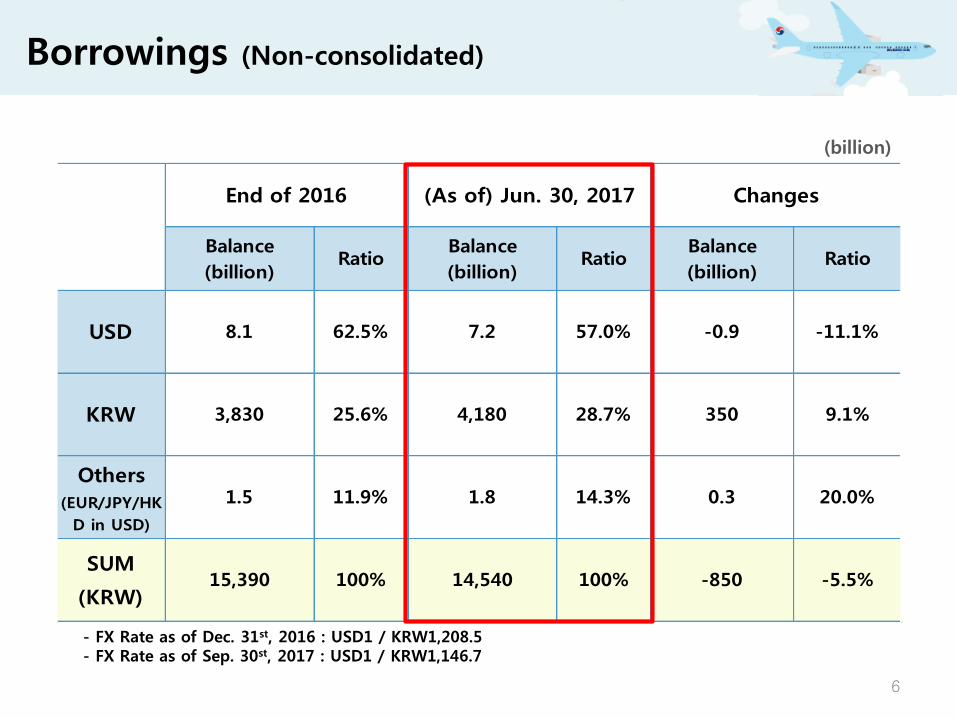
USD 8.1 62.5% 7.2 57.0% -0.9 -11.1%
KRW 3,830 25.6% 4,180 28.7% 350 9.1%
Others
(EUR/JPY/HK
D in USD)
1.5 11.9% 1.8 14.3% 0.3 20.0%
SUM
(KRW)15,390 100% 14,540 100% -850 -5.5%
End of 2016 Changes(As of) Jun. 30, 2017
Borrowings (Non-consolidated)
(billion)
- FX Rate as of Dec. 31st, 2016 : USD1 / KRW1,208.5- FX Rate as of Sep. 30st, 2017 : USD1 / KRW1,146.7

7
3Q2017
(3,126 billion KRW)
Domestic
Passenger
4.4%
International
Passenger
57.1%
Cargo
22.4%
Others
9.4%
Aerospace
6.7%
3Q2016
(3,057 billion KRW)
Domestic
Passenger
4.6%
International
Passenger
60.4%
Cargo
19.1%Others
9.9%
Aerospace
6.0%
Revenue Composition (Non-consolidated)

8
3Q16 3Q17 YoY 3Q16 3Q17 YoY
Capacity (Mil ASK) 24,243 24,936 2.9% 997 987 -1.0%
JUL 8,195 8,445 3.0% 320 337 5.2%
AUG 8,303 8,540 2.9% 342 339 -1.0%
SEP 7,745 7,951 2.7% 335 311 -7.0%
Traffic (Mil RPK) 19,604 20,223 3.2% 796 767 -3.6%
JUL 6,767 6,883 1.7% 265 249 -6.0%
AUG 6,858 7,070 3.1% 282 276 -2.2%
SEP 5,978 6,270 4.9% 249 243 -2.4%
L/F(%) 80.9% 81.1% 0.2%p 79.8% 77.7% -2.0%p
Yield (KRW) 94.0 88.2 -6.1% 178.3 177.5 -0.4%
Yield (US Cent) 8.4 7.8 -7.1% 15.9 15.7 -1.4%
구 분International Domestic
Passenger Traffic
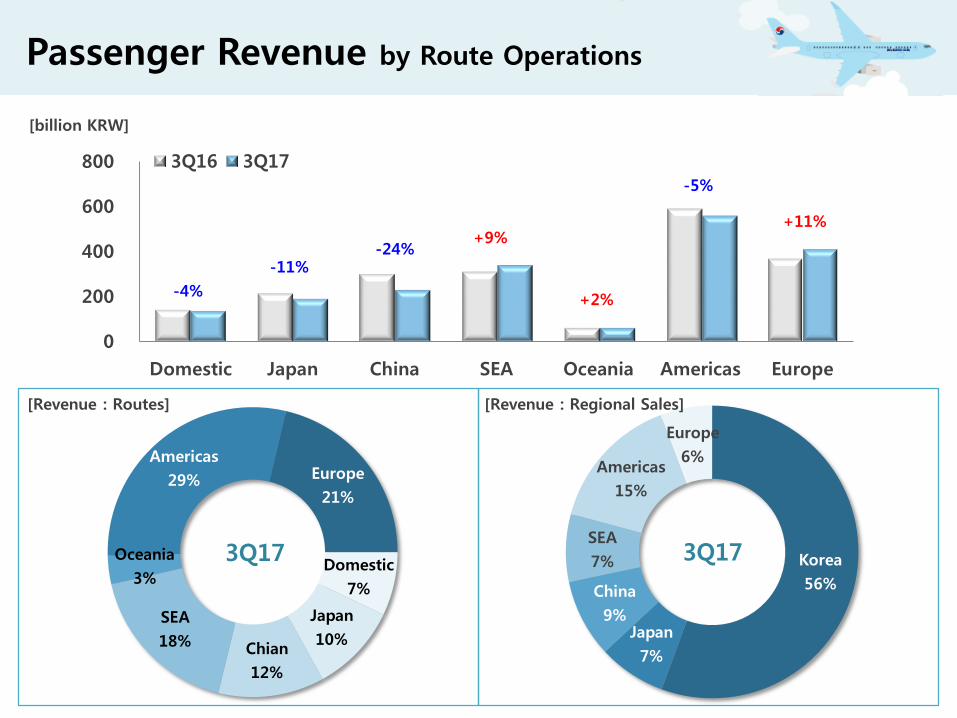
Domestic
7%
Japan
10%Chian
12%
SEA
18%
Oceania
3%
Americas
29% Europe
21%
3Q17
0
200
400
600
800
Domestic Japan China SEA Oceania Americas Europe
3Q16 3Q17
-4%
-11%
+9%
+2%
-5%
-24%
+11%
Korea
56%
Japan
7%
China
9%
SEA
7%
Americas
15%
Europe
6%
3Q17
Passenger Revenue by Route Operations
[billion KRW]
[Revenue : Routes] [Revenue : Regional Sales]

10
Traffic(RPK) Changes : SEA 14%↑, Europe 9%↑, Oceania 6%↑, Americas 2%↑, Japan 11%↓, China 19%↓
Number of Passengers Carried : 3%↑(Korea Outbound 9%↑, Overseas 2%↓)
Expect strong Korea outbound demand deferred from 3Q to long holidays in October and slow demand recovery from China
Plan to improve profitability with more frequency in SEA and Europe routes
Frequency Expansion : Incheon-Hanoi/Da Nang/Barcelona/Honolulu/Bangkok/Osaka/Fukuoka
Frequency Reduction : Incheon-Vienna/Zurich/Houston
Passenger Business Overview
3Q Business Summary
4Q Business Outlook & Plan

11
3Q16 3Q17 YoY
Capacity (Mil AFTK) 2,680 2,794 4.3%
JUL 916 924 0.9%
AUG 890 935 5.1%
SEP 874 934 7.0%
Traffic (Mil FTK) 2,026 2,179 7.5%
JUL 692 727 5.0%
AUG 660 719 8.9%
SEP 675 734 8.7%
L/F (%) 75.6% 78.0% 2.4%p
Yield (KRW) 257.7 292.2 13.4%
Yield (US Cent) 23.0 25.8 12.3%
Cargo (International + Domestic)
Cargo Traffic

Domestic
1%
Japan
5%China
10%SEA
14%Oceania
1%
Americas
43%
Europe
26%
3Q17
0
100
200
300
400
Domestic Japan China SEA Oceania Americas Europe
3Q16 3Q17
+7%+25%
+28%
+18%
+23%
+17%
+19%
Korea
25%
Japan
9%
China
26%
SEA
15%
Americas
13%
Europe
12%
3Q17
Cargo Revenue by Route Operations
[billion KRW]
[Revenue : Routes] [Revenue : Regional Sales]

13
Traffic(FTK) Change : Japan 31%↑, Oceania 20%↑, SEA 8%↑, Americas 7%↑, Europe 7%↑, China 6%↑
Total Tonnage Carried : 10%↑ (Korea Outbound 8%↑, Overseas 10%↑)
Expect strong demand to continue during winter peak season
Expect positive cargo demand with the 4th industrial revolution and restored consumer confidence
Plan to provide flexible capacity, expand new air cargo products, and improve cargo network
Cargo Business Overview
3Q Business Summary
4Q Business Outlook & Plan
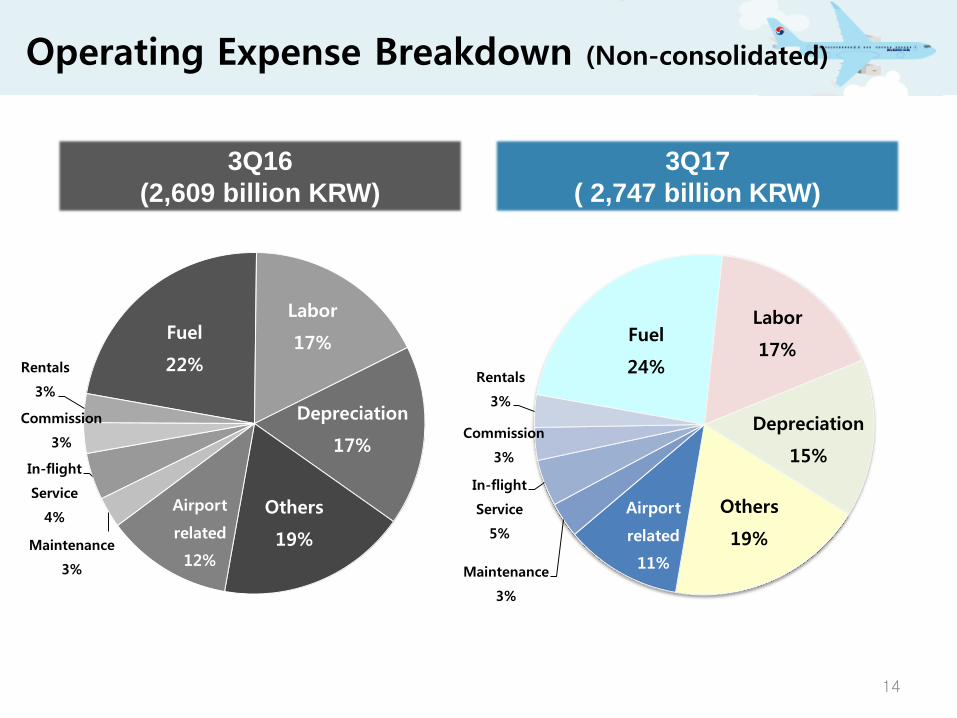
14
Fuel
24%
Labor
17%
Depreciation
15%
Others
19%
Airport
related
11%Maintenance
3%
In-flight
Service
5%
Commission
3%
Rentals
3%
3Q17
( 2,747 billion KRW)
3Q16
(2,609 billion KRW)
Fuel
22%
Labor
17%
Depreciation
17%
Others
19%
Airport
related
12%Maintenance
3%
In-flight
Service
4%
Commission
3%
Rentals
3%
Operating Expense Breakdown (Non-consolidated)

Type No. of Aircrafts Delivery in 4Q17(Month)
A380 10
A330 29
B747-400 4
B747-8I 10
B777 38
B787-9 4 ⑫
B737 36
CS300 0
Passenger Total 131 1
B747F 11
B747-8F 7
B777F 11 ⑩
Cargo Total 29 1
Total 160 2
15
Fleet Status
(As of Sep 30th, 2017)
※CS300 delivery schedule is undecided

16
Thank you