Embed Size (px)
Citation preview

4643 S Ulster Street | Suite 1040 | Denver, CO 80237 303.694.1900 | innovestinc.com
PRODUCT ANALYSIS 3Q17
Littleton Public Schools
Wendy Dominguez, MBA
Elizabeth Stemper, AIF®, QPFC
Peter Mustian
FUND INFORMATION
ROLLING 3 YEAR RETURN AND PERCENTILE RANKINGS
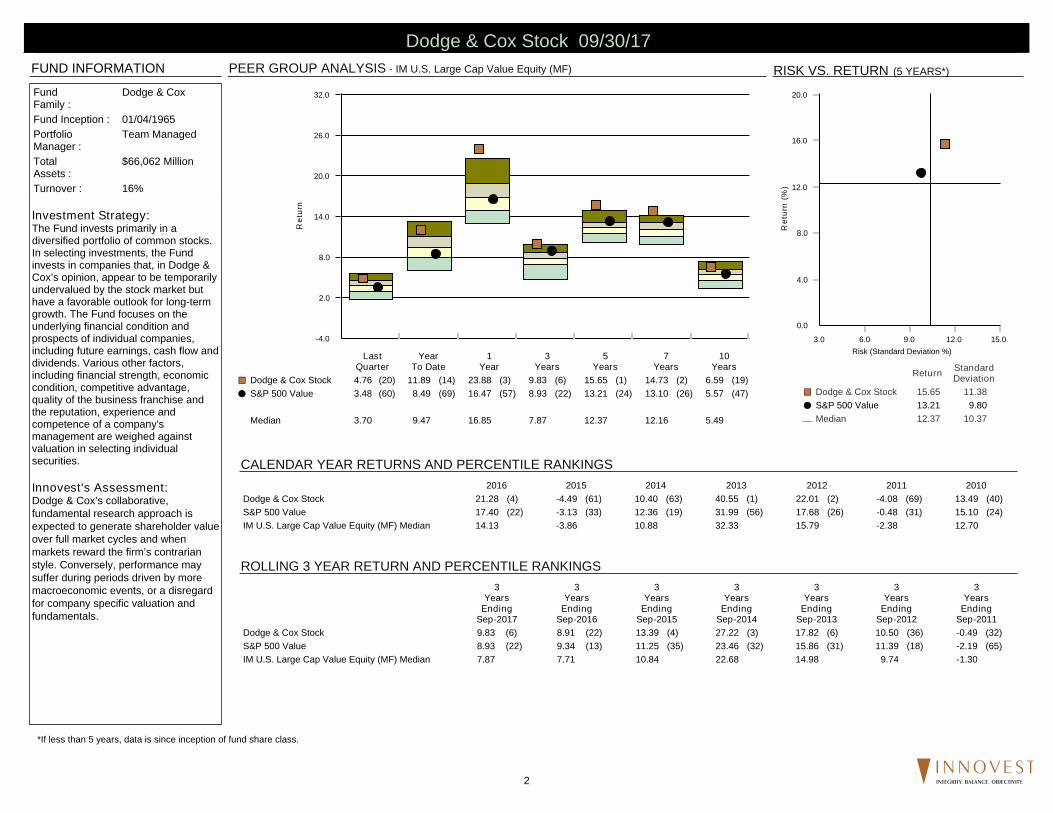
PEER GROUP ANALYSIS - IM U.S. Large Cap Value Equity (MF)
CALENDAR YEAR RETURNS AND PERCENTILE RANKINGS
RISK VS. RETURN (5 YEARS*)
*If less than 5 years, data is since inception of fund share class.
Investment Strategy:The Fund invests primarily in adiversified portfolio of common stocks.In selecting investments, the Fundinvests in companies that, in Dodge &Cox’s opinion, appear to be temporarilyundervalued by the stock market buthave a favorable outlook for long-termgrowth. The Fund focuses on theunderlying financial condition andprospects of individual companies,including future earnings, cash flow anddividends. Various other factors,including financial strength, economiccondition, competitive advantage,quality of the business franchise andthe reputation, experience andcompetence of a company'smanagement are weighed againstvaluation in selecting individualsecurities.
Innovest's Assessment:Dodge & Cox’s collaborative,fundamental research approach isexpected to generate shareholder valueover full market cycles and whenmarkets reward the firm’s contrarianstyle. Conversely, performance maysuffer during periods driven by moremacroeconomic events, or a disregardfor company specific valuation andfundamentals.
-4.0
2.0
8.0
14.0
20.0
26.0
32.0
Ret
urn
LastQuarter
YearTo Date
1Year
3Years
5Years
7Years
10Years
Dodge & Cox Stock 4.76 (20) 11.89 (14) 23.88 (3) 9.83 (6) 15.65 (1) 14.73 (2) 6.59 (19)¢£
S&P 500 Value 3.48 (60) 8.49 (69) 16.47 (57) 8.93 (22) 13.21 (24) 13.10 (26) 5.57 (47)��
Median 3.70 9.47 16.85 7.87 12.37 12.16 5.49
0.0
4.0
8.0
12.0
16.0
20.0
Ret
urn
(%)
3.0 6.0 9.0 12.0 15.0Risk (Standard Deviation %)
Return StandardDeviation
Dodge & Cox Stock 15.65 11.38¢£
S&P 500 Value 13.21 9.80��
Median 12.37 10.37¾
FundFamily :
Dodge & Cox
Fund Inception : 01/04/1965PortfolioManager :
Team Managed
TotalAssets :
$66,062 Million
Turnover : 16%
2016 2015 2014 2013 2012 2011 2010Dodge & Cox Stock 21.28 (4) -4.49 (61) 10.40 (63) 40.55 (1) 22.01 (2) -4.08 (69) 13.49 (40)S&P 500 Value 17.40 (22) -3.13 (33) 12.36 (19) 31.99 (56) 17.68 (26) -0.48 (31) 15.10 (24)IM U.S. Large Cap Value Equity (MF) Median 14.13 -3.86 10.88 32.33 15.79 -2.38 12.70
3Years
EndingSep-2017
3Years
EndingSep-2016
3Years
EndingSep-2015
3Years
EndingSep-2014
3Years
EndingSep-2013
3Years
EndingSep-2012
3Years
EndingSep-2011
Dodge & Cox Stock 9.83 (6) 8.91 (22) 13.39 (4) 27.22 (3) 17.82 (6) 10.50 (36) -0.49 (32)S&P 500 Value 8.93 (22) 9.34 (13) 11.25 (35) 23.46 (32) 15.86 (31) 11.39 (18) -2.19 (65)IM U.S. Large Cap Value Equity (MF) Median 7.87 7.71 10.84 22.68 14.98 9.74 -1.30
Dodge & Cox Stock 09/30/17
2 INTEGRITY. BALANCE. OBJECTIVITY.
SECTOR ALLOCATION
STYLE MAP (01/01/79 - 09/30/17)
SECTOR PERFORMANCE
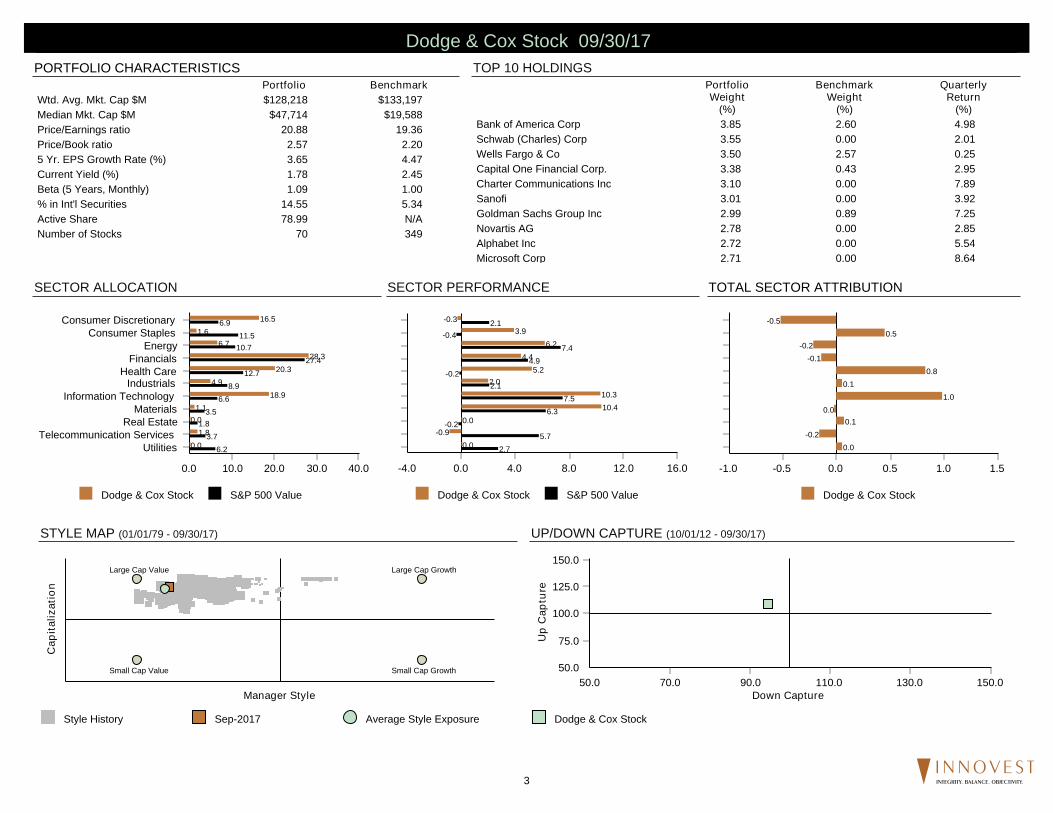
TOP 10 HOLDINGSPORTFOLIO CHARACTERISTICS
UP/DOWN CAPTURE (10/01/12 - 09/30/17)
TOTAL SECTOR ATTRIBUTION
PortfolioWeight
(%)
BenchmarkWeight
(%)
QuarterlyReturn
(%)Bank of America Corp 3.85 2.60 4.98Schwab (Charles) Corp 3.55 0.00 2.01Wells Fargo & Co 3.50 2.57 0.25Capital One Financial Corp. 3.38 0.43 2.95Charter Communications Inc 3.10 0.00 7.89Sanofi 3.01 0.00 3.92Goldman Sachs Group Inc 2.99 0.89 7.25Novartis AG 2.78 0.00 2.85Alphabet Inc 2.72 0.00 5.54Microsoft Corp 2.71 0.00 8.64
% of Portfolio 31.59 6.49
Portfolio BenchmarkWtd. Avg. Mkt. Cap $M $128,218 $133,197Median Mkt. Cap $M $47,714 $19,588Price/Earnings ratio 20.88 19.36Price/Book ratio 2.57 2.205 Yr. EPS Growth Rate (%) 3.65 4.47Current Yield (%) 1.78 2.45Beta (5 Years, Monthly) 1.09 1.00% in Int'l Securities 14.55 5.34Active Share 78.99 N/ANumber of Stocks 70 349
Dodge & Cox Stock S&P 500 Value
0.0 10.0 20.0 30.0 40.0
UtilitiesTelecommunication Services
Real EstateMaterials
Information TechnologyIndustrials
Health CareFinancials
EnergyConsumer Staples
Consumer Discretionary
0.01.8
0.01.1
18.94.9
20.328.3
6.71.6
16.5
6.23.7
1.83.5
6.68.9
12.727.4
10.711.5
6.9
Dodge & Cox Stock
0.0 0.5 1.0 1.5-0.5-1.0
0.0-0.2
0.10.0
1.00.1
0.8-0.1
-0.20.5
-0.5
Dodge & Cox Stock S&P 500 Value
0.0 4.0 8.0 12.0 16.0-4.0
0.0-0.9
0.010.410.3
2.05.2
4.46.2
3.9-0.3
2.75.7
-0.26.3
7.52.1
-0.24.9
7.4-0.4
2.1
Style History Sep-2017 Average Style Exposure
Cap
italiz
atio
n
Manager Style
Large Cap Growth
Small Cap GrowthSmall Cap Value
Large Cap Value
Dodge & Cox Stock
50.0
75.0
100.0
125.0
150.0
Up
Cap
ture
50.0 70.0 90.0 110.0 130.0 150.0Down Capture
Dodge & Cox Stock 09/30/17
3 INTEGRITY. BALANCE. OBJECTIVITY.
FUND INFORMATION
ROLLING 3 YEAR RETURN AND PERCENTILE RANKINGS
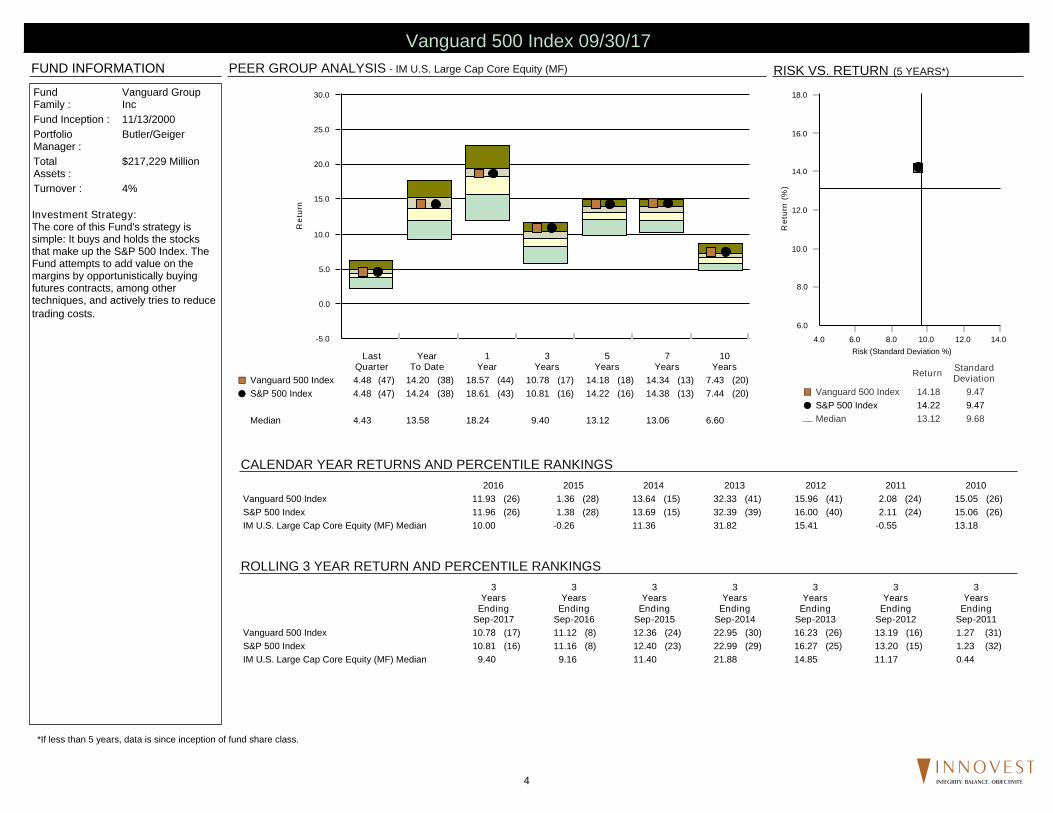
PEER GROUP ANALYSIS - IM U.S. Large Cap Core Equity (MF)
CALENDAR YEAR RETURNS AND PERCENTILE RANKINGS
RISK VS. RETURN (5 YEARS*)
*If less than 5 years, data is since inception of fund share class.
Investment Strategy:The core of this Fund's strategy issimple: It buys and holds the stocksthat make up the S&P 500 Index. TheFund attempts to add value on themargins by opportunistically buyingfutures contracts, among othertechniques, and actively tries to reducetrading costs.
-5.0
0.0
5.0
10.0
15.0
20.0
25.0
30.0
Ret
urn
LastQuarter
YearTo Date
1Year
3Years
5Years
7Years
10Years
Vanguard 500 Index 4.48 (47) 14.20 (38) 18.57 (44) 10.78 (17) 14.18 (18) 14.34 (13) 7.43 (20)¢£
S&P 500 Index 4.48 (47) 14.24 (38) 18.61 (43) 10.81 (16) 14.22 (16) 14.38 (13) 7.44 (20)��
Median 4.43 13.58 18.24 9.40 13.12 13.06 6.60
6.0
8.0
10.0
12.0
14.0
16.0
18.0
Ret
urn
(%)
4.0 6.0 8.0 10.0 12.0 14.0Risk (Standard Deviation %)
Return StandardDeviation
Vanguard 500 Index 14.18 9.47¢£
S&P 500 Index 14.22 9.47��
Median 13.12 9.68¾
FundFamily :
Vanguard GroupInc
Fund Inception : 11/13/2000PortfolioManager :
Butler/Geiger
TotalAssets :
$217,229 Million
Turnover : 4%
2016 2015 2014 2013 2012 2011 2010Vanguard 500 Index 11.93 (26) 1.36 (28) 13.64 (15) 32.33 (41) 15.96 (41) 2.08 (24) 15.05 (26)S&P 500 Index 11.96 (26) 1.38 (28) 13.69 (15) 32.39 (39) 16.00 (40) 2.11 (24) 15.06 (26)IM U.S. Large Cap Core Equity (MF) Median 10.00 -0.26 11.36 31.82 15.41 -0.55 13.18
3Years
EndingSep-2017
3Years
EndingSep-2016
3Years
EndingSep-2015
3Years
EndingSep-2014
3Years
EndingSep-2013
3Years
EndingSep-2012
3Years
EndingSep-2011
Vanguard 500 Index 10.78 (17) 11.12 (8) 12.36 (24) 22.95 (30) 16.23 (26) 13.19 (16) 1.27 (31)S&P 500 Index 10.81 (16) 11.16 (8) 12.40 (23) 22.99 (29) 16.27 (25) 13.20 (15) 1.23 (32)IM U.S. Large Cap Core Equity (MF) Median 9.40 9.16 11.40 21.88 14.85 11.17 0.44
Vanguard 500 Index 09/30/17
4 INTEGRITY. BALANCE. OBJECTIVITY.
SECTOR ALLOCATION
STYLE MAP (12/01/00 - 09/30/17)
SECTOR PERFORMANCE
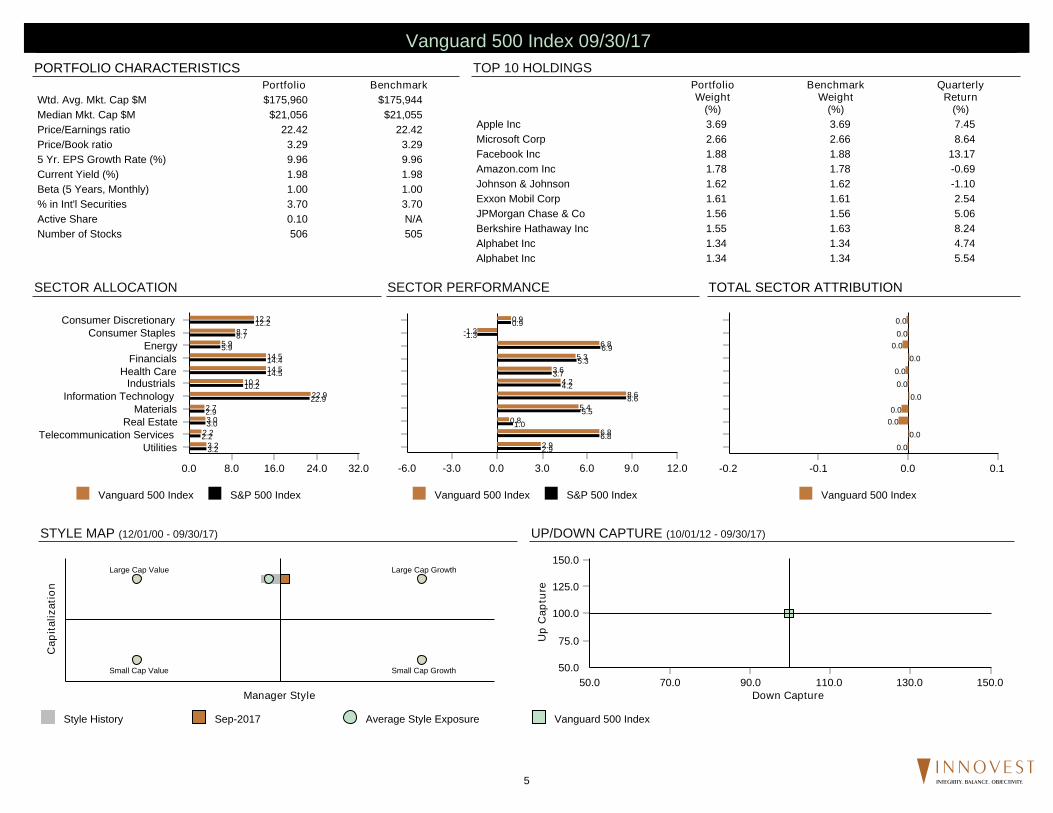
TOP 10 HOLDINGSPORTFOLIO CHARACTERISTICS
UP/DOWN CAPTURE (10/01/12 - 09/30/17)
TOTAL SECTOR ATTRIBUTION
PortfolioWeight
(%)
BenchmarkWeight
(%)
QuarterlyReturn
(%)Apple Inc 3.69 3.69 7.45Microsoft Corp 2.66 2.66 8.64Facebook Inc 1.88 1.88 13.17Amazon.com Inc 1.78 1.78 -0.69Johnson & Johnson 1.62 1.62 -1.10Exxon Mobil Corp 1.61 1.61 2.54JPMorgan Chase & Co 1.56 1.56 5.06Berkshire Hathaway Inc 1.55 1.63 8.24Alphabet Inc 1.34 1.34 4.74Alphabet Inc 1.34 1.34 5.54
% of Portfolio 19.03 19.11
Portfolio BenchmarkWtd. Avg. Mkt. Cap $M $175,960 $175,944Median Mkt. Cap $M $21,056 $21,055Price/Earnings ratio 22.42 22.42Price/Book ratio 3.29 3.295 Yr. EPS Growth Rate (%) 9.96 9.96Current Yield (%) 1.98 1.98Beta (5 Years, Monthly) 1.00 1.00% in Int'l Securities 3.70 3.70Active Share 0.10 N/ANumber of Stocks 506 505
Vanguard 500 Index S&P 500 Index
0.0 8.0 16.0 24.0 32.0
UtilitiesTelecommunication Services
Real EstateMaterials
Information TechnologyIndustrials
Health CareFinancials
EnergyConsumer Staples
Consumer Discretionary
3.22.23.02.7
22.910.2
14.514.5
5.98.7
12.2
3.22.2
3.02.9
22.910.2
14.514.4
5.98.7
12.2
Vanguard 500 Index
0.0 0.1-0.1-0.2
0.00.0
0.00.0
0.00.00.0
0.00.0
0.00.0
Vanguard 500 Index S&P 500 Index
0.0 3.0 6.0 9.0 12.0-3.0-6.0
2.96.8
0.85.4
8.64.2
3.65.3
6.8-1.3
0.9
2.96.8
1.05.5
8.64.2
3.75.3
6.9-1.3
0.9
Style History Sep-2017 Average Style Exposure
Cap
italiz
atio
n
Manager Style
Large Cap Growth
Small Cap GrowthSmall Cap Value
Large Cap Value
Vanguard 500 Index
50.0
75.0
100.0
125.0
150.0
Up
Cap
ture
50.0 70.0 90.0 110.0 130.0 150.0Down Capture
Vanguard 500 Index 09/30/17
5 INTEGRITY. BALANCE. OBJECTIVITY.
FUND INFORMATION
ROLLING 3 YEAR RETURN AND PERCENTILE RANKINGS
PEER GROUP ANALYSIS - IM U.S. Large Cap Growth Equity (MF)
CALENDAR YEAR RETURNS AND PERCENTILE RANKINGS
RISK VS. RETURN (5 YEARS*)
*If less than 5 years, data is since inception of fund share class.
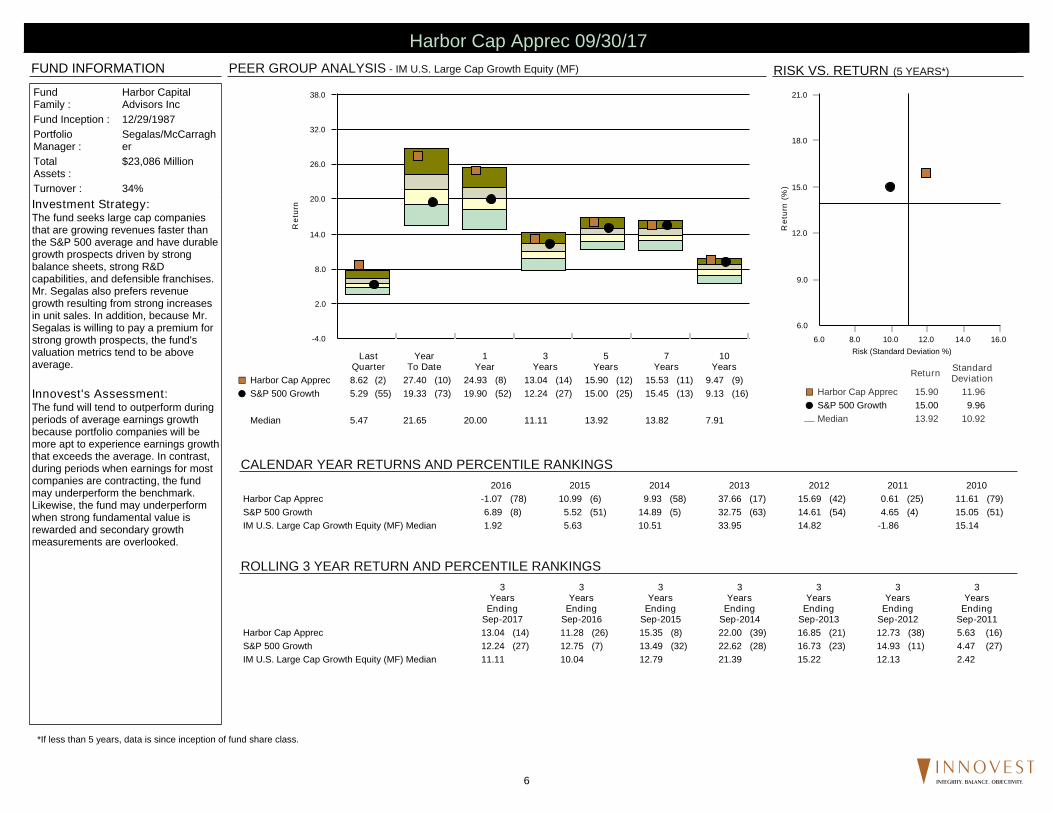
Investment Strategy:The fund seeks large cap companiesthat are growing revenues faster thanthe S&P 500 average and have durablegrowth prospects driven by strongbalance sheets, strong R&Dcapabilities, and defensible franchises.Mr. Segalas also prefers revenuegrowth resulting from strong increasesin unit sales. In addition, because Mr.Segalas is willing to pay a premium forstrong growth prospects, the fund'svaluation metrics tend to be aboveaverage.
Innovest's Assessment:The fund will tend to outperform duringperiods of average earnings growthbecause portfolio companies will bemore apt to experience earnings growththat exceeds the average. In contrast,during periods when earnings for mostcompanies are contracting, the fundmay underperform the benchmark.Likewise, the fund may underperformwhen strong fundamental value isrewarded and secondary growthmeasurements are overlooked.
-4.0
2.0
8.0
14.0
20.0
26.0
32.0
38.0
Ret
urn
LastQuarter
YearTo Date
1Year
3Years
5Years
7Years
10Years
Harbor Cap Apprec 8.62 (2) 27.40 (10) 24.93 (8) 13.04 (14) 15.90 (12) 15.53 (11) 9.47 (9)¢£
S&P 500 Growth 5.29 (55) 19.33 (73) 19.90 (52) 12.24 (27) 15.00 (25) 15.45 (13) 9.13 (16)��
Median 5.47 21.65 20.00 11.11 13.92 13.82 7.91
6.0
9.0
12.0
15.0
18.0
21.0
Ret
urn
(%)
6.0 8.0 10.0 12.0 14.0 16.0Risk (Standard Deviation %)
Return StandardDeviation
Harbor Cap Apprec 15.90 11.96¢£
S&P 500 Growth 15.00 9.96��
Median 13.92 10.92¾
FundFamily :
Harbor CapitalAdvisors Inc
Fund Inception : 12/29/1987PortfolioManager :
Segalas/McCarragher
TotalAssets :
$23,086 Million
Turnover : 34%
2016 2015 2014 2013 2012 2011 2010Harbor Cap Apprec -1.07 (78) 10.99 (6) 9.93 (58) 37.66 (17) 15.69 (42) 0.61 (25) 11.61 (79)S&P 500 Growth 6.89 (8) 5.52 (51) 14.89 (5) 32.75 (63) 14.61 (54) 4.65 (4) 15.05 (51)IM U.S. Large Cap Growth Equity (MF) Median 1.92 5.63 10.51 33.95 14.82 -1.86 15.14
3Years
EndingSep-2017
3Years
EndingSep-2016
3Years
EndingSep-2015
3Years
EndingSep-2014
3Years
EndingSep-2013
3Years
EndingSep-2012
3Years
EndingSep-2011
Harbor Cap Apprec 13.04 (14) 11.28 (26) 15.35 (8) 22.00 (39) 16.85 (21) 12.73 (38) 5.63 (16)S&P 500 Growth 12.24 (27) 12.75 (7) 13.49 (32) 22.62 (28) 16.73 (23) 14.93 (11) 4.47 (27)IM U.S. Large Cap Growth Equity (MF) Median 11.11 10.04 12.79 21.39 15.22 12.13 2.42
Harbor Cap Apprec 09/30/17
6 INTEGRITY. BALANCE. OBJECTIVITY.
SECTOR ALLOCATION
STYLE MAP (01/01/88 - 09/30/17)
SECTOR PERFORMANCE
TOP 10 HOLDINGSPORTFOLIO CHARACTERISTICS
UP/DOWN CAPTURE (10/01/12 - 09/30/17)
TOTAL SECTOR ATTRIBUTION
PortfolioWeight
(%)
BenchmarkWeight
(%)
QuarterlyReturn
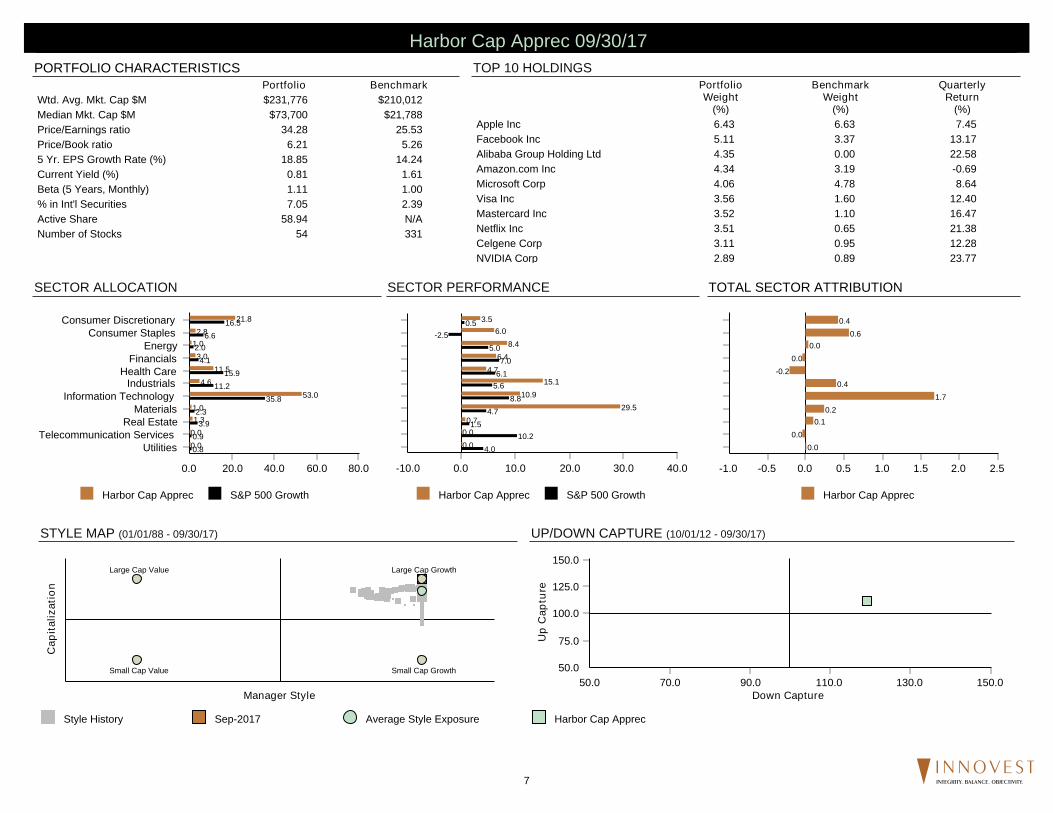
(%)Apple Inc 6.43 6.63 7.45Facebook Inc 5.11 3.37 13.17Alibaba Group Holding Ltd 4.35 0.00 22.58Amazon.com Inc 4.34 3.19 -0.69Microsoft Corp 4.06 4.78 8.64Visa Inc 3.56 1.60 12.40Mastercard Inc 3.52 1.10 16.47Netflix Inc 3.51 0.65 21.38Celgene Corp 3.11 0.95 12.28NVIDIA Corp 2.89 0.89 23.77
% of Portfolio 40.88 23.16
Portfolio BenchmarkWtd. Avg. Mkt. Cap $M $231,776 $210,012Median Mkt. Cap $M $73,700 $21,788Price/Earnings ratio 34.28 25.53Price/Book ratio 6.21 5.265 Yr. EPS Growth Rate (%) 18.85 14.24Current Yield (%) 0.81 1.61Beta (5 Years, Monthly) 1.11 1.00% in Int'l Securities 7.05 2.39Active Share 58.94 N/ANumber of Stocks 54 331
Harbor Cap Apprec S&P 500 Growth
0.0 20.0 40.0 60.0 80.0
UtilitiesTelecommunication Services
Real EstateMaterials
Information TechnologyIndustrials
Health CareFinancials
EnergyConsumer Staples
Consumer Discretionary
0.00.01.31.0
53.04.6
11.53.0
1.02.8
21.8
0.80.9
3.92.3
35.811.2
15.94.1
2.06.6
16.5
Harbor Cap Apprec
0.0 0.5 1.0 1.5 2.0 2.5-0.5-1.0
0.00.0
0.10.2
1.70.4
-0.20.0
0.00.6
0.4
Harbor Cap Apprec S&P 500 Growth
0.0 10.0 20.0 30.0 40.0-10.0
0.00.00.7
29.510.9
15.14.7
6.48.4
6.03.5
4.010.2
1.54.7
8.85.66.17.0
5.0-2.5
0.5
Style History Sep-2017 Average Style Exposure
Cap
italiz
atio
n
Manager Style
Large Cap Growth
Small Cap GrowthSmall Cap Value
Large Cap Value
Harbor Cap Apprec
50.0
75.0
100.0
125.0
150.0
Up
Cap
ture
50.0 70.0 90.0 110.0 130.0 150.0Down Capture
Harbor Cap Apprec 09/30/17
7 INTEGRITY. BALANCE. OBJECTIVITY.
FUND INFORMATION
ROLLING 3 YEAR RETURN AND PERCENTILE RANKINGS
PEER GROUP ANALYSIS - IM U.S. Mid Cap Value Equity (MF)
CALENDAR YEAR RETURNS AND PERCENTILE RANKINGS
RISK VS. RETURN (5 YEARS*)
*If less than 5 years, data is since inception of fund share class.
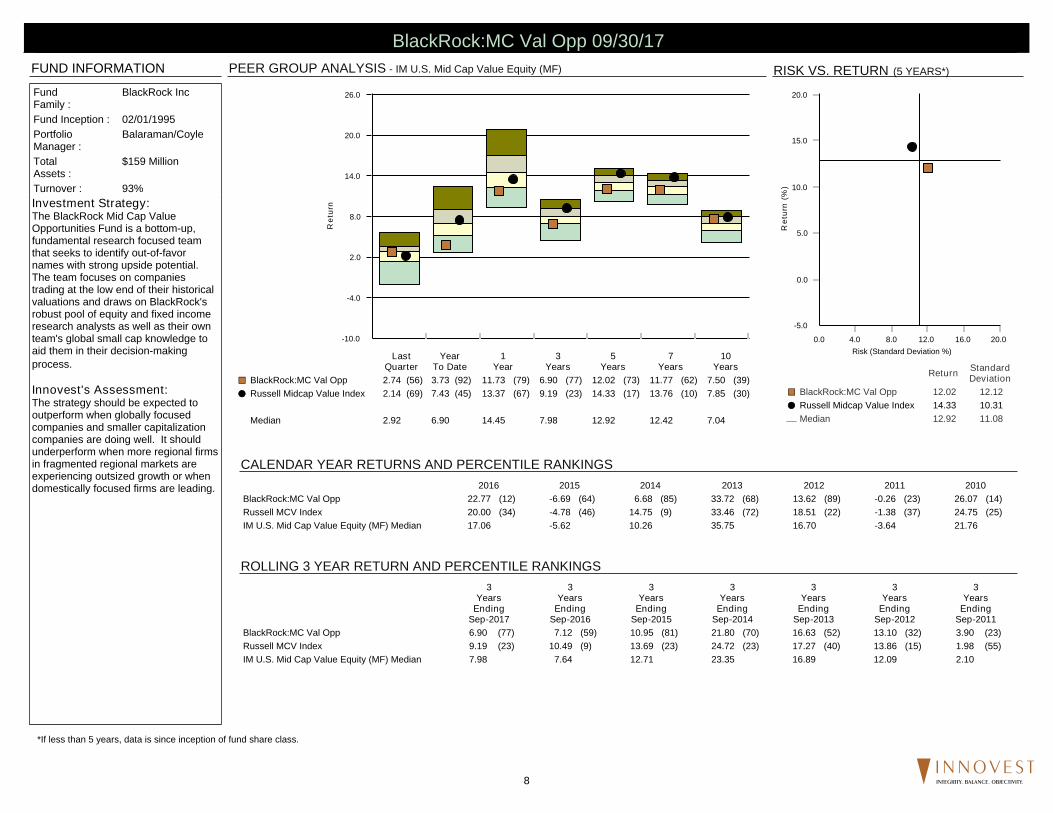
Investment Strategy:The BlackRock Mid Cap ValueOpportunities Fund is a bottom-up,fundamental research focused teamthat seeks to identify out-of-favornames with strong upside potential.The team focuses on companiestrading at the low end of their historicalvaluations and draws on BlackRock'srobust pool of equity and fixed incomeresearch analysts as well as their ownteam's global small cap knowledge toaid them in their decision-makingprocess.
Innovest's Assessment:The strategy should be expected tooutperform when globally focusedcompanies and smaller capitalizationcompanies are doing well. It shouldunderperform when more regional firmsin fragmented regional markets areexperiencing outsized growth or whendomestically focused firms are leading.
-10.0
-4.0
2.0
8.0
14.0
20.0
26.0
Ret
urn
LastQuarter
YearTo Date
1Year
3Years
5Years
7Years
10Years
BlackRock:MC Val Opp 2.74 (56) 3.73 (92) 11.73 (79) 6.90 (77) 12.02 (73) 11.77 (62) 7.50 (39)¢£
Russell Midcap Value Index 2.14 (69) 7.43 (45) 13.37 (67) 9.19 (23) 14.33 (17) 13.76 (10) 7.85 (30)��
Median 2.92 6.90 14.45 7.98 12.92 12.42 7.04
-5.0
0.0
5.0
10.0
15.0
20.0
Ret
urn
(%)
0.0 4.0 8.0 12.0 16.0 20.0Risk (Standard Deviation %)
Return StandardDeviation
BlackRock:MC Val Opp 12.02 12.12¢£
Russell Midcap Value Index 14.33 10.31��
Median 12.92 11.08¾
FundFamily :
BlackRock Inc
Fund Inception : 02/01/1995PortfolioManager :
Balaraman/Coyle
TotalAssets :
$159 Million
Turnover : 93%
2016 2015 2014 2013 2012 2011 2010BlackRock:MC Val Opp 22.77 (12) -6.69 (64) 6.68 (85) 33.72 (68) 13.62 (89) -0.26 (23) 26.07 (14)Russell MCV Index 20.00 (34) -4.78 (46) 14.75 (9) 33.46 (72) 18.51 (22) -1.38 (37) 24.75 (25)IM U.S. Mid Cap Value Equity (MF) Median 17.06 -5.62 10.26 35.75 16.70 -3.64 21.76
3Years
EndingSep-2017
3Years
EndingSep-2016
3Years
EndingSep-2015
3Years
EndingSep-2014
3Years
EndingSep-2013
3Years
EndingSep-2012
3Years
EndingSep-2011
BlackRock:MC Val Opp 6.90 (77) 7.12 (59) 10.95 (81) 21.80 (70) 16.63 (52) 13.10 (32) 3.90 (23)Russell MCV Index 9.19 (23) 10.49 (9) 13.69 (23) 24.72 (23) 17.27 (40) 13.86 (15) 1.98 (55)IM U.S. Mid Cap Value Equity (MF) Median 7.98 7.64 12.71 23.35 16.89 12.09 2.10
BlackRock:MC Val Opp 09/30/17
8 INTEGRITY. BALANCE. OBJECTIVITY.
SECTOR ALLOCATION
STYLE MAP (03/01/95 - 09/30/17)
SECTOR PERFORMANCE
TOP 10 HOLDINGSPORTFOLIO CHARACTERISTICS
UP/DOWN CAPTURE (10/01/12 - 09/30/17)
TOTAL SECTOR ATTRIBUTION
PortfolioWeight
(%)
BenchmarkWeight
(%)
QuarterlyReturn
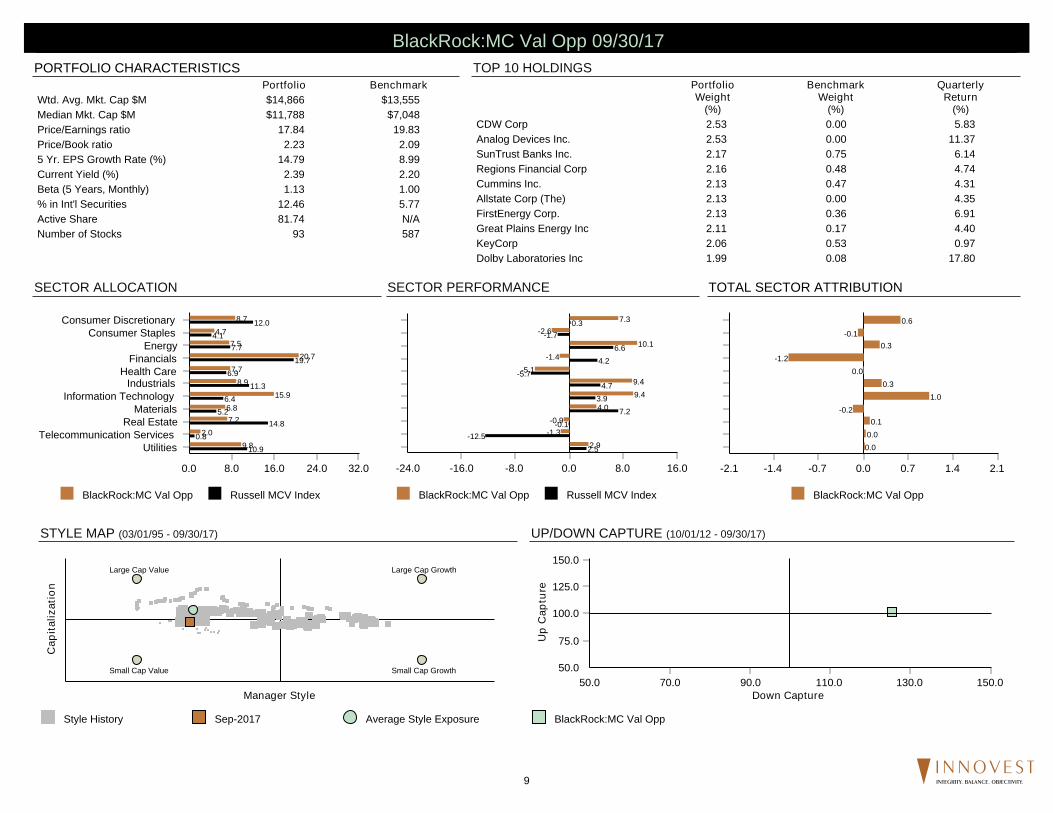
(%)CDW Corp 2.53 0.00 5.83Analog Devices Inc. 2.53 0.00 11.37SunTrust Banks Inc. 2.17 0.75 6.14Regions Financial Corp 2.16 0.48 4.74Cummins Inc. 2.13 0.47 4.31Allstate Corp (The) 2.13 0.00 4.35FirstEnergy Corp. 2.13 0.36 6.91Great Plains Energy Inc 2.11 0.17 4.40KeyCorp 2.06 0.53 0.97Dolby Laboratories Inc 1.99 0.08 17.80
% of Portfolio 21.94 2.84
Portfolio BenchmarkWtd. Avg. Mkt. Cap $M $14,866 $13,555Median Mkt. Cap $M $11,788 $7,048Price/Earnings ratio 17.84 19.83Price/Book ratio 2.23 2.095 Yr. EPS Growth Rate (%) 14.79 8.99Current Yield (%) 2.39 2.20Beta (5 Years, Monthly) 1.13 1.00% in Int'l Securities 12.46 5.77Active Share 81.74 N/ANumber of Stocks 93 587
BlackRock:MC Val Opp Russell MCV Index
0.0 8.0 16.0 24.0 32.0
UtilitiesTelecommunication Services
Real EstateMaterials
Information TechnologyIndustrials
Health CareFinancials
EnergyConsumer Staples
Consumer Discretionary
9.82.0
7.26.8
15.98.9
7.720.7
7.54.7
8.7
10.90.8
14.85.2
6.411.3
6.919.7
7.74.1
12.0
BlackRock:MC Val Opp
0.0 0.7 1.4 2.1-0.7-1.4-2.1
0.00.00.1
-0.21.0
0.30.0
-1.20.3
-0.10.6
BlackRock:MC Val Opp Russell MCV Index
0.0 8.0 16.0-8.0-16.0-24.0
2.9-1.3-0.9
4.09.49.4
-5.1-1.4
10.1-2.6
7.3
2.5-12.5
-0.17.2
3.94.7
-5.74.2
6.6-1.7
0.3
Style History Sep-2017 Average Style Exposure
Cap
italiz
atio
n
Manager Style
Large Cap Growth
Small Cap GrowthSmall Cap Value
Large Cap Value
BlackRock:MC Val Opp
50.0
75.0
100.0
125.0
150.0
Up
Cap
ture
50.0 70.0 90.0 110.0 130.0 150.0Down Capture
BlackRock:MC Val Opp 09/30/17
9 INTEGRITY. BALANCE. OBJECTIVITY.
FUND INFORMATION
ROLLING 3 YEAR RETURN AND PERCENTILE RANKINGS
PEER GROUP ANALYSIS - IM U.S. Mid Cap Core Equity (MF)
CALENDAR YEAR RETURNS AND PERCENTILE RANKINGS
RISK VS. RETURN (5 YEARS*)
*If less than 5 years, data is since inception of fund share class.
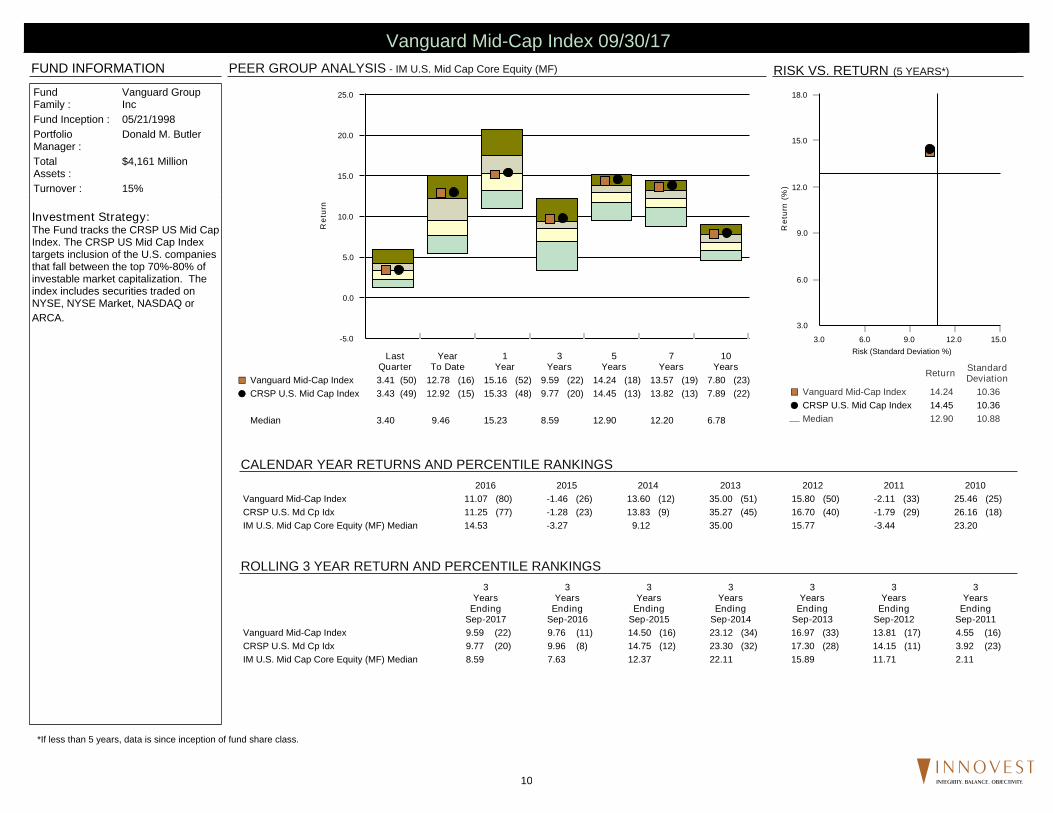
Investment Strategy:The Fund tracks the CRSP US Mid CapIndex. The CRSP US Mid Cap Indextargets inclusion of the U.S. companiesthat fall between the top 70%-80% ofinvestable market capitalization. Theindex includes securities traded onNYSE, NYSE Market, NASDAQ orARCA.
-5.0
0.0
5.0
10.0
15.0
20.0
25.0
Ret
urn
LastQuarter
YearTo Date
1Year
3Years
5Years
7Years
10Years
Vanguard Mid-Cap Index 3.41 (50) 12.78 (16) 15.16 (52) 9.59 (22) 14.24 (18) 13.57 (19) 7.80 (23)¢£
CRSP U.S. Mid Cap Index 3.43 (49) 12.92 (15) 15.33 (48) 9.77 (20) 14.45 (13) 13.82 (13) 7.89 (22)��
Median 3.40 9.46 15.23 8.59 12.90 12.20 6.78
3.0
6.0
9.0
12.0
15.0
18.0
Ret
urn
(%)
3.0 6.0 9.0 12.0 15.0Risk (Standard Deviation %)
Return StandardDeviation
Vanguard Mid-Cap Index 14.24 10.36¢£
CRSP U.S. Mid Cap Index 14.45 10.36��
Median 12.90 10.88¾
FundFamily :
Vanguard GroupInc
Fund Inception : 05/21/1998PortfolioManager :
Donald M. Butler
TotalAssets :
$4,161 Million
Turnover : 15%
2016 2015 2014 2013 2012 2011 2010Vanguard Mid-Cap Index 11.07 (80) -1.46 (26) 13.60 (12) 35.00 (51) 15.80 (50) -2.11 (33) 25.46 (25)CRSP U.S. Md Cp Idx 11.25 (77) -1.28 (23) 13.83 (9) 35.27 (45) 16.70 (40) -1.79 (29) 26.16 (18)IM U.S. Mid Cap Core Equity (MF) Median 14.53 -3.27 9.12 35.00 15.77 -3.44 23.20
3Years
EndingSep-2017
3Years
EndingSep-2016
3Years
EndingSep-2015
3Years
EndingSep-2014
3Years
EndingSep-2013
3Years
EndingSep-2012
3Years
EndingSep-2011
Vanguard Mid-Cap Index 9.59 (22) 9.76 (11) 14.50 (16) 23.12 (34) 16.97 (33) 13.81 (17) 4.55 (16)CRSP U.S. Md Cp Idx 9.77 (20) 9.96 (8) 14.75 (12) 23.30 (32) 17.30 (28) 14.15 (11) 3.92 (23)IM U.S. Mid Cap Core Equity (MF) Median 8.59 7.63 12.37 22.11 15.89 11.71 2.11
Vanguard Mid-Cap Index 09/30/17
10 INTEGRITY. BALANCE. OBJECTIVITY.
SECTOR ALLOCATION
STYLE MAP (06/01/98 - 09/30/17)
SECTOR PERFORMANCE
TOP 10 HOLDINGSPORTFOLIO CHARACTERISTICS
UP/DOWN CAPTURE (10/01/12 - 09/30/17)
TOTAL SECTOR ATTRIBUTION
PortfolioWeight
(%)
BenchmarkWeight
(%)
QuarterlyReturn
(%)Lam Research Corp 0.83 0.83 31.18Fiserv Inc. 0.75 0.75 5.41Amphenol Corp 0.71 0.71 14.92Western Digital Corp 0.69 0.69 -1.92Roper Technologies Inc 0.69 0.69 5.28Autodesk Inc. 0.68 0.68 11.35Digital Realty Trust Inc 0.67 0.67 5.57Bard (C.R.) Inc 0.64 0.64 1.47Edwards Lifesciences Corp 0.64 0.64 -7.55Moody's Corp. 0.62 0.62 14.74
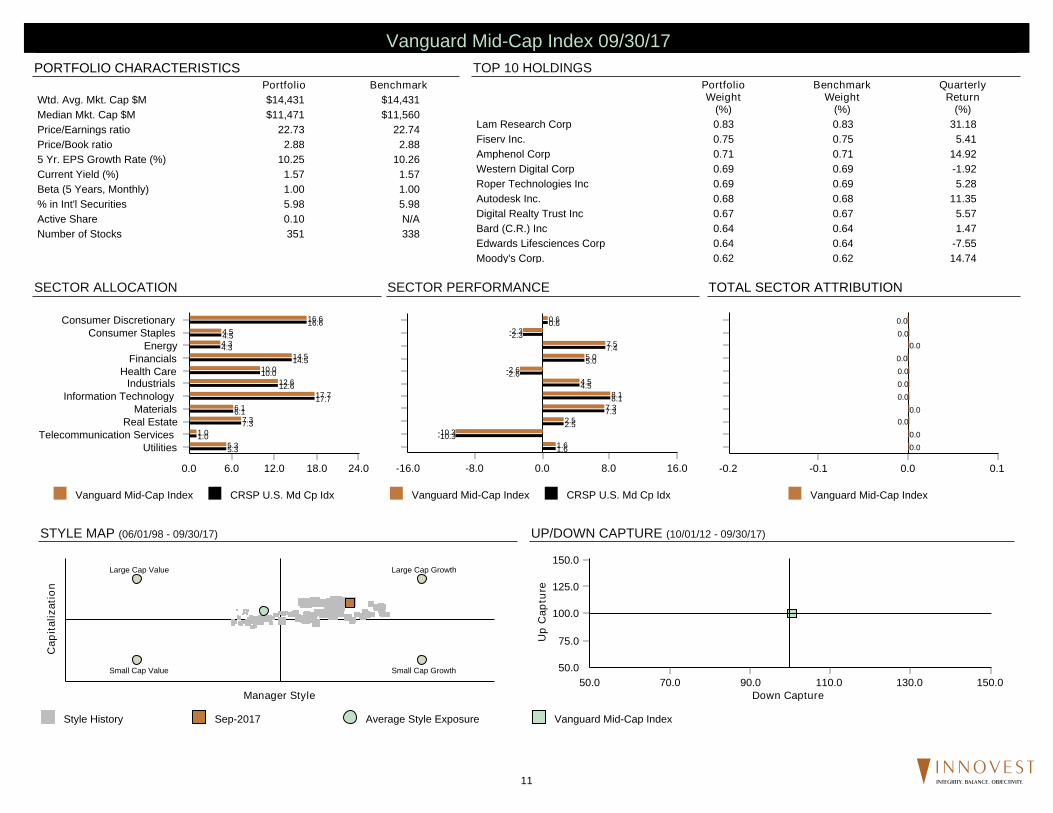
% of Portfolio 6.92 6.92
Portfolio BenchmarkWtd. Avg. Mkt. Cap $M $14,431 $14,431Median Mkt. Cap $M $11,471 $11,560Price/Earnings ratio 22.73 22.74Price/Book ratio 2.88 2.885 Yr. EPS Growth Rate (%) 10.25 10.26Current Yield (%) 1.57 1.57Beta (5 Years, Monthly) 1.00 1.00% in Int'l Securities 5.98 5.98Active Share 0.10 N/ANumber of Stocks 351 338
Vanguard Mid-Cap Index CRSP U.S. Md Cp Idx
0.0 6.0 12.0 18.0 24.0
UtilitiesTelecommunication Services
Real EstateMaterials
Information TechnologyIndustrials
Health CareFinancials
EnergyConsumer Staples
Consumer Discretionary
5.31.0
7.36.1
17.712.6
10.014.5
4.34.5
16.6
5.31.0
7.36.1
17.712.6
10.014.5
4.34.5
16.6
Vanguard Mid-Cap Index
0.0 0.1-0.1-0.2
0.00.0
0.00.0
0.00.00.00.0
0.00.00.0
Vanguard Mid-Cap Index CRSP U.S. Md Cp Idx
0.0 8.0 16.0-8.0-16.0
1.6-10.3
2.57.3
8.14.5
-2.65.0
7.5-2.3
0.6
1.6-10.3
2.57.3
8.14.5
-2.65.0
7.4-2.3
0.6
Style History Sep-2017 Average Style Exposure
Cap
italiz
atio
n
Manager Style
Large Cap Growth
Small Cap GrowthSmall Cap Value
Large Cap Value
Vanguard Mid-Cap Index
50.0
75.0
100.0
125.0
150.0
Up
Cap
ture
50.0 70.0 90.0 110.0 130.0 150.0Down Capture
Vanguard Mid-Cap Index 09/30/17
11 INTEGRITY. BALANCE. OBJECTIVITY.
FUND INFORMATION
ROLLING 3 YEAR RETURN AND PERCENTILE RANKINGS
PEER GROUP ANALYSIS - IM U.S. Mid Cap Growth Equity (MF)
CALENDAR YEAR RETURNS AND PERCENTILE RANKINGS
RISK VS. RETURN (5 YEARS*)
*If less than 5 years, data is since inception of fund share class.
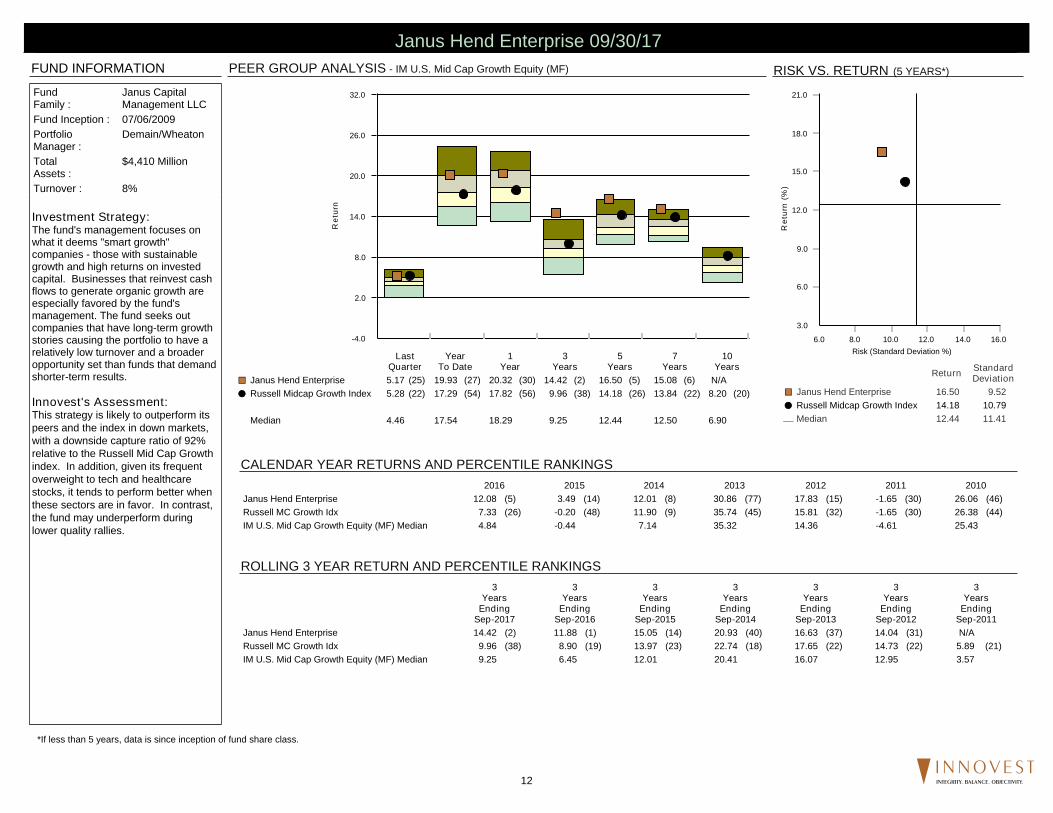
Investment Strategy:The fund's management focuses onwhat it deems "smart growth"companies - those with sustainablegrowth and high returns on investedcapital. Businesses that reinvest cashflows to generate organic growth areespecially favored by the fund'smanagement. The fund seeks outcompanies that have long-term growthstories causing the portfolio to have arelatively low turnover and a broaderopportunity set than funds that demandshorter-term results.
Innovest's Assessment:This strategy is likely to outperform itspeers and the index in down markets,with a downside capture ratio of 92%relative to the Russell Mid Cap Growthindex. In addition, given its frequentoverweight to tech and healthcarestocks, it tends to perform better whenthese sectors are in favor. In contrast,the fund may underperform duringlower quality rallies.
-4.0
2.0
8.0
14.0
20.0
26.0
32.0
Ret
urn
LastQuarter
YearTo Date
1Year
3Years
5Years
7Years
10Years
Janus Hend Enterprise 5.17 (25) 19.93 (27) 20.32 (30) 14.42 (2) 16.50 (5) 15.08 (6) N/A¢£
Russell Midcap Growth Index 5.28 (22) 17.29 (54) 17.82 (56) 9.96 (38) 14.18 (26) 13.84 (22) 8.20 (20)��
Median 4.46 17.54 18.29 9.25 12.44 12.50 6.90
3.0
6.0
9.0
12.0
15.0
18.0
21.0
Ret
urn
(%)
6.0 8.0 10.0 12.0 14.0 16.0Risk (Standard Deviation %)
Return StandardDeviation
Janus Hend Enterprise 16.50 9.52¢£
Russell Midcap Growth Index 14.18 10.79��
Median 12.44 11.41¾
FundFamily :
Janus CapitalManagement LLC
Fund Inception : 07/06/2009PortfolioManager :
Demain/Wheaton
TotalAssets :
$4,410 Million
Turnover : 8%
2016 2015 2014 2013 2012 2011 2010Janus Hend Enterprise 12.08 (5) 3.49 (14) 12.01 (8) 30.86 (77) 17.83 (15) -1.65 (30) 26.06 (46)Russell MC Growth Idx 7.33 (26) -0.20 (48) 11.90 (9) 35.74 (45) 15.81 (32) -1.65 (30) 26.38 (44)IM U.S. Mid Cap Growth Equity (MF) Median 4.84 -0.44 7.14 35.32 14.36 -4.61 25.43
3Years
EndingSep-2017
3Years
EndingSep-2016
3Years
EndingSep-2015
3Years
EndingSep-2014
3Years
EndingSep-2013
3Years
EndingSep-2012
3Years
EndingSep-2011
Janus Hend Enterprise 14.42 (2) 11.88 (1) 15.05 (14) 20.93 (40) 16.63 (37) 14.04 (31) N/ARussell MC Growth Idx 9.96 (38) 8.90 (19) 13.97 (23) 22.74 (18) 17.65 (22) 14.73 (22) 5.89 (21)IM U.S. Mid Cap Growth Equity (MF) Median 9.25 6.45 12.01 20.41 16.07 12.95 3.57
Janus Hend Enterprise 09/30/17
12 INTEGRITY. BALANCE. OBJECTIVITY.
SECTOR ALLOCATION
STYLE MAP (08/01/09 - 09/30/17)
SECTOR PERFORMANCE
TOP 10 HOLDINGSPORTFOLIO CHARACTERISTICS
UP/DOWN CAPTURE (10/01/12 - 09/30/17)
TOTAL SECTOR ATTRIBUTION
PortfolioWeight
(%)
BenchmarkWeight
(%)
QuarterlyReturn
(%)Sensata Tech 2.62 0.14 12.52TD AMERITRADE Holding Corp 2.48 0.38 13.96Aon PLC 2.18 0.00 10.18Lamar Advertising Co 2.06 0.17 -5.64Quintiles Transnational 2.05 0.27 6.22PerkinElmer Inc. 2.01 0.05 1.32TE Connectivity Ltd 2.00 0.00 6.10Constellation Software Inc 1.97 0.00 4.41Crown Castle International Corp 1.93 0.00 0.70Boston Scientific Corp 1.92 0.00 5.23
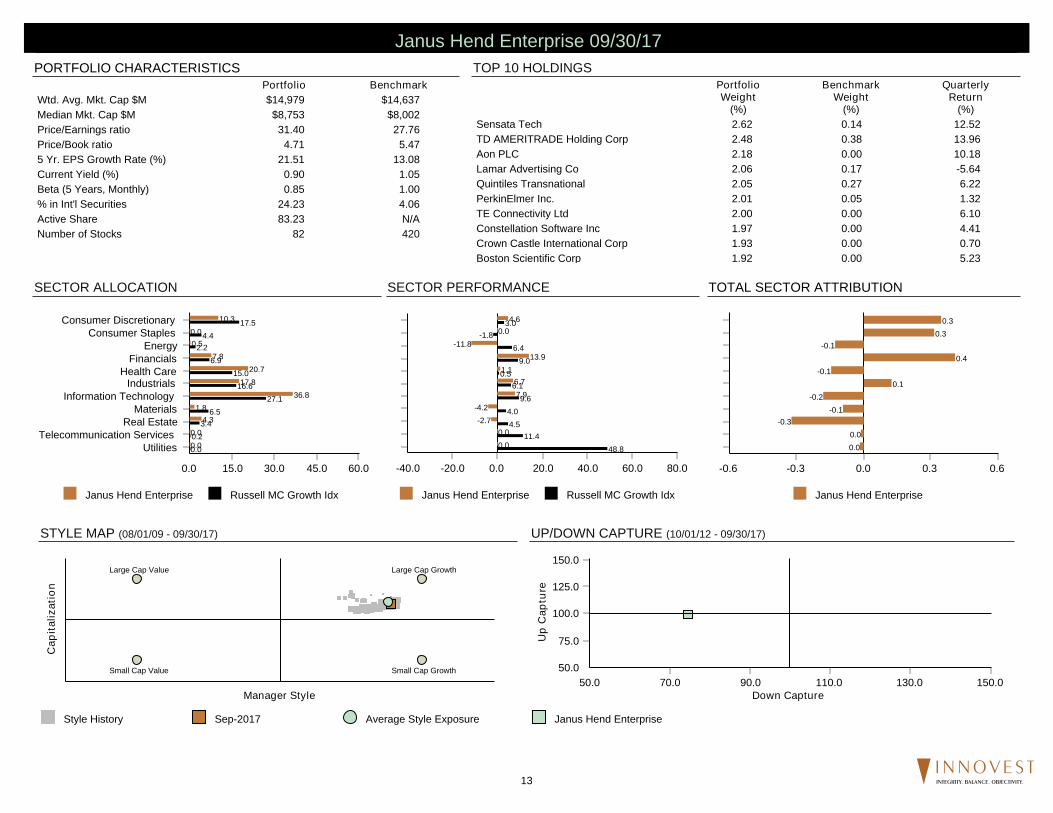
% of Portfolio 21.22 1.01
Portfolio BenchmarkWtd. Avg. Mkt. Cap $M $14,979 $14,637Median Mkt. Cap $M $8,753 $8,002Price/Earnings ratio 31.40 27.76Price/Book ratio 4.71 5.475 Yr. EPS Growth Rate (%) 21.51 13.08Current Yield (%) 0.90 1.05Beta (5 Years, Monthly) 0.85 1.00% in Int'l Securities 24.23 4.06Active Share 83.23 N/ANumber of Stocks 82 420
Janus Hend Enterprise Russell MC Growth Idx
0.0 15.0 30.0 45.0 60.0
UtilitiesTelecommunication Services
Real EstateMaterials
Information TechnologyIndustrials
Health CareFinancials
EnergyConsumer Staples
Consumer Discretionary
0.00.0
4.31.8
36.817.8
20.77.8
0.50.0
10.3
0.00.2
3.46.5
27.116.6
15.06.9
2.24.4
17.5
Janus Hend Enterprise
0.0 0.3 0.6-0.3-0.6
0.00.0
-0.3-0.1
-0.20.1
-0.10.4
-0.10.3
0.3
Janus Hend Enterprise Russell MC Growth Idx
0.0 20.0 40.0 60.0 80.0-20.0-40.0
0.00.0
-2.7-4.2
7.96.7
1.113.9
-11.80.0
4.6
48.811.4
4.54.0
9.66.1
0.59.0
6.4-1.8
3.0
Style History Sep-2017 Average Style Exposure
Cap
italiz
atio
n
Manager Style
Large Cap Growth
Small Cap GrowthSmall Cap Value
Large Cap Value
Janus Hend Enterprise
50.0
75.0
100.0
125.0
150.0
Up
Cap
ture
50.0 70.0 90.0 110.0 130.0 150.0Down Capture
Janus Hend Enterprise 09/30/17
13 INTEGRITY. BALANCE. OBJECTIVITY.
FUND INFORMATION
ROLLING 3 YEAR RETURN AND PERCENTILE RANKINGS
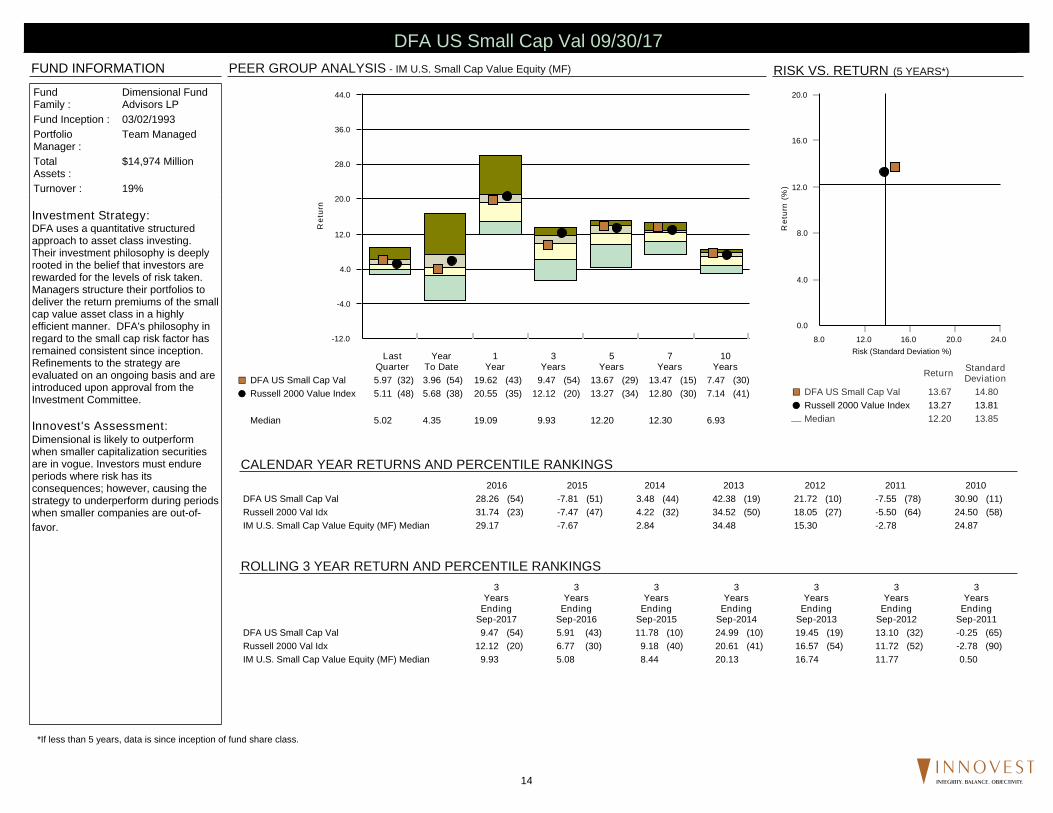
PEER GROUP ANALYSIS - IM U.S. Small Cap Value Equity (MF)
CALENDAR YEAR RETURNS AND PERCENTILE RANKINGS
RISK VS. RETURN (5 YEARS*)
*If less than 5 years, data is since inception of fund share class.
Investment Strategy:DFA uses a quantitative structuredapproach to asset class investing.Their investment philosophy is deeplyrooted in the belief that investors arerewarded for the levels of risk taken.Managers structure their portfolios todeliver the return premiums of the smallcap value asset class in a highlyefficient manner. DFA's philosophy inregard to the small cap risk factor hasremained consistent since inception.Refinements to the strategy areevaluated on an ongoing basis and areintroduced upon approval from theInvestment Committee.
Innovest's Assessment:Dimensional is likely to outperformwhen smaller capitalization securitiesare in vogue. Investors must endureperiods where risk has itsconsequences; however, causing thestrategy to underperform during periodswhen smaller companies are out-of-favor.
-12.0
-4.0
4.0
12.0
20.0
28.0
36.0
44.0
Ret
urn
LastQuarter
YearTo Date
1Year
3Years
5Years
7Years
10Years
DFA US Small Cap Val 5.97 (32) 3.96 (54) 19.62 (43) 9.47 (54) 13.67 (29) 13.47 (15) 7.47 (30)¢£
Russell 2000 Value Index 5.11 (48) 5.68 (38) 20.55 (35) 12.12 (20) 13.27 (34) 12.80 (30) 7.14 (41)��
Median 5.02 4.35 19.09 9.93 12.20 12.30 6.93
0.0
4.0
8.0
12.0
16.0
20.0
Ret
urn
(%)
8.0 12.0 16.0 20.0 24.0Risk (Standard Deviation %)
Return StandardDeviation
DFA US Small Cap Val 13.67 14.80¢£
Russell 2000 Value Index 13.27 13.81��
Median 12.20 13.85¾
FundFamily :
Dimensional FundAdvisors LP
Fund Inception : 03/02/1993PortfolioManager :
Team Managed
TotalAssets :
$14,974 Million
Turnover : 19%
2016 2015 2014 2013 2012 2011 2010DFA US Small Cap Val 28.26 (54) -7.81 (51) 3.48 (44) 42.38 (19) 21.72 (10) -7.55 (78) 30.90 (11)Russell 2000 Val Idx 31.74 (23) -7.47 (47) 4.22 (32) 34.52 (50) 18.05 (27) -5.50 (64) 24.50 (58)IM U.S. Small Cap Value Equity (MF) Median 29.17 -7.67 2.84 34.48 15.30 -2.78 24.87
3Years
EndingSep-2017
3Years
EndingSep-2016
3Years
EndingSep-2015
3Years
EndingSep-2014
3Years
EndingSep-2013
3Years
EndingSep-2012
3Years
EndingSep-2011
DFA US Small Cap Val 9.47 (54) 5.91 (43) 11.78 (10) 24.99 (10) 19.45 (19) 13.10 (32) -0.25 (65)Russell 2000 Val Idx 12.12 (20) 6.77 (30) 9.18 (40) 20.61 (41) 16.57 (54) 11.72 (52) -2.78 (90)IM U.S. Small Cap Value Equity (MF) Median 9.93 5.08 8.44 20.13 16.74 11.77 0.50
DFA US Small Cap Val 09/30/17
14 INTEGRITY. BALANCE. OBJECTIVITY.
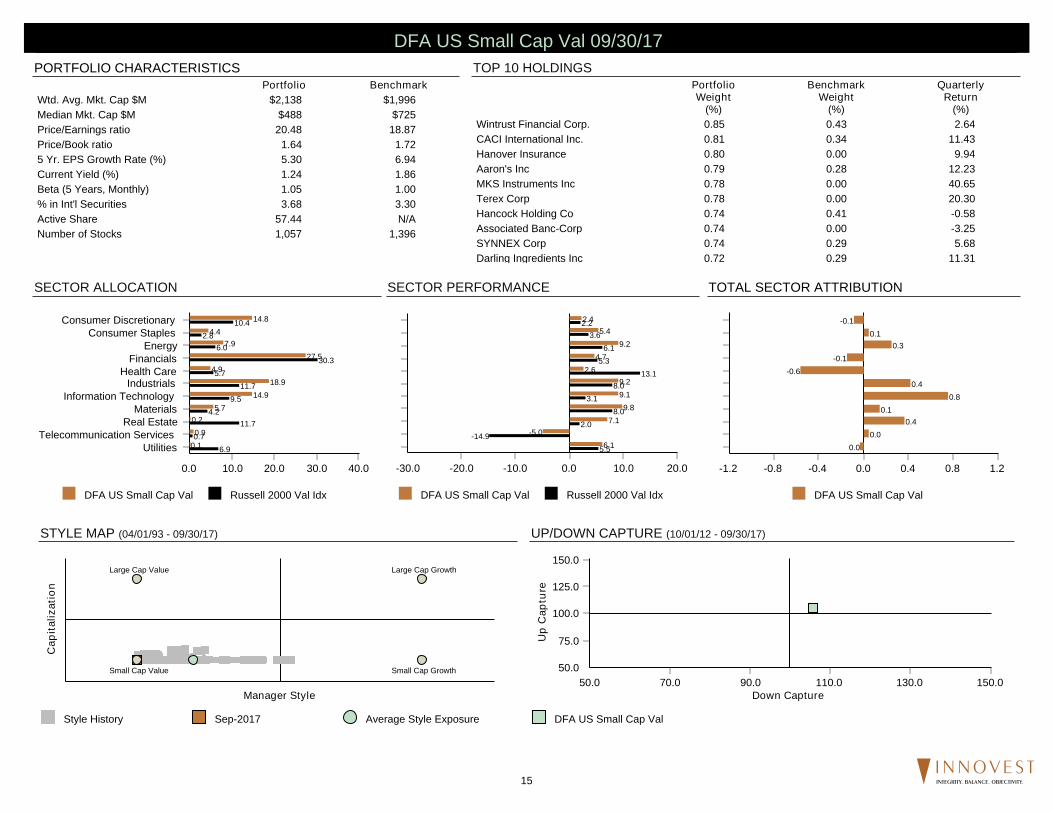
SECTOR ALLOCATION
STYLE MAP (04/01/93 - 09/30/17)
SECTOR PERFORMANCE
TOP 10 HOLDINGSPORTFOLIO CHARACTERISTICS
UP/DOWN CAPTURE (10/01/12 - 09/30/17)
TOTAL SECTOR ATTRIBUTION
PortfolioWeight
(%)
BenchmarkWeight
(%)
QuarterlyReturn
(%)Wintrust Financial Corp. 0.85 0.43 2.64CACI International Inc. 0.81 0.34 11.43Hanover Insurance 0.80 0.00 9.94Aaron's Inc 0.79 0.28 12.23MKS Instruments Inc 0.78 0.00 40.65Terex Corp 0.78 0.00 20.30Hancock Holding Co 0.74 0.41 -0.58Associated Banc-Corp 0.74 0.00 -3.25SYNNEX Corp 0.74 0.29 5.68Darling Ingredients Inc 0.72 0.29 11.31
% of Portfolio 7.75 2.04
Portfolio BenchmarkWtd. Avg. Mkt. Cap $M $2,138 $1,996Median Mkt. Cap $M $488 $725Price/Earnings ratio 20.48 18.87Price/Book ratio 1.64 1.725 Yr. EPS Growth Rate (%) 5.30 6.94Current Yield (%) 1.24 1.86Beta (5 Years, Monthly) 1.05 1.00% in Int'l Securities 3.68 3.30Active Share 57.44 N/ANumber of Stocks 1,057 1,396
DFA US Small Cap Val Russell 2000 Val Idx
0.0 10.0 20.0 30.0 40.0
UtilitiesTelecommunication Services
Real EstateMaterials
Information TechnologyIndustrials
Health CareFinancials
EnergyConsumer Staples
Consumer Discretionary
0.10.9
0.25.7
14.918.9
4.927.5
7.94.4
14.8
6.90.7
11.74.2
9.511.7
5.730.3
6.02.8
10.4
DFA US Small Cap Val
0.0 0.4 0.8 1.2-0.4-0.8-1.2
0.00.0
0.40.1
0.80.4
-0.6-0.1
0.30.1
-0.1
DFA US Small Cap Val Russell 2000 Val Idx
0.0 10.0 20.0-10.0-20.0-30.0
6.1-5.0
7.19.8
9.19.2
2.64.7
9.25.4
2.4
5.5-14.9
2.08.0
3.18.0
13.15.3
6.13.6
2.2
Style History Sep-2017 Average Style Exposure
Cap
italiz
atio
n
Manager Style
Large Cap Growth
Small Cap GrowthSmall Cap Value
Large Cap Value
DFA US Small Cap Val
50.0
75.0
100.0
125.0
150.0
Up
Cap
ture
50.0 70.0 90.0 110.0 130.0 150.0Down Capture
DFA US Small Cap Val 09/30/17
15 INTEGRITY. BALANCE. OBJECTIVITY.
FUND INFORMATION
ROLLING 3 YEAR RETURN AND PERCENTILE RANKINGS
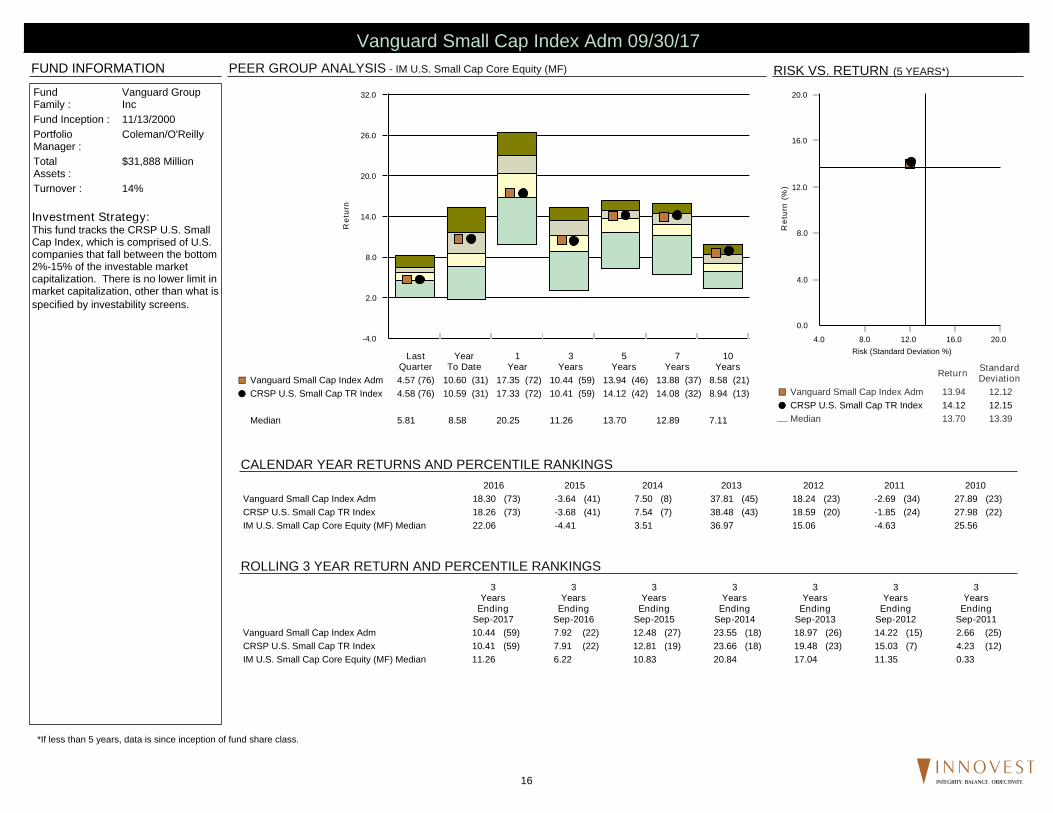
PEER GROUP ANALYSIS - IM U.S. Small Cap Core Equity (MF)
CALENDAR YEAR RETURNS AND PERCENTILE RANKINGS
RISK VS. RETURN (5 YEARS*)
*If less than 5 years, data is since inception of fund share class.
Investment Strategy:This fund tracks the CRSP U.S. SmallCap Index, which is comprised of U.S.companies that fall between the bottom2%-15% of the investable marketcapitalization. There is no lower limit inmarket capitalization, other than what isspecified by investability screens.
-4.0
2.0
8.0
14.0
20.0
26.0
32.0
Ret
urn
LastQuarter
YearTo Date
1Year
3Years
5Years
7Years
10Years
Vanguard Small Cap Index Adm 4.57 (76) 10.60 (31) 17.35 (72) 10.44 (59) 13.94 (46) 13.88 (37) 8.58 (21)¢£
CRSP U.S. Small Cap TR Index 4.58 (76) 10.59 (31) 17.33 (72) 10.41 (59) 14.12 (42) 14.08 (32) 8.94 (13)��
Median 5.81 8.58 20.25 11.26 13.70 12.89 7.11
0.0
4.0
8.0
12.0
16.0
20.0
Ret
urn
(%)
4.0 8.0 12.0 16.0 20.0Risk (Standard Deviation %)
Return StandardDeviation
Vanguard Small Cap Index Adm 13.94 12.12¢£
CRSP U.S. Small Cap TR Index 14.12 12.15��
Median 13.70 13.39¾
FundFamily :
Vanguard GroupInc
Fund Inception : 11/13/2000PortfolioManager :
Coleman/O'Reilly
TotalAssets :
$31,888 Million
Turnover : 14%
2016 2015 2014 2013 2012 2011 2010Vanguard Small Cap Index Adm 18.30 (73) -3.64 (41) 7.50 (8) 37.81 (45) 18.24 (23) -2.69 (34) 27.89 (23)CRSP U.S. Small Cap TR Index 18.26 (73) -3.68 (41) 7.54 (7) 38.48 (43) 18.59 (20) -1.85 (24) 27.98 (22)IM U.S. Small Cap Core Equity (MF) Median 22.06 -4.41 3.51 36.97 15.06 -4.63 25.56
3Years
EndingSep-2017
3Years
EndingSep-2016
3Years
EndingSep-2015
3Years
EndingSep-2014
3Years
EndingSep-2013
3Years
EndingSep-2012
3Years
EndingSep-2011
Vanguard Small Cap Index Adm 10.44 (59) 7.92 (22) 12.48 (27) 23.55 (18) 18.97 (26) 14.22 (15) 2.66 (25)CRSP U.S. Small Cap TR Index 10.41 (59) 7.91 (22) 12.81 (19) 23.66 (18) 19.48 (23) 15.03 (7) 4.23 (12)IM U.S. Small Cap Core Equity (MF) Median 11.26 6.22 10.83 20.84 17.04 11.35 0.33
Vanguard Small Cap Index Adm 09/30/17
16 INTEGRITY. BALANCE. OBJECTIVITY.
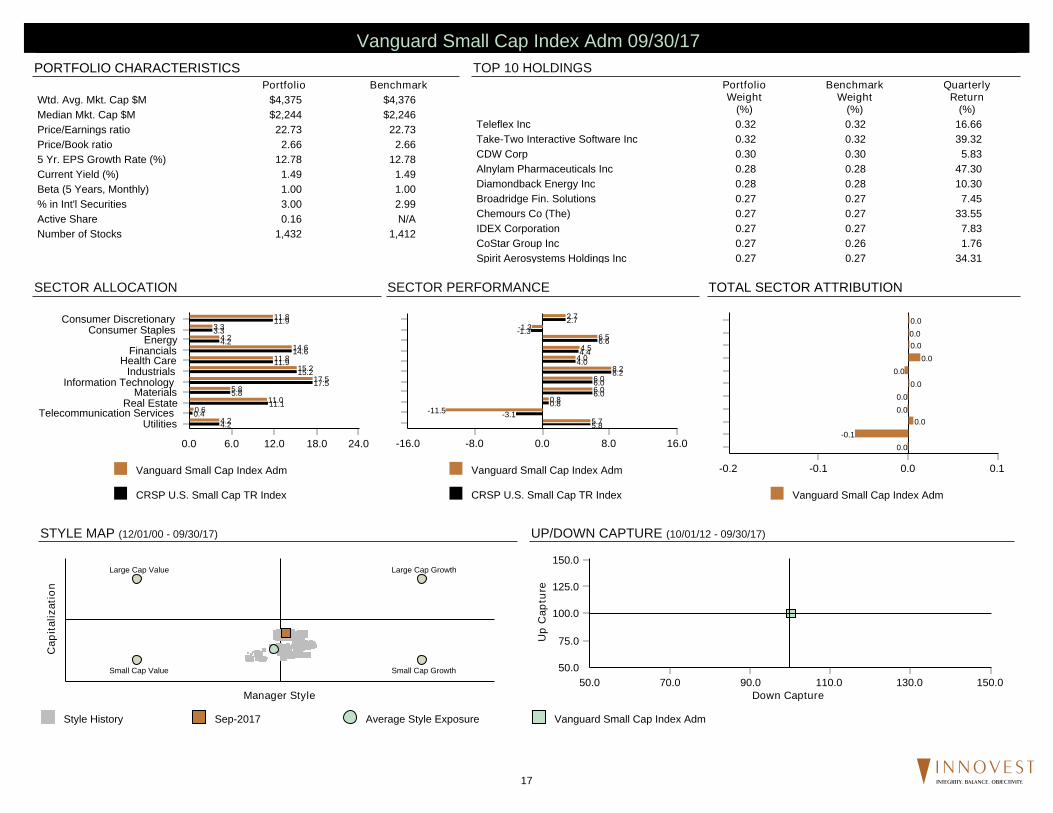
SECTOR ALLOCATION
STYLE MAP (12/01/00 - 09/30/17)
SECTOR PERFORMANCE
TOP 10 HOLDINGSPORTFOLIO CHARACTERISTICS
UP/DOWN CAPTURE (10/01/12 - 09/30/17)
TOTAL SECTOR ATTRIBUTION
PortfolioWeight
(%)
BenchmarkWeight
(%)
QuarterlyReturn
(%)Teleflex Inc 0.32 0.32 16.66Take-Two Interactive Software Inc 0.32 0.32 39.32CDW Corp 0.30 0.30 5.83Alnylam Pharmaceuticals Inc 0.28 0.28 47.30Diamondback Energy Inc 0.28 0.28 10.30Broadridge Fin. Solutions 0.27 0.27 7.45Chemours Co (The) 0.27 0.27 33.55IDEX Corporation 0.27 0.27 7.83CoStar Group Inc 0.27 0.26 1.76Spirit Aerosystems Holdings Inc 0.27 0.27 34.31
% of Portfolio 2.85 2.84
Portfolio BenchmarkWtd. Avg. Mkt. Cap $M $4,375 $4,376Median Mkt. Cap $M $2,244 $2,246Price/Earnings ratio 22.73 22.73Price/Book ratio 2.66 2.665 Yr. EPS Growth Rate (%) 12.78 12.78Current Yield (%) 1.49 1.49Beta (5 Years, Monthly) 1.00 1.00% in Int'l Securities 3.00 2.99Active Share 0.16 N/ANumber of Stocks 1,432 1,412
Vanguard Small Cap Index Adm
CRSP U.S. Small Cap TR Index
0.0 6.0 12.0 18.0 24.0
UtilitiesTelecommunication Services
Real EstateMaterials
Information TechnologyIndustrials
Health CareFinancials
EnergyConsumer Staples
Consumer Discretionary
4.20.6
11.05.8
17.515.2
11.814.6
4.23.3
11.8
4.20.4
11.15.8
17.515.2
11.914.6
4.23.3
11.9
Vanguard Small Cap Index Adm
0.0 0.1-0.1-0.2
0.0-0.1
0.00.00.0
0.00.0
0.00.00.00.0
Vanguard Small Cap Index Adm
CRSP U.S. Small Cap TR Index
0.0 8.0 16.0-8.0-16.0
5.7-11.5
0.86.06.0
8.24.04.5
6.5-1.3
2.7
5.8-3.1
0.86.06.0
8.24.04.4
6.6-1.3
2.7
Style History Sep-2017 Average Style Exposure
Cap
italiz
atio
n
Manager Style
Large Cap Growth
Small Cap GrowthSmall Cap Value
Large Cap Value
Vanguard Small Cap Index Adm
50.0
75.0
100.0
125.0
150.0
Up
Cap
ture
50.0 70.0 90.0 110.0 130.0 150.0Down Capture
Vanguard Small Cap Index Adm 09/30/17
17 INTEGRITY. BALANCE. OBJECTIVITY.
FUND INFORMATION
ROLLING 3 YEAR RETURN AND PERCENTILE RANKINGS
PEER GROUP ANALYSIS - IM U.S. Small Cap Growth Equity (MF)
CALENDAR YEAR RETURNS AND PERCENTILE RANKINGS
RISK VS. RETURN (5 YEARS*)
*If less than 5 years, data is since inception of fund share class.
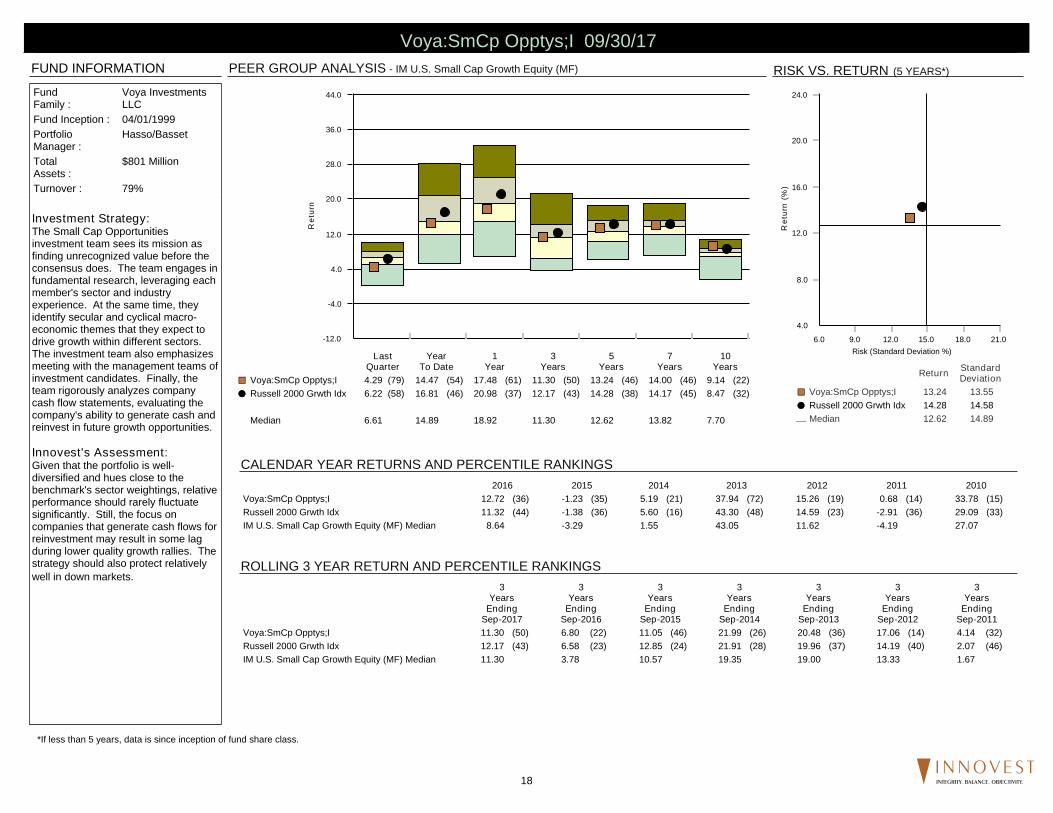
Investment Strategy:The Small Cap Opportunitiesinvestment team sees its mission asfinding unrecognized value before theconsensus does. The team engages infundamental research, leveraging eachmember's sector and industryexperience. At the same time, theyidentify secular and cyclical macro-economic themes that they expect todrive growth within different sectors.The investment team also emphasizesmeeting with the management teams ofinvestment candidates. Finally, theteam rigorously analyzes companycash flow statements, evaluating thecompany's ability to generate cash andreinvest in future growth opportunities.
Innovest's Assessment:Given that the portfolio is well-diversified and hues close to thebenchmark's sector weightings, relativeperformance should rarely fluctuatesignificantly. Still, the focus oncompanies that generate cash flows forreinvestment may result in some lagduring lower quality growth rallies. Thestrategy should also protect relativelywell in down markets.
-12.0
-4.0
4.0
12.0
20.0
28.0
36.0
44.0
Ret
urn
LastQuarter
YearTo Date
1Year
3Years
5Years
7Years
10Years
Voya:SmCp Opptys;I 4.29 (79) 14.47 (54) 17.48 (61) 11.30 (50) 13.24 (46) 14.00 (46) 9.14 (22)¢£
Russell 2000 Grwth Idx 6.22 (58) 16.81 (46) 20.98 (37) 12.17 (43) 14.28 (38) 14.17 (45) 8.47 (32)��
Median 6.61 14.89 18.92 11.30 12.62 13.82 7.70
4.0
8.0
12.0
16.0
20.0
24.0
Ret
urn
(%)
6.0 9.0 12.0 15.0 18.0 21.0Risk (Standard Deviation %)
Return StandardDeviation
Voya:SmCp Opptys;I 13.24 13.55¢£
Russell 2000 Grwth Idx 14.28 14.58��
Median 12.62 14.89¾
FundFamily :
Voya InvestmentsLLC
Fund Inception : 04/01/1999PortfolioManager :
Hasso/Basset
TotalAssets :
$801 Million
Turnover : 79%
2016 2015 2014 2013 2012 2011 2010Voya:SmCp Opptys;I 12.72 (36) -1.23 (35) 5.19 (21) 37.94 (72) 15.26 (19) 0.68 (14) 33.78 (15)Russell 2000 Grwth Idx 11.32 (44) -1.38 (36) 5.60 (16) 43.30 (48) 14.59 (23) -2.91 (36) 29.09 (33)IM U.S. Small Cap Growth Equity (MF) Median 8.64 -3.29 1.55 43.05 11.62 -4.19 27.07
3Years
EndingSep-2017
3Years
EndingSep-2016
3Years
EndingSep-2015
3Years
EndingSep-2014
3Years
EndingSep-2013
3Years
EndingSep-2012
3Years
EndingSep-2011
Voya:SmCp Opptys;I 11.30 (50) 6.80 (22) 11.05 (46) 21.99 (26) 20.48 (36) 17.06 (14) 4.14 (32)Russell 2000 Grwth Idx 12.17 (43) 6.58 (23) 12.85 (24) 21.91 (28) 19.96 (37) 14.19 (40) 2.07 (46)IM U.S. Small Cap Growth Equity (MF) Median 11.30 3.78 10.57 19.35 19.00 13.33 1.67
Voya:SmCp Opptys;I 09/30/17
18 INTEGRITY. BALANCE. OBJECTIVITY.
SECTOR ALLOCATION
STYLE MAP (05/01/99 - 09/30/17)
SECTOR PERFORMANCE
TOP 10 HOLDINGSPORTFOLIO CHARACTERISTICS
UP/DOWN CAPTURE (10/01/12 - 09/30/17)
TOTAL SECTOR ATTRIBUTION
PortfolioWeight
(%)
BenchmarkWeight
(%)
QuarterlyReturn
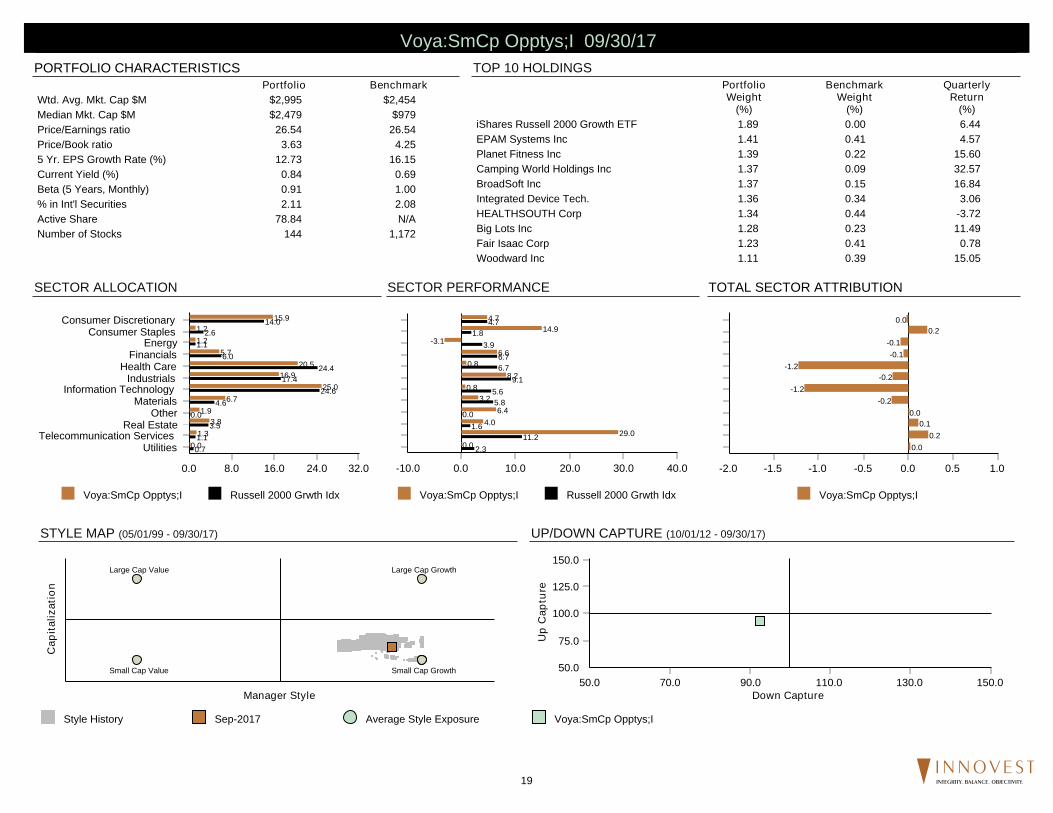
(%)iShares Russell 2000 Growth ETF 1.89 0.00 6.44EPAM Systems Inc 1.41 0.41 4.57Planet Fitness Inc 1.39 0.22 15.60Camping World Holdings Inc 1.37 0.09 32.57BroadSoft Inc 1.37 0.15 16.84Integrated Device Tech. 1.36 0.34 3.06HEALTHSOUTH Corp 1.34 0.44 -3.72Big Lots Inc 1.28 0.23 11.49Fair Isaac Corp 1.23 0.41 0.78Woodward Inc 1.11 0.39 15.05
% of Portfolio 13.75 2.68
Portfolio BenchmarkWtd. Avg. Mkt. Cap $M $2,995 $2,454Median Mkt. Cap $M $2,479 $979Price/Earnings ratio 26.54 26.54Price/Book ratio 3.63 4.255 Yr. EPS Growth Rate (%) 12.73 16.15Current Yield (%) 0.84 0.69Beta (5 Years, Monthly) 0.91 1.00% in Int'l Securities 2.11 2.08Active Share 78.84 N/ANumber of Stocks 144 1,172
Voya:SmCp Opptys;I Russell 2000 Grwth Idx
0.0 8.0 16.0 24.0 32.0
UtilitiesTelecommunication Services
Real EstateOther
MaterialsInformation Technology
IndustrialsHealth Care
FinancialsEnergy
Consumer StaplesConsumer Discretionary
0.01.3
3.81.9
6.725.0
16.920.5
5.71.21.2
15.9
0.71.1
3.50.0
4.624.6
17.424.4
6.01.1
2.614.0
Voya:SmCp Opptys;I
0.0 0.5 1.0-0.5-1.0-1.5-2.0
0.00.2
0.10.0
-0.2-1.2
-0.2-1.2
-0.1-0.1
0.20.0
Voya:SmCp Opptys;I Russell 2000 Grwth Idx
0.0 10.0 20.0 30.0 40.0-10.0
0.029.0
4.06.4
3.20.8
8.20.8
6.6-3.1
14.94.7
2.311.2
1.60.0
5.85.6
9.16.76.7
3.91.8
4.7
Style History Sep-2017 Average Style Exposure
Cap
italiz
atio
n
Manager Style
Large Cap Growth
Small Cap GrowthSmall Cap Value
Large Cap Value
Voya:SmCp Opptys;I
50.0
75.0
100.0
125.0
150.0
Up
Cap
ture
50.0 70.0 90.0 110.0 130.0 150.0Down Capture
Voya:SmCp Opptys;I 09/30/17
19 INTEGRITY. BALANCE. OBJECTIVITY.
FUND INFORMATION
ROLLING 3 YEAR RETURN AND PERCENTILE RANKINGS
PEER GROUP ANALYSIS - IM International Large Cap Value Equity (MF)
CALENDAR YEAR RETURNS AND PERCENTILE RANKINGS
RISK VS. RETURN (5 YEARS*)
*If less than 5 years, data is since inception of fund share class.
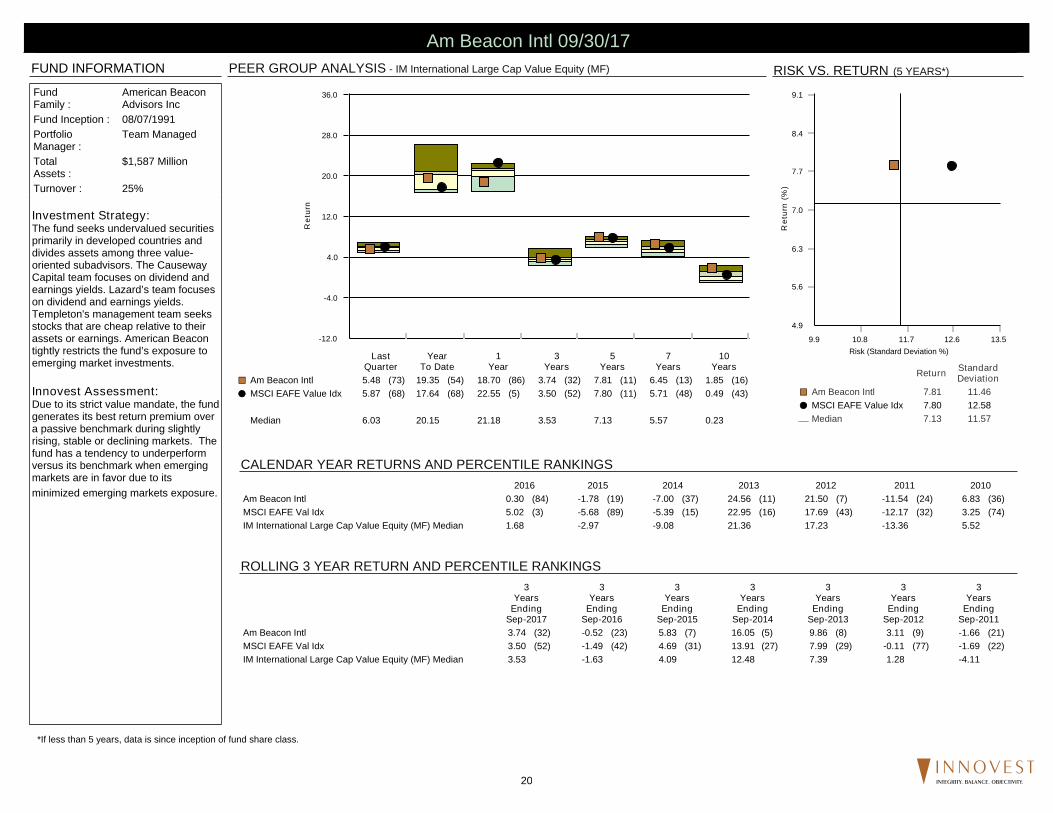
Investment Strategy:The fund seeks undervalued securitiesprimarily in developed countries anddivides assets among three value-oriented subadvisors. The CausewayCapital team focuses on dividend andearnings yields. Lazard’s team focuseson dividend and earnings yields.Templeton's management team seeksstocks that are cheap relative to theirassets or earnings. American Beacontightly restricts the fund’s exposure toemerging market investments.
Innovest Assessment:Due to its strict value mandate, the fundgenerates its best return premium overa passive benchmark during slightlyrising, stable or declining markets. Thefund has a tendency to underperformversus its benchmark when emergingmarkets are in favor due to itsminimized emerging markets exposure.
-12.0
-4.0
4.0
12.0
20.0
28.0
36.0
Ret
urn
LastQuarter
YearTo Date
1Year
3Years
5Years
7Years
10Years
Am Beacon Intl 5.48 (73) 19.35 (54) 18.70 (86) 3.74 (32) 7.81 (11) 6.45 (13) 1.85 (16)¢£
MSCI EAFE Value Idx 5.87 (68) 17.64 (68) 22.55 (5) 3.50 (52) 7.80 (11) 5.71 (48) 0.49 (43)��
Median 6.03 20.15 21.18 3.53 7.13 5.57 0.23
4.9
5.6
6.3
7.0
7.7
8.4
9.1
Ret
urn
(%)
9.9 10.8 11.7 12.6 13.5Risk (Standard Deviation %)
Return StandardDeviation
Am Beacon Intl 7.81 11.46¢£
MSCI EAFE Value Idx 7.80 12.58��
Median 7.13 11.57¾
FundFamily :
American BeaconAdvisors Inc
Fund Inception : 08/07/1991PortfolioManager :
Team Managed
TotalAssets :
$1,587 Million
Turnover : 25%
2016 2015 2014 2013 2012 2011 2010Am Beacon Intl 0.30 (84) -1.78 (19) -7.00 (37) 24.56 (11) 21.50 (7) -11.54 (24) 6.83 (36)MSCI EAFE Val Idx 5.02 (3) -5.68 (89) -5.39 (15) 22.95 (16) 17.69 (43) -12.17 (32) 3.25 (74)IM International Large Cap Value Equity (MF) Median 1.68 -2.97 -9.08 21.36 17.23 -13.36 5.52
3Years
EndingSep-2017
3Years
EndingSep-2016
3Years
EndingSep-2015
3Years
EndingSep-2014
3Years
EndingSep-2013
3Years
EndingSep-2012
3Years
EndingSep-2011
Am Beacon Intl 3.74 (32) -0.52 (23) 5.83 (7) 16.05 (5) 9.86 (8) 3.11 (9) -1.66 (21)MSCI EAFE Val Idx 3.50 (52) -1.49 (42) 4.69 (31) 13.91 (27) 7.99 (29) -0.11 (77) -1.69 (22)IM International Large Cap Value Equity (MF) Median 3.53 -1.63 4.09 12.48 7.39 1.28 -4.11
Am Beacon Intl 09/30/17
20 INTEGRITY. BALANCE. OBJECTIVITY.
REGION ALLOCATION
STYLE MAP (09/01/10 - 09/30/17)
REGION PERFORMANCE
TOP 10 HOLDINGSPORTFOLIO CHARACTERISTICS
TOTAL SECTOR ATTRIBUTION (07/01/17 - 09/30/17)
TOTAL REGION ATTRIBUTION
PortfolioWeight
(%)
BenchmarkWeight
(%)
QuarterlyReturn
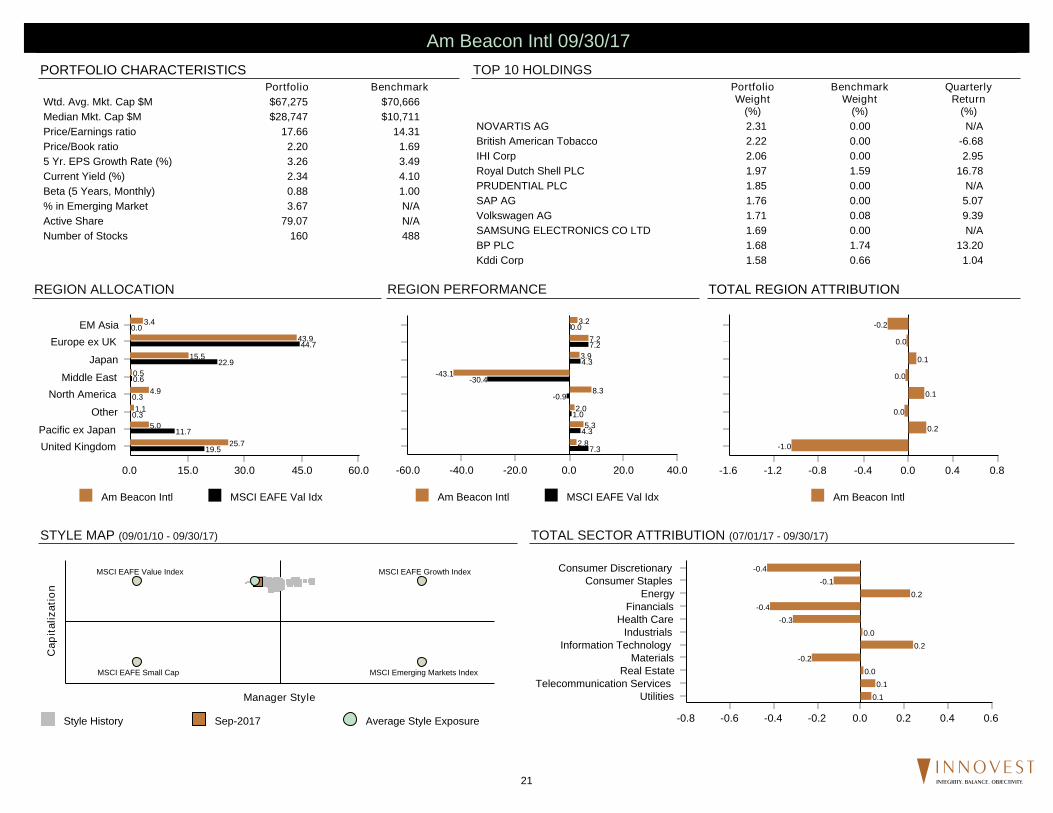
(%)NOVARTIS AG 2.31 0.00 N/ABritish American Tobacco 2.22 0.00 -6.68IHI Corp 2.06 0.00 2.95Royal Dutch Shell PLC 1.97 1.59 16.78PRUDENTIAL PLC 1.85 0.00 N/ASAP AG 1.76 0.00 5.07Volkswagen AG 1.71 0.08 9.39SAMSUNG ELECTRONICS CO LTD 1.69 0.00 N/ABP PLC 1.68 1.74 13.20Kddi Corp 1.58 0.66 1.04
% of Portfolio 18.83 4.07
Portfolio BenchmarkWtd. Avg. Mkt. Cap $M $67,275 $70,666Median Mkt. Cap $M $28,747 $10,711Price/Earnings ratio 17.66 14.31Price/Book ratio 2.20 1.695 Yr. EPS Growth Rate (%) 3.26 3.49Current Yield (%) 2.34 4.10Beta (5 Years, Monthly) 0.88 1.00% in Emerging Market 3.67 N/AActive Share 79.07 N/ANumber of Stocks 160 488
Am Beacon Intl MSCI EAFE Val Idx
0.0 15.0 30.0 45.0 60.0
United KingdomPacific ex Japan
Other
North AmericaMiddle East
Japan
Europe ex UKEM Asia
25.7
5.0
1.1
4.9
0.5
15.5
43.9
3.4
19.5
11.7
0.3
0.3
0.6
22.9
44.7
0.0
Am Beacon Intl
0.0 0.4 0.8-0.4-0.8-1.2-1.6
-1.0
0.2
0.0
0.1
0.0
0.1
0.0
-0.2
Am Beacon Intl MSCI EAFE Val Idx
0.0 20.0 40.0-20.0-40.0-60.0
2.8
5.3
2.0
8.3
-43.1
3.9
7.2
3.2
7.3
4.3
1.0
-0.9
-30.4
4.3
7.2
0.0
Style History Sep-2017 Average Style Exposure
Cap
italiz
atio
n
Manager Style
MSCI EAFE Growth Index
MSCI Emerging Markets IndexMSCI EAFE Small Cap
MSCI EAFE Value Index
0.0 0.2 0.4 0.6-0.2-0.4-0.6-0.8
UtilitiesTelecommunication Services
Real EstateMaterials
Information TechnologyIndustrials
Health CareFinancials
EnergyConsumer Staples
Consumer Discretionary
0.10.1
0.0-0.2
0.20.0
-0.3-0.4
0.2-0.1
-0.4
Am Beacon Intl 09/30/17
21 INTEGRITY. BALANCE. OBJECTIVITY.
FUND INFORMATION
ROLLING 3 YEAR RETURN AND PERCENTILE RANKINGS
PEER GROUP ANALYSIS - IM International Equity (MF)
CALENDAR YEAR RETURNS AND PERCENTILE RANKINGS
RISK VS. RETURN (5 YEARS*)
*If less than 5 years, data is since inception of fund share class.
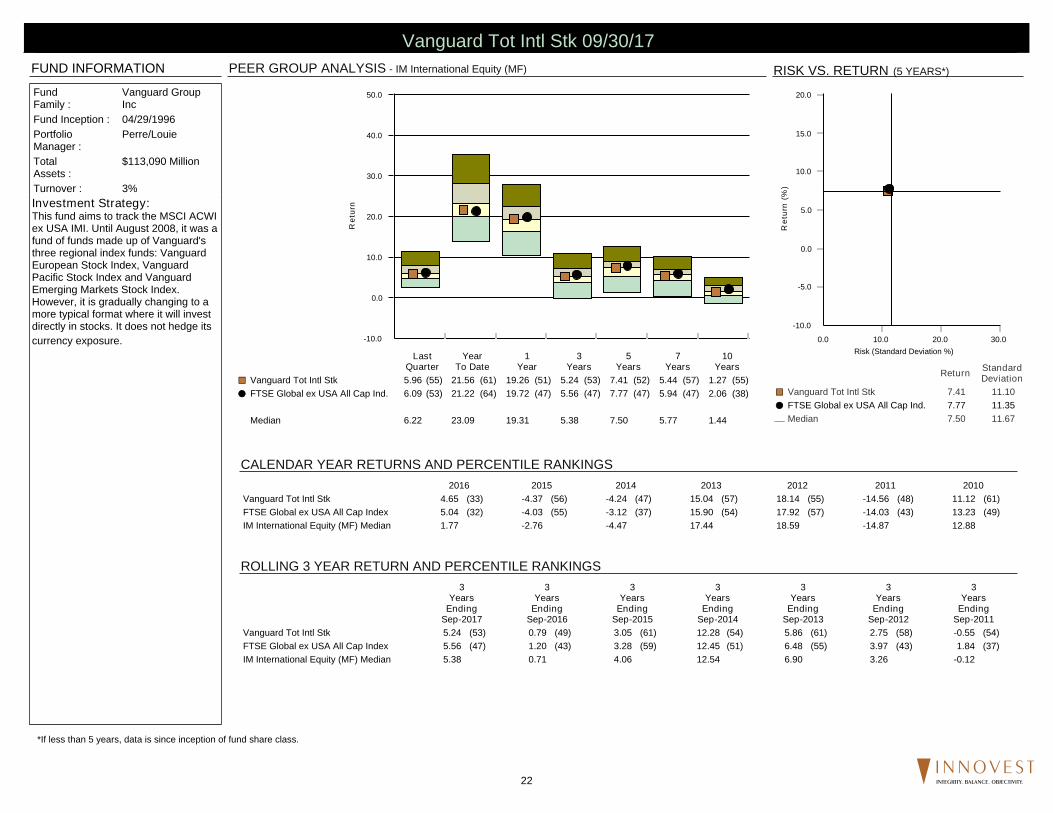
Investment Strategy:This fund aims to track the MSCI ACWIex USA IMI. Until August 2008, it was afund of funds made up of Vanguard'sthree regional index funds: VanguardEuropean Stock Index, VanguardPacific Stock Index and VanguardEmerging Markets Stock Index.However, it is gradually changing to amore typical format where it will investdirectly in stocks. It does not hedge itscurrency exposure. -10.0
0.0
10.0
20.0
30.0
40.0
50.0
Ret
urn
LastQuarter
YearTo Date
1Year
3Years
5Years
7Years
10Years
Vanguard Tot Intl Stk 5.96 (55) 21.56 (61) 19.26 (51) 5.24 (53) 7.41 (52) 5.44 (57) 1.27 (55)¢£
FTSE Global ex USA All Cap Ind. 6.09 (53) 21.22 (64) 19.72 (47) 5.56 (47) 7.77 (47) 5.94 (47) 2.06 (38)��
Median 6.22 23.09 19.31 5.38 7.50 5.77 1.44
-10.0
-5.0
0.0
5.0
10.0
15.0
20.0
Ret
urn
(%)
0.0 10.0 20.0 30.0Risk (Standard Deviation %)
Return StandardDeviation
Vanguard Tot Intl Stk 7.41 11.10¢£
FTSE Global ex USA All Cap Ind. 7.77 11.35��
Median 7.50 11.67¾
FundFamily :
Vanguard GroupInc
Fund Inception : 04/29/1996PortfolioManager :
Perre/Louie
TotalAssets :
$113,090 Million
Turnover : 3%
2016 2015 2014 2013 2012 2011 2010Vanguard Tot Intl Stk 4.65 (33) -4.37 (56) -4.24 (47) 15.04 (57) 18.14 (55) -14.56 (48) 11.12 (61)FTSE Global ex USA All Cap Index 5.04 (32) -4.03 (55) -3.12 (37) 15.90 (54) 17.92 (57) -14.03 (43) 13.23 (49)IM International Equity (MF) Median 1.77 -2.76 -4.47 17.44 18.59 -14.87 12.88
3Years
EndingSep-2017
3Years
EndingSep-2016
3Years
EndingSep-2015
3Years
EndingSep-2014
3Years
EndingSep-2013
3Years
EndingSep-2012
3Years
EndingSep-2011
Vanguard Tot Intl Stk 5.24 (53) 0.79 (49) 3.05 (61) 12.28 (54) 5.86 (61) 2.75 (58) -0.55 (54)FTSE Global ex USA All Cap Index 5.56 (47) 1.20 (43) 3.28 (59) 12.45 (51) 6.48 (55) 3.97 (43) 1.84 (37)IM International Equity (MF) Median 5.38 0.71 4.06 12.54 6.90 3.26 -0.12
Vanguard Tot Intl Stk 09/30/17
22 INTEGRITY. BALANCE. OBJECTIVITY.
TOP 10 HOLDINGSPORTFOLIO CHARACTERISTICS
STYLE MAP (01/01/03 - 09/30/17)
SECTOR ALLOCATION
ASSET ALLOCATION
REGION ALLOCATION
TOP 5 COUNTRIES
UP/DOWN CAPTURE (10/01/12 - 09/30/17)
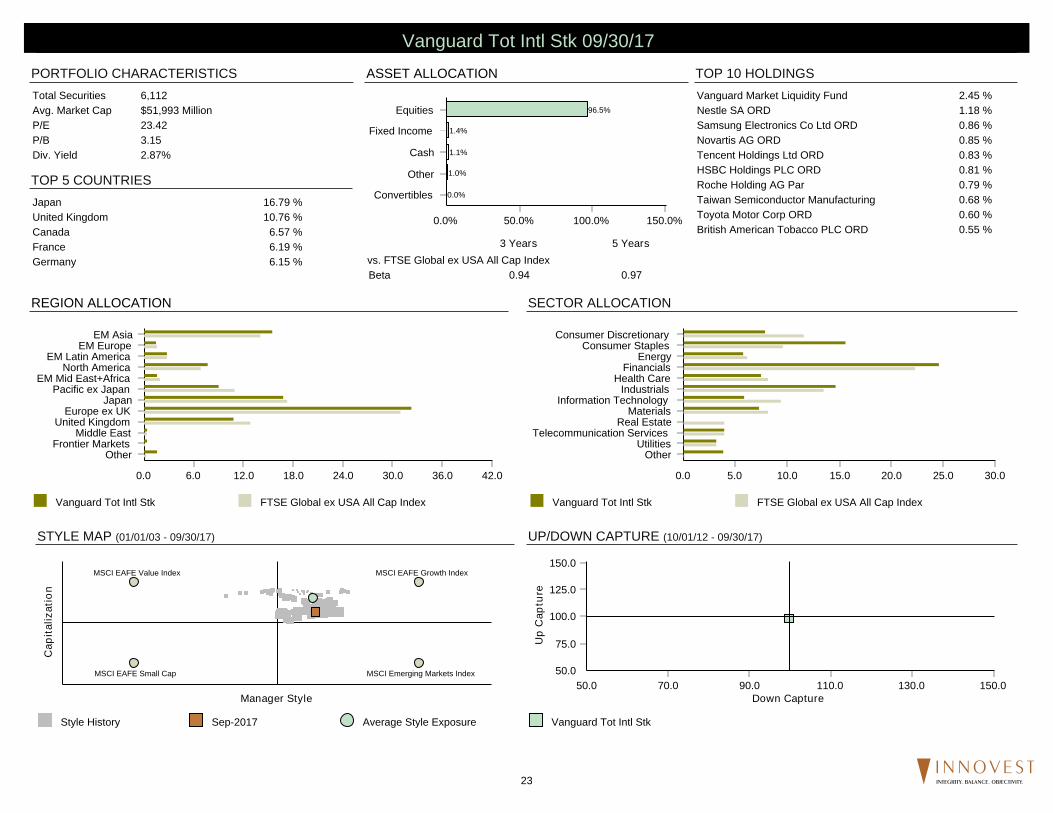
Vanguard Market Liquidity Fund 2.45 %Nestle SA ORD 1.18 %Samsung Electronics Co Ltd ORD 0.86 %Novartis AG ORD 0.85 %Tencent Holdings Ltd ORD 0.83 %HSBC Holdings PLC ORD 0.81 %Roche Holding AG Par 0.79 %Taiwan Semiconductor Manufacturing 0.68 %Toyota Motor Corp ORD 0.60 %British American Tobacco PLC ORD 0.55 %
Total Securities 6,112Avg. Market Cap $51,993 MillionP/E 23.42P/B 3.15Div. Yield 2.87%Annual EPS 15.015Yr EPS 6.353Yr EPS Growth 7.05
0.0% 50.0% 100.0% 150.0%
Convertibles
Other
Cash
Fixed Income
Equities
0.0%
1.0%
1.1%
1.4%
96.5%
Japan 16.79 %United Kingdom 10.76 %Canada 6.57 %France 6.19 %Germany 6.15 %
3 Years 5 Yearsvs. FTSE Global ex USA All Cap IndexBeta 0.94 0.97
Vanguard Tot Intl Stk FTSE Global ex USA All Cap Index
0.0 5.0 10.0 15.0 20.0 25.0 30.0
OtherUtilities
Telecommunication ServicesReal Estate
MaterialsInformation Technology
IndustrialsHealth Care
FinancialsEnergy
Consumer StaplesConsumer Discretionary
Vanguard Tot Intl Stk FTSE Global ex USA All Cap Index
0.0 6.0 12.0 18.0 24.0 30.0 36.0 42.0
OtherFrontier Markets
Middle EastUnited Kingdom
Europe ex UKJapan
Pacific ex JapanEM Mid East+Africa
North AmericaEM Latin America
EM EuropeEM Asia
Style History Sep-2017 Average Style Exposure
Cap
italiz
atio
n
Manager Style
MSCI EAFE Growth Index
MSCI Emerging Markets IndexMSCI EAFE Small Cap
MSCI EAFE Value Index
Vanguard Tot Intl Stk
50.0
75.0
100.0
125.0
150.0
Up
Cap
ture
50.0 70.0 90.0 110.0 130.0 150.0Down Capture
Vanguard Tot Intl Stk 09/30/17
23 INTEGRITY. BALANCE. OBJECTIVITY.
FUND INFORMATION
ROLLING 3 YEAR RETURN AND PERCENTILE RANKINGS
PEER GROUP ANALYSIS - IM International Large Cap Growth Equity (MF)
CALENDAR YEAR RETURNS AND PERCENTILE RANKINGS
RISK VS. RETURN (5 YEARS*)
*If less than 5 years, data is since inception of fund share class.
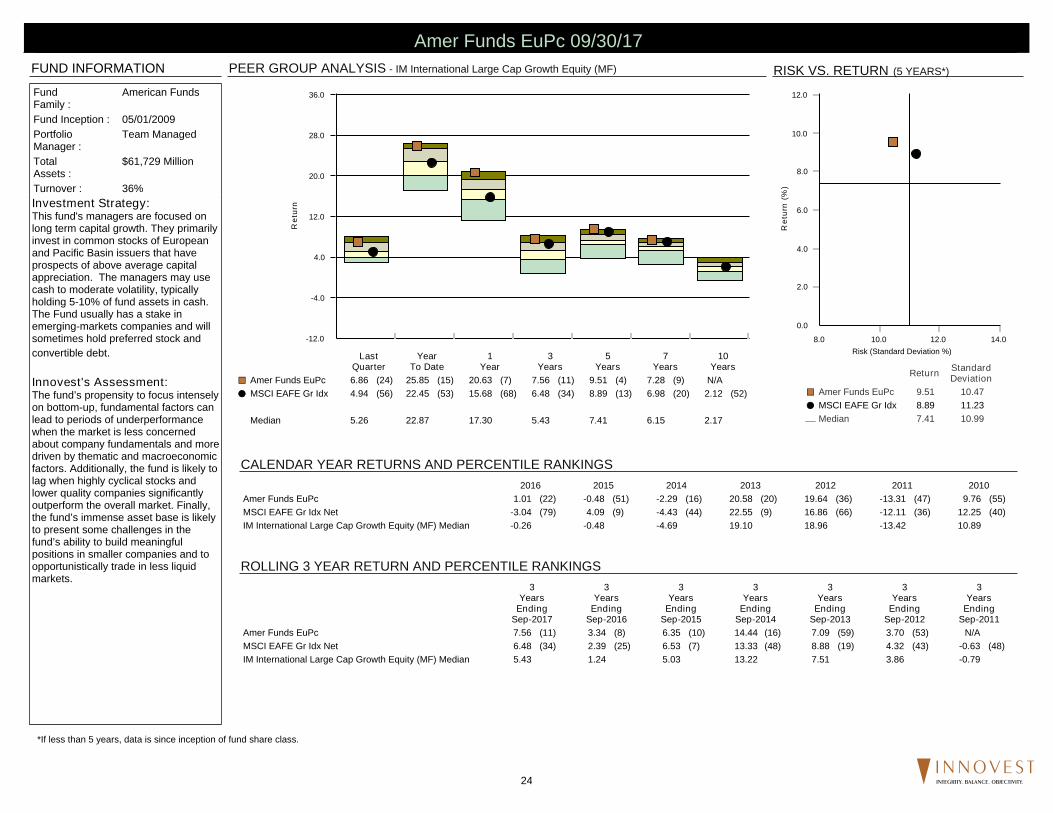
Investment Strategy:This fund's managers are focused onlong term capital growth. They primarilyinvest in common stocks of Europeanand Pacific Basin issuers that haveprospects of above average capitalappreciation. The managers may usecash to moderate volatility, typicallyholding 5-10% of fund assets in cash.The Fund usually has a stake inemerging-markets companies and willsometimes hold preferred stock andconvertible debt.
Innovest's Assessment:The fund’s propensity to focus intenselyon bottom-up, fundamental factors canlead to periods of underperformancewhen the market is less concernedabout company fundamentals and moredriven by thematic and macroeconomicfactors. Additionally, the fund is likely tolag when highly cyclical stocks andlower quality companies significantlyoutperform the overall market. Finally,the fund’s immense asset base is likelyto present some challenges in thefund’s ability to build meaningfulpositions in smaller companies and toopportunistically trade in less liquidmarkets.
-12.0
-4.0
4.0
12.0
20.0
28.0
36.0
Ret
urn
LastQuarter
YearTo Date
1Year
3Years
5Years
7Years
10Years
Amer Funds EuPc 6.86 (24) 25.85 (15) 20.63 (7) 7.56 (11) 9.51 (4) 7.28 (9) N/A¢£
MSCI EAFE Gr Idx 4.94 (56) 22.45 (53) 15.68 (68) 6.48 (34) 8.89 (13) 6.98 (20) 2.12 (52)��
Median 5.26 22.87 17.30 5.43 7.41 6.15 2.17
0.0
2.0
4.0
6.0
8.0
10.0
12.0
Ret
urn
(%)
8.0 10.0 12.0 14.0Risk (Standard Deviation %)
Return StandardDeviation
Amer Funds EuPc 9.51 10.47¢£
MSCI EAFE Gr Idx 8.89 11.23��
Median 7.41 10.99¾
FundFamily :
American Funds
Fund Inception : 05/01/2009PortfolioManager :
Team Managed
TotalAssets :
$61,729 Million
Turnover : 36%
2016 2015 2014 2013 2012 2011 2010Amer Funds EuPc 1.01 (22) -0.48 (51) -2.29 (16) 20.58 (20) 19.64 (36) -13.31 (47) 9.76 (55)MSCI EAFE Gr Idx Net -3.04 (79) 4.09 (9) -4.43 (44) 22.55 (9) 16.86 (66) -12.11 (36) 12.25 (40)IM International Large Cap Growth Equity (MF) Median -0.26 -0.48 -4.69 19.10 18.96 -13.42 10.89
3Years
EndingSep-2017
3Years
EndingSep-2016
3Years
EndingSep-2015
3Years
EndingSep-2014
3Years
EndingSep-2013
3Years
EndingSep-2012
3Years
EndingSep-2011
Amer Funds EuPc 7.56 (11) 3.34 (8) 6.35 (10) 14.44 (16) 7.09 (59) 3.70 (53) N/AMSCI EAFE Gr Idx Net 6.48 (34) 2.39 (25) 6.53 (7) 13.33 (48) 8.88 (19) 4.32 (43) -0.63 (48)IM International Large Cap Growth Equity (MF) Median 5.43 1.24 5.03 13.22 7.51 3.86 -0.79
Amer Funds EuPc 09/30/17
24 INTEGRITY. BALANCE. OBJECTIVITY.

REGION ALLOCATION
STYLE MAP (06/01/09 - 09/30/17)
REGION PERFORMANCE
TOP 10 HOLDINGSPORTFOLIO CHARACTERISTICS
TOTAL SECTOR ATTRIBUTION (07/01/17 - 09/30/17)
TOTAL REGION ATTRIBUTION
PortfolioWeight
(%)
BenchmarkWeight
(%)
QuarterlyReturn
(%)SAMSUNG ELECTRONICS CO LTD 3.20 0.00 N/AAlibaba Group Holding Ltd 3.07 0.00 22.58British American Tobacco 2.63 2.01 -6.68AIA Group Ltd 2.52 1.24 1.34Taiwan Semiconductor 2.34 0.00 4.02H D F C Bank Ltd 2.14 0.00 8.12Tencent Holdings LTD 2.14 0.00 20.34Softbank Group Corp 2.10 0.93 -0.10European Aeronautic 2.09 0.77 15.77Nintendo Co Ltd 1.96 0.38 10.08
% of Portfolio 24.19 5.33
Portfolio BenchmarkWtd. Avg. Mkt. Cap $M $87,260 $52,989Median Mkt. Cap $M $23,442 $10,845Price/Earnings ratio 20.22 21.41Price/Book ratio 3.15 2.975 Yr. EPS Growth Rate (%) 10.62 9.57Current Yield (%) 1.41 2.19Beta (5 Years, Monthly) 0.88 1.00% in Emerging Market 29.85 N/AActive Share 78.75 N/ANumber of Stocks 249 562
Amer Funds EuPc MSCI EAFE Gr Idx Net
0.0 15.0 30.0 45.0 60.0
United KingdomPacific ex Japan
OtherNorth America
Middle EastJapan
Europe ex UKEM Mid East+Africa
EM Latin AmericaEM Europe
EM Asia
10.910.6
0.14.5
0.515.7
31.51.12.2
0.822.2
16.411.8
0.40.20.6
23.746.8
0.00.00.00.0
Amer Funds EuPc
0.0 0.4 0.8 1.2 1.6-0.4-0.8
-0.21.0
0.00.1
-0.30.3
-0.30.1
0.40.1
1.0
Amer Funds EuPc MSCI EAFE Gr Idx Net
0.0 25.0 50.0-25.0-50.0-75.0
1.012.4
4.37.1
-46.75.06.8
10.924.2
19.79.5
3.63.0
10.82.2
4.63.9
6.60.00.00.00.0
Style History Sep-2017 Average Style Exposure
Cap
italiz
atio
n
Manager Style
MSCI EAFE Growth Index
MSCI Emerging Markets IndexMSCI EAFE Small Cap
MSCI EAFE Value Index
0.0 0.5 1.0 1.5 2.0 2.5-0.5-1.0
UtilitiesTelecommunication Services
Real EstateMaterials
Information TechnologyIndustrials
Health CareFinancials
EnergyConsumer Staples
Consumer Discretionary
0.5-0.1
0.10.0
1.50.00.0
0.20.3
0.0-0.4
Amer Funds EuPc 09/30/17
25 INTEGRITY. BALANCE. OBJECTIVITY.
FUND INFORMATION
ROLLING 3 YEAR RETURN AND PERCENTILE RANKINGS
PEER GROUP ANALYSIS - IM U.S. Broad Market Core Fixed Income (MF)
CALENDAR YEAR RETURNS AND PERCENTILE RANKINGS
RISK VS. RETURN (5 YEARS*)
*If less than 5 years, data is since inception of fund share class.
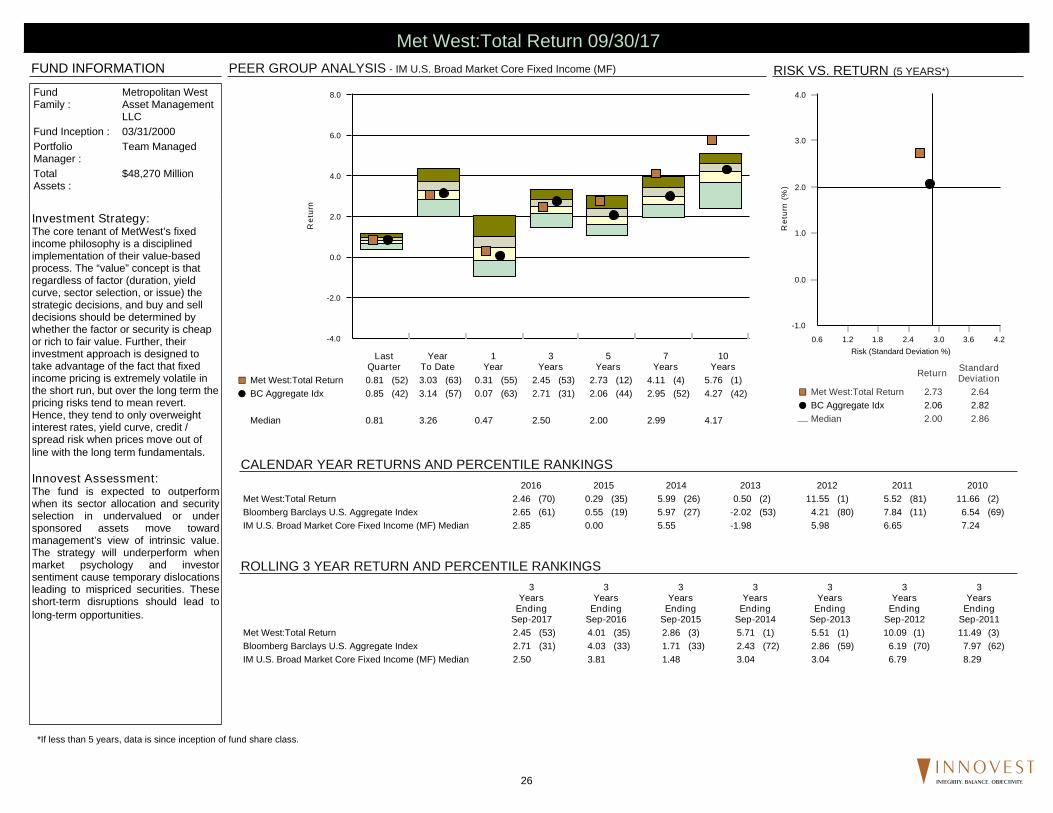
Investment Strategy:The core tenant of MetWest’s fixedincome philosophy is a disciplinedimplementation of their value-basedprocess. The “value” concept is thatregardless of factor (duration, yieldcurve, sector selection, or issue) thestrategic decisions, and buy and selldecisions should be determined bywhether the factor or security is cheapor rich to fair value. Further, theirinvestment approach is designed totake advantage of the fact that fixedincome pricing is extremely volatile inthe short run, but over the long term thepricing risks tend to mean revert.Hence, they tend to only overweightinterest rates, yield curve, credit /spread risk when prices move out ofline with the long term fundamentals.
Innovest Assessment:The fund is expected to outperformwhen its sector allocation and securityselection in undervalued or undersponsored assets move towardmanagement’s view of intrinsic value.The strategy will underperform whenmarket psychology and investorsentiment cause temporary dislocationsleading to mispriced securities. Theseshort-term disruptions should lead tolong-term opportunities.
-4.0
-2.0
0.0
2.0
4.0
6.0
8.0
Ret
urn
LastQuarter
YearTo Date
1Year
3Years
5Years
7Years
10Years
Met West:Total Return 0.81 (52) 3.03 (63) 0.31 (55) 2.45 (53) 2.73 (12) 4.11 (4) 5.76 (1)¢£
BC Aggregate Idx 0.85 (42) 3.14 (57) 0.07 (63) 2.71 (31) 2.06 (44) 2.95 (52) 4.27 (42)��
Median 0.81 3.26 0.47 2.50 2.00 2.99 4.17
-1.0
0.0
1.0
2.0
3.0
4.0
Ret
urn
(%)
0.6 1.2 1.8 2.4 3.0 3.6 4.2Risk (Standard Deviation %)
Return StandardDeviation
Met West:Total Return 2.73 2.64¢£
BC Aggregate Idx 2.06 2.82��
Median 2.00 2.86¾
FundFamily :
Metropolitan WestAsset ManagementLLC
Fund Inception : 03/31/2000PortfolioManager :
Team Managed
TotalAssets :
$48,270 Million
Turnover : 313%
2016 2015 2014 2013 2012 2011 2010Met West:Total Return 2.46 (70) 0.29 (35) 5.99 (26) 0.50 (2) 11.55 (1) 5.52 (81) 11.66 (2)Bloomberg Barclays U.S. Aggregate Index 2.65 (61) 0.55 (19) 5.97 (27) -2.02 (53) 4.21 (80) 7.84 (11) 6.54 (69)IM U.S. Broad Market Core Fixed Income (MF) Median 2.85 0.00 5.55 -1.98 5.98 6.65 7.24
3Years
EndingSep-2017
3Years
EndingSep-2016
3Years
EndingSep-2015
3Years
EndingSep-2014
3Years
EndingSep-2013
3Years
EndingSep-2012
3Years
EndingSep-2011
Met West:Total Return 2.45 (53) 4.01 (35) 2.86 (3) 5.71 (1) 5.51 (1) 10.09 (1) 11.49 (3)Bloomberg Barclays U.S. Aggregate Index 2.71 (31) 4.03 (33) 1.71 (33) 2.43 (72) 2.86 (59) 6.19 (70) 7.97 (62)IM U.S. Broad Market Core Fixed Income (MF) Median 2.50 3.81 1.48 3.04 3.04 6.79 8.29
Met West:Total Return 09/30/17
26 INTEGRITY. BALANCE. OBJECTIVITY.

TOP SECTOR ALLOCATIONSPORTFOLIO CHARACTERISTICS
STYLE MAP (04/01/00 - 09/30/17)
QUALITY ALLOCATION
ASSET ALLOCATION
MATURITY DISTRIBUTION
UP/DOWN CAPTURE (10/01/12 - 09/30/17)
GNMA and Other Mtg Backed 36.58 %Corporate Notes/Bonds 30.39 %Government Agency Securities 25.51 %Asset Backed Securities 5.98 %
Avg. Coupon 3.17 %Nominal Maturity 7.16 YearsEffective Maturity N/ADuration 5.62 YearsSEC 30 Day Yield 3.85Avg. Credit Quality AA
0.0% 50.0% 100.0% 150.0%
Convertibles
Equities
Other
Cash
Fixed Income
0.0%
0.0%
0.0%
1.5%
98.5%
0.0% 20.0% 40.0% 60.0% 80.0% 100.0%
Government/AAAA Rated
BBB RatedAA Rated
CCC, CC AND C rated
BB AND B RatedD Rated
Not RatedEquities/Other
64.6%
15.9%
9.6%
5.3%
2.4%
2.1%
0.2%
0.0%
0.0%
0.0% 10.0% 20.0% 30.0% 40.0% 50.0% 60.0%
>30Yrs
Other
10-20Yrs
1-3Yrs
20-30Yrs
<1Yr
3-5Yrs
5-10Yrs
0.0%
0.0%
4.3%
8.4%
9.2%
11.1%
22.3%
44.7%
Style History Sep-2017
Average Style Exposure
Cap
italiz
atio
n
Manager Style
Barclays Capital Long Term Govt Bond
Barclays Capital Long U.S. CreditBarclays Capital U.S. Credit 1-5 Year Index
Barclays Capital 1-5 Yr Gov
Met West:Total Return
50.0
75.0
100.0
125.0
150.0U
p C
aptu
re
50.0 70.0 90.0 110.0 130.0 150.0Down Capture
Met West:Total Return 09/30/17
27 INTEGRITY. BALANCE. OBJECTIVITY.
FUND INFORMATION
ROLLING 3 YEAR RETURN AND PERCENTILE RANKINGS
PEER GROUP ANALYSIS - IM U.S. Broad Market Core Fixed Income (MF)
CALENDAR YEAR RETURNS AND PERCENTILE RANKINGS
RISK VS. RETURN (5 YEARS*)
*If less than 5 years, data is since inception of fund share class.
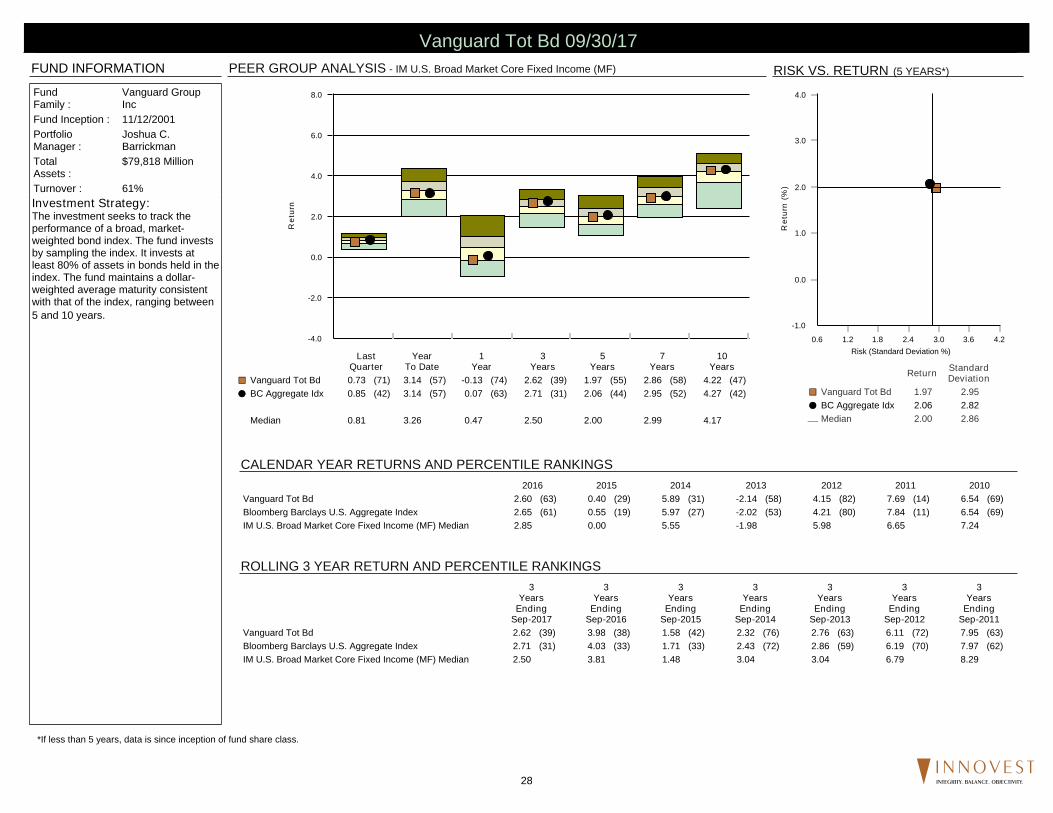
Investment Strategy:The investment seeks to track theperformance of a broad, market-weighted bond index. The fund investsby sampling the index. It invests atleast 80% of assets in bonds held in theindex. The fund maintains a dollar-weighted average maturity consistentwith that of the index, ranging between5 and 10 years.
-4.0
-2.0
0.0
2.0
4.0
6.0
8.0
Ret
urn
LastQuarter
YearTo Date
1Year
3Years
5Years
7Years
10Years
Vanguard Tot Bd 0.73 (71) 3.14 (57) -0.13 (74) 2.62 (39) 1.97 (55) 2.86 (58) 4.22 (47)¢£
BC Aggregate Idx 0.85 (42) 3.14 (57) 0.07 (63) 2.71 (31) 2.06 (44) 2.95 (52) 4.27 (42)��
Median 0.81 3.26 0.47 2.50 2.00 2.99 4.17
-1.0
0.0
1.0
2.0
3.0
4.0
Ret
urn
(%)
0.6 1.2 1.8 2.4 3.0 3.6 4.2Risk (Standard Deviation %)
Return StandardDeviation
Vanguard Tot Bd 1.97 2.95¢£
BC Aggregate Idx 2.06 2.82��
Median 2.00 2.86¾
FundFamily :
Vanguard GroupInc
Fund Inception : 11/12/2001PortfolioManager :
Joshua C.Barrickman
TotalAssets :
$79,818 Million
Turnover : 61%
2016 2015 2014 2013 2012 2011 2010Vanguard Tot Bd 2.60 (63) 0.40 (29) 5.89 (31) -2.14 (58) 4.15 (82) 7.69 (14) 6.54 (69)Bloomberg Barclays U.S. Aggregate Index 2.65 (61) 0.55 (19) 5.97 (27) -2.02 (53) 4.21 (80) 7.84 (11) 6.54 (69)IM U.S. Broad Market Core Fixed Income (MF) Median 2.85 0.00 5.55 -1.98 5.98 6.65 7.24
3Years
EndingSep-2017
3Years
EndingSep-2016
3Years
EndingSep-2015
3Years
EndingSep-2014
3Years
EndingSep-2013
3Years
EndingSep-2012
3Years
EndingSep-2011
Vanguard Tot Bd 2.62 (39) 3.98 (38) 1.58 (42) 2.32 (76) 2.76 (63) 6.11 (72) 7.95 (63)Bloomberg Barclays U.S. Aggregate Index 2.71 (31) 4.03 (33) 1.71 (33) 2.43 (72) 2.86 (59) 6.19 (70) 7.97 (62)IM U.S. Broad Market Core Fixed Income (MF) Median 2.50 3.81 1.48 3.04 3.04 6.79 8.29
Vanguard Tot Bd 09/30/17
28 INTEGRITY. BALANCE. OBJECTIVITY.
TOP SECTOR ALLOCATIONSPORTFOLIO CHARACTERISTICS
STYLE MAP (12/01/01 - 09/30/17)
QUALITY ALLOCATION
ASSET ALLOCATION
MATURITY DISTRIBUTION
UP/DOWN CAPTURE (10/01/12 - 09/30/17)
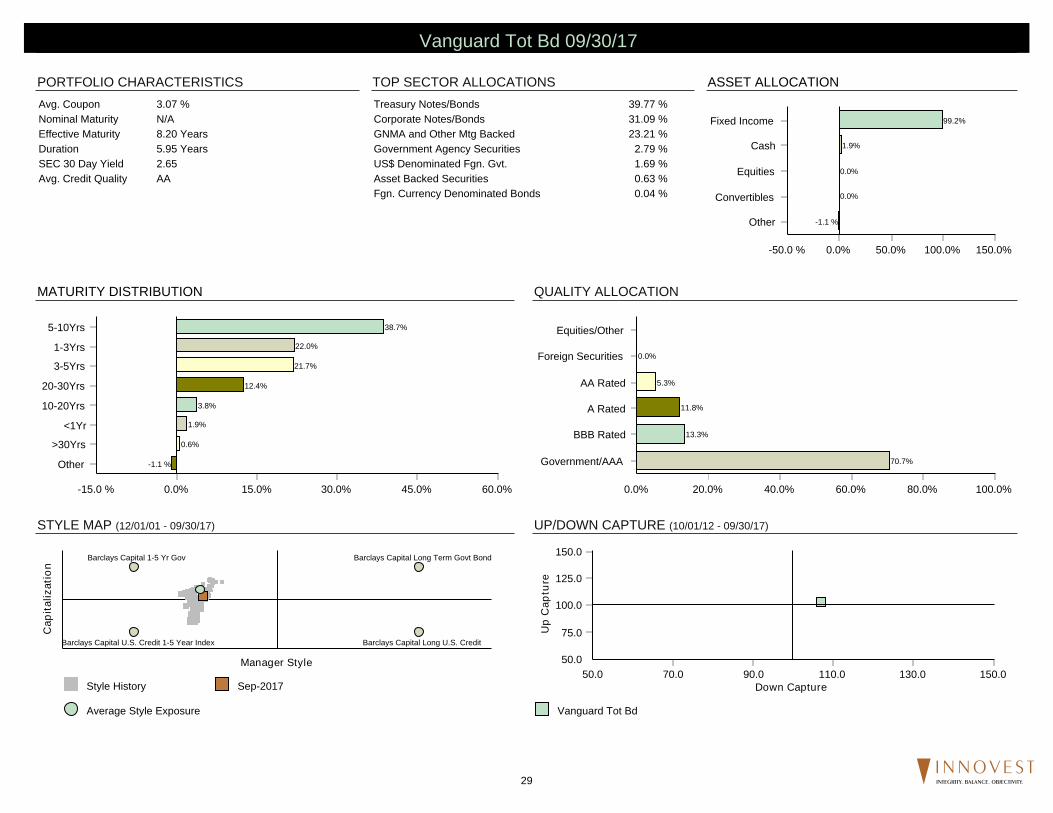
Treasury Notes/Bonds 39.77 %Corporate Notes/Bonds 31.09 %GNMA and Other Mtg Backed 23.21 %Government Agency Securities 2.79 %US$ Denominated Fgn. Gvt. 1.69 %Asset Backed Securities 0.63 %Fgn. Currency Denominated Bonds 0.04 %
Avg. Coupon 3.07 %Nominal Maturity N/AEffective Maturity 8.20 YearsDuration 5.95 YearsSEC 30 Day Yield 2.65Avg. Credit Quality AA
0.0% 50.0% 100.0% 150.0%-50.0 %
Other
Convertibles
Equities
Cash
Fixed Income
-1.1 %
0.0%
0.0%
1.9%
99.2%
0.0% 20.0% 40.0% 60.0% 80.0% 100.0%
Government/AAA
BBB Rated
A Rated
AA Rated
Foreign Securities
Equities/Other
70.7%
13.3%
11.8%
5.3%
0.0%
0.0% 15.0% 30.0% 45.0% 60.0%-15.0 %
Other
>30Yrs
<1Yr
10-20Yrs
20-30Yrs
3-5Yrs
1-3Yrs
5-10Yrs
-1.1 %
0.6%
1.9%
3.8%
12.4%
21.7%
22.0%
38.7%
Style History Sep-2017
Average Style Exposure
Cap
italiz
atio
n
Manager Style
Barclays Capital Long Term Govt Bond
Barclays Capital Long U.S. CreditBarclays Capital U.S. Credit 1-5 Year Index
Barclays Capital 1-5 Yr Gov
Vanguard Tot Bd
50.0
75.0
100.0
125.0
150.0U
p C
aptu
re
50.0 70.0 90.0 110.0 130.0 150.0Down Capture
Vanguard Tot Bd 09/30/17
29 INTEGRITY. BALANCE. OBJECTIVITY.

THIS PAGE LEFT INTENTIONALLY BLANK
30 INTEGRITY. BALANCE. OBJECTIVITY.
90.36%
5.21%
4.43%
TIAA Traditional Account
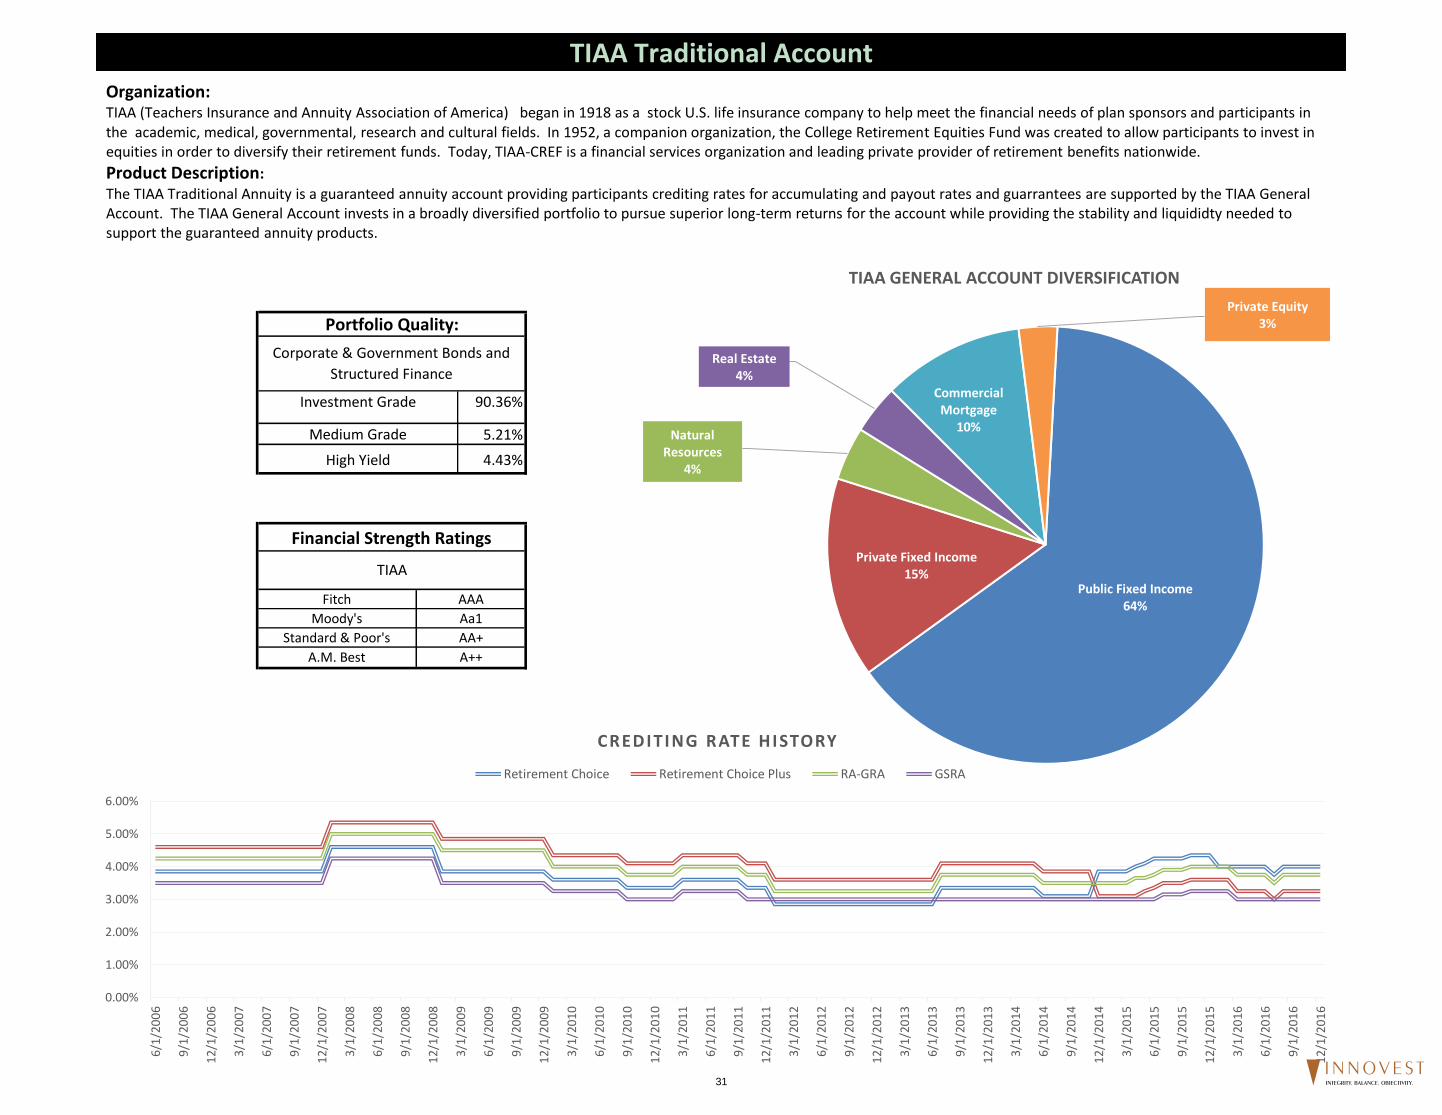
Medium Grade
High Yield
Corporate & Government Bonds and
Structured Finance
Financial Strength Ratings
TIAA
Fitch
Moody's
Standard & Poor's
AAA
Aa1
AA+
A.M. Best A++
Portfolio Quality:
Investment Grade
Organization:TIAA (Teachers Insurance and Annuity Association of America) began in 1918 as a stock U.S. life insurance company to help meet the financial needs of plan sponsors and participants in the academic, medical, governmental, research and cultural fields. In 1952, a companion organization, the College Retirement Equities Fund was created to allow participants to invest in equities in order to diversify their retirement funds. Today, TIAA-CREF is a financial services organization and leading private provider of retirement benefits nationwide.
Product Description:
The TIAA Traditional Annuity is a guaranteed annuity account providing participants crediting rates for accumulating and payout rates and guarrantees are supported by the TIAA General Account. The TIAA General Account invests in a broadly diversified portfolio to pursue superior long-term returns for the account while providing the stability and liquididty needed to support the guaranteed annuity products.
Public Fixed Income64%
Private Fixed Income15%
Natural Resources
4%
Real Estate 4%
Commercial Mortgage
10%
Private Equity3%
TIAA GENERAL ACCOUNT DIVERSIFICATION
0.00%
1.00%
2.00%
3.00%
4.00%
5.00%
6.00%
6/1
/20
06
9/1
/20
06
12
/1/2
00
6
3/1
/20
07
6/1
/20
07
9/1
/20
07
12
/1/2
00
7
3/1
/20
08
6/1
/20
08
9/1
/20
08
12
/1/2
00
8
3/1
/20
09
6/1
/20
09
9/1
/20
09
12
/1/2
00
9
3/1
/20
10
6/1
/20
10
9/1
/20
10
12
/1/2
01
0
3/1
/20
11
6/1
/20
11
9/1
/20
11
12
/1/2
01
1
3/1
/20
12
6/1
/20
12
9/1
/20
12
12
/1/2
01
2
3/1
/20
13
6/1
/20
13
9/1
/20
13
12
/1/2
01
3
3/1
/20
14
6/1
/20
14
9/1
/20
14
12
/1/2
01
4
3/1
/20
15
6/1
/20
15
9/1
/20
15
12
/1/2
01
5
3/1
/20
16
6/1
/20
16
9/1
/20
16
12
/1/2
01
6
CREDITING RATE HISTORY
Retirement Choice Retirement Choice Plus RA-GRA GSRA
31 INTEGRITY. BALANCE. OBJECTIVITY.
FUND INFORMATION
ROLLING 3 YEAR RETURN AND PERCENTILE RANKINGS
PEER GROUP ANALYSIS - IM U.S. Multi-Cap Core Equity (MF)
CALENDAR YEAR RETURNS AND PERCENTILE RANKINGS
RISK VS. RETURN (5 YEARS*)
*If less than 5 years, data is since inception of fund share class.
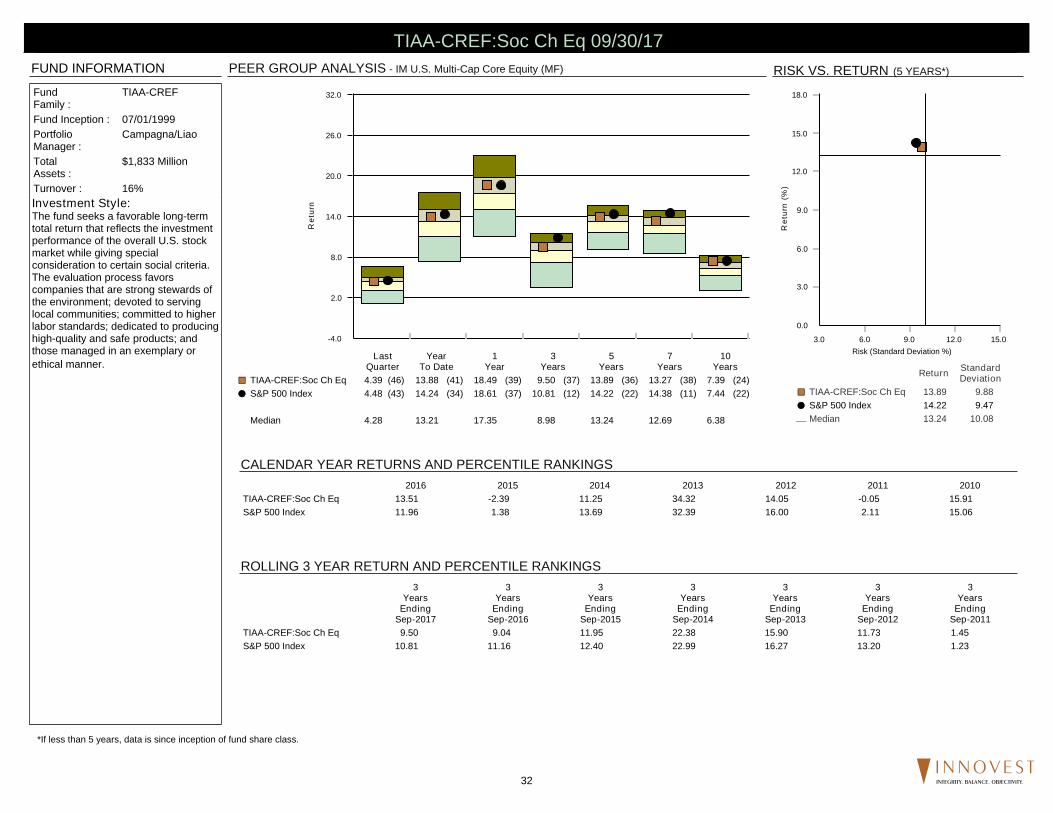
Investment Style:The fund seeks a favorable long-termtotal return that reflects the investmentperformance of the overall U.S. stockmarket while giving specialconsideration to certain social criteria.The evaluation process favorscompanies that are strong stewards ofthe environment; devoted to servinglocal communities; committed to higherlabor standards; dedicated to producinghigh-quality and safe products; andthose managed in an exemplary orethical manner.
-4.0
2.0
8.0
14.0
20.0
26.0
32.0
Ret
urn
LastQuarter
YearTo Date
1Year
3Years
5Years
7Years
10Years
TIAA-CREF:Soc Ch Eq 4.39 (46) 13.88 (41) 18.49 (39) 9.50 (37) 13.89 (36) 13.27 (38) 7.39 (24)¢£
S&P 500 Index 4.48 (43) 14.24 (34) 18.61 (37) 10.81 (12) 14.22 (22) 14.38 (11) 7.44 (22)��
Median 4.28 13.21 17.35 8.98 13.24 12.69 6.38
0.0
3.0
6.0
9.0
12.0
15.0
18.0
Ret
urn
(%)
3.0 6.0 9.0 12.0 15.0Risk (Standard Deviation %)
Return StandardDeviation
TIAA-CREF:Soc Ch Eq 13.89 9.88¢£
S&P 500 Index 14.22 9.47��
Median 13.24 10.08¾
FundFamily :
TIAA-CREF
Fund Inception : 07/01/1999PortfolioManager :
Campagna/Liao
TotalAssets :
$1,833 Million
Turnover : 16%
2016 2015 2014 2013 2012 2011 2010TIAA-CREF:Soc Ch Eq 13.51 -2.39 11.25 34.32 14.05 -0.05 15.91S&P 500 Index 11.96 1.38 13.69 32.39 16.00 2.11 15.06
3Years
EndingSep-2017
3Years
EndingSep-2016
3Years
EndingSep-2015
3Years
EndingSep-2014
3Years
EndingSep-2013
3Years
EndingSep-2012
3Years
EndingSep-2011
TIAA-CREF:Soc Ch Eq 9.50 9.04 11.95 22.38 15.90 11.73 1.45S&P 500 Index 10.81 11.16 12.40 22.99 16.27 13.20 1.23
TIAA-CREF:Soc Ch Eq 09/30/17
32 INTEGRITY. BALANCE. OBJECTIVITY.
SECTOR ALLOCATION
STYLE MAP (08/01/99 - 09/30/17)
SECTOR PERFORMANCE
TOP 10 HOLDINGSPORTFOLIO CHARACTERISTICS
UP/DOWN CAPTURE (10/01/12 - 09/30/17)
TOTAL SECTOR ATTRIBUTION
PortfolioWeight
(%)
BenchmarkWeight
(%)
QuarterlyReturn
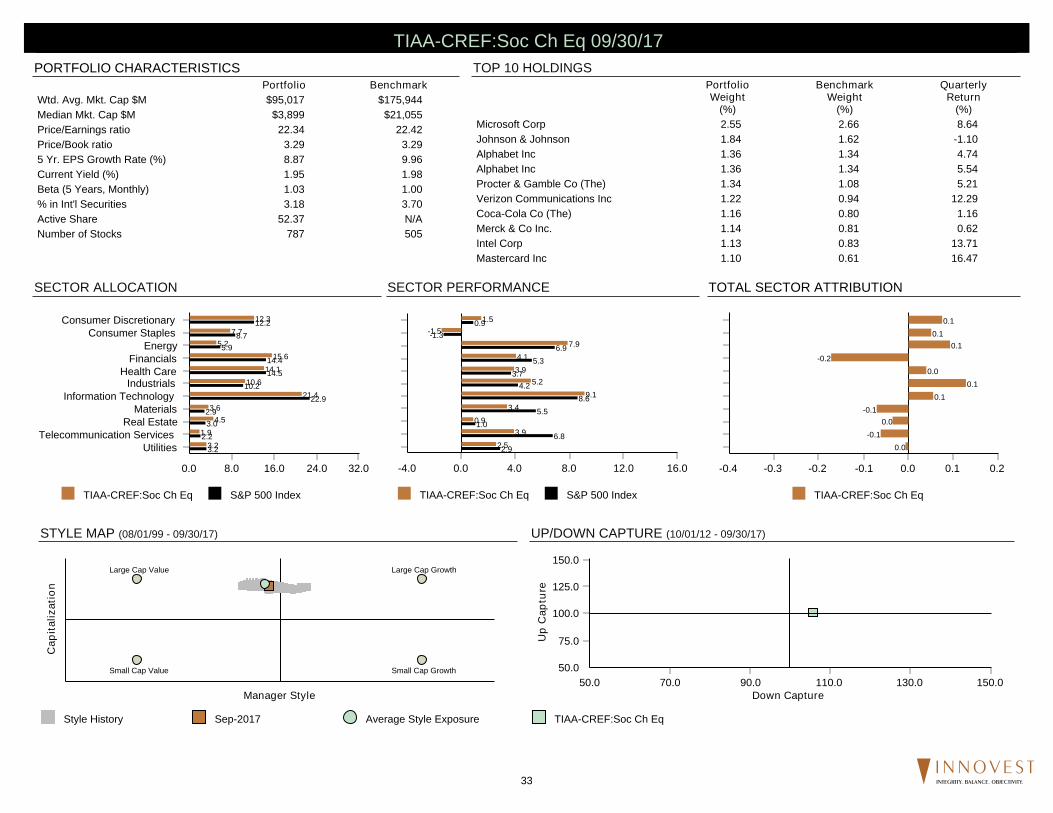
(%)Microsoft Corp 2.55 2.66 8.64Johnson & Johnson 1.84 1.62 -1.10Alphabet Inc 1.36 1.34 4.74Alphabet Inc 1.36 1.34 5.54Procter & Gamble Co (The) 1.34 1.08 5.21Verizon Communications Inc 1.22 0.94 12.29Coca-Cola Co (The) 1.16 0.80 1.16Merck & Co Inc. 1.14 0.81 0.62Intel Corp 1.13 0.83 13.71Mastercard Inc 1.10 0.61 16.47
% of Portfolio 14.20 12.03
Portfolio BenchmarkWtd. Avg. Mkt. Cap $M $95,017 $175,944Median Mkt. Cap $M $3,899 $21,055Price/Earnings ratio 22.34 22.42Price/Book ratio 3.29 3.295 Yr. EPS Growth Rate (%) 8.87 9.96Current Yield (%) 1.95 1.98Beta (5 Years, Monthly) 1.03 1.00% in Int'l Securities 3.18 3.70Active Share 52.37 N/ANumber of Stocks 787 505
TIAA-CREF:Soc Ch Eq S&P 500 Index
0.0 8.0 16.0 24.0 32.0
UtilitiesTelecommunication Services
Real EstateMaterials
Information TechnologyIndustrials
Health CareFinancials
EnergyConsumer Staples
Consumer Discretionary
3.21.9
4.53.6
21.410.6
14.115.6
5.27.7
12.3
3.22.2
3.02.9
22.910.2
14.514.4
5.98.7
12.2
TIAA-CREF:Soc Ch Eq
0.0 0.1 0.2-0.1-0.2-0.3-0.4
0.0-0.1
0.0-0.1
0.10.1
0.0-0.2
0.10.1
0.1
TIAA-CREF:Soc Ch Eq S&P 500 Index
0.0 4.0 8.0 12.0 16.0-4.0
2.53.9
0.93.4
9.15.2
3.94.1
7.9-1.5
1.5
2.96.8
1.05.5
8.64.2
3.75.3
6.9-1.3
0.9
Style History Sep-2017 Average Style Exposure
Cap
italiz
atio
n
Manager Style
Large Cap Growth
Small Cap GrowthSmall Cap Value
Large Cap Value
TIAA-CREF:Soc Ch Eq
50.0
75.0
100.0
125.0
150.0
Up
Cap
ture
50.0 70.0 90.0 110.0 130.0 150.0Down Capture
TIAA-CREF:Soc Ch Eq 09/30/17
33 INTEGRITY. BALANCE. OBJECTIVITY.
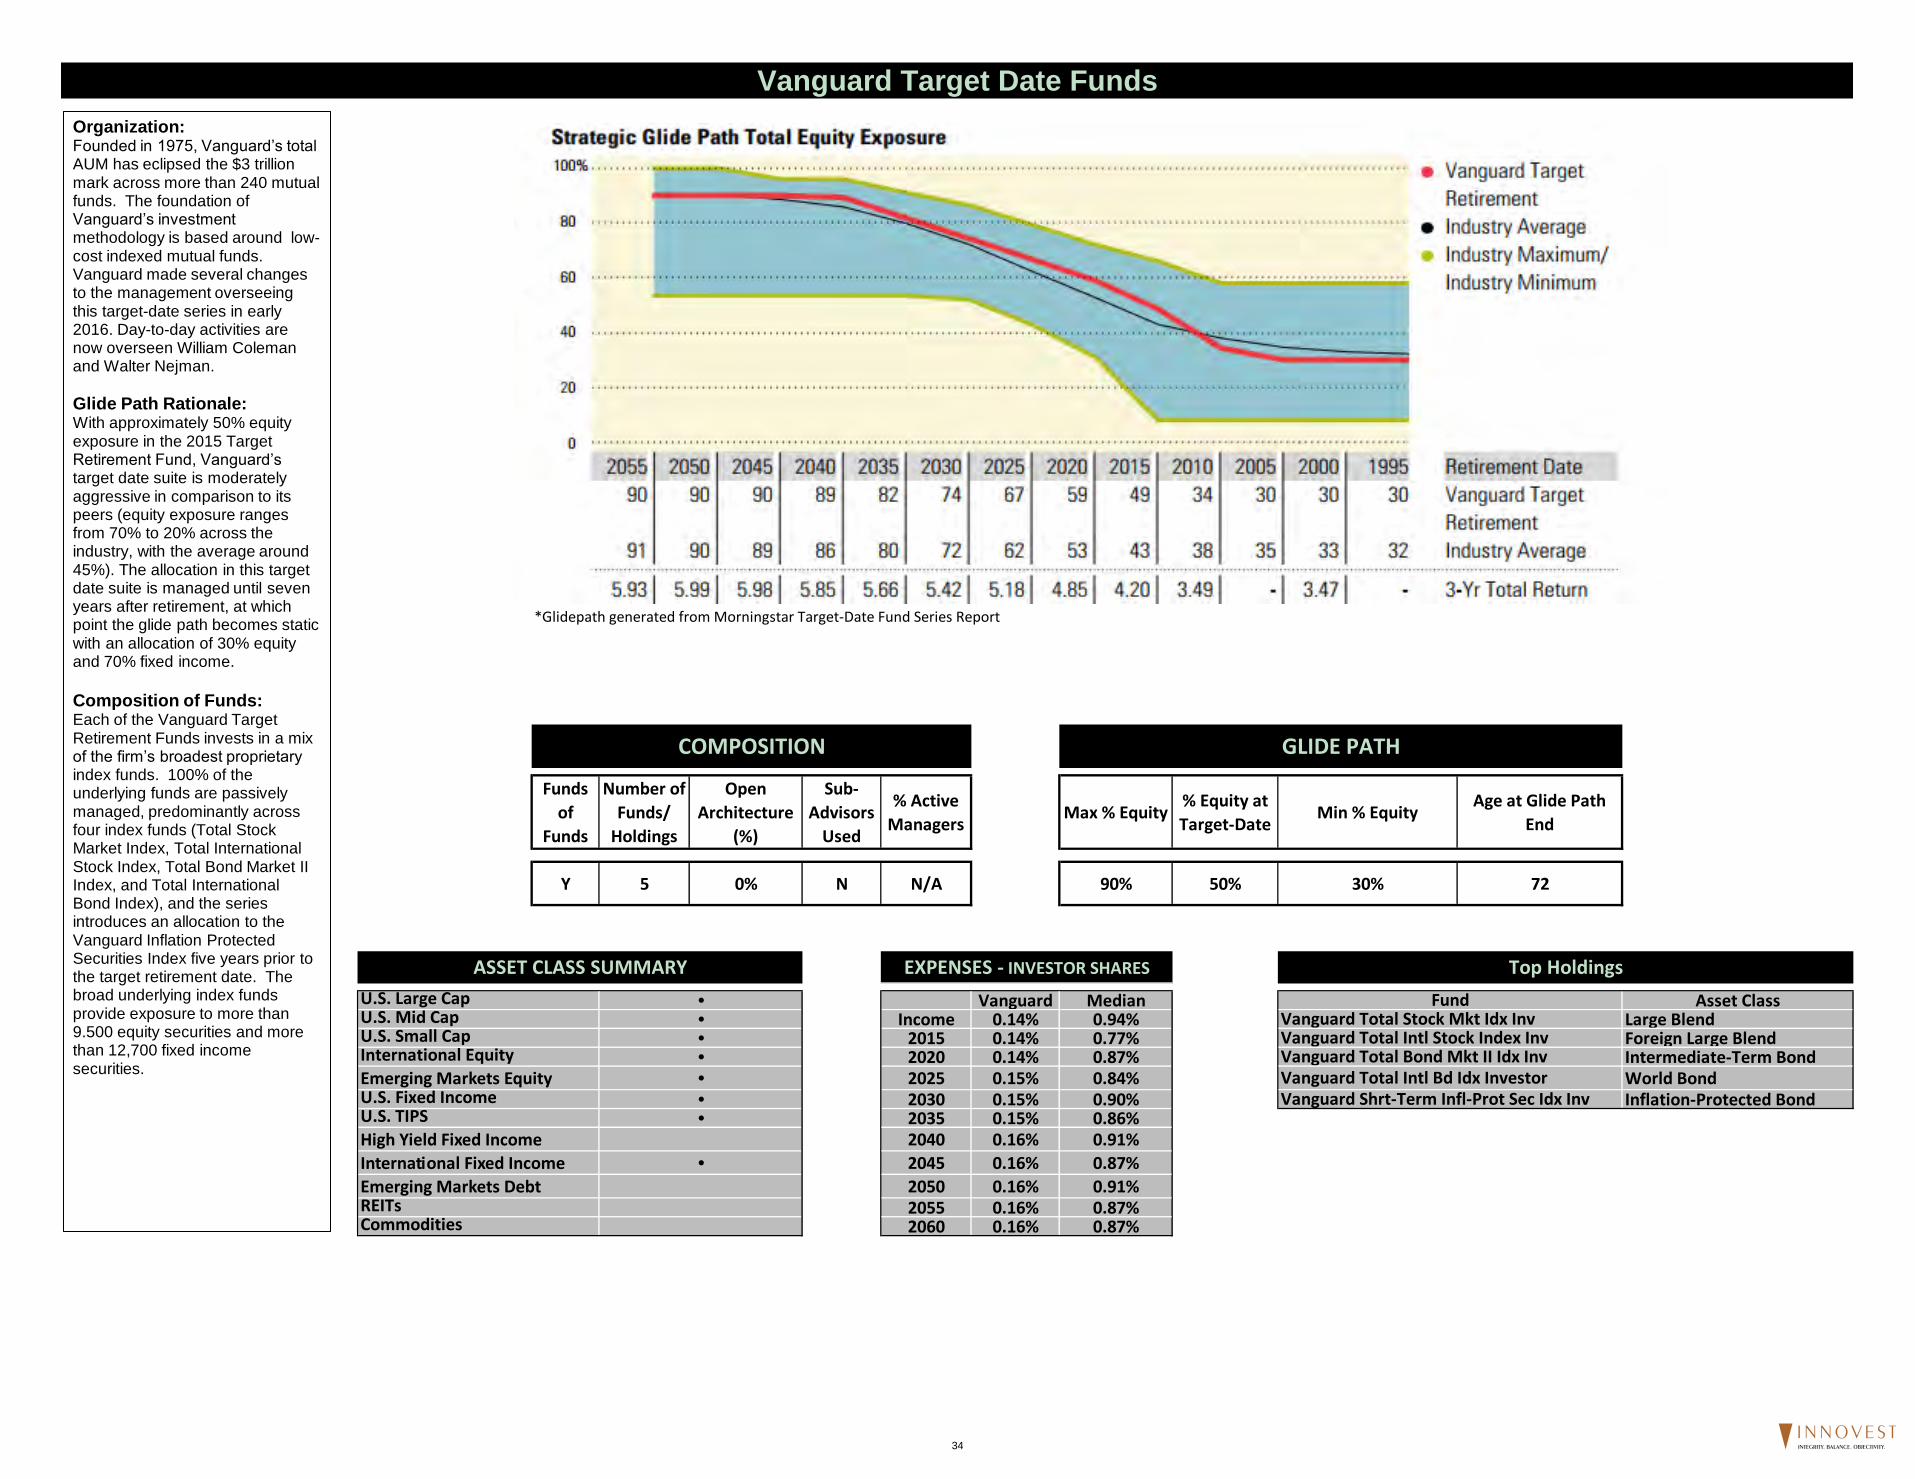
*Glidepath generated from Morningstar Target-Date Fund Series Report
Funds
of
Funds
Number of
Funds/
Holdings
Open
Architecture
(%)
Sub-
Advisors
Used
% Active
ManagersMax % Equity
% Equity at
Target-DateMin % Equity
Age at Glide Path
End
Y 5 0% N N/A 90% 50% 30% 72
Vanguard Median Asset ClassIncome 0.14% 0.94% Large Blend
2015 0.14% 0.77% Foreign Large Blend2020 0.14% 0.87% Intermediate-Term Bond2025 0.15% 0.84% World Bond2030 0.15% 0.90% Inflation-Protected Bond2035 0.15% 0.86%2040 0.16% 0.91%
2045 0.16% 0.87%
2050 0.16% 0.91%2055 0.16% 0.87%2060 0.16% 0.87%
International Equity
U.S. Fixed IncomeU.S. TIPS
REITsCommodities
•
•Emerging Markets Equity
High Yield Fixed Income
International Fixed Income
Emerging Markets Debt
U.S. Small Cap
EXPENSES - INVESTOR SHARES
•
Vanguard Target Date Funds
GLIDE PATHCOMPOSITION
ASSET CLASS SUMMARY
U.S. Large Cap
Top Holdings
•• Vanguard Total Intl Stock Index Inv
Vanguard Total Intl Bd Idx InvestorVanguard Shrt-Term Infl-Prot Sec Idx Inv
•••
FundVanguard Total Stock Mkt Idx Inv
Vanguard Total Bond Mkt II Idx Inv
U.S. Mid Cap
Organization:Founded in 1975, Vanguard’s total AUM has eclipsed the $3 trillion mark across more than 240 mutual funds. The foundation of Vanguard’s investment methodology is based around low-cost indexed mutual funds. Vanguard made several changes to the management overseeing this target-date series in early 2016. Day-to-day activities are now overseen William Coleman and Walter Nejman.
Glide Path Rationale: With approximately 50% equity exposure in the 2015 Target Retirement Fund, Vanguard’s target date suite is moderately aggressive in comparison to its peers (equity exposure ranges from 70% to 20% across the industry, with the average around45%). The allocation in this target date suite is managed until sevenyears after retirement, at which point the glide path becomes static with an allocation of 30% equity and 70% fixed income.
Composition of Funds: Each of the Vanguard Target Retirement Funds invests in a mix of the firm’s broadest proprietary index funds. 100% of the underlying funds are passively managed, predominantly across four index funds (Total Stock Market Index, Total International Stock Index, Total Bond Market II Index, and Total International Bond Index), and the series introduces an allocation to the Vanguard Inflation Protected Securities Index five years prior to the target retirement date. The broad underlying index funds provide exposure to more than 9.500 equity securities and more than 12,700 fixed income securities.
34 INTEGRITY. BALANCE. OBJECTIVITY.
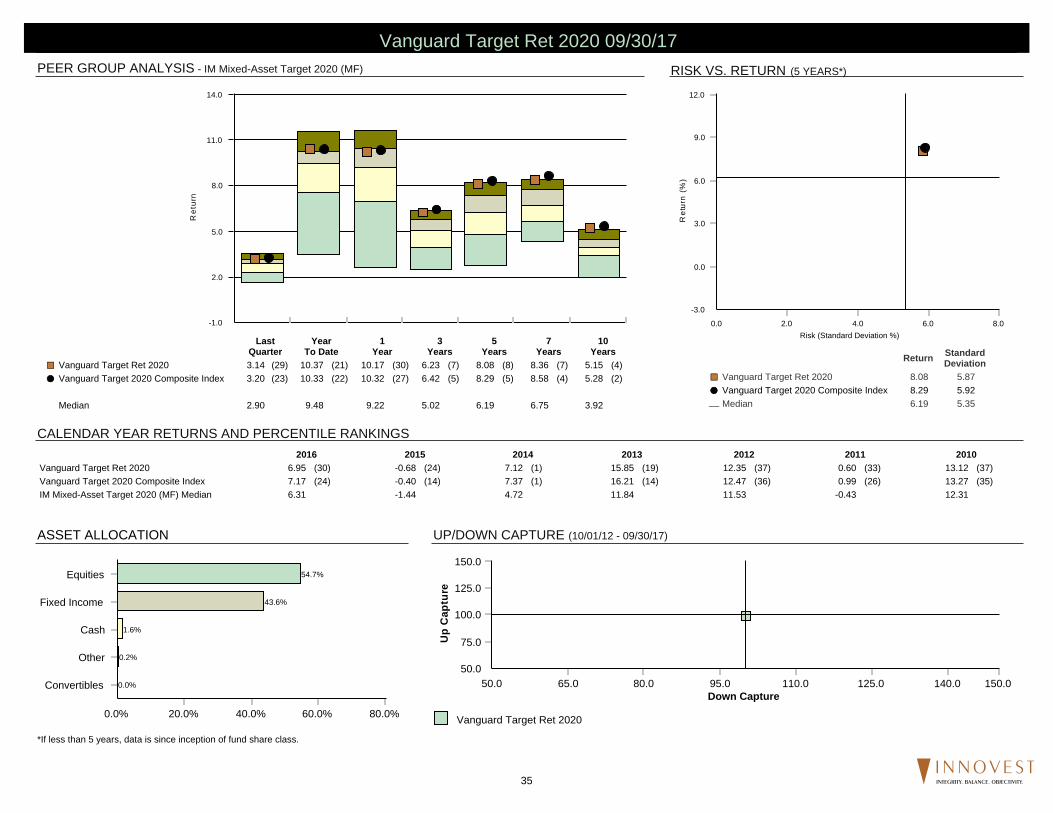
PEER GROUP ANALYSIS - IM Mixed-Asset Target 2020 (MF)
CALENDAR YEAR RETURNS AND PERCENTILE RANKINGS
RISK VS. RETURN (5 YEARS*)
ASSET ALLOCATION UP/DOWN CAPTURE (10/01/12 - 09/30/17)
*If less than 5 years, data is since inception of fund share class.
-1.0
2.0
5.0
8.0
11.0
14.0
Ret
urn
LastQuarter
YearTo Date
1Year
3Years
5Years
7Years
10Years
Vanguard Target Ret 2020 3.14 (29) 10.37 (21) 10.17 (30) 6.23 (7) 8.08 (8) 8.36 (7) 5.15 (4)¢£
Vanguard Target 2020 Composite Index 3.20 (23) 10.33 (22) 10.32 (27) 6.42 (5) 8.29 (5) 8.58 (4) 5.28 (2)��
Median 2.90 9.48 9.22 5.02 6.19 6.75 3.92
-3.0
0.0
3.0
6.0
9.0
12.0
Ret
urn
(%)
0.0 2.0 4.0 6.0 8.0Risk (Standard Deviation %)
ReturnStandardDeviation
Vanguard Target Ret 2020 8.08 5.87¢£
Vanguard Target 2020 Composite Index 8.29 5.92��
Median 6.19 5.35¾
2016 2015 2014 2013 2012 2011 2010
Vanguard Target Ret 2020 6.95 (30) -0.68 (24) 7.12 (1) 15.85 (19) 12.35 (37) 0.60 (33) 13.12 (37)Vanguard Target 2020 Composite Index 7.17 (24) -0.40 (14) 7.37 (1) 16.21 (14) 12.47 (36) 0.99 (26) 13.27 (35)IM Mixed-Asset Target 2020 (MF) Median 6.31 -1.44 4.72 11.84 11.53 -0.43 12.31
0.0% 20.0% 40.0% 60.0% 80.0%
Convertibles
Other
Cash
Fixed Income
Equities
0.0%
0.2%
1.6%
43.6%
54.7%
Vanguard Target Ret 2020
50.0
75.0
100.0
125.0
150.0
Up
Ca
ptu
re
50.0 65.0 80.0 95.0 110.0 125.0 140.0 150.0Down Capture
Vanguard Target Ret 2020 09/30/17
35 INTEGRITY. BALANCE. OBJECTIVITY.
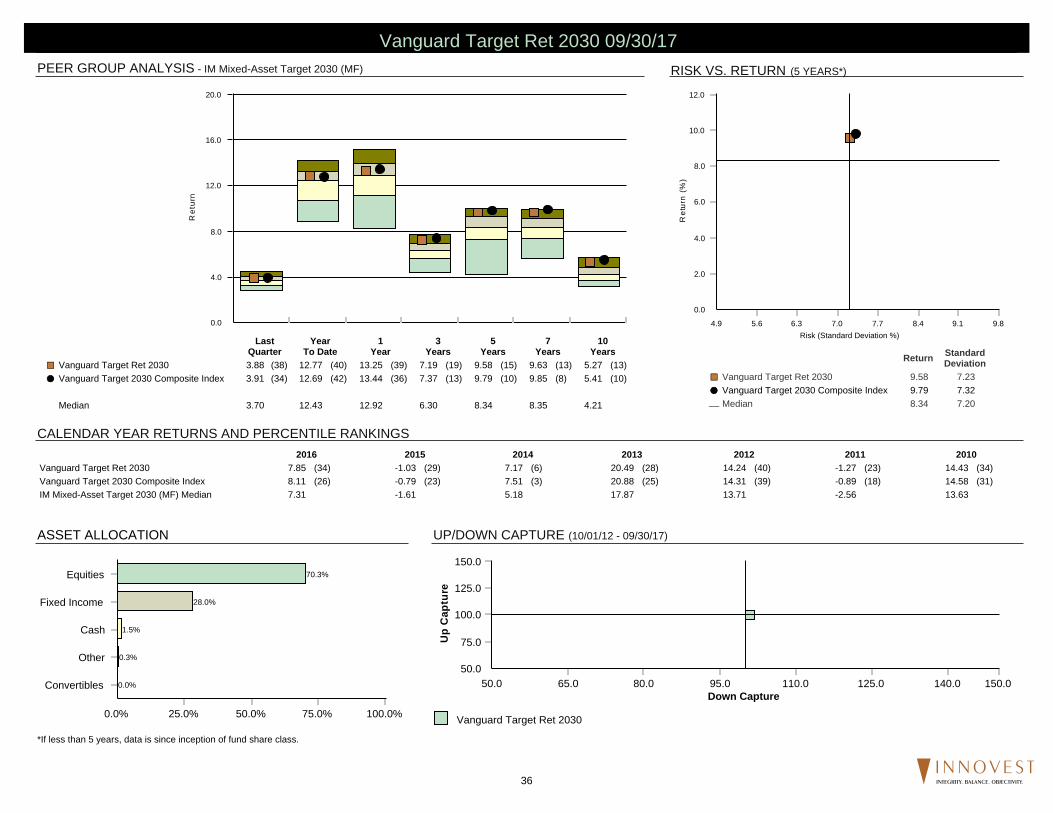
PEER GROUP ANALYSIS - IM Mixed-Asset Target 2030 (MF)
CALENDAR YEAR RETURNS AND PERCENTILE RANKINGS
RISK VS. RETURN (5 YEARS*)
ASSET ALLOCATION UP/DOWN CAPTURE (10/01/12 - 09/30/17)
*If less than 5 years, data is since inception of fund share class.
0.0
4.0
8.0
12.0
16.0
20.0
Ret
urn
LastQuarter
YearTo Date
1Year
3Years
5Years
7Years
10Years
Vanguard Target Ret 2030 3.88 (38) 12.77 (40) 13.25 (39) 7.19 (19) 9.58 (15) 9.63 (13) 5.27 (13)¢£
Vanguard Target 2030 Composite Index 3.91 (34) 12.69 (42) 13.44 (36) 7.37 (13) 9.79 (10) 9.85 (8) 5.41 (10)��
Median 3.70 12.43 12.92 6.30 8.34 8.35 4.21
0.0
2.0
4.0
6.0
8.0
10.0
12.0
Ret
urn
(%)
4.9 5.6 6.3 7.0 7.7 8.4 9.1 9.8Risk (Standard Deviation %)
ReturnStandardDeviation
Vanguard Target Ret 2030 9.58 7.23¢£
Vanguard Target 2030 Composite Index 9.79 7.32��
Median 8.34 7.20¾
2016 2015 2014 2013 2012 2011 2010
Vanguard Target Ret 2030 7.85 (34) -1.03 (29) 7.17 (6) 20.49 (28) 14.24 (40) -1.27 (23) 14.43 (34)Vanguard Target 2030 Composite Index 8.11 (26) -0.79 (23) 7.51 (3) 20.88 (25) 14.31 (39) -0.89 (18) 14.58 (31)IM Mixed-Asset Target 2030 (MF) Median 7.31 -1.61 5.18 17.87 13.71 -2.56 13.63
0.0% 25.0% 50.0% 75.0% 100.0%
Convertibles
Other
Cash
Fixed Income
Equities
0.0%
0.3%
1.5%
28.0%
70.3%
Vanguard Target Ret 2030
50.0
75.0
100.0
125.0
150.0
Up
Ca
ptu
re
50.0 65.0 80.0 95.0 110.0 125.0 140.0 150.0Down Capture
Vanguard Target Ret 2030 09/30/17
36 INTEGRITY. BALANCE. OBJECTIVITY.

PEER GROUP ANALYSIS - IM Mixed-Asset Target 2040 (MF)
CALENDAR YEAR RETURNS AND PERCENTILE RANKINGS
RISK VS. RETURN (5 YEARS*)
ASSET ALLOCATION UP/DOWN CAPTURE (10/01/12 - 09/30/17)
*If less than 5 years, data is since inception of fund share class.
0.0
5.0
10.0
15.0
20.0
25.0
Ret
urn
LastQuarter
YearTo Date
1Year
3Years
5Years
7Years
10Years
Vanguard Target Ret 2040 4.51 (31) 14.96 (32) 16.26 (31) 7.97 (24) 10.80 (11) 10.58 (12) 5.73 (12)¢£
Vanguard Target 2040 Composite Index 4.57 (27) 14.86 (34) 16.45 (28) 8.20 (15) 11.04 (7) 10.85 (6) 5.87 (10)��
Median 4.33 14.39 15.49 7.16 9.45 9.25 4.46
2.0
4.0
6.0
8.0
10.0
12.0
14.0
Ret
urn
(%)
6.0 6.6 7.2 7.8 8.4 9.0 9.6 10.2Risk (Standard Deviation %)
ReturnStandardDeviation
Vanguard Target Ret 2040 10.80 8.57¢£
Vanguard Target 2040 Composite Index 11.04 8.66��
Median 9.45 8.33¾
2016 2015 2014 2013 2012 2011 2010
Vanguard Target Ret 2040 8.73 (28) -1.59 (44) 7.15 (12) 24.37 (17) 15.56 (33) -2.55 (21) 15.17 (37)Vanguard Target 2040 Composite Index 8.98 (22) -1.25 (36) 7.61 (7) 24.79 (12) 15.58 (32) -2.11 (16) 15.33 (30)IM Mixed-Asset Target 2040 (MF) Median 7.98 -1.75 5.38 21.61 14.92 -3.93 14.63
0.0% 50.0% 100.0% 150.0%
Convertibles
Other
Cash
Fixed Income
Equities
0.0%
0.3%
1.4%
13.4%
84.9%
Vanguard Target Ret 2040
50.0
75.0
100.0
125.0
150.0
Up
Ca
ptu
re
50.0 65.0 80.0 95.0 110.0 125.0 140.0 150.0Down Capture
Vanguard Target Ret 2040 09/30/17
37 INTEGRITY. BALANCE. OBJECTIVITY.
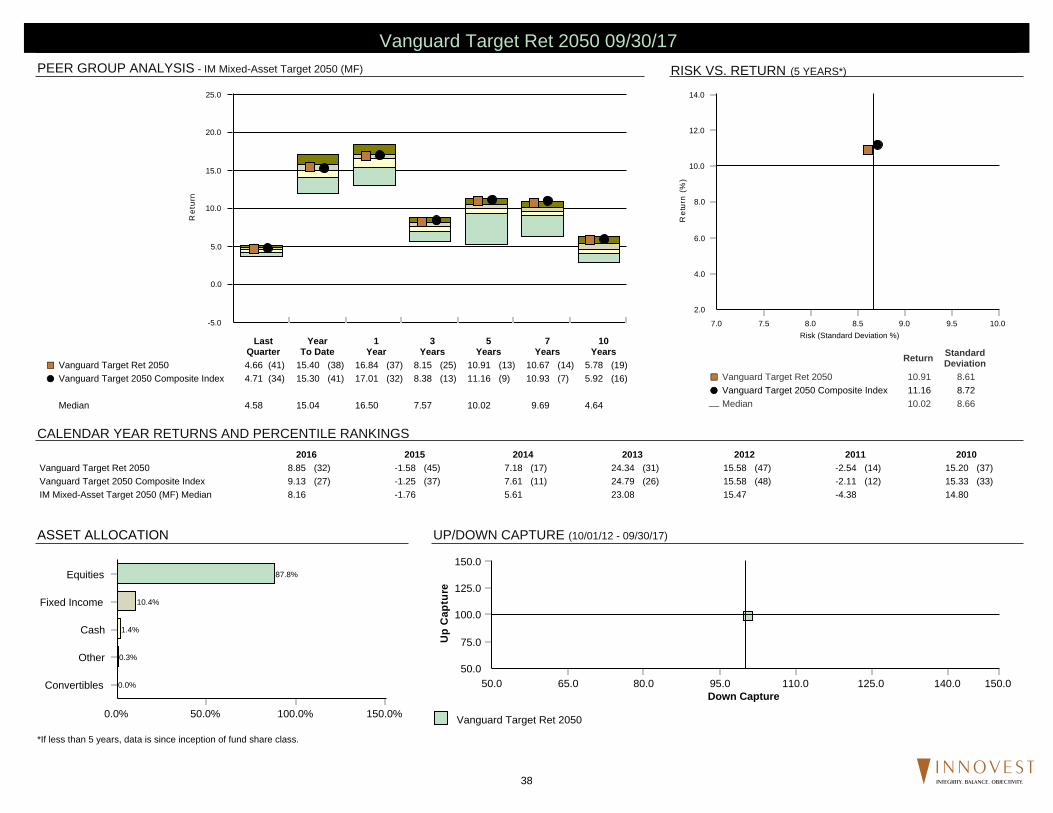
PEER GROUP ANALYSIS - IM Mixed-Asset Target 2050 (MF)
CALENDAR YEAR RETURNS AND PERCENTILE RANKINGS
RISK VS. RETURN (5 YEARS*)
ASSET ALLOCATION UP/DOWN CAPTURE (10/01/12 - 09/30/17)
*If less than 5 years, data is since inception of fund share class.
-5.0
0.0
5.0
10.0
15.0
20.0
25.0
Ret
urn
LastQuarter
YearTo Date
1Year
3Years
5Years
7Years
10Years
Vanguard Target Ret 2050 4.66 (41) 15.40 (38) 16.84 (37) 8.15 (25) 10.91 (13) 10.67 (14) 5.78 (19)¢£
Vanguard Target 2050 Composite Index 4.71 (34) 15.30 (41) 17.01 (32) 8.38 (13) 11.16 (9) 10.93 (7) 5.92 (16)��
Median 4.58 15.04 16.50 7.57 10.02 9.69 4.64
2.0
4.0
6.0
8.0
10.0
12.0
14.0
Ret
urn
(%)
7.0 7.5 8.0 8.5 9.0 9.5 10.0Risk (Standard Deviation %)
ReturnStandardDeviation
Vanguard Target Ret 2050 10.91 8.61¢£
Vanguard Target 2050 Composite Index 11.16 8.72��
Median 10.02 8.66¾
2016 2015 2014 2013 2012 2011 2010
Vanguard Target Ret 2050 8.85 (32) -1.58 (45) 7.18 (17) 24.34 (31) 15.58 (47) -2.54 (14) 15.20 (37)Vanguard Target 2050 Composite Index 9.13 (27) -1.25 (37) 7.61 (11) 24.79 (26) 15.58 (48) -2.11 (12) 15.33 (33)IM Mixed-Asset Target 2050 (MF) Median 8.16 -1.76 5.61 23.08 15.47 -4.38 14.80
0.0% 50.0% 100.0% 150.0%
Convertibles
Other
Cash
Fixed Income
Equities
0.0%
0.3%
1.4%
10.4%
87.8%
Vanguard Target Ret 2050
50.0
75.0
100.0
125.0
150.0
Up
Ca
ptu
re
50.0 65.0 80.0 95.0 110.0 125.0 140.0 150.0Down Capture
Vanguard Target Ret 2050 09/30/17
38 INTEGRITY. BALANCE. OBJECTIVITY.
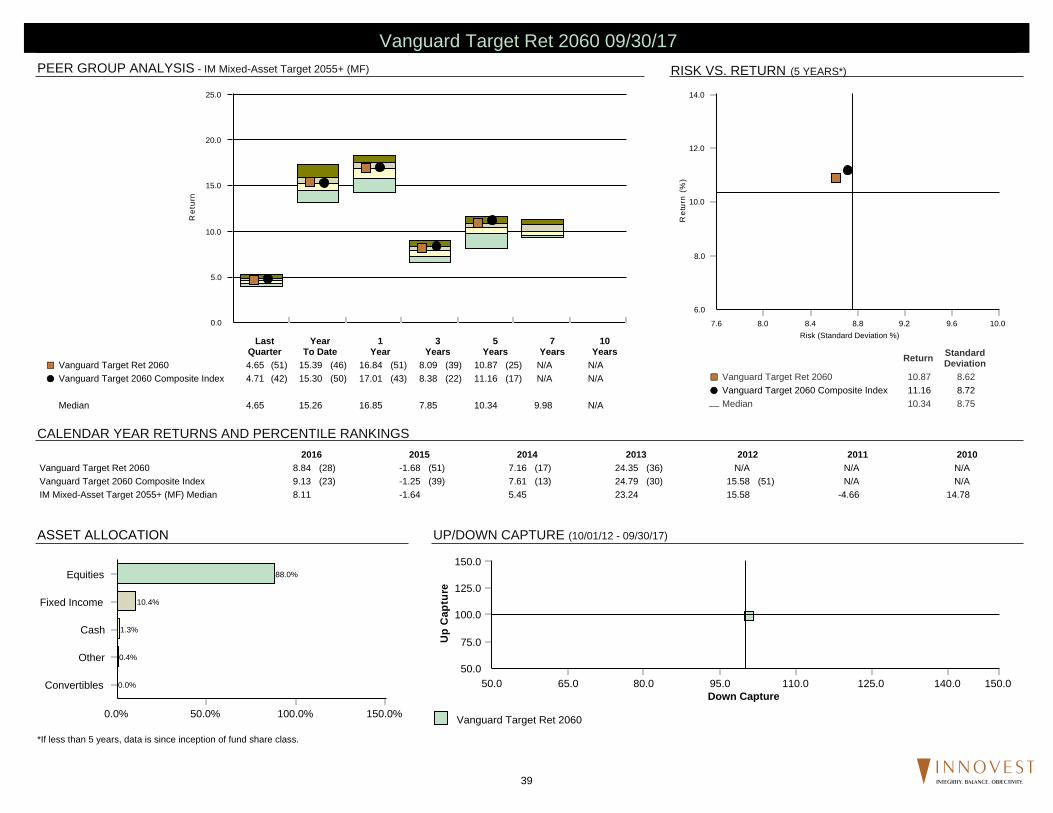
PEER GROUP ANALYSIS - IM Mixed-Asset Target 2055+ (MF)
CALENDAR YEAR RETURNS AND PERCENTILE RANKINGS
RISK VS. RETURN (5 YEARS*)
ASSET ALLOCATION UP/DOWN CAPTURE (10/01/12 - 09/30/17)
*If less than 5 years, data is since inception of fund share class.
0.0
5.0
10.0
15.0
20.0
25.0
Ret
urn
LastQuarter
YearTo Date
1Year
3Years
5Years
7Years
10Years
Vanguard Target Ret 2060 4.65 (51) 15.39 (46) 16.84 (51) 8.09 (39) 10.87 (25) N/A N/A¢£
Vanguard Target 2060 Composite Index 4.71 (42) 15.30 (50) 17.01 (43) 8.38 (22) 11.16 (17) N/A N/A��
Median 4.65 15.26 16.85 7.85 10.34 9.98 N/A
6.0
8.0
10.0
12.0
14.0
Ret
urn
(%)
7.6 8.0 8.4 8.8 9.2 9.6 10.0Risk (Standard Deviation %)
ReturnStandardDeviation
Vanguard Target Ret 2060 10.87 8.62¢£
Vanguard Target 2060 Composite Index 11.16 8.72��
Median 10.34 8.75¾
2016 2015 2014 2013 2012 2011 2010
Vanguard Target Ret 2060 8.84 (28) -1.68 (51) 7.16 (17) 24.35 (36) N/A N/A N/AVanguard Target 2060 Composite Index 9.13 (23) -1.25 (39) 7.61 (13) 24.79 (30) 15.58 (51) N/A N/AIM Mixed-Asset Target 2055+ (MF) Median 8.11 -1.64 5.45 23.24 15.58 -4.66 14.78
0.0% 50.0% 100.0% 150.0%
Convertibles
Other
Cash
Fixed Income
Equities
0.0%
0.4%
1.3%
10.4%
88.0%
Vanguard Target Ret 2060
50.0
75.0
100.0
125.0
150.0
Up
Ca
ptu
re
50.0 65.0 80.0 95.0 110.0 125.0 140.0 150.0Down Capture
Vanguard Target Ret 2060 09/30/17
39 INTEGRITY. BALANCE. OBJECTIVITY.
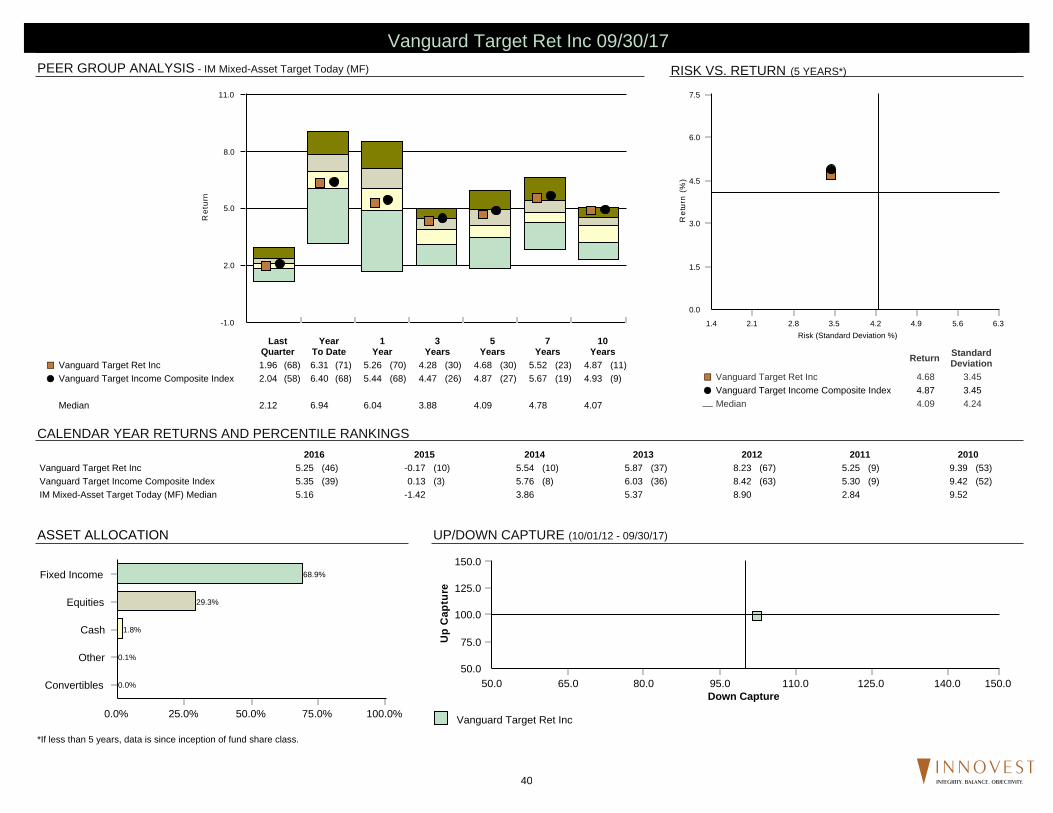
PEER GROUP ANALYSIS - IM Mixed-Asset Target Today (MF)
CALENDAR YEAR RETURNS AND PERCENTILE RANKINGS
RISK VS. RETURN (5 YEARS*)
ASSET ALLOCATION UP/DOWN CAPTURE (10/01/12 - 09/30/17)
*If less than 5 years, data is since inception of fund share class.
-1.0
2.0
5.0
8.0
11.0
Ret
urn
LastQuarter
YearTo Date
1Year
3Years
5Years
7Years
10Years
Vanguard Target Ret Inc 1.96 (68) 6.31 (71) 5.26 (70) 4.28 (30) 4.68 (30) 5.52 (23) 4.87 (11)¢£
Vanguard Target Income Composite Index 2.04 (58) 6.40 (68) 5.44 (68) 4.47 (26) 4.87 (27) 5.67 (19) 4.93 (9)��
Median 2.12 6.94 6.04 3.88 4.09 4.78 4.07
0.0
1.5
3.0
4.5
6.0
7.5
Ret
urn
(%)
1.4 2.1 2.8 3.5 4.2 4.9 5.6 6.3Risk (Standard Deviation %)
ReturnStandardDeviation
Vanguard Target Ret Inc 4.68 3.45¢£
Vanguard Target Income Composite Index 4.87 3.45��
Median 4.09 4.24¾
2016 2015 2014 2013 2012 2011 2010
Vanguard Target Ret Inc 5.25 (46) -0.17 (10) 5.54 (10) 5.87 (37) 8.23 (67) 5.25 (9) 9.39 (53)Vanguard Target Income Composite Index 5.35 (39) 0.13 (3) 5.76 (8) 6.03 (36) 8.42 (63) 5.30 (9) 9.42 (52)IM Mixed-Asset Target Today (MF) Median 5.16 -1.42 3.86 5.37 8.90 2.84 9.52
0.0% 25.0% 50.0% 75.0% 100.0%
Convertibles
Other
Cash
Equities
Fixed Income
0.0%
0.1%
1.8%
29.3%
68.9%
Vanguard Target Ret Inc
50.0
75.0
100.0
125.0
150.0
Up
Ca
ptu
re
50.0 65.0 80.0 95.0 110.0 125.0 140.0 150.0Down Capture
Vanguard Target Ret Inc 09/30/17
40 INTEGRITY. BALANCE. OBJECTIVITY.
Glossary
Active Share measures the percentage of a product’s holdings that differ from the product’s benchmark index, based on portfolio weightings. An Active Share of 60% or higher is generally considered to be active management and less than 20% is generally considered to be passive management. Active Share allows investors to distinguish between products that do and do not engage in a large amount of stock selection. Products with high Active Share may experience significant deviation from the performance of benchmarks over time.
Alpha measures a portfolio’s return in excess of the market return adjusted for risk. It is a measure of the manager’s contribution to performance with reference to security selection. A positive alpha indicates that a portfolio was positively rewarded for the residual risk that was taken for that level of market exposure.
Beta measures the sensitivity of rates of portfolio return to movements in the market. A portfolio’s beta measures the expected change in return per 1% change in the return on the market. If the beta of a portfolio is 1.5, a 1 percent increase in the return of the market will result, on average, in a 1.5 percent increase in the return on the portfolio. The converse would also be true.
Dividend Yield - The total amount of dividends paid out for a stock over the preceding twelve months divided by the closing price of a share of the common stock.
Down Capture Ratio - The Down Capture Ratio is a measure of the Investment’s compound return when the Benchmark was down divided by the Benchmark’s compound return when the Benchmark was down. The smaller the value, the better.
Duration - A time measure of a bond’s interest-rate sensitivity, based on the weighted average of the time periods over which a bond’s cash flows accrue to the bondholder.
Forecasted Long-Term Earnings Growth - This growth rate is a measure of a company’s expected long-term success in generating future year-over-year earnings growth. This growth rate is a market value weighted average of the consensus (mean) analysts’ long-term earnings growth rate forecast for each company in the portfolio. The definition of long-term varies by analyst but is limited to a 3-8 year range. This value is expressed as the expected average annual growth of earnings in percent.
Information Ratio measures the excess return per unit of residual “non market” risk in a portfolio. The ratio is equal to the Alpha divided by the Residual Risk.
Market Capitalization - The market value of a company’s outstanding shares of common stock at a specific point in time, computed as the product of the number of outstanding shares times the stock’s closing price per share.
P/E ratio relates the price of the stock to the per-share earnings of the company. A high P/E generally indicates that the market will pay more to obtain the company because it has confidence in the company’s ability to increase its earnings. Conversely, a low P/E indicates that the market has less confidence that the company’s earnings will increase, and therefore will not pay as much for its stock. In most cases a fund with a high average P/E ratio has paid a premium for stocks that have a high potential for increased earnings. If the fund’s average P/E ratio is low, the manager may believe that the stocks have an overlooked or undervalued potential for appreciation.
P/B ratio of a company relates the per-share market price of the company’s stock to its per -share book value, the historical accounting value of the company’s tangible assets. A high P/B ratio indicates that the price of the stock exceeds the actual worth of the company’s assets. A low P/B ratio would indicate that the stock is a bargain, priced below what the company’s assets could be worth if liquidated.
P/CF ratio compares the total market value of the portfolio to the portfolio’s share of the underlying stocks’ earnings (or book value, cash flow, sales or dividends).
R-Squared indicates the extent to which the variability of the portfolio returns is explained by market action. It can also be thought of as measuring the diversification relative to the appropriate benchmark. An R-Squared value of .75 indicates that 75% of the fluctuation in a portfolio return is explained by market action. An R-Squared of 1.0 indicates that a portfolio’s returns are entirely related to the market and it is not influenced by other factors. An R-Squared of zero indicates that no relationship exists between the portfolio’s return and the market.
Residual Risk is the unsystematic risk of a fund, or the portion of the total risk unique to the manager and not related to the overall market. This reflects the “bets” which the manager places in that particular asset class. These bets reflect emphasis in particular sectors, maturities (for bonds), or other issue specific factors which the manager considers a good investment opportunity. Diversification of the portfolio will reduce the residual risk of that portfolio.
Sharpe Ratio is a measure of risk-adjusted return. It is calculated by subtracting the risk -free return (90 day T-Bills) from the portfolio return and dividing the resulting “excess return” by the portfolio’s total risk level (standard deviation). The result is a measure of returned gained per unit of total risk taken.
Standard Deviation is a statistical measure of portfolio risk. It reflects the average deviation of observations from their sample mean. Stand ard Deviation is used as an estimate of risk since it measures how wide the range of returns typically is. The wider the typical range of returns, the higher the standard deviation of returns, and the higher the portfolio risk. If returns are normally distributed (i.e. as a bell shaped curve distribution) then approximately 66% of 2/3 of the returns would occur within plus or minus one standard deviation of the sample mean.
Style Exposure Chart indicates a portfolio’s exposure to a particular capitalization (large, medium or small) and style (value or growth). Based on Sharpe’s return based style analysis, a style map will attempt to correlate a manager to a particular style of investing (i.e. Large Cap Growth).
Turnover Ratio - This is a measure of the fund’s trading activity which is computed by taking the lesser of purchases or sales (excluding all securities with maturities of less than one year) and dividing by average monthly net assets.
Up Capture Ratio - The Up Capture Ratio is a measure of the Investment’s compound return when the Benchmark was up divided by the Benchmark’s co mpound return when the Benchmark was up. The greater the value, the better.
Down Capture Ratio - The Down Capture Ratio is a measure of the Investment’s compound return when the Benchmark was down divided by the Benchmark’s compound return when the Benchmark was down. The smaller the value, the better.
41 INTEGRITY. BALANCE. OBJECTIVITY.
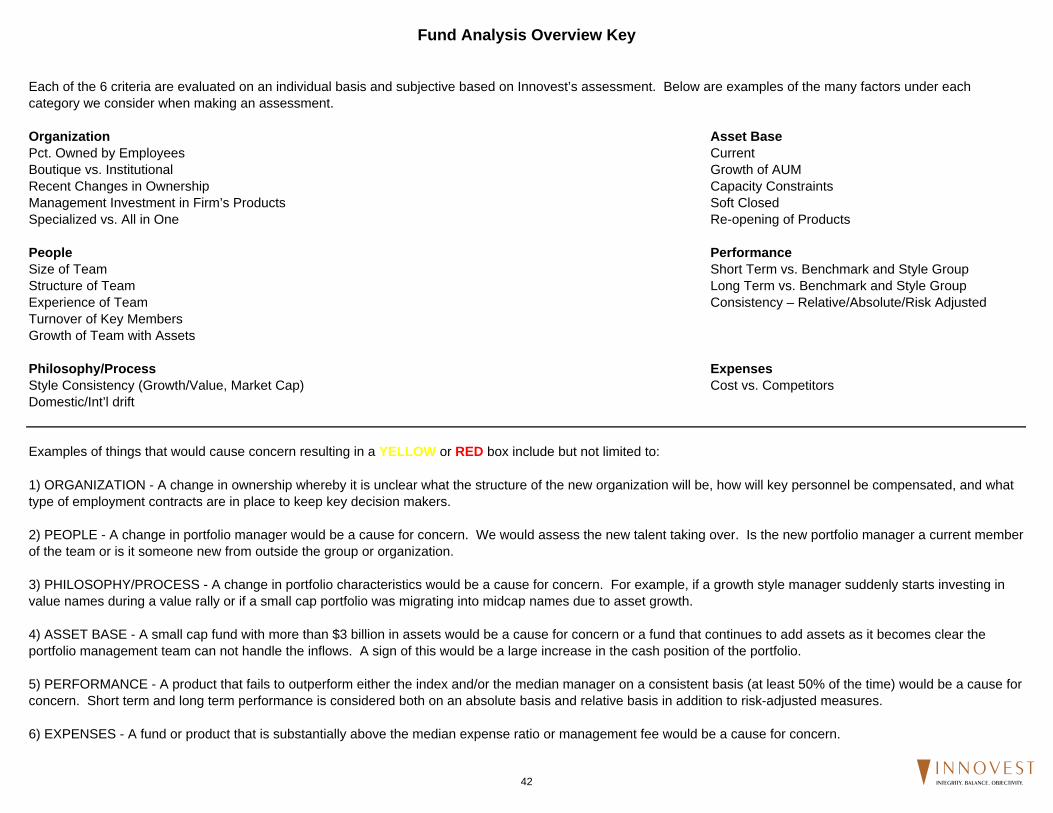
Organization Asset BasePct. Owned by Employees CurrentBoutique vs. Institutional Growth of AUMRecent Changes in Ownership Capacity ConstraintsManagement Investment in Firm’s Products Soft ClosedSpecialized vs. All in One Re-opening of Products
People PerformanceSize of Team Short Term vs. Benchmark and Style GroupStructure of Team Long Term vs. Benchmark and Style GroupExperience of Team Consistency – Relative/Absolute/Risk AdjustedTurnover of Key MembersGrowth of Team with Assets
Philosophy/Process ExpensesStyle Consistency (Growth/Value, Market Cap) Cost vs. CompetitorsDomestic/Int’l drift
Examples of things that would cause concern resulting in a YELLOW or RED box include but not limited to:
6) EXPENSES - A fund or product that is substantially above the median expense ratio or management fee would be a cause for concern.
Fund Analysis Overview Key
1) ORGANIZATION - A change in ownership whereby it is unclear what the structure of the new organization will be, how will key personnel be compensated, and what type of employment contracts are in place to keep key decision makers.
2) PEOPLE - A change in portfolio manager would be a cause for concern. We would assess the new talent taking over. Is the new portfolio manager a current member of the team or is it someone new from outside the group or organization.
3) PHILOSOPHY/PROCESS - A change in portfolio characteristics would be a cause for concern. For example, if a growth style manager suddenly starts investing in value names during a value rally or if a small cap portfolio was migrating into midcap names due to asset growth.
4) ASSET BASE - A small cap fund with more than $3 billion in assets would be a cause for concern or a fund that continues to add assets as it becomes clear the portfolio management team can not handle the inflows. A sign of this would be a large increase in the cash position of the portfolio.
5) PERFORMANCE - A product that fails to outperform either the index and/or the median manager on a consistent basis (at least 50% of the time) would be a cause for concern. Short term and long term performance is considered both on an absolute basis and relative basis in addition to risk-adjusted measures.
Each of the 6 criteria are evaluated on an individual basis and subjective based on Innovest’s assessment. Below are examples of the many factors under each category we consider when making an assessment.
42 INTEGRITY. BALANCE. OBJECTIVITY.
Disclaimer
Past performance is no guarantee of future results. Investing involves the risk of loss. The material herein has been prepared for informational purposes only and is not intended to provide, and should not be relied on for investment, tax, accounting, or legal advice. No representation is being made as to whether any investment product, strategy, or security is suitable or appropriate for an investor’s particular circumstances. Assumptions, opinions, and forecasts herein constitute our judgment and are subject to change without notice. Innovest is an independent Registered Investment Adviser registered with the Securities and Exchange Commission. This document may also contain returns and valuations from outside sources. While the information contained herein is believed to be true and accurate, Innovest assumes no responsibility for the accuracy of these valuations or return methodologies. The preceding statistical analysis was prepared by Innovest Portfolio Solutions LLC with data provided by Investment Metrics (IM), Lipper and Morningstar, Inc. All Rights Reserved. The investment products discussed are not insured by the FDIC and involve investment risk including the possible loss of all principal. Note: Actual client mutual fund returns are reflected on the table of returns page. Fund pages subsequent to the table of returns reflect the representative mutual fund with the longest track record and may not be the actual share class held by the client. Copyright 2017, Standard & Poor’s Financial Services LLC. Reproduction of S&P Index Services in any form is prohibited except with the prior written permission of S&P. S&P does not guarantee the accuracy, adequacy, completeness or availability of any information and is not responsible for any errors or omissions, regardless of the cause or for the results obtained from the use of such information. S&P DISCLAIMS ANY AND ALL EXPRESS OR IMPLIED WARRANTIES, INCLUDING, BUT NOT LIMITED TO, ANY WARRANTIES OF MERCHANTABILITY OR FITNESS FOR A PARTICULAR PURPOSE OR USE. In no event shall S&P be liable for any direct, indirect, special or consequential damages, costs, expenses, legal fees, or losses (including lost income or lost profit and opportunity costs) in connection with subscriber’s or others’ use of S&P Index Services (2017) Copyright MSCI 2017. Unpublished. All Rights Reserved. This information may only be used for your internal use, may not be reproduced or re-disseminated in any form and may not be used to create any financial instruments or products or any indices. This information is provided on an “as is” basis and the user of this information assumes the entire risk of any use it may make or permit to be made of this information. Neither MSCI, any or its affiliates or any other person involved in or related to compiling, computing or creating this information makes any express or implied warranties or representations with respect to such information or the results to be obtained by the use thereof, and MSCI, its affiliates and each such other person hereby expressly disclaim all warranties (including, without limitation, all warranties of originality, accuracy, completeness, timeliness, non-infringement, merchantability and fitness for a particular purpose) with respect to this information. Without limiting any of the foregoing, in no event shall MSCI, any of its affiliates or any other person involved in or related to compiling, computing or creating this information have any liability for any direct, indirect, special, incidental, punitive, consequential or any other damages (including, without limitation, lost profits) even if notified of, or if it might otherwise have anticipated, the possibility of such damages.
43 INTEGRITY. BALANCE. OBJECTIVITY.

What Can Squirrels
Teach Us A
bout Saving?They’re sm
art and adaptable, and they planD
arwin said that organism
s don’t need to be the sm
artest to survive, they need to be the most adaptable.
Gray squirrels are a double threat: they are both
smart and adaptable, equally at hom
e in the woods, a
backyard, or the city.
It turns out they also have a phenomenal ability to
change their behavior to survive, including finding, storing, and retrieving nuts. 1 This puts them
close to hum
ans’ ability to meet a long-dated future goal, such
as saving money.
Sizing
up
nu
ts… an
d in
vestmen
tsM
uch as we assess w
hich investments have the potential
to provide long-term grow
th or preserve capital, squirrels use their sharp peripheral vision to size up nuts to see w
hich ones are good to eat. Nuts that sprout use
up valuable nutrients. A savvy squirrel w
ill use its sharp teeth to cut off a nut’s sprouting m
echanism, thereby
preserving its food value for w
inter.
When evaluating an investm
ent for the future, such as a m
utual fund, you want to be sure that the strategy
it follows has the potential to deliver the results you
expect over many years, often decades. In a w
ay, you’re sizing up your ow
n nuts!
Looking at the fund’s past performance is an often-
useful way to evaluate returns, but it shouldn’t be
the sole factor. (Rem
ember, past perform
ance does not predict future returns.) In addition, look at the consistency of the fund’s returns over tim
e. How
did it do against its benchm
ark in a down m
arket? A fund that
consistently underperforms in a dow
n market is like a
sprouting nut. Consider avoiding it, or replacing it w
ith another option.
Do
n’t h
ide th
em all in
on
e spo
tA
ccording to researchers, fox squirrels move thousands
of nuts among five or m
ore locations to discourage pilfering by rival squirrels. 2
By avoiding losses, squirrels reduce risk. You do the sam
e thing when diversifying a portfolio. R
ather than putting all your “fund nuts” in one basket, you m
ay be able to lessen the risk of experiencing a large loss by spreading your investm
ents across multiple funds.
There’s less likelihood of all investments going dow
n in value at the sam
e time. 3
Investors diversify by including stocks, bonds, and cash in their portfolios. Stocks, w
hich represent shares of ow
nership in a company, usually perform
differently from
bonds or cash. Over long periods, stocks generally
have provided the greatest returns, but with the m
ost risk. C
orporate bonds, which are essentially loans to a
company, offer som
ewhat less return potential, but w
ith less risk than stocks. C
ash or “cash equivalents” typically are the least risky asset class, but also offer the least return.
Having the right balance of asset classes m
ay help you save m
ore for the future in a smart w
ay — just like our
crafty friends, the squirrels.
Fall 2017
1 N
atalie Angier, “N
ut? What N
ut? The Squirrel Outw
its to Survive,” New
York Times, July 5, 2010.
http://ww
w.nytim
es.com/2010/07/06/science/06angi.htm
l
2 “Fox squirrels show
long-term investm
ent savvy when hoarding nuts,” Berkeley N
ews, O
ctober 3,
2012. http://news.berkeley.edu/2012/10/03/squirrelnuts/
3 Diversification does not guarantee a profit or protect from
losses.

Pu
blish
ed
by In
no
ve
st Po
rtfolio
So
lutio
ns
4643 S. U
lster Stre
et, Su
ite 1
040 |
De
nve
r, CO
80237 |
303.6
94.1
900 |
ww
w.in
no
ve
stinc
.co
m
Some p
eople view
having $1 m
illion in the bank as
more valuab
le than having an incom
e of $5,000 per
month. H
owever, b
oth values are roughly eq
uivalent. This exam
ple illustrates w
hat behavioral researchers call
the illusion of wealth and
the illusion of poverty. 1
It seems that m
ost of us have been cond
itioned to
be attracted
to large num
bers, and
in fact, having a
$1 million w
ar chest at our fingertip
s may b
e very ap
pealing
. But consider how
the illusion of wealth m
ay skew
your judg
ment. M
any financial planners use a rule
of thumb
not to withd
raw m
ore than 4% a year from
your retirem
ent account. Historic research has show
n the risk of that w
ithdraw
al rate dep
leting the account
as very remote. But a 4%
annual withd
rawal rate taken
from a $1 m
illion nest egg
is just $40,000 — not
chump
change, b
ut not likely to fund a lavish lifestyle,
either.
On the other hand
, the option to take $5,000 a m
onth from
an investment account m
ay app
ear to suffer from
the illusion of poverty, at least w
hen comp
aring it to
the $1 million lum
p sum
. But here, again, p
erspective
matters. It turns out that a $5,000 p
er month incom
e is roug
hly equivalent to a $1 m
illion nest egg
that’s annuitized
(that is, converting it to a contract that
provid
es a stream of fixed
monthly p
ayments for a
defined
period
). 2
When w
e examine our assum
ptions ab
out money,
it helps to consid
er the filters we use to m
ake com
parisons. Som
etimes, illusions of w
ealth and p
overty play a sub
liminal role.
Wo
uld Yo
u Rather H
ave $1 Millio
n or $5,000 a
Mo
nth to R
etire?C
hoo
sing b
etween these values is all ab
out yo
ur persp
ective
1 “ Would You R
ather Have $1 M
illion or $5,000 Monthly in R
etirement?” W
all Street Journal, March
27, 2017. https://ww
w.w
sj.com/articles/w
ould-you-rather-have-
1-million-or-5-000-m
onthly-in-retirement-1490582208
2 A
nnuities are long-term, tax-deferred vehicles designed for retirem
ent. There are costs and
limitations associated w
ith this product and guarantees are based on the claims paying ability of
Pu
blish
ed
by In
no
ve
st Po
rtfolio
So
lutio
ns
4643 S. U
lster Stre
et, Su
ite 1
040 |
De
nve
r, CO
80237 |
303.6
94.1
900 |
ww
w.in
no
ve
stinc
.co
m
Wh
om
do
I call for h
elp?
Co
ntact TIA
A-C
REF fo
r the
follo
win
g:
> Balances
> Investm
ent changes>
Change personal info
800.842.2009w
ww
.tiaa-cref.org
The P
lan’s In
vestmen
t Co
nsu
ltant
Innovest Portfolio Solutions
4643 S. Ulster St., Suite 1040 D
enver, CO
80237
303.694.1900 | ww
w.innovestinc.com

The pie chart and accompanying data show
n for each portfolio illustrates the percentage allocated to each fund.
How
is the portfolio diversified?
Investment perform
ance results shown above represent past perform
ance and are not indicative of future results. Please read the
information contained in the applicable fund prospectuses carefully before investing m
oney.
Past P
erformance
Current A
ge:The age (today) of an average investor with tim
e horizon, risk level, and return expectations of the Conservative P
ortfolio.
Time H
orizon: Indicates the number of years (tim
e horizon) to the average retirement age of 65, w
hen the investor will begin spending the
money in their account, and the num
ber of years to assumed life expectancy of age 85.
Risk Level:The am
ount of expected risk in the Conservative P
ortfolio. Risk is m
easured by the potential loss over a 12-month period that
an investor might expect in the C
onservative Portfolio, and is calculated via a statistical process consistent w
ith 95% probability.
Low:-8%
to-14%
Expected R
eturn:The level of expected investment return from
the Conservative P
ortfolio. The range of returns shown below
indicatesthe potential gain that an investor m
ight expect each year, on average, over a 5-year period. This is also referred to as the "mean" return,
and is calculated using a statistical process to determine a range of probabilities.
Low:4%
to6%
Who typically uses this portfolio?
Understanding Y
our Professionally-M
anaged Portfolios
Portfolio A
llocation (%)
Who typically uses this portfolio?
Current A
ge:over 60
Risk Level:
Low
Expected R
eturn:Low
Time H
orizon:
Years to A
ge 65:under 5
Years to A
ge 85:under 25
Expense R
atio (%) 0.26
Past P
erformance (%
)*
Septem
ber 30, 2017 : $100D
odge & C
ox Stock (D
OD
GX
)7.0
¢£
Vanguard 500 Index;A
dm (V
FIAX
)7.0
¢£
Harbor:C
ap Apprec;Inst (H
AC
AX
)7.0
¢£
Vanguard M
d-Cp Idx;A
dm (V
IMA
X)
4.5¢£
Vanguard S
m-C
p Idx;Adm
(VS
MA
X)
4.5¢£
Am
Beacon:Intl E
q;Inst (AA
IEX
)6.5
¢£
Am
erican Funds EuP
c;R6 (R
ER
GX
)6.5
¢£
Met W
est:Total Return;I (M
WTIX
)19.0
¢£
Vanguard Tot B
d;Adm
(VB
TLX)
19.0¢£
TIAA
Traditional19.0
¢£
LastQ
uarterY
TD1
Year
3Y
ears5
Years
10Y
earsLittleton P
ublic School C
onservative2.85
9.249.14
5.757.06
N/A
Littleton Public S
chool Conservative
09/30/17
*Innovest relies on 3rd party data for these returns.
**Returns using TIA
A Traditional A
nnuity - GR
A contract
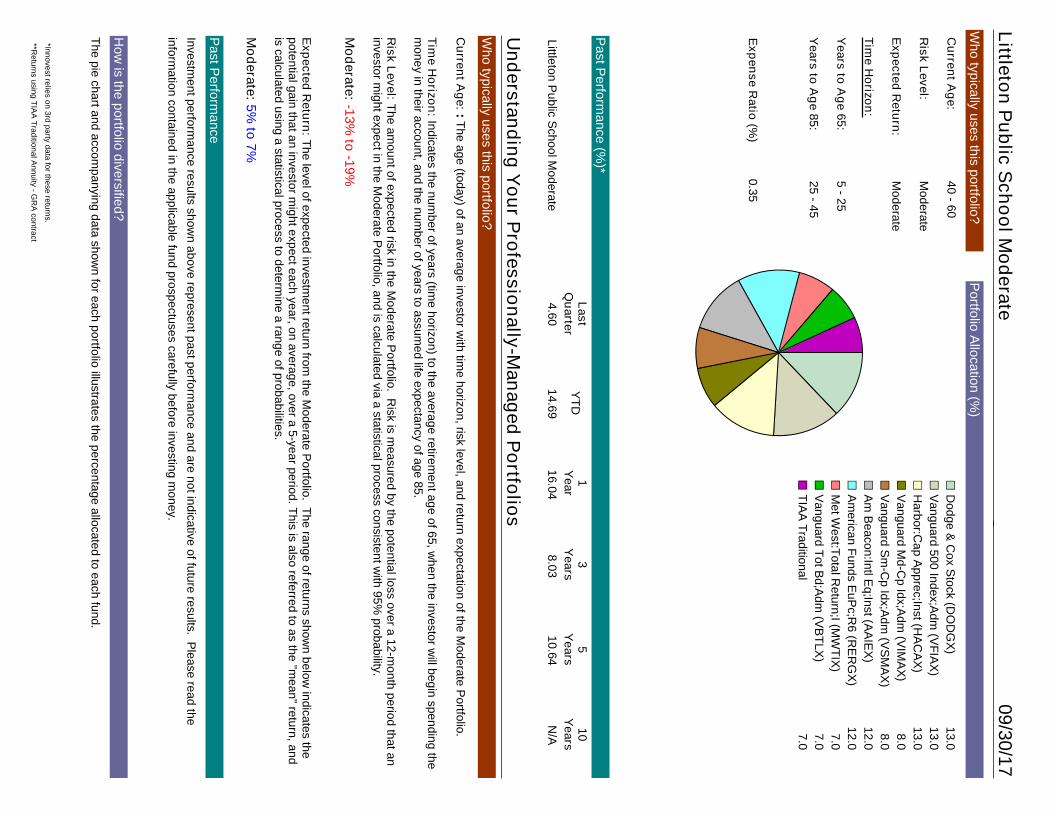
The pie chart and accompanying data show
n for each portfolio illustrates the percentage allocated to each fund.
How
is the portfolio diversified?
Investment perform
ance results shown above represent past perform
ance and are not indicative of future results. Please read the
information contained in the applicable fund prospectuses carefully before investing m
oney.
Past P
erformance
Current A
ge:: The age (today) of an average investor w
ith time horizon, risk level, and return expectation of the M
oderate Portfolio.
Time H
orizon: Indicates the number of years (tim
e horizon) to the average retirement age of 65, w
hen the investor will begin spending the
money in their account, and the num
ber of years to assumed life expectancy of age 85.
Risk Level:The am
ount of expected risk in the Moderate P
ortfolio. Risk is m
easured by the potential loss over a 12-month period that an
investor might expect in the M
oderate Portfolio, and is calculated via a statistical process consistent w
ith 95% probability.
Moderate:-13%
to -19%
Expected R
eturn: The level of expected investment return from
the Moderate P
ortfolio. The range of returns shown below
indicates thepotential gain that an investor m
ight expect each year, on average, over a 5-year period. This is also referred to as the "mean" return, and
is calculated using a statistical process to determine a range of probabilities.
Moderate:5%
to 7%
Who typically uses this portfolio?
Understanding Y
our Professionally-M
anaged Portfolios
Portfolio A
llocation (%)
Who typically uses this portfolio?
Current A
ge:40
- 60
Risk Level:
Moderate
Expected R
eturn:M
oderate
Time H
orizon:
Years to A
ge 65:5 - 25
Years to A
ge 85:25 - 45
Past P
erformance (%
)*
Expense R
atio (%) 0.35
Septem
ber 30, 2017 : $100D
odge & C
ox Stock (D
OD
GX
)13.0
¢£
Vanguard 500 Index;A
dm (V
FIAX
)13.0
¢£
Harbor:C
ap Apprec;Inst (H
AC
AX
)13.0
¢£
Vanguard M
d-Cp Idx;A
dm (V
IMA
X)
8.0¢£
Vanguard S
m-C
p Idx;Adm
(VS
MA
X)
8.0¢£
Am
Beacon:Intl E
q;Inst (AA
IEX
)12.0
¢£
Am
erican Funds EuP
c;R6 (R
ER
GX
)12.0
¢£
Met W
est:Total Return;I (M
WTIX
)7.0
¢£
Vanguard Tot B
d;Adm
(VB
TLX)
7.0¢£
TIAA
Traditional7.0
¢£
LastQ
uarterY
TD1
Year
3Y
ears5
Years
10Y
earsLittleton P
ublic School M
oderate4.60
14.6916.04
8.0310.64
N/A
Littleton Public S
chool Moderate
09/30/17
*Innovest relies on 3rd party data for these returns.
**Returns using TIA
A Traditional A
nnuity - GR
A contract
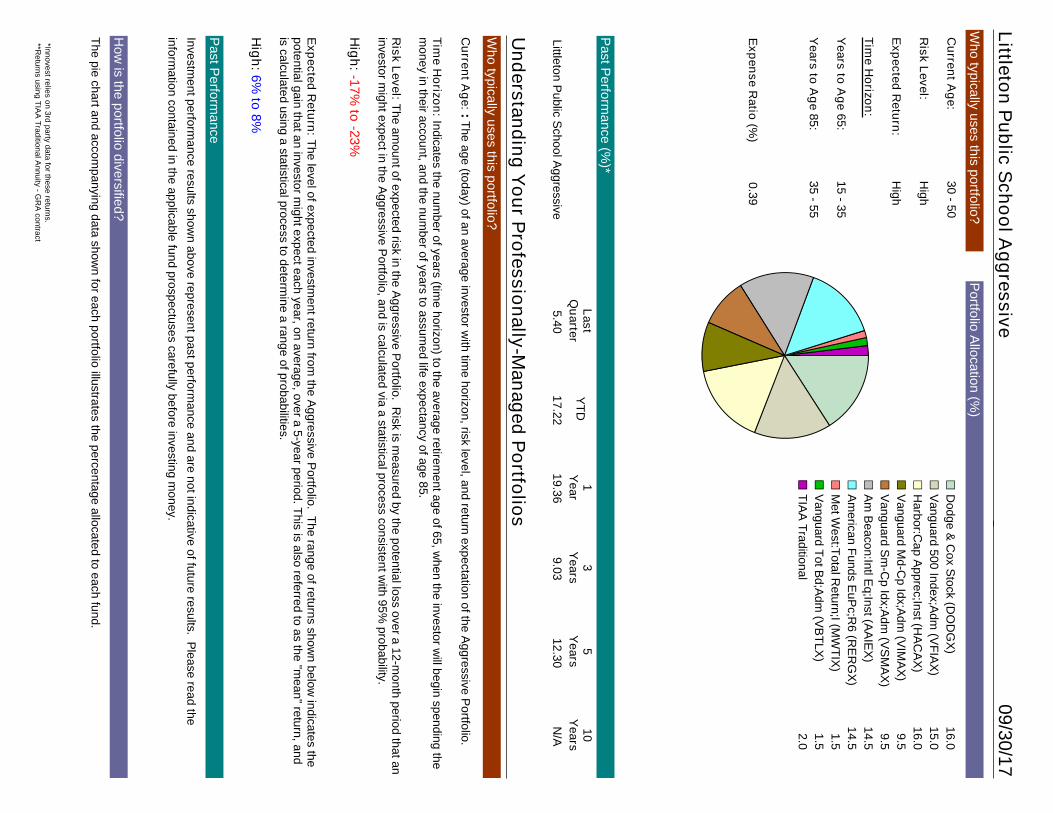
The pie chart and accompanying data show
n for each portfolio illustrates the percentage allocated to each fund.
How
is the portfolio diversified?
Investment perform
ance results shown above represent past perform
ance and are not indicative of future results. Please read the
information contained in the applicable fund prospectuses carefully before investing m
oney.
Past P
erformance
Current A
ge:: The age (today) of an average investor w
ith time horizon, risk level, and return expectation of the A
ggressive Portfolio.
Time H
orizon: Indicates the number of years (tim
e horizon) to the average retirement age of 65, w
hen the investor will begin spending the
money in their account, and the num
ber of years to assumed life expectancy of age 85.
Risk Level:The am
ount of expected risk in the Aggressive P
ortfolio. Risk is m
easured by the potential loss over a 12-month period that an
investor might expect in the A
ggressive Portfolio, and is calculated via a statistical process consistent w
ith 95% probability.
High:-17%
to -23%
Expected R
eturn: The level of expected investment return from
the Aggressive P
ortfolio. The range of returns shown below
indicates thepotential gain that an investor m
ight expect each year, on average, over a 5-year period. This is also referred to as the "mean" return, and
is calculated using a statistical process to determine a range of probabilities.
High:6%
to 8%
Who typically uses this portfolio?
Understanding Y
our Professionally-M
anaged Portfolios
Portfolio A
llocation (%)
Who typically uses this portfolio?
Current A
ge:30
- 50
Risk Level:
High
Expected R
eturn:H
igh
Time H
orizon:
Years to A
ge 65:15 - 35
Years to A
ge 85:35 - 55
Past P
erformance (%
)*
Expense R
atio (%) 0.39
Septem
ber 30, 2017 : $100D
odge & C
ox Stock (D
OD
GX
)16.0
¢£
Vanguard 500 Index;A
dm (V
FIAX
)15.0
¢£
Harbor:C
ap Apprec;Inst (H
AC
AX
)16.0
¢£
Vanguard M
d-Cp Idx;A
dm (V
IMA
X)
9.5¢£
Vanguard S
m-C
p Idx;Adm
(VS
MA
X)
9.5¢£
Am
Beacon:Intl E
q;Inst (AA
IEX
)14.5
¢£
Am
erican Funds EuP
c;R6 (R
ER
GX
)14.5
¢£
Met W
est:Total Return;I (M
WTIX
)1.5
¢£
Vanguard Tot B
d;Adm
(VB
TLX)
1.5¢£
TIAA
Traditional2.0
¢£
LastQ
uarterY
TD1
Year
3Y
ears5
Years
10Y
earsLittleton P
ublic School A
ggressive5.40
17.2219.36
9.0312.30
N/A
Littleton Public S
chool Aggressive
09/30/17
*Innovest relies on 3rd party data for these returns.**R
eturns using TIAA
Traditional Annuity - G
RA
contract