Embed Size (px)
Citation preview

3Q21 Results 29 October 2021
2
The purpose of this presentation is purely informative and should not be considered as a service or offer of any
financ ial product, service or advice, nor should it be interpreted as, an offer to sell or exchange or acquire, or an
invitation for offers to buy securities issued by CaixaBank, S.A. (“CaixaBank”) or any of the companies mentioned
herein. The information contained herein is subject to, and must be read in conjunction with , all other public ly
available information. Any person at any time acquiring securities must do so only on the basis of such person’s
own judgment as to the merits or the suitability of the securities for its purpose and only on such information as is
contained in such public information set out in the relevant documentation filed by the issuer in the context of such
specific offer or issue and after tak ing any professional or any other advice as it deems necessary or appropriate
under the relevant circumstances and not in reliance on the information contained in this presentation.
CaixaBank cautions that this presentation might contain forward-look ing statements concerning the development of
our business and economic performance. Particu larly , the financial information from CaixaBank Group related to
results from investments has been prepared mainly based on estimates. While these statements are based on our
current projections, judgments and future expectations concerning the development of our business, a number of
risks, uncertainties and other important factors could cause actual developments and results to differ materially from
our expectations. Such factors include, but are not limited to, the market general situation, macroeconomic factors,
regulatory, political or government guidelines and trends, movements in domestic and international securities
markets, currency exchange rates and interest rates, changes in the financial position, creditworth iness or solvency
of our customers, debtors or counterparts, etc . These risk factor s, together with any other ones mentioned in past or
future reports, could adversely affect our business and the levels of performance and results described. Other
unknown or unforeseeable factors, and those whose evolution and potential impact remain uncertain , could also
make the results or outcome differ significantly from those described in our projections and estimates.
In particular, this presentation may contain references, including certain forward-looking statements, to potential
benefits identified and made public when formulating the joint merger plan for the merger of Bankia, S.A.
(absorbed company) into CaixaBank (absorbing company) announced on 18 September 2020, however, CaixaBank
cannot guaranty that those benefits will materialise in the terms as provided, nor that the Group will not be
exposed to difficu lties, additional expenditures and risks associated with the integration after the merger having
become effective on March 26, 2021.
Statements as to historical performance, h istor ical share price or financial accretion are not intended to mean that
future performance, future share price or future earnings for any period will necessarily match or exceed those of
any prior year. Nothing in th is presentation should be construed as a profit forecast. In addition, it should be noted
that although this presentation has been prepared based on accounting registers kept by CaixaBank and by the rest
of the Group companies it may contain certain adjustments and reclassifications in order to harmonise the
accounting princ iples and criteria followed by such companies with those followed by CaixaBank, as in the specif ic
case of Banco Português de Investimento (“BPI”), so that, the relevant data included in this presentation may differ
from those included in the relevant f inancial information as published by BPI. Likewise, in relation to the historical
information on Bankia and that referring to the evolution of Bankia and/or the rest of the Group contained in this
presentation, it must be taken into account that it has undergone certain adjustments and reclassifications in order
to adapt it to CaixaBank Group's presentation criteria.
In the same way, and in order to show the recurring evolution of the results of the new entity resulting from the
merger, a proforma income statement has been prepared by adding, to the CaixaBank Group’s results, Bankia’s
results in the first quarter of 2021 as well as in the entire financial year 2020. Likewise, extraordinary impacts
associated with the integration of Bankia have been excluded from the result.
In particu lar , regarding the data provided by third parties, neither CaixaBank, nor any of its administr ators, directors
or employees, either explic itly or implicitly, guarantees that these contents are exact, accurate, comprehensive or
complete, nor are they obliged to keep them updated, nor to correct them in the case that any deficiency, error or
omission were to be detected. Moreover, in reproducing these contents in by any means, CaixaBank may introduce
any changes it deems suitable, may omit partially or completely any of the elements of th is presentation, and in
case of any deviation between such a version and this one , CaixaBank assumes no liability for any discrepancy. This
statement must be taken into account by all those persons or entities that may have to make decisions or prepare
or disseminate opinions regarding securities issued by CaixaBank and, in particular, by analysts and investors who
handle this document. All of them are encouraged to consult the documentation and public information
communicated or registered by CaixaBank with the National Securities Market Commission (Comisión Nacional del
Mercado de Valores, “CNMV”). In particular, it should be noted that this document contains unaudited financial
information.
In relation to Alternative Performance Measures (APMs) as defined in the guidelines on Alternative Performance
Measures issued by the European Securities and Markets Authority on 30 June 2015 (ESMA/2015/1057), this
presentation uses certain APMs, which have not been audited, for a better understanding of the company's f inancial
performance. These measures are considered additional disc losures and in no case replace the financial information
prepared under the International Financial Reporting Standards (IFRS). Moreover, the way the Group defines and
calculates these measures may differ to the way similar measures are calculated by other companies. Accordingly,
they may not be comparable. Please refer to the Glossary section of the relevant CaixaBank’s Business Activ ity and
Results Report for a list of the APMs used along with the relevant reconciliation between certain indicators.
This presentation has not been submitted to the CNMV or to any other authority in any other jurisdiction for review
or for approval. Its content is regulated by the Spanish law applicable at the date hereto, and it is not addressed to
any person or any legal entity located in any other jurisdiction and therefore it may not be compliant with the
relevant regulations or legal requirements as applicable in any such other jurisdiction.
Notwithstanding any legal requirements, or any limitations imposed by CaixaBank which may be applicable,
permission is hereby expressly refused for any type of use or exploitation of the content of th is presentation, and for
any use of the signs, trademarks and logotypes contained herein. This prohibition extends to any kind of
reproduction, distribution, transmission to third parties, public communication or conversion by any other mean, for
commercial purposes, without the previous express consent of CaixaBank and/or other respective proprietary title
holders. Any failure to observe this restriction may constitute as sanctionable offense under the current legislation.
Presentation prepared with Group data at closing of 30 September 2021, unless otherwise noted.
From an accounting point of view, BKIA consolidates from 31 March 2021, incorporating assets and liabilities from BKIA at fair value on that date. The results from BKIA are included from 2Q21; in 1Q do not contribute to consolidated net income in
the quarter. BKIA P&L figures are presented based on CaixaBank reporting criteria, restating those from 2020.
Disclaimer

3
II. 3Q21 P&L and Balance Sheet
CONTENTS
I.Highlights
4
HIGHLIGHTS
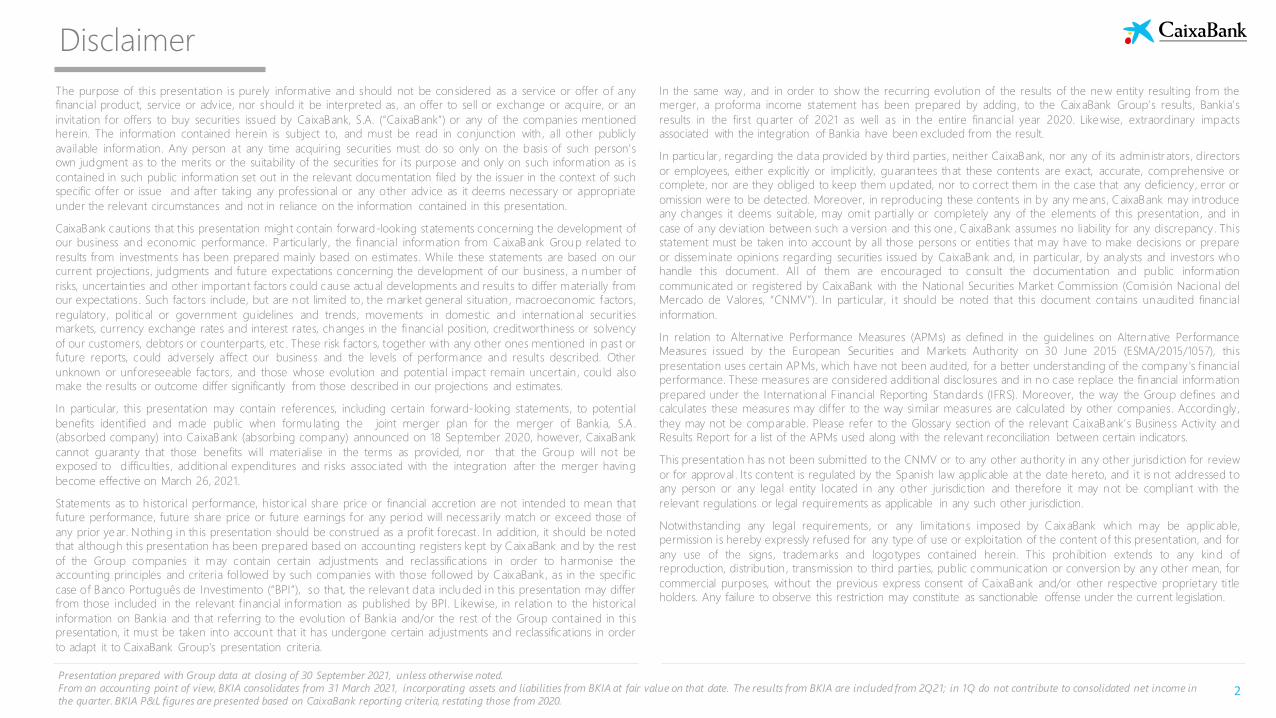
Adj. net income of €2,022M up 178% yoy on lower cost of risk
(1) Annual cost synergies pre-tax. (2) Mutual funds, pension plans and saving insurance funds. % ytd organic (excluding BKIA contribution at merger). (3) In Spain, including new MyBox premia in life-risk and non-life. (4) 9M21 PF including
Q1 of BKIA vs. 9M20 PF including BKIA. (5) PF CoR ttm including BKIA on a 12-month basis. Reported CoR ttm of 25 bps. (6) Solvency ratios include accrual of 50% pay-out over consolidated net income adjusted to exclude M&A impacts.
% CET1 including IFRS9 TA at 13.0%. (7) Including accrual of dividend and AT1 coupons. +147 bps excluding them. (8) Attributed net income adjusted excludes impact from badwill (€4,300M pre/post tax in 1Q), extraordinary in tegration
costs (-€28M in 1Q, -€1,351M in 2Q and -€35M in 3Q, all post-tax) and M&A one-offs in other P&L lines (-€18M in 2Q and -€89M in 3Q, post-tax). Reported net income of €4,801M in 9M21 and €620M in 3Q21.
€2,022M | €744M 9M21 | 3Q21 Adj. net income(8)
Strong capital structure further reinforced–With strong organic generation ytd (+88 bps)(7)
% CET1 ex IFRS9 TA(6) 12.7% +20 bps qoq
25.6% +47 bps qoq% MREL(6)
CoR keeps trending down with credit metrics stable–FY21 CoR guidance improved by 10 bps to <30 bps
0.30% -11 bps qoq
3.6% Stable qoq
% PF CoR ttm(5)
% NPL
Strong momentum in long-term savings continues–MyBox drives growth of protection insurance +140% 9M yoy
L/T SAVINGS(2) +8.9% ytd
NEW MYBOX
PREMIA(3)
Integration proceeding at full speed–Personnel departures and associated cost-savings begin in Q4
o/w in 2022E ~€755 M
TOTAL COST SYNERGIES(1) 2023E ~€940 M
Core revenues stable despite NII headwinds–Insurance and fees grow strongly +5.9% yoy
9M CORE REV.(4) Stable yoy
9M NON-NII
CORE REV.(4)
5
HIGHLIGHTS
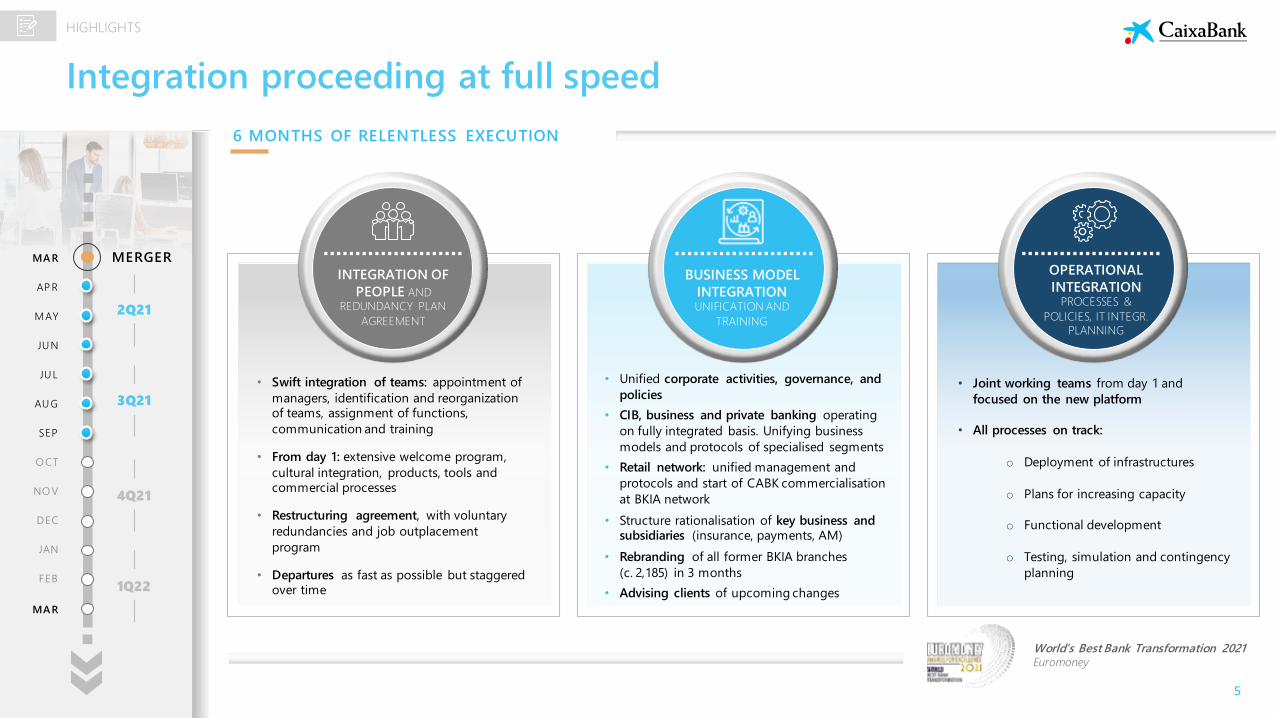
Integration proceeding at full speed
6 MONTHS OF RELENTLESS EXECUTION
INTEGRATION OF
PEOPLE AND
REDUNDANCY PLAN
AGREEMENT
BUSINESS MODEL
INTEGRATION UNIFICATION AND
TRAINING
OPERATIONAL
INTEGRATION PROCESSES &
POLICIES, IT INTEGR.
PLANNING
• Swift integration of teams: appointment of
managers, identification and reorganization of teams, assignment of functions,
communication and training
• From day 1: extensive welcome program,
cultural integration, products, tools and commercial processes
• Restructuring agreement, with voluntary
redundancies and job outplacement
program
• Departures as fast as possible but staggered over time
• Unified corporate activities, governance, and
policies
• CIB, business and private banking operating
on fully integrated basis. Unifying business
models and protocols of specialised segments
• Retail network: unified management and
protocols and start of CABK commercialisation
at BKIA network
• Structure rationalisation of key business and subsidiaries (insurance, payments, AM)
• Rebranding of all former BKIA branches
(c. 2,185) in 3 months
• Advising clients of upcoming changes
• Joint working teams from day 1 and
focused on the new platform
• All processes on track:
o Deployment of infrastructures
o Plans for increasing capacity
o Functional development
o Testing, simulation and contingency
planning
World’s Best Bank Transformation 2021Euromoney
MERGER
AP R
MAY
JUN
JUL
AUG
SEP
MAR
O CT
NO V
DEC
JAN
FEB
MAR
2Q21
3Q21
4Q21
1Q22
6
HIGHLIGHTS
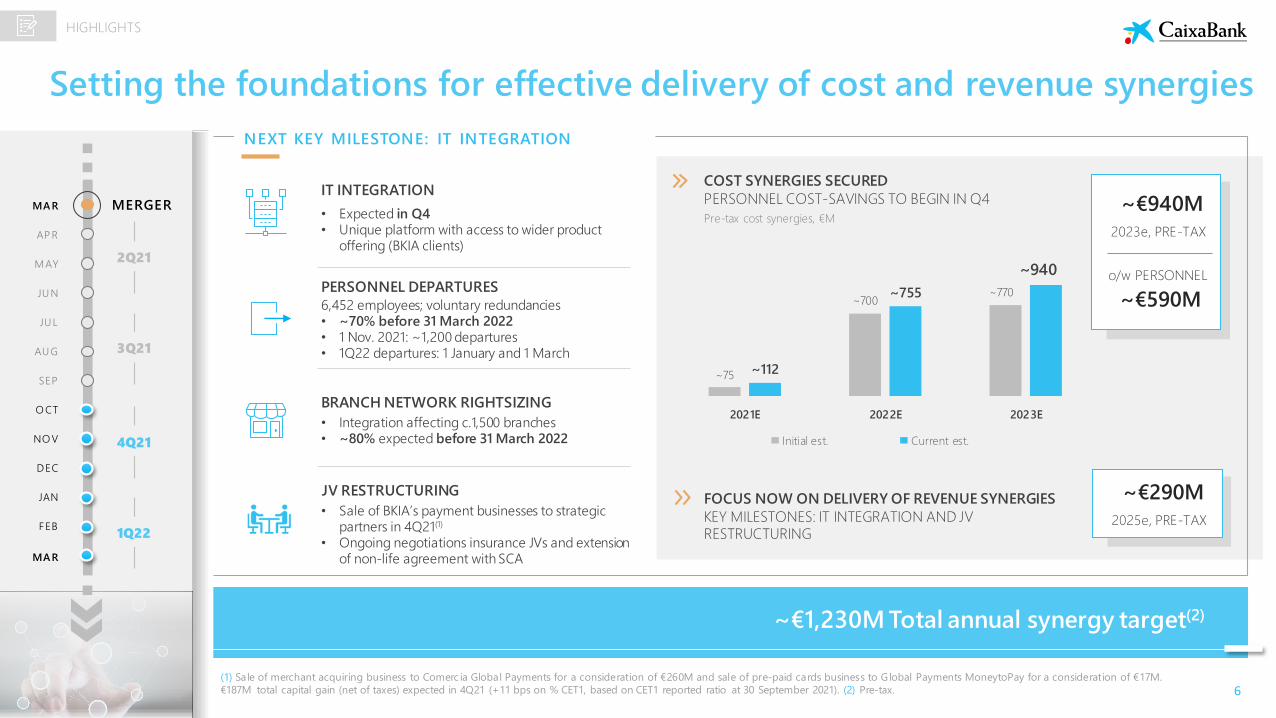
Setting the foundations for effective delivery of cost and revenue synergies
COST SYNERGIES SECURED
PERSONNEL COST-SAVINGS TO BEGIN IN Q4IT INTEGRATION
• Expected in Q4• Unique platform with access to wider product
offering (BKIA clients)
PERSONNEL DEPARTURES
6,452 employees; voluntary redundancies• ~70% before 31 March 2022• 1 Nov. 2021: ~1,200 departures• 1Q22 departures: 1 January and 1 March
BRANCH NETWORK RIGHTSIZING
• Integration affecting c.1,500 branches • ~80% expected before 31 March 2022
JV RESTRUCTURING
~75
~700~770
~112
~755
~940
2021E 2022E 2023E
Initial est. Current est.
Pre-tax cost synergies, €M
FOCUS NOW ON DELIVERY OF REVENUE SYNERGIES
KEY MILESTONES: IT INTEGRATION AND JV RESTRUCTURING
~€940M
2023e, PRE-TAX
o/w PERSONNEL
~€590M
~€290M
2025e, PRE-TAX
~€1,230M Total annual synergy target(2)
MERGER
AP R
MAY
JUN
JUL
AUG
SEP
MAR
O CT
NO V
DEC
JAN
FEB
MAR
2Q21
3Q21
4Q21
1Q22
NEXT KEY MILESTONE: IT INTEGRATION
• Sale of BKIA’s payment businesses to strategic partners in 4Q21(1)
• Ongoing negotiations insurance JVs and extension of non-life agreement with SCA
(1) Sale of merchant acquiring business to Comerc ia Global Payments for a consideration of €260M and sale of pre-paid cards business to Global Payments MoneytoPay for a consideration of €17M.
€187M total capital gain (net of taxes) expected in 4Q21 (+11 bps on % CET1, based on CET1 reported ratio at 30 September 2021). (2) Pre-tax.
7
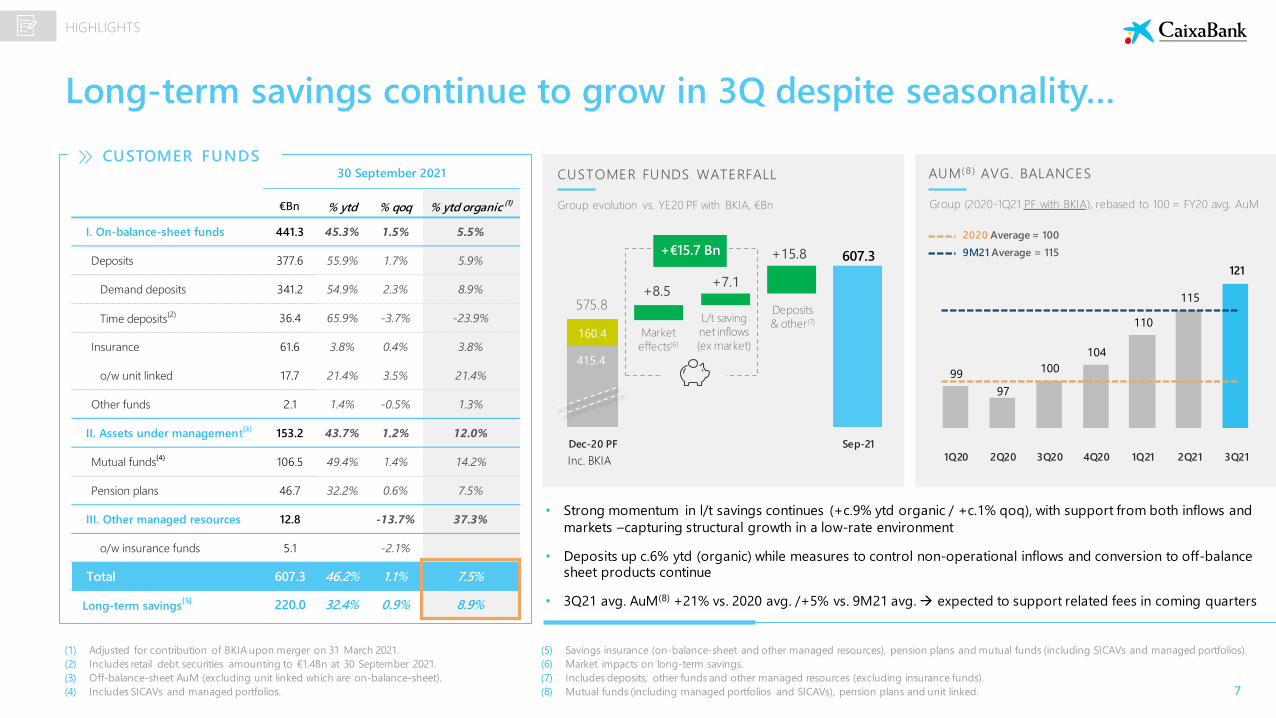
€Bn % ytd % qoq % ytd organic(1)
I. On-balance-sheet funds 441.3 45.3% 1.5% 5.5%
Deposits 377.6 55.9% 1.7% 5.9%
Demand deposits 341.2 54.9% 2.3% 8.9%
Time deposits(2) 36.4 65.9% -3.7% -23.9%
Insurance 61.6 3.8% 0.4% 3.8%
o/w unit linked 17.7 21.4% 3.5% 21.4%
Other funds 2.1 1.4% -0.5% 1.3%
II. Assets under management(3)
153.2 43.7% 1.2% 12.0%
Mutual funds(4)
106.5 49.4% 1.4% 14.2%
Pension plans 46.7 32.2% 0.6% 7.5%
III. Other managed resources 12.8 -13.7% 37.3%
o/w insurance funds 5.1 -2.1%
Total 607.3 46.2% 1.1% 7.5%
Long-term savings(5) 220.0 32.4% 0.9% 8.9%
30 September 2021
CUSTOMER FUNDS
(1) Adjusted for contribution of BKIA upon merger on 31 March 2021.
(2) Includes retail debt securities amounting to €1.4Bn at 30 September 2021.
(3) Off-balance-sheet AuM (excluding unit linked which are on-balance-sheet).
(4) Includes SICAVs and managed portfolios.
(5) Savings insurance (on-balance-sheet and other managed resources), pension plans and mutual funds (including SICAVs and managed portfolios).
(6) Market impacts on long-term savings.
(7) Includes deposits, other funds and other managed resources (excluding insurance funds).
(8) Mutual funds (including managed portfolios and SICAVs), pension plans and unit linked.
• Strong momentum in l/t savings continues (+c.9% ytd organic / +c.1% qoq), with support from both inflows and
markets –capturing structural growth in a low-rate environment
• Deposits up c.6% ytd (organic) while measures to control non-operational inflows and conversion to off-balance sheet products continue
• 3Q21 avg. AuM(8) +21% vs. 2020 avg. /+5% vs. 9M21 avg. → expected to support related fees in coming quarters
AUM ( 8 ) AVG. BALANCES
99
97
100
104
110
115
121
1Q20 2Q20 3Q20 4Q20 1Q21 2Q21 3Q21
Long-term savings continue to grow in 3Q despite seasonality…
2020 Average = 100
9M21 Average = 115
HIGHLIGHTS
CUSTOMER FUNDS WATERFALL
Inc. BKIA
575.8
415.4
607.3
160.4
+8.5+7.1
+15.8
Dec-20 PF Sep-21
Market
effects(6)
L/t saving
net inflows
(ex market)
+€15.7 Bn
Deposits
& other(7)
Group (2020-1Q21 PF with BKIA), rebased to 100 = FY20 avg. AuMGroup evolution vs. YE20 PF with BKIA, €Bn
8
HIGHLIGHTS
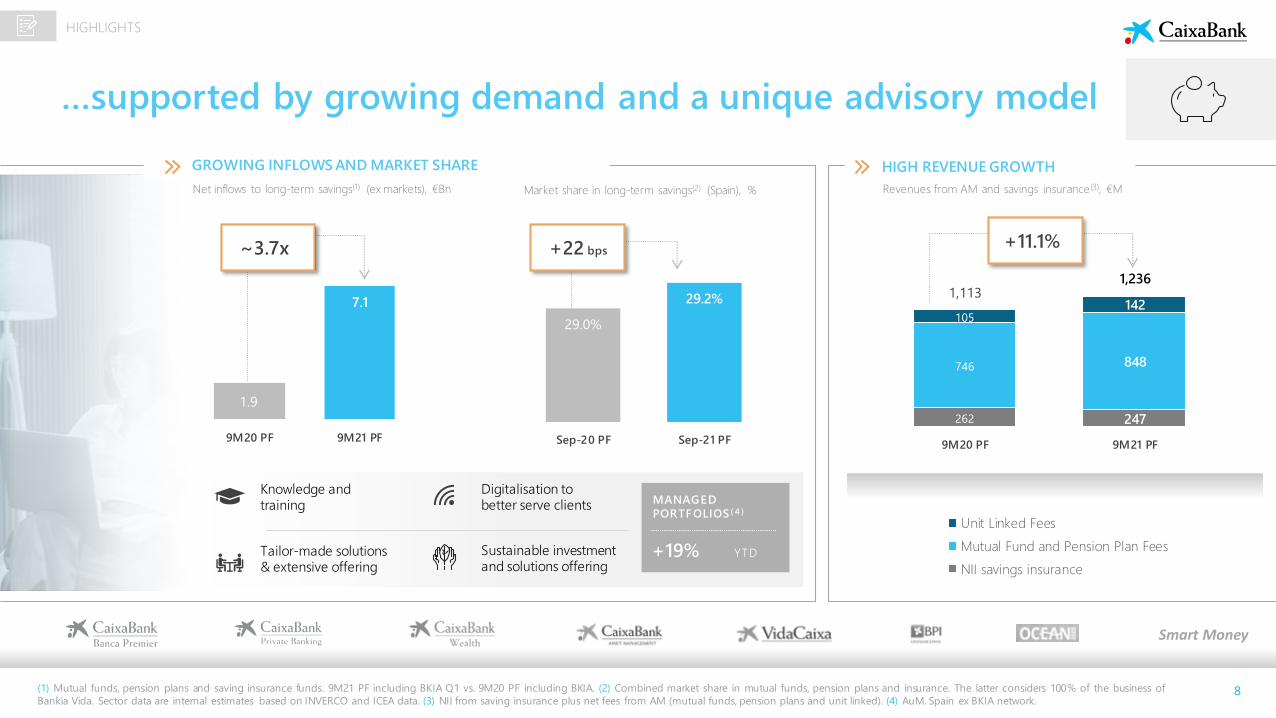
…supported by growing demand and a unique advisory model
262 247
746 848
105142
1,1131,236
9M20 PF 9M21 PF
Unit Linked Fees
Mutual Fund and Pension Plan Fees
NII savings insurance
+11.1%
(1) Mutual funds, pension plans and saving insurance funds. 9M21 PF including BKIA Q1 vs. 9M20 PF including BKIA. (2) Combined market share in mutual funds, pension plans and insurance. The latter considers 100% of the business of
Bankia Vida. Sector data are internal estimates based on INVERCO and ICEA data. (3) NII from saving insurance plus net fees from AM (mutual funds, pension plans and unit linked). (4) AuM. Spain ex BKIA network.
HIGH REVENUE GROWTH
Smart Money
Market share in long-term savings(2) (Spain), %
29.0%
29.2%
Sep-20 PF Sep-21 PF
MANAGED
PORTFOLIOS ( 4 )
GROWING INFLOWS AND MARKET SHARE
Net inflows to long-term savings(1) (ex markets), €Bn
1.9
7.1
9M20 PF 9M21 PF
~3.7x
Knowledge and training
Tailor-made solutions & extensive offering
Digitalisation to better serve clients
Sustainable investment and solutions offering
+19% YTD
+22 bps
Revenues from AM and savings insurance (3), €M
9
HIGHLIGHTS
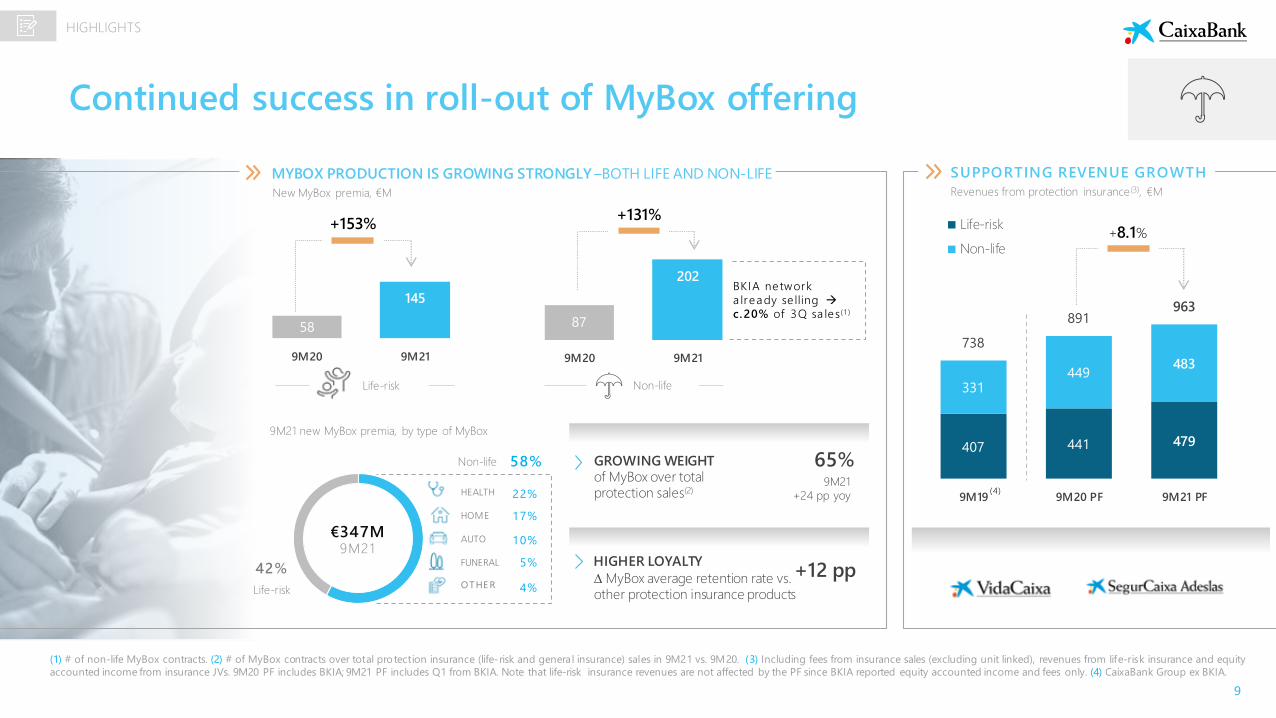
Continued success in roll-out of MyBox offering
(1) # of non-life MyBox contracts. (2) # of MyBox contracts over total protection insurance (life-risk and general insurance) sales in 9M21 vs. 9M20. (3) Including fees from insurance sales (excluding unit linked), revenues from life-risk insurance and equity
accounted income from insurance JVs. 9M20 PF includes BKIA; 9M21 PF includes Q1 from BKIA. Note that life-risk insurance revenues are not affected by the PF since BKIA reported equity accounted income and fees only. (4) CaixaBank Group ex BKIA.
407 441 479
331449
483
738
891963
9M19 9M20 PF 9M21 PF
Life-risk
Non-life
(4)
+8.1%
SUPPORTING REVENUE GROWTHMYBOX PRODUCTION IS GROWING STRONGLY –BOTH LIFE AND NON-LIFE
New MyBox premia, €M
58
145
9M20 9M21
+153%
Life-risk
+131%
Non-life
87
202
9M20 9M21
BKIA network
a lready se lling →
c.20% of 3Q sa les ( 1 )
9M21 new MyBox premia, by type of MyBox
GROWING WEIGHT of MyBox over total protection sales(2)
HIGHER LOYALTY
MyBox average retention rate vs. other protection insurance products
+12 pp
65%9M21
+24 pp yoy
42%
Life-risk
€347M9M21
17%
10%
5%
4%OT HE R
58%Non-life
22%
HOME
HEALTH
AUTO
FUNERAL
Revenues from protection insurance (3), €M
10
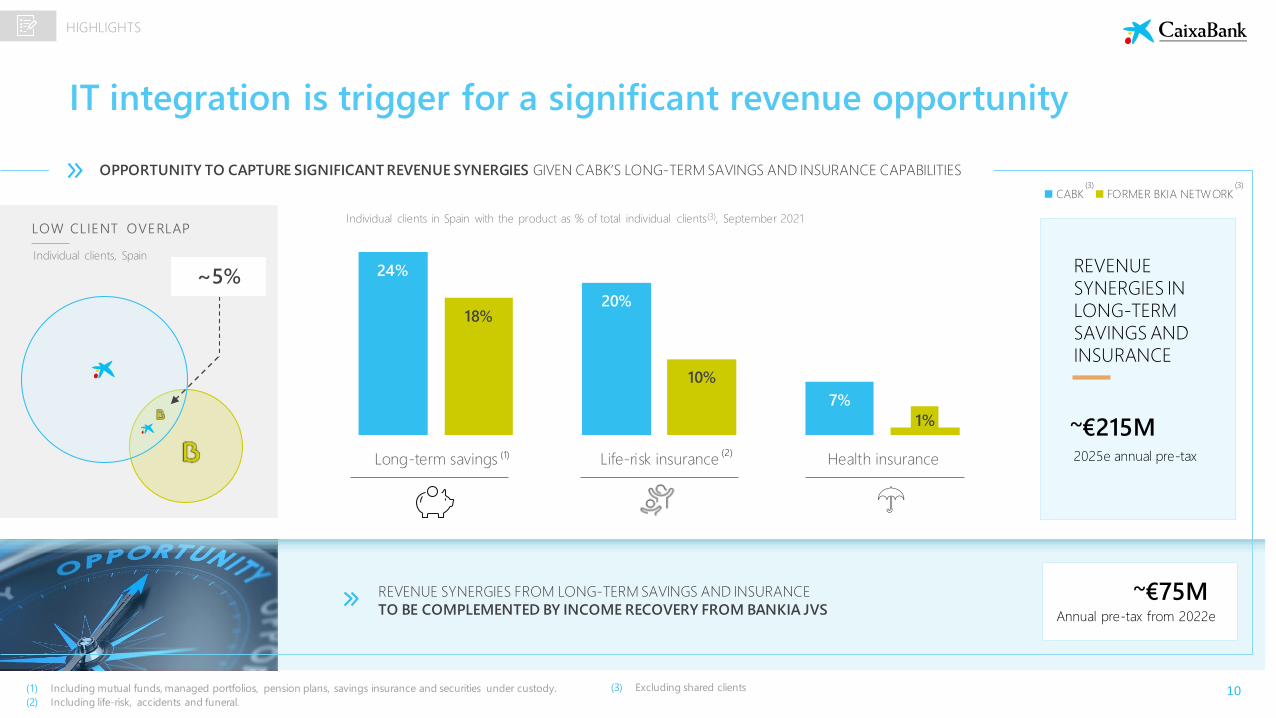
HIGHLIGHTS
IT integration is trigger for a significant revenue opportunity
24%
20%
7%
18%
10%
1%
Long-term savings Life-risk insurance Health insurance
CABK FORMER BKIA NETWORK
Individual clients in Spain with the product as % of total individual clients(3), September 2021
OPPORTUNITY TO CAPTURE SIGNIFICANT REVENUE SYNERGIES GIVEN CABK’S LONG-TERM SAVINGS AND INSURANCE CAPABILITIES
~€75MAnnual pre-tax from 2022e
REVENUE SYNERGIES FROM LONG-TERM SAVINGS AND INSURANCE
TO BE COMPLEMENTED BY INCOME RECOVERY FROM BANKIA JVS
LOW CLIENT OVERLAP
REVENUE SYNERGIES IN LONG-TERM SAVINGS AND INSURANCE
2025e annual pre-tax
~5%
(1) Including mutual funds, managed portfolios, pension plans, savings insurance and securities under custody.
(2) Including life-risk, accidents and funeral.
Individual clients, Spain
(3) (3)
(1) (2)
(3) Excluding shared clients
~€215M
11
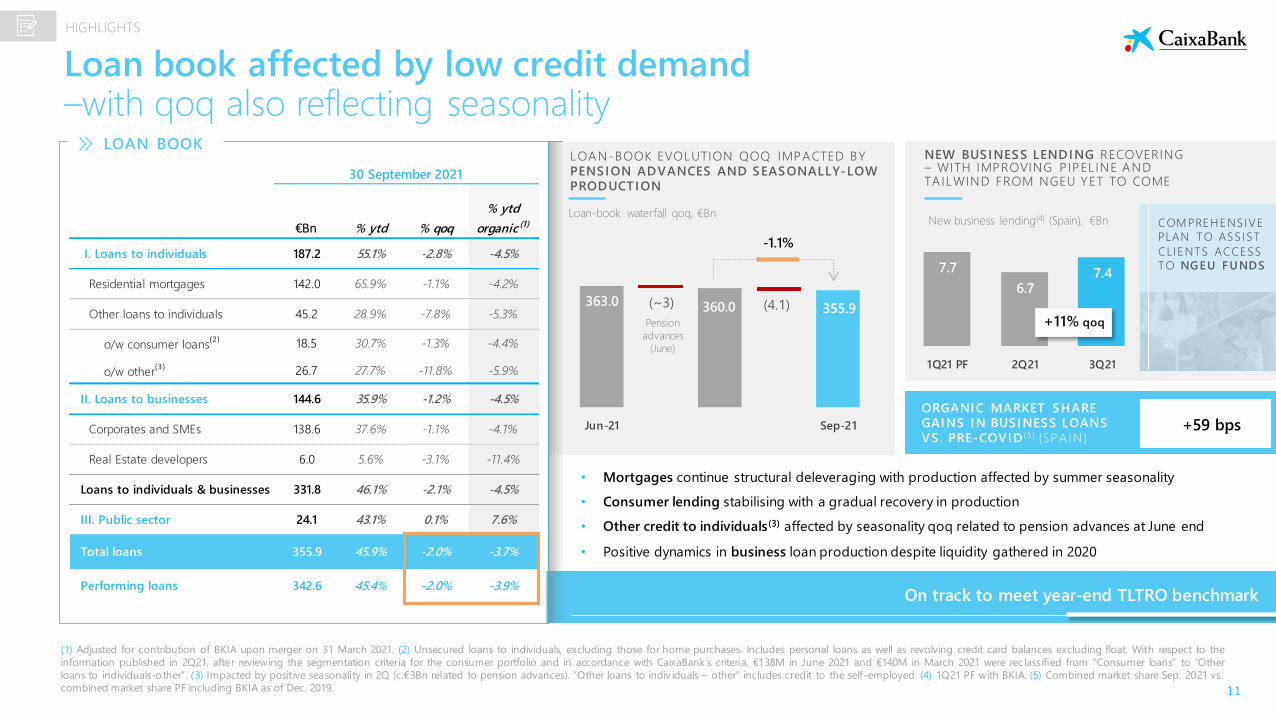
€Bn % ytd % qoq
% ytd
organic (1)
I. Loans to individuals 187.2 55.1% -2.8% -4.5%
Residential mortgages 142.0 65.9% -1.1% -4.2%
Other loans to individuals 45.2 28.9% -7.8% -5.3%
o/w consumer loans(2) 18.5 30.7% -1.3% -4.4%
o/w other(3) 26.7 27.7% -11.8% -5.9%
II. Loans to businesses 144.6 35.9% -1.2% -4.5%
Corporates and SMEs 138.6 37.6% -1.1% -4.1%
Real Estate developers 6.0 5.6% -3.1% -11.4%
Loans to individuals & businesses 331.8 46.1% -2.1% -4.5%
III. Public sector 24.1 43.1% 0.1% 7.6%
Total loans 355.9 45.9% -2.0% -3.7%
Performing loans 342.6 45.4% -2.0% -3.9%
30 September 2021
Loan book affected by low credit demand –with qoq also reflecting seasonality
LOAN BOOK
• Mortgages continue structural deleveraging with production affected by summer seasonality
• Consumer lending stabilising with a gradual recovery in production
• Other credit to individuals(3) affected by seasonality qoq related to pension advances at June end
• Positive dynamics in business loan production despite liquidity gathered in 2020
(1) Adjusted for contribution of BKIA upon merger on 31 March 2021. (2) Unsecured loans to individuals, excluding those for home purchases. Includes personal loans as well as revolving credit card balances excluding float. With respect to the
information published in 2Q21, after reviewing the segmentation criteria for the consumer portfolio and in accordance with CaixaBank’s criteria, €138M in June 2021 and €140M in March 2021 were rec lassified from “Consumer loans” to “Other
loans to individuals-other”. (3) Impacted by positive seasonality in 2Q (c.€3Bn related to pension advances). “Other loans to indiv iduals – other” includes credit to the self-employed. (4) 1Q21 PF with BKIA. (5) Combined market share Sep. 2021 vs.
combined market share PF including BKIA as of Dec. 2019.
HIGHLIGHTS
LOAN-BOOK EVOLUTION QOQ IMPACTED BY PENSION ADVANCES AND SEASONALLY-LOW PRODUCTION
On track to meet year-end TLTRO benchmark
363.0 360.0 355.9(~3) (4.1)
Jun-21 Sep-21
Pension
advances
(June)
NEW BUSINESS LENDING RECOVERING – WITH IMPROVING PIPEL INE AND TAILWIND FROM NGEU YET TO COME
7.7
6.77.4
1Q21 PF 2Q21 3Q21
Loan-book waterfall qoq, €Bn
-1.1%
New business lending(4) (Spain), €Bn COMPREHENSIVE
PLAN TO ASS IST
CLIENTS ACCESS
TO NGEU FUNDS
+11% qoq
ORGANIC MARKET SHARE GAINS IN BUSINESS LOANS VS. PRE-COVID (5 ) (SPA IN )
+59 bps
12
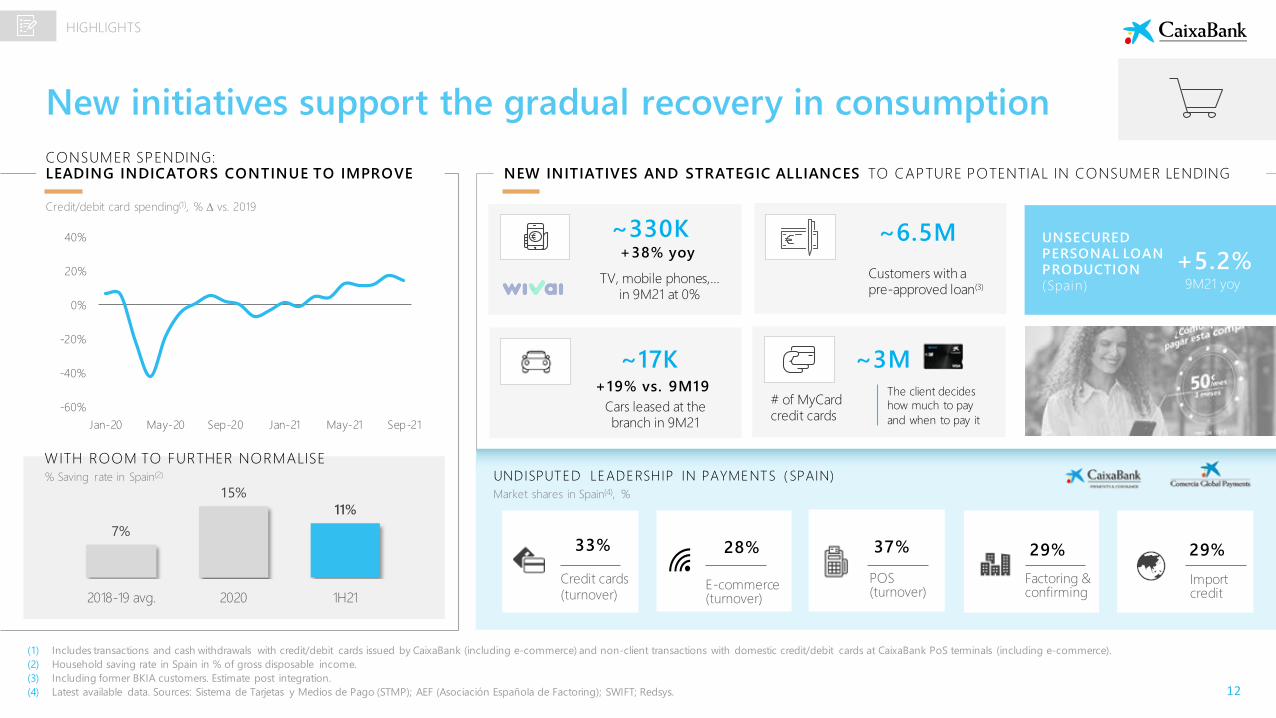
HIGHLIGHTS
New initiatives support the gradual recovery in consumption
(1) Includes transactions and cash withdrawals with credit/debit cards issued by CaixaBank (including e-commerce) and non-client transactions with domestic credit/debit cards at CaixaBank PoS terminals (including e-commerce).
(2) Household saving rate in Spain in % of gross disposable income.
(3) Including former BKIA customers. Estimate post integration.
(4) Latest available data. Sources: Sistema de Tarjetas y Medios de Pago (STMP); AEF (Asociación Española de Factoring); SWIFT; Redsys.
CONSUMER SPENDING: LEADING INDICATORS CONTINUE TO IMPROVE
Credit/debit card spending(1), % vs. 2019
-60%
-40%
-20%
0%
20%
40%
Jan-20 May-20 Sep-20 Jan-21 May-21 Sep-21
% Saving rate in Spain(2)
7%
15%
11%
2018-19 avg. 2020 1H21
NEW INITIATIVES AND STRATEGIC ALLIANCES TO CAPTURE POTENTIAL IN CONSUMER LENDING
UNDISPUTED LEADERSHIP IN PAYMENTS ( SPAIN)
Credit cards (turnover)
33% 28%
POS (turnover)
37%
Factoring & confirming
29%
Import credit
29%
E-commerce (turnover)
Customers with a pre-approved loan(3)
~6.5M~330K+38% yoy
TV, mobile phones,… in 9M21 at 0%
Market shares in Spain(4), %
WITH ROOM TO FURTHER NORMALISE
The client decides
how much to pay
and when to pay it
# of MyCardcredit cards
~3M
Cars leased at the branch in 9M21
~17K+19% vs. 9M19
UNSECURED PERSONAL LOAN PRODUCTION (Spain)
+5.2%9M21 yoy
13
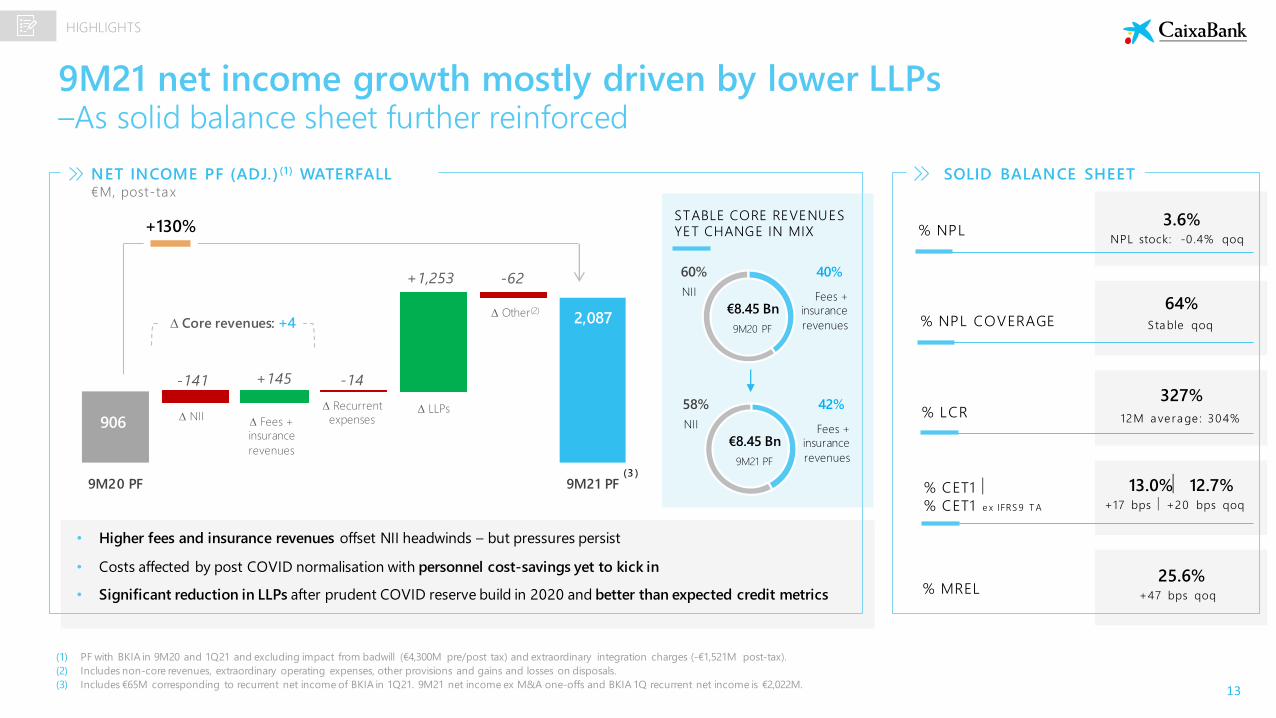
9M21 net income growth mostly driven by lower LLPs –As solid balance sheet further reinforced
(1) PF with BKIA in 9M20 and 1Q21 and excluding impact from badwill (€4,300M pre/post tax) and extraordinary integration charges (-€1,521M post-tax).
(2) Includes non-core revenues, extraordinary operating expenses, other provisions and gains and losses on disposals.
(3) Includes €65M corresponding to recurrent net income of BKIA in 1Q21. 9M21 net income ex M&A one-offs and BKIA 1Q recurrent net income is €2,022M.
HIGHLIGHTS
NET INCOME PF (ADJ.) (1) WATERFALL€M, post-tax
STABLE CORE REVENUES YET CHANGE IN MIX
€8.45 Bn
9M20 PF
40%
Fees +
insurance
revenues
60%
NII
€8.45 Bn
9M21 PF
42%
Fees +
insurance
revenues
58%
NII906
2,087
-141 +145 -14
+1,253 -62
9M20 PF 9M21 PF
NII Recurrent
expenses LLPs
Other(2)
Fees +
insurance
revenues
Core revenues: +4
+130%
(3 )
• Higher fees and insurance revenues offset NII headwinds – but pressures persist
• Costs affected by post COVID normalisation with personnel cost-savings yet to kick in
• Significant reduction in LLPs after prudent COVID reserve build in 2020 and better than expected credit metrics
SOLID BALANCE SHEET
% NPL3.6%
% NPL COVERAGE64%
Stable qoq
% LCR327%
% CET1
% CET1 e x IFRS 9 T A
13.0% 12.7%+17 bps +20 bps qoq
% MREL25.6%
+47 bps qoq
NPL stock: -0 .4% qoq
12M average : 304%
14
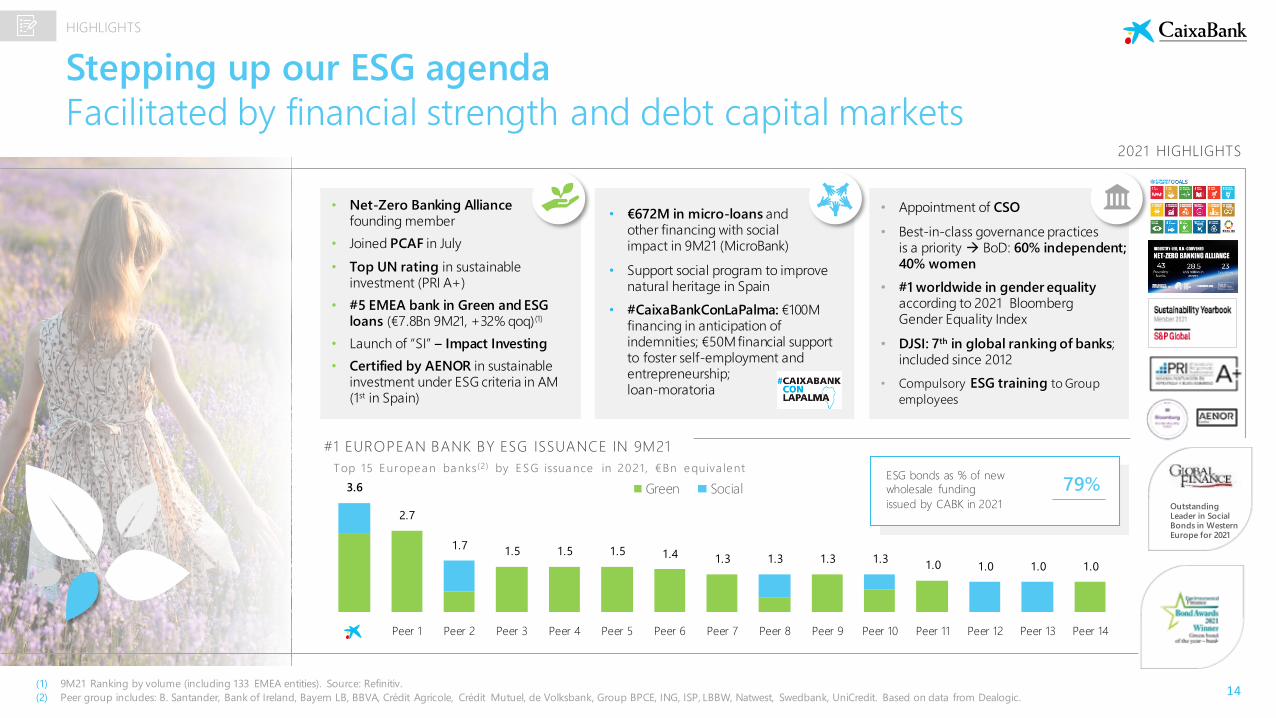
HIGHLIGHTS
(1) 9M21 Ranking by volume (including 133 EMEA entities). Source: Refinitiv.
(2) Peer group includes: B. Santander, Bank of Ireland, Bayern LB, BBVA, Crédit Agricole, Crédit Mutuel, de Volksbank, Group BPCE, ING, ISP, LBBW, Natwest, Swedbank, UniCredit. Based on data from Dealogic.
Stepping up our ESG agenda
Facilitated by financial strength and debt capital markets
• Net-Zero Banking Alliancefounding member
• Joined PCAF in July
• Top UN rating in sustainable investment (PRI A+)
• #5 EMEA bank in Green and ESG loans (€7.8Bn 9M21, +32% qoq)(1)
• Launch of “SI” – Impact Investing
• Certified by AENOR in sustainable investment under ESG criteria in AM (1st in Spain)
• Appointment of CSO
• Best-in-class governance practices is a priority → BoD: 60% independent; 40% women
• #1 worldwide in gender equality according to 2021 Bloomberg Gender Equality Index
• DJSI: 7th in global ranking of banks; included since 2012
• Compulsory ESG training to Group
employees
• €672M in micro-loans and other financing with social impact in 9M21 (MicroBank)
• Support social program to improve natural heritage in Spain
• #CaixaBankConLaPalma: €100M financing in anticipation of indemnities; €50M financial support to foster self-employment and entrepreneurship; loan-moratoria
3.6
2.7
1.71.5 1.5 1.5 1.4 1.3 1.3 1.3 1.3
1.0 1.0 1.0 1.0
Peer 1 Peer 2 Peer 3 Peer 4 Peer 5 Peer 6 Peer 7 Peer 8 Peer 9 Peer 10 Peer 11 Peer 12 Peer 13 Peer 14
Green Social
2021 HIGHLIGHTS
ESG bonds as % of new
wholesale funding
issued by CABK in 2021
#1 EUROPEAN BANK BY ESG ISSUANCE IN 9M21
Top 15 European banks (2) by ESG issuance in 2021, €Bn equiva lent
79%Outstanding Leader in Social Bonds in Western Europe for 2021
15
I. 3Q21 Highlights
CONTENTS
II.3Q21 P&L and Balance Sheet
16
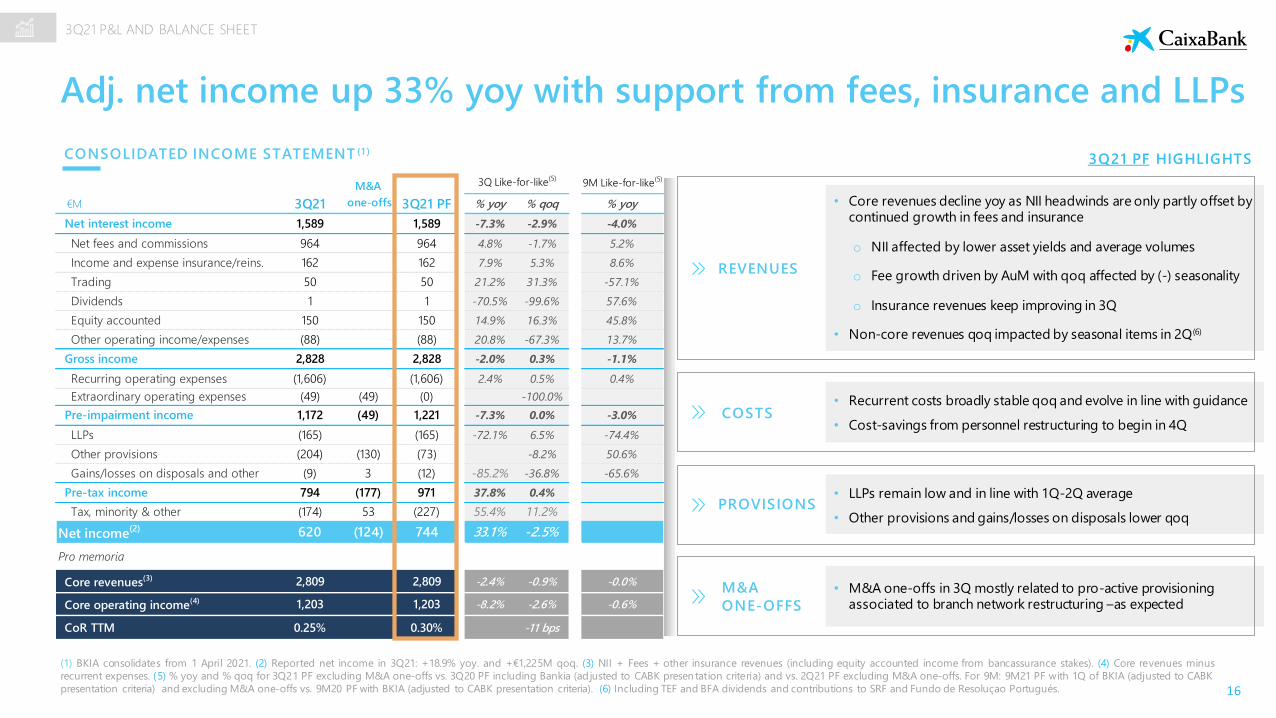
Adj. net income up 33% yoy with support from fees, insurance and LLPs
(1) BKIA consolidates from 1 April 2021. (2) Reported net income in 3Q21: +18.9% yoy. and +€1,225M qoq. (3) NII + Fees + other insurance revenues (including equity accounted income from bancassurance stakes). (4) Core revenues minus
recurrent expenses. (5) % yoy and % qoq for 3Q21 PF excluding M&A one-offs vs. 3Q20 PF including Bankia (adjusted to CABK presen tation criteria) and vs. 2Q21 PF excluding M&A one-offs. For 9M: 9M21 PF with 1Q of BKIA (adjusted to CABK
presentation criteria) and excluding M&A one-offs vs. 9M20 PF with BKIA (adjusted to CABK presentation criteria). (6) Including TEF and BFA dividends and contributions to SRF and Fundo de Resoluçao Portugués.
REVENUES
COSTS
PROVISIONS
M&A
ONE-OFFS
• Core revenues decline yoy as NII headwinds are only partly offset by continued growth in fees and insurance
o NII affected by lower asset yields and average volumes
o Fee growth driven by AuM with qoq affected by (-) seasonality
o Insurance revenues keep improving in 3Q
• Non-core revenues qoq impacted by seasonal items in 2Q(6)
• Recurrent costs broadly stable qoq and evolve in line with guidance
• Cost-savings from personnel restructuring to begin in 4Q
• LLPs remain low and in line with 1Q-2Q average
• Other provisions and gains/losses on disposals lower qoq
• M&A one-offs in 3Q mostly related to pro-active provisioning associated to branch network restructuring –as expected
3Q21 P&L AND BALANCE SHEET
3Q21 PF HIGHLIGHTS
M&A 9M Like-for-like(5)
€M 3Q21 one-offs 3Q21 PF % yoy % qoq % yoy
Net interest income 1,589 1,589 -7.3% -2.9% -4.0%
Net fees and commissions 964 964 4.8% -1.7% 5.2%
Income and expense insurance/reins. 162 162 7.9% 5.3% 8.6%
Trading 50 50 21.2% 31.3% -57.1%
Dividends 1 1 -70.5% -99.6% 57.6%
Equity accounted 150 150 14.9% 16.3% 45.8%
Other operating income/expenses (88) (88) 20.8% -67.3% 13.7%
Gross income 2,828 2,828 -2.0% 0.3% -1.1%
Recurring operating expenses (1,606) (1,606) 2.4% 0.5% 0.4%
Extraordinary operating expenses (49) (49) (0) -100.0%
Pre-impairment income 1,172 (49) 1,221 -7.3% 0.0% -3.0%
LLPs (165) (165) -72.1% 6.5% -74.4%
Other provisions (204) (130) (73) -8.2% 50.6%
Gains/losses on disposals and other (9) 3 (12) -85.2% -36.8% -65.6%
Pre-tax income 794 (177) 971 37.8% 0.4%
Tax, minority & other (174) 53 (227) 55.4% 11.2%
Net income(2) 620 (124) 744 33.1% -2.5%
Pro memoria
Core revenues(3) 2,809 2,809 -2.4% -0.9% -0.0%
Core operating income(4) 1,203 1,203 -8.2% -2.6% -0.6%
CoR TTM 0.25% 0.30% -11 bps
3Q Like-for-like(5)
CONSOLIDATED INCOME STATEMENT (1 )
17
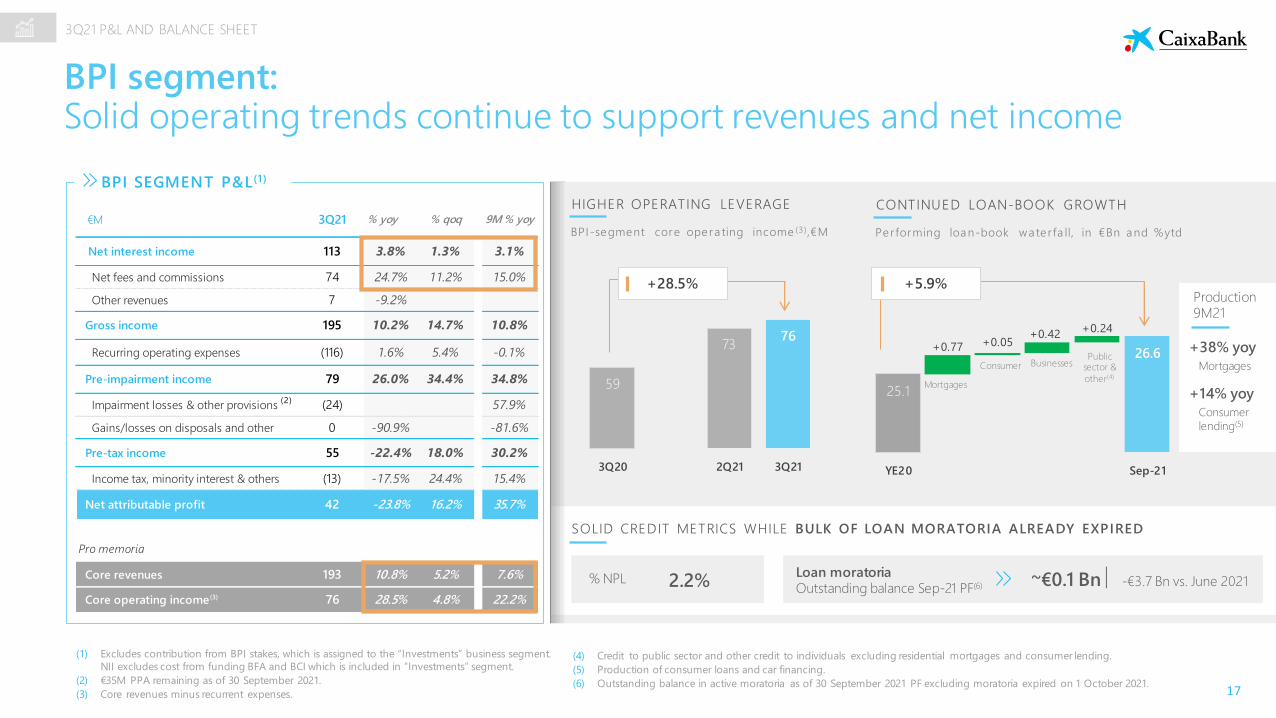
€M 3Q21 % yoy % qoq 9M % yoy
Net interest income 113 3.8% 1.3% 3.1%
Net fees and commissions 74 24.7% 11.2% 15.0%
Other revenues 7 -9.2%
Gross income 195 10.2% 14.7% 10.8%
Recurring operating expenses (116) 1.6% 5.4% -0.1%
Pre-impairment income 79 26.0% 34.4% 34.8%
Impairment losses & other provisions (24) 57.9%
Gains/losses on disposals and other 0 -90.9% -81.6%
Pre-tax income 55 -22.4% 18.0% 30.2%
Income tax, minority interest & others (13) -17.5% 24.4% 15.4%
Net attributable profit 42 -23.8% 16.2% 35.7%
Pro memoria
Core revenues 193 10.8% 5.2% 7.6%
Core operating income (3) 76 28.5% 4.8% 22.2%
BPI segment: Solid operating trends continue to support revenues and net income
(1) Excludes contribution from BPI stakes, which is assigned to the “Investments” business segment.
NII excludes cost from funding BFA and BCI which is included in ”Investments” segment.
(2) €35M PPA remaining as of 30 September 2021.
(3) Core revenues minus recurrent expenses.
(4) Credit to public sector and other credit to individuals excluding residential mortgages and consumer lending.
(5) Production of consumer loans and car financing.
(6) Outstanding balance in active moratoria as of 30 September 2021 PF excluding moratoria expired on 1 October 2021.
HIGHER OPERATING LEVERAGE
BPI-segment core opera ting income (3),€M
CONTINUED LOAN-BOOK GROWTH
Per forming loan-book wa ter fa ll, in €Bn and %ytd
59
7376
3Q20 2Q21 3Q21
+28.5%
25.1
26.6+0.77 +0.05
+0.42+0.24
YE20 Sep-21
Mortgages
ConsumerPublic
sector &
other(4)
Businesses
+5.9%
SOLID CREDIT METRICS WHILE BULK OF LOAN MORATORIA ALREADY EXPIRED
Loan moratoria Outstanding balance Sep-21 PF(6) ~€0.1 Bn -€3.7 Bn vs. June 2021
Production9M21
+38% yoy
BPI SEGMENT P&L(1)
(2)
Mortgages
+14% yoy
Consumer
lending(5)
3Q21 P&L AND BALANCE SHEET
% NPL 2.2%
18
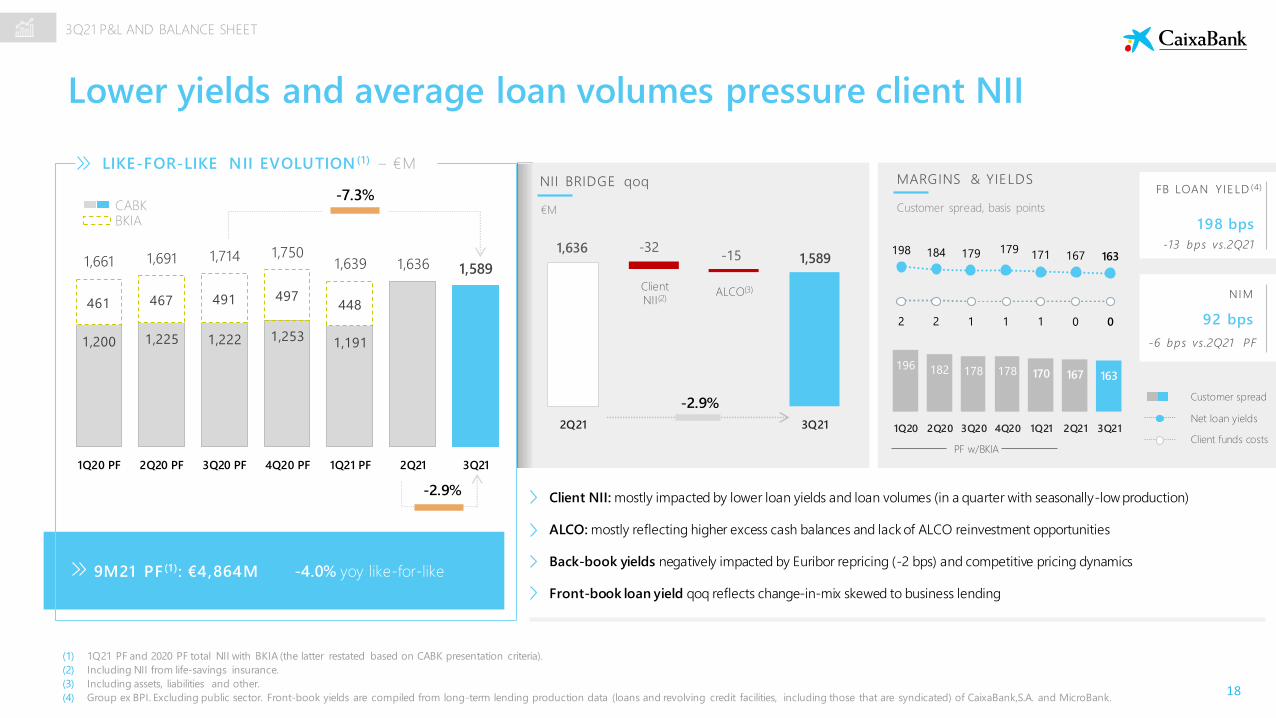
Lower yields and average loan volumes pressure client NII
LIKE-FOR-LIKE NII EVOLUTION (1) ‒ €M
CABKBKIA
1,200 1,225 1,222 1,253 1,191
461 467 491 497448
1,661 1,691 1,714 1,7501,639 1,636 1,589
1Q20 PF 2Q20 PF 3Q20 PF 4Q20 PF 1Q21 PF 2Q21 3Q21
-7.3%
9M21 PF (1): €4,864M -4.0% yoy like-for-like
NII BRIDGE qoq
€M
MARGINS & YIELDS
Customer spread, basis points
196 182 178 178 170 167 163
1Q20 2Q20 3Q20 4Q20 1Q21 2Q21 3Q21
2 2 1 1 1 0 0
198 184 179 179171 167 163
Customer spread
Net loan yields
NIM
92 bps
-6 bps vs.2Q21 PF
1,6361,589
2Q21 3Q21
-32
Client
NII(2)ALCO(3)
-15
FB LOAN YIELD (4)
198 bps
-13 bps vs.2Q21
PF w/BKIA
-2.9%
Client funds costs
Client NII: mostly impacted by lower loan yields and loan volumes (in a quarter with seasonally-low production)
ALCO: mostly reflecting higher excess cash balances and lack of ALCO reinvestment opportunities
Back-book yields negatively impacted by Euribor repricing (-2 bps) and competitive pricing dynamics
Front-book loan yield qoq reflects change-in-mix skewed to business lending
(1) 1Q21 PF and 2020 PF total NII with BKIA (the latter restated based on CABK presentation criteria).
(2) Including NII from life-savings insurance.
(3) Including assets, liabilities and other.
(4) Group ex BPI. Excluding public sector. Front-book yields are compiled from long-term lending production data (loans and revolving credit facilities, including those that are syndicated) of CaixaBank,S.A. and MicroBank.
3Q21 P&L AND BALANCE SHEET
-2.9%
19
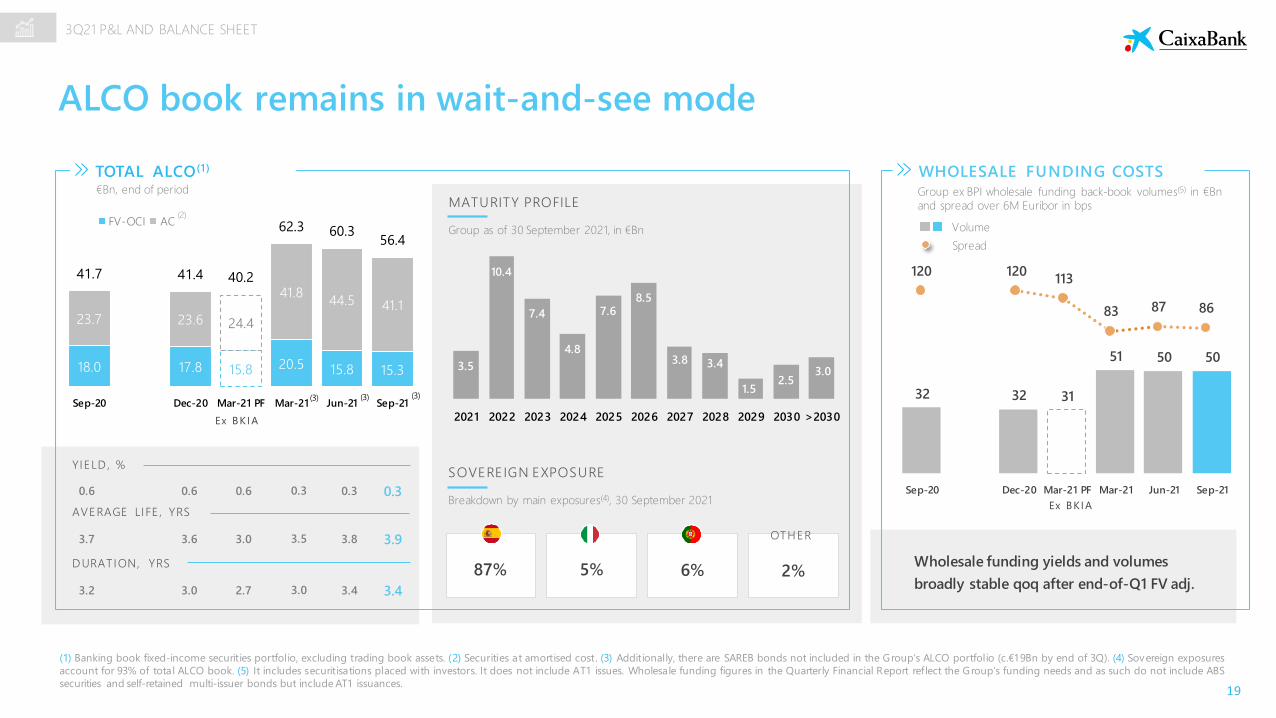
DURATION, YRS
AVERAGE LIFE , YRS
YIELD , %
0.6 0.6 0.6 0.3
3.7 3.6 3.0 3.8
3.2 3.0 2.7 3.4
(2)
Ex BKIA
0.3
3.5
3.0
ALCO book remains in wait-and-see mode
(1) Banking book fixed-income securities portfolio, excluding trading book assets. (2) Securities at amortised cost. (3) Additionally, there are SAREB bonds not included in the Group’s ALCO portfolio (c.€19Bn by end of 3Q). (4) Sovereign exposures
account for 93% of total ALCO book. (5) It includes securitisations placed with investors. It does not include AT1 issues. Wholesale funding figures in the Quarterly Financial Report reflect the Group’s funding needs and as such do not include ABS
securities and self-retained multi-issuer bonds but include AT1 issuances.
3.5
10.4
7.4
4.8
7.68.5
3.8 3.4
1.52.5
3.0
2021 2022 2023 2024 2025 2026 2027 2028 2029 2030 >2030
SOVEREIGN EXPOSURE
Breakdown by main exposures(4), 30 September 2021
87% 5% 6%
OTHER
2%
Group as of 30 September 2021, in €Bn
MATURITY PROFILE€Bn, end of period
TOTAL ALCO(1) WHOLESALE FUNDING COSTSGroup ex BPI wholesale funding back-book volumes(5) in €Bn
and spread over 6M Euribor in bps
32 32 31
51 50 50
Sep-20 Dec-20 Mar-21 PF Mar-21 Jun-21 Sep-21
120 120 113
83 87 86
Spread
Volume
Wholesale funding yields and volumes
broadly stable qoq after end-of-Q1 FV adj.
Ex BKIA
18.0 17.8 15.8 20.5 15.8 15.3
23.7 23.6 24.4
41.844.5 41.1
41.7 41.4 40.2
62.3 60.356.4
Sep-20 Dec-20 Mar-21 PF Mar-21 Jun-21 Sep-21
FV-OCI AC
(3) (3)
0.3
3.9
3.4
3Q21 P&L AND BALANCE SHEET
(3)
20
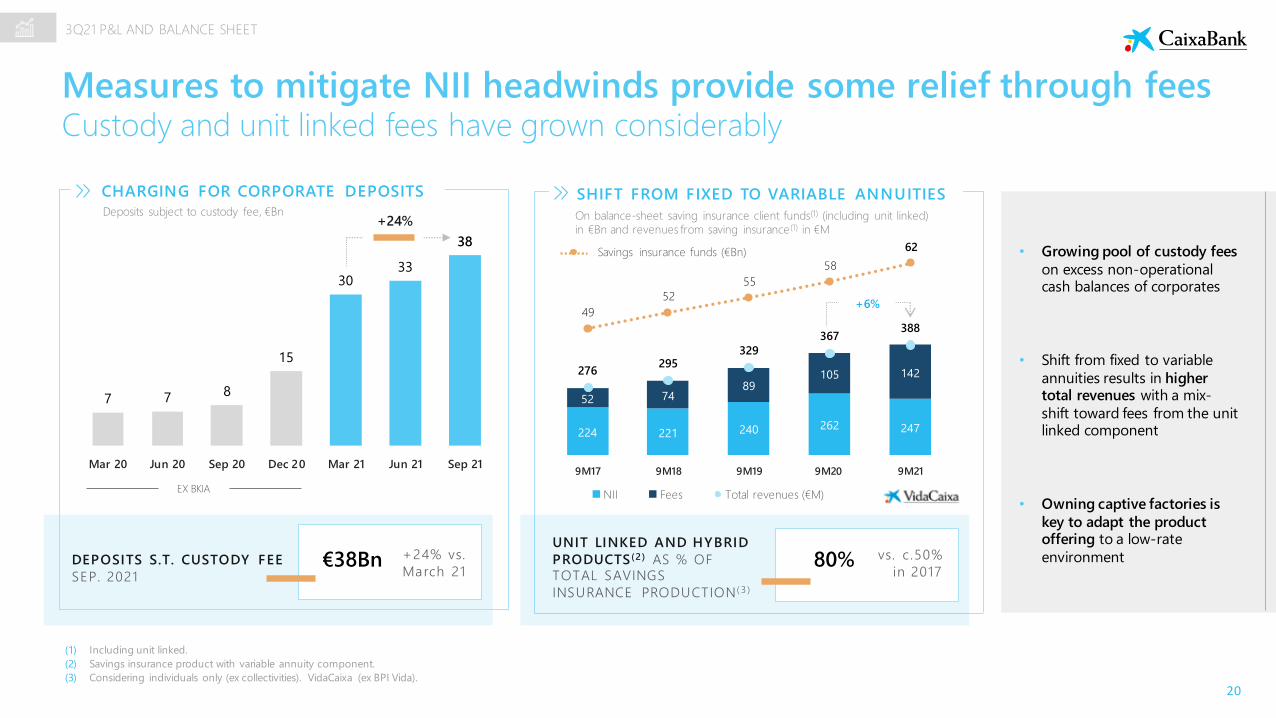
Measures to mitigate NII headwinds provide some relief through feesCustody and unit linked fees have grown considerably
7 7 8
15
3033
38
Mar 20 Jun 20 Sep 20 Dec 20 Mar 21 Jun 21 Sep 21
DEPOSITS S.T. CUSTODY FEE
SEP. 2021€38Bn +24% vs.
March 21
SHIFT FROM FIXED TO VARIABLE ANNUITIESCHARGING FOR CORPORATE DEPOSITS
Deposits subject to custody fee, €Bn
UNIT LINKED AND HYBRID
PRODUCTS (2) AS % OF TOTAL SAVINGS
INSURANCE PRODUCTION ( 3 )
80% vs. c.50%
in 2017
• Growing pool of custody fees
on excess non-operational cash balances of corporates
• Shift from fixed to variable
annuities results in higher total revenues with a mix-
shift toward fees from the unit linked component
• Owning captive factories is
key to adapt the product offering to a low-rate
environment
(1) Including unit linked.
(2) Savings insurance product with variable annuity component.
(3) Considering individuals only (ex collectivities). VidaCaixa (ex BPI Vida).
3Q21 P&L AND BALANCE SHEET
49
52
55
58
62
On balance-sheet saving insurance client funds(1) (including unit linked)
in €Bn and revenues from saving insurance (1) in €M
Savings insurance funds (€Bn)
+6%
EX BKIA
+24%
224 221 240 262 247
52 7489
105 142276295
329
367388
9M17 9M18 9M19 9M20 9M21
NII Fees Total revenues (€M)
21
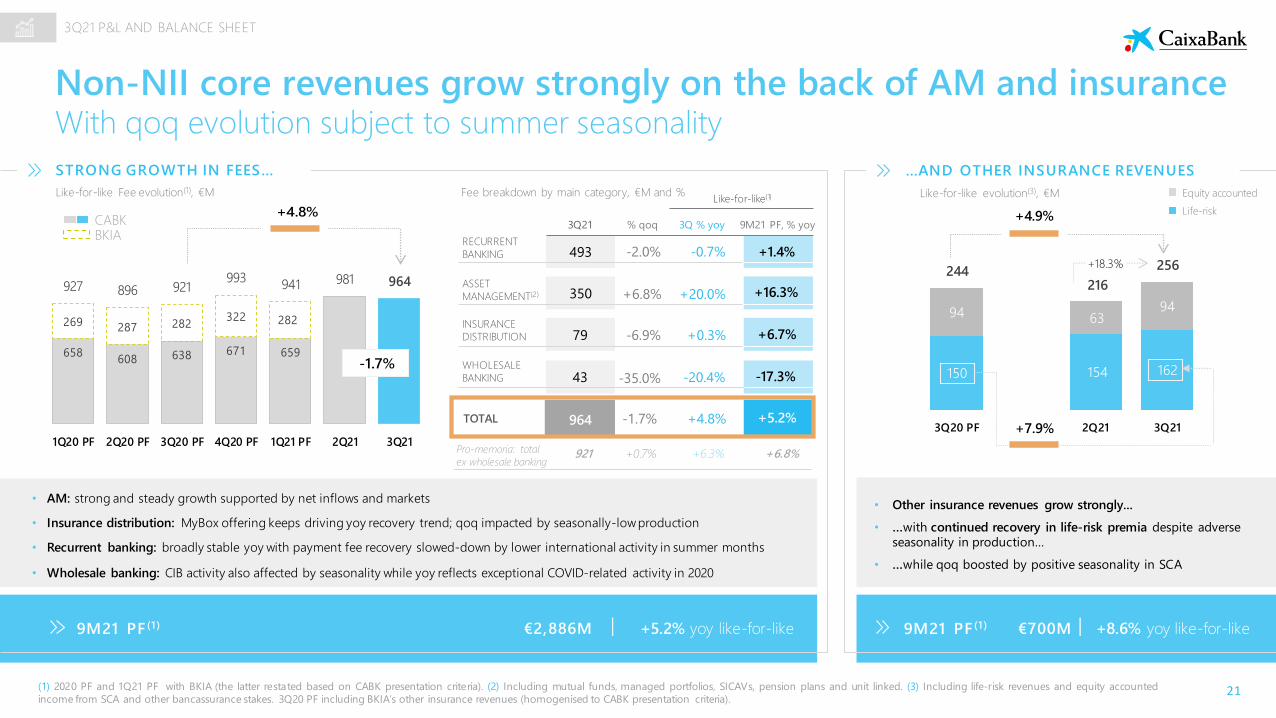
Non-NII core revenues grow strongly on the back of AM and insuranceWith qoq evolution subject to summer seasonality
(1) 2020 PF and 1Q21 PF with BKIA (the latter restated based on CABK presentation criteria). (2) Including mutual funds, managed portfolios, SICAVs, pension plans and unit linked. (3) Including life-risk revenues and equity accounted
income from SCA and other bancassurance stakes. 3Q20 PF including BKIA’s other insurance revenues (homogenised to CABK presentation criteria).
3Q21 P&L AND BALANCE SHEET
STRONG GROWTH IN FEES… …AND OTHER INSURANCE REVENUES
Like-for-like Fee evolution(1), €M
CABKBKIA
658608 638 671 659
269 287 282322 282
927 896 921993
941 981 964
1Q20 PF 2Q20 PF 3Q20 PF 4Q20 PF 1Q21 PF 2Q21 3Q21
+4.8%
-1.7%
• AM: strong and steady growth supported by net inflows and markets
• Insurance distribution: MyBox offering keeps driving yoy recovery trend; qoq impacted by seasonally-lowproduction
• Recurrent banking: broadly stable yoy with payment fee recovery slowed-down by lower international activity in summer months
• Wholesale banking: CIB activity also affected by seasonality while yoy reflects exceptional COVID-related activity in 2020
9M21 PF (1) €2,886M +5.2% yoy like-for-like
Fee breakdown by main category, €M and % Like-for-like evolution(3), €M
9M21 PF (1) €700M +8.6% yoy like-for-like
• Other insurance revenues grow strongly...
• …with continued recovery in life-risk premia despite adverse seasonality in production…
• …while qoq boosted by positive seasonality in SCA
150 154 162
94 6394
244216
256
3Q20 PF 2Q21 3Q21
+4.9%
+18.3%
+7.9%
Equity accounted
Life-risk
Pro-memoria: total
ex wholesale banking
9M21 PF, % yoy
Like-for-like(1)
RECURRENT
BANKING
ASSET
MANAGEMENT(2)
INSURANCE
DISTRIBUTION
493
350
79
% qoq
+6.8%
-6.9%
-2.0%
3Q21
+16.3%
+6.7%
+1.4%
3Q % yoy
+20.0%
+0.3%
-0.7%
WHOLESALE
BANKING 43 -35.0% -17.3%-20.4%
TOTAL 964 -1.7% +5.2%+4.8%
+6.8%921 +0.7% +6.3%
22
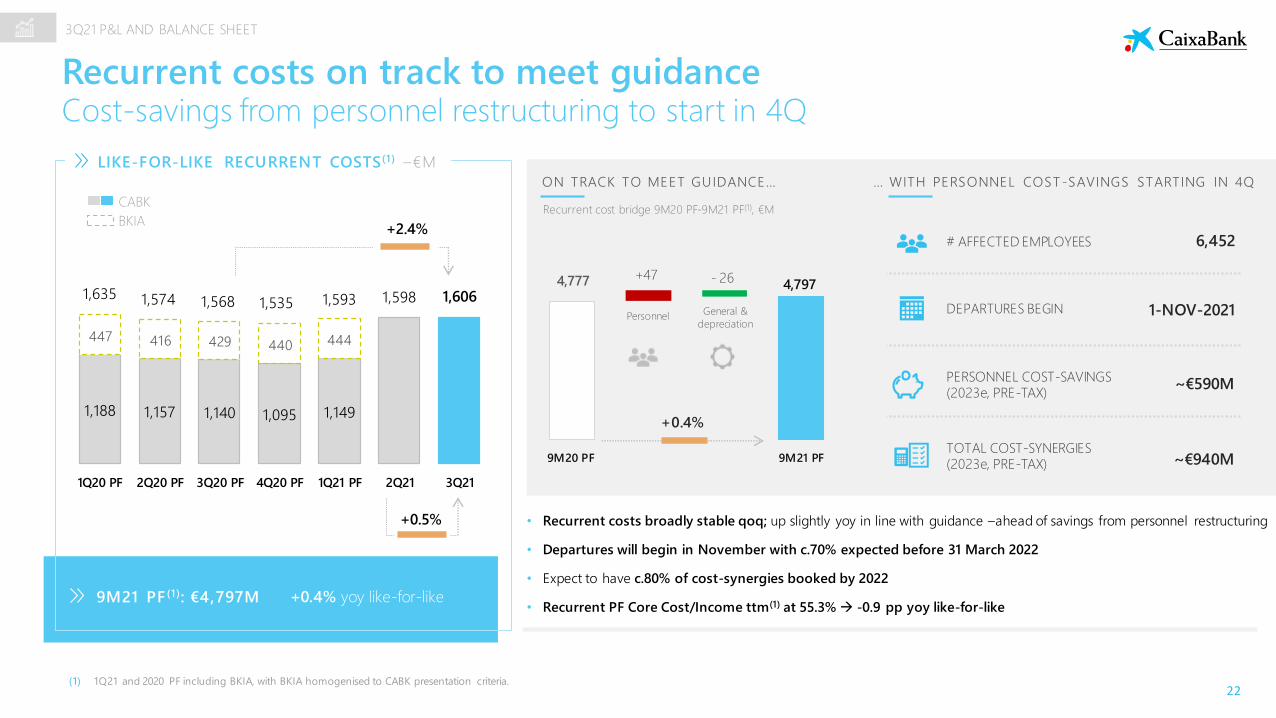
Recurrent costs on track to meet guidance Cost-savings from personnel restructuring to start in 4Q
(1) 1Q21 and 2020 PF including BKIA, with BKIA homogenised to CABK presentation criteria.
1,188 1,157 1,140 1,095 1,149
447 416 429 440 444
1,635 1,574 1,568 1,535 1,593 1,598 1,606
1Q20 PF 2Q20 PF 3Q20 PF 4Q20 PF 1Q21 PF 2Q21 3Q21
+0.5%
9M21 PF (1): €4,797M +0.4% yoy like-for-like
LIKE-FOR-LIKE RECURRENT COSTS(1) –€M
CABK
BKIA+2.4%
ON TRACK TO MEET GUIDANCE…
4,777 4,797
9M20 PF 9M21 PF
Personnel General &
depreciation
+47 - 26
+0.4%
Recurrent cost bridge 9M20 PF-9M21 PF(1), €M
… WITH PERSONNEL COST -SAVINGS STARTING IN 4Q
# AFFECTED EMPLOYEES 6,452
DEPARTURES BEGIN 1-NOV-2021
PERSONNEL COST-SAVINGS(2023e, PRE-TAX)
~€590M
TOTAL COST-SYNERGIES(2023e, PRE-TAX) ~€940M
• Recurrent costs broadly stable qoq; up slightly yoy in line with guidance –ahead of savings from personnel restructuring
• Departures will begin in November with c.70% expected before 31 March 2022
• Expect to have c.80% of cost-synergies booked by 2022
• Recurrent PF Core Cost/Income ttm(1) at 55.3% → -0.9 pp yoy like-for-like
3Q21 P&L AND BALANCE SHEET
23
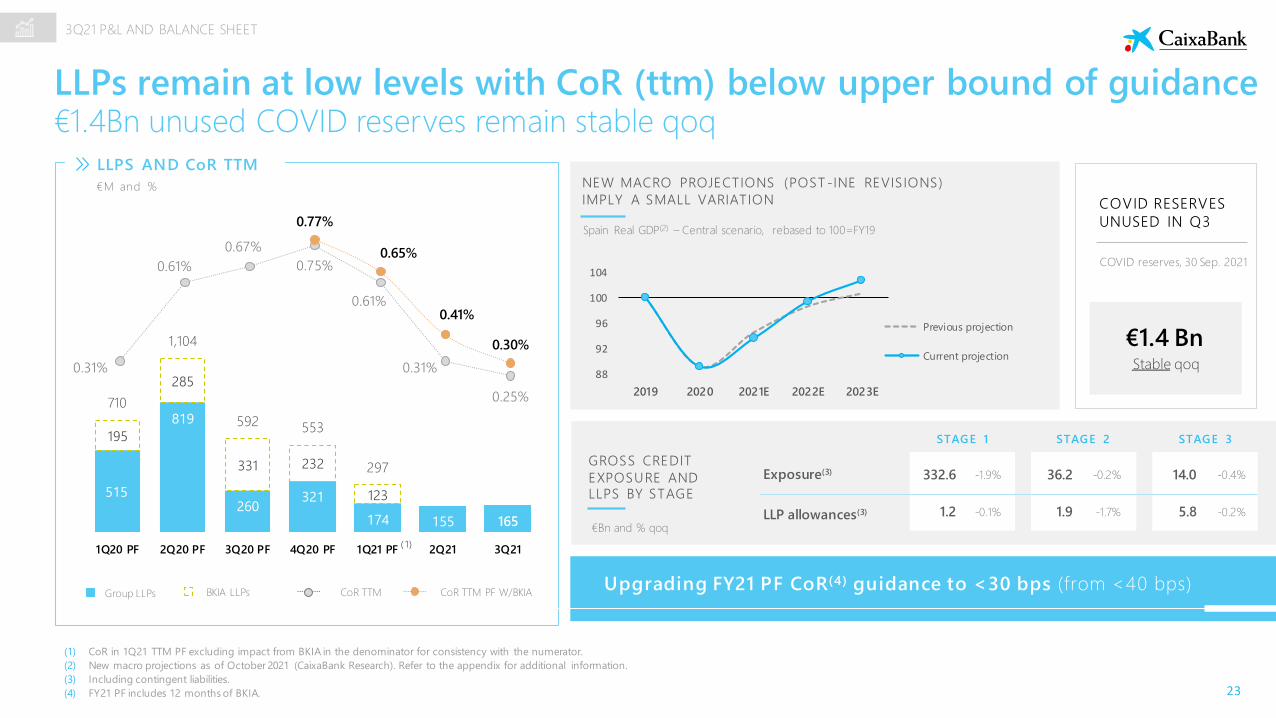
LLPs remain at low levels with CoR (ttm) below upper bound of guidance€1.4Bn unused COVID reserves remain stable qoq
(1) CoR in 1Q21 TTM PF excluding impact from BKIA in the denominator for consistency with the numerator.
(2) New macro projections as of October 2021 (CaixaBank Research). Refer to the appendix for additional information.
(3) Including contingent liabilities.
(4) FY21 PF includes 12 months of BKIA.
0.31%
0.61%
0.67%
0.75%
0.61%
0.31%
0.25%
0.77%
0.65%
0.41%
0.30%
LLPS AND CoR TTM
€M and %
515
819
260321
174 155 165
195
285
331 232
123
710
1,104
592 553
297
1Q20 PF 2Q20 PF 3Q20 PF 4Q20 PF 1Q21 PF 2Q21 3Q21( 1)
CoR TTM CoR TTM PF W/BKIABKIA LLPsGroup LLPs
NEW MACRO PROJECTIONS (POST -INE REVISIONS)
IMPLY A SMALL VARIATION
Spain Real GDP(2) – Central scenario, rebased to 100=FY19
88
92
96
100
104
2019 2020 2021E 2022E 2023E
Previous projection
Current projection
3Q21 P&L AND BALANCE SHEET
Upgrading FY21 PF CoR(4) guidance to <30 bps (from <40 bps)
GROSS CREDIT
EXPOSURE AND LLPS BY STAGE
STAGE 1
332.6
STAGE 2
36.2
STAGE 3
14.0
1.2 1.9 5.8
Exposure(3)
LLP allowances(3)
-1.9% -0.2% -0.4%
-0.1% -1.7% -0.2%
COVID RESERVES
UNUSED IN Q3
€1.4 BnStable qoq
€Bn and % qoq
COVID reserves, 30 Sep. 2021
24
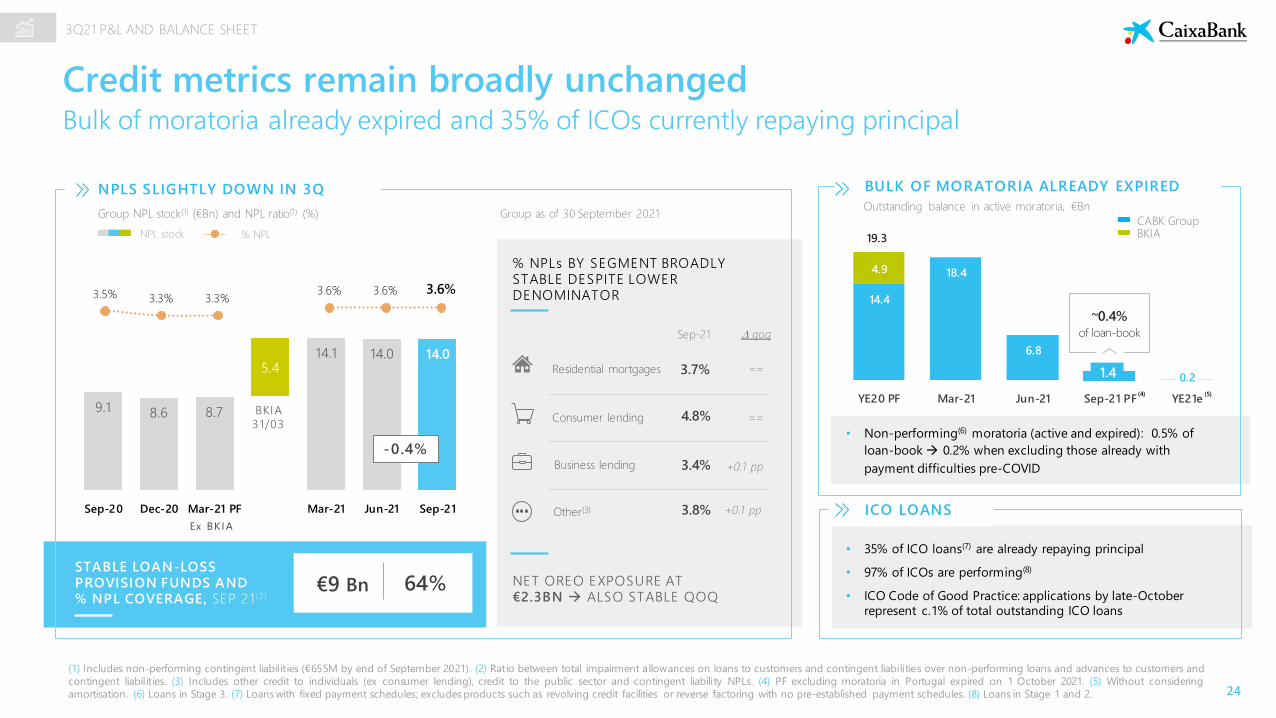
Credit metrics remain broadly unchangedBulk of moratoria already expired and 35% of ICOs currently repaying principal
NPLS SLIGHTLY DOWN IN 3Q
Group NPL stock(1) (€Bn) and NPL ratio(1) (%)
NPL stock % NPL
% NPLs BY SEGMENT BROADLY STABLE DESPITE LOWER DENOMINATOR
(1) Includes non-performing contingent liabilities (€655M by end of September 2021) . (2) Ratio between total impairment allowances on loans to customers and contingent liabilities over non-performing loans and advances to customers and
contingent liabilities. (3) Includes other credit to individuals (ex consumer lending), credit to the public sector and contingent liability NPLs. (4) PF excluding moratoria in Portugal expired on 1 October 2021. (5) Without considering
amortisation. (6) Loans in Stage 3. (7) Loans with fixed payment schedules; excludes products such as revolving credit facilities or reverse factoring with no pre-established payment schedules. (8) Loans in Stage 1 and 2.
9.1 8.6 8.7
14.1 14.0 14.05.4
Sep-20 Dec-20 Mar-21 PF Mar-21 Jun-21 Sep-21
3.5% 3.3% 3.3%3.6% 3.6% 3.6%
Ex BKIA
BKIA
31/03
-0.4%
€9 Bn 64%
BULK OF MORATORIA ALREADY EXPIRED
CABK GroupBKIA
Outstanding balance in active moratoria, €Bn
• Non-performing(6) moratoria (active and expired): 0.5% of
loan-book → 0.2% when excluding those already with
payment difficulties pre-COVID
14.4
18.4
6.8
1.4 0.2
4.9
YE20 PF Mar-21 Jun-21 Sep-21 PF YE21e
~0.4% of loan-book
19.3
(5)
3Q21 P&L AND BALANCE SHEET
qoq
Residential mortgages 3.7%
Business lending 3.4%
Other(3) 3.8%
Consumer lending 4.8%
==
==
+0.1 pp
+0.1 pp
Sep-21
Group as of 30 September 2021
NET OREO EXPOSURE AT €2.3BN → ALSO STABLE QOQ
• 35% of ICO loans(7) are already repaying principal
• 97% of ICOs are performing(8)
• ICO Code of Good Practice: applications by late-October represent c.1% of total outstanding ICO loans
ICO LOANS
(4)
STABLE LOAN-LOSS PROVISION FUNDS AND % NPL COVERAGE, SEP 21 (2 )
25
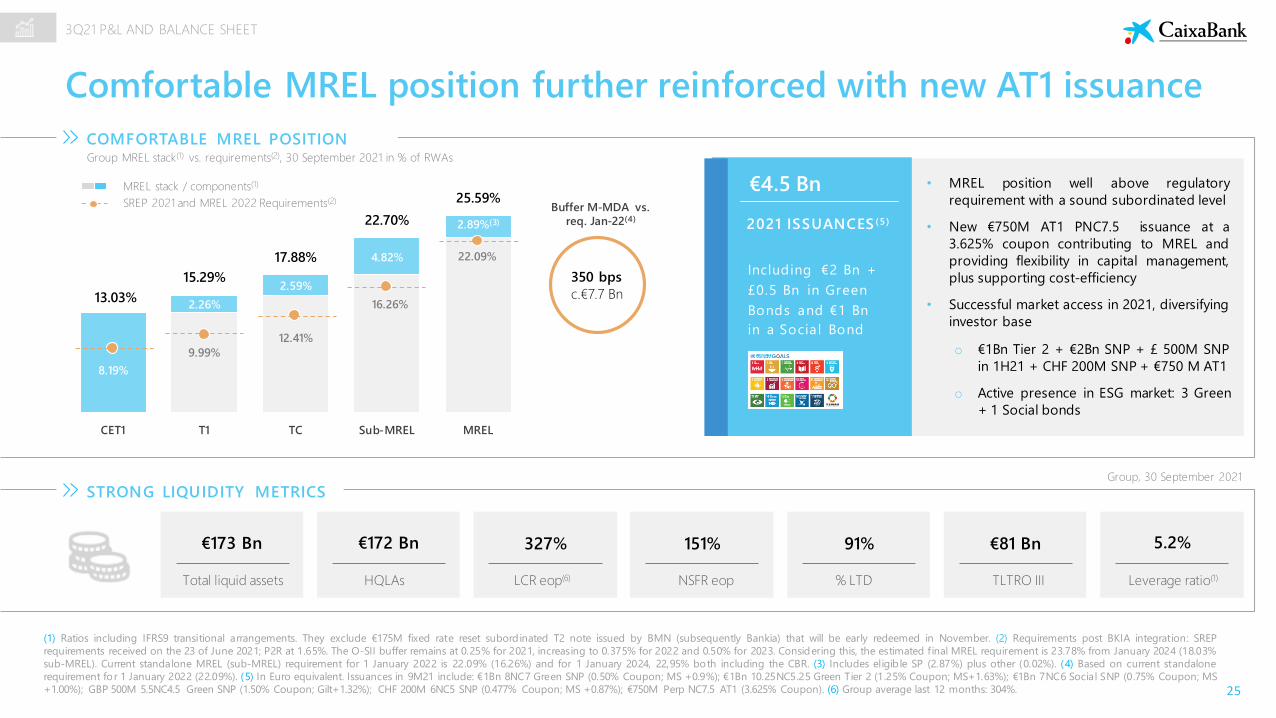
Comfortable MREL position further reinforced with new AT1 issuance
(1) Ratios including IFRS9 transitional arrangements. They exclude €175M fixed rate reset subordinated T2 note issued by BMN (subsequently Bankia) that will be early redeemed in November. (2) Requirements post BKIA integration: SREP
requirements received on the 23 of June 2021; P2R at 1.65%. The O-SII buffer remains at 0.25% for 2021, increasing to 0.375% for 2022 and 0.50% for 2023. Considering this, the estimated final MREL requirement is 23.78% from January 2024 (18.03%
sub-MREL). Current standalone MREL (sub-MREL) requirement for 1 January 2022 is 22.09% (16.26%) and for 1 January 2024, 22,95% both including the CBR. (3) Includes eligib le SP (2.87%) plus other (0.02%). (4) Based on current standalone
requirement for 1 January 2022 (22.09%). (5) In Euro equivalent. Issuances in 9M21 include: €1Bn 8NC7 Green SNP (0.50% Coupon; MS +0.9%); €1Bn 10.25NC5.25 Green Tier 2 (1.25% Coupon; MS+1.63%); €1Bn 7NC6 Social SNP (0.75% Coupon; MS
+1.00%); GBP 500M 5.5NC4.5 Green SNP (1.50% Coupon; Gilt+1.32%); CHF 200M 6NC5 SNP (0.477% Coupon; MS +0.87%); €750M Perp NC7.5 AT1 (3.625% Coupon). (6) Group average last 12 months: 304%.
Group, 30 September 2021
STRONG LIQUIDITY METRICS
Total liquid assets TLTRO IIIHQLAs LCR eop(6) NSFR eop % LTD Leverage ratio(1)
€173 Bn €172 Bn 327% 151% 91% €81 Bn 5.2%
COMFORTABLE MREL POSITIONGroup MREL stack(1) vs. requirements(2), 30 September 2021 in % of RWAs
Buffer M-MDA vs.
req. Jan-22(4)
350 bps
c.€7.7 Bn13.03%2.26%
2.59%
4.82%
2.89%(3)
8.19%
9.99%
12.41%
16.26%
22.09%
15.29%
17.88%
22.70%
25.59%
CET1 T1 TC Sub-MREL MREL
• MREL position well above regulatory
requirement with a sound subordinated level
• New €750M AT1 PNC7.5 issuance at a
3.625% coupon contributing to MREL and
providing flexibility in capital management,
plus supporting cost-efficiency
• Successful market access in 2021, diversifying
investor base
o €1Bn Tier 2 + €2Bn SNP + £ 500M SNP
in 1H21 + CHF 200M SNP + €750 M AT1
o Active presence in ESG market: 3 Green
+ 1 Social bonds
2021 ISSUANCES (5)
€4.5 Bn
Including €2 Bn +
£0.5 Bn in Green
Bonds and €1 Bn
in a Socia l Bond
MREL stack / components(1)
SREP 2021 and MREL 2022 Requirements(2)
3Q21 P&L AND BALANCE SHEET
26
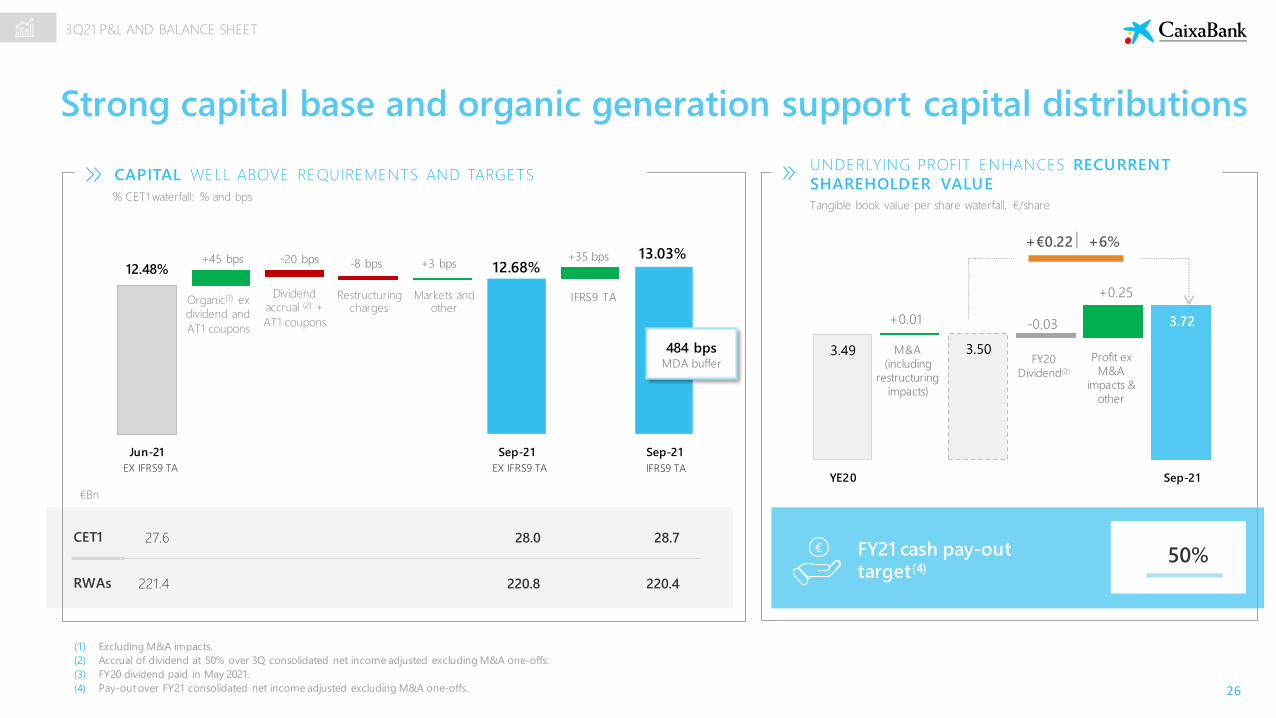
Strong capital base and organic generation support capital distributions
CET1
RWAs 220.8
28.0
220.4
28.7
(1) Excluding M&A impacts.
(2) Accrual of dividend at 50% over 3Q consolidated net income adjusted excluding M&A one-offs.
(3) FY20 dividend paid in May 2021.
(4) Pay-out over FY21 consolidated net income adjusted excluding M&A one-offs.
€Bn
50%
UNDERLYING PROFIT ENHANCES RECURRENT
SHAREHOLDER VALUE
Tangible book value per share waterfall, €/share
FY21 cash pay-out target(4)
221.4
27.6
CAPITAL WELL ABOVE REQUIREMENTS AND TARGETS
% CET1 waterfall: % and bps
€
3.49 3.50
3.72
YE20 Sep-21
+0.01
M&A
(including
restructuring
impacts)
FY20
Dividend(3)
Profit ex
M&A
impacts &
other
-0.03
+€0.22 +6%
+0.25
IFRS9 TA
3Q21 P&L AND BALANCE SHEET
12.48% 12.68%13.03%
Jun-21 Sep-21 Sep-21
Organic(1) ex
dividend and
AT1 coupons
Dividend
accrual (2) +
AT1 coupons
-20 bps
Markets and other
+45 bps +35 bps
IFRS9 TA
EX IFRS9 TA EX IFRS9 TA
+3 bps-8 bps
Restructuring charges
484 bps MDA buffer

27
APPENDIX
APPENDIX
28
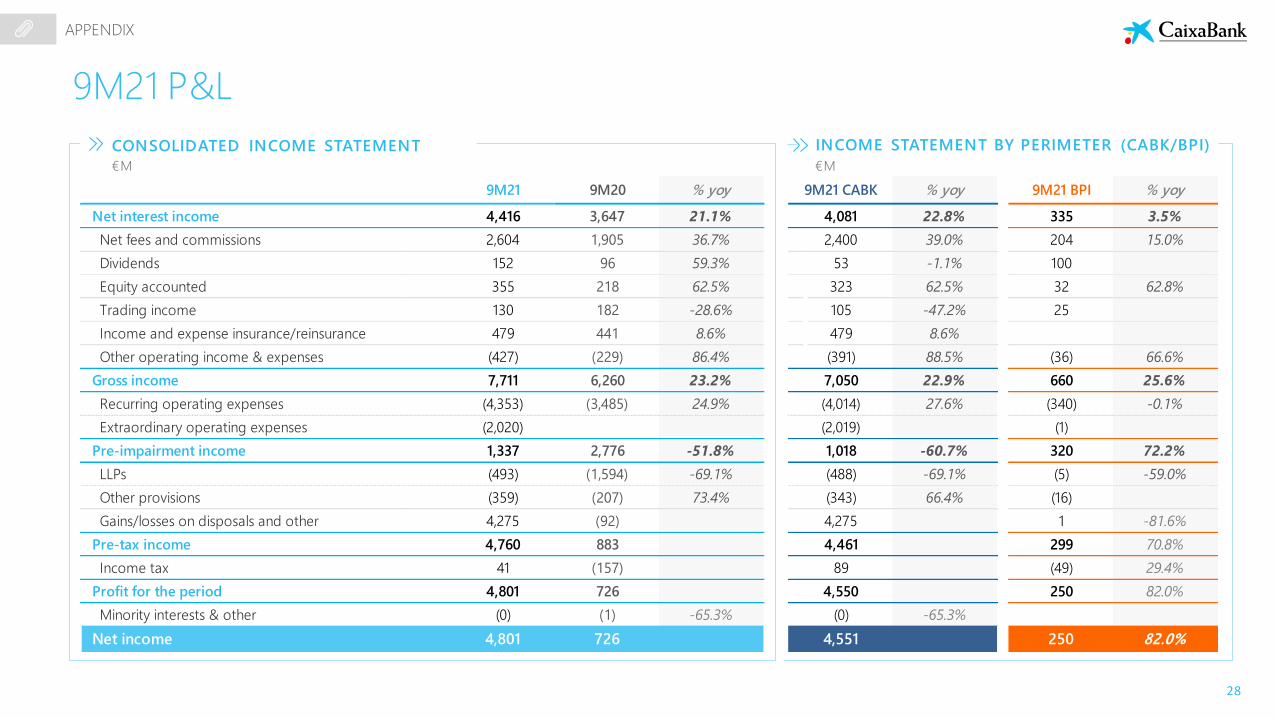
9M21 9M20 % yoy 9M21 CABK % yoy 9M21 BPI % yoy
Net interest income 4,416 3,647 21.1% 4,081 22.8% 335 3.5%
Net fees and commissions 2,604 1,905 36.7% 2,400 39.0% 204 15.0%
Dividends 152 96 59.3% 53 -1.1% 100
Equity accounted 355 218 62.5% 323 62.5% 32 62.8%
Trading income 130 182 -28.6% 105 -47.2% 25
Income and expense insurance/reinsurance 479 441 8.6% 479 8.6%
Other operating income & expenses (427) (229) 86.4% (391) 88.5% (36) 66.6%
Gross income 7,711 6,260 23.2% 7,050 22.9% 660 25.6%
Recurring operating expenses (4,353) (3,485) 24.9% (4,014) 27.6% (340) -0.1%
Extraordinary operating expenses (2,020) (2,019) (1)
Pre-impairment income 1,337 2,776 -51.8% 1,018 -60.7% 320 72.2%
LLPs (493) (1,594) -69.1% (488) -69.1% (5) -59.0%
Other provisions (359) (207) 73.4% (343) 66.4% (16)
Gains/losses on disposals and other 4,275 (92) 4,275 1 -81.6%
Pre-tax income 4,760 883 4,461 299 70.8%
Income tax 41 (157) 89 (49) 29.4%
Profit for the period 4,801 726 4,550 250 82.0%
Minority interests & other (0) (1) -65.3% (0) -65.3%
Net income 4,801 726 4,551 250 82.0%
9M21 P&L
CONSOLIDATED INCOME STATEMENT INCOME STATEMENT BY PERIMETER (CABK/BPI)
€M
APPENDIX
€M
29
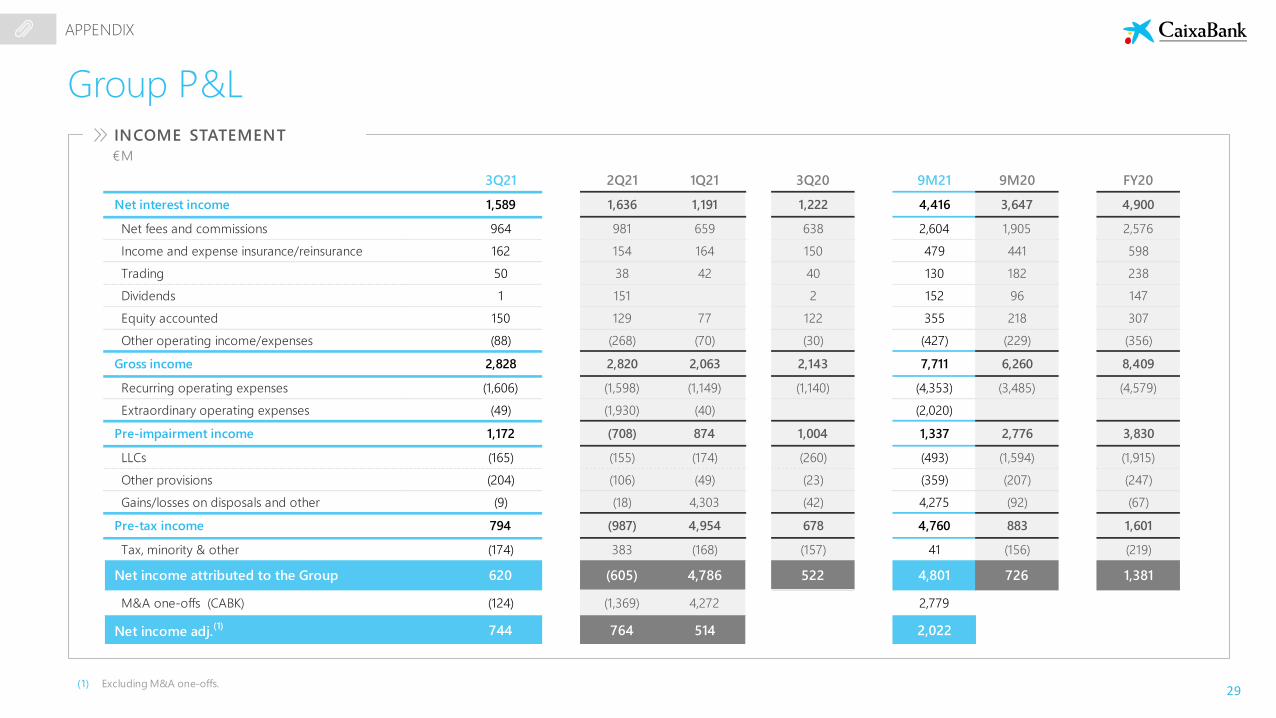
Group P&L
APPENDIX
INCOME STATEMENT
€M
(1) Excluding M&A one-offs.
3Q21 2Q21 1Q21 3Q20 9M21 9M20 FY20
Net interest income 1,589 1,636 1,191 1,222 4,416 3,647 4,900
Net fees and commissions 964 981 659 638 2,604 1,905 2,576
Income and expense insurance/reinsurance 162 154 164 150 479 441 598
Trading 50 38 42 40 130 182 238
Dividends 1 151 2 152 96 147
Equity accounted 150 129 77 122 355 218 307
Other operating income/expenses (88) (268) (70) (30) (427) (229) (356)
Gross income 2,828 2,820 2,063 2,143 7,711 6,260 8,409
Recurring operating expenses (1,606) (1,598) (1,149) (1,140) (4,353) (3,485) (4,579)
Extraordinary operating expenses (49) (1,930) (40) (2,020)
Pre-impairment income 1,172 (708) 874 1,004 1,337 2,776 3,830
LLCs (165) (155) (174) (260) (493) (1,594) (1,915)
Other provisions (204) (106) (49) (23) (359) (207) (247)
Gains/losses on disposals and other (9) (18) 4,303 (42) 4,275 (92) (67)
Pre-tax income 794 (987) 4,954 678 4,760 883 1,601
Tax, minority & other (174) 383 (168) (157) 41 (156) (219)
Net income attributed to the Group 620 (605) 4,786 522 4,801 726 1,381
M&A one-offs (CABK) (124) (1,369) 4,272 2,779
Net income adj.(1) 744 764 514 2,022
30
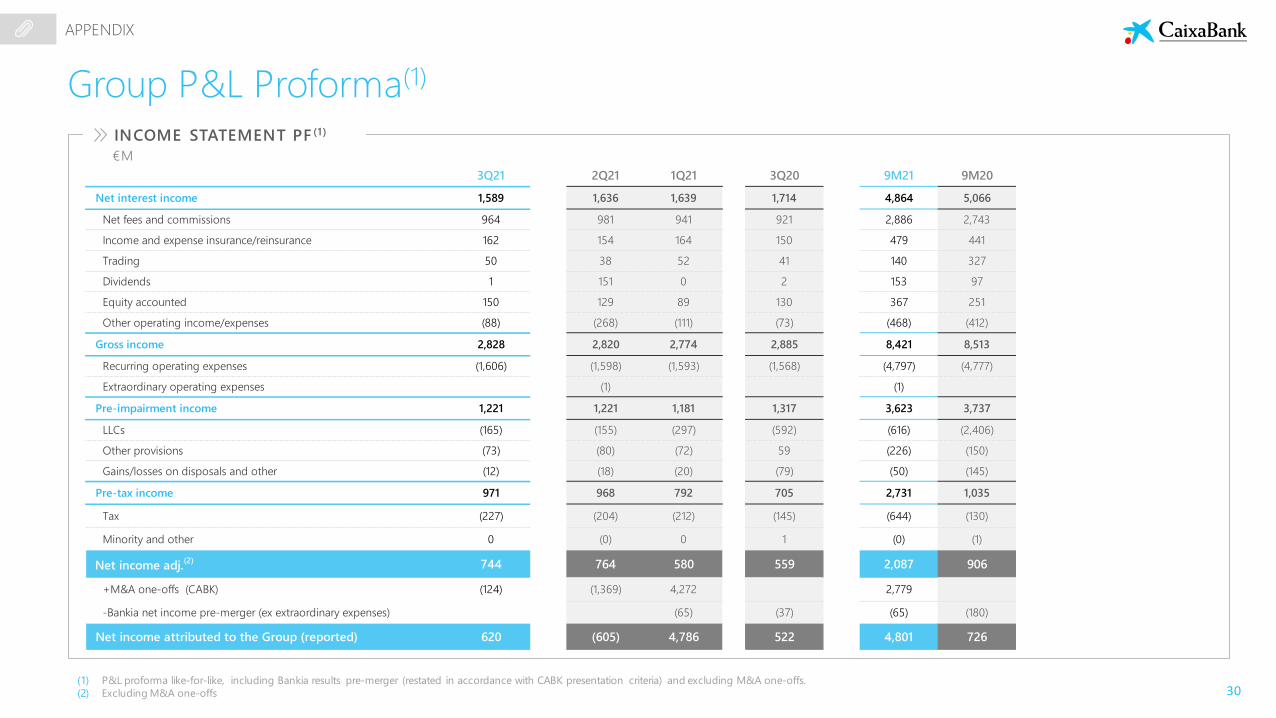
Group P&L Proforma(1)
APPENDIX
INCOME STATEMENT PF (1)
€M
(1) P&L proforma like-for-like, including Bankia results pre-merger (restated in accordance with CABK presentation criteria) and excluding M&A one-offs.
(2) Excluding M&A one-offs
3Q21 2Q21 1Q21 3Q20 9M21 9M20
Net interest income 1,589 1,636 1,639 1,714 4,864 5,066
Net fees and commissions 964 981 941 921 2,886 2,743
Income and expense insurance/reinsurance 162 154 164 150 479 441
Trading 50 38 52 41 140 327
Dividends 1 151 0 2 153 97
Equity accounted 150 129 89 130 367 251
Other operating income/expenses (88) (268) (111) (73) (468) (412)
Gross income 2,828 2,820 2,774 2,885 8,421 8,513
Recurring operating expenses (1,606) (1,598) (1,593) (1,568) (4,797) (4,777)
Extraordinary operating expenses (1) (1)
Pre-impairment income 1,221 1,221 1,181 1,317 3,623 3,737
LLCs (165) (155) (297) (592) (616) (2,406)
Other provisions (73) (80) (72) 59 (226) (150)
Gains/losses on disposals and other (12) (18) (20) (79) (50) (145)
Pre-tax income 971 968 792 705 2,731 1,035
Tax (227) (204) (212) (145) (644) (130)
Minority and other 0 (0) 0 1 (0) (1)
Net income adj.(2) 744 764 580 559 2,087 906
+M&A one-offs (CABK) (124) (1,369) 4,272 2,779
-Bankia net income pre-merger (ex extraordinary expenses) (65) (37) (65) (180)
Net income attributed to the Group (reported) 620 (605) 4,786 522 4,801 726
31
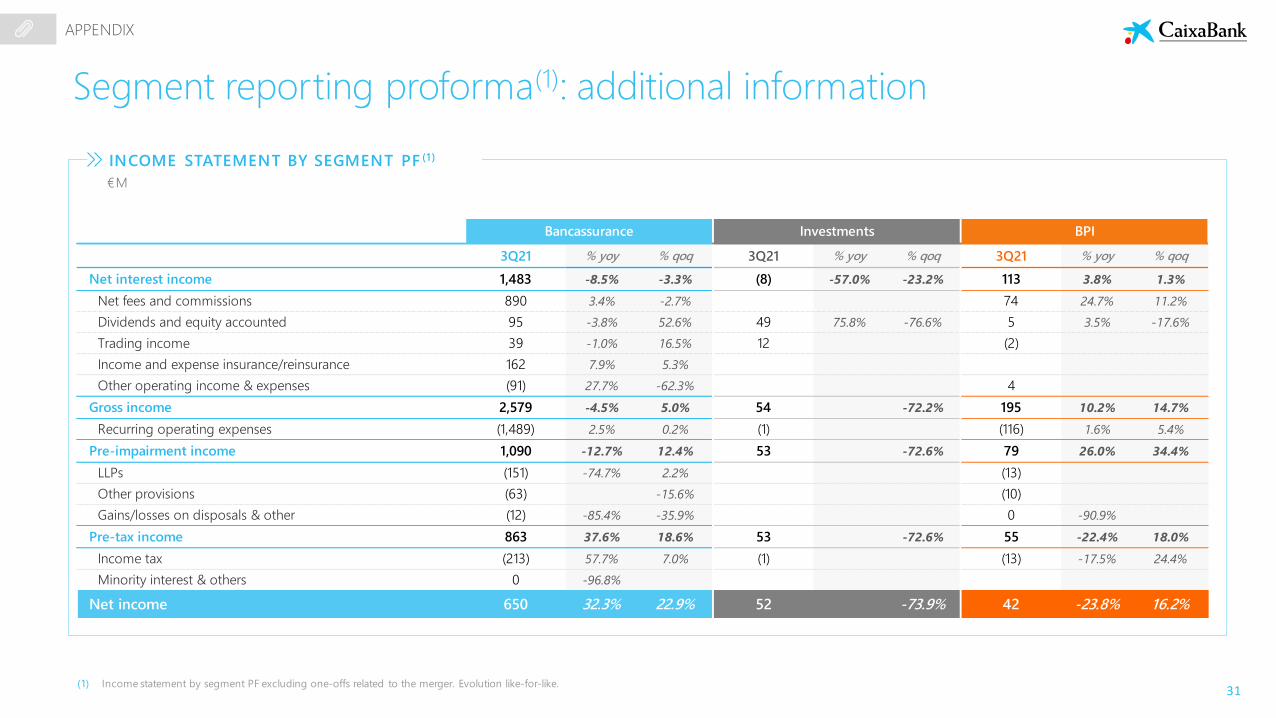
3Q21 % yoy % qoq 3Q21 % yoy % qoq 3Q21 % yoy % qoq
Net interest income 1,483 -8.5% -3.3% (8) -57.0% -23.2% 113 3.8% 1.3%
Net fees and commissions 890 3.4% -2.7% 74 24.7% 11.2%
Dividends and equity accounted 95 -3.8% 52.6% 49 75.8% -76.6% 5 3.5% -17.6%
Trading income 39 -1.0% 16.5% 12 (2)
Income and expense insurance/reinsurance 162 7.9% 5.3%
Other operating income & expenses (91) 27.7% -62.3% 4
Gross income 2,579 -4.5% 5.0% 54 -72.2% 195 10.2% 14.7%
Recurring operating expenses (1,489) 2.5% 0.2% (1) (116) 1.6% 5.4%
Pre-impairment income 1,090 -12.7% 12.4% 53 -72.6% 79 26.0% 34.4%
LLPs (151) -74.7% 2.2% (13)
Other provisions (63) -15.6% (10)
Gains/losses on disposals & other (12) -85.4% -35.9% 0 -90.9%
Pre-tax income 863 37.6% 18.6% 53 -72.6% 55 -22.4% 18.0%
Income tax (213) 57.7% 7.0% (1) (13) -17.5% 24.4%
Minority interest & others 0 -96.8%
Net income 650 32.3% 22.9% 52 -73.9% 42 -23.8% 16.2%
Bancassurance Investments BPI
Segment reporting proforma(1): additional information
€M
APPENDIX
INCOME STATEMENT BY SEGMENT PF (1)
(1) Income statement by segment PF excluding one-offs related to the merger. Evolution like-for-like.
32
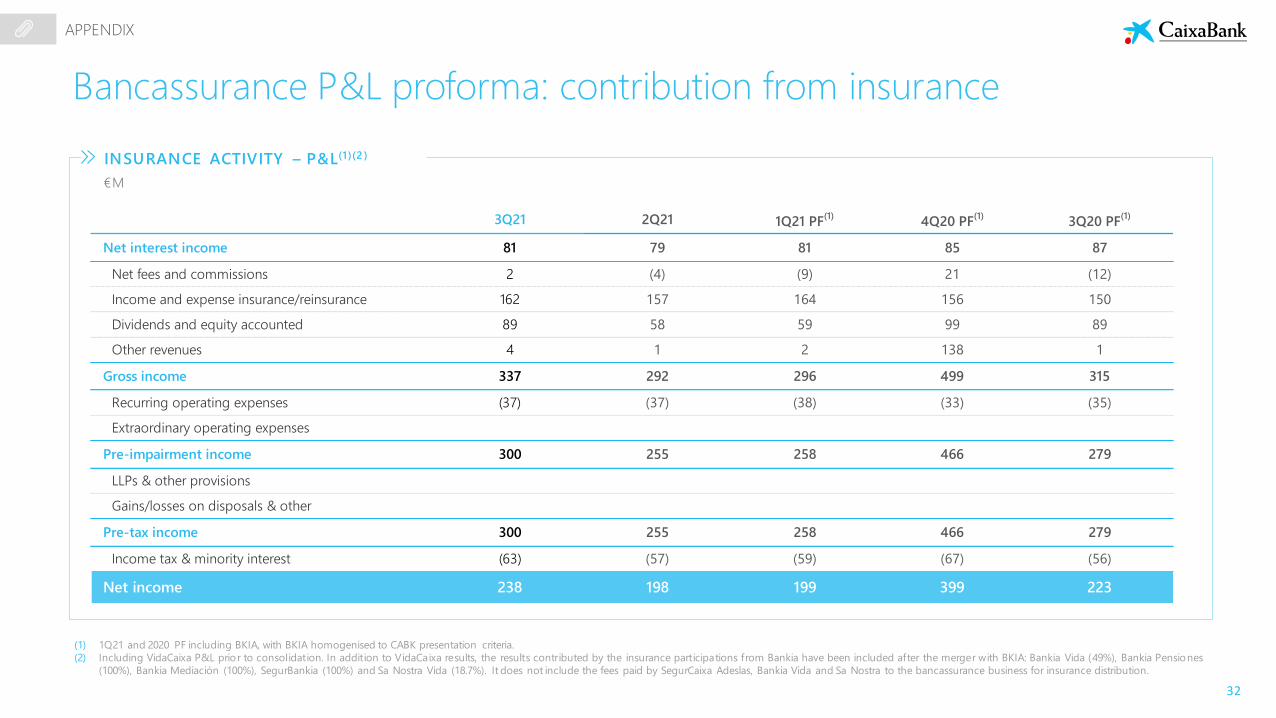
Bancassurance P&L proforma: contribution from insurance
(1) 1Q21 and 2020 PF including BKIA, with BKIA homogenised to CABK presentation criteria.
(2) Including VidaCaixa P&L prior to consolidation. In addition to VidaCaixa results, the results contributed by the insurance participations from Bankia have been included after the merger with BKIA: Bankia Vida (49%), Bankia Pensiones
(100%), Bankia Mediación (100%), SegurBankia (100%) and Sa Nostra Vida (18.7%). It does not include the fees paid by SegurCaixa Adeslas, Bankia Vida and Sa Nostra to the bancassurance business for insurance distribution.
APPENDIX
€M
INSURANCE ACTIVITY – P&L(1)(2 )
3Q21 2Q21 1Q21 PF(1)
4Q20 PF(1)
3Q20 PF(1)
Net interest income 81 79 81 85 87
Net fees and commissions 2 (4) (9) 21 (12)
Income and expense insurance/reinsurance 162 157 164 156 150
Dividends and equity accounted 89 58 59 99 89
Other revenues 4 1 2 138 1
Gross income 337 292 296 499 315
Recurring operating expenses (37) (37) (38) (33) (35)
Extraordinary operating expenses
Pre-impairment income 300 255 258 466 279
LLPs & other provisions
Gains/losses on disposals & other
Pre-tax income 300 255 258 466 279
Income tax & minority interest (63) (57) (59) (67) (56)
Net income 238 198 199 399 223
33
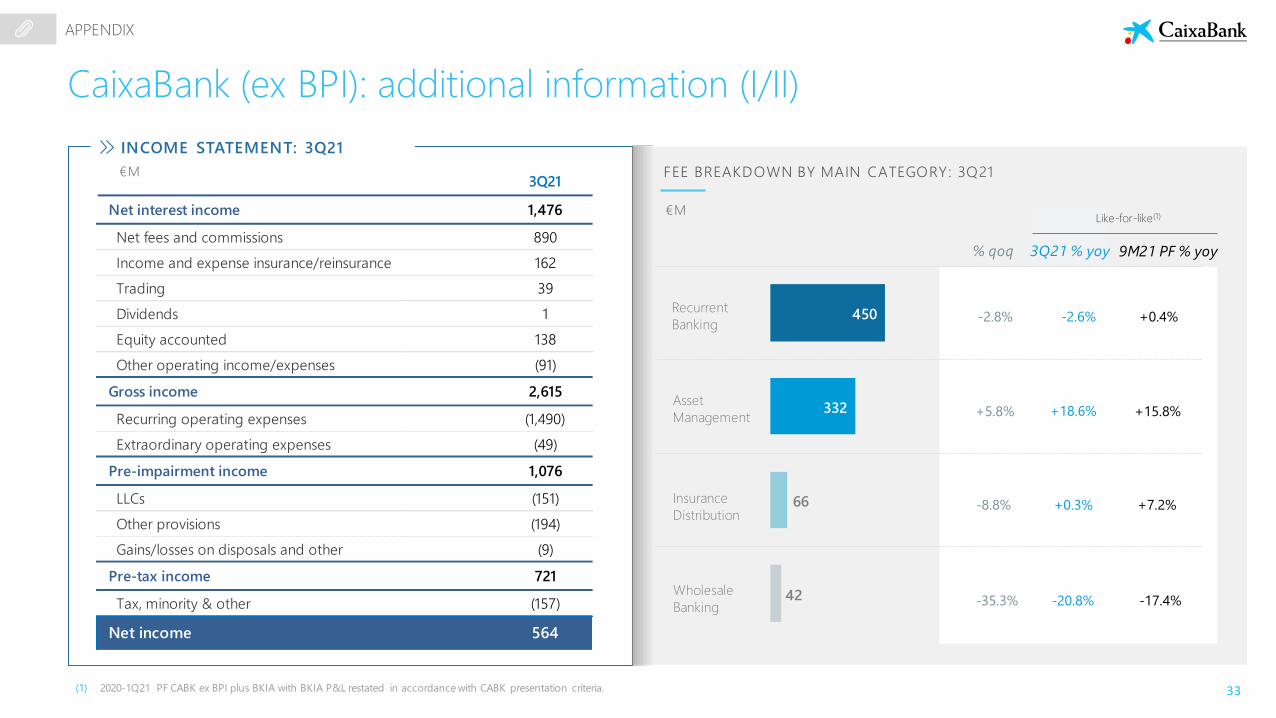
450
332
66
42
CaixaBank (ex BPI): additional information (I/II)
€M
Insurance
Distribution
Recurrent
Banking
Asset
Management
Wholesale
Banking
% qoq
-2.8%
+5.8%
-8.8%
-35.3%
APPENDIX
3Q21
Net interest income 1,476
Net fees and commissions 890
Income and expense insurance/reinsurance 162
Trading 39
Dividends 1
Equity accounted 138
Other operating income/expenses (91)
Gross income 2,615
Recurring operating expenses (1,490)
Extraordinary operating expenses (49)
Pre-impairment income 1,076
LLCs (151)
Other provisions (194)
Gains/losses on disposals and other (9)
Pre-tax income 721
Tax, minority & other (157)
Net income 564
FEE BREAKDOWN BY MAIN CATEGORY: 3Q21
INCOME STATEMENT: 3Q21
€M
(1) 2020-1Q21 PF CABK ex BPI plus BKIA with BKIA P&L restated in accordance with CABK presentation criteria.
Like-for-like(1)
9M21 PF % yoy
+0.4%
+15.8%
+7.2%
-17.4%
3Q21 % yoy
-2.6%
+18.6%
+0.3%
-20.8%
34
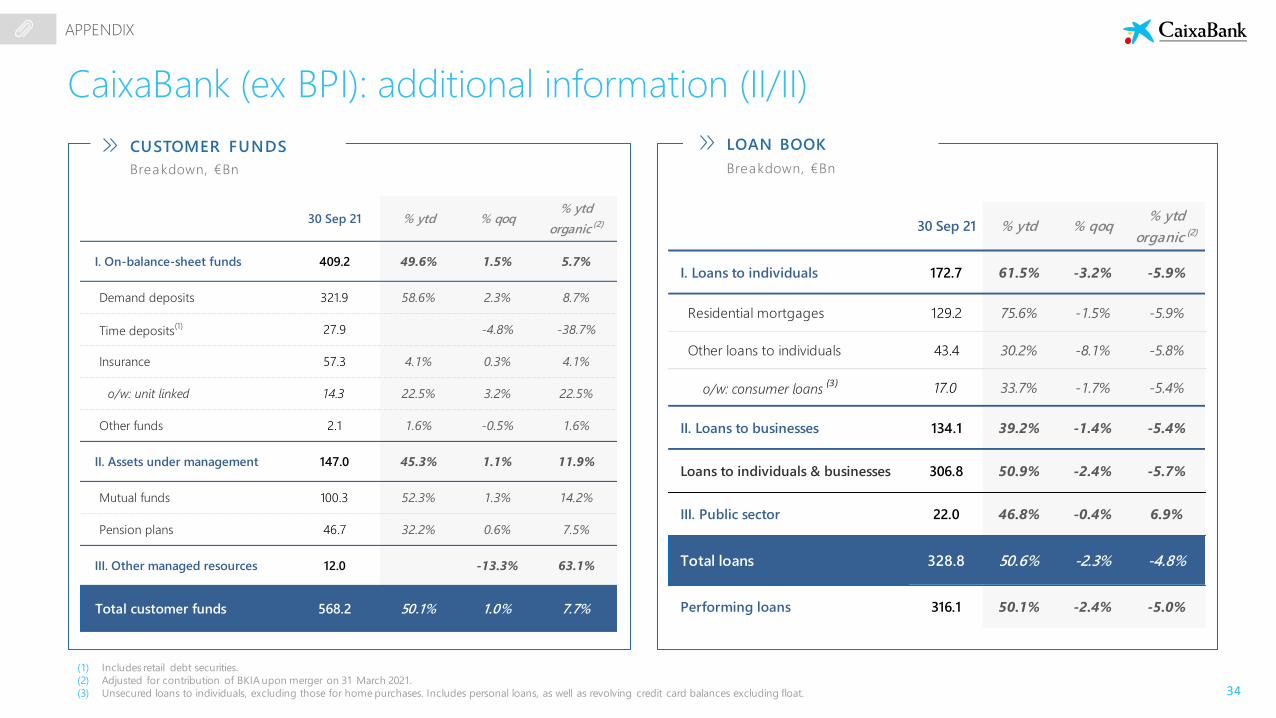
Breakdown, €Bn
(1) Includes retail debt securities.
(2) Adjusted for contribution of BKIA upon merger on 31 March 2021.
(3) Unsecured loans to individuals, excluding those for home purchases. Includes personal loans, as well as revolving credit card balances excluding float.
APPENDIX
CaixaBank (ex BPI): additional information (II/II)
CUSTOMER FUNDS LOAN BOOK
Breakdown, €Bn
30 Sep 21 % ytd % qoq% ytd
organic(2)
I. On-balance-sheet funds 409.2 49.6% 1.5% 5.7%
Demand deposits 321.9 58.6% 2.3% 8.7%
Time deposits(1) 27.9 -4.8% -38.7%
Insurance 57.3 4.1% 0.3% 4.1%
o/w: unit linked 14.3 22.5% 3.2% 22.5%
Other funds 2.1 1.6% -0.5% 1.6%
II. Assets under management 147.0 45.3% 1.1% 11.9%
Mutual funds 100.3 52.3% 1.3% 14.2%
Pension plans 46.7 32.2% 0.6% 7.5%
III. Other managed resources 12.0 -13.3% 63.1%
Total customer funds 568.2 50.1% 1.0% 7.7%
30 Sep 21 % ytd % qoq% ytd
organic (2)
I. Loans to individuals 172.7 61.5% -3.2% -5.9%
Residential mortgages 129.2 75.6% -1.5% -5.9%
Other loans to individuals 43.4 30.2% -8.1% -5.8%
o/w: consumer loans(3) 17.0 33.7% -1.7% -5.4%
II. Loans to businesses 134.1 39.2% -1.4% -5.4%
Loans to individuals & businesses 306.8 50.9% -2.4% -5.7%
III. Public sector 22.0 46.8% -0.4% 6.9%
Total loans 328.8 50.6% -2.3% -4.8%
Performing loans 316.1 50.1% -2.4% -5.0%
35
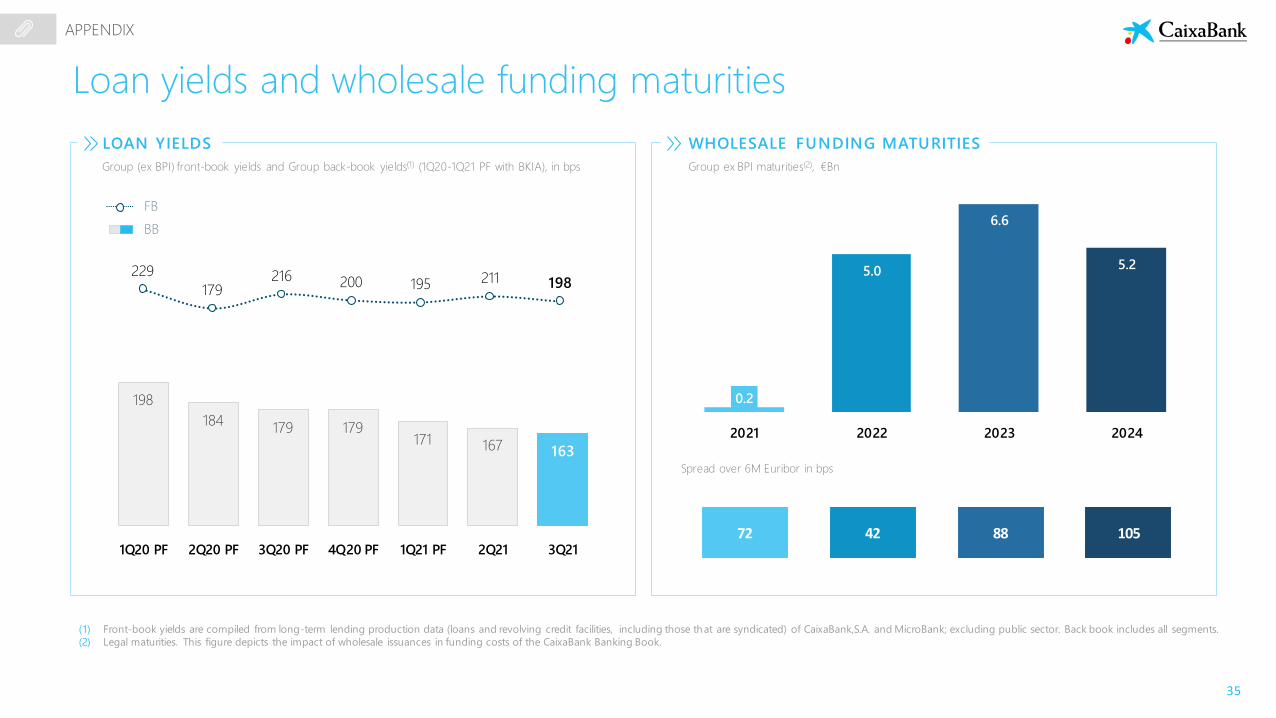
Loan yields and wholesale funding maturities
LOAN YIELDS
Group (ex BPI) front-book yields and Group back-book yields(1) (1Q20-1Q21 PF with BKIA), in bps
198
184179 179
171 167 163
1Q20 PF 2Q20 PF 3Q20 PF 4Q20 PF 1Q21 PF 2Q21 3Q21
229
179216 200 195 211 198
BB
FB
WHOLESALE FUNDING MATURITIES
Group ex BPI maturities(2), €Bn
0.2
5.0
6.6
5.2
2021 2022 2023 2024
(1) Front-book yields are compiled from long-term lending production data (loans and revolving credit facilities, including those that are syndicated) of CaixaBank,S.A. and MicroBank; excluding public sector. Back book includes all segments.
(2) Legal maturities. This figure depicts the impact of wholesale issuances in funding costs of the CaixaBank Banking Book.
APPENDIX
Spread over 6M Euribor in bps
72 42 10588
36
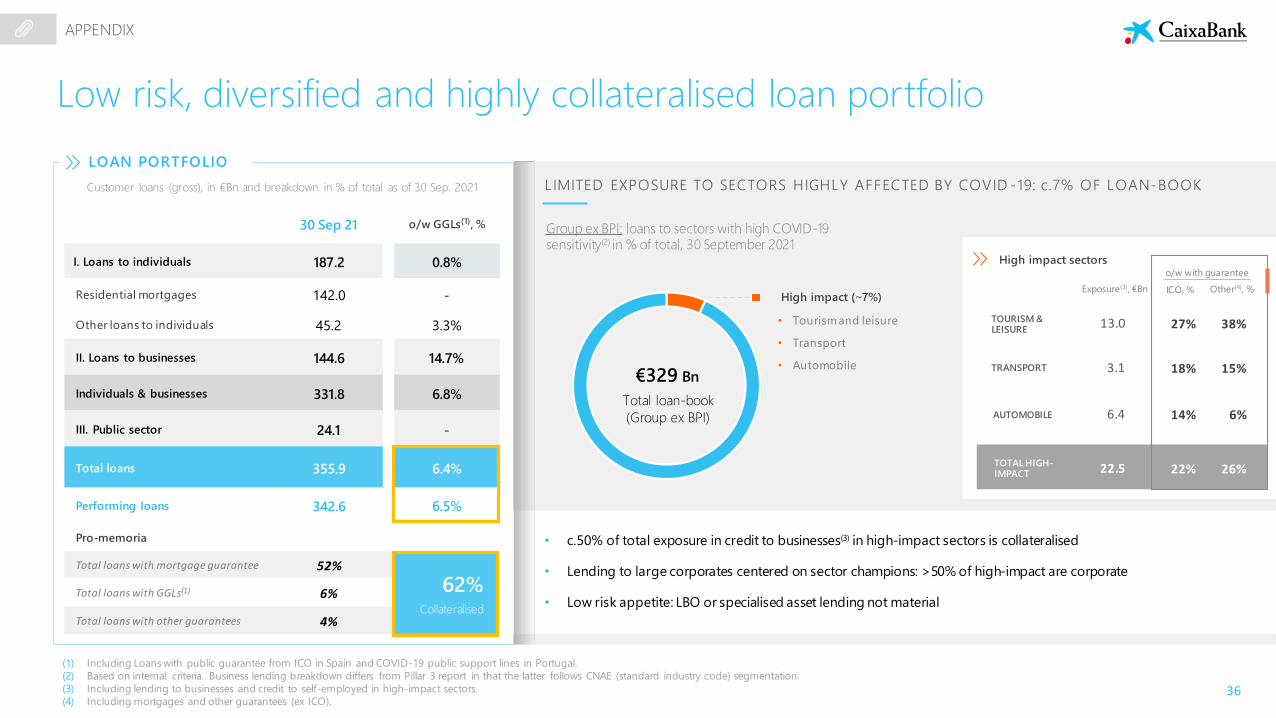
Low risk, diversified and highly collateralised loan portfolio
(1) Including Loans with public guarantee from ICO in Spain and COVID-19 public support lines in Portugal.
(2) Based on internal criteria. Business lending breakdown differs from Pillar 3 report in that the latter follows CNAE (standard industry code) segmentation.
(3) Including lending to businesses and credit to self-employed in high-impact sectors.
(4) Including mortgages and other guarantees (ex ICO).
APPENDIX
LOAN PORTFOLIO
Customer loans (gross), in €Bn and breakdown in % of total as of 30 Sep. 2021
30 Sep 21 o/w GGLs(1), %
I. Loans to individuals 187.2 0.8%
Residential mortgages 142.0 -
Other loans to individuals 45.2 3.3%
II. Loans to businesses 144.6 14.7%
Individuals & businesses 331.8 6.8%
III. Public sector 24.1 -
Total loans 355.9 6.4%
Performing loans 342.6 6.5%
Pro-memoria
Total loans with mortgage guarantee 52%
Total loans with GGLs(1) 6%
Total loans with other guarantees 4%
56%Collateralised
62%Collateralised
Group ex BPI: loans to sectors with high COVID-19 sensitivity(2) in % of total, 30 September 2021
LIMITED EXPOSURE TO SECTORS HIGHLY AFFECTED BY COVID -19: c.7% OF LOAN-BOOK
High impact sectors
Exposure(3), €Bn
TRANSPORT
TOURISM & LEISURE
AUTOMOBILE
13.0
3.1
6.4
ICO, %
27%
18%
14%
Other(4), %
38%
15%
6%
o/w with guarantee
TOTAL HIGH-IMPACT 22.5 22% 26%
• c.50% of total exposure in credit to businesses(3) in high-impact sectors is collateralised
• Lending to large corporates centered on sector champions: >50% of high-impact are corporate
• Low risk appetite: LBO or specialised asset lending not material
€329 Bn
High impact (~7%)
• Tourism and leisure
• Transport
• Automobile
Total loan-book
(Group ex BPI)
37
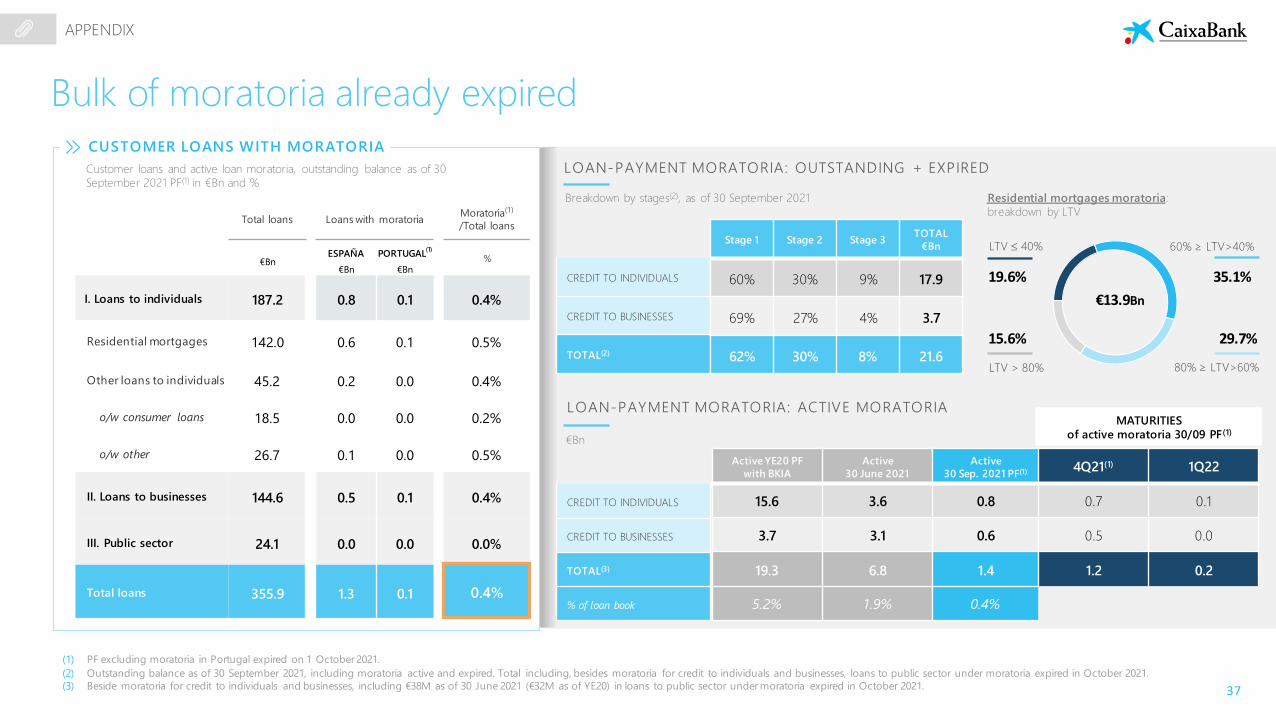
Total loans Loans with moratoriaMoratoria(1)
/Total loans
€BnESPAÑA
€Bn
PORTUGAL(1)
€Bn%
I. Loans to individuals 187.2 0.8 0.1 0.4%
Residential mortgages 142.0 0.6 0.1 0.5%
Other loans to individuals 45.2 0.2 0.0 0.4%
o/w consumer loans 18.5 0.0 0.0 0.2%
o/w other 26.7 0.1 0.0 0.5%
II. Loans to businesses 144.6 0.5 0.1 0.4%
III. Public sector 24.1 0.0 0.0 0.0%
Total loans 355.9 1.3 0.1 0.4%
(1) PF excluding moratoria in Portugal expired on 1 October 2021.
(2) Outstanding balance as of 30 September 2021, including moratoria active and expired. Total including, besides moratoria for credit to individuals and businesses, loans to public sector under moratoria expired in October 2021.
(3) Beside moratoria for credit to individuals and businesses, including €38M as of 30 June 2021 (€32M as of YE20) in loans to public sector under moratoria expired in October 2021.
Residential mortgages moratoria:
breakdown by LTV
Bulk of moratoria already expired
APPENDIX
CUSTOMER LOANS WITH MORATORIA
Customer loans and active loan moratoria, outstanding balance as of 30
September 2021 PF(1) in €Bn and %
LOAN-PAYMENT MORATORIA: ACTIVE MORATORIA
CREDIT TO INDIVIDUALS
CREDIT TO BUSINESSES
TOTAL(3)
% of loan book
Active YE20 PF
with BKIA
Active
30 June 2021
Active
30 Sep. 2021 PF(1) 4Q21(1) 1Q22
15.6 3.6 0.8 0.7 0.1
3.7 3.1 0.6 0.5 0.0
19.3 6.8 1.4 1.2 0.2
5.2% 1.9% 0.4%
MATURITIES
of active moratoria 30/09 PF(1)€Bn
19.6%
LTV > 80% 80% ≥ LTV>60%
60% ≥ LTV>40%LTV 40%
35.1%
29.7%15.6%
€13.9Bn
Breakdown by stages(2), as of 30 September 2021
CREDIT TO INDIVIDUALS
CREDIT TO BUSINESSES
TOTAL(2)
Stage 1 Stage 2 Stage 3TOTAL
€Bn
60% 30% 9% 17.9
69% 27% 4% 3.7
62% 30% 8% 21.6
LOAN-PAYMENT MORATORIA: OUTSTANDING + EXPIRED
38
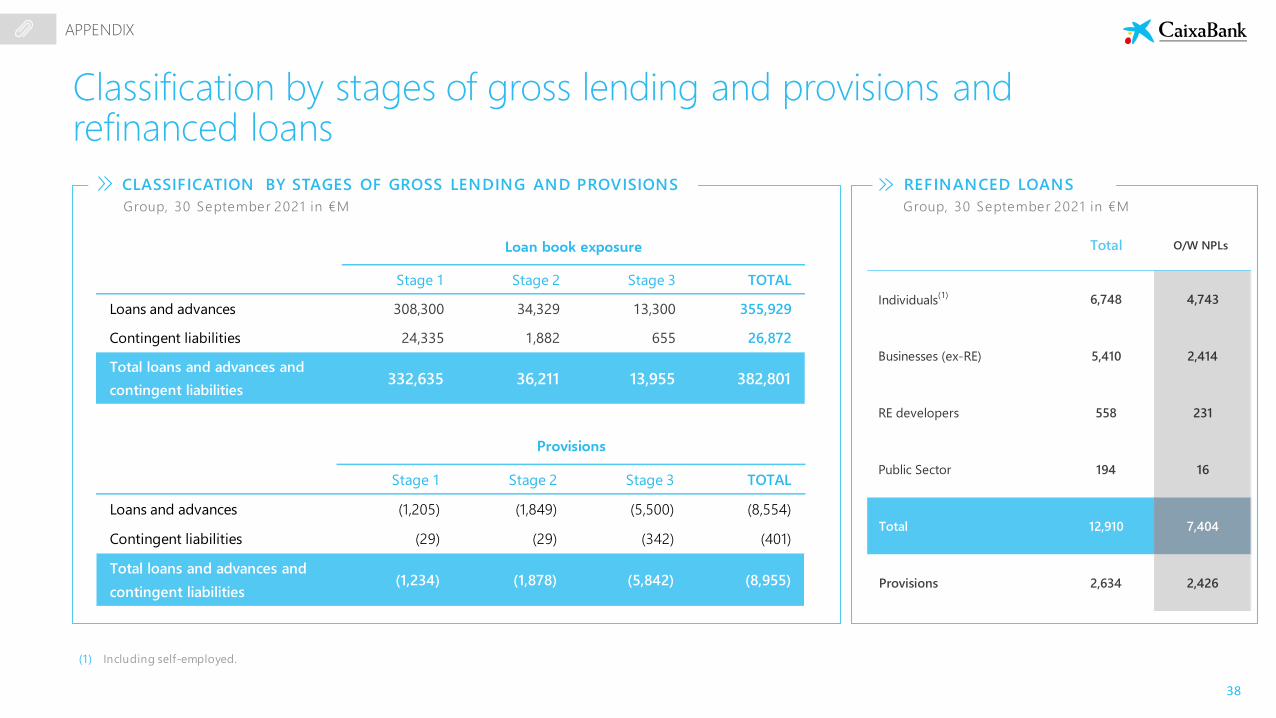
CLASSIFICATION BY STAGES OF GROSS LENDING AND PROVISIONS
Group, 30 September 2021 in €M
Classification by stages of gross lending and provisions and refinanced loans
(1) Including self-employed.
APPENDIX
Stage 1 Stage 2 Stage 3 TOTAL
Loans and advances 308,300 34,329 13,300 355,929
Contingent liabilities 24,335 1,882 655 26,872
Total loans and advances and
contingent liabilities332,635 36,211 13,955 382,801
Loan book exposure
Stage 1 Stage 2 Stage 3 TOTAL
Loans and advances (1,205) (1,849) (5,500) (8,554)
Contingent liabilities (29) (29) (342) (401)
Total loans and advances and
contingent liabilities(1,234) (1,878) (5,842) (8,955)
Provisions
REFINANCED LOANS
Total O/W NPLs
Individuals(1) 6,748 4,743
Businesses (ex-RE) 5,410 2,414
RE developers 558 231
Public Sector 194 16
Total 12,910 7,404
Provisions 2,634 2,426
Group, 30 September 2021 in €M
39
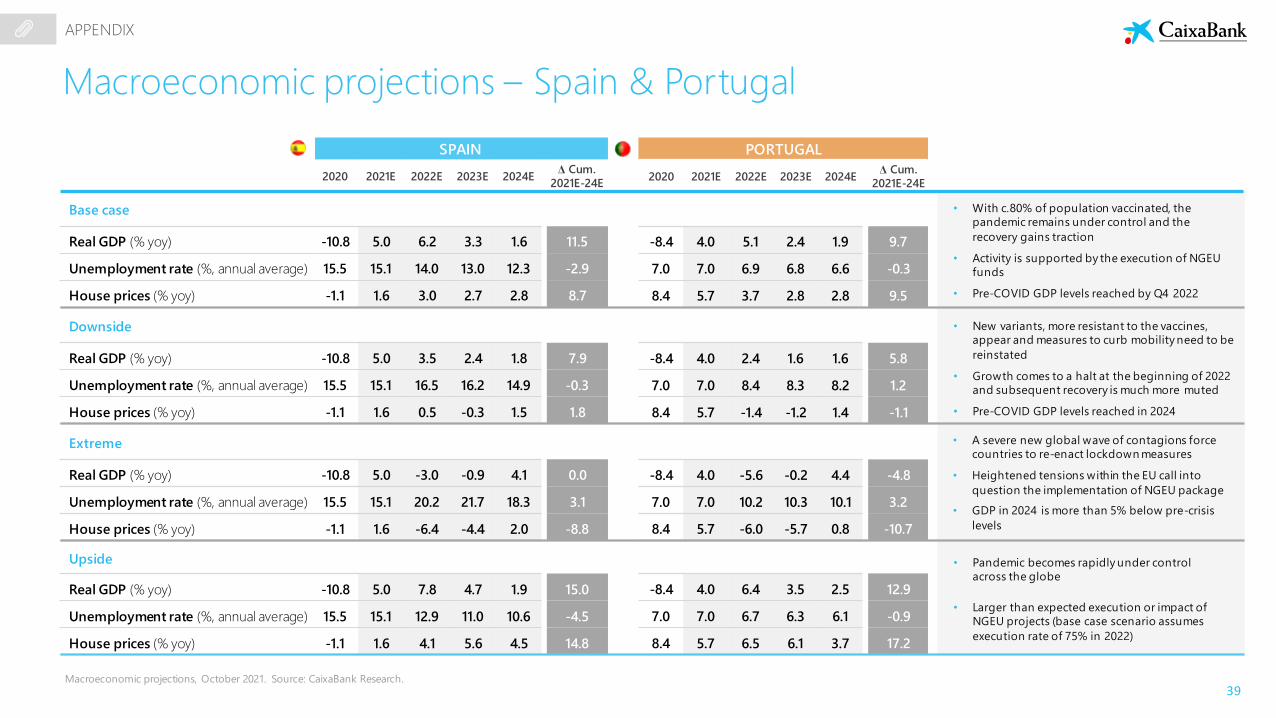
Macroeconomic projections – Spain & Portugal
SPAIN
2020 2021E 2022E 2023E 2024EΔ Cum.
2021E-24E
Base case
Real GDP (% yoy) -10.8 5.0 6.2 3.3 1.6 11.5
Unemployment rate (%, annual average) 15.5 15.1 14.0 13.0 12.3 -2.9
House prices (% yoy) -1.1 1.6 3.0 2.7 2.8 8.7
Downside
Real GDP (% yoy) -10.8 5.0 3.5 2.4 1.8 7.9
Unemployment rate (%, annual average) 15.5 15.1 16.5 16.2 14.9 -0.3
House prices (% yoy) -1.1 1.6 0.5 -0.3 1.5 1.8
Extreme
Real GDP (% yoy) -10.8 5.0 -3.0 -0.9 4.1 0.0
Unemployment rate (%, annual average) 15.5 15.1 20.2 21.7 18.3 3.1
House prices (% yoy) -1.1 1.6 -6.4 -4.4 2.0 -8.8
Upside
Real GDP (% yoy) -10.8 5.0 7.8 4.7 1.9 15.0
Unemployment rate (%, annual average) 15.5 15.1 12.9 11.0 10.6 -4.5
House prices (% yoy) -1.1 1.6 4.1 5.6 4.5 14.8
• With c.80% of population vaccinated, the
pandemic remains under control and the
recovery gains traction
• Activity is supported by the execution of NGEU
funds
• Pre-COVID GDP levels reached by Q4 2022
• New variants, more resistant to the vaccines,
appear and measures to curb mobility need to be
reinstated
• Growth comes to a halt at the beginning of 2022
and subsequent recovery is much more muted
• Pre-COVID GDP levels reached in 2024
• Pandemic becomes rapidly under control
across the globe
• Larger than expected execution or impact of
NGEU projects (base case scenario assumes
execution rate of 75% in 2022)
PORTUGAL
2020 2021E 2022E 2023E 2024EΔ Cum.
2021E-24E
-8.4 4.0 5.1 2.4 1.9 9.7
7.0 7.0 6.9 6.8 6.6 -0.3
8.4 5.7 3.7 2.8 2.8 9.5
-8.4 4.0 2.4 1.6 1.6 5.8
7.0 7.0 8.4 8.3 8.2 1.2
8.4 5.7 -1.4 -1.2 1.4 -1.1
-8.4 4.0 -5.6 -0.2 4.4 -4.8
7.0 7.0 10.2 10.3 10.1 3.2
8.4 5.7 -6.0 -5.7 0.8 -10.7
-8.4 4.0 6.4 3.5 2.5 12.9
7.0 7.0 6.7 6.3 6.1 -0.9
8.4 5.7 6.5 6.1 3.7 17.2
APPENDIX
Macroeconomic projections, October 2021. Source: CaixaBank Research.
• A severe new global wave of contagions force
countries to re-enact lockdown measures
• Heightened tensions within the EU call into
question the implementation of NGEU package
• GDP in 2024 is more than 5% below pre-crisis
levels
40
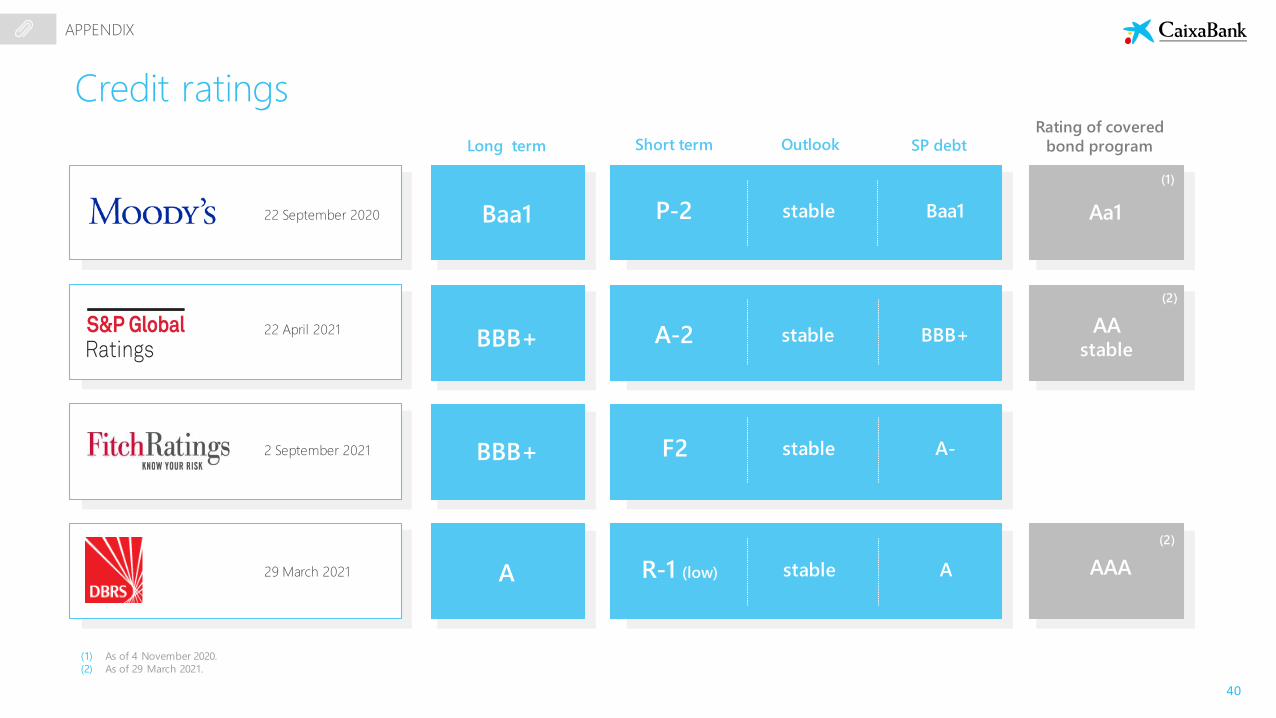
22 September 2020
22 April 2021
2 September 2021
29 March 2021
Long term
Baa1
BBB+
BBB+
A
Short term Outlook SP debt
P-2
A-2
F2
stable
stable
stable
R-1 (low) stable A
Baa1
BBB+
A-
Rating of covered
bond program
AAA
Aa1
AAstable
(2)
(1)
(2)
(1) As of 4 November 2020.
(2) As of 29 March 2021.
Credit ratings
APPENDIX
41
In addition to the financial information prepared in accordance with International Financial Reporting Standards (IFRS), this document includes certain Alternative Performance Measures (APMs) as defined in the guidelines on
Alternative Performance Measures issued by the European Securities and Markets Authority on 30 June 2015 (ESMA/2015/1057) (the “ESMA Guidelines”). CaixaBank uses certain APMs, which have not been audited, for a better
understanding of the company's financial performance. These measures are considered additional disclosures and in no case replace the financial information prepared under IFRS. Moreover, the way the Group defines and calculates
these measures may differ to the way similar measures are calculated by other companies. Accordingly, they may not be comparable. ESMA guidelines define an APM as a financial measure of historical or future performance, financial
position, or cash flows, other than a financial measure defined or specified in the applicable financial reporting framework. In accordance with these guidelines, following is a list of the APMs used, along with a reconciliation between
certain management indicators and the indicators presented in the consolidated financial statements prepared under IFRS.
Term Definition
AC Amortised cost.
ALCO Asset – Liability Committee.
AT1 Additional Tier 1: capital instruments that are continuous (no fixed maturity), including preferred shares and high contingent convertible secur ities.
AuM / AM Assets under Management, include mutual funds, pension plans and unit linked.
bps Basis points.
BFA Banco de Fomento Angola.
BoD Board of Directors.
CBR Combined Buffer Requirements.
CET1 Common Equity Tier 1.
CHF Swiss franc.
CIB Corporate and Institutional Banking.
Consumer loans (Group) Unsecured loans to individuals, excluding those for home purchases. Includes personal loans, as well as revolving credit card balances excluding float.
CoR Cost of risk: total allowances for insolvency risk divided by average lending, gross, plus contingent liabilities, using management criteria.
Core Cost/Income ratio Core cost-to-income ratio: operating expenses (administrative expenses, depreciation and amortisation) stripping out extraordinary expenses divided by core revenues for the last 12 months.
Core operating income Core revenues minus recurrent operating expenses.
Core revenues Sum of NII, Fees and other revenues from insurance (life-risk premia and equity accounted income from SegurCaixa Adeslas and other bancassurance stakes).
APPENDIX
Glossary (I/V)
42
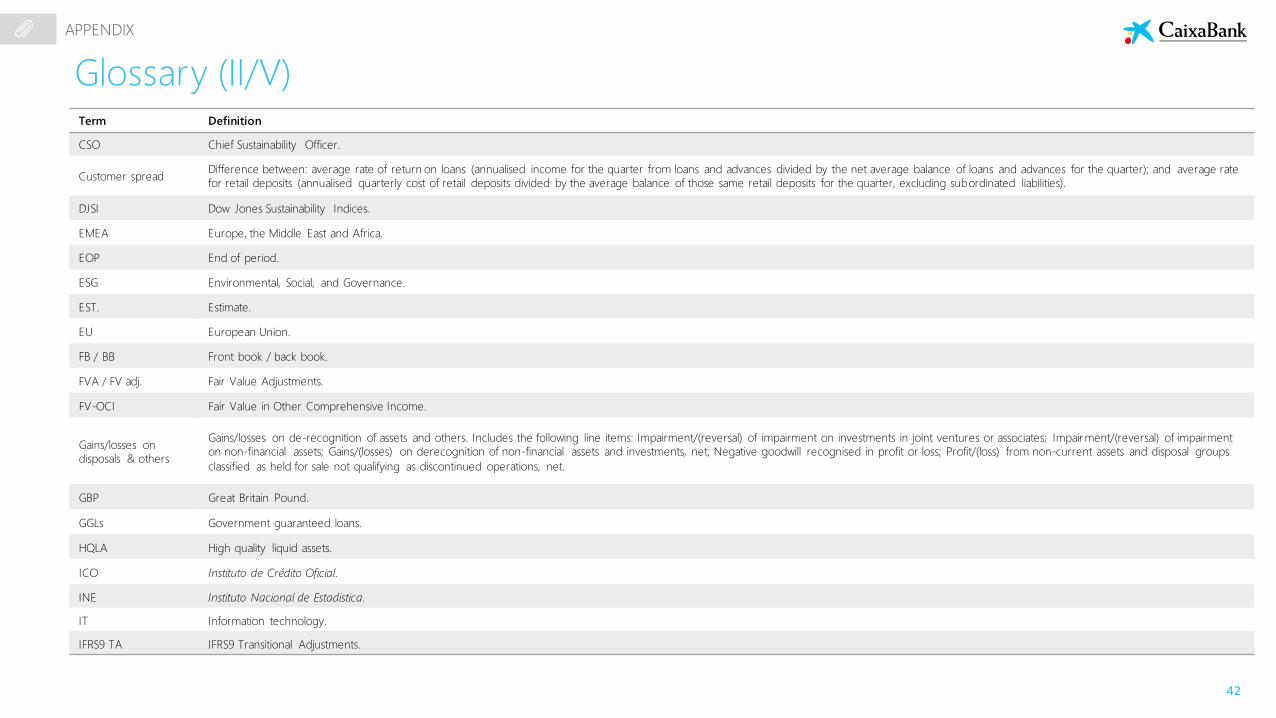
Term Definition
CSO Chief Sustainability Officer.
Customer spreadDifference between: average rate of return on loans (annualised income for the quarter from loans and advances divided by the net average balance of loans and advances for the quarter); and average rate
for retail deposits (annualised quarterly cost of retail deposits divided by the average balance of those same retail deposits for the quarter, excluding subordinated liabilities).
DJSI Dow Jones Sustainability Indices.
EMEA Europe, the Middle East and Africa.
EOP End of period.
ESG Environmental, Social, and Governance.
EST. Estimate.
EU European Union.
FB / BB Front book / back book.
FVA / FV adj. Fair Value Adjustments.
FV-OCI Fair Value in Other Comprehensive Income.
Gains/losses on
disposals & others
Gains/losses on de-recognition of assets and others. Includes the following line items: Impairment/(reversal) of impairment on investments in joint ventures or associates; Impairment/(reversal) of impairment
on non-financial assets; Gains/(losses) on derecognition of non-financial assets and investments, net; Negative goodwill recognised in profit or loss; Profit/(loss) from non-current assets and disposal groups
classified as held for sale not qualifying as discontinued operations, net.
GBP Great Britain Pound.
GGLs Government guaranteed loans.
HQLA High quality liquid assets.
ICO Instituto de Crédito Oficial.
INE Instituto Nacional de Estadistica.
IT Information technology.
IFRS9 TA IFRS9 Transitional Adjustments.
APPENDIX
Glossary (II/V)
43
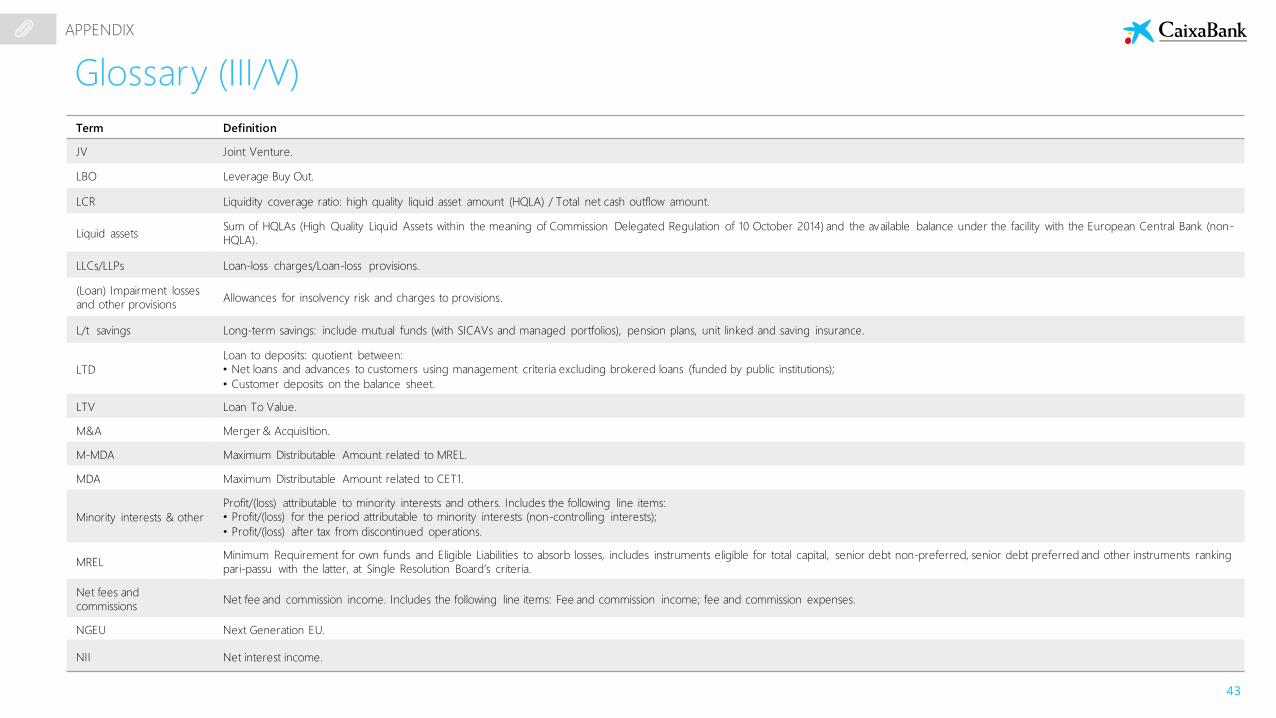
Term Definition
JV Joint Venture.
LBO Leverage Buy Out.
LCR Liquidity coverage ratio: high quality liquid asset amount (HQLA) / Total net cash outflow amount.
Liquid assetsSum of HQLAs (High Quality Liquid Assets within the meaning of Commission Delegated Regulation of 10 October 2014) and the available balance under the facility with the European Central Bank (non-
HQLA).
LLCs/LLPs Loan-loss charges/Loan-loss provisions.
(Loan) Impairment losses
and other provisionsAllowances for insolvency risk and charges to provisions.
L/t savings Long-term savings: include mutual funds (with SICAVs and managed portfolios), pension plans, unit linked and saving insurance.
LTD
Loan to deposits: quotient between:
• Net loans and advances to customers using management criteria excluding brokered loans (funded by public institutions);
• Customer deposits on the balance sheet.
LTV Loan To Value.
M&A Merger & AcquisItion.
M-MDA Maximum Distributable Amount related to MREL.
MDA Maximum Distributable Amount related to CET1.
Minority interests & other
Profit/(loss) attributable to minority interests and others. Includes the following line items:
• Profit/(loss) for the period attributable to minority interests (non-controlling interests);
• Profit/(loss) after tax from discontinued operations.
MRELMinimum Requirement for own funds and Eligible Liabilities to absorb losses, includes instruments eligible for total capital, senior debt non-preferred, senior debt preferred and other instruments ranking
pari-passu with the latter, at Single Resolution Board’s criteria.
Net fees and
commissionsNet fee and commission income. Includes the following line items: Fee and commission income; fee and commission expenses.
NGEU Next Generation EU.
NII Net interest income.
APPENDIX
Glossary (III/V)
44
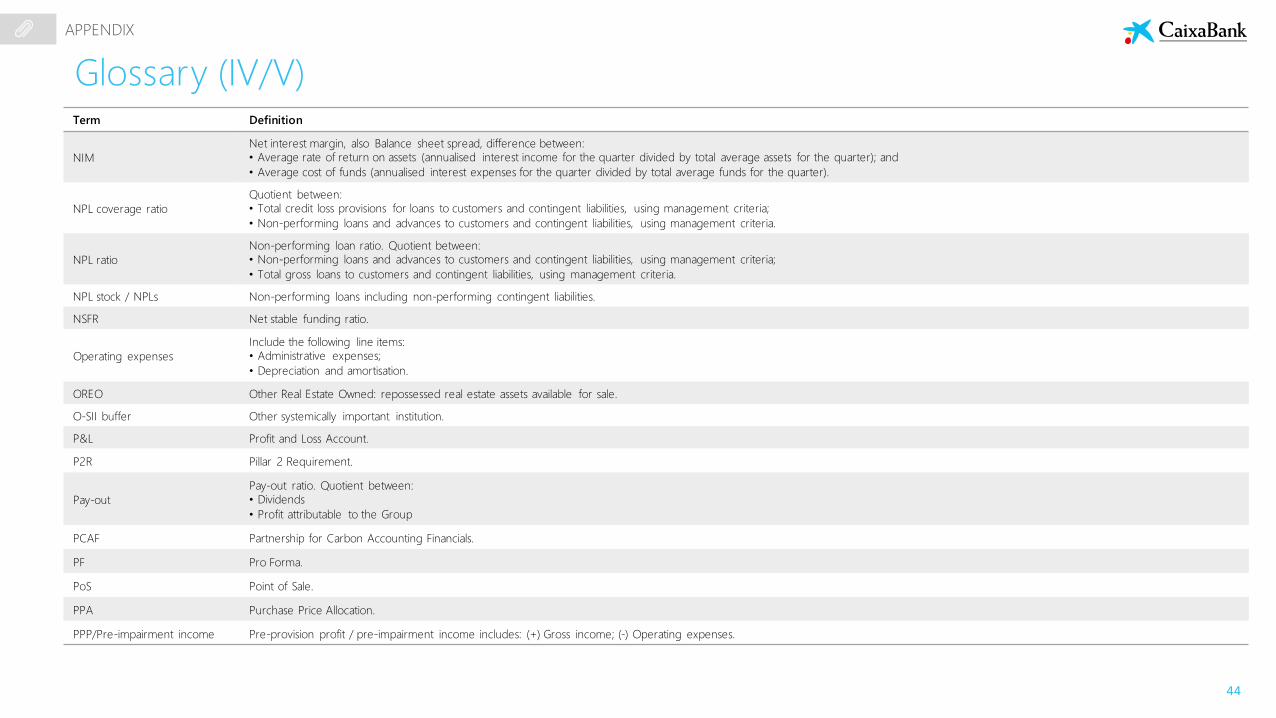
Term Definition
NIM
Net interest margin, also Balance sheet spread, difference between:
• Average rate of return on assets (annualised interest income for the quarter divided by total average assets for the quarter); and
• Average cost of funds (annualised interest expenses for the quarter divided by total average funds for the quarter).
NPL coverage ratio
Quotient between:
• Total credit loss provisions for loans to customers and contingent liabilities, using management criteria;
• Non-performing loans and advances to customers and contingent liabilities, using management criteria.
NPL ratio
Non-performing loan ratio. Quotient between:
• Non-performing loans and advances to customers and contingent liabilities, using management criteria;
• Total gross loans to customers and contingent liabilities, using management criteria.
NPL stock / NPLs Non-performing loans including non-performing contingent liabilities.
NSFR Net stable funding ratio.
Operating expenses
Include the following line items:
• Administrative expenses;
• Depreciation and amortisation.
OREO Other Real Estate Owned: repossessed real estate assets available for sale.
O-SII buffer Other systemically important institution.
P&L Profit and Loss Account.
P2R Pillar 2 Requirement.
Pay-out
Pay-out ratio. Quotient between:
• Dividends
• Profit attributable to the Group
PCAF Partnership for Carbon Accounting Financials.
PF Pro Forma.
PoS Point of Sale.
PPA Purchase Price Allocation.
PPP/Pre-impairment income Pre-provision profit / pre-impairment income includes: (+) Gross income; (-) Operating expenses.
APPENDIX
Glossary (IV/V)
45
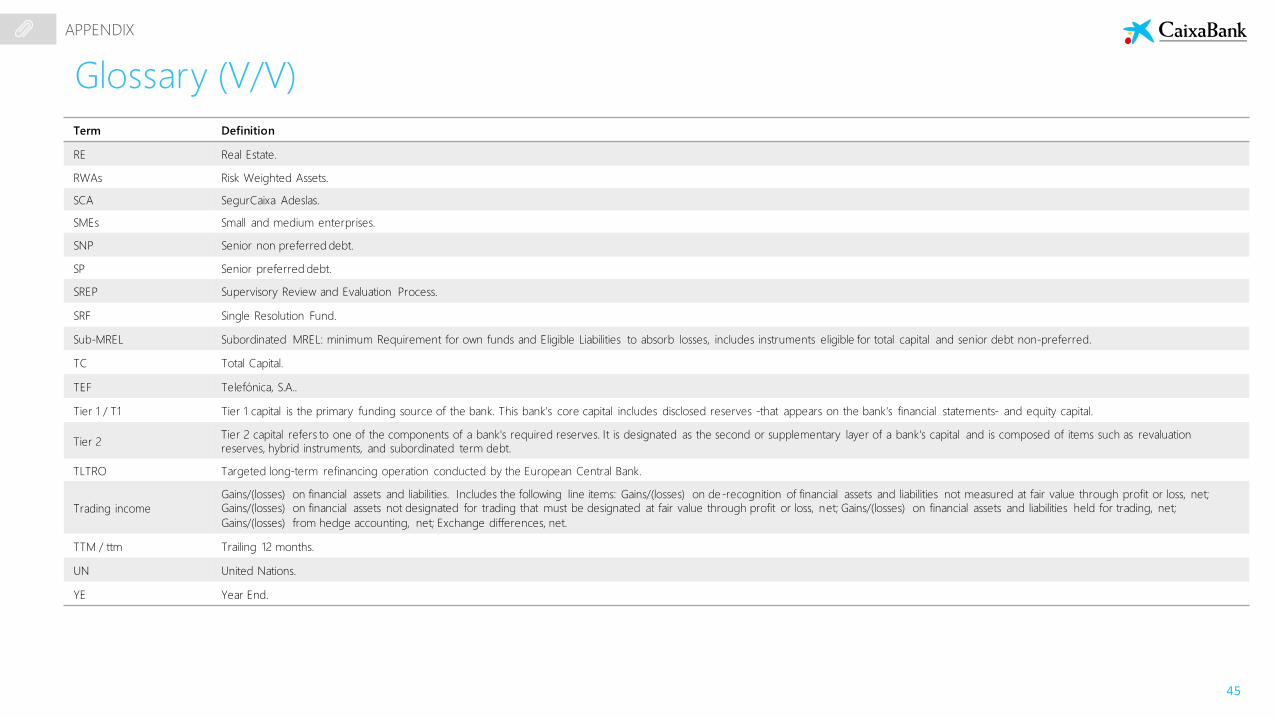
Term Definition
RE Real Estate.
RWAs Risk Weighted Assets.
SCA SegurCaixa Adeslas.
SMEs Small and medium enterprises.
SNP Senior non preferred debt.
SP Senior preferred debt.
SREP Supervisory Review and Evaluation Process.
SRF Single Resolution Fund.
Sub-MREL Subordinated MREL: minimum Requirement for own funds and Eligible Liabilities to absorb losses, includes instruments eligible for total capital and senior debt non-preferred.
TC Total Capital.
TEF Telefónica, S.A..
Tier 1 / T1 Tier 1 capital is the primary funding source of the bank. This bank's core capital includes disclosed reserves -that appears on the bank's financial statements- and equity capital.
Tier 2Tier 2 capital refers to one of the components of a bank's required reserves. It is designated as the second or supplementary layer of a bank's capital and is composed of items such as revaluation
reserves, hybrid instruments, and subordinated term debt.
TLTRO Targeted long-term refinancing operation conducted by the European Central Bank.
Trading income
Gains/(losses) on financial assets and liabilities. Includes the following line items: Gains/(losses) on de-recognition of financial assets and liabilities not measured at fair value through profit or loss, net;
Gains/(losses) on financial assets not designated for trading that must be designated at fair value through profit or loss, net; Gains/(losses) on financial assets and liabilities held for trading, net;
Gains/(losses) from hedge accounting, net; Exchange differences, net.
TTM / ttm Trailing 12 months.
UN United Nations.
YE Year End.
APPENDIX
Glossary (V/V)

+34 93 411 75 03
Av. Diagonal, 621-629 - Barcelona
Pintor Sorolla, 2-446002 Valencia
Spain
www.CaixaBank.com


![3Q21 [ENG] Results Presentation-Analyst](https://img.pdfslide.net/doc/110x75/62059ee21708c43c2d4570d9/3q21-eng-results-presentation-analyst.jpg)