Embed Size (px)
Citation preview

McCormick & Company, Inc.
September 30, 2021
3RD QUARTER 2021 FINANCIAL RESULTS AND OUTLOOK
The following slides accompany a September 30th, 2021, earnings release conference call. This information should be read in conjunction with the press release issued on that date.
FORWARD-LOOKING INFORMATIONCertain information contained in this presentation, including statements concerning expected performance, such as those relating to net sales, gross margins, earnings, cost savings, transaction and integration expenses, special charges, acquisitions, brand marketing support, volume and product mix, income tax expense and the impact of foreign currency rates are “forward-looking statements” within the meaning of Section 21E of the Securities Exchange Act of 1934, as amended. These statements may be identified by the use of words such as “may,” “will,” “expect,” “should,” “anticipate,” "intend," “believe” and “plan.” These statements may relate to: the impact of COVID-19 on our business, suppliers, consumers, customers, and employees; disruptions or inefficiencies in the supply chain, including any impact of COVID-19; the expected results of operations of businesses acquired by the company, including the acquisitions of Cholula and FONA; the expected impact of the inflationary cost environment, including commodities, packaging materials and transportation costs on our business; the expected impact of pricing actions on the company's results of operations and gross margins; the expected impact of factors affecting our supply chain, including transportation capacity, labor shortages and absenteeism; the expected impact of productivity improvements, including those associated with our Comprehensive Continuous Improvement ("CCI") program and global enablement initiative; expected working capital improvements; expectations regarding growth potential in various geographies and markets, including the impact from customer, channel, category, and e-commerce expansion; expected trends in net sales and earnings performance and other financial measures; the expected timing and costs of implementing our business transformation initiative, which includes the implementation of a global enterprise resource planning ("ERP") system; the expected impact of accounting pronouncements; the expectations of pension and postretirement plan contributions and anticipated charges associated with those plans; the holding period and market risks associated with financial instruments; the impact of foreign exchange fluctuations; the adequacy of internally generated funds and existing sources of liquidity, such as the availability of bank financing; the anticipated sufficiency of future cash flows to enable the payments of interest and repayment of short- and long-term debt as well as quarterly dividends and the ability to issue additional debt or equity securities; and expectations regarding purchasing shares of McCormick's common stock under the existing repurchase authorization.
These and other forward-looking statements are based on management’s current views and assumptions and involve risks and uncertainties that could significantly affect expected results. Results may be materially affected by factors such as: the company's ability to drive revenue growth; the company's ability to increase pricing to offset, or partially offset, inflationary pressures on the cost of our products; damage to the company's reputation or brand name; loss of brand relevance; increased private label use; product quality, labeling, or safety concerns; negative publicity about our products; actions by, and the financial condition of, competitors and customers; the longevity of mutually beneficial relationships with our large customers; the ability to identify, interpret and react to changes in consumer preferences and demand; business interruptions due to natural disasters, unexpected events or public health crises, including COVID-19; issues affecting the company's supply chain and raw materials, including fluctuations in the cost and availability of raw and packaging materials; government regulation, and changes in legal and regulatory requirements and enforcement practices; the lack of successful acquisition and integration of new businesses, including the acquisitions of Cholula and FONA; global economic and financial conditions generally, including the impact of the exit of the United Kingdom from the European Union, availability of financing, interest and inflation rates, and the imposition of tariffs, quotas, trade barriers and other similar restrictions; foreign currency fluctuations; the effects of increased level of debt service following the Cholula and FONA acquisitions as well as the effects that such increased debt service may have on the company's ability to borrow or the cost of any such additional borrowing, our credit rating, and our ability to react to certain economic and industry conditions; risks associated with the phase-out of LIBOR; impairments of indefinite-lived intangible assets; assumptions we have made regarding the investment return on retirement plan assets, and the costs associated with pension obligations; the stability of credit and capital markets; risks associated with the company's information technology systems, including the threat of data breaches and cyber-attacks; the company's inability to successfully implement our business transformation initiative; fundamental changes in tax laws; including interpretations and assumptions we have made, and guidance that may be issued, volatility in our effective tax rate; climate change; infringement of intellectual property rights, and those of customers; litigation, legal and administrative proceedings; the company's inability to achieve expected and/or needed cost savings or margin improvements; negative employee relations; and other risks described in the company's filings with the Securities and Exchange Commission.
Actual results could differ materially from those projected in the forward-looking statements. The company undertakes no obligation to update or revise publicly any forward-looking statements, whether as a result of new information, future events or otherwise, except as may be required by law.2

3
Lawrence KurziusChairman, President and Chief Executive Officer
THIRD QUARTER 2021 RESULTS REFLECT ROBUST AND SUSTAINED GROWTH MOMENTUM
4 1) Proforma including Cholula and FONA acquisitions; approximation of category sizes
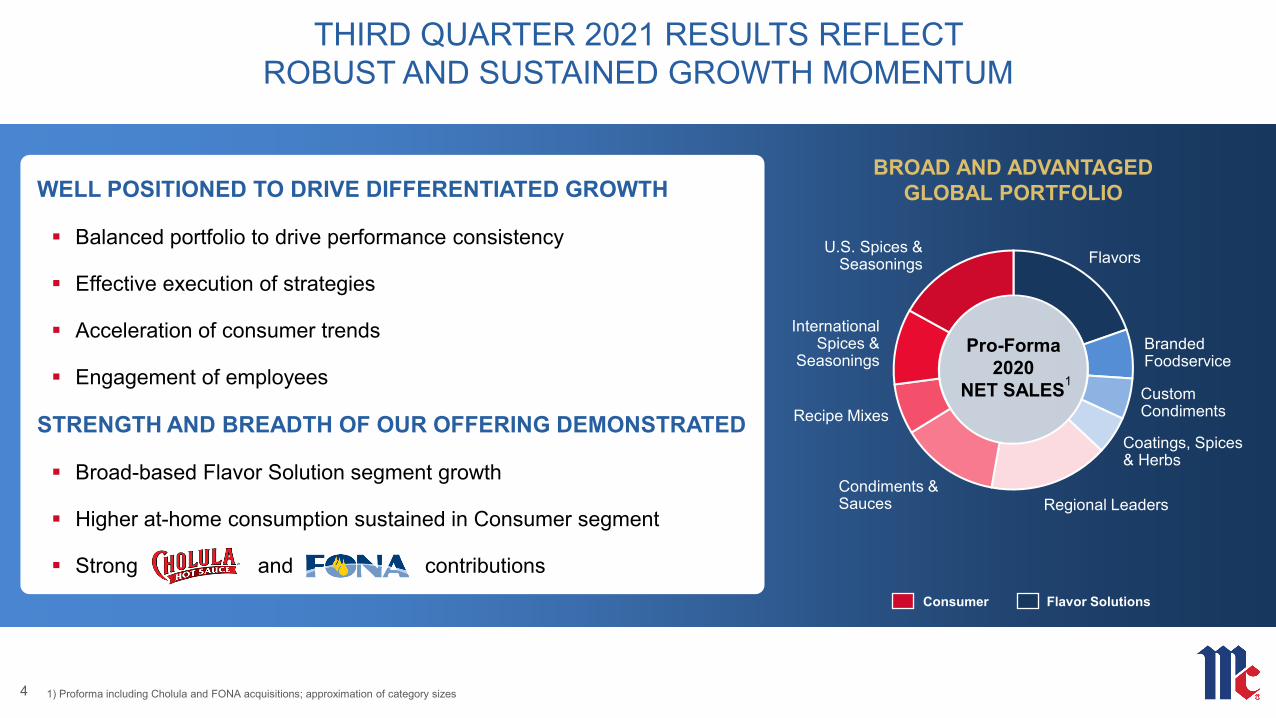
WELL POSITIONED TO DRIVE DIFFERENTIATED GROWTH
Balanced portfolio to drive performance consistency
Effective execution of strategies
Acceleration of consumer trends
Engagement of employees
STRENGTH AND BREADTH OF OUR OFFERING DEMONSTRATED
Broad-based Flavor Solution segment growth
Higher at-home consumption sustained in Consumer segment
Strong and contributions
Branded Foodservice
Custom CondimentsRecipe Mixes
Condiments & Sauces
International Spices &
Seasonings
U.S. Spices & Seasonings
Regional Leaders
Coatings, Spices & Herbs
Flavors
Pro-Forma2020
NET SALES1
Flavor SolutionsConsumer
BROAD AND ADVANTAGED GLOBAL PORTFOLIO
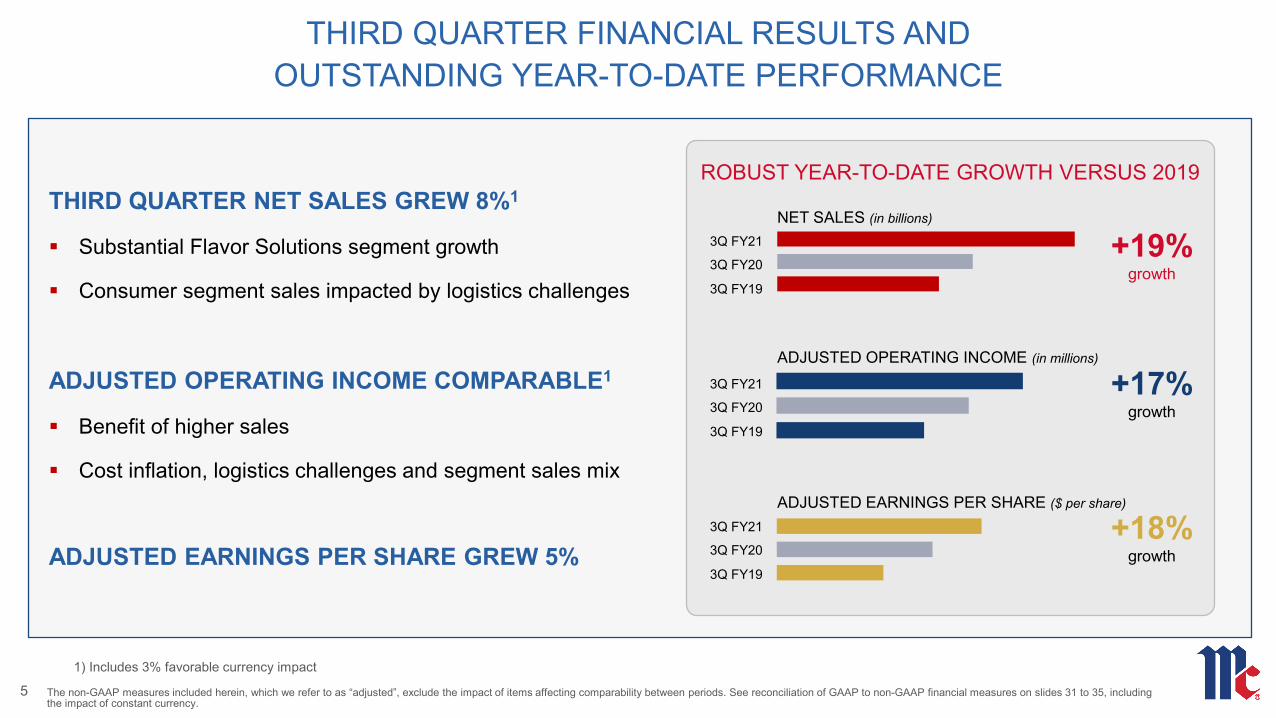
THIRD QUARTER NET SALES GREW 8%1
Substantial Flavor Solutions segment growth
Consumer segment sales impacted by logistics challenges
ADJUSTED OPERATING INCOME COMPARABLE1
Benefit of higher sales
Cost inflation, logistics challenges and segment sales mix
ADJUSTED EARNINGS PER SHARE GREW 5%
THIRD QUARTER FINANCIAL RESULTS AND OUTSTANDING YEAR-TO-DATE PERFORMANCE
5
ROBUST YEAR-TO-DATE GROWTH VERSUS 2019
NET SALES (in billions)
ADJUSTED OPERATING INCOME (in millions)
ADJUSTED EARNINGS PER SHARE ($ per share)
+18% growth
+17% growth
+19% growth
3Q FY19
3Q FY20
3Q FY21
3Q FY19
3Q FY20
3Q FY21
3Q FY19
3Q FY20
3Q FY21
1) Includes 3% favorable currency impact
The non-GAAP measures included herein, which we refer to as “adjusted”, exclude the impact of items affecting comparability between periods. See reconciliation of GAAP to non-GAAP financial measures on slides 31 to 35, including the impact of constant currency.
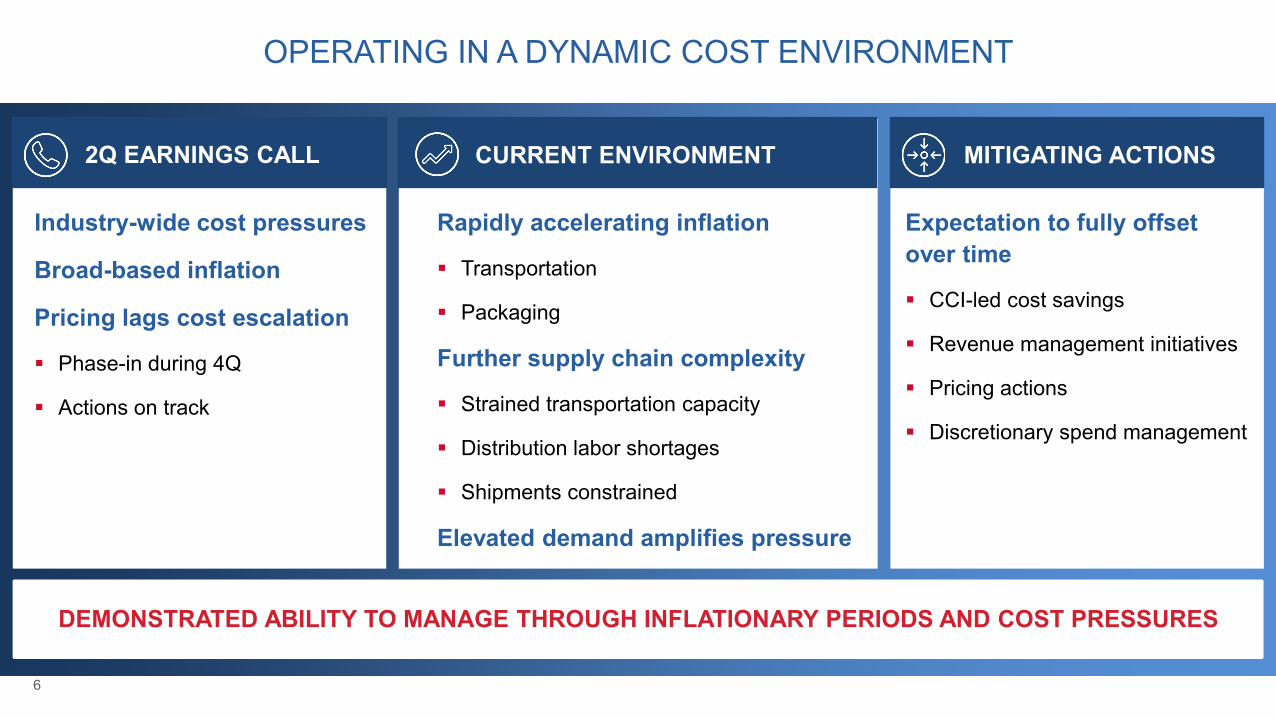
OPERATING IN A DYNAMIC COST ENVIRONMENT
6
Rapidly accelerating inflation
Transportation
Packaging
Further supply chain complexity
Strained transportation capacity
Distribution labor shortages
Shipments constrained
Elevated demand amplifies pressure
Industry-wide cost pressures
Broad-based inflation
Pricing lags cost escalation
Phase-in during 4Q
Actions on track
Expectation to fully offset over time
CCI-led cost savings
Revenue management initiatives
Pricing actions
Discretionary spend management
DEMONSTRATED ABILITY TO MANAGE THROUGH INFLATIONARY PERIODS AND COST PRESSURES
CURRENT ENVIRONMENT2Q EARNINGS CALL MITIGATING ACTIONS
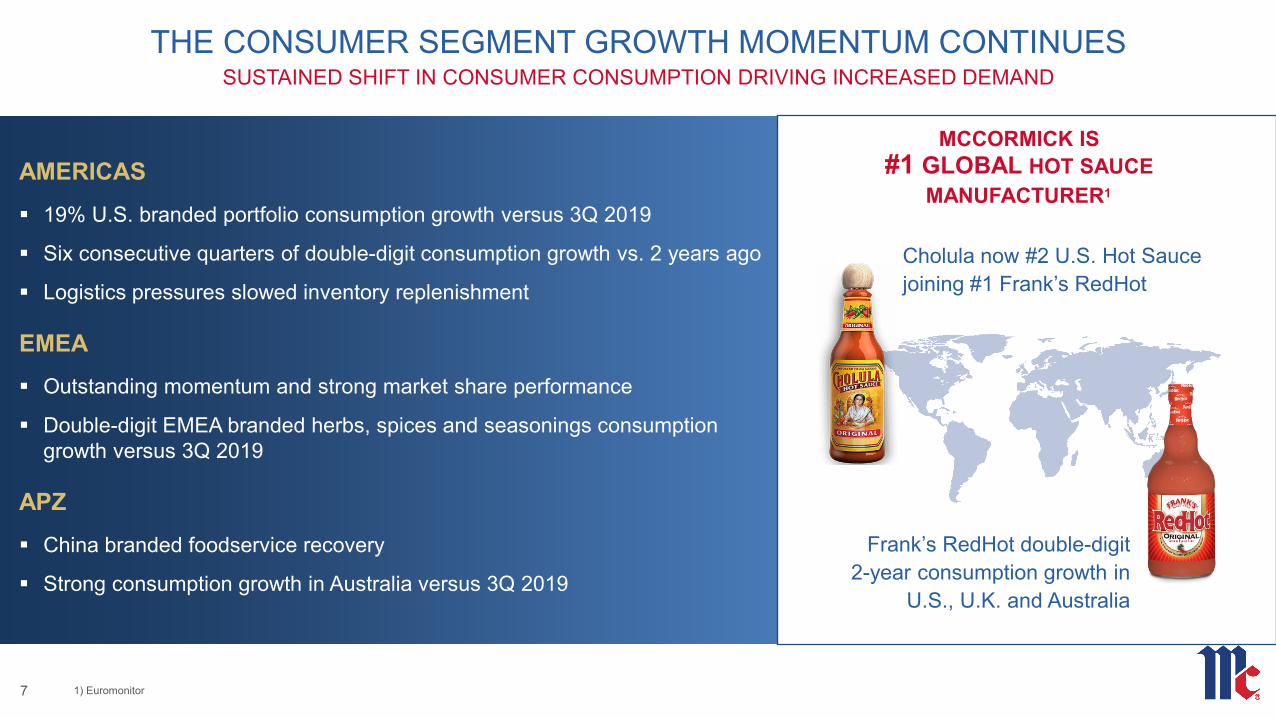
THE CONSUMER SEGMENT GROWTH MOMENTUM CONTINUES SUSTAINED SHIFT IN CONSUMER CONSUMPTION DRIVING INCREASED DEMAND
AMERICAS 19% U.S. branded portfolio consumption growth versus 3Q 2019
Six consecutive quarters of double-digit consumption growth vs. 2 years ago
Logistics pressures slowed inventory replenishment
EMEA Outstanding momentum and strong market share performance
Double-digit EMEA branded herbs, spices and seasonings consumption growth versus 3Q 2019
APZ China branded foodservice recovery
Strong consumption growth in Australia versus 3Q 2019
7
MCCORMICK IS #1 GLOBAL HOT SAUCE
1) Euromonitor
Frank’s RedHot double-digit 2-year consumption growth in
U.S., U.K. and Australia
Cholula now #2 U.S. Hot Sauce joining #1 Frank’s RedHot
MANUFACTURER1
8
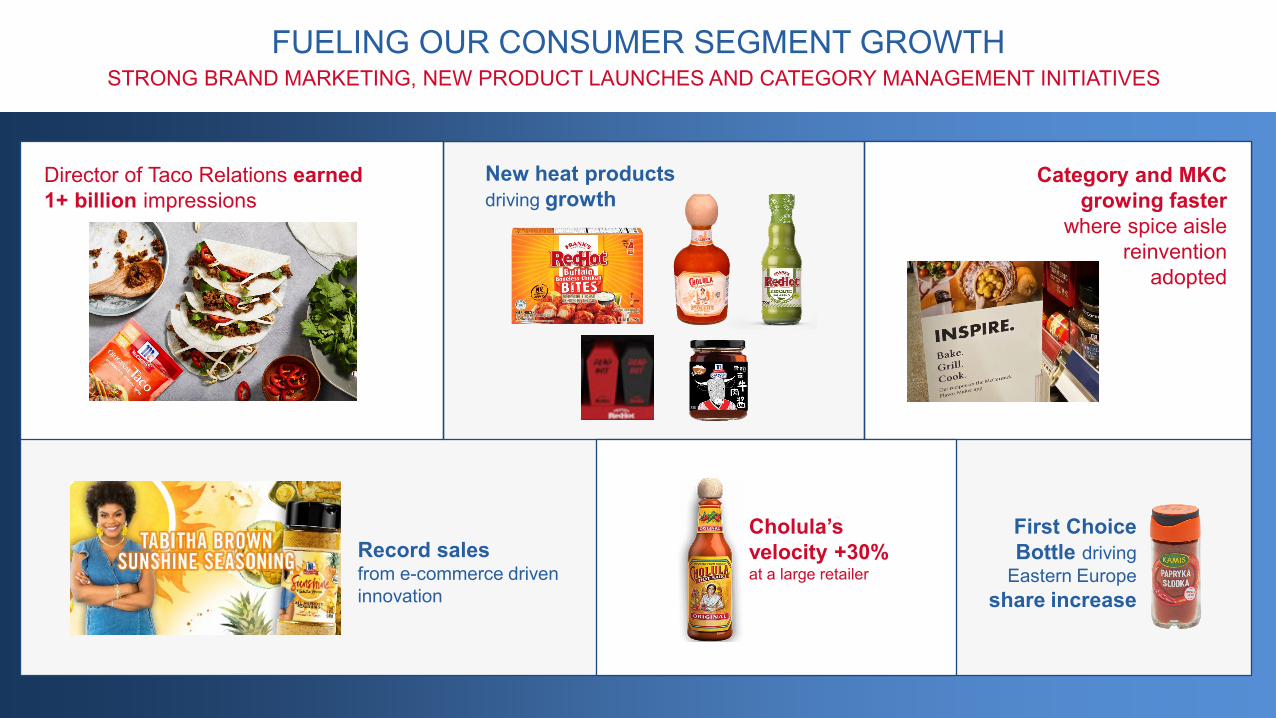
FUELING OUR CONSUMER SEGMENT GROWTH
Record salesfrom e-commerce driven innovation
STRONG BRAND MARKETING, NEW PRODUCT LAUNCHES AND CATEGORY MANAGEMENT INITIATIVES
New heat productsdriving growth
Director of Taco Relations earned 1+ billion impressions
Category and MKC growing faster
where spice aisle reinvention
adopted
Cholula’s velocity +30% at a large retailer
First Choice Bottle driving
Eastern Europe share increase
9
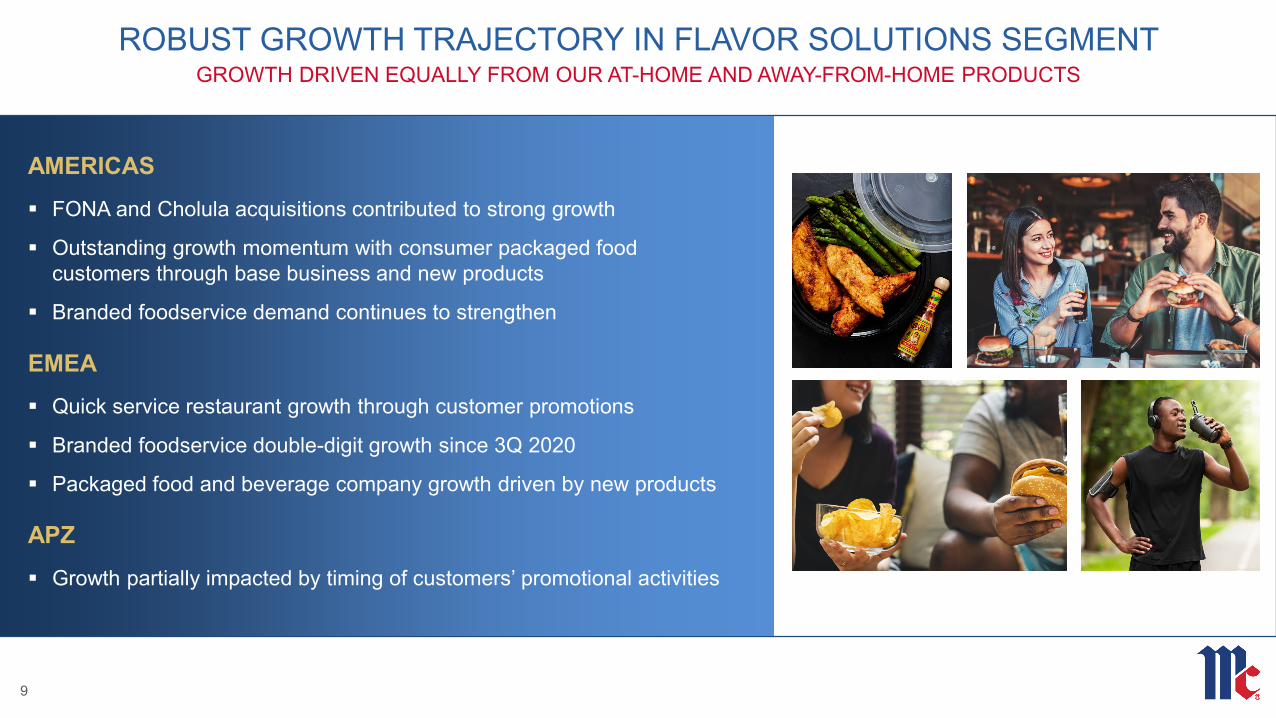
ROBUST GROWTH TRAJECTORY IN FLAVOR SOLUTIONS SEGMENT GROWTH DRIVEN EQUALLY FROM OUR AT-HOME AND AWAY-FROM-HOME PRODUCTS
AMERICAS FONA and Cholula acquisitions contributed to strong growth
Outstanding growth momentum with consumer packaged food customers through base business and new products
Branded foodservice demand continues to strengthen
EMEA Quick service restaurant growth through customer promotions
Branded foodservice double-digit growth since 3Q 2020
Packaged food and beverage company growth driven by new products
APZ Growth partially impacted by timing of customers’ promotional activities

RECOGNITION FOR DOING WHAT’S RIGHT
SUSTAINABILITY-LINKED FINANCING PARTNERSHIP
PARTNERSHIP TO INCREASE FARMER RESILIENCE
McCormick named as aGlobal Compact LEAD company
PURPOSE-LED PERFORMANCE
10
McCormick named as one of theTop 50 Best Companies for Latinas
to Work for in the U.S.
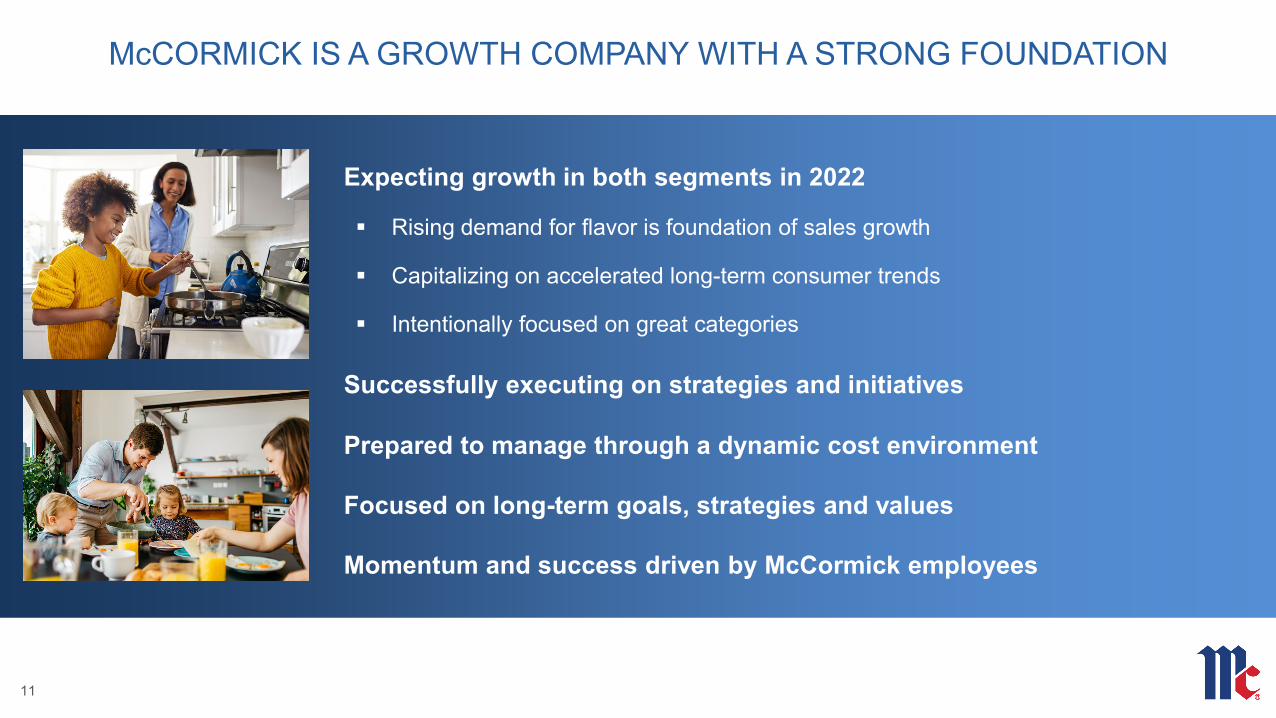
McCORMICK IS A GROWTH COMPANY WITH A STRONG FOUNDATION
11
Expecting growth in both segments in 2022
Rising demand for flavor is foundation of sales growth
Capitalizing on accelerated long-term consumer trends
Intentionally focused on great categories
Successfully executing on strategies and initiatives
Prepared to manage through a dynamic cost environment
Focused on long-term goals, strategies and values
Momentum and success driven by McCormick employees

Mike SmithExecutive Vice President And Chief Financial Officer

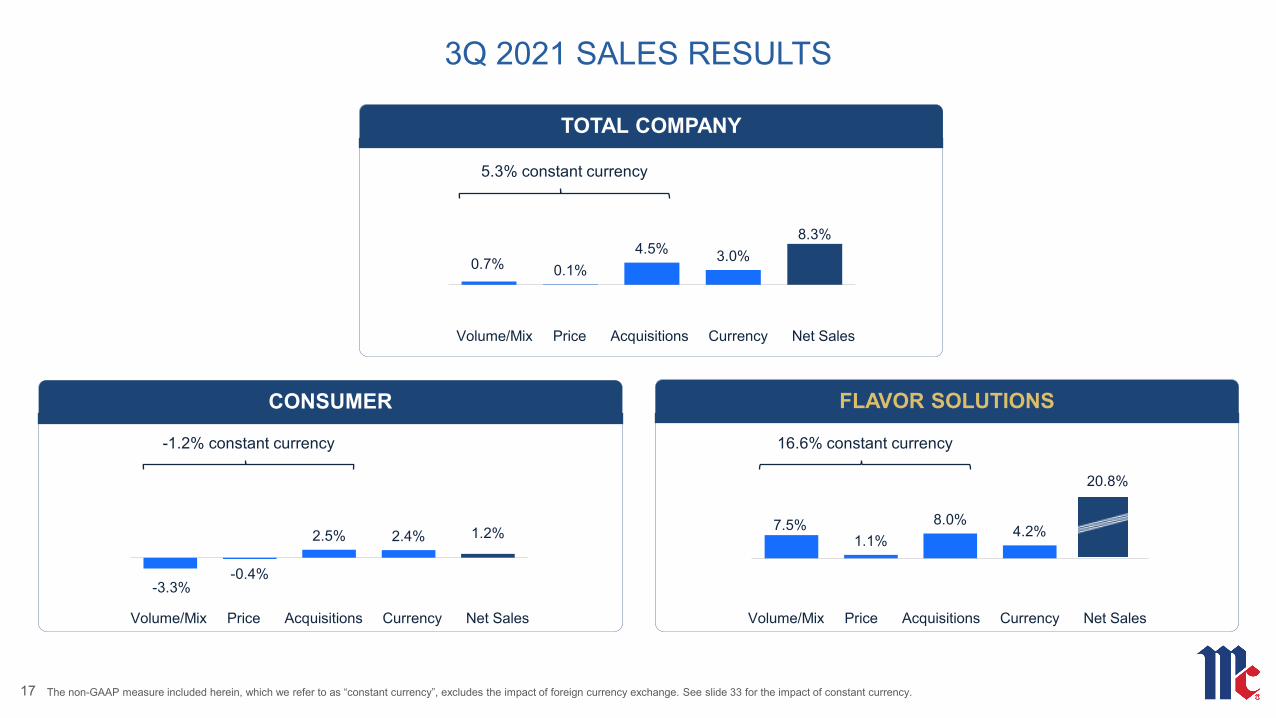
-3.3%-0.4%
2.5% 2.4% 1.2%
0.7% 0.1%4.5% 3.0%
8.3%
FLAVOR SOLUTIONS
7.5%1.1%
8.0%4.2%
20.8%
3Q 2021 SALES RESULTS
5.3% constant currency
-1.2% constant currency 16.6% constant currency
Volume/Mix Price Acquisitions Currency Net Sales
Volume/Mix Price Acquisitions Currency Net Sales Volume/Mix Price Acquisitions Currency Net Sales
13
CONSUMER
TOTAL COMPANY
The non-GAAP measure included herein, which we refer to as “constant currency”, excludes the impact of foreign currency exchange. See slide 33 for the impact of constant currency.
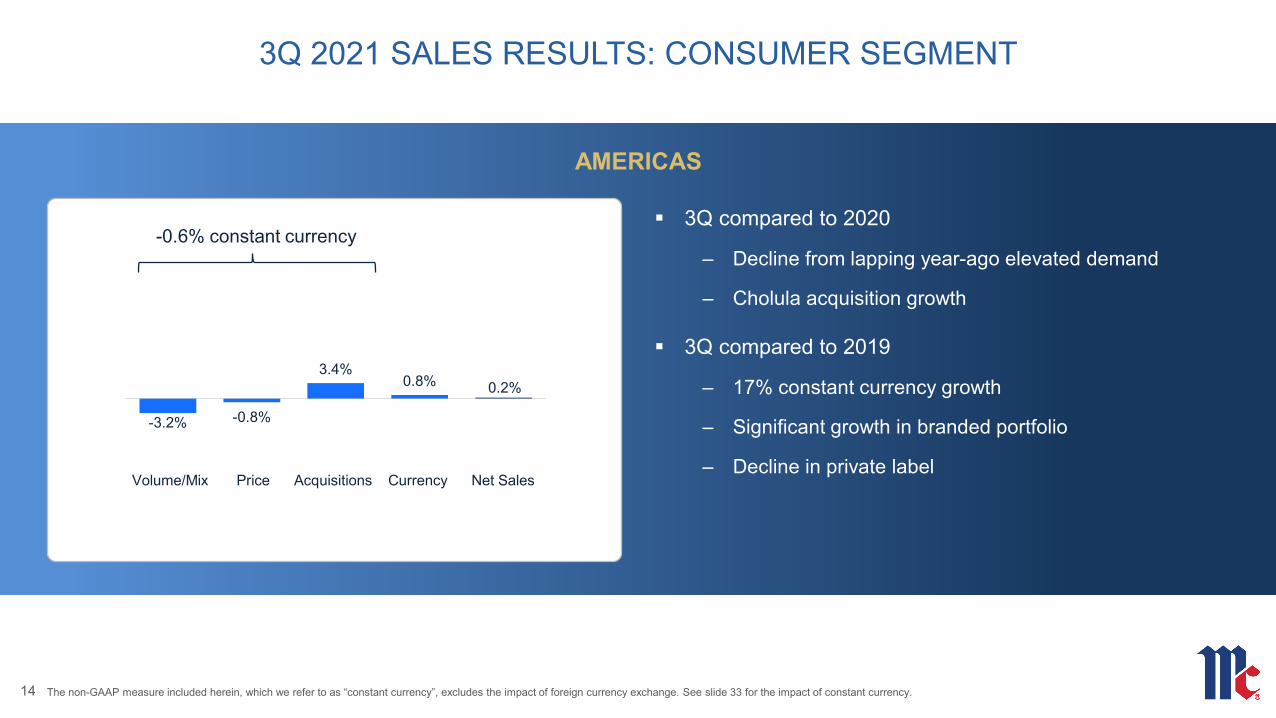
-3.2% -0.8%
3.4%0.8% 0.2%
3Q 2021 SALES RESULTS: CONSUMER SEGMENT
AMERICAS
-0.6% constant currency 3Q compared to 2020
‒ Decline from lapping year-ago elevated demand
‒ Cholula acquisition growth
3Q compared to 2019
‒ 17% constant currency growth
‒ Significant growth in branded portfolio
‒ Decline in private label Volume/Mix Price Acquisitions Currency Net Sales
14 The non-GAAP measure included herein, which we refer to as “constant currency”, excludes the impact of foreign currency exchange. See slide 33 for the impact of constant currency.
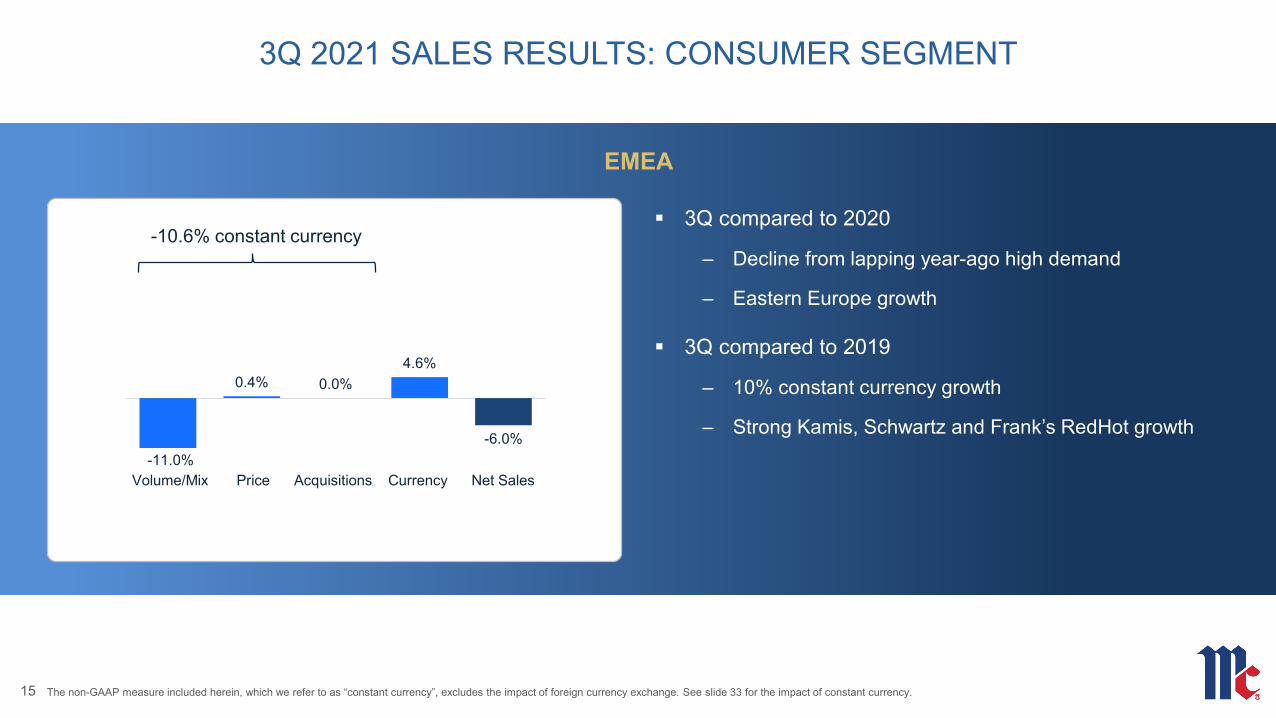
-11.0%
0.4% 0.0%4.6%
-6.0%
3Q 2021 SALES RESULTS: CONSUMER SEGMENT
EMEA
-10.6% constant currency 3Q compared to 2020
‒ Decline from lapping year-ago high demand
‒ Eastern Europe growth
3Q compared to 2019
‒ 10% constant currency growth
‒ Strong Kamis, Schwartz and Frank’s RedHot growth
15
Volume/Mix Price Acquisitions Currency Net Sales
The non-GAAP measure included herein, which we refer to as “constant currency”, excludes the impact of foreign currency exchange. See slide 33 for the impact of constant currency.
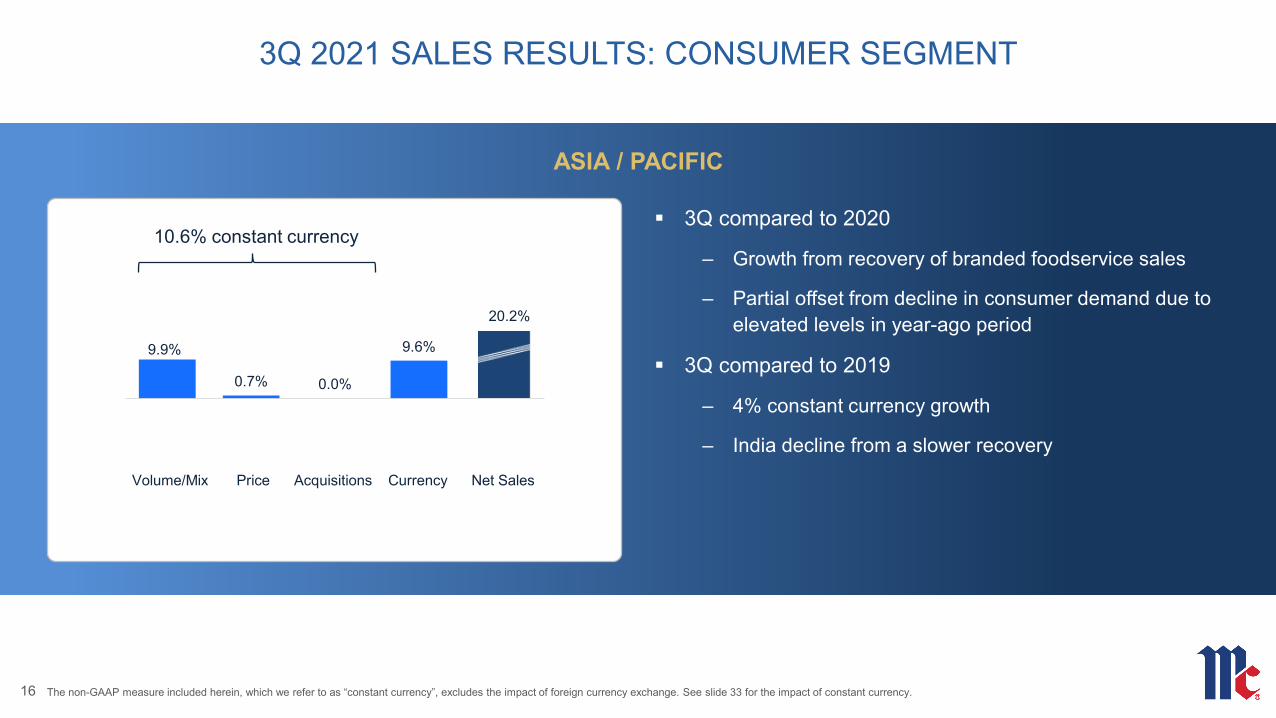
9.9%
0.7% 0.0%
9.6%
20.2%
3Q 2021 SALES RESULTS: CONSUMER SEGMENT
ASIA / PACIFIC
10.6% constant currency 3Q compared to 2020
‒ Growth from recovery of branded foodservice sales
‒ Partial offset from decline in consumer demand due to elevated levels in year-ago period
3Q compared to 2019
‒ 4% constant currency growth
‒ India decline from a slower recovery
16
Volume/Mix Price Acquisitions Currency Net Sales
The non-GAAP measure included herein, which we refer to as “constant currency”, excludes the impact of foreign currency exchange. See slide 33 for the impact of constant currency.
-3.3%-0.4%
2.5% 2.4% 1.2%
0.7% 0.1%4.5% 3.0%
8.3%
FLAVOR SOLUTIONS
7.5%1.1%
8.0%4.2%
20.8%
3Q 2021 SALES RESULTS
5.3% constant currency
-1.2% constant currency 16.6% constant currency
Volume/Mix Price Acquisitions Currency Net Sales
Volume/Mix Price Acquisitions Currency Net Sales Volume/Mix Price Acquisitions Currency Net Sales
17
CONSUMER
TOTAL COMPANY
The non-GAAP measure included herein, which we refer to as “constant currency”, excludes the impact of foreign currency exchange. See slide 33 for the impact of constant currency.

3Q 2021 SALES RESULTS: FLAVOR SOLUTIONS SEGMENT
AMERICAS
3Q compared to 2020
‒ FONA and Cholula acquisitions growth
− Higher sales to branded foodservice customers
− Growth with packaged food and beverage companies with strength in snack seasonings
3Q compared to 2019
‒ 15% constant currency growth
‒ Higher sales from acquisitions and packaged food and beverage companies
5.4%1.4%
11.8%
2.2%
20.8%
18
18.6% constant currency
Volume/Mix Price Acquisitions Currency Net Sales
The non-GAAP measure included herein, which we refer to as “constant currency”, excludes the impact of foreign currency exchange. See slide 33 for the impact of constant currency.

3Q 2021 SALES RESULTS: FLAVOR SOLUTIONS SEGMENT
EMEA
3Q compared to 2020
‒ Quick service restaurants and branded foodservice growth
‒ Continued growth momentum with packaged food and beverage companies
3Q compared to 2019
‒ 23% constant currency growth
‒ Growth with packaged food and beverage companies and quick service restaurants
18.5%
0.9% 0.0%
8.7%
28.1%
19
19.4% constant currency
Volume/Mix Price Acquisitions Currency Net Sales
The non-GAAP measure included herein, which we refer to as “constant currency”, excludes the impact of foreign currency exchange. See slide 33 for the impact of constant currency.
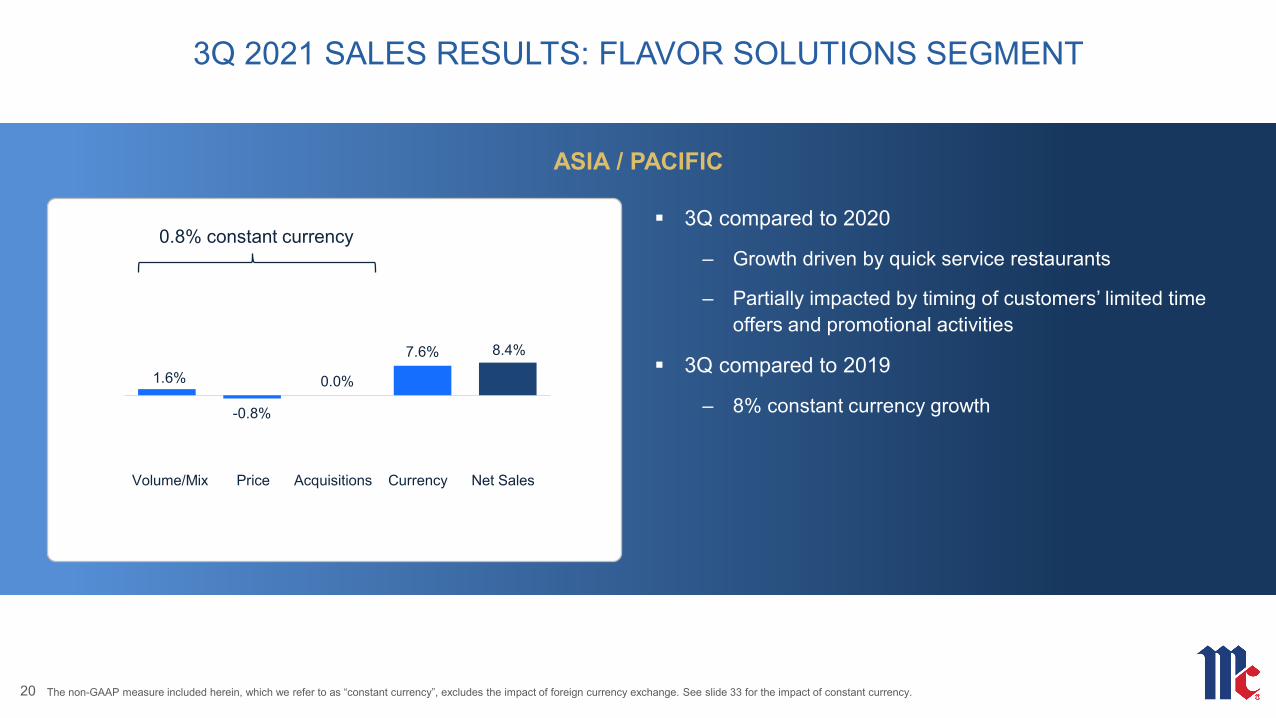
1.6%
-0.8%
0.0%
7.6% 8.4%
3Q 2021 SALES RESULTS: FLAVOR SOLUTIONS SEGMENT
ASIA / PACIFIC
3Q compared to 2020
‒ Growth driven by quick service restaurants
‒ Partially impacted by timing of customers’ limited time offers and promotional activities
3Q compared to 2019
‒ 8% constant currency growth
20
0.8% constant currency
Volume/Mix Price Acquisitions Currency Net Sales
The non-GAAP measure included herein, which we refer to as “constant currency”, excludes the impact of foreign currency exchange. See slide 33 for the impact of constant currency.
OPERATING INCOME
(in millions) 3Q 2021 3Q 20203Q
Fav/(Unfav)Change
YTD 2021 Fav/(Unfav)
Change
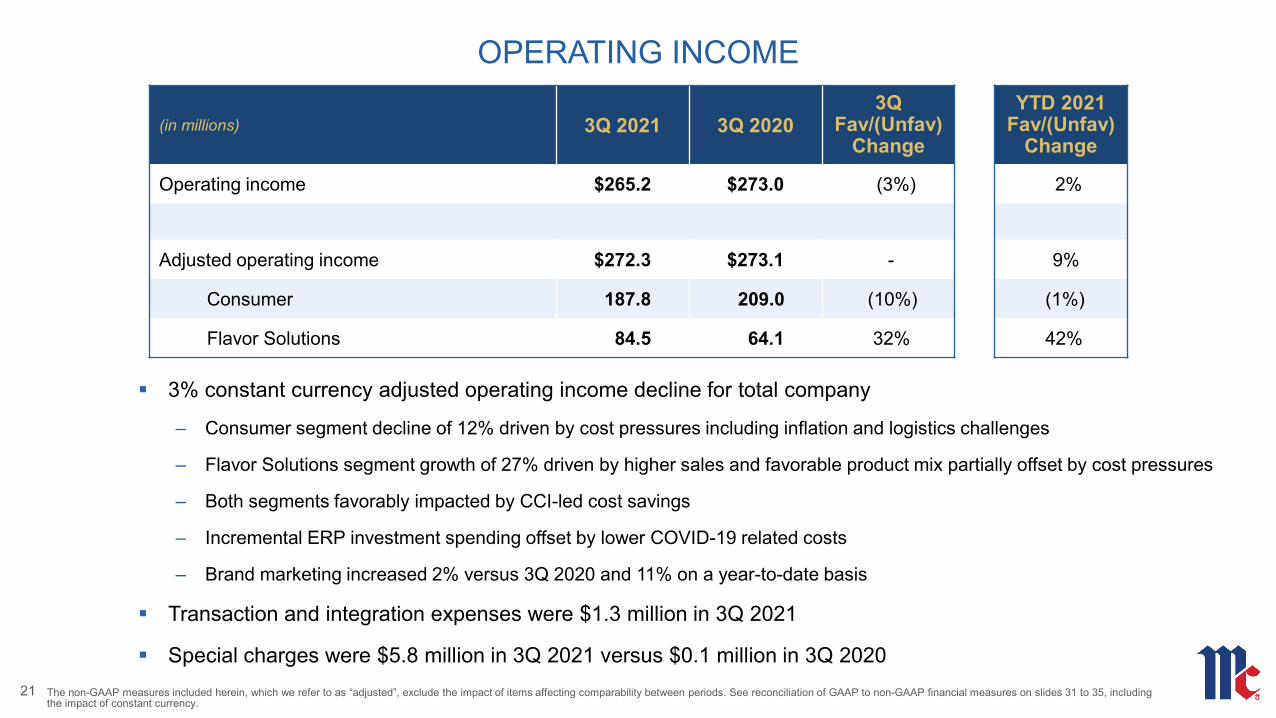
Operating income $265.2 $273.0 (3%) 2%
Adjusted operating income $272.3 $273.1 - 9%
Consumer 187.8 209.0 (10%) (1%)
Flavor Solutions 84.5 64.1 32% 42%
3% constant currency adjusted operating income decline for total company
‒ Consumer segment decline of 12% driven by cost pressures including inflation and logistics challenges
‒ Flavor Solutions segment growth of 27% driven by higher sales and favorable product mix partially offset by cost pressures
‒ Both segments favorably impacted by CCI-led cost savings
‒ Incremental ERP investment spending offset by lower COVID-19 related costs
‒ Brand marketing increased 2% versus 3Q 2020 and 11% on a year-to-date basis
Transaction and integration expenses were $1.3 million in 3Q 2021
Special charges were $5.8 million in 3Q 2021 versus $0.1 million in 3Q 202021 The non-GAAP measures included herein, which we refer to as “adjusted”, exclude the impact of items affecting comparability between periods. See reconciliation of GAAP to non-GAAP financial measures on slides 31 to 35, including
the impact of constant currency.
OPERATING MARGIN
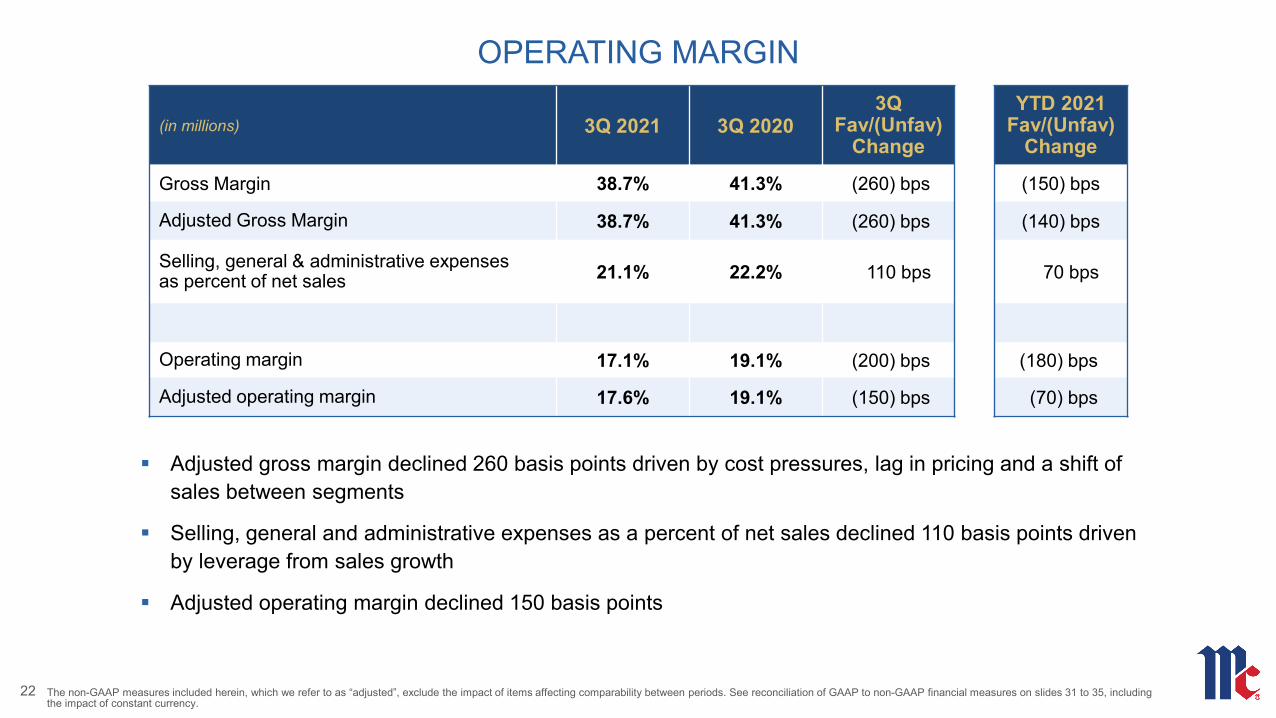
Adjusted gross margin declined 260 basis points driven by cost pressures, lag in pricing and a shift of sales between segments
Selling, general and administrative expenses as a percent of net sales declined 110 basis points driven by leverage from sales growth
Adjusted operating margin declined 150 basis points
22
(in millions) 3Q 2021 3Q 20203Q
Fav/(Unfav)Change
YTD 2021 Fav/(Unfav)
Change
Gross Margin 38.7% 41.3% (260) bps (150) bps
Adjusted Gross Margin 38.7% 41.3% (260) bps (140) bps
Selling, general & administrative expenses as percent of net sales 21.1% 22.2% 110 bps 70 bps
Operating margin 17.1% 19.1% (200) bps (180) bps
Adjusted operating margin 17.6% 19.1% (150) bps (70) bps
The non-GAAP measures included herein, which we refer to as “adjusted”, exclude the impact of items affecting comparability between periods. See reconciliation of GAAP to non-GAAP financial measures on slides 31 to 35, including the impact of constant currency.
(in millions) 3Q 2021 3Q 2020 YTD 2021 YTD 2020
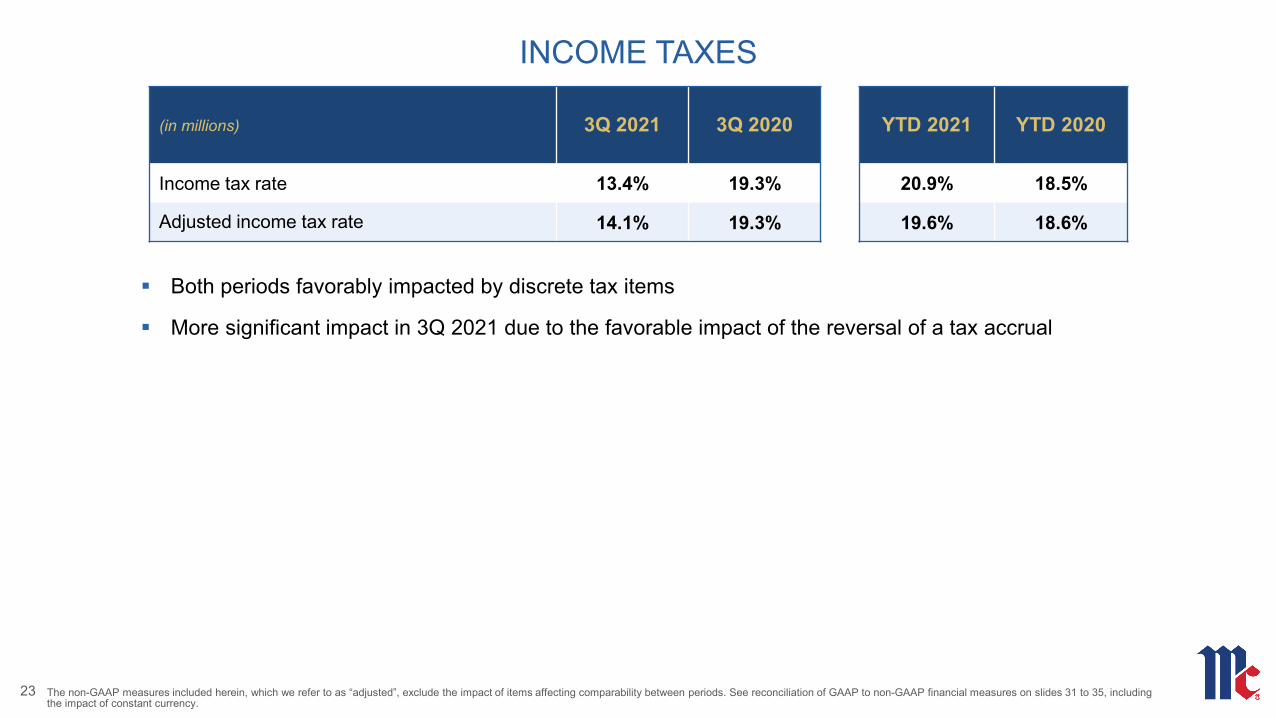
Income tax rate 13.4% 19.3% 20.9% 18.5%
Adjusted income tax rate 14.1% 19.3% 19.6% 18.6%
INCOME TAXES
Both periods favorably impacted by discrete tax items
More significant impact in 3Q 2021 due to the favorable impact of the reversal of a tax accrual
23 The non-GAAP measures included herein, which we refer to as “adjusted”, exclude the impact of items affecting comparability between periods. See reconciliation of GAAP to non-GAAP financial measures on slides 31 to 35, including the impact of constant currency.

(in millions) 3Q 2021 3Q 20203Q
Fav/(Unfav)Change
YTD 2021 Fav/(Unfav)
Change
Income from unconsolidated operations $9.1 $9.6 (5%) 52%
Adjusted income from unconsolidated operations $9.1 $9.6 (5%) 7%
INCOME FROM UNCONSOLIDATED OPERATIONS
Mid-single digit increase in adjusted income from unconsolidated expected for 2021
24 The non-GAAP measures included herein, which we refer to as “adjusted”, exclude the impact of items affecting comparability between periods. See reconciliation of GAAP to non-GAAP financial measures on slides 31 to 35, including the impact of constant currency.
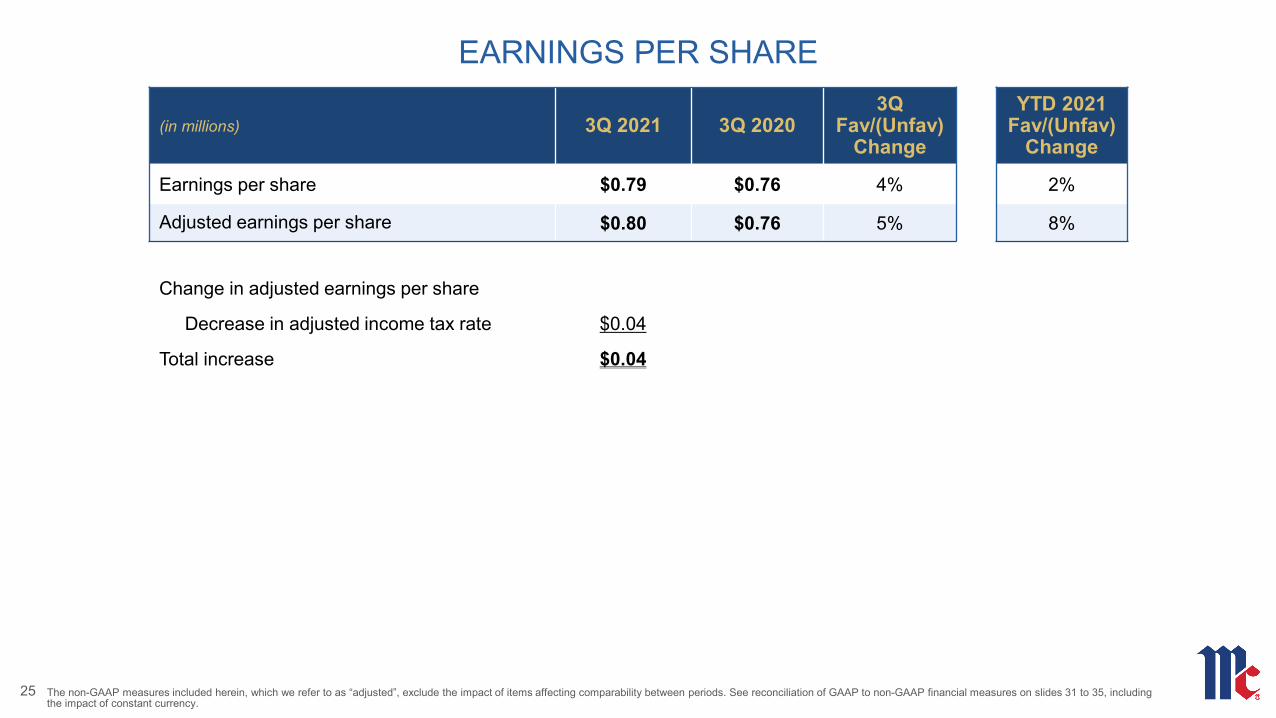
Change in adjusted earnings per share
Decrease in adjusted income tax rate $0.04
Total increase $0.04
(in millions) 3Q 2021 3Q 20203Q
Fav/(Unfav)Change
YTD 2021 Fav/(Unfav)
Change
Earnings per share $0.79 $0.76 4% 2%
Adjusted earnings per share $0.80 $0.76 5% 8%
EARNINGS PER SHARE
25 The non-GAAP measures included herein, which we refer to as “adjusted”, exclude the impact of items affecting comparability between periods. See reconciliation of GAAP to non-GAAP financial measures on slides 31 to 35, including the impact of constant currency.
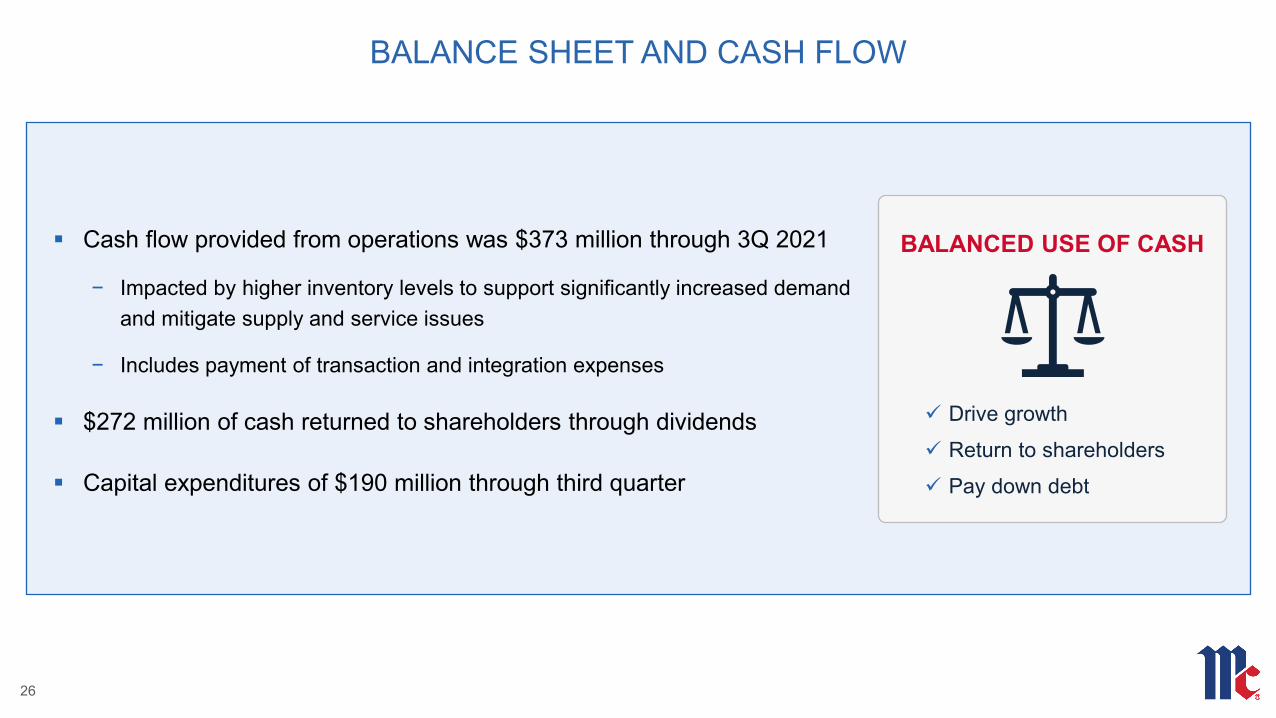
Cash flow provided from operations was $373 million through 3Q 2021
− Impacted by higher inventory levels to support significantly increased demand and mitigate supply and service issues
− Includes payment of transaction and integration expenses
$272 million of cash returned to shareholders through dividends
Capital expenditures of $190 million through third quarter
BALANCE SHEET AND CASH FLOW
26
Drive growth
Return to shareholders
Pay down debt
BALANCED USE OF CASH
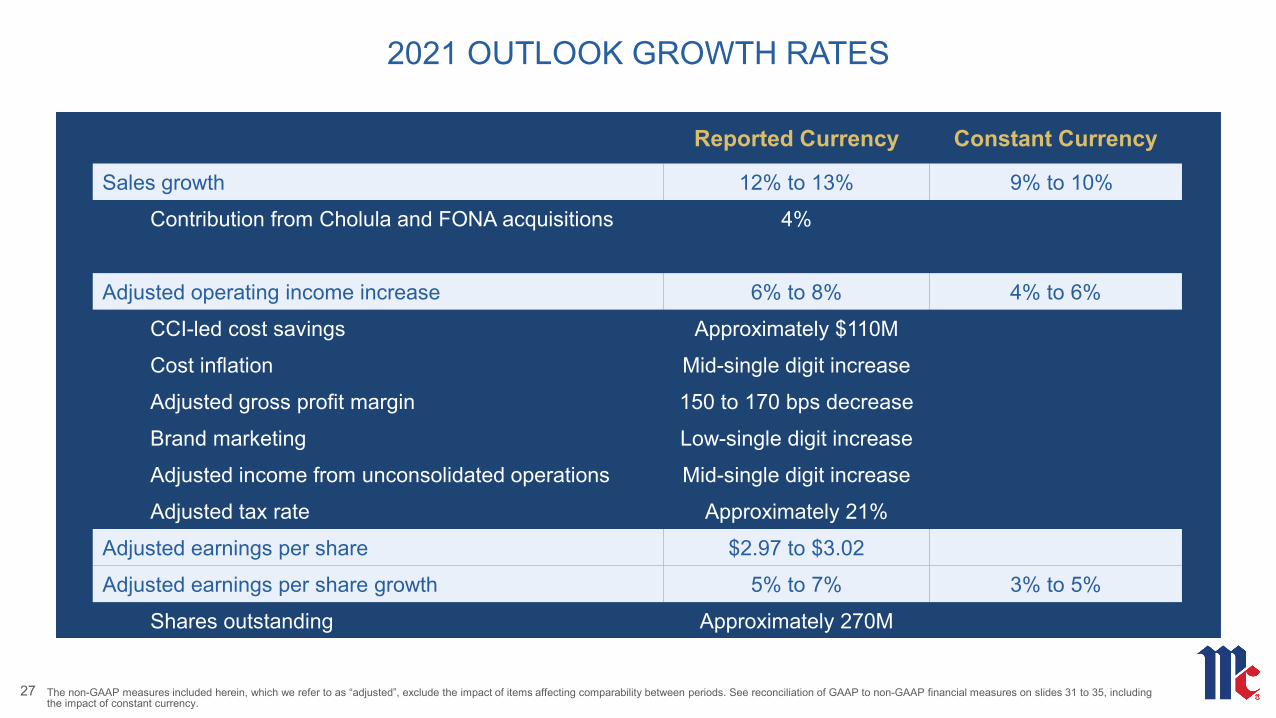
2021 OUTLOOK GROWTH RATES
Reported Currency Constant Currency
Sales growth 12% to 13% 9% to 10%
Contribution from Cholula and FONA acquisitions 4%
Adjusted operating income increase 6% to 8% 4% to 6%
CCI-led cost savings Approximately $110M
Cost inflation Mid-single digit increase
Adjusted gross profit margin 150 to 170 bps decrease
Brand marketing Low-single digit increase
Adjusted income from unconsolidated operations Mid-single digit increase
Adjusted tax rate Approximately 21%
Adjusted earnings per share $2.97 to $3.02
Adjusted earnings per share growth 5% to 7% 3% to 5%
Shares outstanding Approximately 270M
27 The non-GAAP measures included herein, which we refer to as “adjusted”, exclude the impact of items affecting comparability between periods. See reconciliation of GAAP to non-GAAP financial measures on slides 31 to 35, including the impact of constant currency.

-1%
-1%
9% to 10%
8% to 10%
8% to 10%
-3%
-3% -1%
2021 OUTLOOK GROWTH RATES
2021CONSTANT CURRENCYGUIDANCE
STRONG BASE BUSINESS & ACQUISITION
GROWTH
COVID-19 COST
INCREASE
ERP INVESTMENT
TaxHeadwind
TAX HEADWIND
9% to 10%
4% to 6%
3% to 5%
* In constant currency
Sales growth*
Adjusted operating income growth*
Adjusted EPS growth*
28 The non-GAAP measures included herein, which we refer to as “adjusted”, exclude the impact of items affecting comparability between periods. See reconciliation of GAAP to non-GAAP financial measures on slides 31 to 35, including the impact of constant currency.
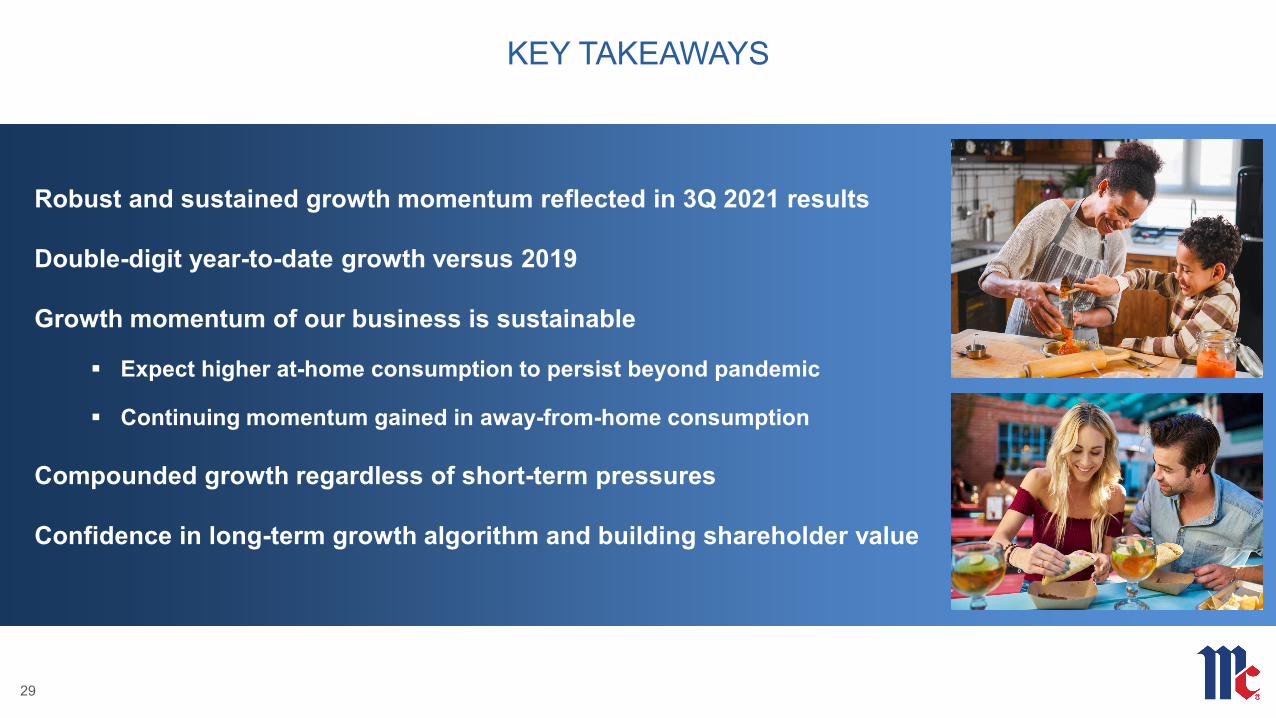
KEY TAKEAWAYS
29
Robust and sustained growth momentum reflected in 3Q 2021 results
Double-digit year-to-date growth versus 2019
Growth momentum of our business is sustainable
Expect higher at-home consumption to persist beyond pandemic
Continuing momentum gained in away-from-home consumption
Compounded growth regardless of short-term pressures
Confidence in long-term growth algorithm and building shareholder value

McCormick & Company, Inc.
September 30, 2021
3RD QUARTER 2021 FINANCIAL RESULTS AND OUTLOOK
The following slides accompany a September 30th, 2021, earnings release conference call. This information should be read in conjunction with the press release issued on that date.
NON-GAAP FINANCIAL MEASURESThe tables below include financial measures of adjusted gross profit, adjusted gross profit margin, adjusted operating income, adjusted operating income margin, adjusted income tax expense, adjusted income tax rate, adjusted net income and adjusted diluted earnings per share. These represent non-GAAP financial measures which are prepared as a complement to our financial results prepared in accordance with United States generally accepted accounting principles. These financial measures exclude the impact, as applicable, of the following:
Special charges - In our consolidated income statement, we include a separate line item captioned “Special charges” in arriving at our consolidated operating income. Special charges consist of expenses associated with certain actions undertaken by the company to reduce fixed costs, simplify or improve processes, and improve our competitiveness and are of such significance in terms of both up-front costs and organizational/structural impact to require advance approval by our Management Committee. Upon presentation of any such proposed action (including details with respect to estimated costs, expected benefits and expected timing) to the Management Committee and the Committee’s advance approval, expenses associated with the approved action are classified as special charges upon recognition and monitored on an on-going basis through completion.
Transaction and integration expenses associated with the Cholula and FONA acquisitions – We exclude certain costs associated with our acquisitions of Cholula and FONA in November and December 2020, respectively, and their subsequent integration into the Company. Such costs, which we refer to as “Transaction and integration expenses”, include transaction costs associated with the acquisition, as well as integration costs following the acquisition, including the impact of any acquisition date fair value adjustment for inventory, together with the impact of discrete tax items, if any, directly related to each acquisition.
Income from sale of unconsolidated operations – We exclude the gain realized with our sale of an unconsolidated operation in March 2021 that occurred during the second quarter of fiscal 2021. The sale of our 26% interest in Eastern Condiments Private Ltd resulted in a gain of $13.4 million, net of tax of $5.7 million. The gain is included in Income from unconsolidated operations in our consolidated income statement.
We believe that these non-GAAP financial measures are important. The exclusion of the items noted above provides additional information that enables enhanced comparisons to prior periods and, accordingly, facilitates the development of future projections and earnings growth prospects. This information is also used by management to measure the profitability of our ongoing operations and analyze our business performance and trends.
These non-GAAP financial measures may be considered in addition to results prepared in accordance with GAAP, but they should not be considered a substitute for, or superior to, GAAP results. In addition, these non-GAAP financial measures may not be comparable to similarly titled measures of other companies because other companies may not calculate them in the same manner that we do. We intend to continue to provide these non-GAAP financial measures as part of our future earnings discussions and, therefore, the inclusion of these non-GAAP financial measures will provide consistency in our financial reporting. A reconciliation of these non-GAAP financial measures to the related GAAP financial measures is provided below:
31

NON-GAAP FINANCIAL MEASURES
1) Transaction and integration expenses include transaction and integration expenses associated with our acquisitions of Cholula and FONA. These expenses include transaction expenses, integration expenses, including the effect of the fair value adjustment of acquired inventory on cost of goods sold and the unfavorable impact of a discrete deferred state income tax expense item, directly related to our December 2020 acquisition of FONA. This discrete tax item had a favorable impact of $1.0 million in the three months ended August 31, 2021 and a net unfavorable impact of $10.4 million or $0.04 per diluted share for the nine months ended August 31, 2021.
2) Adjusted gross profit margin is calculated as adjusted gross profit as a percentage of net sales for each period presented.
3) Adjusted operating income margin is calculated as adjusted operating income as a percentage of net sales for each period presented.
4) Adjusted income tax rate is calculated as adjusted income tax expense as a percentage of income from consolidated operations before income taxes excluding transaction and integration expenses and special charges of $241.9 million and $701.5 million for the three and nine months ended August 31, 2021, respectively, and $243.5 million and $637.9 million for the three and nine months ended August 31, 2020, respectively..
32
(in millions except per share data) Three Months Ended Nine Months Ended8/31/2021 8/31/2020 8/31/2021 8/31/2020
Gross profit $ 599.6 $ 590.3 $ 1,791.7 $ 1,639.7Impact of transaction and integration expenses included in cost of goods sold (1) — — 6.3 —Adjusted gross profit $ 599.6 $ 590.3 $ 1,798.0 $ 1,639.7Adjusted gross profit margin (2) 38.7 % 41.3 % 39.2 % 40.6 %
Operating income $ 265.2 $ 273.0 $ 738.9 $ 724.6Impact of transaction and integration expenses included in cost of goods sold (1) — — 6.3 —Impact of other transaction and integration expenses (1) 1.3 — 27.0 —Impact of special charges 5.8 0.1 20.6 4.0Adjusted operating income $ 272.3 $ 273.1 $ 792.8 $ 728.6
% (decrease) increase versus year-ago period (0.3) % 8.8 %Adjusted operating income margin (3) 17.6 % 19.1 % 17.3 % 18.0 %
Income tax expense $ 31.5 $ 46.9 $ 135.5 $ 117.4Impact of transaction and integration expenses (1) 1.2 — (3.1) —Impact of special charges 1.4 — 4.9 1.2Adjusted income tax expense $ 34.1 $ 46.9 $ 137.3 $ 118.6Adjusted income tax rate (4) 14.1 % 19.3 % 19.6 % 18.6 %
Net income $ 212.4 $ 206.1 $ 557.9 $ 546.7Impact of transaction and integration expenses (1) 0.1 — 36.4 —Impact of special charges 4.4 0.1 15.7 2.8Impact of after-tax gain on sale of unconsolidated operation — — (13.4) —Adjusted net income $ 216.9 $ 206.2 $ 596.6 $ 549.5
% increase versus year-ago period 5.2 % 8.6 %
Earnings per share - diluted $ 0.79 $ 0.76 $ 2.07 $ 2.03Impact of transaction and integration expenses (1) — — 0.14 —Impact of special charges 0.01 — 0.05 0.01Impact of after-tax gain on sale of unconsolidated operation — — (0.05) $ —Adjusted earnings per share - diluted $ 0.80 $ 0.76 $ 2.21 $ 2.04
% increase versus year-ago period 5.3 % 8.3 %
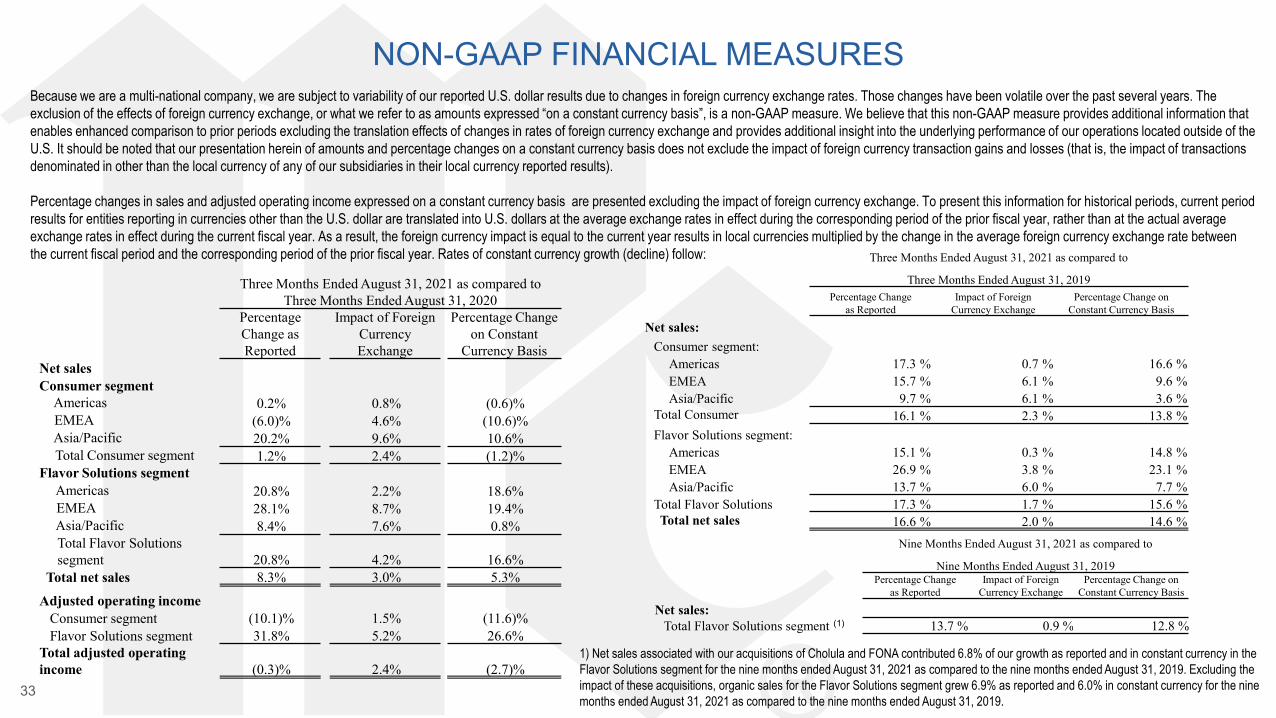
NON-GAAP FINANCIAL MEASURESBecause we are a multi-national company, we are subject to variability of our reported U.S. dollar results due to changes in foreign currency exchange rates. Those changes have been volatile over the past several years. The exclusion of the effects of foreign currency exchange, or what we refer to as amounts expressed “on a constant currency basis”, is a non-GAAP measure. We believe that this non-GAAP measure provides additional information that enables enhanced comparison to prior periods excluding the translation effects of changes in rates of foreign currency exchange and provides additional insight into the underlying performance of our operations located outside of the U.S. It should be noted that our presentation herein of amounts and percentage changes on a constant currency basis does not exclude the impact of foreign currency transaction gains and losses (that is, the impact of transactions denominated in other than the local currency of any of our subsidiaries in their local currency reported results).
Percentage changes in sales and adjusted operating income expressed on a constant currency basis are presented excluding the impact of foreign currency exchange. To present this information for historical periods, current period results for entities reporting in currencies other than the U.S. dollar are translated into U.S. dollars at the average exchange rates in effect during the corresponding period of the prior fiscal year, rather than at the actual average exchange rates in effect during the current fiscal year. As a result, the foreign currency impact is equal to the current year results in local currencies multiplied by the change in the average foreign currency exchange rate between the current fiscal period and the corresponding period of the prior fiscal year. Rates of constant currency growth (decline) follow:
33
1) Net sales associated with our acquisitions of Cholula and FONA contributed 6.8% of our growth as reported and in constant currency in the Flavor Solutions segment for the nine months ended August 31, 2021 as compared to the nine months ended August 31, 2019. Excluding the impact of these acquisitions, organic sales for the Flavor Solutions segment grew 6.9% as reported and 6.0% in constant currency for the nine months ended August 31, 2021 as compared to the nine months ended August 31, 2019.
Three Months Ended August 31, 2021 as compared to Three Months Ended August 31, 2020
Percentage Change as Reported
Impact of Foreign Currency Exchange
Percentage Change on Constant
Currency BasisNet salesConsumer segment
Americas 0.2% 0.8% (0.6)%EMEA (6.0)% 4.6% (10.6)%Asia/Pacific 20.2% 9.6% 10.6%Total Consumer segment 1.2% 2.4% (1.2)%
Flavor Solutions segmentAmericas 20.8% 2.2% 18.6%EMEA 28.1% 8.7% 19.4%Asia/Pacific 8.4% 7.6% 0.8%Total Flavor Solutions segment 20.8% 4.2% 16.6%
Total net sales 8.3% 3.0% 5.3%
Adjusted operating incomeConsumer segment (10.1)% 1.5% (11.6)%Flavor Solutions segment 31.8% 5.2% 26.6%
Total adjusted operating income (0.3)% 2.4% (2.7)%
Three Months Ended August 31, 2021 as compared to
Three Months Ended August 31, 2019Percentage Change
as ReportedImpact of Foreign
Currency ExchangePercentage Change on
Constant Currency Basis
Net sales:Consumer segment:
Americas 17.3 % 0.7 % 16.6 %EMEA 15.7 % 6.1 % 9.6 %Asia/Pacific 9.7 % 6.1 % 3.6 %
Total Consumer 16.1 % 2.3 % 13.8 %Flavor Solutions segment:
Americas 15.1 % 0.3 % 14.8 %EMEA 26.9 % 3.8 % 23.1 %Asia/Pacific 13.7 % 6.0 % 7.7 %
Total Flavor Solutions 17.3 % 1.7 % 15.6 %Total net sales 16.6 % 2.0 % 14.6 %
Nine Months Ended August 31, 2021 as compared to
Nine Months Ended August 31, 2019Percentage Change
as ReportedImpact of Foreign
Currency ExchangePercentage Change on
Constant Currency Basis
Net sales:Total Flavor Solutions segment (1) 13.7 % 0.9 % 12.8 %
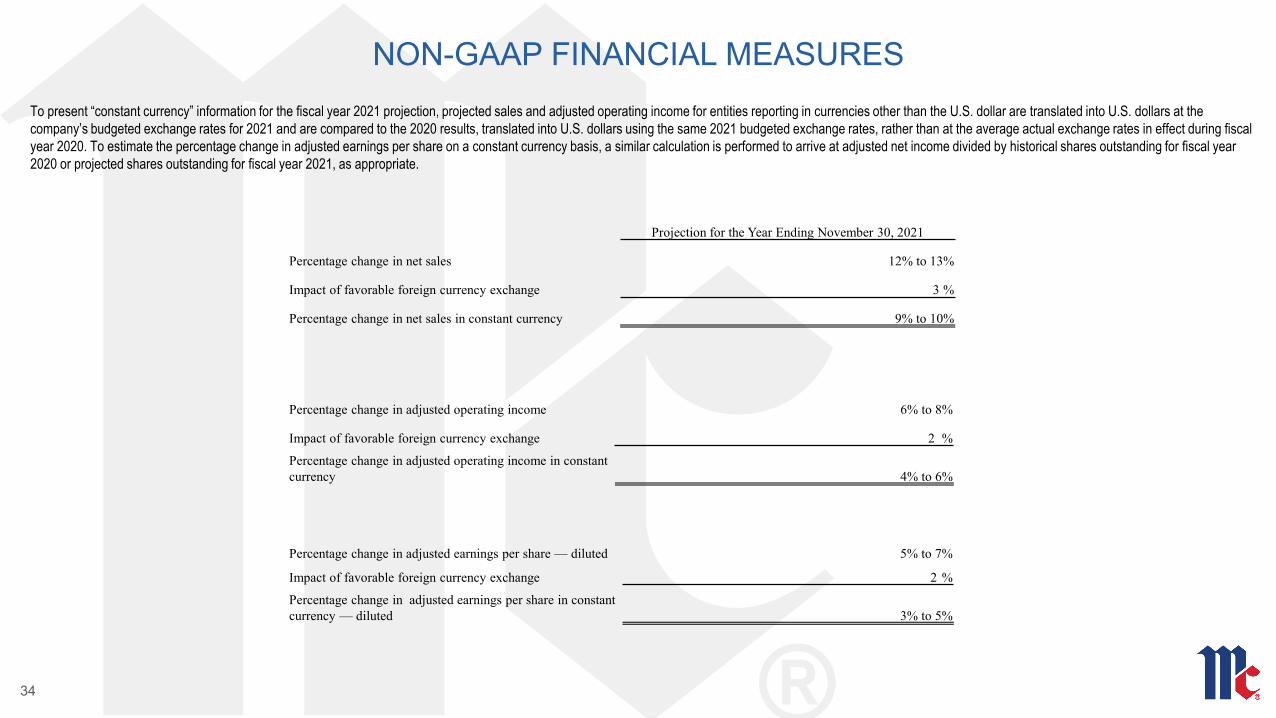
NON-GAAP FINANCIAL MEASURESTo present “constant currency” information for the fiscal year 2021 projection, projected sales and adjusted operating income for entities reporting in currencies other than the U.S. dollar are translated into U.S. dollars at the company’s budgeted exchange rates for 2021 and are compared to the 2020 results, translated into U.S. dollars using the same 2021 budgeted exchange rates, rather than at the average actual exchange rates in effect during fiscal year 2020. To estimate the percentage change in adjusted earnings per share on a constant currency basis, a similar calculation is performed to arrive at adjusted net income divided by historical shares outstanding for fiscal year 2020 or projected shares outstanding for fiscal year 2021, as appropriate.
34
Projection for the Year Ending November 30, 2021
Percentage change in net sales 12% to 13%
Impact of favorable foreign currency exchange 3 %
Percentage change in net sales in constant currency 9% to 10%
Percentage change in adjusted operating income 6% to 8%
Impact of favorable foreign currency exchange 2 %
Percentage change in adjusted operating income in constant currency 4% to 6%
Percentage change in adjusted earnings per share — diluted 5% to 7%
Impact of favorable foreign currency exchange 2 %
Percentage change in adjusted earnings per share in constant currency — diluted 3% to 5%

NON-GAAP FINANCIAL MEASURESThe following provides a reconciliation of our estimated earnings per share to adjusted earnings per share for 2021 and actual results for 2020:
35
Twelve Months Ended2021 Projection 11/30/20
Earnings per share - diluted $2.80 to $2.85 $ 2.78
Impact of transaction and integration expenses 0.15 0.04
Impact of special charges 0.07 0.01
Impact of sale of unconsolidated investment (0.05) —
Adjusted earnings per share $2.97 to $3.02 $ 2.83