Embed Size (px)
Citation preview

Geological Survey of Norway N-7441 Trondheim, Norway Tel.: 47 73 90 40 00 Telefax 47 73 92 16 20 REPORT
Report no.: 2001.106
ISSN 0800-3416
Grading: Open
Title: Searching for hidden radioactive sources in the Barents Rescue 2001 nuclear emergency exercise
Authors: Mark A. Smethurst, John O. Mogaard, Eirik Mauring, Janusz Koziel, Ola Kihle
Client: NGU
County: Norrbotten, Sweden
Commune:
Map-sheet name (M=1:250.000)
Map-sheet no. and -name (M=1:50.000)
Deposit name and grid-reference:
Number of pages: 19 Price (NOK): 138,- Map enclosures:
Fieldwork carried out: 11.09.01 - 21.09.01
Date of report: 06.11.01
Project no.: 2676.00
Person responsible:
Summary: The international nuclear emergency exercise Barents Rescue took place in the vicinity of Boden in northern Sweden between the 12th and 20th of September 2001. The Gamma Search Cell part of the exercise was designed to test the abilities of car-borne and airborne measuring systems to quickly locate and characterise radioactive sources hidden in the countryside. The Geological Survey of Norway participated in the Gamma Search Cell with a car-borne gamma-ray spectrometer system, a field team of three persons and a remote support group of two persons situated in Trondheim. The Geological Survey of Norway team identified 16 sources and 2 small areas of Chernobyl fallout in real time. Two additional sources were identified during post processing of the data. Otherwise the team drove past 2 'strong' and 4 weak sources without detecting them. The remaining 9 sources were in locations not visited by the car-borne measuring system. All but two source identifications were reported to the base of operations within a few minutes of discovery. The Geological Survey of Norway's source search strategy worked well and comparatively few strong sources were overlooked in the short time allocated for searching. The measuring system proved to be extremely reliable, making approximately 140,000 measurements during 8 days of measuring in and around Boden. Keywords: Atomberedskap
Radiometri
Fagrapport

3
CONTENTS
1. INTRODUCTION..............................................................................................................4
2. EQUIPMENT .....................................................................................................................6
2.1 Vehicle........................................................................................................................6
2.2 Fixed Instrument.........................................................................................................6
2.3 Hand-held instrument .................................................................................................7
2.4 Navigation ..................................................................................................................7
2.5 Real-time data processing, data display and data logging..........................................7
3. METHODS.........................................................................................................................8
3.1 Strategy.......................................................................................................................8
3.2 Surveying parameters .................................................................................................8
3.3 Data analysis...............................................................................................................9
4. RESULTS.........................................................................................................................12
5. CONCLUSIONS ..............................................................................................................19
6. ACKNOWLEDGEMENT................................................................................................19
7. REFERENCES .................................................................................................................19

4
1. INTRODUCTION
The Barents Rescue exercise 2001 was designed to test the preparedness of appropriate authorities and assisting organisations for a nuclear emergency entailing the release of an unknown number of potentially dangerous radioactive sources over a wide geographic area. The exercise was carried out in September of 2001 in and around the town of Boden in the county of Norrbotten, northern Sweden (Fig. 1). Barents Rescue was organised by the County Administrative Board of Norrbotten and the Swedish radiation Protection Institute together with 12 others Swedish organisations. Approximately 1450 people from 25 countries participated in the exercise. Information on the exercise can be obtained from two Internet web sites with addresses http://barentsrescue.ssi.se (Swedish Radiation Protection Institute) and http://barentsrescue.srv.se (Swedish Rescue Services Agency).
Different kinds of radioactive sources were hidden in military reservations and military buildings spread over a 60 km by 30 km region. The Gamma Search Cell part of the exercise comprised the use of mobile measuring systems to locate and characterise the hidden radioactive sources. There were 21 car-borne systems from 10 countries, 9 helicopter-borne systems from 7 countries and 1 fixed-wing system. The Geological Survey of Norway participated with a car-borne system that had the identifying code NOK.
The formal measuring days for car-borne systems were 17th, 18th and 19th September. Test measurements were made in the days before this, first on the 13th at the helicopter base in Boden (area R1) and then on the 14th at test area R2 (15 km SW of Boden, Fig. 1). Further test measurements were made on the 15th followed by a half-day hidden source pre-exercise on the 16th in area C2 (Fig. 1). The results of the hidden source pre-exercise are given in this report. The majority of sources used in the pre-exercise were moved in the hours following the exercise. The exercise proper began on the 17th September. The NOK team (Geological Survey of Norway) was asked to search for hidden sources in area C7 (Fig. 1) starting at 08:00 and ending no later than 17:00. Car teams were required to report information on sources directly to the Radiological Emergency Assessment Centre (REAC) by mobile telephone. All measurement data were delivered to REAC in digital 'NKS' format upon return to the base of operations in Boden. On the 18th the NOK team was asked to search in C3 in the morning and C4 in the afternoon (Fig. 1). Again, searching was restricted to the period 08:00 to 17:00. On the final day, the 19th, NOK searched areas C1 and C2 (Fig. 1) under the same conditions as before. The results of the three days of searching are summarised in this report.

C7
C1
C4
C3
R1
R2 C2
C7
C7 Boden
Sw
ed
en
10 km
Figure 1. Location map for theBarents Rescue exercise. Searchareas for the car-bornemeasuring systems are labelledC1, C2, C3, C4 and C7.Calibration areas R1 and R2 arealso indicated.

6
2. EQUIPMENT
2.1 Vehicle
The measuring equipment for team NOK is mounted in a four-wheel-drive Toyota Hiace van (Fig. 2; Smethurst 2000). The van has a crew of two, a driver and an instrument operator, both seated in the front of the vehicle.
Figure 2. The measuring system used by team NOK of the Geological Survey of Norway. Note that the 16.7 litre NaI detector behind the side door can be rotated to present a larger cross-sectional area to the left and right sides of the road.
2.2 Fixed Instrument
The principal measuring instrument for mobile source detection is an Exploranium GR-820 256-channel gamma ray spectrometer utilizing an Exploranium GPX-1024 16.7 litre NaI detector. Counting time is usually set to one second but this can be increased to 5 seconds. The detector is supported a few centimetres beneath the roof of the van on a steel frame. The centre of the detector is at a height of 1.5 m. The frame permits the rotation of the detector about an axis aligned with the direction of travel of the vehicle. The detector can be rotated and fixed so that its largest surface faces directly out to the side, maximising the sensitivity of the instrument to near-horizontal radiation from sources situated on or near the ground to either side of the vehicle.

7
2.3 Hand-held instrument
An Automess 6150 AD6 dose rate meter is used to monitor dose rates in the vehicle for the protection of the crew. The instrument is also used outside the vehicle for determining the precise locations of radioactive sources and the doses associated with them.
2.4 Navigation
The vehicle's location is determined once every second using an Ashtech G12 GPS receiver linked to a dedicated PC. The navigation system is able to deliver most kinds of projected coordinates in real-time – including the Swedish RT90 coordinate system used in the Barents Rescue exercise.
If the Automess dose rate meter is used at some distance from the vehicle, a position of the dose measurement can be obtained from a hand-held Garmin GPS 12 XL GPS navigation device.
2.5 Real-time data processing, data display and data logging
A laptop computer situated on the dashboard of the vehicle acquires data from the gamma ray spectrometer and navigation system, processes the data, displays the data in various forms, and records the data on disk in binary (full spectrum) and ASCII text forms (NKS format).

8
3. METHODS
3.1 Strategy
The NOK team exercised both a field measuring crew, present in Boden, and support personnel at the Geological Survey of Norway headquarters in Trondheim. The field team reported to the Barents Rescue Radiation Emergency Assessment Centre (REAC) as instructed, and shortly afterwards sent full spectrum data to Trondheim. The team in Trondheim archived the data, produced large-format maps of various kinds, and produced an independent interpretation of the data. The Trondheim interpretation of sources was then sent back to the field crew in Boden together with a selection of illustrations and map images (Fig. 3).
The field strategy for team NOK was to measure along all roads within each search area in the time allocated by the Gamma Search Cell leadership. Importance was placed on scanning the entire search area for strong and potentially hazardous sources at the risk of bypassing weak sources. With a large detector, measuring once a second, we set a maximum speed of 50 km/h. In practice we drove between 30 and 50 km/h and still covered most of the roads in each search area.
The search for sources was founded solely on data from the principal measuring instrument, the gamma ray spectrometer. Only when that instrument gave indication of a source did we stop the vehicle and investigate the surrounding area on foot. We did not stop and check objects at or near the roadside simply because they were there.
It was also decided that we should report a single dose rate and cps (counts per second) measurement for each source found, even though several measurements of each source were made, so that more time could be spent covering the search area.
3.2 Surveying parameters
In most situations driving speed was set to between 30 and 50 km/h. The NaI detector was turned on its side in order to present as large a cross-sectional area as possible to the left and right sides of the road.

9
Figure 3. Example map of dose rates measured along tracks in the middle of area C4, 18/09/2001. Note that a non-linear colour scale has been used.
3.3 Data analysis
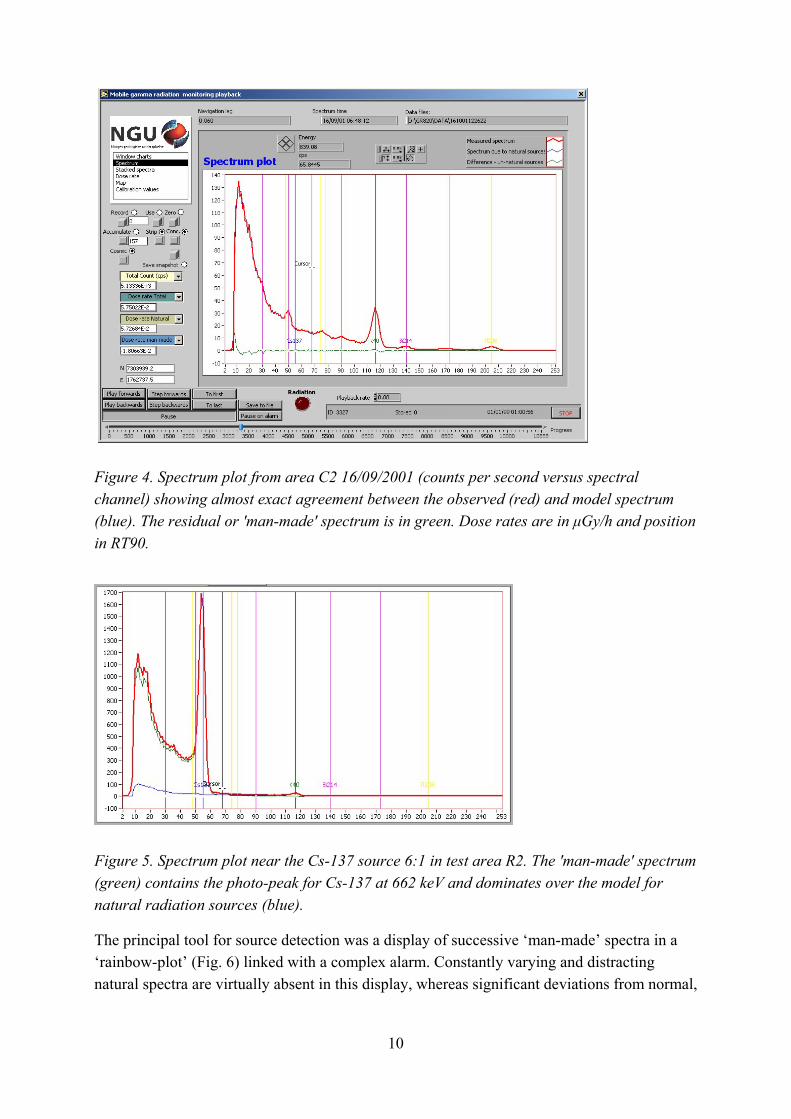
All data processing is done in real-time. Conventional window stripping is performed to provide an indication of the amounts of naturally occurring K-40, daughters of U-238, and daughters of Th-232 in the surrounding natural environment (IAEA 1991). These values and the ‘cosmic window' value (spectrum channel 255) are used to scale unit gamma ray spectra for K-40, U-238, Th-232 and cosmic radiation before they are summed to yield a model of the natural spectrum. The model spectrum is then subtracted from the measured spectrum to produce a residual or ‘man-made’ spectrum. If the model spectrum is a close fit to the observed spectrum, the ‘man-made’ spectrum is virtually zero (Fig. 4). If there is an exotic radionuclide within detection range, the ‘man-made’ spectrum resembles the gamma ray spectrum of the exotic nuclide (Fig. 5). Dose rate (air kerma rate) is determined from the sum of energy-weighted channel count rates (Bargholz 1996, Bargholz & Korsbech 1997) for the observed spectrum (total dose), model spectrum (natural dose) and ‘man-made’ spectrum (dose from source). The integrity of the natural model can break down when a photo-peak from an exotic source impinges on one of the energy windows used in the stripping process. The 1330 keV photo-peak for Co-60 does this. Even in this situation, where the spectra for natural and man-made sources are not properly separated, the deviation from natural behaviour is large enough to be quite obvious and the source is found.
10
Figure 4. Spectrum plot from area C2 16/09/2001 (counts per second versus spectral channel) showing almost exact agreement between the observed (red) and model spectrum (blue). The residual or 'man-made' spectrum is in green. Dose rates are in µGy/h and position in RT90.
Figure 5. Spectrum plot near the Cs-137 source 6:1 in test area R2. The 'man-made' spectrum (green) contains the photo-peak for Cs-137 at 662 keV and dominates over the model for natural radiation sources (blue).
The principal tool for source detection was a display of successive ‘man-made’ spectra in a ‘rainbow-plot’ (Fig. 6) linked with a complex alarm. Constantly varying and distracting natural spectra are virtually absent in this display, whereas significant deviations from normal,

11
natural, behaviour are enhanced. Nuclide identifications are based on visual examination of spectral shapes.
In most situations during the Barents Rescue exercise visual contact was made with either the sources themselves or the structures that enclosed them. In these cases the location of the source was rapidly determined through direct observation from the vehicle and dose rate measurements made on foot. When practical to do so, the NOK team performed a controlled drive-by of the source to produce a simple source profile shape that could then be used to estimate distance to the source. Also estimates of source activity were made based on an adaptation of equation 9.1 given by IAEA (1991).
Figure 6. 'Rainbow plot' of a drive by of sources R1:1 (Cs-137, left) and R1:2 (Co-60, right) at the helicopter airfield in Boden. This display form, consisting only of the difference spectrum ('man-made' spectrum), was heavily used in the exercise. The plot consists of vertical coloured strips, each representing one spectrum. Each new measurement appears as a vertical strip at the right of the screen and the previous measurements scroll to the left. For each strip the vertical axis represents spectral channel while colour is used to indicate counts per second in each channel. Warm colours denote high values.

12
4. RESULTS
Source identifications were reported to REAC by mobile telephone. Relevant processed data, including source position in RT90, could be read directly from the computer screen in the car in real-time. There were only two or three occasions when contact with REAC could not be established within a few minutes of source detection.
Finished processed measurements were stored in NKS files in real time. Each day’s track data, amounting to some 30,000 measurements made over 9 hours, were delivered to the REAC shortly after returning to the Exercise Area. Measurement data were checked in the vehicle during the half-hour journey from the search area back to the Exercise Area. This check included loading the NKS file into a map-making package, Geosoft Oasis Montaj, and making a map of the day’s data. The NKS files and example maps were delivered to REAC before 6 pm.
Copies of the data were sent to Trondheim where an independent search for sources took place. Each day’s data took less than three hours to analyse (one third of the real data acquisition time), including the production of various maps of the data. The Trondheim team recognised all of the sources reported by the NOK field team in Boden and further refined the interpretation of the data. The tables below summarise the performance of the NOK team in the various parts of the Barents Rescue exercise for car-borne measuring systems. The tables list all the sources present in the search areas, and indicate which of these were found by the NOK team. If a source was not found, a reason is given in the table. Overall, the NOK team made 16 positive source identifications, reported 2 small areas with Chernobyl fallout within search area C3, and made 2 false source identifications. Two additional sources were identified in the data during post processing. Otherwise, six sources (or source pairs) were passed without detection (only two of these were 'strong' sources), and 9 were not visited by NOK.
Explanation of result tables:
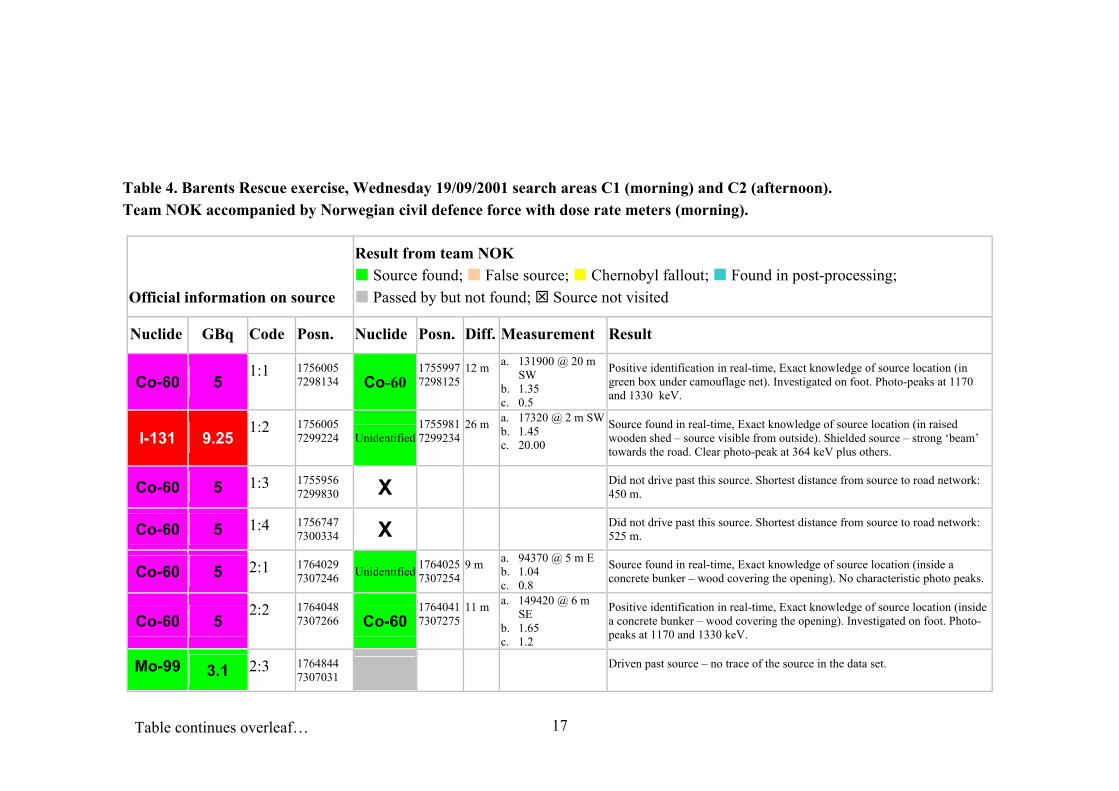
The result tables include official information on the sources on the left and the results of the NOK team on the right. Positions for the sources are in the Swedish RT90 coordinate system. The difference between the official position and the position reported by NOK is given under the heading 'Diff.'. We are uncertain of the relative accuracies of the two estimates of position.
The tables include selected measurements of the sources. Measurement type (a) is derived from the gamma ray spectrometer (detector height 1.5 m). The measurement is in counts per second (e.g. 31700), measured at a given distance from the source (e.g. 20 m) in a given direction from the source (e.g. SW). Measurement type (b) is air kerma rate (µGy/h), also derived from the gamma ray spectrometer, for the same position relative to the source. Measurement type (c) is dose rate (µSv/h) obtained from the Automess dose rate meter for a position close to that of (a) and (b).

13
Official information on source
Result from team NOK Source found; False source; Chernobyl fallout; Found in post-processing; Passed
by but not found; Source not visited
Nuclide GBq Code Posn. Nuclide Posn. Diff. Measurement Result
Cs-137 2.6 6:1 1761020
7302427 Cs-137 1761020 7302427
0 m a. 31700 @ 20 m SW
b. 0.47 c. 0.45
Positive identification in real-time, Exact knowledge of source location (military trailer). Investigated on foot. Photo-peak at 662 keV.
Co-60 5 6:2 1761670
7302884 Co-60 1761670 7302890
6 m a. 20300 @ 47 m SE
b. 0.40 c. 0.45
Positive identification in real-time, Exact knowledge of source location (chaotic wood stack). photo-peaks at 1170 and 1330 keV.
Cs-137 1.9 X:1 1762946 7303659 Cs-137
1762928 7303669
20 m a. 17010 @ 2 m N b. 0.19 c. 0.26
Positive identification in real-time, Exact knowledge of source location (civilian trailer). Photo-peak at 662 keV.
Cs-137 0.5 X:2-1 1764308 7308519 Driven past source – no trace of the source in the data set.
Co-60 0.02 X:2-1 1764308 7308519 Driven past source – no trace of the source in the data set.
Cs-137 2x0.5 X:3 1764698 7306720 X Short side road not driven.
Co-60 2x0.02 X:4 1764300 7306424 X
Short side road not driven.
Cs-137 Cs-137 Cs-137 Co-60 Co-60 Ba-133
1.3 1.9 0.4 0.1 0.1
0.004
X:5 1763856 7305822
Cs-137
Post-processing: Cs-137 source/s observed in two successive spectra measured a few metres from the source/s. The Cs-137 source/s were only within detection range for 2 seconds and were therefore overlooked by the measuring team.
Team NOK did not stop unless the primary measuring instrument gave indication of a possible source. No source was noticed and therefore we did not stop to investigate on foot.
Table 1. Result from the pre-exercise, Sunday 16/09/2001 search area C2

14
Official information on source
Result from team NOK Source found; False source; Chernobyl fallout; Found in post-processing; Passed by but not found; Source not visited
Nuclide GBq Code Posn. Nuclide Posn. Diff. Measurement Result
Co-60 5 7:1 1725376
7340248 Co-60 17253807340240
9 m a. 39157 @ 20 m Eb. 0.88 c. 1.00
Positive identification in real-time, Exact knowledge of source location (military warehouse). Investigated on foot. Shielded source – strong ‘beam’ through door. Photo-peaks at 1170 and 1330 keV.
Co-60 5 7:2 1721169
7340769 Co-60 17211597340790
23 m a. 56200 @ 20 m N b. 1.12 c. 1.89
Positive identification in real-time, Exact knowledge of source location (military warehouse). Investigated on foot. Spectral peaks at 1170 and 1330 keV.
Co-60 5 7:3 1718957
7338223 Co-60 17189457338220
12 m a. 160000 50m NNW
b. 2.60 c. 11.00
Positive identification in real-time, Exact knowledge of source location (military warehouse). Investigated on foot. Photo-peaks at 1170 and 1330 keV.
Co-60 5 7:4 1718983 7338209 Co-60
This and the above source were located in the same military warehouse. Team NOK interpreted the two sources as one single source.
Co-60 5 7:5 1711648
7331315 Unidentified17116417331309
9 m a. 6210 @ 3 m N b. 0.40 c. ?
Source found in real-time, Exact knowledge of source location (military warehouse). Investigated on foot. Shielding around source, no characteristic photo-peaks observed – isotope not identified.
Ra-226 Nat 7:6 1721282 7340593 Driven past source – no trace of the source in the data set.
Ra-226 Nat 7:7 1718765 7337175 Driven past source – no trace of the source in the data set.
Ra-226 Nat 7:8 1712920 7318874 Ra-226
Post-processing: Ra-226 source observed.
Table 2. Barents Rescue exercise, Monday 17/09/2001 search area C7
Table continues overleaf…

15
Reported Low energy gamma
17414357295615
Suspicious low energy gamma radiation – not explained by live modelling of natural radiation sources. Reported to REAC as “Possible distant source”
Reported Low energy gamma
17178817336290
Suspicious low energy gamma radiation – not explained by live modelling of natural radiation sources. Reported to REAC as “Possible distant source”
Official information on source
Result from team NOK Source found; False source; Chernobyl fallout; Found in post-processing; Passed by but not found; Source not visited
Nuclide GBq Code Posn. Nuclide Posn. Diff. Measurement Result
Co-60 4x5 3:1 1766304
7316848 C0-60
1766288 7316863
21 m a. 175000 @ 6 m Nb. 1.83 c. 1.00
Positive identification in real-time, Exact knowledge of source location (military warehouse). Investigated on foot. Shielded source – strong ‘beam’ through door. Photo-peaks at 1170 and 1330 keV. Heavily shielded – characteristic photo-peaks absent from most vantage points.
Cs-137 0.4 4:1 1760923 7321390 Cs-137
1760897 7321397
27 m a. 51550 @ 8 m S b. 0.81 c. 0.50
Positive identification in real-time, Exact knowledge of source location (red wooden shed). Investigated on foot. Photo-peak at 662 keV.
Cs-137 2.5 4:2 1760488 7323895 X
Did not drive past this source (narrow track deep inside shooting range).
Ir-192 13 4:3 1760310 7323933 X
Did not drive past this source (narrow track deep inside shooting range).
Table 3. Barents Rescue exercise, Tuesday 18/09/2001 search areas C3 (morning) and C4 (afternoon) Team NOK accompanied by Norwegian civil defence force with dose rate meters.
Table continues overleaf…

16
Co-60 5 4:4 1761137
7323702 Co-60
1761122 7323712
18 m a. 87570 @ 12 m Nb. 2.37 c. 0.40
Positive identification in real-time, Exact knowledge of source location (concrete bunker, open upwards, with metal plate weighed down by stones over the opening). Photo-peaks at 1170 and 1330 keV. Complex shielding. Investigated on foot.
Co-60 5 4:5 1761117
7323744 Unidentified 1761102 7323749
16 m a. 27420 @ 7 m E b. 0.32 c. 0.20
Source found in real-time, Exact knowledge of source location (concrete bunker, close to source above). Complex shielding, no characteristic photo-peaks observed – isotope not identified. Investigated on foot.
Cs-137 1.3 4:6 1761442 7323932 X
Drove close to but not past this source.
Cs-137 1.9 4:7 1761559 7323941 X
Drove close to but not past this source.
Fallout C3
Chernobyl fallout Cs-137
1766257 7318837
Traces of Chernobyl fallout in the neglected lawns between abandoned residential buildings at road junction.
Fallout C3
Chernobyl fallout Cs-137
1767383 7315342
Traces of Chernoblyl fallout around two run-down wooden warehouses.
17
Official information on source
Result from team NOK Source found; False source; Chernobyl fallout; Found in post-processing; Passed by but not found; Source not visited
Nuclide GBq Code Posn. Nuclide Posn. Diff. Measurement Result
Co-60 5 1:1 1756005
7298134 Co-60 17559977298125
12 m a. 131900 @ 20 m SW
b. 1.35 c. 0.5
Positive identification in real-time, Exact knowledge of source location (in green box under camouflage net). Investigated on foot. Photo-peaks at 1170 and 1330 keV.
I-131 9.25 1:2 1756005
7299224 Unidentified17559817299234
26 m a. 17320 @ 2 m SW b. 1.45 c. 20.00
Source found in real-time, Exact knowledge of source location (in raised wooden shed – source visible from outside). Shielded source – strong ‘beam’ towards the road. Clear photo-peak at 364 keV plus others.
Co-60 5 1:3 1755956 7299830 X
Did not drive past this source. Shortest distance from source to road network: 450 m.
Co-60 5 1:4 1756747 7300334 X
Did not drive past this source. Shortest distance from source to road network: 525 m.
Co-60 5 2:1 1764029 7307246 Unidentified 1764025
73072549 m a. 94370 @ 5 m E
b. 1.04 c. 0.8
Source found in real-time, Exact knowledge of source location (inside a concrete bunker – wood covering the opening). No characteristic photo peaks.
Co-60 5 2:2 1764048
7307266 Co-60 17640417307275
11 m a. 149420 @ 6 m SE
b. 1.65 c. 1.2
Positive identification in real-time, Exact knowledge of source location (inside a concrete bunker – wood covering the opening). Investigated on foot. Photo-peaks at 1170 and 1330 keV.
Mo-99 3.1 2:3 1764844 7307031 Driven past source – no trace of the source in the data set.
Table 4. Barents Rescue exercise, Wednesday 19/09/2001 search areas C1 (morning) and C2 (afternoon). Team NOK accompanied by Norwegian civil defence force with dose rate meters (morning).
Table continues overleaf…

18
Mo-99 18 2:4 1765350 7305451 X
Did not drive past this source.
Cs-137 3x0.5 2:5-1 1763466 7306095 Driven past source – no trace of the source in the data set.
Co-60 3x0.02 2:5-2 1763466 7306095 Driven past source – no trace of the source in the data set.
Am-241 0.0004 2:6 1760526 7302595 Driven past source – no trace of the source in the data set.

19
5. CONCLUSIONS
The measuring system employed by the NOK team proved to be reliable. 140,000 measurements were made in Boden over 8 days without technical failure. We feel that the source search strategy worked well and are satisfied that comparatively few strong sources were overlooked in the short time allocated for searching. We are also pleased that the support team in Trondheim were able to reproduce the results of the on-site team. The Barents Rescue exercise was a positive and learning experience for the NOK team members and we now feel better prepared for emergency measurements of this kind.
6. ACKNOWLEDGEMENT
We thank the Nordic Nuclear Fission Safety Research organisation (NKS) for providing financial support for our participation in the Barents Rescue exercise.
7. REFERENCES
Bargholz, K. 1996. Dose rate determination from airborne gamma-ray spectra. Department of Automation, Technical University of Denmark report IT-NT-28.
Bargholz, K. & Korsbech, U. 1997. Conversion of airborne gamma ray spectra to ground level air kerma rates. Radiation Protection Dosimetry, 73, 127-130.
IAEA 1991. Airborne Gamma Ray Spectrometer Surveying. Technical Report Series No. 323, International Atomic Energy Agency, Vienna.
Smethurst, M.A. 2000. A mobile gamma ray spectrometer system for nuclear hazard mapping. Geological Survey of Norway report 2000.088.


![[Viet - Anh] Thanh Ngu - Tuc Ngu - CA Dao](https://img.pdfslide.net/doc/110x75/5571f81a49795991698ca4a8/viet-anh-thanh-ngu-tuc-ngu-ca-dao.jpg)