Embed Size (px)
Citation preview
ARTICLE
Received 16 Apr 2015 | Accepted 3 Mar 2016 | Published 7 Apr 2016
4D Visualization of replication foci in mammaliancells corresponding to individual repliconsV.O. Chagin1,2, C.S. Casas-Delucchi1,3,*, M. Reinhart1,*, L. Schermelleh4,5, Y. Markaki5, A. Maiser5,
J.J. Bolius1, A. Bensimon6, M. Fillies7,8, P. Domaing7, Y.M. Rozanov2, H. Leonhardt5 & M.C. Cardoso1
Since the pioneering proposal of the replicon model of DNA replication 50 years ago, the
predicted replicons have not been identified and quantified at the cellular level. Here, we
combine conventional and super-resolution microscopy of replication sites in live and fixed
cells with computational image analysis. We complement these data with genome size
measurements, comprehensive analysis of S-phase dynamics and quantification of replication
fork speed and replicon size in human and mouse cells. These multidimensional analyses
demonstrate that replication foci (RFi) in three-dimensional (3D) preserved somatic
mammalian cells can be optically resolved down to single replicons throughout S-phase.
This challenges the conventional interpretation of nuclear RFi as replication factories, that is,
the complex entities that process multiple clustered replicons. Accordingly, 3D genome
organization and duplication can be now followed within the chromatin context at the level of
individual replicons.
DOI: 10.1038/ncomms11231 OPEN
1 Department of Biology, Technische Universitaet Darmstadt, Darmstadt 64287, Germany. 2 Laboratory of chromosome stability, Institute of Cytology,St. Petersburg 194064, Russia. 3 Cancer Research UK London Research Institute, Clare Hall Laboratories, South Mimms EN6 3LD, UK. 4 Micron AdvancedBioimaging Unit, Department of Biochemistry, University of Oxford, OX1 3QU Oxford, UK. 5 Center for Integrated Protein Science at the Department ofBiology, Ludwig Maximilians University Munich, Planegg-Martinsried 82152, Germany. 6 Genomic Vision, Bagneux 92220, France. 7 Max Delbrueck Centerfor Molecular Medicine, Berlin 13125, Germany. 8 Charite—Universitaetsmedizin, 13353 Berlin, Germany. * These authors contributed equally to this work.Correspondence and requests for materials should be addressed to M.C.C. (email: [email protected])
NATURE COMMUNICATIONS | 7:11231 | DOI: 10.1038/ncomms11231 | www.nature.com/naturecommunications 1
Genomic DNA is duplicated during the S-phase of theeukaryotic cell cycle. At the chromatin fibre level, DNAreplication can be characterized by the location on the
DNA molecule where the DNA synthetic complexes (replisomes)are assembled and replication is initiated (the so-called originof replication) and by the actual positions where DNA synthesisoccurs at any given moment, termed replication forks1. Only asubset of potential origins of replication will be activated in theindividual cell in a given cell cycle2–4. Each activated origin ofreplication normally gives rise to two replication forks thatdrift apart along the template DNA. Initiation of DNA synthesisat a particular origin of replication provides a functionaldefinition of replicon as a chromosome segment replicated as aresult of a single initiation event in a particular cell cycle.To duplicate the whole genome in a reasonable time, multiplereplicons must operate in parallel at any given time pointduring S-phase. Data regarding replicon arrangement, sizeand the rate of replication fork movement, were originallyobtained from pattern analysis of tritiated thymidine-labelledtracks of replication forks on extended DNA molecules5–7.These DNA autoradiography findings suggested that thegenome replicates via clusters of small (50–300 kbp)synchronously activated replicons8,9. The total number ofreplicons activated during S-phase was indirectly estimated as20,000–50,000 (refs 10–12).
At the cell nucleus level, focal sites of DNA synthesis, hereaftercalled replication foci (RFi) can be visualized by either labellingreplisome components or by detecting sites of nucleotideincorporation upon pulse labelling13. The spatial pattern ofsubnuclear distribution of RFi undergoes dynamic changesduring S-phase progression and is characteristic for thedifferent S-phase sub-stages10,13,14. General principles of DNAreplication were studied using the analysis of various RFicharacteristics, such as their number, brightness, size, lifetimeand their intranuclear distribution10–18. Up to six distinctpatterns of RFi could be distinguished in cycling somaticcells10,19, although more commonly S-phase was subdividedinto early, middle and late stages: Se, Sm and Sl, respectively20–22.
Notably, the number of RFi that was observed in each S-phasepattern with conventional microscopic techniques13,23 wasmuch smaller than the estimated number of active repliconsleading to the conclusion that each RF contained multiplereplicons11–16,21,23. The stability of RFi over several cell cyclesand characteristics of their brightness suggested a relation ofnuclear RFi to tandem clusters of synchronously activatedreplicons described on DNA fibres12.
In parallel, the concept of ‘replication factories’ arose fromelectron microscopy observations of localized incorporation ofreplication label and accumulation of replication proteins inB150 nuclear sites24, which were similar to the reportednumbers of RFi and followed the dynamics of RFi patternsduring S-phase25. As a result, it was suggested that genomeduplication occurred by sliding the template DNA of multiplereplicons through composite polymerizing sites of each factoryimmobilized at the nuclear matrix25.
On the basis of these initial studies, RFi were for decadesconsidered as complex functional–structural units of chromatinthat contained multiple replicons26,27.
Studies using fluorescence halo technique revealed a dynamicrelationship between replicon size and the size of chromatinloops28–30 providing a link between the organization ofDNA replication and the structural organization of chromatin.As a result it has been hypothesized that metazoan genomeis duplicated by synchronous processing of multiple loopswithin chromatin domains organized around replicationfactories31.
A comprehensive three-dimensional (3D) analysis ofelementary replication units throughout different S-phase stagesin mammalian cells was compromised by the limited resolutionof optical microscopy. Electron microscopy studies, although lesslimited in resolution, relied on precarious calculations to estimatethe total number of nuclear RFi on the basis of data obtainedfrom partial sections of nuclei32,33. Accordingly, development ofnew approaches was essential to close the gap between the dataobtained in conventional microscopic and DNA fibre studies ongenome replication in higher eukaryotes. Recent advances insuper-resolution microscopy provided tools for detailed opticalanalysis of replication structures in 3D-preserved nuclei34,35.Although, various high-resolution microscopy techniques led toan increase in the observed numbers of RFi34,36, 3D-structuredillumination microscopy (3D-SIM) proved to be the most suitableapproach allowing multicolour 3D detection of replication sites inspatially preserved nuclei34. Importantly, the correspondingeightfold increase in 3D resolution posed additional challengessince high throughput analysis and quantification of nucleicontaining thousands of RFi was impossible without developingand validating computer-assisted automated approaches.
To re-evaluate the above replication factory concept and testthe hypothesis that replicons and not replicon clusters may infact represent the in situ elementary units of DNA replication;in this study, we perform a comprehensive super-resolutionanalysis of RFi in somatic human and mouse cells. RFi arevisualized both by labelling newly synthesized DNA and PCNAas a crucial replisome component. We complement the RFianalysis with quantifications of genome size, S-phase durationand measurements of molecular replicon characteristics of thesame cells to overcome inaccuracy through indirect estimates.Using newly developed protocols for robust RFi quantification,we demonstrate that comparable numbers of several thousands ofRFi are active throughout all S-phase stages. The combinedconsideration of the experimental data show that conventionallyobserved RFi can be optically resolved down to single repliconsin all S-phase sub-stages. Our findings imply that S-phasedynamics is primarily dictated by chromatin folding andindividual synthetic complexes independently ‘read’ and ‘copy’the underlying chromatin units37.
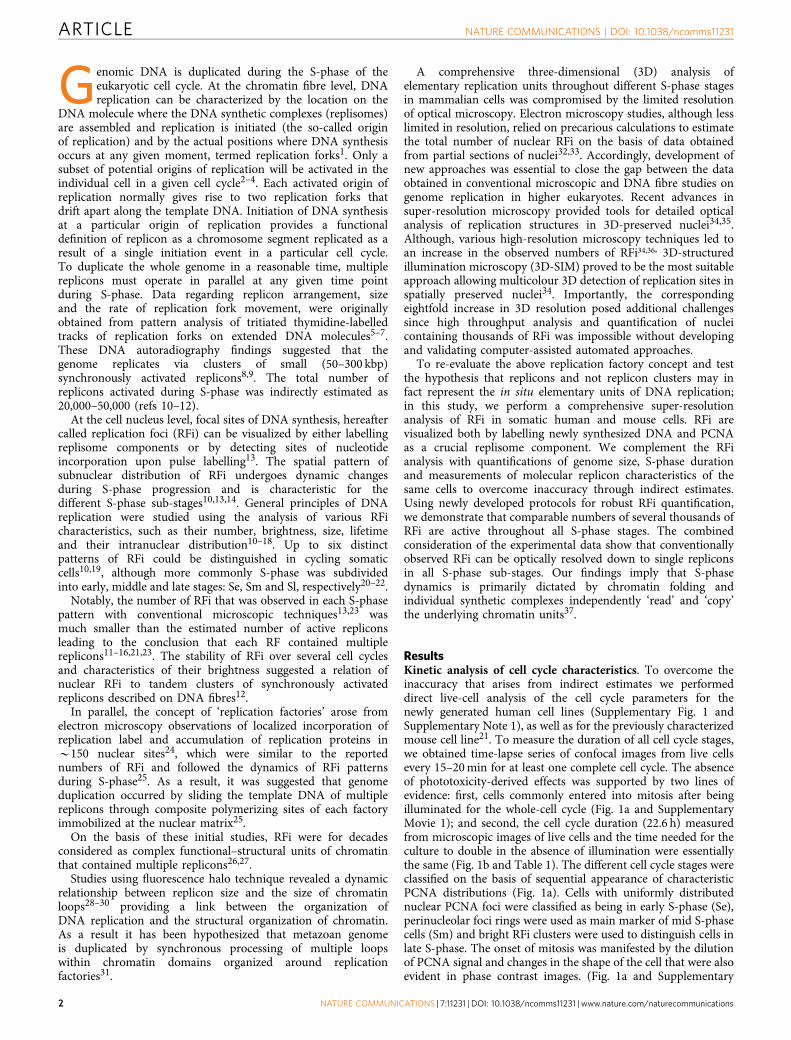
ResultsKinetic analysis of cell cycle characteristics. To overcome theinaccuracy that arises from indirect estimates we performeddirect live-cell analysis of the cell cycle parameters for thenewly generated human cell lines (Supplementary Fig. 1 andSupplementary Note 1), as well as for the previously characterizedmouse cell line21. To measure the duration of all cell cycle stages,we obtained time-lapse series of confocal images from live cellsevery 15–20 min for at least one complete cell cycle. The absenceof phototoxicity-derived effects was supported by two lines ofevidence: first, cells commonly entered into mitosis after beingilluminated for the whole-cell cycle (Fig. 1a and SupplementaryMovie 1); and second, the cell cycle duration (22.6 h) measuredfrom microscopic images of live cells and the time needed for theculture to double in the absence of illumination were essentiallythe same (Fig. 1b and Table 1). The different cell cycle stages wereclassified on the basis of sequential appearance of characteristicPCNA distributions (Fig. 1a). Cells with uniformly distributednuclear PCNA foci were classified as being in early S-phase (Se),perinucleolar foci rings were used as main marker of mid S-phasecells (Sm) and bright RFi clusters were used to distinguish cells inlate S-phase. The onset of mitosis was manifested by the dilutionof PCNA signal and changes in the shape of the cell that were alsoevident in phase contrast images. (Fig. 1a and Supplementary
ARTICLE NATURE COMMUNICATIONS | DOI: 10.1038/ncomms11231
2 NATURE COMMUNICATIONS | 7:11231 | DOI: 10.1038/ncomms11231 | www.nature.com/naturecommunications
Movie 1). We used the information on the preceding or thefollowing cell cycle stage to classify nuclei with homogeneousPCNA distribution as G1 or G2 stage.
Despite differences in their karyotypes, the human and mousecells had comparable cell cycle and S-phase (9.5 h) durations(Fig. 1b and Table 1).
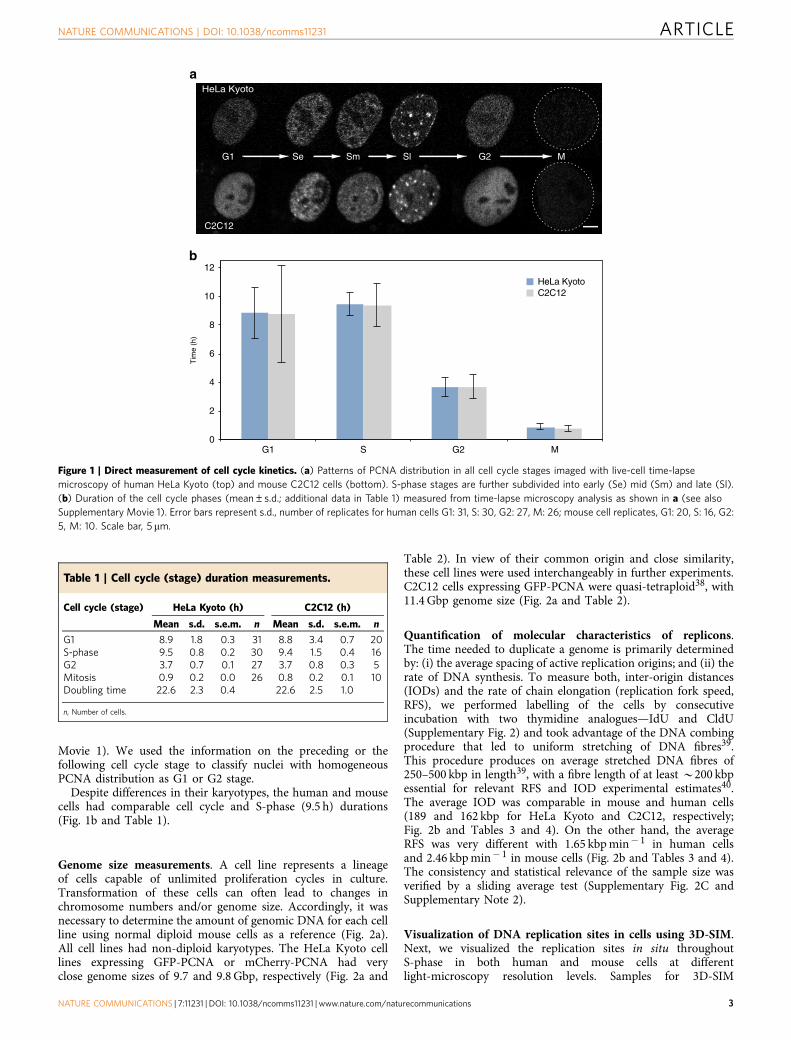
Genome size measurements. A cell line represents a lineageof cells capable of unlimited proliferation cycles in culture.Transformation of these cells can often lead to changes inchromosome numbers and/or genome size. Accordingly, it wasnecessary to determine the amount of genomic DNA for each cellline using normal diploid mouse cells as a reference (Fig. 2a).All cell lines had non-diploid karyotypes. The HeLa Kyoto celllines expressing GFP-PCNA or mCherry-PCNA had veryclose genome sizes of 9.7 and 9.8 Gbp, respectively (Fig. 2a and
Table 2). In view of their common origin and close similarity,these cell lines were used interchangeably in further experiments.C2C12 cells expressing GFP-PCNA were quasi-tetraploid38, with11.4 Gbp genome size (Fig. 2a and Table 2).
Quantification of molecular characteristics of replicons.The time needed to duplicate a genome is primarily determinedby: (i) the average spacing of active replication origins; and (ii) therate of DNA synthesis. To measure both, inter-origin distances(IODs) and the rate of chain elongation (replication fork speed,RFS), we performed labelling of the cells by consecutiveincubation with two thymidine analogues—IdU and CldU(Supplementary Fig. 2) and took advantage of the DNA combingprocedure that led to uniform stretching of DNA fibres39.This procedure produces on average stretched DNA fibres of250–500 kbp in length39, with a fibre length of at least B200 kbpessential for relevant RFS and IOD experimental estimates40.The average IOD was comparable in mouse and human cells(189 and 162 kbp for HeLa Kyoto and C2C12, respectively;Fig. 2b and Tables 3 and 4). On the other hand, the averageRFS was very different with 1.65 kbp min� 1 in human cellsand 2.46 kbp min� 1 in mouse cells (Fig. 2b and Tables 3 and 4).The consistency and statistical relevance of the sample size wasverified by a sliding average test (Supplementary Fig. 2C andSupplementary Note 2).
Visualization of DNA replication sites in cells using 3D-SIM.Next, we visualized the replication sites in situ throughoutS-phase in both human and mouse cells at differentlight-microscopy resolution levels. Samples for 3D-SIM
G1 Se Sm Sl G2 M
HeLa Kyoto
C2C12
a
b
0
2
4
6
8
10
12
G1 S G2 M
Tim
e (h
)
C2C12HeLa Kyoto
Figure 1 | Direct measurement of cell cycle kinetics. (a) Patterns of PCNA distribution in all cell cycle stages imaged with live-cell time-lapse
microscopy of human HeLa Kyoto (top) and mouse C2C12 cells (bottom). S-phase stages are further subdivided into early (Se) mid (Sm) and late (Sl).
(b) Duration of the cell cycle phases (mean±s.d.; additional data in Table 1) measured from time-lapse microscopy analysis as shown in a (see also
Supplementary Movie 1). Error bars represent s.d., number of replicates for human cells G1: 31, S: 30, G2: 27, M: 26; mouse cell replicates, G1: 20, S: 16, G2:
5, M: 10. Scale bar, 5 mm.
Table 1 | Cell cycle (stage) duration measurements.
Cell cycle (stage) HeLa Kyoto (h) C2C12 (h)
Mean s.d. s.e.m. n Mean s.d. s.e.m. n
G1 8.9 1.8 0.3 31 8.8 3.4 0.7 20S-phase 9.5 0.8 0.2 30 9.4 1.5 0.4 16G2 3.7 0.7 0.1 27 3.7 0.8 0.3 5Mitosis 0.9 0.2 0.0 26 0.8 0.2 0.1 10Doubling time 22.6 2.3 0.4 22.6 2.5 1.0
n, Number of cells.
NATURE COMMUNICATIONS | DOI: 10.1038/ncomms11231 ARTICLE
NATURE COMMUNICATIONS | 7:11231 | DOI: 10.1038/ncomms11231 | www.nature.com/naturecommunications 3
a
0
1
2
3
0 10 20 30 40 50 60 70 80 90 100 110 120 130 140 150
G0/G1
C57Blmouse splenocytes
Cel
l cou
nt 1
03
Population of cycling cells
G1
G2/MS
Normalized DNA amount
b
•Rep
licat
ion
fork
spe
ed(1
03 N
td p
er m
in)
Inte
r-or
igin
dis
tanc
e (k
bp)
100
200
300
400
500
0
600
1
2
3
4
5
0
6
7HeLa Kyoto C2C12 HeLa Kyoto C2C12
188.7 ± 121.4n= 50
161.7 ± 100.3n= 38
2.46 ± 0.58n= 30
1.65 ± 1.28n= 122
•
••
Figure 2 | Genomic DNA content and DNA fibre analysis of replicons. (a) DNA flow cytometry histogram of ethidium bromide/olivomycin stained HeLa
Kyoto mCherry-PCNA expressing cells admixed with C57Bl mouse splenocytes is shown. The peak at channels 34–38 corresponds to the G1/G0 peak of
non-cycling splenocytes. HeLa Kyoto cell cycle distribution is represented by a typical DNA flow cytometry histogram consisting of G1, S-phase and G2/M
populations. To calculate the amount of genomic DNA in the cycling cell line, G1/G0 peak of mouse splenocytes and G1 peak of the cell line were
approximated with Gaussian distributions and the relative position of the G1 peak was calculated (for details see methods and Table 2). (b) Cells were pulse
labelled with IdU for 30 min, followed by a 30 min CldU pulse. Whole-genome DNA was extracted under gentle conditions and single DNA fibres were
stretched with the constant factor of 2 kbp permm. Incorporated nucleotides were immunostained and signals acquired in a wide-field microscope.
Fluorescent tracks were measured by hand and used to calculate mean IOD and RFS. For details see methods; Supplementary Fig. 2 and Tables 3 and 4.
Table 2 | Genome size measurements.
Cell line Relative DNA amount* Genomic DNA (pg) Genome Size (103 Mbp) n
HeLa Kyoto GFP-PCNA 1.527 9.899 9.682±0.002 9HeLa Kyoto mCherry-PCNA 1.544 10.007 9.786±0.006 8C2C12 GFP-PCNA 1.798 11.676 11.419±0.006 4
*represents the ratio between the DNA amounts of the indicated cells in G1 and the DNA amount of G0/G1 C57Bl mouse splenocytes. All values are given as Mean±s.e.m.; n represents number ofindependent measurements.
Table 3 | Statistics of the IOD measurements.
IOD (kbp) HeLa Kyoto C2C12
Mean 188.7 161.7s.d. 121.4 100.3s.e.m. 17.2 16.395% CI 33.6 31.9n 50 38
CI, confidence interval; IOD, inter-origin distance; n, number of tracks.
Table 4 | Statistics of the RFS measurements.
RFS (103Ntd per min) HeLa Kyoto C2C12
Mean 1.65 2.46s.d. 1.28 0.58s.e.m. 0.12 0.1195% CI 0.23 0.21n 122 30
CI, confidence interval; n, number of tracks; RFS, replication fork speed.
ARTICLE NATURE COMMUNICATIONS | DOI: 10.1038/ncomms11231
4 NATURE COMMUNICATIONS | 7:11231 | DOI: 10.1038/ncomms11231 | www.nature.com/naturecommunications
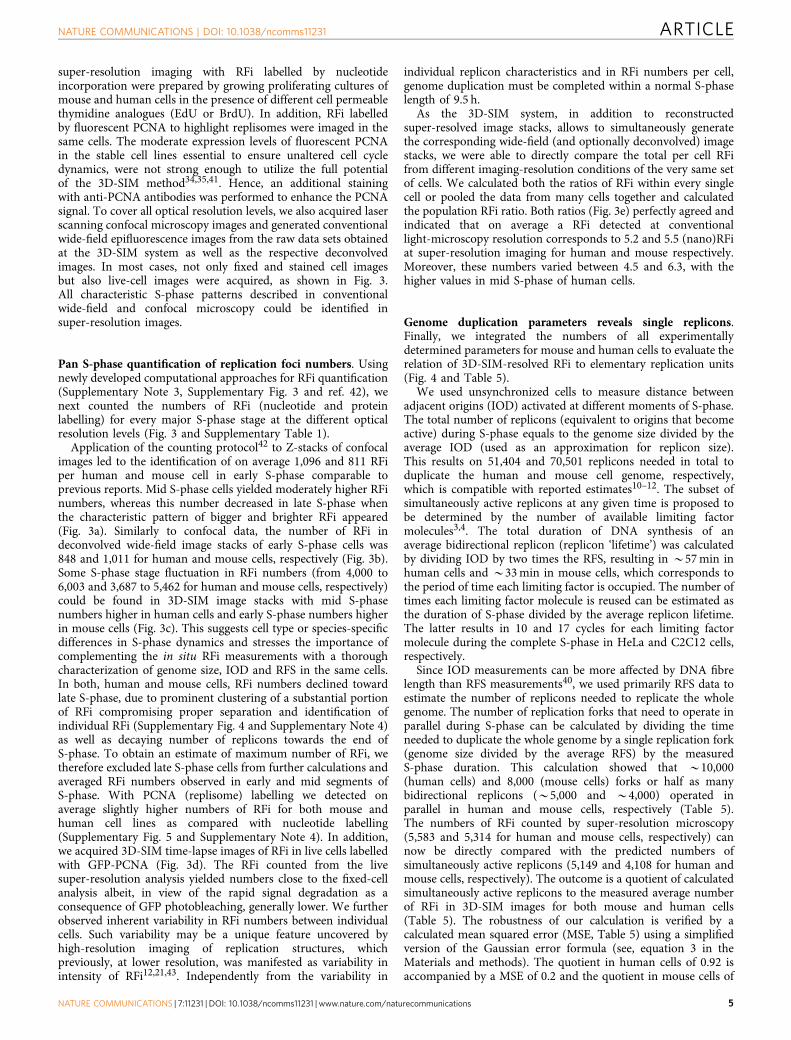
super-resolution imaging with RFi labelled by nucleotideincorporation were prepared by growing proliferating cultures ofmouse and human cells in the presence of different cell permeablethymidine analogues (EdU or BrdU). In addition, RFi labelledby fluorescent PCNA to highlight replisomes were imaged in thesame cells. The moderate expression levels of fluorescent PCNAin the stable cell lines essential to ensure unaltered cell cycledynamics, were not strong enough to utilize the full potentialof the 3D-SIM method34,35,41. Hence, an additional stainingwith anti-PCNA antibodies was performed to enhance the PCNAsignal. To cover all optical resolution levels, we also acquired laserscanning confocal microscopy images and generated conventionalwide-field epifluorescence images from the raw data sets obtainedat the 3D-SIM system as well as the respective deconvolvedimages. In most cases, not only fixed and stained cell imagesbut also live-cell images were acquired, as shown in Fig. 3.All characteristic S-phase patterns described in conventionalwide-field and confocal microscopy could be identified insuper-resolution images.
Pan S-phase quantification of replication foci numbers. Usingnewly developed computational approaches for RFi quantification(Supplementary Note 3, Supplementary Fig. 3 and ref. 42), wenext counted the numbers of RFi (nucleotide and proteinlabelling) for every major S-phase stage at the different opticalresolution levels (Fig. 3 and Supplementary Table 1).
Application of the counting protocol42 to Z-stacks of confocalimages led to the identification of on average 1,096 and 811 RFiper human and mouse cell in early S-phase comparable toprevious reports. Mid S-phase cells yielded moderately higher RFinumbers, whereas this number decreased in late S-phase whenthe characteristic pattern of bigger and brighter RFi appeared(Fig. 3a). Similarly to confocal data, the number of RFi indeconvolved wide-field image stacks of early S-phase cells was848 and 1,011 for human and mouse cells, respectively (Fig. 3b).Some S-phase stage fluctuation in RFi numbers (from 4,000 to6,003 and 3,687 to 5,462 for human and mouse cells, respectively)could be found in 3D-SIM image stacks with mid S-phasenumbers higher in human cells and early S-phase numbers higherin mouse cells (Fig. 3c). This suggests cell type or species-specificdifferences in S-phase dynamics and stresses the importance ofcomplementing the in situ RFi measurements with a thoroughcharacterization of genome size, IOD and RFS in the same cells.In both, human and mouse cells, RFi numbers declined towardlate S-phase, due to prominent clustering of a substantial portionof RFi compromising proper separation and identification ofindividual RFi (Supplementary Fig. 4 and Supplementary Note 4)as well as decaying number of replicons towards the end ofS-phase. To obtain an estimate of maximum number of RFi, wetherefore excluded late S-phase cells from further calculations andaveraged RFi numbers observed in early and mid segments ofS-phase. With PCNA (replisome) labelling we detected onaverage slightly higher numbers of RFi for both mouse andhuman cell lines as compared with nucleotide labelling(Supplementary Fig. 5 and Supplementary Note 4). In addition,we acquired 3D-SIM time-lapse images of RFi in live cells labelledwith GFP-PCNA (Fig. 3d). The RFi counted from the livesuper-resolution analysis yielded numbers close to the fixed-cellanalysis albeit, in view of the rapid signal degradation as aconsequence of GFP photobleaching, generally lower. We furtherobserved inherent variability in RFi numbers between individualcells. Such variability may be a unique feature uncovered byhigh-resolution imaging of replication structures, whichpreviously, at lower resolution, was manifested as variability inintensity of RFi12,21,43. Independently from the variability in
individual replicon characteristics and in RFi numbers per cell,genome duplication must be completed within a normal S-phaselength of 9.5 h.
As the 3D-SIM system, in addition to reconstructedsuper-resolved image stacks, allows to simultaneously generatethe corresponding wide-field (and optionally deconvolved) imagestacks, we were able to directly compare the total per cell RFifrom different imaging-resolution conditions of the very same setof cells. We calculated both the ratios of RFi within every singlecell or pooled the data from many cells together and calculatedthe population RFi ratio. Both ratios (Fig. 3e) perfectly agreed andindicated that on average a RFi detected at conventionallight-microscopy resolution corresponds to 5.2 and 5.5 (nano)RFiat super-resolution imaging for human and mouse respectively.Moreover, these numbers varied between 4.5 and 6.3, with thehigher values in mid S-phase of human cells.
Genome duplication parameters reveals single replicons.Finally, we integrated the numbers of all experimentallydetermined parameters for mouse and human cells to evaluate therelation of 3D-SIM-resolved RFi to elementary replication units(Fig. 4 and Table 5).
We used unsynchronized cells to measure distance betweenadjacent origins (IOD) activated at different moments of S-phase.The total number of replicons (equivalent to origins that becomeactive) during S-phase equals to the genome size divided by theaverage IOD (used as an approximation for replicon size).This results on 51,404 and 70,501 replicons needed in total toduplicate the human and mouse cell genome, respectively,which is compatible with reported estimates10–12. The subset ofsimultaneously active replicons at any given time is proposed tobe determined by the number of available limiting factormolecules3,4. The total duration of DNA synthesis of anaverage bidirectional replicon (replicon ‘lifetime’) was calculatedby dividing IOD by two times the RFS, resulting in B57 min inhuman cells and B33 min in mouse cells, which corresponds tothe period of time each limiting factor is occupied. The number oftimes each limiting factor molecule is reused can be estimated asthe duration of S-phase divided by the average replicon lifetime.The latter results in 10 and 17 cycles for each limiting factormolecule during the complete S-phase in HeLa and C2C12 cells,respectively.
Since IOD measurements can be more affected by DNA fibrelength than RFS measurements40, we used primarily RFS data toestimate the number of replicons needed to replicate the wholegenome. The number of replication forks that need to operate inparallel during S-phase can be calculated by dividing the timeneeded to duplicate the whole genome by a single replication fork(genome size divided by the average RFS) by the measuredS-phase duration. This calculation showed that B10,000(human cells) and 8,000 (mouse cells) forks or half as manybidirectional replicons (B5,000 and B4,000) operated inparallel in human and mouse cells, respectively (Table 5).The numbers of RFi counted by super-resolution microscopy(5,583 and 5,314 for human and mouse cells, respectively) cannow be directly compared with the predicted numbers ofsimultaneously active replicons (5,149 and 4,108 for human andmouse cells, respectively). The outcome is a quotient of calculatedsimultaneously active replicons to the measured average numberof RFi in 3D-SIM images for both mouse and human cells(Table 5). The robustness of our calculation is verified by acalculated mean squared error (MSE, Table 5) using a simplifiedversion of the Gaussian error formula (see, equation 3 in theMaterials and methods). The quotient in human cells of 0.92 isaccompanied by a MSE of 0.2 and the quotient in mouse cells of
NATURE COMMUNICATIONS | DOI: 10.1038/ncomms11231 ARTICLE
NATURE COMMUNICATIONS | 7:11231 | DOI: 10.1038/ncomms11231 | www.nature.com/naturecommunications 5
Rep
licat
ion
foci
103
1
2
0
Rep
licat
ion
foci
103
1
2
0
Mid
dle
sect
ion
HeLa Kyoto C2C12
Mid
dle
sect
ion
Zm
ax
Se Sm Sl
Zm
ax
Zm
axM
iddl
e se
ctio
n
Se Sm Sl
Rep
licat
ion
foci
103
6
12
0
HeLa Kyoto C2C12
Mid
dle
sect
ion
Se Sm Sl
Zm
ax
Zm
axM
iddl
e se
ctio
n
Se Sm Sl
Rep
licat
ion
foci
103
T= 0 s T= 10 s T= 50 sT= 40 sT= 30 sT= 20 s
Mid
dle
sect
ion
Zm
ax
a
b
c
d
e
Rep
licat
ion
foci
103
6
12
0
Rep
licat
ion
foci
103
1
2
0
6
12
0
HeLa Kyoto
Se Sm Sl
C2C12
Mid
dle
sect
ion
Zm
ax
4,217 ± 3,131n= 14
Se Sm Sl
Rep
licat
ion
foci
103
1
2
0
HeLa Kyoto C2C12
4.5 6.2 5.24.8 6.3 5.64.6 6.2 5.4
0
2
4
6
Sen= 41
Smn= 19
Sln= 43
5.9 5.3 5.45.9 5.3 5.35.9 5.3 5.3
0
2
4
6
Sen= 11
Smn= 15
Sln= 10
5.1 5.55.4 5.55.2 5.5
0
2
4
6
HeLa Alln= 103
C2C12 Alln= 36
HeLa Kyoto C2C12
HeLa Kyoto C2C12
Rep
licat
ion
foci
103
Rep
licat
ion
foci
103
Rep
licat
ion
foci
103
1
2
0
1
2
0
1
2
0
1
2
0
6
12
0
6
12
0
Se + Sm + Sl
Se + Sm
Se + Sm + Sl
Se + Sm
Se + Sm + Sl
Se + Sm
Se + Sm + Sl
Mean of individual foci ratios Mean of substage population ratios Mean
5,027 ± 2,409n= 16
5,005 ± 2,428n= 244
4,809 ± 2,100n= 132
5,583 ± 2,016n= 155
5,314 ± 2,169n= 91
681 ± 329n= 138
835 ± 245n= 38
814 ± 309n= 79
914 ± 215n= 27
930 ± 277n= 50
1,176 ± 177n= 84
999 ± 296n= 31
5,246 ± 2,111n= 86
6,003 ± 1,819n= 69
4,000 ± 2,751n= 89
5,462 ± 1,689n= 31
5,237 ± 2,389n= 60
3,687 ± 1,410n= 41
642 ± 211n= 11
847 ± 214n= 16
1,011 ± 185n= 11
504 ± 266n= 59
765 ± 221n= 32
848 ± 356n= 47
1,096 ± 157n= 49
1,287 ± 142n= 35
811 ± 226n= 11
1,102 ± 282n= 20
819 ± 204n= 19
617 ± 157n= 30
1,029 ± 301n= 114
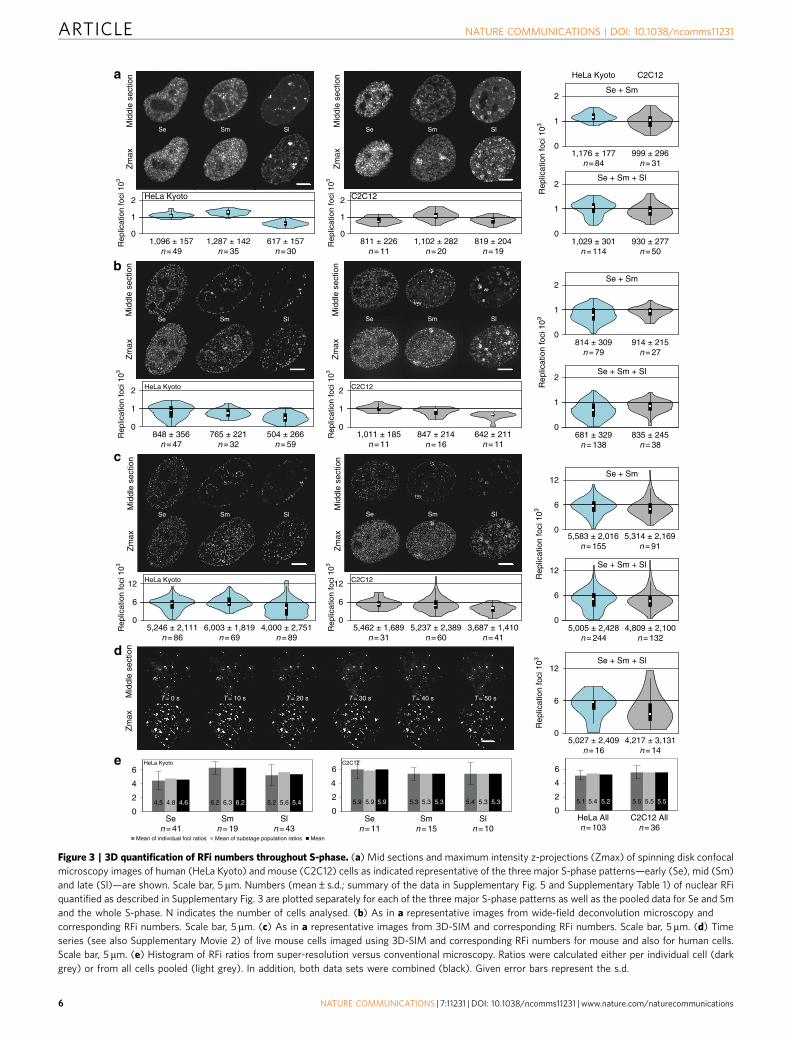
Figure 3 | 3D quantification of RFi numbers throughout S-phase. (a) Mid sections and maximum intensity z-projections (Zmax) of spinning disk confocal
microscopy images of human (HeLa Kyoto) and mouse (C2C12) cells as indicated representative of the three major S-phase patterns—early (Se), mid (Sm)
and late (Sl)—are shown. Scale bar, 5 mm. Numbers (mean±s.d.; summary of the data in Supplementary Fig. 5 and Supplementary Table 1) of nuclear RFi
quantified as described in Supplementary Fig. 3 are plotted separately for each of the three major S-phase patterns as well as the pooled data for Se and Sm
and the whole S-phase. N indicates the number of cells analysed. (b) As in a representative images from wide-field deconvolution microscopy and
corresponding RFi numbers. Scale bar, 5 mm. (c) As in a representative images from 3D-SIM and corresponding RFi numbers. Scale bar, 5mm. (d) Time
series (see also Supplementary Movie 2) of live mouse cells imaged using 3D-SIM and corresponding RFi numbers for mouse and also for human cells.
Scale bar, 5 mm. (e) Histogram of RFi ratios from super-resolution versus conventional microscopy. Ratios were calculated either per individual cell (dark
grey) or from all cells pooled (light grey). In addition, both data sets were combined (black). Given error bars represent the s.d.
ARTICLE NATURE COMMUNICATIONS | DOI: 10.1038/ncomms11231
6 NATURE COMMUNICATIONS | 7:11231 | DOI: 10.1038/ncomms11231 | www.nature.com/naturecommunications
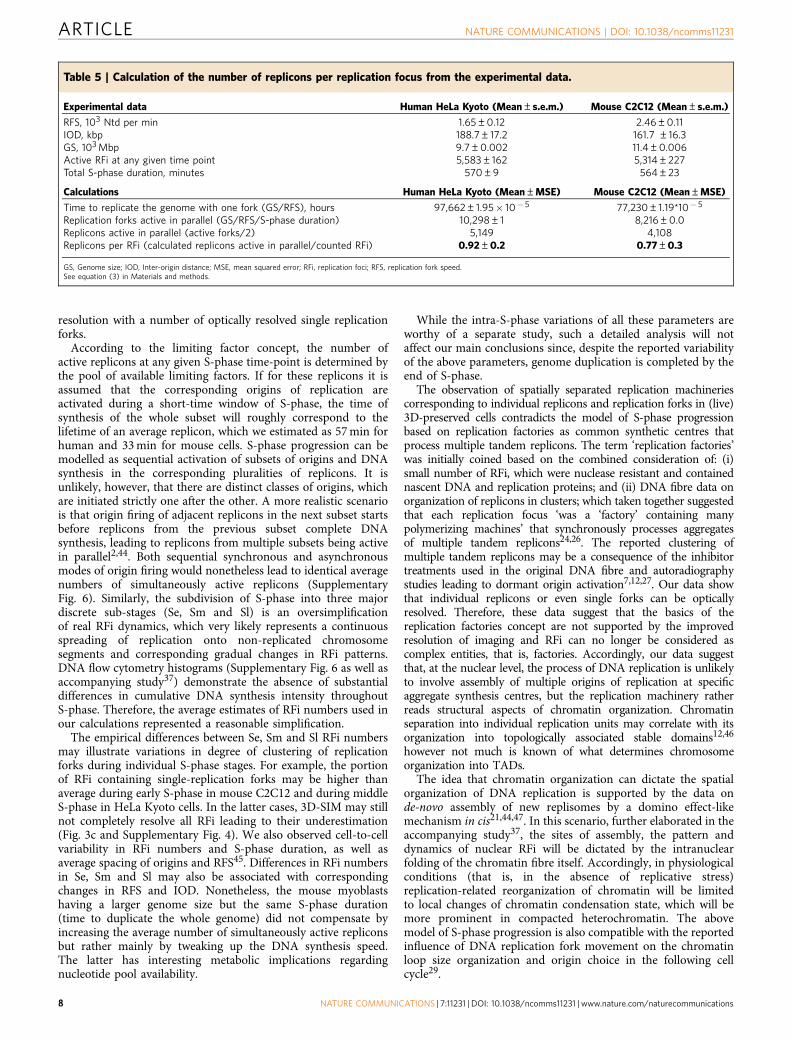
0.77 has a MSE of 0.3 respectively. Those MSE take into accountthe variances of the measured genome size (Table 2), themeasured fork speed (Table 3) and the measured S-phase length(Table 1). The difference of the average number of replicons persingle RF between human (0.92) and mouse (0.77) cells, likelyarise from differential clustering of replication forks in particularcell types and/or S-phase sub-periods when some RFi can containindividual replication forks.
All in all, we conclude that, for all S-phase patterns, themajority of nuclear replication sites were resolved down to thelevel of single replicons with a portion of spatially separated singlereplication forks.
DiscussionIn this study, we present a comprehensive examination ofDNA replication in mammalian cells including various resolution
levels of optical microscopy. Special effort was made to controlfor all inaccuracies that could affect the outcome of the analysisand characterization of RFi in super-resolution images.
First, we took advantage of mammalian cell lines stablyexpressing fluorescent replication factors and performed confocallive-cell microscopy to directly characterize the temporal S-phasedynamics in these cells. We further measured genome size foreach cell line used in our experiments and analysed the molecularcharacteristics of replicons in the same cells. To quantify RFinumbers in super-resolution images, we developed and verifieduser-independent protocols for 3D RFi segmentation andcounting. We compared RFi quantifications results with respectwith the other parameters measured for identical cells.
In both cell lines we detected on average five thousands RFi atany S-phase sub-stage using super-resolution imaging (Fig. 3).Combining all the experimental data together, we concluded thatthe majority of RFi represent single replicons at 3D-SIM
Nascent DNA
Replisome
Template DNA
Replicon
Ori
WF
Confocal
SR
a bAverage reported RFi number
c
Rep
licat
ion
foci
103
1
2
0
3
4
5
6
Super-resolution
Confocal
Wide-field
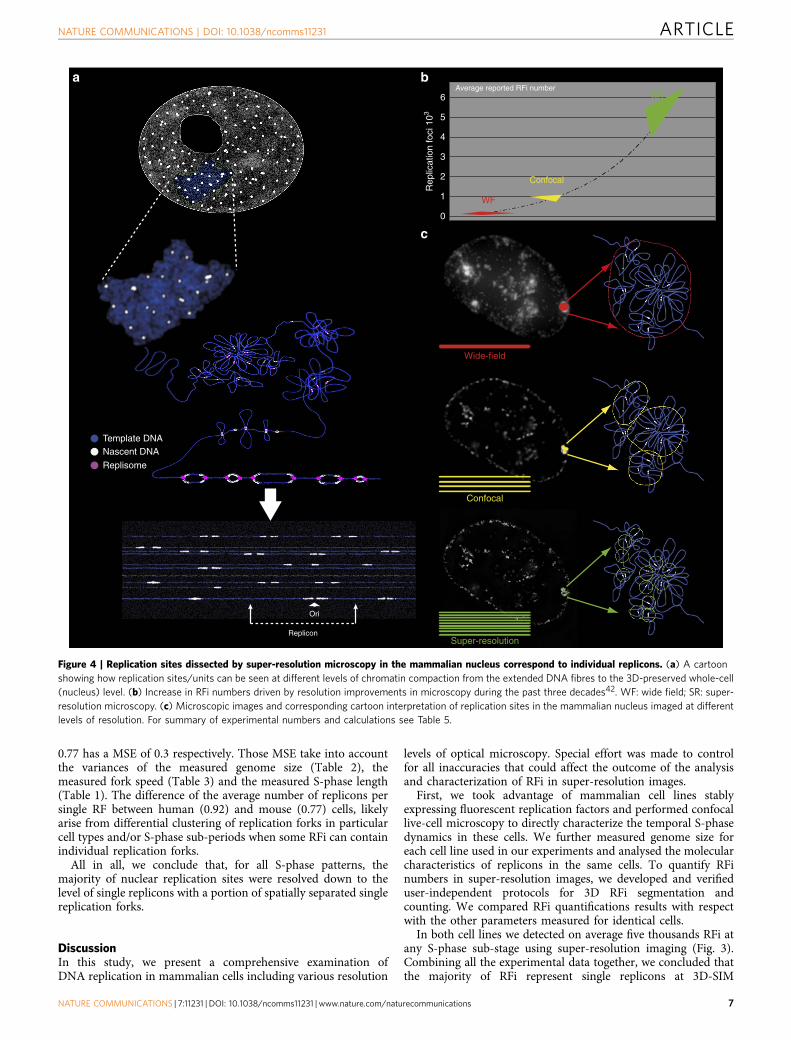
Figure 4 | Replication sites dissected by super-resolution microscopy in the mammalian nucleus correspond to individual replicons. (a) A cartoon
showing how replication sites/units can be seen at different levels of chromatin compaction from the extended DNA fibres to the 3D-preserved whole-cell
(nucleus) level. (b) Increase in RFi numbers driven by resolution improvements in microscopy during the past three decades42. WF: wide field; SR: super-
resolution microscopy. (c) Microscopic images and corresponding cartoon interpretation of replication sites in the mammalian nucleus imaged at different
levels of resolution. For summary of experimental numbers and calculations see Table 5.
NATURE COMMUNICATIONS | DOI: 10.1038/ncomms11231 ARTICLE
NATURE COMMUNICATIONS | 7:11231 | DOI: 10.1038/ncomms11231 | www.nature.com/naturecommunications 7
resolution with a number of optically resolved single replicationforks.
According to the limiting factor concept, the number ofactive replicons at any given S-phase time-point is determined bythe pool of available limiting factors. If for these replicons it isassumed that the corresponding origins of replication areactivated during a short-time window of S-phase, the time ofsynthesis of the whole subset will roughly correspond to thelifetime of an average replicon, which we estimated as 57 min forhuman and 33 min for mouse cells. S-phase progression can bemodelled as sequential activation of subsets of origins and DNAsynthesis in the corresponding pluralities of replicons. It isunlikely, however, that there are distinct classes of origins, whichare initiated strictly one after the other. A more realistic scenariois that origin firing of adjacent replicons in the next subset startsbefore replicons from the previous subset complete DNAsynthesis, leading to replicons from multiple subsets being activein parallel2,44. Both sequential synchronous and asynchronousmodes of origin firing would nonetheless lead to identical averagenumbers of simultaneously active replicons (SupplementaryFig. 6). Similarly, the subdivision of S-phase into three majordiscrete sub-stages (Se, Sm and Sl) is an oversimplificationof real RFi dynamics, which very likely represents a continuousspreading of replication onto non-replicated chromosomesegments and corresponding gradual changes in RFi patterns.DNA flow cytometry histograms (Supplementary Fig. 6 as well asaccompanying study37) demonstrate the absence of substantialdifferences in cumulative DNA synthesis intensity throughoutS-phase. Therefore, the average estimates of RFi numbers used inour calculations represented a reasonable simplification.
The empirical differences between Se, Sm and Sl RFi numbersmay illustrate variations in degree of clustering of replicationforks during individual S-phase stages. For example, the portionof RFi containing single-replication forks may be higher thanaverage during early S-phase in mouse C2C12 and during middleS-phase in HeLa Kyoto cells. In the latter cases, 3D-SIM may stillnot completely resolve all RFi leading to their underestimation(Fig. 3c and Supplementary Fig. 4). We also observed cell-to-cellvariability in RFi numbers and S-phase duration, as well asaverage spacing of origins and RFS45. Differences in RFi numbersin Se, Sm and Sl may also be associated with correspondingchanges in RFS and IOD. Nonetheless, the mouse myoblastshaving a larger genome size but the same S-phase duration(time to duplicate the whole genome) did not compensate byincreasing the average number of simultaneously active repliconsbut rather mainly by tweaking up the DNA synthesis speed.The latter has interesting metabolic implications regardingnucleotide pool availability.
While the intra-S-phase variations of all these parameters areworthy of a separate study, such a detailed analysis will notaffect our main conclusions since, despite the reported variabilityof the above parameters, genome duplication is completed by theend of S-phase.
The observation of spatially separated replication machineriescorresponding to individual replicons and replication forks in (live)3D-preserved cells contradicts the model of S-phase progressionbased on replication factories as common synthetic centres thatprocess multiple tandem replicons. The term ‘replication factories’was initially coined based on the combined consideration of: (i)small number of RFi, which were nuclease resistant and containednascent DNA and replication proteins; and (ii) DNA fibre data onorganization of replicons in clusters; which taken together suggestedthat each replication focus ‘was a ‘factory’ containing manypolymerizing machines’ that synchronously processes aggregatesof multiple tandem replicons24,26. The reported clustering ofmultiple tandem replicons may be a consequence of the inhibitortreatments used in the original DNA fibre and autoradiographystudies leading to dormant origin activation7,12,27. Our data showthat individual replicons or even single forks can be opticallyresolved. Therefore, these data suggest that the basics of thereplication factories concept are not supported by the improvedresolution of imaging and RFi can no longer be considered ascomplex entities, that is, factories. Accordingly, our data suggestthat, at the nuclear level, the process of DNA replication is unlikelyto involve assembly of multiple origins of replication at specificaggregate synthesis centres, but the replication machinery ratherreads structural aspects of chromatin organization. Chromatinseparation into individual replication units may correlate with itsorganization into topologically associated stable domains12,46
however not much is known of what determines chromosomeorganization into TADs.
The idea that chromatin organization can dictate the spatialorganization of DNA replication is supported by the data onde-novo assembly of new replisomes by a domino effect-likemechanism in cis21,44,47. In this scenario, further elaborated in theaccompanying study37, the sites of assembly, the pattern anddynamics of nuclear RFi will be dictated by the intranuclearfolding of the chromatin fibre itself. Accordingly, in physiologicalconditions (that is, in the absence of replicative stress)replication-related reorganization of chromatin will be limitedto local changes of chromatin condensation state, which will bemore prominent in compacted heterochromatin. The abovemodel of S-phase progression is also compatible with the reportedinfluence of DNA replication fork movement on the chromatinloop size organization and origin choice in the following cellcycle29.
Table 5 | Calculation of the number of replicons per replication focus from the experimental data.
Experimental data Human HeLa Kyoto (Mean±s.e.m.) Mouse C2C12 (Mean±s.e.m.)
RFS, 103 Ntd per min 1.65±0.12 2.46±0.11IOD, kbp 188.7±17.2 161.7 ±16.3GS, 103 Mbp 9.7±0.002 11.4±0.006Active RFi at any given time point 5,583±162 5,314±227Total S-phase duration, minutes 570±9 564±23
Calculations Human HeLa Kyoto (Mean±MSE) Mouse C2C12 (Mean±MSE)
Time to replicate the genome with one fork (GS/RFS), hours 97,662±1.95� 10� 5 77,230±1.19*10� 5
Replication forks active in parallel (GS/RFS/S-phase duration) 10,298±1 8,216±0.0Replicons active in parallel (active forks/2) 5,149 4,108Replicons per RFi (calculated replicons active in parallel/counted RFi) 0.92±0.2 0.77±0.3
GS, Genome size; IOD, Inter-origin distance; MSE, mean squared error; RFi, replication foci; RFS, replication fork speed.See equation (3) in Materials and methods.
ARTICLE NATURE COMMUNICATIONS | DOI: 10.1038/ncomms11231
8 NATURE COMMUNICATIONS | 7:11231 | DOI: 10.1038/ncomms11231 | www.nature.com/naturecommunications
Resolving conventional nuclear RFi down to sites containingsingle replicons or replication forks implies a modifiedinterpretation of the RFi characteristics that are traditionallyanalysed in studies of spatio-temporal organization of DNAreplication. In this respect, the original meaning of the term‘replication factory’ as a macromolecular complex performingsimultaneous synthesis of multiple replicons, needs to be reducedto smaller replisome complexes or even single replisomes, whichare assembled on DNA spatially organized within the nucleus.
An inherent component of the replication factory model wereclusters of 30 nm chromatin loops arranged at each factory26,which were assumed to form rosette-like chromatin sub-compartments. Analysis of chromatin interactions using3C-based technologies48 has suggested that, above 11 nmnucleosomal string, there can exist not only canonical 30 nmfibre49 but also various higher-level compaction states ofinterphase chromatin50,51. Our data and the ensuing model37
are compatible with the view that interphase chromatin fibres areorganized by complex and dynamic topological loopinginteractions52, which provide a structural framework for DNAmetabolism. Based on our comparison of numbers of RFifrom conventional and super-resolution microscopy, an averageof five replicons correspond to one conventional replicationfocus (Fig. 3e). This analysis suggests a spatial association ofreplicons within one Mbp chromatin segment, which likelyreflects the spatial chromatin organization of the segment.Nonetheless, genetic continuity would not be mandatory forsuch an association. As proposed in our accompanying study37,the induced domino-like replication origin activation, wouldimplicitly lead to the temporal grouping of active replicons withina chromatin fibre. Further experimental analyses of dynamicrelationships between neighbouring RFi will be needed.
Finally, the results presented in this study also suggest that3D-SIM microscopy is a first-choice approach for multicolour 3Danalysis of elementary replication units in eukaryotic cells. Based on3D-SIM microscopy and multicolour 3D analysis, further experi-ments need to be designed to address the 3D arrangement ofreplicons in relation to epigenetic chromatin signatures and otheraspects of functional chromatin organization. Our findings andongoing development of higher spatio-temporal resolution 3D-SIMlive systems53–55 create a basis for in vivo genome duplicationanalysis in 3D at a single-replicon resolution. Importantly, wepresent evidence that individual replicons within the chromatincontext and not replicon clusters represent the main players of DNAreplication. We propose that beyond the 150–200 bp nucleosomalDNA unit, a subsequent order of functional chromatin organizationis constituted by the a thousand times larger (150–200 kbp) genomeunit functioning as individual replicons during S-phase. Fifty yearsafter the introduction of the replicon concept56 individual repliconsare again in focus backed by our vastly improved knowledge ofchromatin structure and function.
MethodsCell culture. HeLa Kyoto cells57 (a kind gift from Jan Ellenberg) were grown inDMEM medium supplemented with 10% FCS, L-glutamine and antibiotics at 37 �Cin a humidified atmosphere of 5% CO2. Mouse C2C12 myoblasts expressingfluorescently tagged PCNA21 were grown in DMEM medium supplementedwith 20% FCS, L-glutamine and antibiotics at 37 �C in a humidified atmosphereof 5% CO2.
Generation of cell lines stably expressing fluorescent PCNA. HeLa Kyoto celllines expressing fluorescent PCNA variants were obtained using the Flp-In system(Invitrogen) based on the Flp site-specific recombinase. Briefly, cells were firsttransfected with a plasmid bearing a FRT site and the Zeocin resistance gene fused tothe LacZ gene (pFRT-lacZeo) using PEI transfection58. Cells where the plasmidintegrated into a chromosome were selected throughout a week on the basis of thenewly acquired Zeocin resistance (75mg ml� 1) and eight clones with integrated FRT
sites were isolated. Beta-galactosidase activity of HeLa Kyoto LacZ stable clones wasthen verified using X-gal and ONPG (o-nitrophenyl-b-D-galactosidase) assays.
HeLa Kyoto FRTLacZ clones with low and high b-galactosidase activity wereselected for further transfection with pFRT-B-GPCNA (encoding GFP-PCNA) andpFRT-B-CPCNA (encoding mCherry-PCNA) plasmids and cotransfected withpOG44 Flp-recombinase using Transfectin (BioRad) (Supplementary Fig. 1A).Four hours after transfection the cell culture medium was exchanged and cells weregrown for 48 h and selected with 2.5 mg ml� 1 Blasticidin (Invitrogen).
Characterization of cell lines expressing fluorescent PCNA. Absence of cellcycle effects was verified by propidium iodide (PI) staining and flow cytometryanalysis (Supplementary Fig. 1C). For cell cycle analysis with PI staining, cells weretrypsinized, washed with PBS, pelleted and fixed with ice-cold methanol (1–4 hincubated at 4 �C). After fixation, cells were pelleted and resuspended in PBS thentreated with RNAseA (Sigma, working concentration: 50 mg ml� 1) and incubatedwith PI solution (final concentration 50 mg ml� 1, 30 min at 4 �C). Samples wererun on a BD FACSVantage flow cytometer and the data were analysed usingFlowJo software (Tree Star Inc.).
Expression and characteristic S-phase distributions of fluorescent PCNA wereverified visually. Colocalization of GFP-PCNA and mCherry-PCNA with activesites of active nuclear replication was confirmed using BrdU labelling and detectionthat was performed as follows: BrdU (BD Biosciences) was added to the cell culturemedium to the final concentration of 100mM for 30 min, the cells were thenwashed with PBS and then fixed with 3.7% formaldehyde for 10 min at roomtemperature; DNA was denatured by DNAseI treatment, anti-BrdU primary mouseantibody (1:5, BD Biosciences, catalog # 347580) and donkey anti-mouse IgG TexasRed (1:200, Jackson Immuno Research Laboratories, catalog # 715-075-151) or goatanti-mouse IgG Alexa Fluor 488 (1:400, ThermoFisher Scientific, catalog # 11001)secondary antibodies; and nuclear DNA was stained with DAPI (0.5 mg ml� 1),5 min at room temperature.
Counting of BrdU positive S-phase cells versus non-S-phase cells showed that34.9% of cells were in S-phase. This number was comparable to the flow cytometryestimates.
For immunoblot analysis (Supplementary Fig. 1B) of the ectopic fusion proteinsand the relative amount of the endogenous PCNA, whole-cell lysates were analysedby SDS–polyacrylamide gel electrophoresis, transferred to nitrocellulosemembranes and incubated with rat anti-PCNA monoclonal antibodies 16D10(ref. 59) followed by donkey anti-rat IgG Cy5 (1:200, Jackson Immuno ResearchLaboratories, catalog # 712-175-153) and detection using a fluorescence scanningimaging system (STORM, GE Healthcare).
Genome size measurements. To measure the amount of genomic DNA the cellswere washed twice with PBS/EDTA buffer, trypsinized and resuspended in Versenesolution (0.2 g l� 1 EDTA(Na4) in PBS). Before staining, cells were counted andmixed with a comparable number of male C57Bl mice splenocytes. For DNAstaining, the cellular suspension was supplemented with Triton X-100 (Sigma) tothe final concentration of 0.1%, ethidium bromide (Calbiochem) to the finalconcentration 20 mg ml� 1 and olivomycin A (MZM) to the final concentration40 mg ml� 1 and MgCl2 to the final concentration 15 mM, and incubated for 24 h at4 �C. Measurements were performed using a self-built high-resolution cytometersetup based on a fluorescence microscope and laminar flow chamber60. At leastthree DNA histograms were obtained for each probe. For C57Bl mouse splenocytesused as a standard object, the variation coefficient of DNA histograms was o2.0%.To calculate the average DNA content in a cell population, positions of the peak inthe histogram corresponding to the mouse splenocytes and G1 peak of the cellpopulation were determined (Fig. 2a). The error of measurement of the G1 peakposition was r0.2%. The relative amount of the genomic DNA in each cell linewas corrected for human/mouse genome size and female/male differences(factors of 1.06 and 1.016, respectively). The size of genomic DNA in base pairswas calculated based on the estimated amount of DNA in a diploid humangenome—7 pg (ref. 61)—with the following formula:
DNA base pairsð Þ¼ DNA pgð Þ�0:978�109
DNA fibre experiments. Replication labelling and preparation of DNA fibres:Cells were pulse labelled with 100 mM IdU for 30 min, washed two times with PBS,followed by a 30 min 100 mM CldU pulse. Cells were trypsinized, pelleted andresuspended in low-temperature melting agarose to form plugs of 200,000 cellseach. Plugs were incubated over night at 50 �C in 0.25 mg ml� 1 proteinase K in10% sarcosyl/EDTA, washed in Tris-EDTA buffer twice for 30 min at roomtemperature. Agarose was digested at 42 �C by two units of b-agarase per plug.Fibres were combed using the Genomic Vision combing machine as follows: inshort, a silanized coverslip was incubated in the sample for 5 min. The coverslipwas removed at a constant speed of 300 mm s� 1 with a resulting average fibrelength between 250–500 kbp.
Staining: DNA fibres were dehydrated in a series of ethanol with increasingconcentration and denatured in a 0.5 M NaOH/1 M NaCl solution. After washingwith 0.05 M Tris/1 M NaCl and PBS, the incorporated nucleotides were detectedwith two to four layers of antibodies in 4% BSA/PBS for each 1 h at 37 �C. Primary
NATURE COMMUNICATIONS | DOI: 10.1038/ncomms11231 ARTICLE
NATURE COMMUNICATIONS | 7:11231 | DOI: 10.1038/ncomms11231 | www.nature.com/naturecommunications 9
antibodies: mouse anti-BrdU (1:5, BD Biosciences, catalog # 347580); rat anti-BrdU(1:25, Harlan Sera-Lab, catalog # OBT0030). Secondary antibodies: goatanti-mouse IgG Alexa 488 (1:200, ThermoFisher Scientific, catalog # 11001); anddonkey anti-rat IgG Cy3 (1:200, Jackson Immuno Research Laboratories,catalog # 712-165-153). Third antibody: horse anti-goat IgG biotin (1:200,Vector Laboratories, catalog # BA-9500). Fourth layer: Streptavidin-Alexa 488(1:200, Invitrogen, catalog # S11223). Stained DNA fibres were mounted inVectashield (Invitrogen).
Microscopy: Epifluorescence images were obtained using an Axiovert 200microscope (Zeiss) with a � 40/1.4 NA Plan-Apochromat oil immersion objectivelens (Zeiss) and a cooled 12-bit charge-coupled device camera (Sensicam).
Image analysis: The brightness and colour of each image was adjusted withImageJ62. It should be considered that the several pictures of one fibre look equal inbrightness and contrast. IdU was set to green, CldU to red. Alignment of the imagesof the same fibre was performed with Photoshop (function ‘photomerge’). Brightnessand contrast was set again to optimize analysis conditions. The aligned images weremeasured in ImageJ. The unit of length was set on‘micrometre’ and the pixel width on0.168 under image properties. To measure the length of the several parts for IOD andfork speed, the selection tool and the function ‘measure’ was used.
To get the track length in kbp, for the IODs, the value was multiplied with 2(stretching-factor). For the fork speed in kbp min� 1, the value was additionallydivided by 30 (30 min nucleotide pulse).
Dynamic cell cycle analysis. C2C12 stably expressing GFP-PCNA or HeLa Kyotocells stably expressing FP-PCNA were plated on chambered glass coverslips oneday before microscopy.
3D stacks were obtained on a UltraVIEW VoX spinning disc confocal system(Perkin Elmer, UK) in a closed live-cell microscopy chamber (ACU control,Olympus, Japan) heated to 37 �C, with 5% CO2 and 60% air humidity control,mounted on a Nikon Ti microscope (Nikon, Japan). Image acquisition wasperformed using a � 60/1.45 NA Planapochromat oil immersion objective lens.Images were obtained with a cooled 14-bit EMCCD camera (Hamamatsu) and hada voxel size of 104� 104� 500 nm3.
Alternatively, image time series were acquired with a Zeiss LSM 510 Metalaser scanning confocal microscope equipped with a stage mounted incubationsystem maintaining a humidified atmosphere of 5% CO2 at 37 �C (Okolab) using a63� /1.4 NA Plan-Apochromat oil immersion objective lens and the 488 nm laserline of an Argon ion laser at low power every 15 min (zoom¼ 1.0, field size:1,024� 1,024 pixels; pixel size: 200� 200 nm2) over 174 frames.
Individual frames were processed and assembled using ImageJ.Visual inspection and classification of PCNA patterns frame by frame was
performed and cells were first classified as: non-replicating, early/mid/late S-phaseand mitotic. Temporal information on the preceding/subsequent cell cycle stagewas used to discriminate between G1 and G2 cells.
The duration of each cell cycle sub-stage was determined by multiplying thenumber of frames corresponding to each cell cycle sub-stage by 15 min.
Replication labelling and staining. For BrdU replication labelling, cells grown oncover glasses were incubated with 10–20 mM BrdU (BD Biosciences) for 5–30 min,fixed and stained as described above. Alternatively, cells grown on cover glasseswere incubated with 10–20 mM EdU (Invitrogen) for the specified time, fixed andstained using the Click-iT assay (Invitrogen). Fluorophores conjugated to thesecondary antibody or fluorescent azide were chosen to have sufficiently differentemission spectra from the fluorescent group attached to FP-PCNA.
To enhance GFP-PCNA signal and increase signal-to-noise ratio before3D-SIM imaging, C2C12 GFP-PCNA or HeLa Kyoto GFP-PCNA cells wereprocessed as follows: cells were incubated with the CSK extraction buffer(10 mM Pipes-KOH, pH 7.0, 100 mM NaCl, 300 mM sucrose, 3 mM MgCl2) beforefixing them as described in ref. 63. Fixed cells were permeabilized with 0.5% TritonX-100 and PCNA was detected using mouse anti-PCNA monoclonal antibody(1:200, Santa Cruz, catalog # sc-56) followed by goat anti-mouse IgG Alexa 488(1:400, ThermoFisher Scientific, catalog # 11001). Stained samples were mountedin Vectashield (Invitrogen).
Replication foci visualization and quantification. Confocal microscopy:Images were acquired with a Leica TCS SP5II confocal laser scanning microscope(Leica Microsystems, Wetzlar, Germany) equipped with an oil immersionPlan-Apochromat � 100/1.44 NA objective lens (pixel size in XY set to 50 nm,Z-step¼ 290 nm) and laser lines at 405, 488, 561 and 633 nm. Alternatively, thespinning disk microscope was used (see dynamic cell cycle analysis section above).
3D-SIM: Super-resolution imaging of fixed samples was performed on a OMXprototype system35 or DeltaVision OMX V3 system (GE Healthcare) equippedwith a � 100/1.40 NA PlanApo oil immersion objective (Olympus), Cascade II:512EMCCD cameras (Photometrics) and 405, 488 and 593 nm diode lasers. Live-cellsuper-resolution imaging was performed with a DeltaVision OMX V3 Blazesystem (GE Healthcare), equipped with a � 60/1.42 NA PlanApo oil objectiveand (Olympus) and sCMOS cameras (PCO) for high-speed stack acquisition.Both, fixed and live 3D-SIM was performed as previously described64.
3D-SIM super-resolution images were reconstructed41 by processing rawimages using the API DeltaVision OMX softWoRx image processing software(version: 5.9.9 release 19).
For comparison, conventional wide-field image stacks were generated from3D-SIM raw data by average projection of five consecutive phase-shifted imagesfrom each plane for the first rotation angle and subsequently subjected to aniterative 3D deconvolution using softWoRX 6.0. For direct comparison with3D-SIM images, the pixel numbers were doubled in x and y using a bicubicinterpolation in ImageJ to unify voxel sizes in all cases to 40� 40� 125 nm.
Image analysis: Quantification of RFi in cells was performed as summarized inSupplementary Fig. 3 and detailed in ref. 42. Briefly, confocal microscopy imageswere smoothed using mean filter (r¼ 1.5) to reduce effects of noise on local maximaidentification. Stacks were normalized and local maxima were identified and markedwith single pixels having maximum intensity using ‘Find stack maxima’ Image Jmacros available from: http://rsbweb.nih.gov/ij/macros/FindStackMaxima.txt. Thestack with the map of local maxima was convolved with a Gaussian filter (r¼ 1.0) togenerate artificial focal objects around the identified maxima. Finally, the number ofthe objects corresponding to the local maxima was counted using a 3D objectcounting plug-in65 available from:
http://imagejdocu.tudor.lu/doku.php?id=plugin:analysis:3d_object_counter:start.3D-SIM images were cropped with ImageJ to one nucleus only and background
was removed automatically by the triangle method66. Volocity v.5 3D imageanalysis software (Perkin Elmer) was used to separate and count touching RFi(see Supplementary Fig. 3 for image preprocessing details).
Statistical analysis representation. Statistical analyses were represented with violinplots (Supplementary Fig. 7; modified from ref. 29), a variation to the box plot with akernel density plot on each side to display the distribution of the data at differentvalues. Similar to a box plot it includes a marker for the median, a box indicating theinter-quartile range and whiskers for the upper and lower adjacent values.
Error calculations. Error calculations were performed in R-Project(http://www.R-project.org).
S.d. for a single variable were computed via equation 1.
~s ¼ffiffiffiffiffiffiffiffiffiffiffiffiffiffiffiffiffiffiXn
i¼1
v2i
n� 1
s¼
ffiffiffiffiffiffiffiffiffiffiffiffiffiffiffiffiffiffiffiffiffiffiffiffiffiXn
i¼1
xi � �xð Þ2
n� 1
sð1Þ
S.e.m. of the mean were calculated with equation 2.
~s ¼ffiffiffiffiffiffiffiffiffiffiffiffiffiffiffiffiffiffiffiffiffiffiffiffiffiXn
i¼1
v2i
n n� 1ð Þ
s¼ ~sffiffiffi
np ð2Þ
To calculate errors for diverse factors, for example, independent variables, thesimplified version of the Gaussian error formula (the variance formula), as shownin equation 3, was used. Those errors were marked as ‘MSE’.
~sf ¼
ffiffiffiffiffiffiffiffiffiffiffiffiffiffiffiffiffiffiffiffiffiffiffiffiffiffiffiffiffiffiXk
j¼1
~sxj
@f@xj
� �2vuut ð3Þ
References1. Chagin, V. O., Stear, J. H. & Cardoso, M. C. Organization of DNA replication.
Cold Spring Harb. Perspect. Biol. 2, a000737 (2010).2. Shermoen, A. W., McCleland, M. L. & O’Farrell, P. H. Developmental
control of late replication and S phase length. Curr. Biol. 20, 2067–2077 (2010).3. Goldar, A., Labit, H., Marheineke, K. & Hyrien, O. A dynamic stochastic
model for DNA replication initiation in early embryos. PloS ONE 3, e2919(2008).
4. Rhind, N. DNA replication timing: random thoughts about origin firing.Nat. Cell. Biol. 8, 1313–1316 (2006).
5. Cairns, J. Autoradiography of HeLa cell DNA. J. Mol. Biol. 15, 372–373 (1966).6. Hand, R. DNA replication in mammalian cells. Altered patterns of initiation
during inhibition of protein synthesis. J. Cell Biol. 67, 761–773 (1975).7. Huberman, J. A. & Riggs, A. D. On the mechanism of DNA replication in
mammalian chromosomes. J. Mol. Biol. 32, 327–341 (1968).8. Edenberg, H. J. & Huberman, J. A. Eukaryotic chromosome replication.
Annu. Rev. Genet. 9, 245–284 (1975).9. Hand, R. Eucaryotic DNA: organization of the genome for replication. Cell 15,
317–325 (1978).10. O’Keefe, R. T., Henderson, S. C. & Spector, D. L. Dynamic organization of
DNA replication in mammalian cell nuclei: spatially and temporally definedreplication of chromosome-specific alpha-satellite DNA sequences. J. Cell Biol.116, 1095–1110 (1992).
11. Ma, H. et al. Spatial and temporal dynamics of DNA replication sites inmammalian cells. J. Cell Biol. 143, 1415–1425 (1998).
12. Jackson, D. A. & Pombo, A. Replicon clusters are stable units of chromosomestructure: evidence that nuclear organization contributes to the efficient
ARTICLE NATURE COMMUNICATIONS | DOI: 10.1038/ncomms11231
10 NATURE COMMUNICATIONS | 7:11231 | DOI: 10.1038/ncomms11231 | www.nature.com/naturecommunications
activation and propagation of S phase in human cells. J. Cell Biol. 140,1285–1295 (1998).
13. Nakamura, H., Morita, T. & Sato, C. Structural organizations of replicondomains during DNA synthetic phase in the mammalian nucleus. Exp. Cell Res.165, 291–297 (1986).
14. Nakayasu, H. & Berezney, R. Mapping replicational sites in the eucaryotic cellnucleus. J. Cell Biol. 108, 1–11 (1989).
15. Manders, E. M., Stap, J., Brakenhoff, G. J., van Driel, R. & Aten, J. A. Dynamicsof three-dimensional replication patterns during the S-phase, analysed bydouble labelling of DNA and confocal microscopy. J. Cell Sci. 103, 857–862(1992).
16. Manders, E. M., Stap, J., Strackee, J., van Driel, R. & Aten, J. A. Dynamicbehavior of DNA replication domains. Exp. Cell. Res. 226, 328–335 (1996).
17. Tomilin, N. et al. Visualization of elementary DNA replication units in humannuclei corresponding in size to DNA loop domains. Chromosome Res. 3, 32–40(1995).
18. van Driel, R., Manders, E. M., de Jong, L., Stap, J. & Aten, J. A. Mapping ofDNA replication sites in situ by fluorescence microscopy. Methods Cell Biol. 53,455–469 (1998).
19. Kennedy, B. K., Barbie, D. A., Classon, M., Dyson, N. & Harlow, E. Nuclearorganization of DNA replication in primary mammalian cells. Genes Dev. 14,2855–2868 (2000).
20. Dimitrova, D. S. & Berezney, R. The spatio-temporal organization of DNAreplication sites is identical in primary, immortalized and transformedmammalian cells. J. Cell Sci. 115, 4037–4051 (2002).
21. Leonhardt, H. et al. Dynamics of DNA replication factories in living cells. J. CellBiol. 149, 271–280 (2000).
22. van Dierendonck, J. H., Keyzer, R., van de Velde, C. J. & Cornelisse, C. J.Subdivision of S-phase by analysis of nuclear 5-bromodeoxyuridine stainingpatterns. Cytometry 10, 143–150 (1989).
23. Mills, A. D. et al. Replication occurs at discrete foci spaced throughout nucleireplicating in vitro. J. Cell. Sci. 94, 471–477 (1989).
24. Hozak, P., Hassan, A. B., Jackson, D. A. & Cook, P. R. Visualization ofreplication factories attached to nucleoskeleton. Cell 73, 361–373 (1993).
25. Hozak, P., Jackson, D. A. & Cook, P. R. Replication factories and nuclearbodies: the ultrastructural characterization of replication sites during the cellcycle. J. Cell Sci. 107, 2191–2202 (1994).
26. Cook, P. R. The organization of replication and transcription. Science 284,1790–1795 (1999).
27. Ge, X. Q., Jackson, D. A. & Blow, J. J. Dormant origins licensed by excessMcm2-7 are required for human cells to survive replicative stress. Genes Dev.21, 3331–3341 (2007).
28. Buongiorno-Nardelli, M., Micheli, G., Carri, M. T. & Marilley, M. A relationshipbetween replicon size and supercoiled loop domains in the eukaryotic genome.Nature 298, 100–102 (1982).
29. Hintze, J. L. & Nelson, R. D. Violin plots: a box plot-density trace synergism.Am. Stat. 52, 181–184 (1998).
30. Rajan, M. et al. Generation of an alpaca-derived nanobody recognizinggamma-H2AX. FEBS Open Bio 5, 779–788 (2015).
31. Cayrou, C., Coulombe, P. & Mechali, M. Programming DNA replicationorigins and chromosome organization. Chromosome Res. 18, 137–145 (2010).
32. Koberna, K. et al. Electron microscopy of DNA replication in 3-D: evidence forsimilar-sized replication foci throughout S-phase. J. Cell. Biochem. 94, 126–138(2005).
33. Ligasova, A., Raska, I. & Koberna, K. Organization of human replicon: singlesor zipping couples? J. Struct. Biol. 165, 204–213 (2009).
34. Baddeley, D. et al. Measurement of replication structures at the nanometer scaleusing super-resolution light microscopy. Nucleic Acids Res. 38, e8 (2010).
35. Schermelleh, L. et al. Subdiffraction multicolor imaging of the nuclearperiphery with 3D structured illumination microscopy. Science 320, 1332–1336(2008).
36. Cseresnyes, Z., Schwarz, U. & Green, C. M. Analysis of replication factories inhuman cells by super-resolution light microscopy. BMC Cell Biol. 10, 88 (2009).
37. Lob, D. et al. 3D replicon distributions arise from stochastic initiation anddomino-like DNA replication progression. Nat. Commun. 7, 11207doi: 10.1038/ncomms11207 (2016).
38. Casas-Delucchi, C. S. et al. Histone acetylation controls the inactive Xchromosome replication dynamics. Nat. Commun. 2, 222 (2011).
39. Schurra, C. & Bensimon, A. Combing genomic DNA for structural andfunctional studies. Methods Mol. Biol. 464, 71–90 (2009).
40. Techer, H. et al. Replication dynamics: biases and robustness of DNA fiberanalysis. J. Mol. Biol. 425, 4845–4855 (2013).
41. Schermelleh, L., Heintzmann, R. & Leonhardt, H. A guide to super-resolutionfluorescence microscopy. J. Cell Biol. 190, 165–175 (2010).
42. Chagin, V. O., Reinhart, M. & Cardoso, M. C. in Methods Mol Biol Vol. 1300(eds Dalgaard, J. & Vengrova, S.) 43–65 (Springer ScienceþBusiness Media,New York, 2015).
43. Fox, M. H., Arndt-Jovin, D. J., Jovin, T. M., Baumann, P. H. & Robert-Nicoud, M.Spatial and temporal distribution of DNA replication sites localized byimmunofluorescence and confocal microscopy in mouse fibroblasts. J. Cell Sci.99, 247–253 (1991).
44. Sporbert, A., Gahl, A., Ankerhold, R., Leonhardt, H. & Cardoso, M. C. DNApolymerase clamp shows little turnover at established replication sites butsequential de novo assembly at adjacent origin clusters. Mol. Cell 10, 1355–1365(2002).
45. Berezney, R., Dubey, D. D. & Huberman, J. A. Heterogeneity of eukaryoticreplicons, replicon clusters, and replication foci. Chromosoma 108, 471–484(2000).
46. Pope, B. D. et al. Topologically associating domains are stable units ofreplication-timing regulation. Nature 515, 402–405 (2014).
47. Maya-Mendoza, A., Olivares-Chauvet, P., Shaw, A. & Jackson, D. A. S phaseprogression in human cells is dictated by the genetic continuity of DNA foci.PLoS Genet. 6, e1000900 (2010).
48. Fraser, J., Williamson, I., Bickmore, W. A. & Dostie, J. An overview of genomeorganization and how we got there: from FISH to Hi-C. Microbiol. Mol. Biol.Rev. 79, 347–372 (2015).
49. McGhee, J. D., Rau, D. C., Charney, E. & Felsenfeld, G. Orientation of thenucleosome within the higher order structure of chromatin. Cell 22, 87–96(1980).
50. Bian, Q. & Belmont, A. S. Revisiting higher-order and large-scale chromatinorganization. Curr. Opin. Cell. Biol. 24, 359–366 (2012).
51. Razin, S. V. & Gavrilov, A. A. Chromatin without the 30-nm fiber: constraineddisorder instead of hierarchical folding. Epigenetics. 9, 653–657 (2014).
52. Mateos-Langerak, J. et al. Spatially confined folding of chromatin in theinterphase nucleus. Proc. Natl Acad. Sci. USA 106, 3812–3817 (2009).
53. Chen, B. C. et al. Lattice light-sheet microscopy: imaging molecules to embryosat high spatiotemporal resolution. Science 346, 1257998 (2014).
54. Fiolka, R., Shao, L., Rego, E. H., Davidson, M. W. & Gustafsson, M. G.Time-lapse two-color 3D imaging of live cells with doubled resolution usingstructured illumination. Proc. Natl Acad. Sci. USA 109, 5311–5315 (2012).
55. Shao, L., Kner, P., Rego, E. H. & Gustafsson, M. G. Super-resolution 3Dmicroscopy of live whole cells using structured illumination. Nat. Methods 8,1044–1046 (2011).
56. Jacob, F., Brenner, S. & Cuzin, F. On the regulation of DNA replication inbacteria. Cold Spring Harb. Symp. Quant. Biol. 28, 329–348 (1963).
57. Erfle, H. et al. Reverse transfection on cell arrays for high content screeningmicroscopy. Nat. Protoc. 2, 392–399 (2007).
58. Agarwal, N. et al. MeCP2 interacts with HP1 and modulates itsheterochromatin association during myogenic differentiation. Nucleic AcidsRes. 35, 5402–5408 (2007).
59. Rottach, A. et al. Generation and characterization of a rat monoclonal antibodyspecific for PCNA. Hybridoma 27, 91–98 (2008).
60. Chagin, V. O., Rozanov, Y. M. & Tomilin, N. V. Multiple deceleration of DNAsynthesis during the S phase of cell cycle: study by flow cytometry method.Dokl. Biochem. Biophys. 394, 11–14 (2004).
61. Gregory, T. R. Animal Genome Size Database ohttp://www.genomesize.com4(2012).
62. Rasband, W. S. ImageJ, U.S. National Institutes of Health, Bethesda, Maryland,USA ohttp://imagej.nih.gov/ij/4 (1009-2012).
63. Masata, M., Juda, P., Raska, O., Cardoso, M. C. & Raska, I. A fraction of MCM2 proteins remain associated with replication foci during a major part of Sphase. Folia Biol. (Praha) 57, 3–11 (2011).
64. Smeets, D. et al. Three-dimensional super-resolution microscopy of the inactiveX chromosome territory reveals a collapse of its active nuclear compartmentharboring distinct Xist RNA foci. Epigenetics Chromatin 7, 8 (2014).
65. Bolte, S. & Cordelieres, F. P. A guided tour into subcellular colocalizationanalysis in light microscopy. J. Microsc. 224, 213–232 (2006).
66. Zack, G. W., Rogers, W. E. & Latt, S. A. Automatic measurement of sisterchromatid exchange frequency. J. Histochem. Cytochem. 25, 741–753 (1977).
AcknowledgementsWe thank Sebastian Haase for help in DNA fibre image analysis, Hans-Peter Rahn forassistance with flow cytometry and Danny Nowak and Anne Lehmkuhl for technicalsupport. We are grateful to John Sedat and Pete Carlton for initial support with OMXexperiments. This work was supported by grants of the German Research Foundation(DFG CA 198/9 to M.C.C., DFG SFB-TR5 to L.S., DFG SFB 1064 A17/Z05 to H.L. andNanosystems Initiative Munich to H.L.) and a Wellcome Trust Strategic Award (091911)supporting Micron Oxford. C.S.C.-D. was supported in part by a Marie Curie long-termIEF fellowship.
Author contributionsA.B., M.F. and P.D generated/provided the materials. V.O.C., C.S.C.-D., M.R., L.S., Y.M.,A.M., J.J.B. and Y.M.R. performed the experiments. V.O.C., C.S.C.-D., M.R., L.S. andY.M. developed image analysis protocols. V.O.C., C.S.C.-D., M.R., L.S., Y.M. and Y.M.R.
NATURE COMMUNICATIONS | DOI: 10.1038/ncomms11231 ARTICLE
NATURE COMMUNICATIONS | 7:11231 | DOI: 10.1038/ncomms11231 | www.nature.com/naturecommunications 11
analysed the data. V.O.C., H.L. and M.C.C. designed the project. V.O.C., C.S.C.-D., M.R.and M.C.C. wrote the manuscript. All authors commented on the manuscript.
Additional informationSupplementary Information accompanies this paper at http://www.nature.com/naturecommunications
Competing financial interests: The authors declare no competing financial interests.
Reprints and permission information is available online at http://npg.nature.com/reprintsandpermissions/
How to cite this article: Chagin, V. O. et al. 4D Visualization of replication foci inmammalian cells corresponding to individual replicons. Nat. Commun. 7:11231doi: 10.1038/ncomms11231 (2016).
This work is licensed under a Creative Commons Attribution 4.0International License. The images or other third party material in this
article are included in the article’s Creative Commons license, unless indicated otherwisein the credit line; if the material is not included under the Creative Commons license,users will need to obtain permission from the license holder to reproduce the material.To view a copy of this license, visit http://creativecommons.org/licenses/by/4.0/
ARTICLE NATURE COMMUNICATIONS | DOI: 10.1038/ncomms11231
12 NATURE COMMUNICATIONS | 7:11231 | DOI: 10.1038/ncomms11231 | www.nature.com/naturecommunications
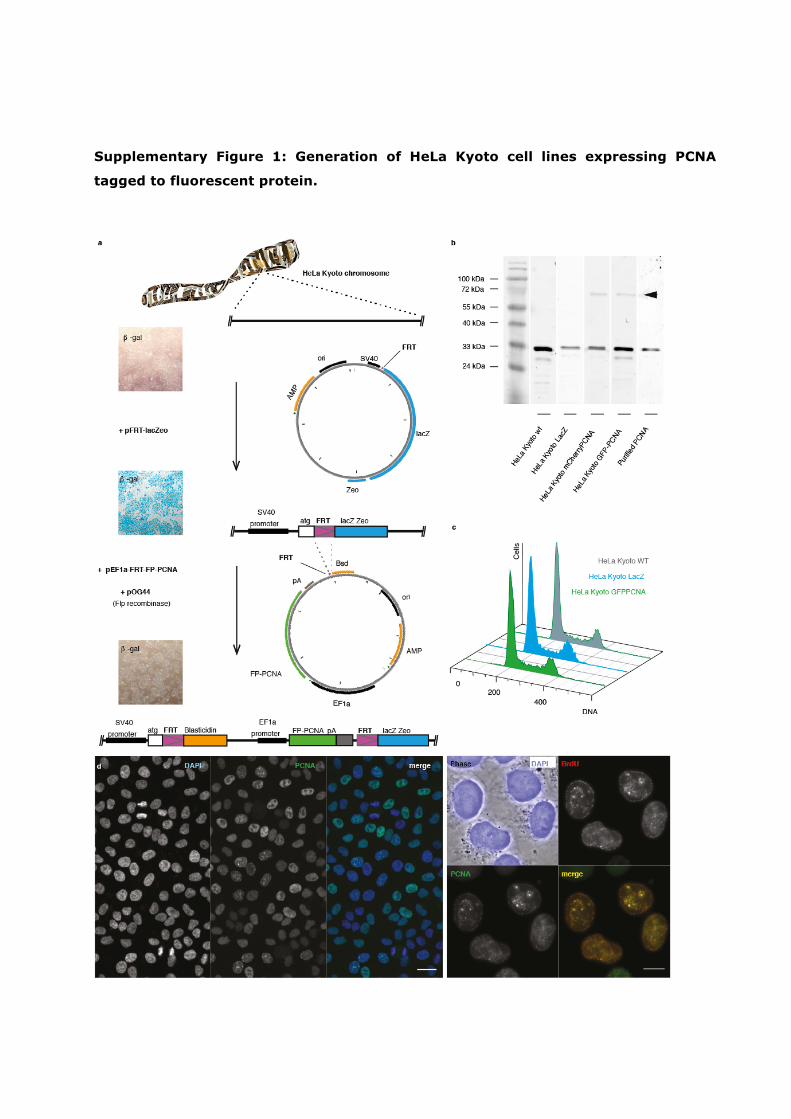
Supplementary Figure 1: Generation of HeLa Kyoto cell lines expressing PCNA
tagged to fluorescent protein.
a. Schematic representation of the two-step protocol used to generate HeLa Kyoto cell lines
stably expressing PCNA tagged to fluorescent protein – “FP-PCNA” (see Supplementary Note
1). HeLa Kyoto cell lines expressing mCherry-PCNA or GFP-PCNA proteins were generated
by: First, introducing FRT site recognized by Flp recombinase together with LacZ and gene
of Zeocin resistance. The cells where integration of the plasmid into a chromosome occurred
were then selected on the basis of the acquired Zeocin resistance (eight days 75 µg/ml) and
eight clones with integrated FRT sites were isolated. Beta-Galactosidase activity was
assayed as an indicator of activity of SV40 promoter. Second, several HeLa-Kyoto-FRTLacZ-
clones with low and high ß-galactosidase expression were selected for further co-
transfection with FRT-GFP-PCNA or FRT-mCherry-PCNA containing plasmids with pOG44
plasmid containing gene of Flp-recombinase. Successful integration of FP-PCNA at the
chromosomal FRT sites was verified based on acquired Blasticidin resistance and loss of
LacZ activity. Scale bar: 50 micron. b. Immunoblot analysis of FP-PCNA expression levels in
HeLa Kyoto cells at all stages of the protocol shown in (a). c. Flow cytometry histograms
demonstrating the absence of alterations in the cell cycle dynamics. d. Left panel:
microscopic images demonstrating the stability and uniformity of FP-PCNA expression. Scale
bar: 10 micron. Right panel: colocalization of FP-PCNA with the nuclear sites of DNA
synthesis. Scale bar: 5 micron.
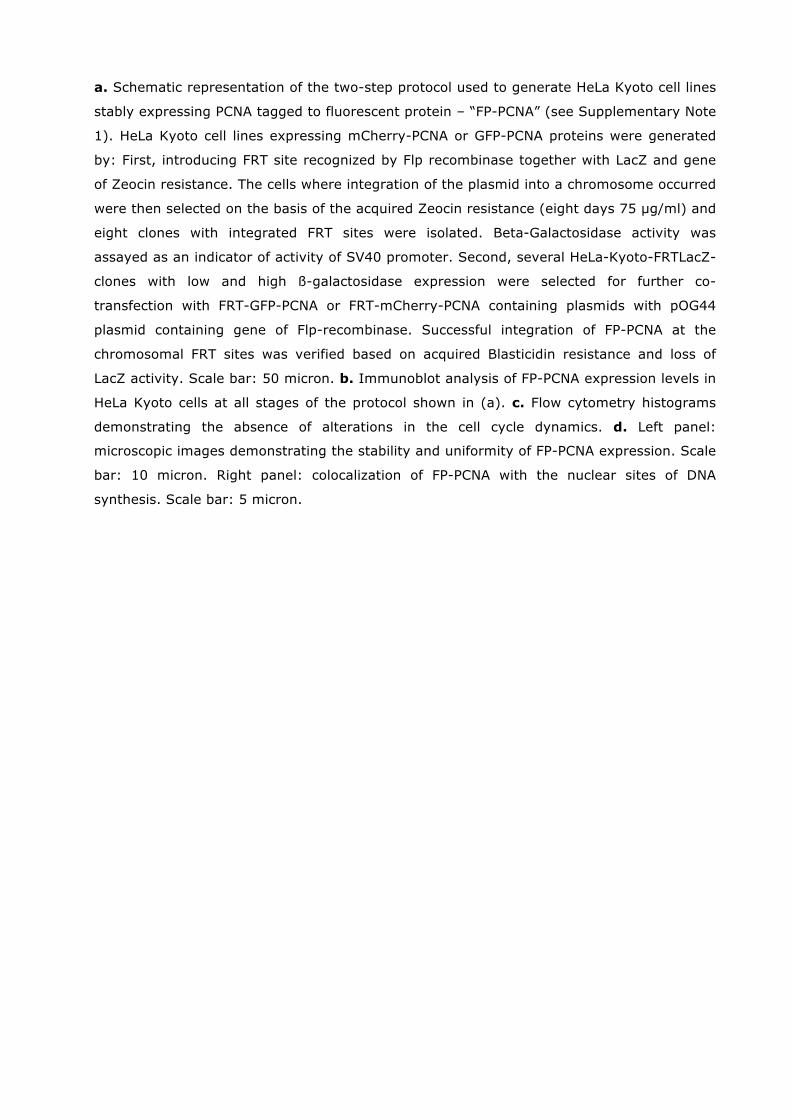
Supplementary Figure 2: Criteria for inter-origin distance and replication fork
speed sampling.
30’ IdU 30’ CldU DNA extraction DNA combing (constant stretching factor: 2 kb / µm) immuno-detection
Fork blockage?
fork merger
x
x
x x x x
x x x
x
x x x x
x
x included excluded tracks
a
ORI
b
c
-20
0
20
40
60
80
100
1 21 41 61 81 101
Cha
nge
in m
ean
valu
es %
inter-ori distance HeLaK
inter-ori distance C2C12
fork speed HeLaK
fork speed C2C12
5 % limit
a. Schematic summary of the labeling, DNA fiber stretching and immunodetection steps.
Exemplary image of stained DNA tracks acquired with a wide-field microscope.
b. Fluorescent DNA fiber tracks were selected according to their pattern for calculations of
inter-origin distances (IOD) and / or replication fork speed (RFS) as shown. Thick arrows
indicate the positions considered as replication origins, thin arrows represent the IOD.
Circles mark the tracks included into the calculations of RFS, crosses mark the tracks
excluded from the calculations. c. The effect of increasing the sample size on the mean
value of the indicated parameter is represented as a plot of the change in the average value
of the sample “n” to the mean of “n-1” (See Supplementary Note 2).
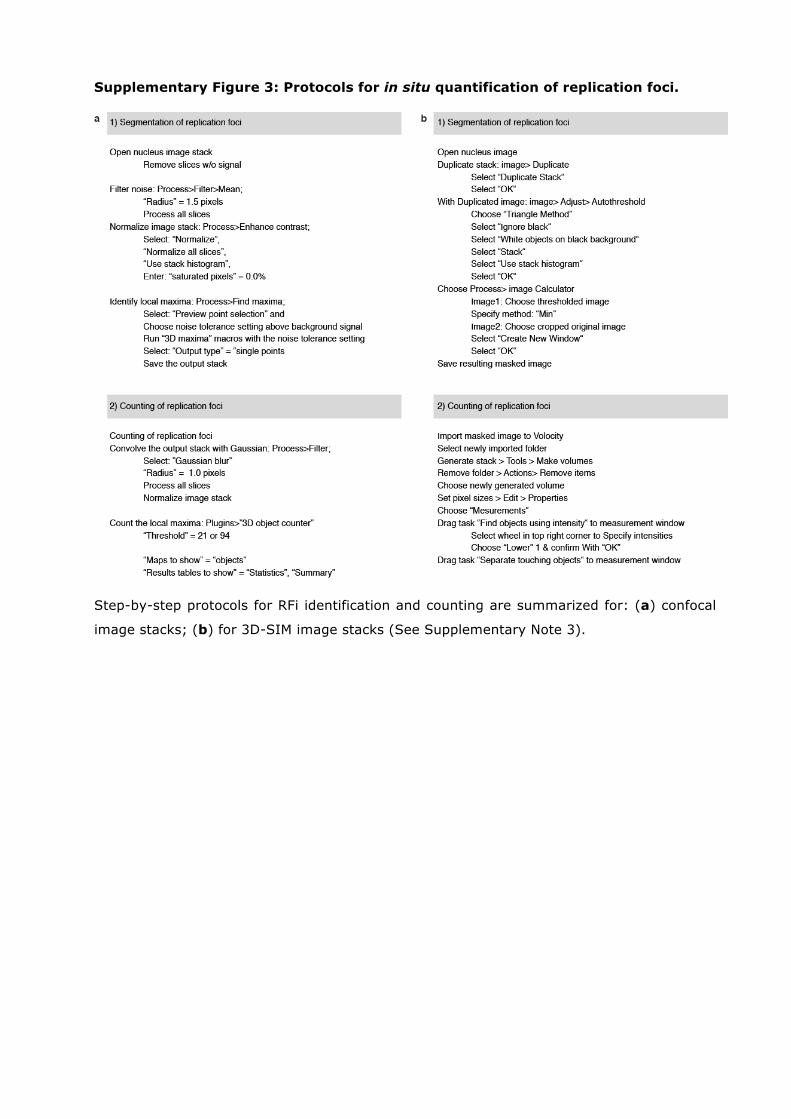
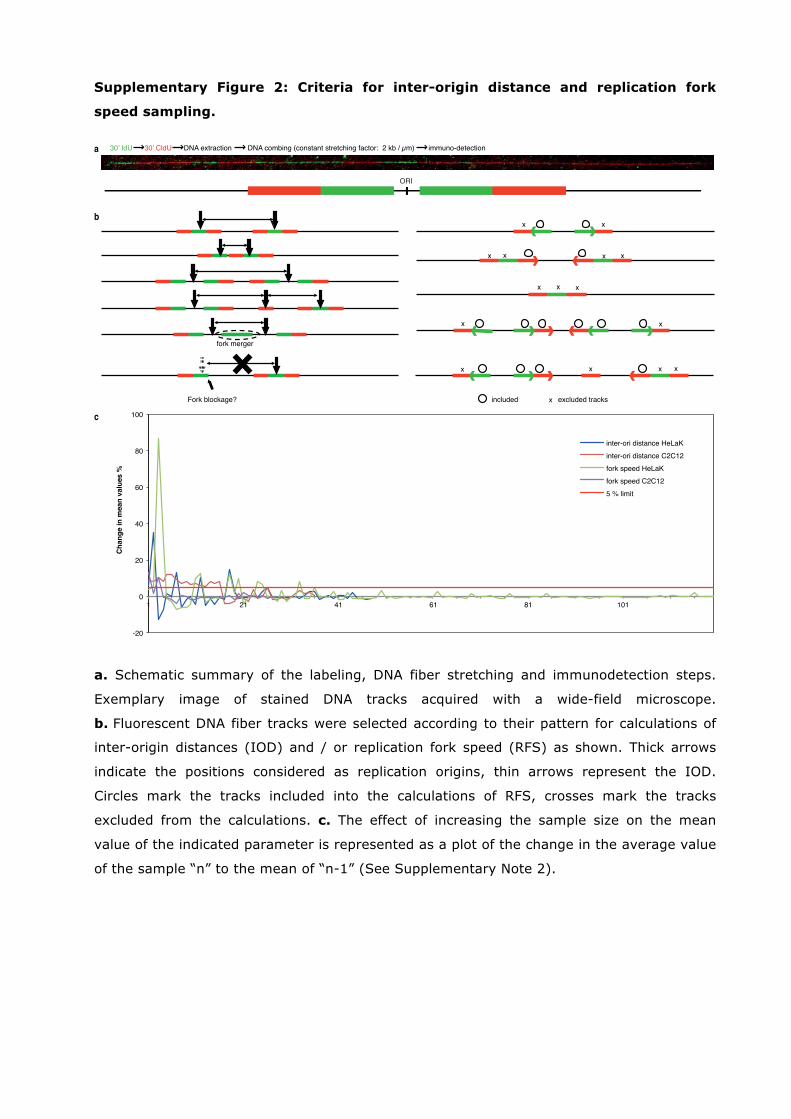
Supplementary Figure 3: Protocols for in situ quantification of replication foci.
Step-by-step protocols for RFi identification and counting are summarized for: (a) confocal
image stacks; (b) for 3D-SIM image stacks (See Supplementary Note 3).
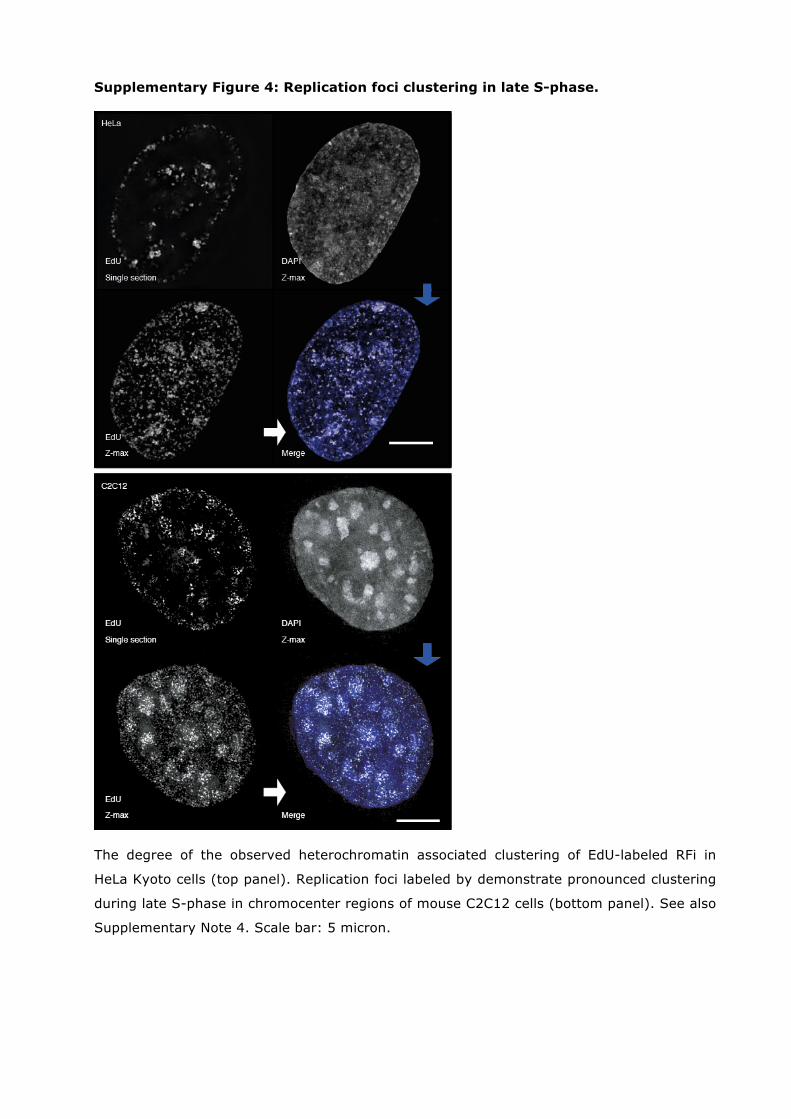
Supplementary Figure 4: Replication foci clustering in late S-phase.
The degree of the observed heterochromatin associated clustering of EdU-labeled RFi in
HeLa Kyoto cells (top panel). Replication foci labeled by demonstrate pronounced clustering
during late S-phase in chromocenter regions of mouse C2C12 cells (bottom panel). See also
Supplementary Note 4. Scale bar: 5 micron.
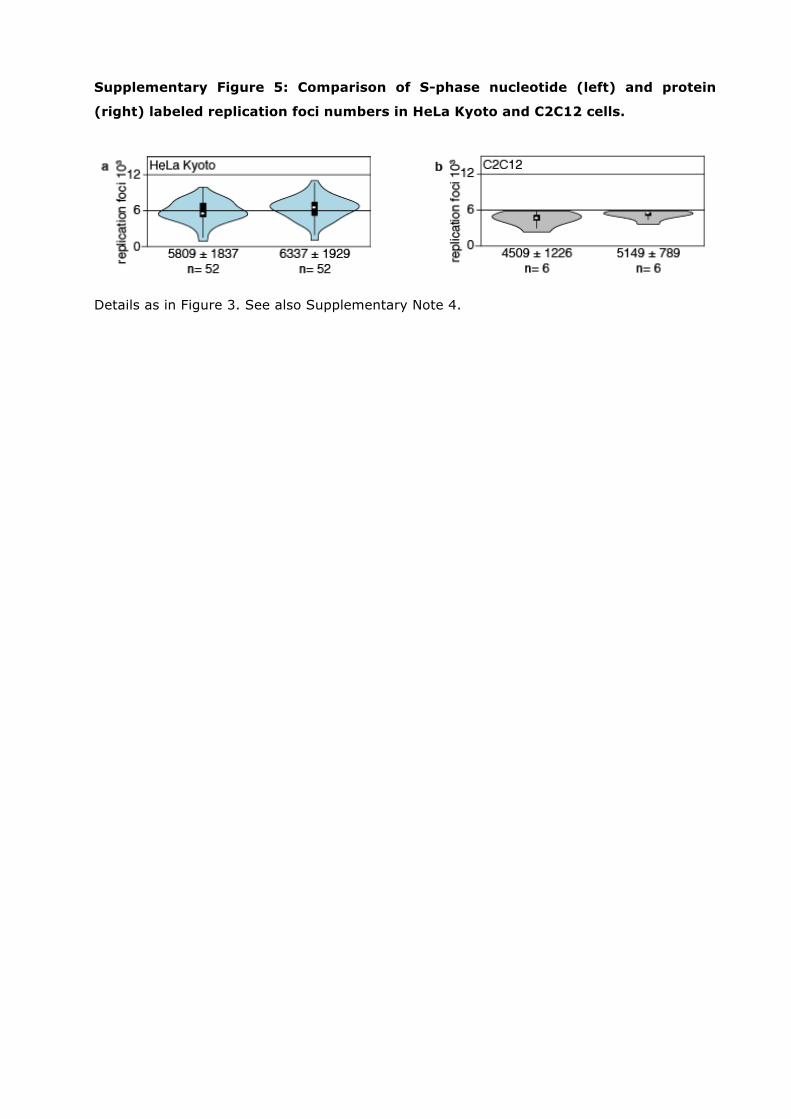
Supplementary Figure 5: Comparison of S-phase nucleotide (left) and protein
(right) labeled replication foci numbers in HeLa Kyoto and C2C12 cells.
Details as in Figure 3. See also Supplementary Note 4.

Supplementary Figure 6: Schematic of different modes of replicon activation.
S-phase dynamics is represented as sequential activation of groups of replicons scattered
over the genome. Each colored curve depicts combined intensity of DNA synthesis in a
respective replicon subset. Cumulative DNA synthesis profile (S-phase part of DNA
histogram, top panel) will be similar, if S-phase dynamics is modeled by asynchronous
overlapping (Gaussian curves) mode of origin activation (middle panel), or as
synchronized sequential (step-like curves) initiation of DNA synthesis (bottom panel) by
the groups of replicons.
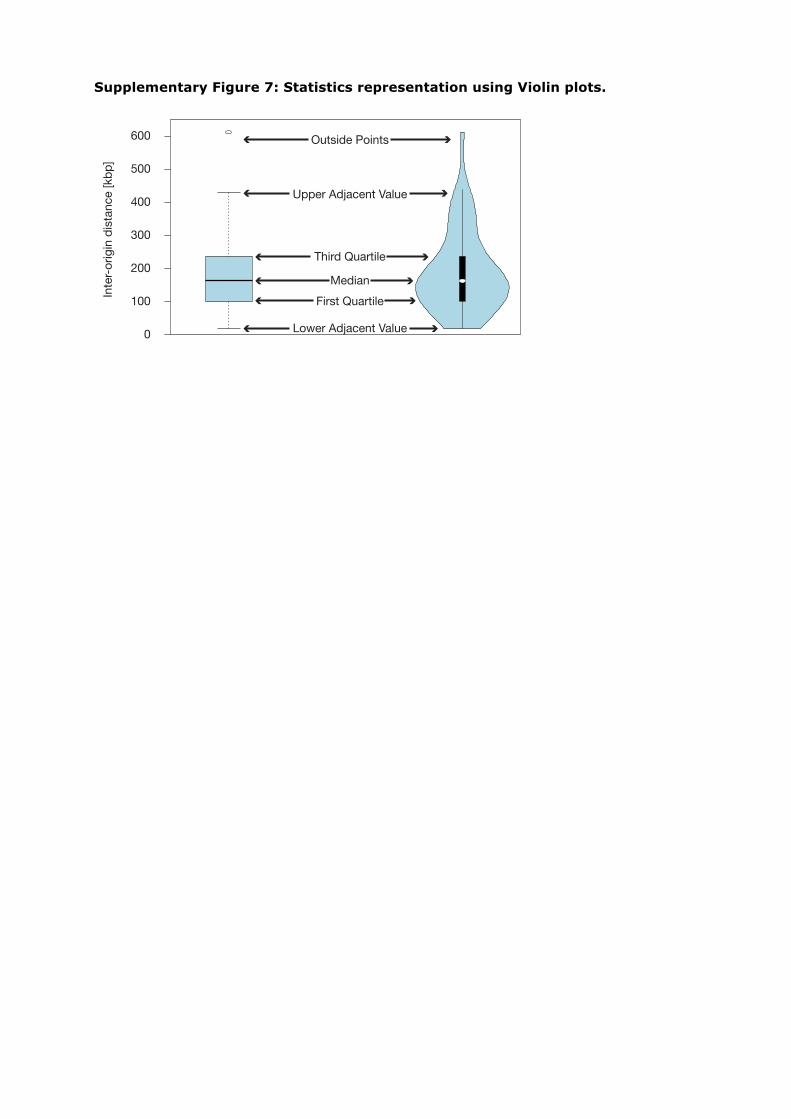
Supplementary Figure 7: Statistics representation using Violin plots.
●
Inte
r-o
rig
in d
ista
nce [kb
p]
100
200
300
400
500
0
600 Outside Points
Upper Adjacent Value
Lower Adjacent Value
Third Quartile
First Quartile
Median

Supplementary Table 1: Summary of RFi measurements statistics.
S-phase stage Cell line Resolution RFi mean RFi median SEM1 SD2 RFi min RFi max n3
early HeLa Kyoto confocal 1095.9 1072 22.4 157 839 1547 49
mid HeLa Kyoto confocal 1287.4 1301 23.9 141.6 941 1559 35
late HeLa Kyoto confocal 616.8 623 28.7 157.2 353 986 30
combined HeLa Kyoto confocal 1028.6 1081 28.2 300.9 353 1559 114
max HeLa Kyoto confocal 1175.7 1158 19.4 177.5 839 1559 84
early C2C12 confocal 811 746 68 225.7 418 1162 11
mid C2C12 confocal 1102 1072 63.1 282.3 517 1615 20
late C2C12 confocal 818.5 857 46.8 203.9 366 1229 19
combined C2C12 confocal 930.2 902 39.1 276.8 366 1615 50
max C2C13 confocal 998.7 1035 53.1 295.7 418 1615 31
early HeLa Kyoto WFD 847.7 911 51.9 355.7 37 1476 47
mid HeLa Kyoto WFD 765 757.5 39.1 221 357 1269 32
late HeLa Kyoto WFD 503.8 488 34.6 265.6 16 1058 59
combined HeLa Kyoto WFD 681.5 703 28 328.8 16 1476 138
max HeLa Kyoto WFD 814.2 787 34.8 309.4 37 1476 79
early C2C12 WFD 1011.5 1056 55.8 185 743 1398 11
mid C2C12 WFD 847.1 937.5 53.4 213.5 437 1108 16
late C2C12 WFD 642 689 63.5 210.7 49 840 11
combined C2C12 WFD 835.3 848 39.8 245.2 49 1398 38
max C2C13 WFD 914 964 41.4 215 437 1398 27
early HeLa Kyoto 3D-SIM 5246 5703.5 227.6 2111 249 10976 86
mid HeLa Kyoto 3D-SIM 6002.7 5699 218.9 1818.6 2326 11037 69
late HeLa Kyoto 3D-SIM 3999.9 4059 291.6 2750.5 134 13178 89
combined HeLa Kyoto 3D-SIM 5005.5 5206 155.5 2428.4 134 13178 244
max HeLa Kyoto 3D-SIM 5582.8 5699 161.9 2015.5 249 11037 155
early C2C12 3D-SIM 5462.4 5254 303.4 1689.2 2760 9279 31
mid C2C12 3D-SIM 5236.9 4897.5 308.5 2389.5 1121 14394 60
late C2C12 3D-SIM 3687.3 3987 220.1 1409.5 537 6436 41
combined C2C12 3D-SIM 4808.5 4563 182.8 2100.1 537 14394 132
max C2C13 3D-SIM 5313.7 5054 227.4 2169.3 1121 14394 91
combined HeLa Kyoto 3D-SIM live 4216.7 3533 836.8 3131 652 11649 14
combined C2C12 3D-SIM live 5026.8 5817.5 602.2 2408.9 61 8615 16
1 standard error of mean 2 standard deviation 3 number of cells quantified
“max” values represent combined measurements from early and mid S-phases
Supplementary Note 1: Cell lines with stable expression of fluorescent DNA
replication markers.
An important advantage of cell lines expressing fluorescent replication markers is the
possibility of using them for live-cell analysis of the genome duplication process. Hence, in
addition to our previously described mouse myoblast line expressing labeled GFP-tagged
PCNA 1, we generated two human HeLa Kyoto cell lines variants expressing PCNA tagged to
fluorescent proteins (FP-PCNA) by applying a two-step protocol of chromosomal integration
based on Flp-mediated site-specific recombination (Supplementary Figure 1). By using
different FP-PCNA constructs in the second step of the protocol, two cell lines were designed
to express GFP-tagged PCNA and mCherry-tagged PCNA, respectively 1,2. Both human cell
lines revealed stable and uniform expression of fluorescently-tagged PCNA variants (Figure
1D, left panel) at about 12% of endogenous PCNA level, as measured by quantitative
Western blot (Supplementary Figure 1B). We further verified by flow cytometry that the FP-
PCNA proteins did not lead to cell cycle alterations (Supplementary Figure 1C). Similarly to
native PCNA, recombinant FP-PCNA proteins localized in the nucleus and labeled sites of
active DNA synthesis (Supplementary Figure 1D, right panel). Hence, we concluded that the
generated HeLa Kyoto FP-PCNA cell lines exhibited unaltered replication dynamics 3,4 and
represented an adequate model system for DNA replication in human cells.
Supplementary Note 2: Quantification of molecular replication parameters on
combed DNA fibers.
The combination of double replication labeling and the fiber spreading protocol gave the
possibility to discard fused or partially labeled replication fork tracks (Supplementary Figure
2) and provided increased precision for each measurement. At the same time, the number
of tracks included into the quantifications was consequently reduced. Therefore, to ensure
the relevance of our measurements we verified that the mean values of both measured
parameters, RFS and IOD, were not affected by the sample size used. For that we varied
the number of measurements used in the calculations and assessed the corresponding
changes in the calculated mean values. For both parameters, individual measurements
changed the mean values in less than 5% for the sample sizes used. Hence, we concluded
that the number of replication fork tracks included in the calculations was sufficient for
statistically significant measurements (Supplementary Figure 2C).
Supplementary Note 3: Development of computer-aided protocols for replication
foci quantification.
Our initial tests revealed that very small threshold variations at the segmentation step could
lead to substantial variations in the resulting RFi numbers. We therefore set out to develop
approaches based on intrinsic image features that consequently would be as user-
independent as possible. Various algorithms for quantification of replication foci at the
different resolution levels (confocal, wide field deconvolution and super-resolution 3D-SIM)
were validated using parallel manual counting of RFi by independent persons. When
assessing the outcome of RFi quantifications, preference was given to algorithms that
resulted in fewer RFi (for a conservative estimate) than to algorithms that lead to
overestimation of RFi numbers. The best correspondence between results of
(semi)automatic RFi quantification and manual counting was obtained using the protocols
described in Supplementary Figure 3 and in more detail in 5.
Supplementary Note 4: Influence of chromatin compaction and labeling mode on
super-resolution imaging of replication foci.
Within highly compacted chromosomal regions perfect segmentation of foci even at super-
resolution microscopy level is challenging (see Supplementary Figure 4). Hence, in
particular in late S-phase mouse cells RFi numbers decreased. In addition, on average the
number of RFi counted from PCNA labeling super-resolution images was slightly higher than
the number of RFi labeled by nucleotide incorporation (Supplementary Figure 5). This
difference could be due to an inefficient incorporation and/or detection of incorporated
nucleotides. Alternatively, differences regarding dynamic behavior of DNA and PCNA
components of RFi were revealed with super-resolution microscopy. It should be noted that
during a 15-minute pulse of nucleotide incorporation an average replication fork labels
about 25 kbp that correspond to eight microns of unpacked DNA. Therefore, up to certain
condensation level the signal from the labeled nucleotide will be fuzzier than the focal signal
from PCNA-containing replisomes. An underestimation of RFi numbers can be considered as
a conservative estimate of actual RFi numbers and does not affect our further calculations
and conclusions.
Supplementary References
1 Leonhardt, H. et al. Dynamics of DNA replication factories in living cells. J Cell Biol
149, 271-280 (2000).
2 Rottach, A. et al. Generation and characterization of a rat monoclonal antibody
specific for PCNA. Hybridoma 27, 91-98 (2008).
3 Dimitrova, D. S. & Berezney, R. The spatio-temporal organization of DNA replication
sites is identical in primary, immortalized and transformed mammalian cells. J Cell
Sci 115, 4037-4051 (2002).
4 Kennedy, B. K., Barbie, D. A., Classon, M., Dyson, N. & Harlow, E. Nuclear
organization of DNA replication in primary mammalian cells. Genes Dev 14, 2855-
2868 (2000).
5 Chagin, V. O., Reinhart, M. & Cardoso, M. C. in Methods Mol Biol Vol. 1300 (eds J.
Dalgaard & S. Vengrova) 43-65 (Springer Science+Business Media New York,
2015).