Embed Size (px)
Citation preview
ANNUAL REPORT2014 - 2015
2G3G4G LT
E
TRANSPORT
ICT
ENERGY, WATER & SANITATION
IRURA ANNUAL REPORT 2014 - 2015
ANNUAL REPORT2014 - 2015

II RURA ANNUAL REPORT 2014 - 2015
IIIRURA ANNUAL REPORT 2014 - 2015
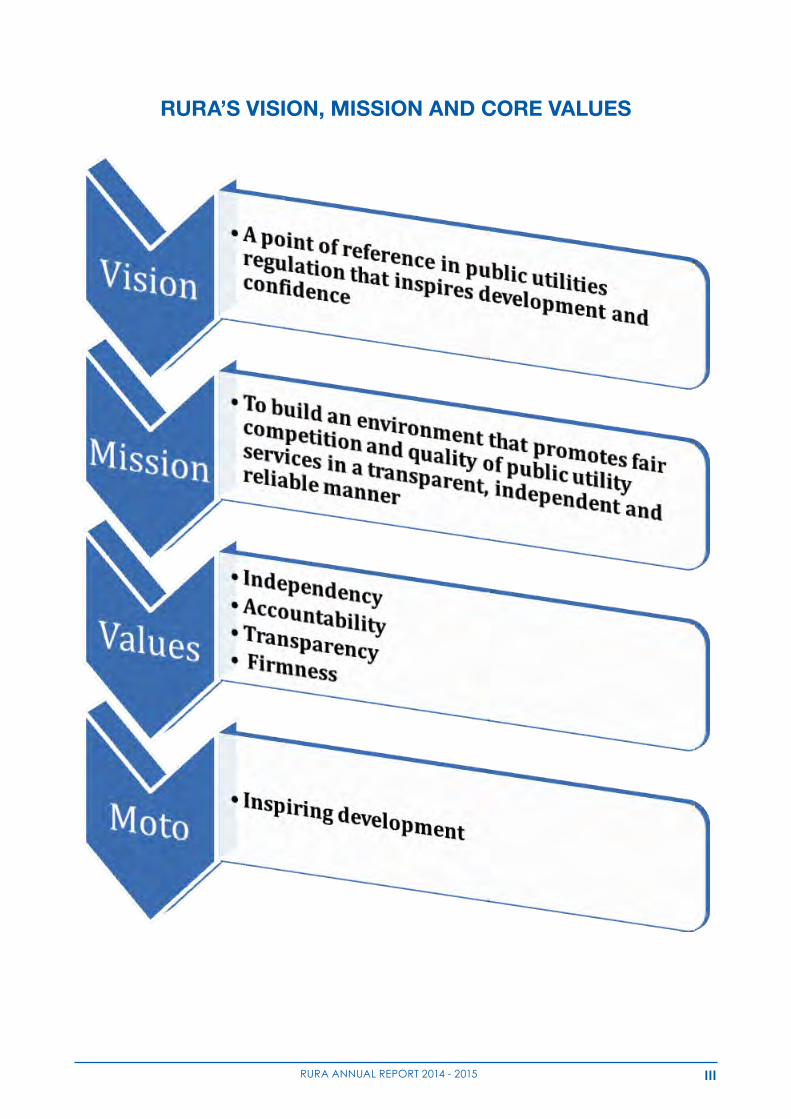
RURA’S VISION, MISSION AND CORE VALUES
RURA’S VISION, MISSION AND CORE VALUES
IV RURA ANNUAL REPORT 2014 - 2015
CONTENTS
RURA’S VISION, MISSION AND CORE VALUES IIILIST OF FIGURES VILIST OF TABLES VIIABBREVIATIONS VIIIACKNOWLEDGMENT XTHE REGULATORY BOARD XIFOREWORD XIIEXECUTIVE SUMMARY XIII
INTRODUCTION 11.1. RWANDA IN CONTEXT 21.2. RURA’S OPERATIONAL FRAMEWORK 21.3. MISSION AND POWERS 31.4. CORPORATE GOVERNANCE 41.4.1. REGULATORY BOARD 41.4.1.1. RESPONSIBILITIES OF THE REGULATORY BOARD 41.4.1.2. POWERS OF THE REGULATORY BOARD 51.4.1.3. REGULATORY BOARD COMMITTEES 51.4.1.4. REGULATORY BOARD MEETINGS 51.4.2. THE MANAGEMENT 71.5. RESPONSIBILITY AND ACCOUNTABILITY 7
2. CORPORATE PERFORMANCE REVIEW 82.1. RURA WORKFORCE 82.2. TRAINING AND DEVELOPMENT 92.3. KNOWLEDGE TRANSFER 92.4. CONSUMER EMPOWERMENT 102.5. REGIONAL AND INTERNATIONAL PARTNERSHIP 102.6. KEY EVENTS AND CORPORATE SOCIAL RESPONSIBILITY 112.7. FINANCIAL PERFORMANCE 11 ICT SECTOR 133.1. LEGAL AND REGULATORY FRAMEWORK 153.2. LICENSING 153.2.1. TELECOMMUNICATION AND INTERNET SERVICE PROVISION 153.2.2. BROADCASTING 163.2.2.1. TV BROADCASTING 163.2.2.2. FM RADIO BROADCASTERS 183.2.2.3. INTERNET AND PRINT MEDIA 193.3. MARKET PERFORMANCE AND STATISTICS 203.3.1. MOBILE AND FIXED TELEPHONE SERVICES 203.3.2. INTERNET SERVICE PROVISION 243.4. MANAGEMENT OF ICT RESOURCES 273.4.1. MANAGEMENT OF FREQUENCY SPECTRUM 273.4.2. MANAGEMENT OF NUMBERING RESOURCES 273.4.3. MANAGEMENT OF INTERNET RESOURCES 283.5. MONITORING AND ENFORCEMENT 293.5.1. FREQUENCY SPECTRUM MONITORING 293.5.2. INTERNATIONAL GATEWAY TRAFFIC VERIFICATION SYSTEM 303.5.3. INSPECTIONS AND AUTHORIZATIONS TO TELECOM OPERATOR 303.5.4. QUALITY OF SERVICE MONITORING 323.6. CONSUMER PROTECTION 333.6.1. COMPLAINTS HANDLING 33
VRURA ANNUAL REPORT 2014 - 2015
3.6.2. TELECOM OPERATORS PROMOTIONS ANALYSIS 343.7. UNIVERSAL ACCESS 343.8. OUTSTANDING ISSUES 354.1. LEGAL AND REGULATORY FRAMEWORK 394.2. LICENSING AND MARKET PERFORMANCE 394.2.1. LICENSING 394.2.1.1. PASSENGER TRANSPORTATION SERVICE 394.2.1.2. CROSS BORDER TRANSPORTATION SERVICES 404.2.1.3. TRANSPORT OF GOODS 404.2.1.4. MOTORCYCLE TRANSPORTATION 424.2.1.5. RENTAL CARS TRANSPORTATION SERVICES 424.2.1.6. TAXI CABS TRANSPORTATION SERVICES 434.2.1.7. DRIVING SCHOOLS 434.2.1.8. SCHOOL BUSES TRANSPORTATION SERVICES 454.2.2. TARIFF STRUCTURE 454.3. NEW PROJECTS INTRODUCED IN TRANSPORT SECTOR 454.3.1. ELECTRONIC-TICKETING SYSTEM 454.3.2. DRIVERS VOCATIONAL CARDS (DVC) 464.4. CONSUMER COMPLAINTS HANDLING 46
ENERGY, WATER & SANITATION SECTOR 495 ENERGY 525.1. LEGAL AND REGULATORY FRAMEWORK 525.2. LICENSING AND MARKET PERFORMANCE 525.2.1. LICENSING 525.2.1.1. ELECTRICITY 525.2.1.2. LICENSING OF DOWN STREAM PETROLEUM 535.2.2. MARKET PERFORMANCE 545.3. MONITORING 565.3.1. ELECTRICITY 565.3.2. GAS, PETROLEUM AND RENEWABLE ENERGY 565.3.2.1. LAKE KIVU METHANE GAS AND INDUSTRIAL GASES 565.3.2.2. DOWNSTREAM PETROLEUM 565.3.2.3. RENEWABLE ENERGY 575.4. CONSUMER COMPLAINTS HANDLING 575.5. OUTSTANDING ISSUES 586 WATER & SANITATION 586.1 LEGAL AND REGULATORY FRAMEWORK 586.2. LICENSING AND MARKET PERFORMANCE 586.2.1. WATER 586.2.2. SANITATION 606.3. MONITORING 626.3.1. WATER 626.3.2. SANITATION 636.3.2.1. CLEANING SERVICES 636.3.2.2. SOLID WASTE MANAGEMENT 646.4. CONSUMER PROTECTION 646.4.1. COMPLAINTS HANDLING 646.4.2. INSPECTIONS AND REVIEW OF CONTRACTS BETWEEN CONSUMERS AND OPERATORS 656.5. OUTSTANDING ISSUES 657. CONCLUSIONS AND WAY FORWARD 65
ANNEXES 69
VI RURA ANNUAL REPORT 2014 - 2015
LIST OF FIGURES
FIGURE 1: DISTRIBUTION OF RURA STAFF PER QUALIFICATIONS 8FIGURE 2: DISTRIBUTION OF RURA STAFF BY AGE (2014-2015) 9FIGURE 3: DEVELOPMENT OF THE MOBILE TELEPHONE SUBSCRIBER BASE FOR THE PERIOD 2009-JUNE 2015. 21FIGURE 4: DEVELOPMENT OF FIXED TELEPHONE SUBSCRIBERS FOR THE PERIOD 2009-JUNE 2015 21FIGURE 5: EVOLUTION OF MOBILE TELEPHONE SUBSCRIBERS MARKET SHARE PER OPERATOR 22FIGURE 6: MOBILE TELEPHONE NETWORK COVERAGE TREND UP TO JUNE 2015 23FIGURE 7: DEVELOPMENT OF INTERNET SUBSCRIBERS FOR THE PERIOD 2009 - JUNE 2015 25FIGURE 8: INTERNET PENETRATION RATE TREND AS OF JUNE 2015 25FIGURE 9: NUMBER OF REGISTERED COMPLAINTS IN ICT DURING FISCAL YEAR 2014- 2015 33FIGURE 10: NUMBER OF REGISTERED COMPLAINTS PER CATEGORY IN ICT SECTOR (2014-2015) 34FIGURE 11: FLEET INCREASE IN PASSENGER BUS TRANSPORTATION SERVICES 40FIGURE 12: EVOLUTION OF FLEET IN GOODS TRANSPORT COMPANIES / COOPERATIVES 41FIGURE 13: EVOLUTION OF LICENSED INDIVIDUAL VEHICLES IN TRANSPORT OF GOODS 41FIGURE 14: FLEET EVOLUTION IN TAXI CABS BY DISTRICT 43FIGURE 15: LICENSED DRIVING SCHOOL OPERATORS 43FIGURE 16: NUMBER OF REGISTERED COMPLAINTS IN TRANSPORT SECTOR DURING FISCAL 46FIGURE 17: REGISTERED COMPLAINTS PER CATEGORY IN TRANSPORT SECTOR 47FIGURE 18: NUMBER OF REGISTERED COMPLAINTS IN ENERGY SECTOR 57 DURING FISCAL YEAR 2014- 2015 57FIGURE 19: VOLUME OF WATER PRODUCED AND SUPPLIED BY WASAC LTD 59FIGURE 20: NON REVENUE WATER IN URBAN WATER SUPPLY 59FIGURE 21: CUSTOMERS’ CONNECTIONS IN WATER SUPPLY 59FIGURE 22: LICENSED OPERATORS IN CLEANING SERVICE PROVISION 60FIGURE 23: NZOVE WATER TREATMENT PLANT 63FIGURE 24: NUMBER OF REGISTERED COMPLAINTS IN WATER AND SANITATION SECTOR DURING FISCAL YEAR 2014- 2015 64
VIIRURA ANNUAL REPORT 2014 - 2015
LIST OF TABLESTABLE 1: STRATEGIC AREA OF TRAINING 9TABLE 2: FINANCIAL PERFORMANCE IN RWF/RURA 12TABLE 3: FINANCIAL PERFORMANCE IN RWF/UNIVERSAL ACCESS FUND 12TABLE 4: LICENSED NETWORK AND SERVICE PROVIDERS AS OF JUNE 2015 16TABLE 5: THE LIST OF TELEVISION BROADCASTING APPLICANTS AS OF JUNE 30TH, 2015 17TABLE 6: LIST OF NEW ASSIGNED FM FREQUENCIES 18TABLE 7: NEW INTERNET RELATED MEDIA APPLICATIONS AND LICENSES PROVIDED BY RURA 19TABLE 8: NEW PRINT MEDIA ORGANS THAT HAVE THE PERMIT IN FISCAL YEAR 2014-2015 19TABLE 9: NUMBER OF MOBILE AND FIXED TELEPHONE SERVICE SUBSCRIBERS PER TELECOM OPERATOR 20TABLE 10: MOBILE TELEPHONE NETWORK COVERAGE PER TYPE OF TECHNOLOGY AND OPERATORS AS OF JUNE 2015 22TABLE 11: FIXED VOICE TELEPHONE TARIFF TREND 23TABLE 12: MOBILE VOICE TELEPHONE TARIFF TREND 24TABLE 13: INTERNATIONAL INTERNET BANDWIDTH IN MBPS 25TABLE 14: INTERNET SUBSCRIBERS PER CATEGORY PER OPERATOR AS OF JUNE 2015 26TABLE 15: SMART DEVICES USERS IN THE LAST TWO QUARTERS 26TABLE 16: LICENSES ISSUED AND REVOKED IN DIFFERENT SERVICES 27TABLE 17: LIST OF HARMONIZED CODES FOR IDENTIFIED SERVICES 28TABLE 18: NEW REGISTRARS DURING FISCAL YEAR 2014 - 2015 29TABLE 19: EVOLUTION OF INCOMING, OUTGOING INTERNATIONAL AND NATIONAL OFF NET TRAFFIC 30TABLE 20: TOWER AND ROOFTOP AUTHORIZATION IN FISCAL YEAR 2014 - 2015 31TABLE 21: FIBER OPTIC INSTALLATION AUTHORIZATION 31TABLE 22: STATISTICS OF QOS FOR MOBILE NETWORKS OF MTN RWANDA, TIGO AND AIRTEL RWANDA IN 2014-2015 . 32TABLE 23: LICENSED CROSS-BORDER COMPANIES 40TABLE 24: LICENSED RENTAL TRANSPORT COMPANIES WITH THEIR FLEET CAPACITY 42TABLE 25: DISTRIBUTION OF DRIVING SCHOOLS PER DISTRICT 44TABLE 26: LICENSED ELECTRICAL POWER GENERATION OPERATORS 53TABLE 27: LIST OF THE LICENSED PETROL SERVICE STATIONS (2014-2015) 54TABLE 28: TREND IN ELECTRICITY SUBSCRIBERS 55TABLE 29: ELECTRICITY TARIFF VAT EXCLUSIVE 55TABLE 30: NEW END USER WATER TARIFF 60TABLE 31: DISTRIBUTION OF LICENSED OPERATORS PER REGION 61TABLE 32: LICENSED OPERATORS IN SOLID WASTE COLLECTION AND TRANSPORTATION 61
ANNEX 1: RURA ORGANISATIONAL STRUCTURE 70ANNEX 2: LICENSED LOCAL PUBLIC BUS TRANSPORT COMPANIES / COOPERATIVES 71ANNEX 3: LICENSED GOODS TRANSPORT COMPANIES/ COOPERATIVES 73ANNEX 4: LICENSED MOTOCYCLE TRANSPORT COOPERATIVES PER MARKET SHARE 75ANNEX 5: LICENSED TAXI CAB OPERATORS 80ANNEX 6: LICENSED DRIVING SCHOOLS 83
VIII RURA ANNUAL REPORT 2014 - 2015
ABBREVIATIONS
ADECOR Association Des Consommateurs au Rwanda
AFRINIC Africain Network Information Center
ARCEP L’Autorité de régulation des communications électroniques
et de la poste
ARCT Agence de Régulation et de Contrôle des Télécommunications
BBC British Broadcasting Corporation
CA Communication Authority of Kenya
CBA CostBenefitAnalysis
CcTLD Country Code Top Level Domain
CDMA Code Division Multiple Access
CDR Call Drop Rate
COMESA Common Market for Eastern and Southern Africa
CSSR Call Setup Success Rate
CST Calll Setup Time
CTO Commonwealth Telecommunications organization
DTT Digital Terrestrial Television
DVC Drivers Vocational Cards
EAC East African Community
EACO The East African Communications organization
EARP Electricity Access Roll-Out Program
EDPRS Economic Development and Poverty Reduction Strategy
ERA Electricity Regulatory Authority
ERC Electricity Regulatory Commission
EREA Energy Regulators Association of East Africa
ESAWAS Eastern and Southern Africa Water and Sanitation Regulators
Association
EUCL Energy Utility Corporation Limited
EWURA Energy and Water Utilities Regulatory Authority
FM Frequency Modulation
GDP Gross Domestic Product
GoR Government of Rwanda
GVEP Global Village Energy Partnership
ICANN Internet Corporation for Assigned Names and Numbers
IER Institution of Engineers Rwanda
IGTVS InternationalGatewayTrafficVerificationSystem
IPv Internet Protocol Version
ISP Internet Service Provider
ITU International Telecommunication Union
IXRURA ANNUAL REPORT 2014 - 2015
LPG LiquefiedPetroleumGas
MDG Millennium Development Goals
MNP Mobile Number Portability
MoU Memorandum of Understanding
MW Megawatt
NCIP Northern Corridor Integrated Projects
NGO Non Governmental Organization
NISR National Institute of Statistics of Rwanda
NICI National Information Communication Infrastructure
ORn Olleh Rwanda Network
QoS Quality of Service
RAERESA Regional Association of Energy Regulators for Eastern and Southern
Africa
RDB Rwanda Development Board
REG Rwanda Energy Group
RICTA Rwanda Information and Communication Technology Association
RINEX Rwanda Internet Network Exchange
RNP Rwanda National Police
RURA Rwanda Utilities Regulatory Authority
SDG Sustainable Development Goals
SP Société Pétrolière
STB Set Top Boxes
STL Studio Transmitter Link
SWH Solar Water Heating
TCRA Tanzania Communications Regulatory Authority
TVWS TV White Space
UAF Universal Access Fund
UCC Uganda Communication Commission
UITP Union Internationale des Transports Publics
USAID United States Agency for International Development
VHF Very High Frequency
VSAT Very Small Aperture Terminal
WASAC Water and Sanitation Corporation
WSIS World Summit on the Information Society
X RURA ANNUAL REPORT 2014 - 2015
ACKNOWLEDGMENT
The Rwanda Utilities Regulatory Authority recognizes and appreciates the hard work that
went into developing this Annual Report. For this reason, the Regulatory Board and the
Management wish to thank the following individuals for their devotion, dedication and
professionalism in developing this Annual Report.
Ms. Beata Mukangabo– Chairperson
Mr. Egidius Mbarara– Vice Chairperson
Mrs. Consolee Umulisa
Mr. Deo Muvunyi
Mrs Carine Manirakiza
Mrs. Yvonne Umutoni
Mr. Aaron Ndizeye
Mrs. Annick Muhama
XIRURA ANNUAL REPORT 2014 - 2015
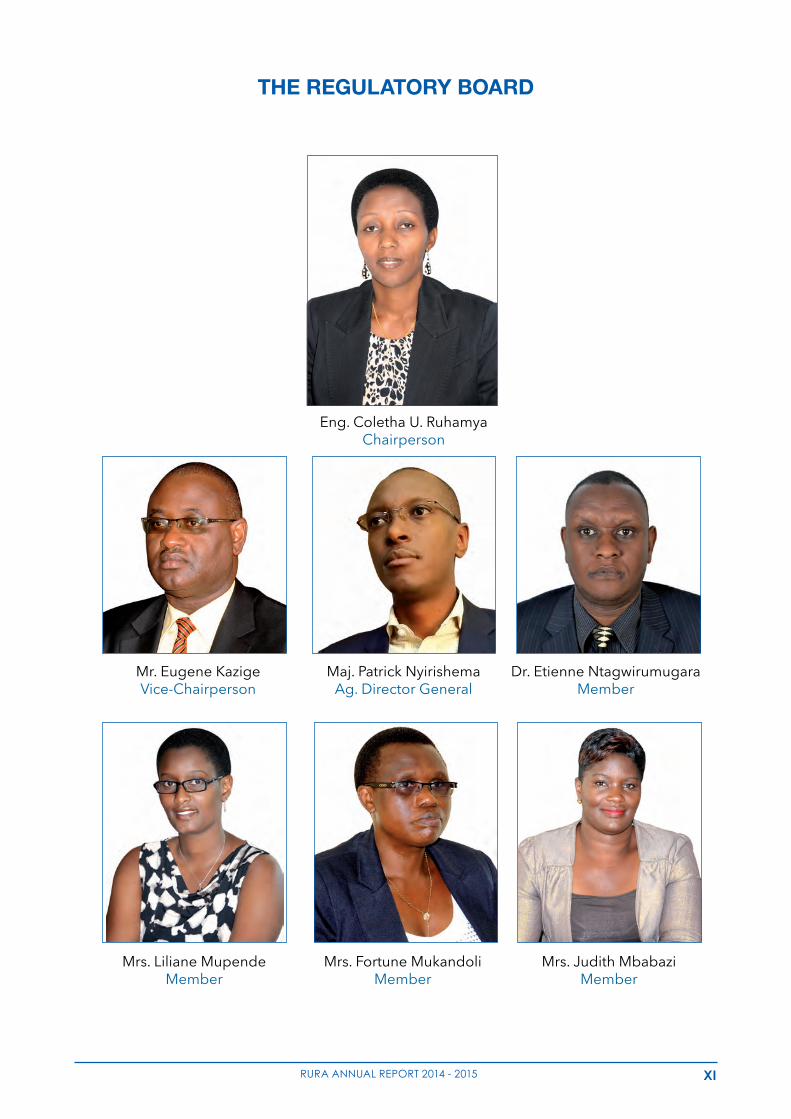
THE REGULATORY BOARD
13
RURA ANNUAL REPORT 2013-2014
Eng. Coletha U. RuhamyaChairperson
Mr. Eugene KazigeVice-Chairperson
Dr. Etienne NtagwirumugaraMember
Maj. Patrick NyirishemaAg. Director General
Mrs. Fortune MukandoliMember
Mrs. Liliane MupendeMember
Mrs. Judith MbabaziMember
ThE REGULATORy BOARD
XII RURA ANNUAL REPORT 2014 - 2015
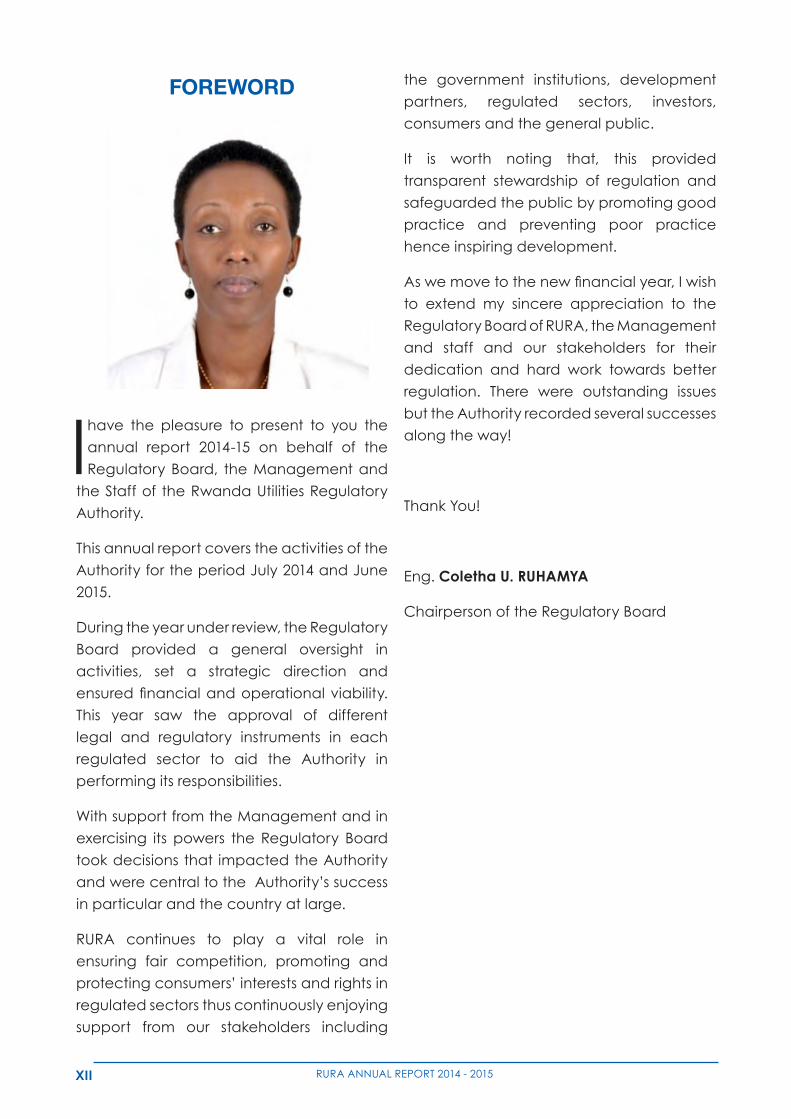
FOREWORD
I have the pleasure to present to you the
annual report 2014-15 on behalf of the
Regulatory Board, the Management and
the Staff of the Rwanda Utilities Regulatory
Authority.
This annual report covers the activities of the
Authority for the period July 2014 and June
2015.
During the year under review, the Regulatory
Board provided a general oversight in
activities, set a strategic direction and
ensuredfinancialandoperationalviability.
This year saw the approval of different
legal and regulatory instruments in each
regulated sector to aid the Authority in
performing its responsibilities.
With support from the Management and in
exercising its powers the Regulatory Board
took decisions that impacted the Authority
and were central to the Authority’s success
in particular and the country at large.
RURA continues to play a vital role in
ensuring fair competition, promoting and
protecting consumers’ interests and rights in
regulated sectors thus continuously enjoying
support from our stakeholders including
the government institutions, development
partners, regulated sectors, investors,
consumers and the general public.
It is worth noting that, this provided
transparent stewardship of regulation and
safeguarded the public by promoting good
practice and preventing poor practice
hence inspiring development.
Aswemovetothenewfinancialyear,Iwish
to extend my sincere appreciation to the
Regulatory Board of RURA, the Management
and staff and our stakeholders for their
dedication and hard work towards better
regulation. There were outstanding issues
but the Authority recorded several successes
along the way!
Thank You!
Eng. Coletha U. RUHAMYA
Chairperson of the Regulatory Board
XIIIRURA ANNUAL REPORT 2014 - 2015
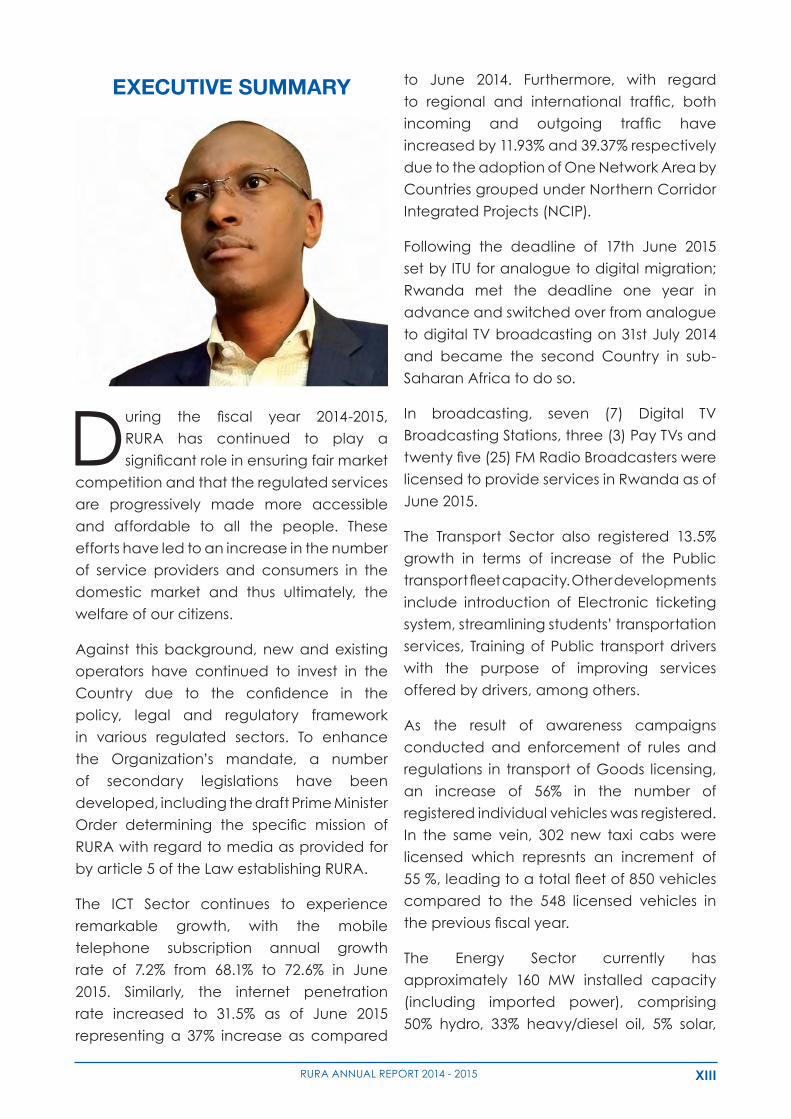
EXECUTIVE SUMMARY
During the fiscal year 2014-2015,
RURA has continued to play a
significantroleinensuringfairmarket
competition and that the regulated services
are progressively made more accessible
and affordable to all the people. These
efforts have led to an increase in the number
of service providers and consumers in the
domestic market and thus ultimately, the
welfare of our citizens.
Against this background, new and existing
operators have continued to invest in the
Country due to the confidence in the
policy, legal and regulatory framework
in various regulated sectors. To enhance
the Organization’s mandate, a number
of secondary legislations have been
developed, including the draft Prime Minister
Order determining the specific mission of
RURA with regard to media as provided for
by article 5 of the Law establishing RURA.
The ICT Sector continues to experience
remarkable growth, with the mobile
telephone subscription annual growth
rate of 7.2% from 68.1% to 72.6% in June
2015. Similarly, the internet penetration
rate increased to 31.5% as of June 2015
representing a 37% increase as compared
to June 2014. Furthermore, with regard
to regional and international traffic, both
incoming and outgoing traffic have
increased by 11.93% and 39.37% respectively
due to the adoption of One Network Area by
Countries grouped under Northern Corridor
Integrated Projects (NCIP).
Following the deadline of 17th June 2015
set by ITU for analogue to digital migration;
Rwanda met the deadline one year in
advance and switched over from analogue
to digital TV broadcasting on 31st July 2014
and became the second Country in sub-
Saharan Africa to do so.
In broadcasting, seven (7) Digital TV
Broadcasting Stations, three (3) Pay TVs and
twentyfive(25)FMRadioBroadcasterswere
licensed to provide services in Rwanda as of
June 2015.
The Transport Sector also registered 13.5%
growth in terms of increase of the Public
transportfleetcapacity.Otherdevelopments
include introduction of Electronic ticketing
system, streamlining students’ transportation
services, Training of Public transport drivers
with the purpose of improving services
offered by drivers, among others.
As the result of awareness campaigns
conducted and enforcement of rules and
regulations in transport of Goods licensing,
an increase of 56% in the number of
registered individual vehicles was registered.
In the same vein, 302 new taxi cabs were
licensed which represnts an increment of
55%,leadingtoatotalfleetof850vehicles
compared to the 548 licensed vehicles in
thepreviousfiscalyear.
The Energy Sector currently has
approximately 160 MW installed capacity
(including imported power), comprising
50% hydro, 33% heavy/diesel oil, 5% solar,
XIV RURA ANNUAL REPORT 2014 - 2015
2% methane gas with the 10% balance
coming from imports. RURA issued a 25-
year license for electricity generation for an
80MW peat-to-power plant in the Southern
Province and six (6) provisional electricity
generation licenses were issued; while the
total electricity subscribers increased by
19%.
RURA also enforced the Petrol Service Stations
Regulations governing the construction,
installation and operation of petrol service
stationsinRwandawherebytwentyfive(25)
new developers of petrol service stations
were licensed.
On the other hand, as access to improved
drinking water and sanitation services is
a basic right that every citizen must enjoy,
the water supply sub-sector recorded an
increase of 2.1 % in water production while
total number of customer connections
increased by 9.7% as compared to the
previous year. The water utility needs to
significantlyboostwaterproductionaswell
as distribution to meet both the existing and
future demand.
In line with the Country visibility, RURA
continued to represent Rwanda in
regional activities including East African
Communication Organization (EACO) and
EREA Working Groups and Conferences.
At international level, RURA continued
to represent Rwanda in International
Telecommunications Union (ITU) activities
including ITU Telecom World 2014, Study
Groups, Council Working Groups, Radio
Communication Advisory Group, WSIS
Forum, the Rwanda campaign for re-
election to ITU Council and was re-elected
for the period 2014 – 2018.
During the fiscal year under review,
RURA witnessed viable relationship and
partnership with many Regional and
International organisations including ITU,
EACO, EREA, RERESA, ESAWAS and ICANN
aimed at building effective partnerships
and exchange of regulatory experiences
within the Regional and International
Organizations.
As this annual report indicates, much has
been done over the previous year. The ICT
sector is well on its way to achieve Vision
2020 targets by 2017, but much more needs
to be done to achieve EDPRS and Vision
2020 targets, particularly in Energy and
Water sub-sectors.
Patrick Nyirishema
Maj.
Ag. Director General

1RURA ANNUAL REPORT 2014 - 2015
INTRODUCTION
2 RURA ANNUAL REPORT 2014 - 2015
1.1. RWANDA IN CONTEXT
Rwanda is a landlocked country within
the East Africa Community (EAC)
political sphere (commonly known as
the land of thousand hills) and has a surface
area of 26,338 Square kilometres with a
population of about 10.9 million, one of the
highest in the world in terms of density (NISR,
2012). And GDP per capita of about U$ 644
(as of 2013)
The documents of the Vision 2020 and
the Economic Development and Poverty
Reduction Strategy [EDPRS II] 2013-2018 set
the target to achieve income status by 2020
with an annual growth rate of 11.5% and the
GDP per capita of USD 1,200 by 2020. In line
with its policy of economic development
and good governance, the Government of
Rwanda (GoR) has established the Rwanda
Utilities Regulatory Authority (RURA) so that it
contributes to the achievement of its socio-
economic goals.
1.2. RURA’S OPERATIONAL FRAMEWORK
Rwanda Utilities Regulatory Authority (RURA)
is a multi-sector regulatory body with the
mandate to regulate four sectors of the
economy to wit; ICTs including Media&
Postal, Energy, Water & Sanitation and
Transport. With a very high tele-density,
lower GDP per capita and highly agrarian
economy, the role of the Regulatory Authority
in the much-needed transformational
development is both crucial and strategic.
Theeffectiveexecutionandfulfilmentof its
mandate will to a great extent depend on
a clear and effective strategic alignment of
its operations.
RURA was initially created by the Law
N° 39/2001 of 13thSeptember 2001 as an
agency with the mission to regulate certain
public Utilities, namely: telecommunications
network and/ or Telecommunications
services, electricity, water, removal of
waste products from residential or business
premises, extraction and distribution of gas
and transport of goods and persons.
This Law was further reviewed and replaced
by Law Nº 09/2013 of 01/03/2013 establishing
Rwanda Utilities Regulatory Authority
(RURA) and determining its mission, powers,
organization and functioning. This Law gives
RURA the mandate to regulate:
1. Telecommunications, information
technology, broadcasting and
converging electronic technologies
including the internet and any other audio-
visual information and communication
technology;
Ms Beata MukangaboHead of Corporate, Legal & Industrial Affairs Department
3RURA ANNUAL REPORT 2014 - 2015
2. postal services;
3. Renewable and non-renewable
energy, industrial gases, pipelines and
storage facilities;
4. Water;
5. Sanitation;
6. Transport of persons and goods; 7.
Other public utilities, if deemed necessary.
The same Law gives the Regulatory
Authoritya legalpersonality, financialand
administrativeautonomyinthefulfilmentof
its mandate. The Authority plays a pivotal
role between the policy maker, licensed
service providers and consumers. The
Authority reports totheOfficeof thePrime
Minister and it coordinates with line ministries
responsible for each regulated sector in
executing its functions.
In addition to the law creating RURA, there
are a number of other legal and regulatory
instruments which help RURA to discharge its
responsibilitiesineachspecificsectortobe
regulated.
In the same vein, the Authority has the mission
to ensure fair competition, promoting and
protecting consumers’ interests and rights in
regulated sectors.
1.3. MISSION AND POWERS
The Law Nº 09/2013 of 01/03/2013 gives the
Authority the following missions and power:
• tosetupnecessaryguidelinesinorderto
implement laws and regulations in force;
• to ensure compliance by public utilities
with the provisions of laws and regulations
governing the regulated sectors in
an objective, transparent and non-
discriminatory manner;
• toensurethecontinuityofservicedelivery
by the licensed or authorized service
providers and the preservation of public
interest;
• to protect users’ andoperators’ interests
by taking measures likely to guarantee
effective, sound and fair competition in
the regulated sectors within the framework
of applicable laws and regulations;
• to protect and promote consumers’
interests;
• to promote the availability, accessibility
and affordability of regulated services to
all consumers including low income, rural
and disadvantaged consumers;
• to promote efficient development of
regulated sectors in accordance with
Government economic and financial
policy;
• to promote and enhance general
knowledge, sensitization and awareness
of the regulated sectors including but not
limited to:
•Promote and protect the rights and
obligations of consumers and service
providers;
• Issuing permits, authorizations and
licenses required for regulated sectors, in
accordance with the relevant laws and
regulations;
• to monitor and ensure compliance by
regulated network or service providers
in line with their licenses, permits and
concession obligations;
• Toensurefaircompetitioninallregulated
sectors.
4 RURA ANNUAL REPORT 2014 - 2015
For public interest and consumers protection
inparticular,andinordertoeffectivelyfulfil
this mandate, RURA has been vested by the
Law the following powers:
1º to carry out investigations including
inspections at service delivery sites of
the regulated service providers in the
purpose of ensuring compliance with their
obligations;
2º to impose administrative sanctions in
case of a violation of this Law and other
Laws and regulations governing regulated
sectors;
3 º to settle and facilitate the settlement of
disputes related to regulated services;
4º to issue directives to the regulated service
provider whose license to operate has
beencancelled,suspended,modifiedor
revoked, and appoint an administrator
5º Power to regulate tariffs and charges
6º Power to obtain information
7º Judicial police power and RURA’s
representation before courts
As per the Law, RURA may have access to
any commercial premises of any natural
person or legal entity, at any time, in
accordance with the law, either with or
without notice, to inspect and obtain any
necessary information when there are
reasonable grounds to believe that there is
a violation of provisions of the law governing
the concerned regulated utility or the Law
creating the Authority.
1.4. CORPORATE GOVERNANCE
1.4.1. REGULATORY BOARD
The Regulatory Board is by virtue of the law
is the supreme management and decision
making organ. The Regulatory Board consists
of seven (7) members including the Director
General who equally serves as a rapporteur.
The functioning and duties of the Regulatory
Board are determined by the Law.
1.4.1.1. RESPONSIBILITIES OF THE REGULATORY BOARD
The responsibilities of the Regulatory Board
as outlined in the law establishing RURA
include
a) To participate in developing
RURA general policy and monitor its
implementation;
b) To determine the general vision of
RURA and ensure its implementation;
c) To approve RURA’s annual budget
and action plan;
d) To approve annual financial
statementsforthepreviousfinancialyear;
e) To adopt the staff statutes, their
emoluments, their wage structure, the
internal rules and the organizational
structure for RURA;
f) To determine the job descriptions
of RURA employees, set related terms
and conditions of employment and
appoint staff members based on the
recommendation of the Director General;
g) To evaluate the performance of
the RURA based on its action plan and
budget;
h) To decide on receiving, buying,
5RURA ANNUAL REPORT 2014 - 2015
giving away or selling movable or
immovable property and on the use of
RURA’s property;
i) To approve the annual activity
report of RURA before its submission to the
supervisory authority.
1.4.1.2. POWERS OF THE REGULATORY BOARD
The Regulatory Board shall have the
following powers:
1) To set up the general regulations and
directives in accordance with the laws in
force;
2) To determine at any time
tariffs, charges related to networks
interconnection or infrastructure shared
by public utilities provider
3) To take any decision pertaining to the
regulation of public utilities, particularly
any decisions relating to the granting,
suspension and withdrawal of a license,
authorization or permit;
4) To take administrative sanctions in
case of violation of legal and regulatory
provisions or of the contents of permits,
licenses, authorization and other
directives;
5) To take decisions on any disputes
referred to it;
6) To conciliate, upon request of parties
in dispute.
1.4.1.3. REGULATORY BOARD COMMITTEES
In order to effectively perform its
responsibilities, the Regulatory Board formed
the following committees entrusted with
analyzing in depth all issues of the Authority
before any decision is taken:
• Audit and Risk Committee: The
Committee consists of 4 members of the
Regulatory Board and met three (3) times
during the period under review mainly to
ensure that the financial health of the
Authority is in good condition.
• Human Resource Committee: The
Committee consists of 3 members of
the Regulatory Board and met three (3)
times during the period under review
mainly to review the human resource
issues affecting the Authority.
• Technical Committee: The Technical
Committee consists of 3 members of the
Regulatory Board.
1.4.1.4. REGULATORY BOARD MEETINGS
The ordinary meetings of the Regulatory
Board are held every month and the extra
ordinary meetings are held at any time
once initiated by the Chairperson/Vice-
Chairperson of the Regulatory Board, the
supervising Organ of RURA (The Prime
Minister’s Office), 2/3 members of the
Regulatory Board or by the Director General
of RURA.
6 RURA ANNUAL REPORT 2014 - 2015
During the period under review, the
Regulatory Board held Seven (7) ordinary
Board meetings and Three (3) extra-ordinary
Board meetings. In addition to this, the
Regulatory Board held a session with the
Board members of Uganda Communications
Commission who paid a study visit to Rwanda
for learning from RURA’s experience on a
number of regulatory issues.
The following are some key resolutions/
decisions taken during the period under
review per Department:
• ICT Sector
(i) Approval of the signal distributor
license for Pan-Africa Network Group
(ii) Approval of additional frequencies
for Airtel Rwanda
(iii) Approval of amended schedule
to the existing regulations on the
InternationalGateway TrafficVerification
System (IGTVS)
(iv) Approval of the network facilities
provider license, the network services
provider license and content services
provider license for “FIBRENET TELECOM
LIMITED”
(v) Review of VSAT License fees
(vi) Approval of the change in the
shareholding structure of TIGO
(vii) Approval of the request by AIRTEL to
sell shareholding in Rwanda towers to IHS
Rwanda
(viii) Approval of the network service
provider license for “Bandwidth and
Cloud Service Group Limited” (BCS)
(ix) Approval of regulations governing
Postal and Courier services in Rwanda
(x) Approval of the International
Gateway Traffic Verification System
(IGTVS) payment plan
• Energy, Water and Sanitation Sector
(i) Approval of the regulations on solid
waste collection and transportation in
Rwanda
(ii) Approval of the generation License
for YUMN Ltd
(iii) Approval of the modification of
electrical installation regulations
(iv) Approval of the solar water heating
regulations
(v) Endorsement the electricity end-user
tariff methodology
(vi) Approval of the regulations governing
solid waste recycling in Rwanda
(vii) Approval of the regulations governing
solid waste recycling in Rwanda
• TRANSPORT Sector
(i) Approval of the regulations governing
waterways transport services in Rwanda
(ii) Approval of the new public transport
tariff
(iii) Approval of passengers road
transport regulations
(iv) Review of the code of conduct of
public road transport drivers in Rwanda
• Corporate, Legal and Industry Affairs Department
(i) Confirmation of staff on different
positions
(ii) Approval of the purchase of an extra
7RURA ANNUAL REPORT 2014 - 2015
plot for the construction of the RURA HQ
(Twin Towers)
(iii) Approval of the annual activities
reportforthefiscalyear2013-2014
(iv) Approval of the transfer of the
remaining funds from GTV performance
bond to the RURA Account
(v) Appointment of an Inquiry Committee
on the BBC Documentary “Rwanda’s
Untold Story”
(vi) Approval of the revised budget for
thefinancialyear2014-2015
(vii) Approval of new positions on the
existing RURA Structure
1.4.2. THE MANAGEMENT
The Director General of RURA is entrusted with
executive powers. He/she coordinates and
directs its daily activities and is answerable
to the Regulatory Board on how its decisions
are implemented. The Director General
is assisted by four Heads of Departments
heading respectively 1) Communications &
Media Regulation, 2) Transport Regulation,
3) Energy, Water & Sanitation Regulation
and 4) Corporate, Legal &Industry Affairs
Departments. The Director General and
the Heads of Departments constitute the
Senior Management of RURA. The entire
organizational structure can be found in
Annex 1.
1.5. RESPONSIBILITY AND ACCOUNTABILITY
In the conduct of its mission, RURA is
supervisedbythePrimeMinister’sOfficeand
it coordinates with line ministries responsible
for each regulated sector in executing its
functions. The Prime Minister’s Order No 89/03
of 11/09/2014 has determined modalities
of which Ministries in charge of regulated
sectors shall coordinate activities with RURA
in the implementation of their respective
mandates.
RURA submits an annual activity report to the
PrimeMinister’sofficeandprovidecopiesto
the Parliament, both chambers, Ministry in
chargeoffinanceandMinistries incharge
of regulated services within three (3) months
after the close of the budget year.
RURA finances are audited by the Auditor
GeneraloftheStatefinancesattheendof
the budget year and whenever considered
necessary.
RURA has also internal control systems that
help the organization to achieve its goals in
effective,efficientandtransparentmanner.
8 RURA ANNUAL REPORT 2014 - 2015
2. CORPORATE PERFORMANCE REVIEW
2.1. RURA WORKFORCE
The number of RURA staff by June 2015 reached one hundred and twenty nine (129)
including 4 on determined contract, the percentage of male and female counts 65.1%
and 34.9% respectively.
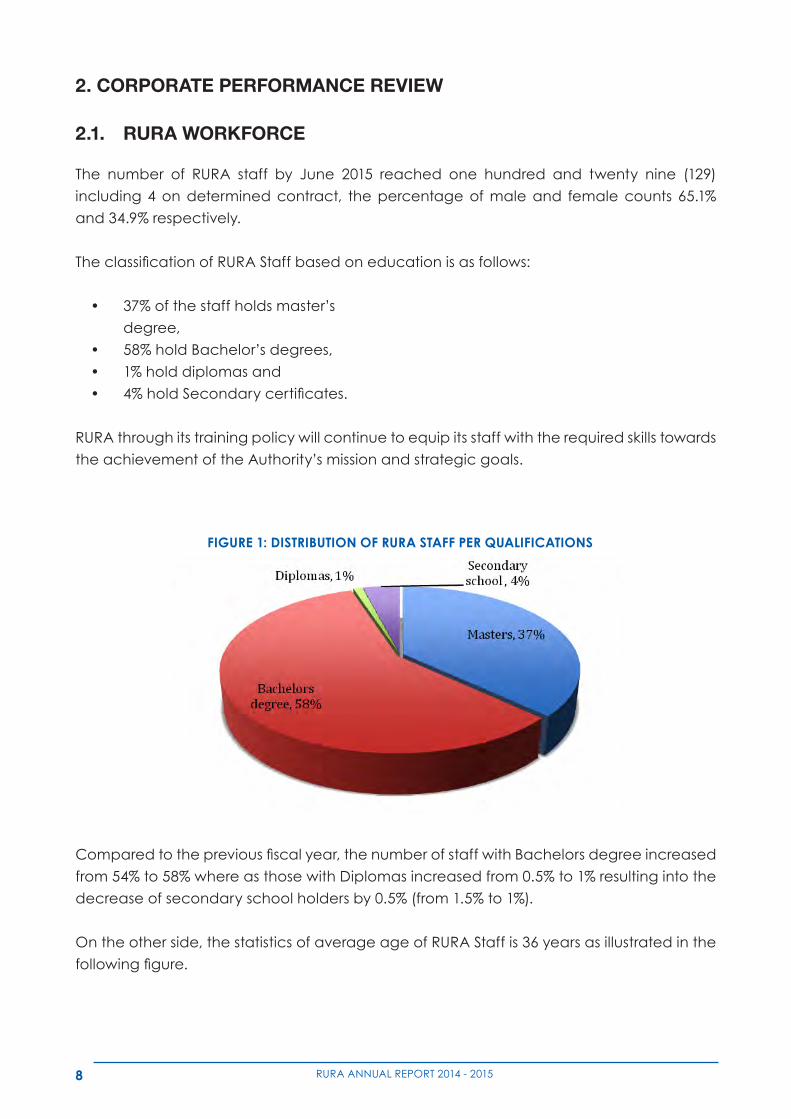
TheclassificationofRURAStaffbasedoneducationisasfollows:
• 37%ofthestaffholdsmaster’s
degree,
• 58%holdBachelor’sdegrees,
• 1%holddiplomasand
• 4%holdSecondarycertificates.
RURA through its training policy will continue to equip its staff with the required skills towards
the achievement of the Authority’s mission and strategic goals.
Comparedtothepreviousfiscalyear,thenumberofstaffwithBachelorsdegreeincreased
from 54% to 58% where as those with Diplomas increased from 0.5% to 1% resulting into the
decrease of secondary school holders by 0.5% (from 1.5% to 1%).
On the other side, the statistics of average age of RURA Staff is 36 years as illustrated in the
followingfigure.
2. CORPORATE PERFORMANCE REVIEW
2.1. RURA WORKFORCE
The number of RURA staff by June 2015 reached one hundred and twenty nine (129) including 4
on determined contract, the percentage of male and female counts 65.1% and 34.9%
respectively.
The classification of RURA Staff based on education is as follows:
• 37% of the staff holds master’s degree,
• 58% hold Bachelor’s degrees,
• 1% hold diplomas and
• 4% hold Secondary certificates.
RURA through its training policy will continue to equip its staff with the required skills towards
the achievement of the Authority’s mission and strategic goals.
Figure 1: Distribution of RURA staff per qualifications
FIGURE 1: DISTRIBUTION OF RURA STAFF PER QUALIFICATIONS
9RURA ANNUAL REPORT 2014 - 2015
Compared to the previous fiscal year, the number of staff with Bachelors degree increased from
54% to 58% where as those with Diplomas increased from 0.5% to 1% resulting into the
decrease of secondary school holders by 0.5% (from 1.5% to 1%).
On the other side, the statistics of average age of RURA Staff is 36 years as illustrated in the
following figure.
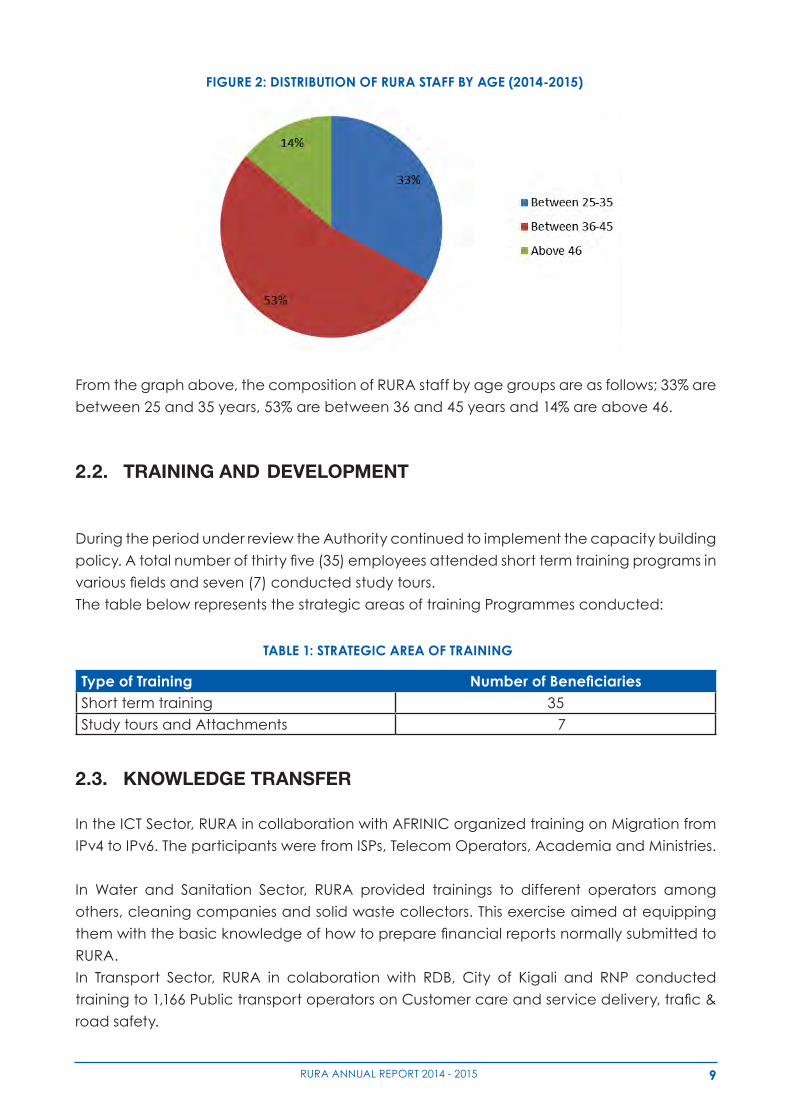
Figure 2: Distribution of RURA staff by age (2014-2015)
From the graph above, the composition of RURA staff by age groups are as follows; 33% are
between 25 and 35 years, 53% are between 36 and 45 years and 14% are above 46.
2.2. TRAINING AND DEVELOPMENT
During the period under review the Authority continued to implement the capacity building
policy. A total number of thirty five (35) employees attended short term training programs in
various fields and seven (7) conducted study tours.
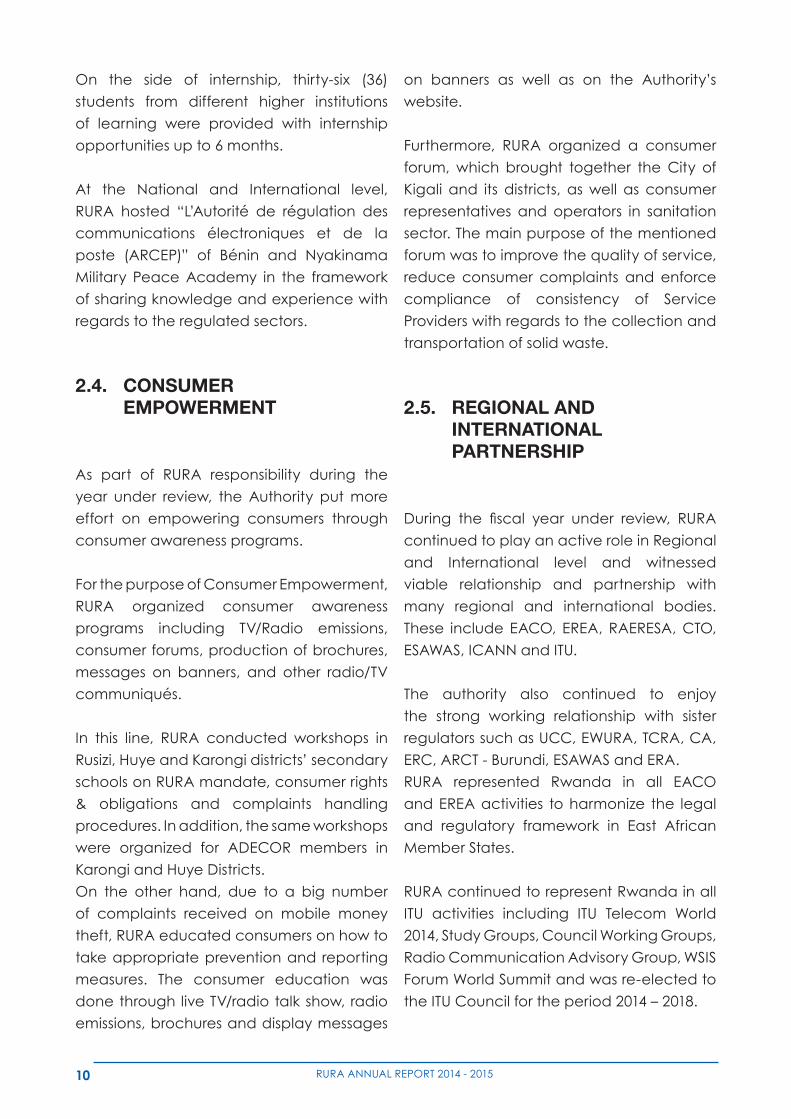
The table below represents the strategic areas of training Programmes conducted:
FIGURE 2: DISTRIBUTION OF RURA STAFF BY AGE (2014-2015)
From the graph above, the composition of RURA staff by age groups are as follows; 33% are
between 25 and 35 years, 53% are between 36 and 45 years and 14% are above 46.
2.2. TRAINING AND DEVELOPMENT
During the period under review the Authority continued to implement the capacity building
policy.Atotalnumberofthirtyfive(35)employeesattendedshorttermtrainingprogramsin
variousfieldsandseven(7)conductedstudytours.
The table below represents the strategic areas of training Programmes conducted:
2.3. KNOWLEDGE TRANSFER
In the ICT Sector, RURA in collaboration with AFRINIC organized training on Migration from
IPv4 to IPv6. The participants were from ISPs, Telecom Operators, Academia and Ministries.
In Water and Sanitation Sector, RURA provided trainings to different operators among
others, cleaning companies and solid waste collectors. This exercise aimed at equipping
themwiththebasicknowledgeofhowtopreparefinancialreportsnormallysubmittedto
RURA.
In Transport Sector, RURA in colaboration with RDB, City of Kigali and RNP conducted
trainingto1,166PublictransportoperatorsonCustomercareandservicedelivery,trafic&
road safety.
TABLE 1: STRATEGIC AREA OF TRAINING
Type of Training NumberofBeneficiariesShort term training 35Study tours and Attachments 7
10 RURA ANNUAL REPORT 2014 - 2015
On the side of internship, thirty-six (36)
students from different higher institutions
of learning were provided with internship
opportunities up to 6 months.
At the National and International level,
RURA hosted “L’Autorité de régulation des
communications électroniques et de la
poste (ARCEP)” of Bénin and Nyakinama
Military Peace Academy in the framework
of sharing knowledge and experience with
regards to the regulated sectors.
2.4. CONSUMER EMPOWERMENT
As part of RURA responsibility during the
year under review, the Authority put more
effort on empowering consumers through
consumer awareness programs.
For the purpose of Consumer Empowerment,
RURA organized consumer awareness
programs including TV/Radio emissions,
consumer forums, production of brochures,
messages on banners, and other radio/TV
communiqués.
In this line, RURA conducted workshops in
Rusizi, Huye and Karongi districts’ secondary
schools on RURA mandate, consumer rights
& obligations and complaints handling
procedures. In addition, the same workshops
were organized for ADECOR members in
Karongi and Huye Districts.
On the other hand, due to a big number
of complaints received on mobile money
theft, RURA educated consumers on how to
take appropriate prevention and reporting
measures. The consumer education was
done through live TV/radio talk show, radio
emissions, brochures and display messages
on banners as well as on the Authority’s
website.
Furthermore, RURA organized a consumer
forum, which brought together the City of
Kigali and its districts, as well as consumer
representatives and operators in sanitation
sector. The main purpose of the mentioned
forum was to improve the quality of service,
reduce consumer complaints and enforce
compliance of consistency of Service
Providers with regards to the collection and
transportation of solid waste.
2.5. REGIONAL AND INTERNATIONAL PARTNERSHIP
During the fiscal year under review, RURA
continued to play an active role in Regional
and International level and witnessed
viable relationship and partnership with
many regional and international bodies.
These include EACO, EREA, RAERESA, CTO,
ESAWAS, ICANN and ITU.
The authority also continued to enjoy
the strong working relationship with sister
regulators such as UCC, EWURA, TCRA, CA,
ERC, ARCT - Burundi, ESAWAS and ERA.
RURA represented Rwanda in all EACO
and EREA activities to harmonize the legal
and regulatory framework in East African
Member States.
RURA continued to represent Rwanda in all
ITU activities including ITU Telecom World
2014, Study Groups, Council Working Groups,
Radio Communication Advisory Group, WSIS
Forum World Summit and was re-elected to
the ITU Council for the period 2014 – 2018.
11RURA ANNUAL REPORT 2014 - 2015
2.6. KEY EVENTS AND CORPORATE SOCIAL RESPONSIBILITY
During the Financial year under review,
RURA continued its Corporate Social
Responsibility actions to Rukumberi Sector,
Ngoma District by building two houses for
Genocide Survivors. This took place during
commemoration of the 21st anniversary of
Genocide perpetrated against Tutsi and the
above mentioned houses would be handed
over by December,2015.
During the same year, RURA continued
to put in place efficient mechanism of
security system. It is in this regards that RURA
organised and conducted inhouse training
to give basic skills about the workplace
safety and health practices, and the various
ways to follow them. RURA staff gained
the basic knowledge on how to respond
quicklytoaccidents,tofirealarms,tousefire
extinguishers, and to apply other measures
toextinguish fire. Theacquired knowledge
would be helpful in implementation of safer
and healthier practices at workplace.
In addition to that, RURA enhanced security
issues within and outside RURA premises, this
includes installation of security equipment
and acquisition of adequate car parking for
both RURA staff and its visitors.
On 1 May 2015, RURA like other institutions
joined the world and National in celebrating
Labour Day. This year’s celebrations
centred mainly on promoting the culture of
professionalism and identifying successful
entrepreneurs who can serve as models
for other Rwandans. This was a great
opportunity for employer and employees to
discussthewaysofenhancingefficiencyin
their day to day tasks. Other topics discussed
includes; improving professionalism, hard
work, effective service delivery to the public.
2.7. FINANCIAL PERFORMANCE
The review shows the level of performance
in terms of collected revenues and how it
was allocated to action plan 2014/2015. All
regulated sectors have generated revenues
in different ways and as per the projections
set. The figures shows that all sectors are
growing in terms of revenues generation
and they have increased compared to
previousfigures.
During the financial year 2014/2015, the
Authority collected a total amount of
(8,280,024,388 Frw) from various sources
including ICT Sector, Enery sector, Transport
sector and other revenues received from
penalities charged in different sectors and
fees to acquire tender documents. The year
under review, RURA marked an increase of
its revenues by 23% compared to previous
fiscalyear.Theincreaseofrevenuewasdue
to the increase of the number of licenses
issued to operators in both ICT, Transport
and Energy Sectors.
On the expenditure side, the total amount
increased compared to the previous
financialyearby32%duetotheexpansion
of regulatory activities in all sectors
especially those related to the awareness
campaigns, sensitization of operators and
enforcemment of regulations.
Regarding the Universal Access Fund
(UAF), an amount of 3,759,457,874 Rwf was
collected from annual contribution by
Telecom Operators representing an increase
of36%comparedtopreviousfinancialyear.
On expenditure side, the total expenditure
12 RURA ANNUAL REPORT 2014 - 2015
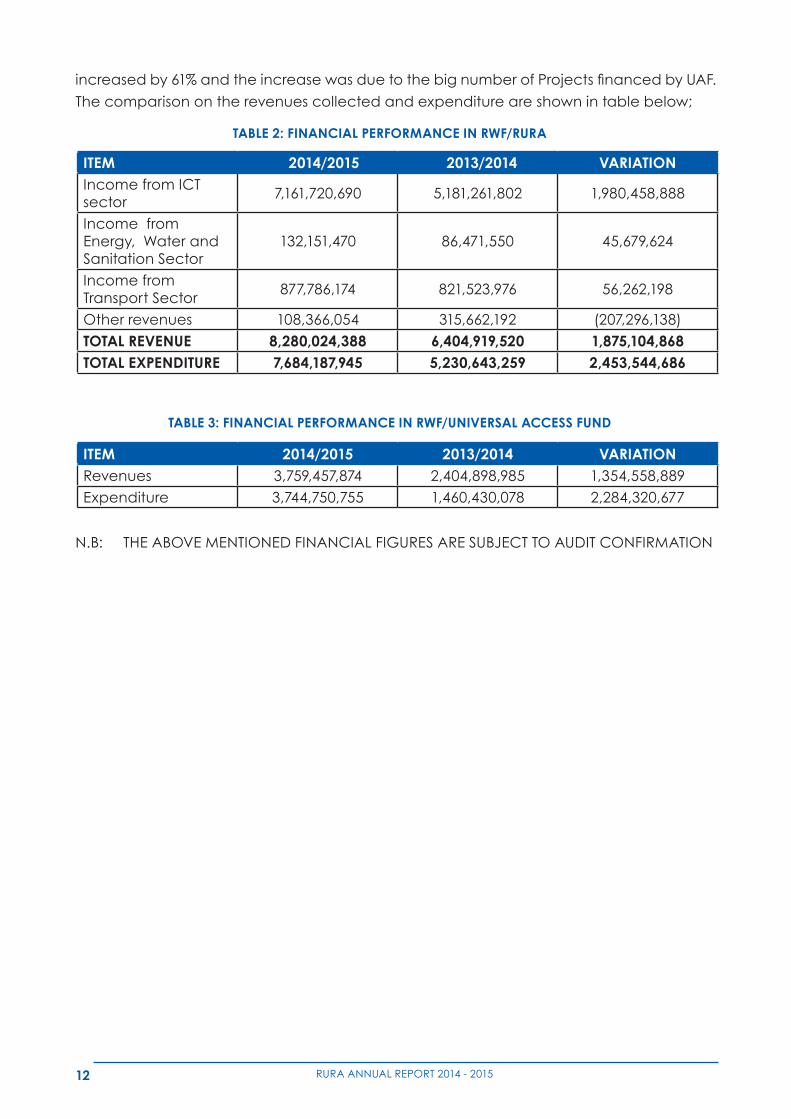
increasedby61%andtheincreasewasduetothebignumberofProjectsfinancedbyUAF.
The comparison on the revenues collected and expenditure are shown in table below;
TABLE 2: FINANCIAL PERFORMANCE IN RWF/RURA
ITEM 2014/2015 2013/2014 VARIATIONIncome from ICT sector
7,161,720,690 5,181,261,802 1,980,458,888
Income from Energy, Water and Sanitation Sector
132,151,470 86,471,550 45,679,624
Income from Transport Sector
877,786,174 821,523,976 56,262,198
Other revenues 108,366,054 315,662,192 (207,296,138)TOTAL REVENUE 8,280,024,388 6,404,919,520 1,875,104,868TOTAL EXPENDITURE 7,684,187,945 5,230,643,259 2,453,544,686
TABLE 3: FINANCIAL PERFORMANCE IN RWF/UNIVERSAL ACCESS FUND
ITEM 2014/2015 2013/2014 VARIATIONRevenues 3,759,457,874 2,404,898,985 1,354,558,889Expenditure 3,744,750,755 1,460,430,078 2,284,320,677
N.B: THE ABOVE MENTIONED FINANCIAL FIGURES ARE SUBJECT TO AUDIT CONFIRMATION
13RURA ANNUAL REPORT 2014 - 2015
ICT SECTOR
14 RURA ANNUAL REPORT 2014 - 2015
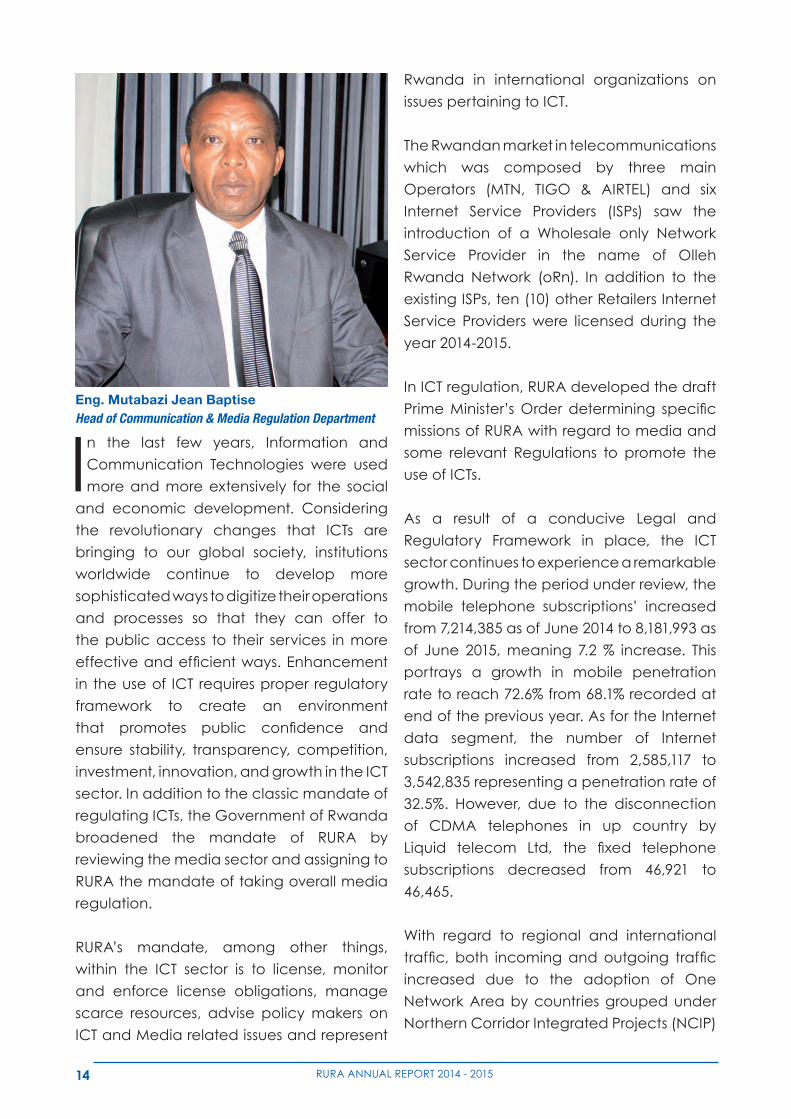
In the last few years, Information and
Communication Technologies were used
more and more extensively for the social
and economic development. Considering
the revolutionary changes that ICTs are
bringing to our global society, institutions
worldwide continue to develop more
sophisticated ways to digitize their operations
and processes so that they can offer to
the public access to their services in more
effectiveandefficientways.Enhancement
in the use of ICT requires proper regulatory
framework to create an environment
that promotes public confidence and
ensure stability, transparency, competition,
investment, innovation, and growth in the ICT
sector. In addition to the classic mandate of
regulating ICTs, the Government of Rwanda
broadened the mandate of RURA by
reviewing the media sector and assigning to
RURA the mandate of taking overall media
regulation.
RURA’s mandate, among other things,
within the ICT sector is to license, monitor
and enforce license obligations, manage
scarce resources, advise policy makers on
ICT and Media related issues and represent
Rwanda in international organizations on
issues pertaining to ICT.
The Rwandan market in telecommunications
which was composed by three main
Operators (MTN, TIGO & AIRTEL) and six
Internet Service Providers (ISPs) saw the
introduction of a Wholesale only Network
Service Provider in the name of Olleh
Rwanda Network (oRn). In addition to the
existing ISPs, ten (10) other Retailers Internet
Service Providers were licensed during the
year 2014-2015.
In ICT regulation, RURA developed the draft
PrimeMinister’sOrderdetermining specific
missions of RURA with regard to media and
some relevant Regulations to promote the
use of ICTs.
As a result of a conducive Legal and
Regulatory Framework in place, the ICT
sector continues to experience a remarkable
growth. During the period under review, the
mobile telephone subscriptions’ increased
from 7,214,385 as of June 2014 to 8,181,993 as
of June 2015, meaning 7.2 % increase. This
portrays a growth in mobile penetration
rate to reach 72.6% from 68.1% recorded at
end of the previous year. As for the Internet
data segment, the number of Internet
subscriptions increased from 2,585,117 to
3,542,835 representing a penetration rate of
32.5%. However, due to the disconnection
of CDMA telephones in up country by
Liquid telecom Ltd, the fixed telephone
subscriptions decreased from 46,921 to
46,465.
With regard to regional and international
traffic, both incomingandoutgoing traffic
increased due to the adoption of One
Network Area by countries grouped under
Northern Corridor Integrated Projects (NCIP)
Eng. Mutabazi Jean BaptiseHead of Communication & Media Regulation Department
15RURA ANNUAL REPORT 2014 - 2015
whileatthesametimethetariffsignificantly
decreased due to the elimination of
surchargesonregionaltraffic.
Following the deadline of 17th June 2015
set by ITU, for migration of Analogue TV
Transmission to Digital Broadcasting, the
Government of Rwanda decided to
digitalize the whole Rwanda broadcasting
Network.Duringthefiscalyearunderreview,
the 3 remaining analogue transmitters were
switched off on 31st of July, 2014.
Subsequent to the airing of the BBC
Documentary entitled “The Rwanda Untold
Story”,RURAdecidedtoindefinitelysuspend
the Kinyarwanda programme of BBC on the
FM frequency in Rwanda.
3.1. LEGAL AND REGULATORY FRAMEWORK
During the period under review, RURA put
in place regulatory instruments so as to
promote the use of ICTs as follows;
•Draft Prime Minister Order determining
specificmissionofRURAinregardtomedia
as per provided by article 5 of RURA Law.
•RegulationsgoverningPostalandCourier
Services in Rwanda.
•BoardDecisiondeterminingtheRegulatory
Fees for Retailer Internet Service Providers.
•Board Decision repealing the Board
Decision N° 05/2007 of 18th July
2007 determining Fees for Satellite
Communications Licenses.
3.2. LICENSING
3.2.1. TELECOMMUNICATION AND INTERNET SERVICE PROVISION
Further to the licensing of the Wholesale
Network Service Provider in the course of
the previous fiscal year, RURA licensed 10
Retailer Internet Service Providers in addition
to existing Telecom Operators/ ISPs, during
thefiscalyear2014-2015.Inaddition,RURA
licensed a new Network Facility Provider
entitled “Fibernet Telecom Ltd” while “IHS
Ltd” acquired “Rwanda Tower Ltd”.
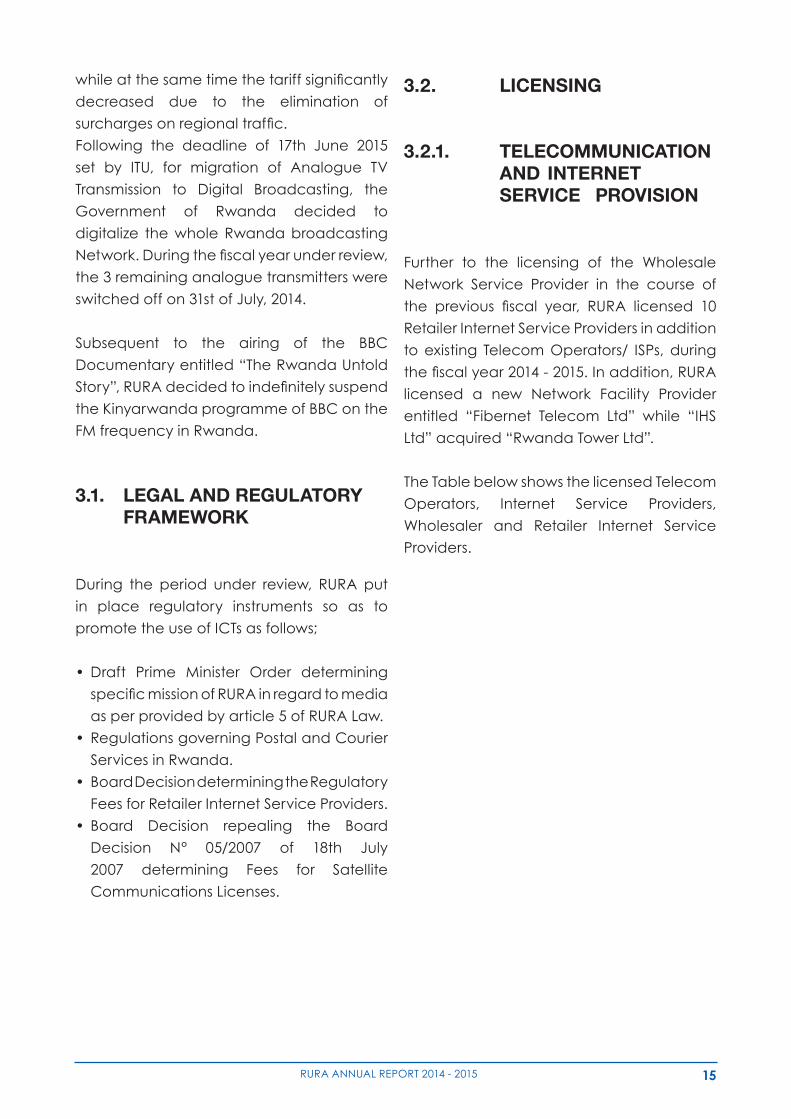
The Table below shows the licensed Telecom
Operators, Internet Service Providers,
Wholesaler and Retailer Internet Service
Providers.
16 RURA ANNUAL REPORT 2014 - 2015
TABLE 4: LICENSED NETWORK AND SERVICE PROVIDERS AS OF JUNE 2015
Operators Licensed From (Year)MTN Rwanda Ltd 2006TIGO Rwanda Ltd 2008AIRTEL Rwanda Ltd 2011Liquid Telecom Ltd 2014New Artel Ltd 2004ISPA Ltd 20064G NETWORKS Ltd 2009BSC Ltd 2010AXIOM 2014
Wholesale Network Service ProviderOlleh Rwanda Network (ORN) 2013Retailer Internet Service ProvidersGMAX 2014Intercom Technologies 2014Telecom Network Solution Provider 20144NetAfrica Ltd 2014Piramie Inc 2014Twinning in Corporation 2015Simba Supermarket 2015TRUCONNECT LTD 2015POPCONN LTD 2015SUKU NSA LTD 2015
Network Facility ProvidersIHS Rwanda Ltd 2014Fibernet Telecom Ltd 2015
3.2.2. BROADCASTING
3.2.2.1. TV BROADCASTING
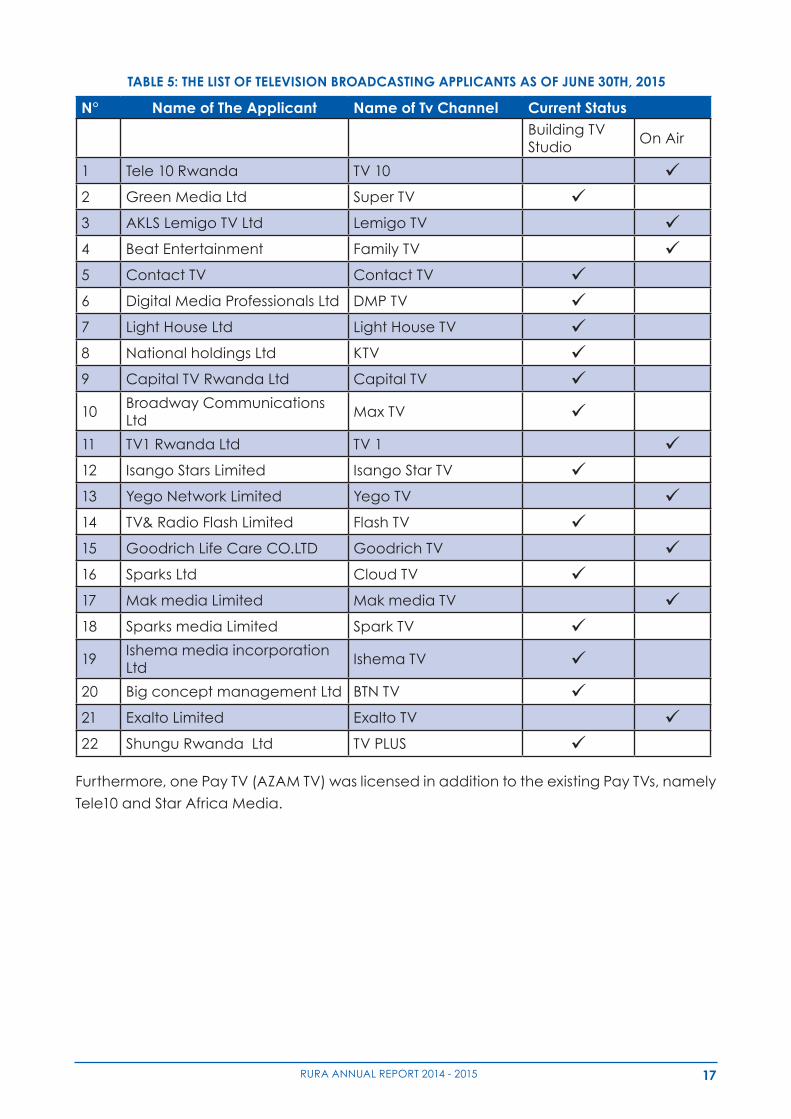
During the year under review, RURA received twelve (12) applications for television
broadcasting whereas 10 were received in the previous year. So far, seven (7) local television
channels are now on air. Below is the status of the received TV Broadcasting applications
as of June 2015:
17RURA ANNUAL REPORT 2014 - 2015
TABLE 5: THE LIST OF TELEVISION BROADCASTING APPLICANTS AS OF JUNE 30TH, 2015
N° Name of The Applicant Name of Tv Channel Current StatusBuilding TV Studio
On Air
1 Tele 10 Rwanda TV 10 2 Green Media Ltd Super TV 3 AKLS Lemigo TV Ltd Lemigo TV 4 Beat Entertainment Family TV 5 Contact TV Contact TV 6 Digital Media Professionals Ltd DMP TV 7 Light House Ltd Light House TV 8 National holdings Ltd KTV 9 Capital TV Rwanda Ltd Capital TV
10Broadway Communications Ltd
Max TV
11 TV1 Rwanda Ltd TV 1 12 Isango Stars Limited Isango Star TV 13 Yego Network Limited Yego TV 14 TV& Radio Flash Limited Flash TV 15 Goodrich Life Care CO.LTD Goodrich TV 16 Sparks Ltd Cloud TV 17 Mak media Limited Mak media TV 18 Sparks media Limited Spark TV
19Ishema media incorporation Ltd
Ishema TV
20 Big concept management Ltd BTN TV 21 Exalto Limited Exalto TV 22 Shungu Rwanda Ltd TV PLUS
Furthermore, one Pay TV (AZAM TV) was licensed in addition to the existing Pay TVs, namely
Tele10 and Star Africa Media.
18 RURA ANNUAL REPORT 2014 - 2015
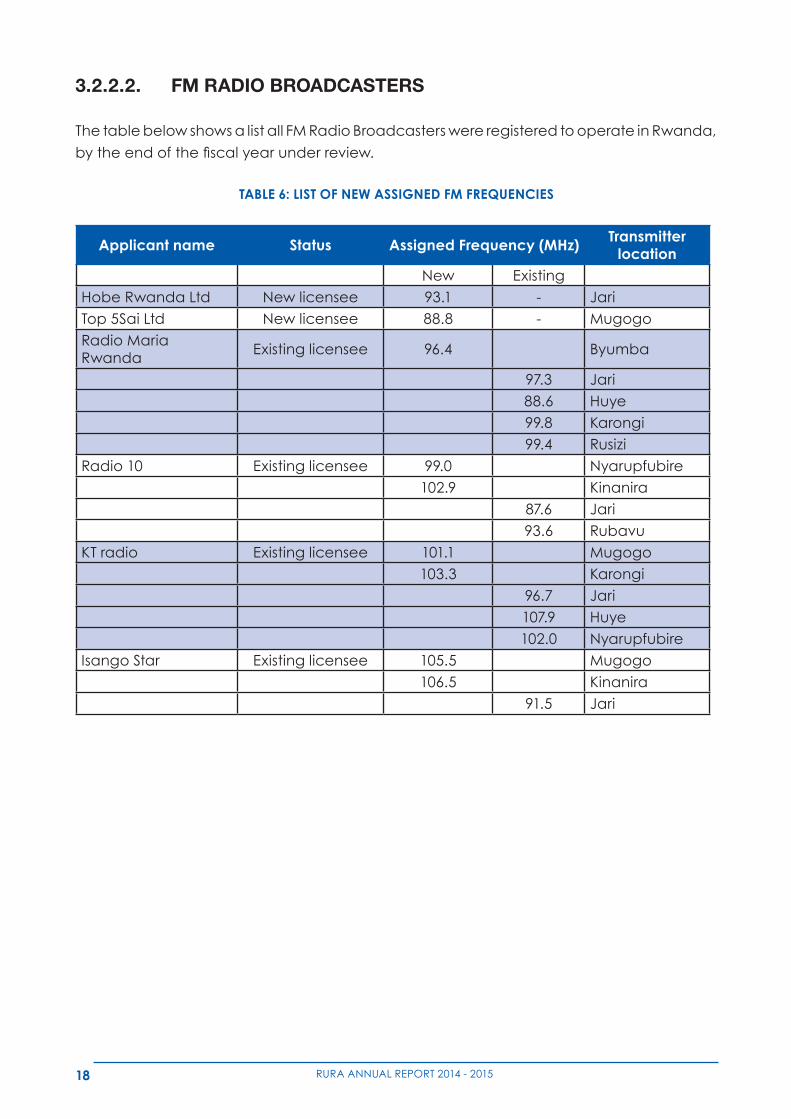
3.2.2.2. FM RADIO BROADCASTERS
The table below shows a list all FM Radio Broadcasters were registered to operate in Rwanda,
bytheendofthefiscalyearunderreview.
TABLE 6: LIST OF NEW ASSIGNED FM FREQUENCIES
Applicant name Status Assigned Frequency (MHz) Transmitter location
New ExistingHobe Rwanda Ltd New licensee 93.1 - Jari Top 5Sai Ltd New licensee 88.8 - MugogoRadio Maria Rwanda
Existing licensee 96.4 Byumba
97.3 Jari88.6 Huye99.8 Karongi99.4 Rusizi
Radio 10 Existing licensee 99.0 Nyarupfubire102.9 Kinanira
87.6 Jari93.6 Rubavu
KT radio Existing licensee 101.1 Mugogo103.3 Karongi
96.7 Jari107.9 Huye102.0 Nyarupfubire
Isango Star Existing licensee 105.5 Mugogo106.5 Kinanira
91.5 Jari
19RURA ANNUAL REPORT 2014 - 2015
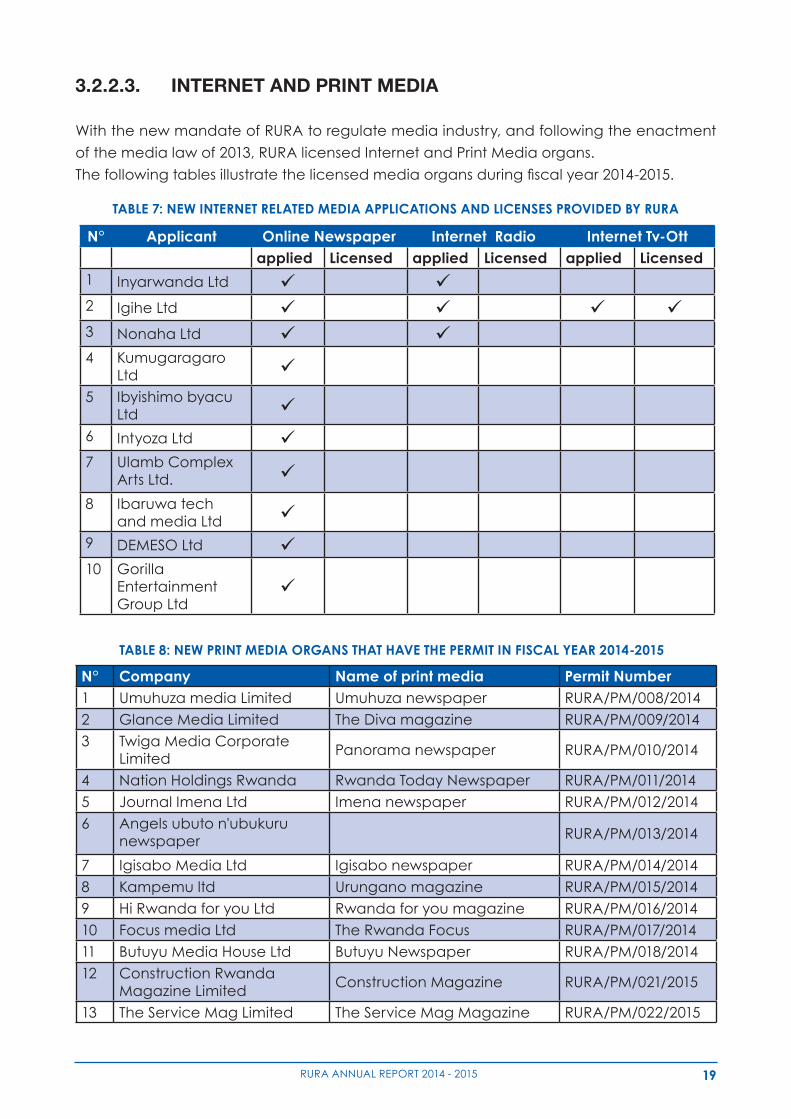
3.2.2.3. INTERNET AND PRINT MEDIA
With the new mandate of RURA to regulate media industry, and following the enactment
of the media law of 2013, RURA licensed Internet and Print Media organs.
Thefollowingtablesillustratethelicensedmediaorgansduringfiscalyear2014-2015.
TABLE 7: NEW INTERNET RELATED MEDIA APPLICATIONS AND LICENSES PROVIDED BY RURA
N° Applicant Online Newspaper Internet Radio Internet Tv-Ottapplied Licensed applied Licensed applied Licensed
1 Inyarwanda Ltd 2 Igihe Ltd 3 Nonaha Ltd 4 Kumugaragaro
Ltd
5 Ibyishimo byacu Ltd
6 Intyoza Ltd 7 Ulamb Complex
Arts Ltd.
8 Ibaruwa tech and media Ltd
9 DEMESO Ltd 10 Gorilla
Entertainment Group Ltd
TABLE 8: NEW PRINT MEDIA ORGANS THAT HAVE THE PERMIT IN FISCAL YEAR 2014-2015
N° Company Name of print media Permit Number1 Umuhuza media Limited Umuhuza newspaper RURA/PM/008/20142 Glance Media Limited The Diva magazine RURA/PM/009/20143 Twiga Media Corporate
LimitedPanorama newspaper RURA/PM/010/2014
4 Nation Holdings Rwanda Rwanda Today Newspaper RURA/PM/011/20145 Journal Imena Ltd Imena newspaper RURA/PM/012/20146 Angels ubuto n'ubukuru
newspaper RURA/PM/013/2014
7 Igisabo Media Ltd Igisabo newspaper RURA/PM/014/20148 Kampemu ltd Urungano magazine RURA/PM/015/20149 Hi Rwanda for you Ltd Rwanda for you magazine RURA/PM/016/201410 Focus media Ltd The Rwanda Focus RURA/PM/017/201411 Butuyu Media House Ltd Butuyu Newspaper RURA/PM/018/201412 Construction Rwanda
Magazine LimitedConstruction Magazine RURA/PM/021/2015
13 The Service Mag Limited The Service Mag Magazine RURA/PM/022/2015
20 RURA ANNUAL REPORT 2014 - 2015
3.3. MARKET PERFORMANCE AND STATISTICS
The period under review experienced
a remarkable growth in terms of mobile
telephone subscriptions’ from 7,214,385 as
of June 2014 to 8,181,993 as of June 2015
meaning 7.2 % increase. This portrays a
growth in mobile penetration rate to reach
72.6% from 68.1% recorded at end of the
previous year.
Fixed telephone subscriptions in the year
under review were found to be 46,465 as of
June 2015 from 46,921 as of June 2014. This
decrease in fixed telephone subscribers
is attributed to CDMA telephones in up
country disconnected by Liquid Telecom
Ltd.
As for the internet data segment, the
number of internet subscriptions increased
from 2,585,117 as of June 2014 to 3,542,835
as of June 2015 representing a penetration
rate of 31.5% demonstrating a 37% increase
as compared to the previous fiscal year.
This increase is mainly brought about by the
widespread use of mobile internet.
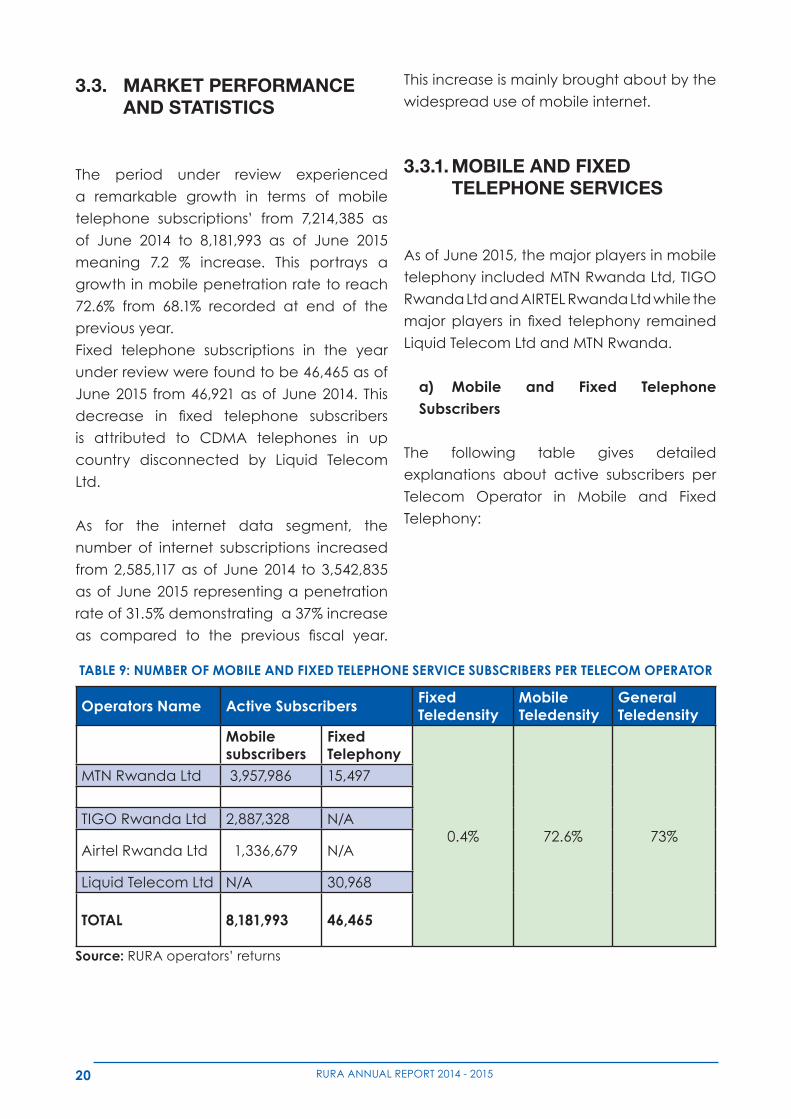
3.3.1. MOBILE AND FIXED TELEPHONE SERVICES
As of June 2015, the major players in mobile
telephony included MTN Rwanda Ltd, TIGO
Rwanda Ltd and AIRTEL Rwanda Ltd while the
major players in fixed telephony remained
Liquid Telecom Ltd and MTN Rwanda.
a) Mobile and Fixed Telephone Subscribers
The following table gives detailed
explanations about active subscribers per
Telecom Operator in Mobile and Fixed
Telephony:
TABLE 9: NUMBER OF MOBILE AND FIXED TELEPHONE SERVICE SUBSCRIBERS PER TELECOM OPERATOR
Operators Name Active Subscribers Fixed Teledensity
Mobile Teledensity
General Teledensity
Mobile subscribers
Fixed Telephony
0.4% 72.6% 73%
MTN Rwanda Ltd 3,957,986 15,497
TIGO Rwanda Ltd 2,887,328 N/A
Airtel Rwanda Ltd 1,336,679 N/A
Liquid Telecom Ltd N/A 30,968
TOTAL 8,181,993 46,465
Source: RURA operators’ returns
21RURA ANNUAL REPORT 2014 - 2015
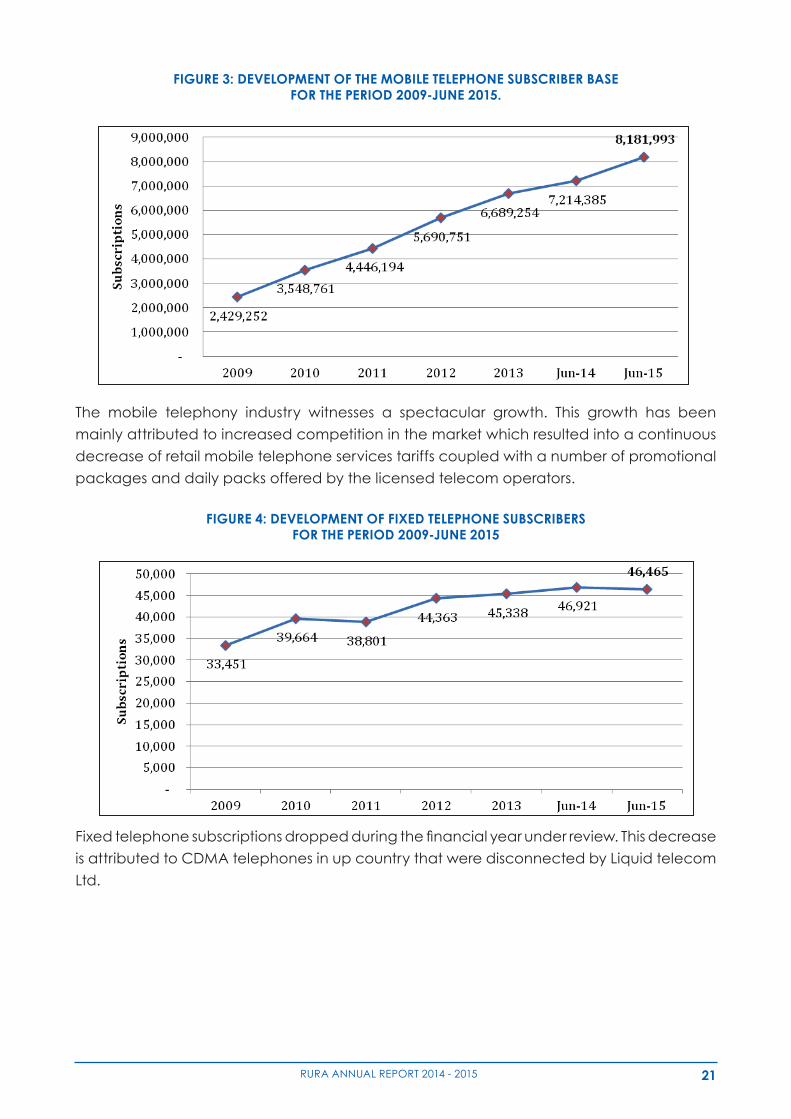
FIGURE 3: DEVELOPMENT OF THE MOBILE TELEPHONE SUBSCRIBER BASE FOR THE PERIOD 2009-JUNE 2015.
The following table gives detailed explanations about active subscribers per Telecom Operator in
Mobile and Fixed Telephony:
Table 9: Number of Mobile and Fixed Telephone Service Subscribers per Telecom Operator
Operators Name Active Subscribers Fixed
Teledensity
Mobile
Teledensity
General
Teledensity
Mobile subscribers
Fixed Telephony
MTN Rwanda Ltd
3,957,986
15,497
TIGO Rwanda Ltd
2,887,328
N/A
Airtel Rwanda Ltd
1,336,679
N/A
Liquid Telecom
Ltd
N/A 30,968
Total 8,181,993 46,465
0.4%
72.6%
73%
Source: RURA operators’ return
Figure 3: Development of the Mobile Telephone Subscriber Base for the Period 2009-June 2015.
The mobile telephony industry witnesses a spectacular growth. This growth has been mainly
attributed to increased competition in the market which resulted into a continuous decrease of
The mobile telephony industry witnesses a spectacular growth. This growth has been
mainly attributed to increased competition in the market which resulted into a continuous
decrease of retail mobile telephone services tariffs coupled with a number of promotional
packages and daily packs offered by the licensed telecom operators.retail mobile telephone services tariffs coupled with a number of promotional packages and daily
packs offered by the licensed telecom operators.
Figure 4: Development of fixed telephone subscribers for the period 2009-June 2015
Fixed telephone subscriptions dropped during the financial year under review. This decrease is
attributed to CDMA telephones in up country that were disconnected by Liquid telecom Ltd.
Figure 5: Evolution of Mobile Telephone Subscribers Market Share per Operator
FIGURE 4: DEVELOPMENT OF FIXED TELEPHONE SUBSCRIBERSFOR THE PERIOD 2009-JUNE 2015
Fixedtelephonesubscriptionsdroppedduringthefinancialyearunderreview.Thisdecrease
is attributed to CDMA telephones in up country that were disconnected by Liquid telecom
Ltd.
22 RURA ANNUAL REPORT 2014 - 2015
retail mobile telephone services tariffs coupled with a number of promotional packages and daily
packs offered by the licensed telecom operators.
Figure 4: Development of fixed telephone subscribers for the period 2009-June 2015
Fixed telephone subscriptions dropped during the financial year under review. This decrease is
attributed to CDMA telephones in up country that were disconnected by Liquid telecom Ltd.
Figure 5: Evolution of Mobile Telephone Subscribers Market Share per Operator
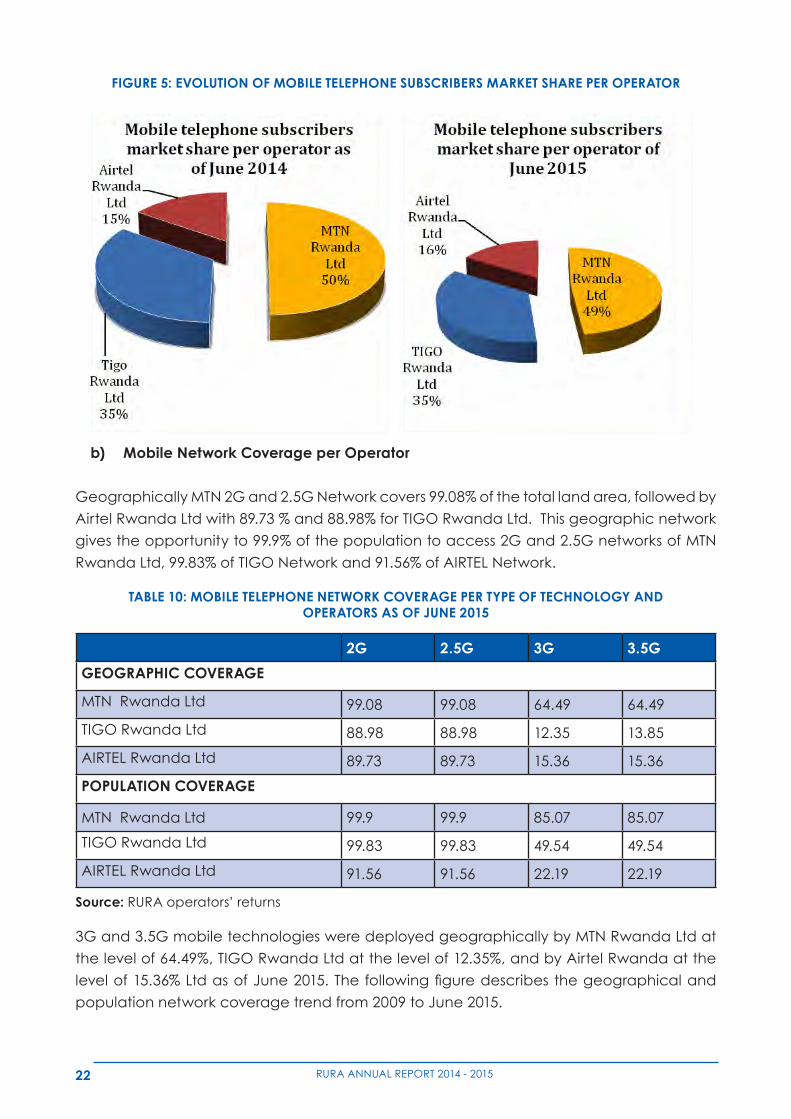
FIGURE 5: EVOLUTION OF MOBILE TELEPHONE SUBSCRIBERS MARKET SHARE PER OPERATOR
b) Mobile Network Coverage per Operator
Geographically MTN 2G and 2.5G Network covers 99.08% of the total land area, followed by
Airtel Rwanda Ltd with 89.73 % and 88.98% for TIGO Rwanda Ltd. This geographic network
gives the opportunity to 99.9% of the population to access 2G and 2.5G networks of MTN
Rwanda Ltd, 99.83% of TIGO Network and 91.56% of AIRTEL Network.
TABLE 10: MOBILE TELEPHONE NETWORK COVERAGE PER TYPE OF TECHNOLOGY AND OPERATORS AS OF JUNE 2015
2G 2.5G 3G 3.5G
GEOGRAPHIC COVERAGE
MTN Rwanda Ltd 99.08 99.08 64.49 64.49
TIGO Rwanda Ltd 88.98 88.98 12.35 13.85
AIRTEL Rwanda Ltd 89.73 89.73 15.36 15.36
POPULATION COVERAGE
MTN Rwanda Ltd 99.9 99.9 85.07 85.07
TIGO Rwanda Ltd 99.83 99.83 49.54 49.54
AIRTEL Rwanda Ltd 91.56 91.56 22.19 22.19
Source: RURA operators’ returns
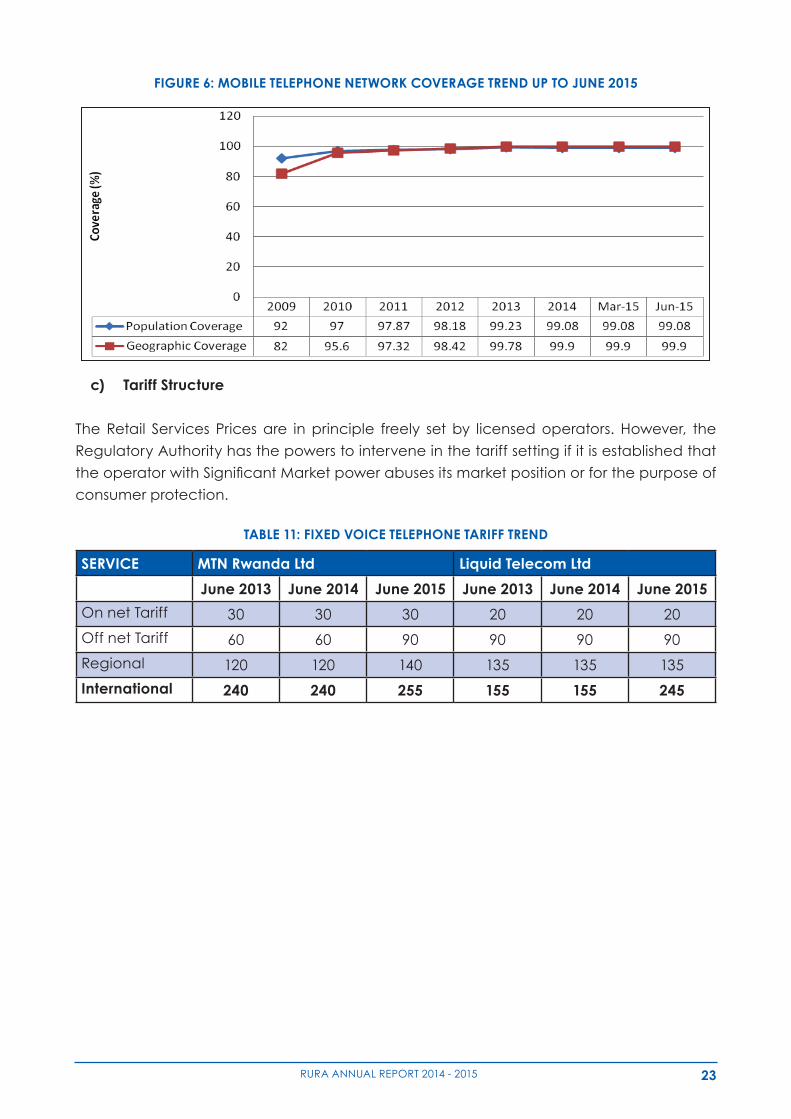
3G and 3.5G mobile technologies were deployed geographically by MTN Rwanda Ltd at
the level of 64.49%, TIGO Rwanda Ltd at the level of 12.35%, and by Airtel Rwanda at the
levelof15.36%LtdasofJune2015.Thefollowingfiguredescribesthegeographicaland
population network coverage trend from 2009 to June 2015.
23RURA ANNUAL REPORT 2014 - 2015
FIGURE 6: MOBILE TELEPHONE NETWORK COVERAGE TREND UP TO JUNE 2015
Figure 6: Mobile telephone network coverage trend up to June 2015
MTN TIGO AIRTEL SERVICE
June
2013
June
2014
June
2015
June
2013
June
2014
June
2015
June
2013
June
2014
June
2015
On Net Tariff
Pre-paid 45 36 46 30 25 34 27 20 28
Post-paid 30 30
Off Net Tariff
Pre-paid 60 60 60 60 60 60 60 60 62
Post-paid 50 60 60 60 60 60 60 60 62
Regional and International Tariff
Kenya 120 120 60 135 165 68 120 120 59
Uganda 216 120 60 135 165 60 120 120 59
Burundi 216 120 158 165 165 165 - 165 169
Rest of Africa
Tariff Group A
165 165 158 165 165 165 - 165 169
Rest of Africa
Tariff Group B
390 165 158 165 165 165 - 165 169
USA /Canada
/China /India /
Belgium
49.8 49.8 51 45 40 40 32 35 29
c) Tariff Structure
The Retail Services Prices are in principle freely set by licensed operators. However, the
Regulatory Authority has the powers to intervene in the tariff setting if it is established that
theoperatorwithSignificantMarketpowerabusesitsmarketpositionorforthepurposeof
consumer protection.
TABLE 11: FIXED VOICE TELEPHONE TARIFF TREND
SERVICE MTN Rwanda Ltd Liquid Telecom Ltd
June 2013 June 2014 June 2015 June 2013 June 2014 June 2015
On net Tariff 30 30 30 20 20 20
Off net Tariff 60 60 90 90 90 90
Regional 120 120 140 135 135 135
International 240 240 255 155 155 245
24 RURA ANNUAL REPORT 2014 - 2015
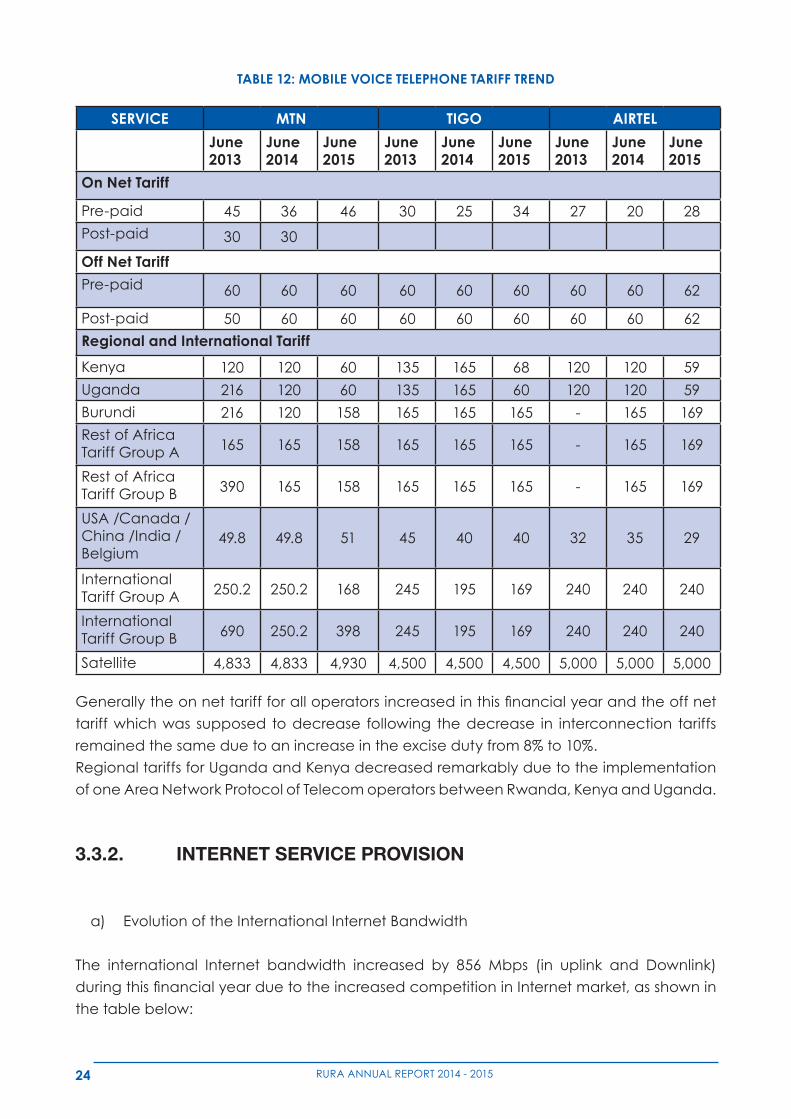
Generallytheonnettariffforalloperatorsincreasedinthisfinancialyearandtheoffnet
tariff which was supposed to decrease following the decrease in interconnection tariffs
remained the same due to an increase in the excise duty from 8% to 10%.
Regional tariffs for Uganda and Kenya decreased remarkably due to the implementation
of one Area Network Protocol of Telecom operators between Rwanda, Kenya and Uganda.
3.3.2. INTERNET SERVICE PROVISION
a) Evolution of the International Internet Bandwidth
The international Internet bandwidth increased by 856 Mbps (in uplink and Downlink)
duringthisfinancialyearduetotheincreasedcompetitioninInternetmarket,asshownin
the table below:
TABLE 12: MOBILE VOICE TELEPHONE TARIFF TREND
SERVICE MTN TIGO AIRTEL
June 2013
June 2014
June 2015
June 2013
June 2014
June 2015
June 2013
June 2014
June 2015
On Net Tariff
Pre-paid 45 36 46 30 25 34 27 20 28
Post-paid 30 30
Off Net Tariff
Pre-paid 60 60 60 60 60 60 60 60 62
Post-paid 50 60 60 60 60 60 60 60 62
Regional and International Tariff
Kenya 120 120 60 135 165 68 120 120 59
Uganda 216 120 60 135 165 60 120 120 59
Burundi 216 120 158 165 165 165 - 165 169
Rest of Africa Tariff Group A 165 165 158 165 165 165 - 165 169
Rest of Africa Tariff Group B 390 165 158 165 165 165 - 165 169
USA /Canada /China /India / Belgium
49.8 49.8 51 45 40 40 32 35 29
International Tariff Group A 250.2 250.2 168 245 195 169 240 240 240
International Tariff Group B 690 250.2 398 245 195 169 240 240 240
Satellite 4,833 4,833 4,930 4,500 4,500 4,500 5,000 5,000 5,000
25RURA ANNUAL REPORT 2014 - 2015
TABLE 13: INTERNATIONAL INTERNET BANDWIDTH IN MBPS
International Internet bandwidth (Mbps) Jun-12 Jun-13 Jun-14 June-15
Up link 2024 4,054 5,111 5,967
Down link 2140 4,056 5,111 5,967
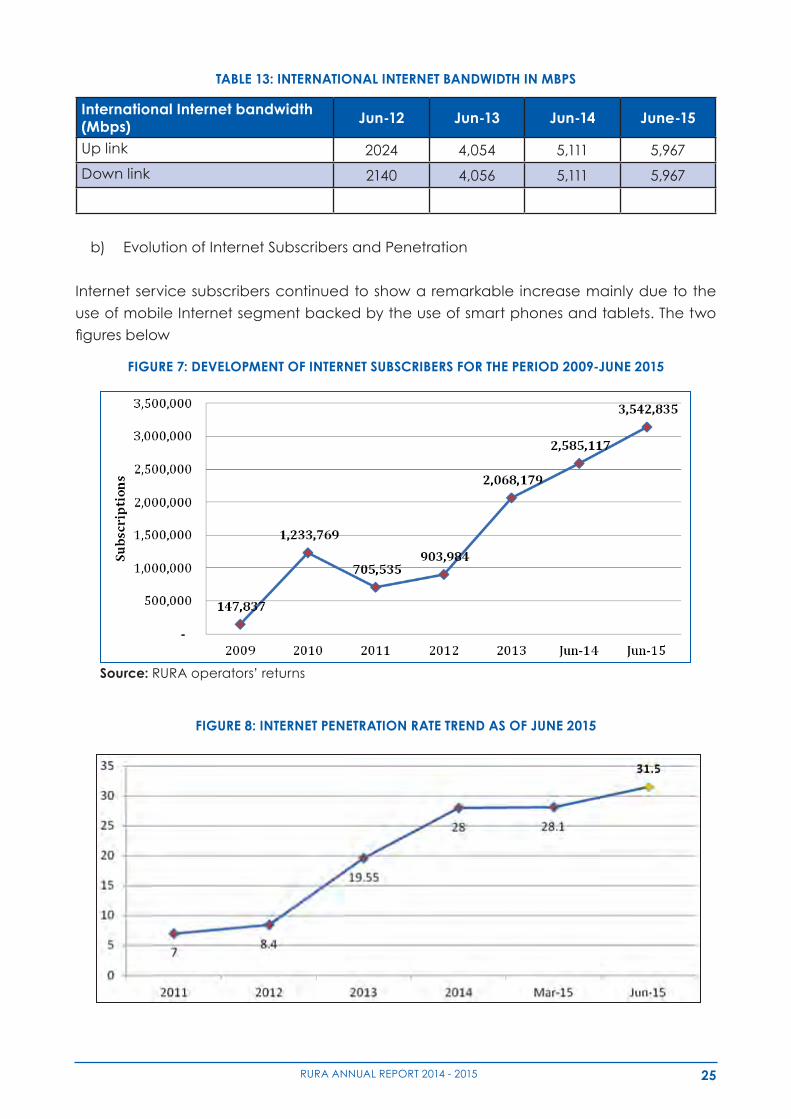
b) Evolution of Internet Subscribers and Penetration
Internet service subscribers continued to show a remarkable increase mainly due to the
use of mobile Internet segment backed by the use of smart phones and tablets. The two
figuresbelow
FIGURE 7: DEVELOPMENT OF INTERNET SUBSCRIBERS FOR THE PERIOD 2009-JUNE 2015
a) Evolution of the International Internet Bandwidth
The international Internet bandwidth increased by 856 Mbps (in uplink and Downlink) during
this financial year due to the increased competition in Internet market, as shown in the table
below:
Table 13: International Internet bandwidth in Mbps
International Internet bandwidth (Mbps) Jun-12 Jun-13 Jun-14 June-2015
Up link 2024 4,054 5,111 5,967
Down link 2140 4,056 5,111 5,967
b) Evolution of Internet Subscribers and Penetration
Internet service subscribers continued to show a remarkable increase mainly due to the use of
mobile Internet segment backed by the use of smart phones and tablets. The two figures below
indicate the evolution of both total Internet Subscribers and Internet penetration up to June 2015:
Figure 7: Development of Internet subscribers for the period 2009-June 2015
Source: RURA operators’ returns
Source: RURA operators’ returns
FIGURE 8: INTERNET PENETRATION RATE TREND AS OF JUNE 2015
Figure 8: Internet penetration rate trend as of June 2015
The two tables below illustrate the breakdown of both Internet subscribers and Smart Devices’
Users per Operator.
Table 14: Internet subscribers per category per operator as of June 2015
Source: RURA operators’ returns
Fixed internet ISPs
Narrowband
(≤256kbps)
Broadband (≥256kbps)
Mobile
Internet
Total internet
subscribers
Liquid Telecom Ltd 39 533 572
MTN Rwanda Ltd 372 18,162 1,490,117 1,508,651
TIGO Rwanda Ltd 102 1,505,786 1,505,888
New Artel Ltd 16 45 61
ISPA Ltd 37 95 132
4G Networks Ltd 45 45
BSC Ltd 1,463 1,463
Axiom Networks Ltd 89 89
Airtel Rwanda Ltd 14 525,920 525,934
Total 464 20,548 3,521,823 3,542,835
26 RURA ANNUAL REPORT 2014 - 2015
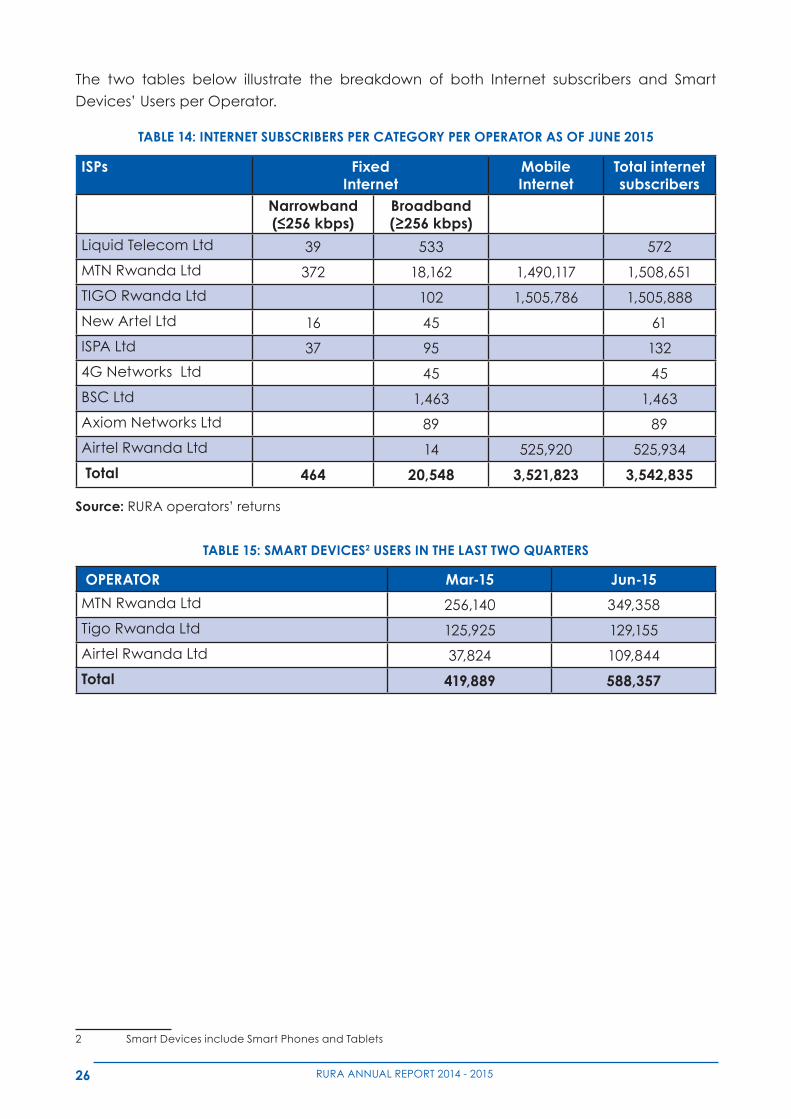
The two tables below illustrate the breakdown of both Internet subscribers and Smart
Devices’ Users per Operator.
TABLE 14: INTERNET SUBSCRIBERS PER CATEGORY PER OPERATOR AS OF JUNE 2015
ISPs Fixed Internet
Mobile Internet
Total internet subscribers
Narrowband (≤256kbps)
Broadband (≥256kbps)
Liquid Telecom Ltd 39 533 572
MTN Rwanda Ltd 372 18,162 1,490,117 1,508,651
TIGO Rwanda Ltd 102 1,505,786 1,505,888
New Artel Ltd 16 45 61
ISPA Ltd 37 95 132
4G Networks Ltd 45 45
BSC Ltd 1,463 1,463
Axiom Networks Ltd 89 89
Airtel Rwanda Ltd 14 525,920 525,934
Total 464 20,548 3,521,823 3,542,835
Source: RURA operators’ returns
TABLE 15: SMART DEVICES2 USERS IN THE LAST TWO QUARTERS
2 Smart Devices include Smart Phones and Tablets
OPERATOR Mar-15 Jun-15
MTN Rwanda Ltd 256,140 349,358
Tigo Rwanda Ltd 125,925 129,155
Airtel Rwanda Ltd 37,824 109,844
Total 419,889 588,357
27RURA ANNUAL REPORT 2014 - 2015
3.4. MANAGEMENT OF ICT RESOURCES
3.4.1. MANAGEMENT OF FREQUENCY SPECTRUM
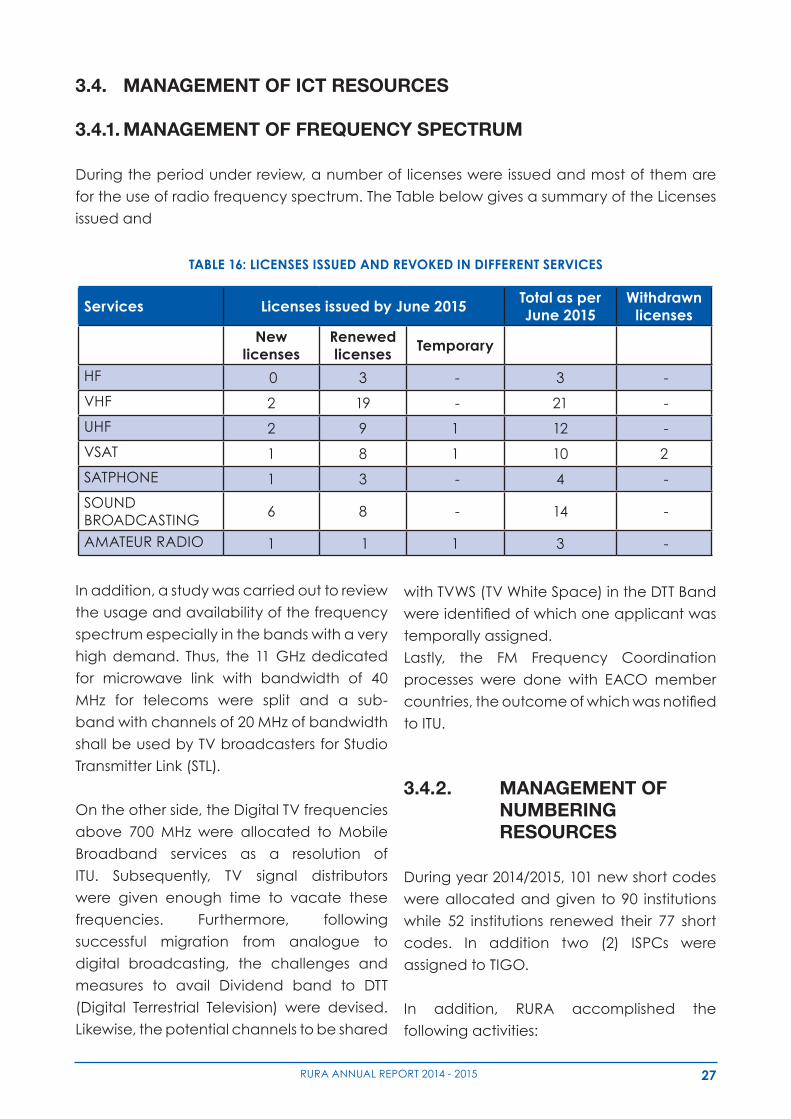
During the period under review, a number of licenses were issued and most of them are
for the use of radio frequency spectrum. The Table below gives a summary of the Licenses
issued and
TABLE 16: LICENSES ISSUED AND REVOKED IN DIFFERENT SERVICES
Services Licenses issued by June 2015 Total as per June 2015
Withdrawn licenses
New licenses
Renewed licenses Temporary
HF 0 3 - 3 -
VHF 2 19 - 21 -
UHF 2 9 1 12 -
VSAT 1 8 1 10 2
SATPHONE 1 3 - 4 -
SOUND BROADCASTING
6 8 - 14 -
AMATEUR RADIO 1 1 1 3 -
In addition, a study was carried out to review
the usage and availability of the frequency
spectrum especially in the bands with a very
high demand. Thus, the 11 GHz dedicated
for microwave link with bandwidth of 40
MHz for telecoms were split and a sub-
band with channels of 20 MHz of bandwidth
shall be used by TV broadcasters for Studio
Transmitter Link (STL).
On the other side, the Digital TV frequencies
above 700 MHz were allocated to Mobile
Broadband services as a resolution of
ITU. Subsequently, TV signal distributors
were given enough time to vacate these
frequencies. Furthermore, following
successful migration from analogue to
digital broadcasting, the challenges and
measures to avail Dividend band to DTT
(Digital Terrestrial Television) were devised.
Likewise, the potential channels to be shared
with TVWS (TV White Space) in the DTT Band
wereidentifiedofwhichoneapplicantwas
temporally assigned.
Lastly, the FM Frequency Coordination
processes were done with EACO member
countries,theoutcomeofwhichwasnotified
to ITU.
3.4.2. MANAGEMENT OF NUMBERING RESOURCES
During year 2014/2015, 101 new short codes
were allocated and given to 90 institutions
while 52 institutions renewed their 77 short
codes. In addition two (2) ISPCs were
assigned to TIGO.
In addition, RURA accomplished the
following activities:
28 RURA ANNUAL REPORT 2014 - 2015
a. Audit of the Usage of Telecom
Numbering Resources
During the period under review, RURA
conducted an audit on the usage of
Telecom Numbering Resources among
Mobile Telecom Operator’s in Rwanda to
ensure that theyareusedefficientlyand
to check compliance with the National
Numbering Plan.
b. Implementation of harmonized short
codes as recommended by the 2013
EACO congress
As recommended by 2013 EACO Congress,
member countries were requested to
harmonize Codes for Identified Services
in order to strengthen and promote
communication services in EAC Member
States. Therefore, RURA arranged the timely
implementation of harmonized codes, and
the following codes below were reserved
or/andconfigured for only those identified
services.
c. Cost Benefit Analysis on the
Implementation of Mobile Number
Portability
The Law No 44/2001 of 30th November
2001 governing telecommunication
in its article 45 gives the Regulatory
Authority the responsibility to investigate
the possibility of number portability in
Rwanda. In this regard, RURA carried
out a Cost Benefit Analysis (CBA) of the
introduction of Mobile Number Portability.
The study came with a recommendation to
implement Mobile Number Portability (MNP)
at in the future but in a realistic timing, and
meanwhile RURA should work on other issues
that have a greater competitive effect for
the Rwandan market.
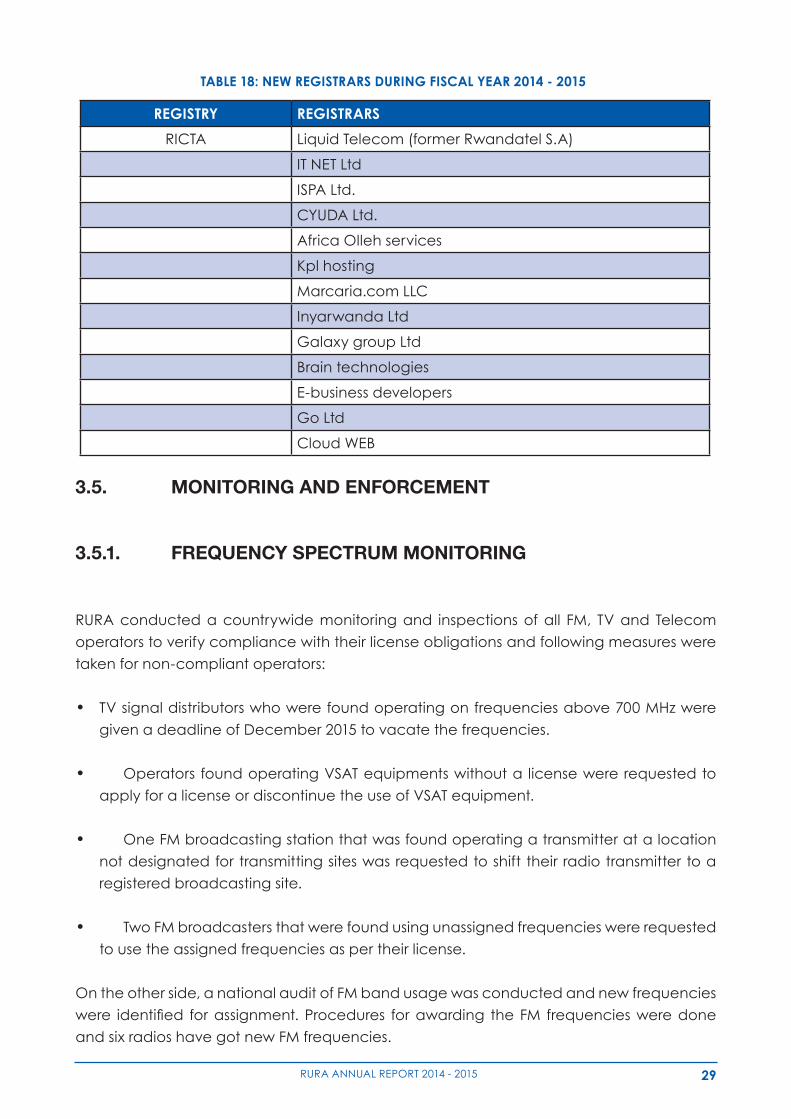
3.4.3. MANAGEMENT OF INTERNET RESOURCES
During the period under review, RURA
continued to provide support to the
Rwanda Information and Communication
Technology Association (RICTA) for the
management of RINEX. In addition, RURA
monitored and evaluated the performance
of RICTA in order to ensure the technical and
administrative management of the Internet
infrastructure of the Country Code Top Level
Domain (ccTLD). The table below highlights
the new Registrars under the ccTLD (.rw)
duringthefiscalyear2014–2015:
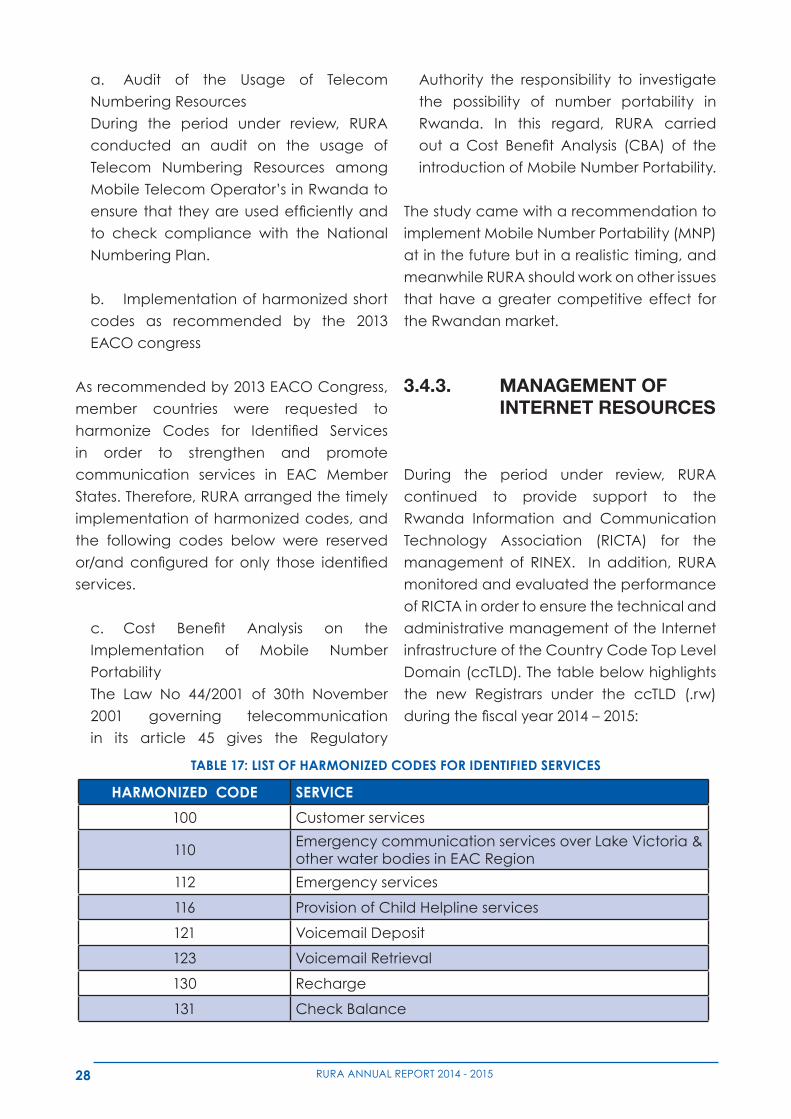
TABLE 17: LIST OF HARMONIZED CODES FOR IDENTIFIED SERVICES
HARMONIZED CODE SERVICE
100 Customer services
110Emergency communication services over Lake Victoria & other water bodies in EAC Region
112 Emergency services
116 Provision of Child Helpline services
121 Voicemail Deposit
123 Voicemail Retrieval
130 Recharge
131 Check Balance
29RURA ANNUAL REPORT 2014 - 2015
3.5. MONITORING AND ENFORCEMENT
3.5.1. FREQUENCY SPECTRUM MONITORING
RURA conducted a countrywide monitoring and inspections of all FM, TV and Telecom
operators to verify compliance with their license obligations and following measures were
taken for non-compliant operators:
• TV signal distributors who were found operating on frequencies above 700 MHz were
given a deadline of December 2015 to vacate the frequencies.
• Operators found operating VSAT equipments without a license were requested to
apply for a license or discontinue the use of VSAT equipment.
• One FM broadcasting station that was found operating a transmitter at a location
not designated for transmitting sites was requested to shift their radio transmitter to a
registered broadcasting site.
• Two FM broadcasters that were found using unassigned frequencies were requested
to use the assigned frequencies as per their license.
On the other side, a national audit of FM band usage was conducted and new frequencies
were identified forassignment.Procedures forawarding theFM frequenciesweredone
and six radios have got new FM frequencies.
TABLE 18: NEW REGISTRARS DURING FISCAL YEAR 2014 - 2015
REGISTRY REGISTRARS
RICTA Liquid Telecom (former Rwandatel S.A)
IT NET Ltd
ISPA Ltd.
CYUDA Ltd.
Africa Olleh services
Kpl hosting
Marcaria.com LLC
Inyarwanda Ltd
Galaxy group Ltd
Brain technologies
E-business developers
Go Ltd
Cloud WEB
30 RURA ANNUAL REPORT 2014 - 2015
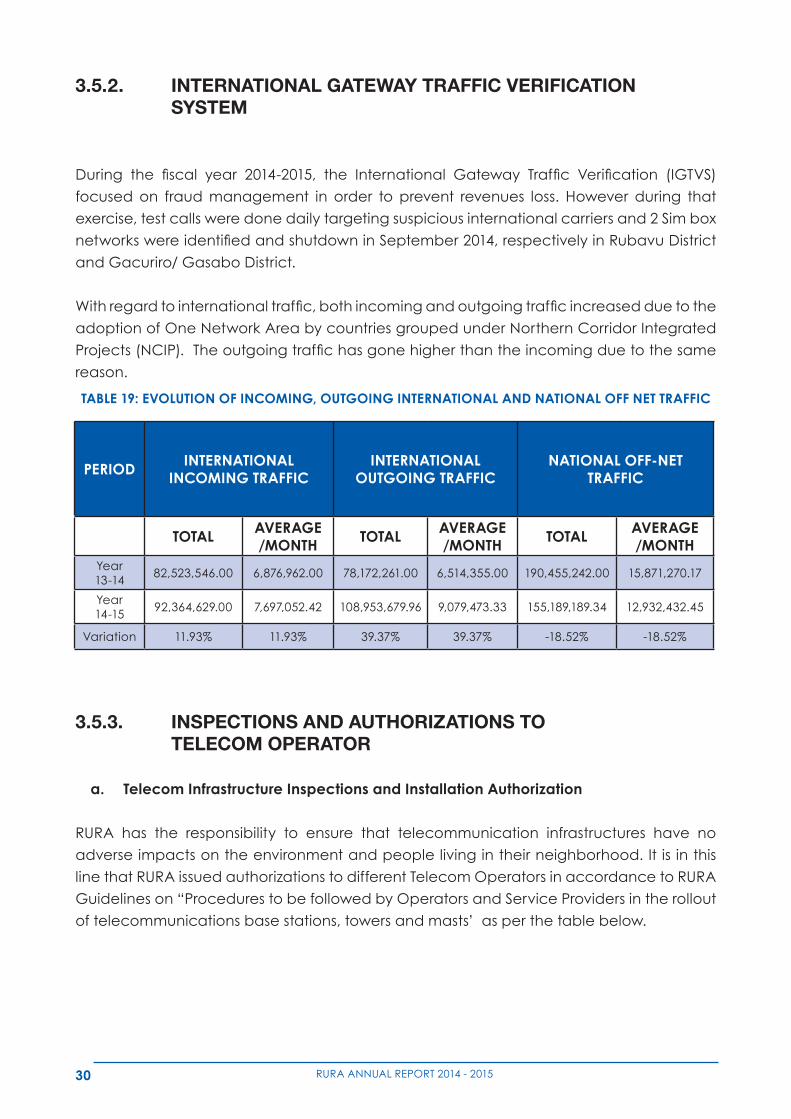
3.5.2. INTERNATIONAL GATEWAY TRAFFIC VERIFICATION SYSTEM
During the fiscal year 2014-2015, the International Gateway Traffic Verification (IGTVS)
focused on fraud management in order to prevent revenues loss. However during that
exercise, test calls were done daily targeting suspicious international carriers and 2 Sim box
networkswereidentifiedandshutdowninSeptember2014,respectivelyinRubavuDistrict
and Gacuriro/ Gasabo District.
Withregardtointernationaltraffic,bothincomingandoutgoingtrafficincreasedduetothe
adoption of One Network Area by countries grouped under Northern Corridor Integrated
Projects(NCIP).Theoutgoingtraffichasgonehigherthantheincomingduetothesame
reason.
3.5.3. INSPECTIONS AND AUTHORIZATIONS TO TELECOM OPERATOR
a. Telecom Infrastructure Inspections and Installation Authorization
RURA has the responsibility to ensure that telecommunication infrastructures have no
adverse impacts on the environment and people living in their neighborhood. It is in this
line that RURA issued authorizations to different Telecom Operators in accordance to RURA
Guidelines on “Procedures to be followed by Operators and Service Providers in the rollout
of telecommunications base stations, towers and masts’ as per the table below.
PERIOD INTERNATIONAL INCOMING TRAFFIC
INTERNATIONAL OUTGOING TRAFFIC
NATIONAL OFF-NET TRAFFIC
TOTAL AVERAGE/MONTH TOTAL AVERAGE
/MONTH TOTAL AVERAGE/MONTH
Year 13-14
82,523,546.00 6,876,962.00 78,172,261.00 6,514,355.00 190,455,242.00 15,871,270.17
Year 14-15
92,364,629.00 7,697,052.42 108,953,679.96 9,079,473.33 155,189,189.34 12,932,432.45
Variation 11.93% 11.93% 39.37% 39.37% -18.52% -18.52%
TABLE 19: EVOLUTION OF INCOMING, OUTGOING INTERNATIONAL AND NATIONAL OFF NET TRAFFIC
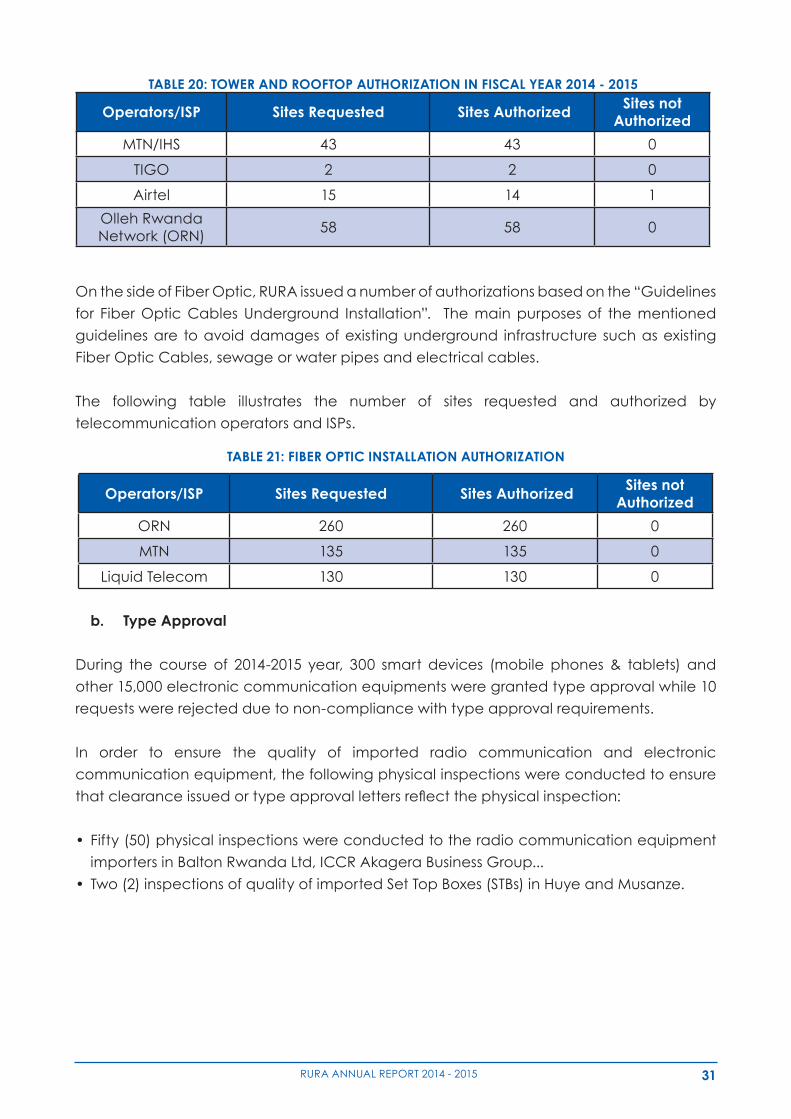
31RURA ANNUAL REPORT 2014 - 2015
On the side of Fiber Optic, RURA issued a number of authorizations based on the “Guidelines
for Fiber Optic Cables Underground Installation”. The main purposes of the mentioned
guidelines are to avoid damages of existing underground infrastructure such as existing
Fiber Optic Cables, sewage or water pipes and electrical cables.
The following table illustrates the number of sites requested and authorized by
telecommunication operators and ISPs.
b. Type Approval
During the course of 2014-2015 year, 300 smart devices (mobile phones & tablets) and
other 15,000 electronic communication equipments were granted type approval while 10
requests were rejected due to non-compliance with type approval requirements.
In order to ensure the quality of imported radio communication and electronic
communication equipment, the following physical inspections were conducted to ensure
thatclearanceissuedortypeapprovallettersreflectthephysicalinspection:
• Fifty(50)physicalinspectionswereconductedtotheradiocommunicationequipment
importers in Balton Rwanda Ltd, ICCR Akagera Business Group...
• Two(2)inspectionsofqualityofimportedSetTopBoxes(STBs)inHuyeandMusanze.
TABLE 20: TOWER AND ROOFTOP AUTHORIZATION IN FISCAL YEAR 2014 - 2015
Operators/ISP Sites Requested Sites Authorized Sites not Authorized
MTN/IHS 43 43 0
TIGO 2 2 0
Airtel 15 14 1
Olleh Rwanda Network (ORN)
58 58 0
TABLE 21: FIBER OPTIC INSTALLATION AUTHORIZATION
Operators/ISP Sites Requested Sites Authorized Sites not Authorized
ORN 260 260 0
MTN 135 135 0
Liquid Telecom 130 130 0
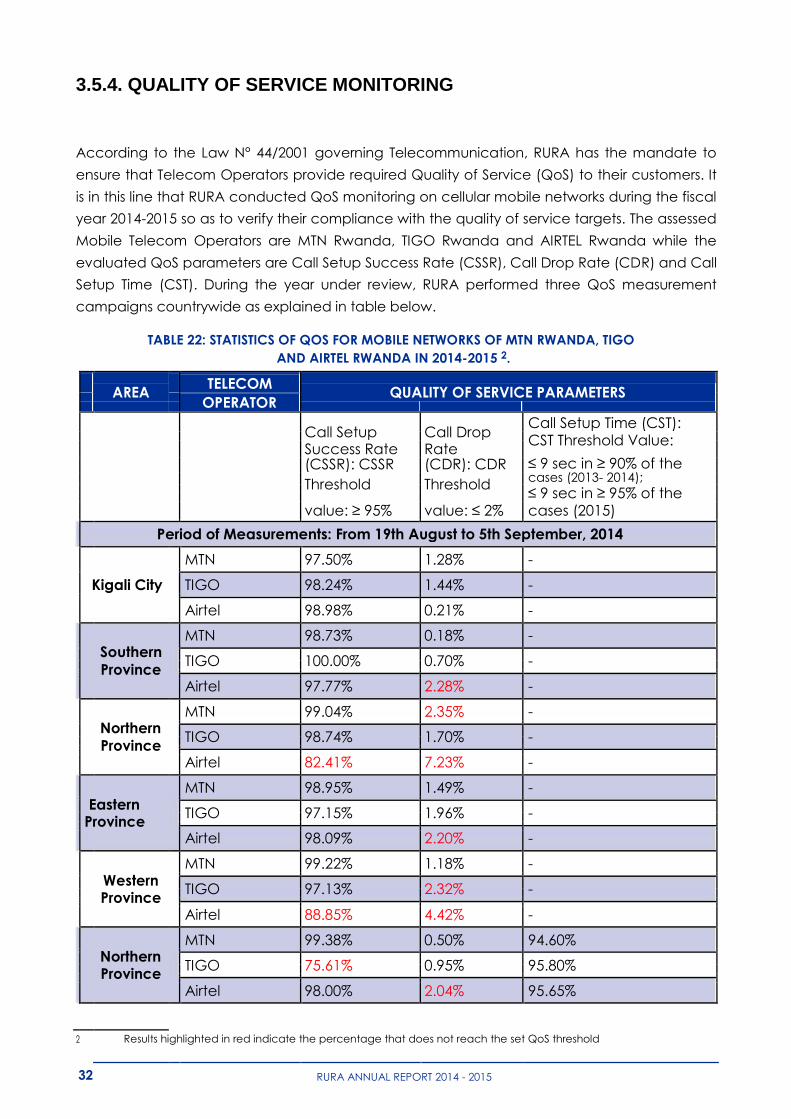
3.5.4. QUALITY OF SERVICE MONITORING
According to the Law N° 44/2001 governing Telecommunication, RURA has the mandate to
ensure that Telecom Operators provide required Quality of Service (QoS) to their customers. It
is in this line that RURA conducted QoS monitoring on cellular mobile networks during the fiscal
year 2014-2015 so as to verify their compliance with the quality of service targets. The assessed
Mobile Telecom Operators are MTN Rwanda, TIGO Rwanda and AIRTEL Rwanda while the
evaluated QoS parameters are Call Setup Success Rate (CSSR), Call Drop Rate (CDR) and Call
Setup Time (CST). During the year under review, RURA performed three QoS measurement
campaigns countrywide as explained in table below.
TABLE 22: STATISTICS OF QOS FOR MOBILE NETWORKS OF MTN RWANDA, TIGO
AND AIRTEL RWANDA IN 2014-2015 2.
AREA
TELECOM QUALITY OF SERVICE PARAMETERS
OPERATOR
Call Setup Call Drop
Call Setup Time (CST):
CST Threshold Value:
Success Rate Rate
≤ 9 sec in ≥ 90% of the
(CSSR): CSSR (CDR): CDR
Threshold Threshold
cases (2013- 2014);
≤ 9 sec in ≥ 95% of the
value: ≥ 95% value: ≤ 2%
cases (2015)
Period of Measurements: From 19th August to 5th September, 2014
MTN 97.50% 1.28% -
Kigali City
TIGO 98.24% 1.44% -
Airtel 98.98% 0.21% -
Southern
MTN 98.73% 0.18% -
TIGO 100.00% 0.70% -
Province
Airtel 97.77% 2.28% -
Northern
MTN 99.04% 2.35% -
TIGO 98.74% 1.70% -
Province
Airtel 82.41% 7.23% -
Eastern
MTN 98.95% 1.49% -
TIGO 97.15% 1.96% -
Province
Airtel 98.09% 2.20% -
Western
MTN 99.22% 1.18% -
TIGO 97.13% 2.32% -
Province
Airtel 88.85% 4.42% -
Northern
MTN 99.38% 0.50% 94.60%
TIGO 75.61% 0.95% 95.80%
Province
Airtel 98.00% 2.04% 95.65%
2 Results highlighted in red indicate the percentage that does not reach the set QoS threshold
32
RURA ANNUAL REPORT 2014 - 2015
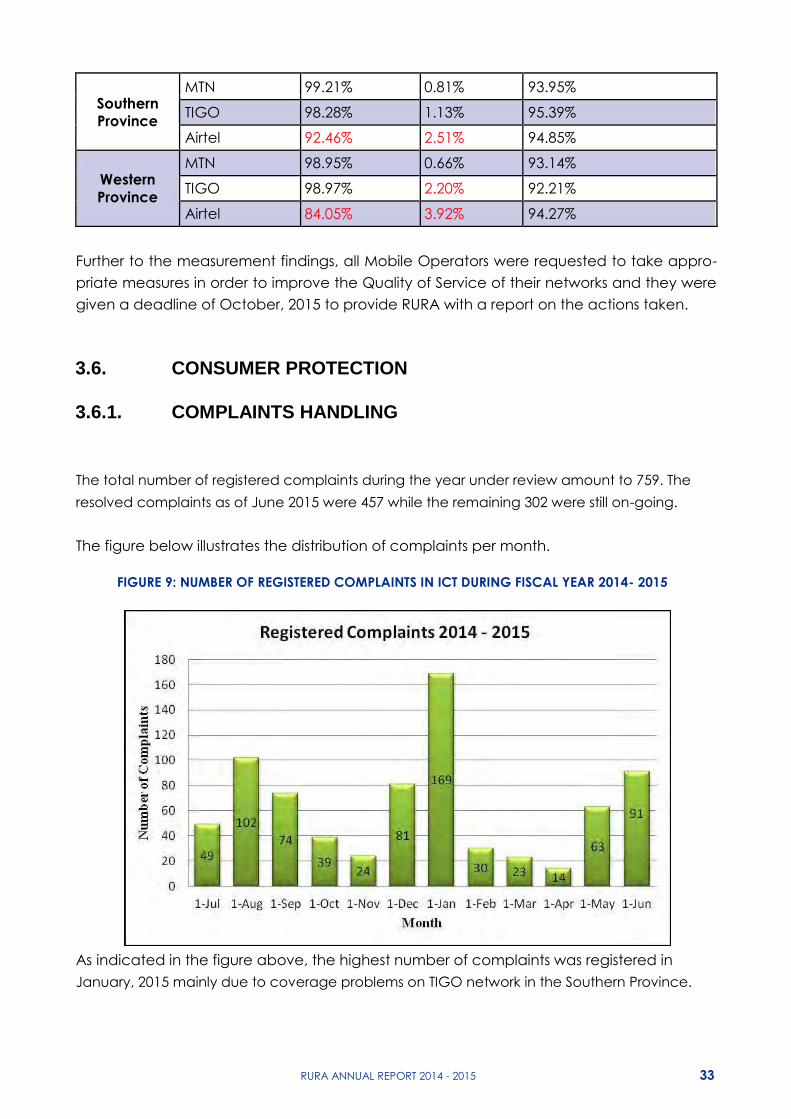
Southern MTN 99.21% 0.81% 93.95%
TIGO 98.28% 1.13% 95.39%
Province
Airtel 92.46% 2.51% 94.85%
Western MTN 98.95% 0.66% 93.14%
TIGO 98.97% 2.20% 92.21%
Province
Airtel 84.05% 3.92% 94.27%
Further to the measurement findings, all Mobile Operators were requested to take appro-
priate measures in order to improve the Quality of Service of their networks and they were
given a deadline of October, 2015 to provide RURA with a report on the actions taken.
3.6. CONSUMER PROTECTION
3.6.1. COMPLAINTS HANDLING
The total number of registered complaints during the year under review amount to 759. The
resolved complaints as of June 2015 were 457 while the remaining 302 were still on-going.
The figure below illustrates the distribution of complaints per month.
FIGURE 9: NUMBER OF REGISTERED COMPLAINTS IN ICT DURING FISCAL YEAR 2014- 2015
As indicated in the figure above, the highest number of complaints was registered in January, 2015 mainly due to coverage problems on TIGO network in the Southern Province.
RURA ANNUAL REPORT 2014 - 2015 33

34 RURA ANNUAL REPORT 2014 - 2015
FIGURE 10: NUMBER OF REGISTERED COMPLAINTS PER CATEGORY IN ICT SECTOR (2014-2015)
Figure 10: Number of registered complaints per category in ICT Sector (2014-2015)
From the figure above, the service accessibility problems, billing and poor service delivery
constitute the main categories of the complaints registered during the year under review. They
represent 78% of the total number of complaints registered.
Even though the percentage of mobile money related complaints is not very high (7%), it is
important to highlight the new trend of fraud in mobile money against customers and agents.
Investigations are being conducted to detect fraudsters.
3.7.2. Telecom Operators Promotions Analysis
Application for promotions from MTN, TIGO and Airtel were received by RURA and analysed
before approval to avoid exploitation that may occur from some promotions.
3.8. UNIVERSAL ACCESS
The Government of Rwanda (GoR), through the Law No 44/2001 of 30th November 2001
governing telecommunications, established the Universal Access Fund (UAF) to accelerate the
use of ICT in the country. The functioning and the source of funding of UAF are determined by
the Presidential Order No 05/01 of 15/03/2004.
From the figure above, the service
accessibility problems, billing and poor
service delivery constitute the main
categories of the complaints registered
during the year under review. They represent
78% of the total number of complaints
registered.
Even though the percentage of mobile
money related complaints is not very high
(7%), it is important to highlight the new
trend of fraud in mobile money against
customers and agents. Investigations are
being conducted to detect fraudsters.
3.6.2. TELECOM OPERATORS PROMOTIONS ANALYSIS
Application for promotions from MTN,
TIGO and Airtel were received by RURA
and analysed before approval to avoid
exploitation that may occur from some
promotions.
The following diagram describes the number of registered complaints per category during
the period under review.
3.7. UNIVERSAL ACCESS
The Government of Rwanda (GoR), through
the Law No 44/2001 of 30th November
2001 governing telecommunications,
established the Universal Access Fund (UAF)
to accelerate the use of ICT in the country.
The functioning and the source of funding
of UAF are determined by the Presidential
Order No 05/01 of 15/03/2004.
The fund is financed by the licensed
operators who contribute 2% of their annual
turnover. The Regulatory Board has the
mandate to manage this fund in a way that
favours the spread and take-up of ICTs in
designated remote and under-served areas
of the country. Projects under Universal
Access complement and integrate the
overall NICI policy framework for Rwanda.
In this fiscal year 2014-2015, RURA through
UAF in collaboration with other institutions
developed and implemented the following
projects:
35RURA ANNUAL REPORT 2014 - 2015
a) Joint project with MINEDUC to connect
schools in rural and underserved areas
to broadband Internet. Sixty four (64)
schools were selected, 15 of which were
connected to BSC Fiber Optic while 49
were connected to TIGO wireless network
b) Subsidizing bandwidth acquisition to rural
communities: This initiative aims to ensure
access of the affordable Internet services
and wider penetration of ICTs services to
the public and private institutions in rural
and remote areas of the country. This
is done by subsidizing bandwidth using
VSAT Technology to the rural communities
wherefibernetworkisnotyetoperational.
During this fiscal period RURA, provided
bandwidth connectivity and conducted
the site visits to 14 remaining subsidized
sites located in rural areas of the entire
country to monitor and evaluate the
performance of NEW ARTEL.
c) Subsidy support to RNP for establishment
of Emergency Call Center countrywide:
This project is now in its final phase and
is coordinated by RNP with the aim of
ensuring efficient functionality and free
access for emergency public services.
d) Support in Operations and management
of ccTLD (Country Code Top Level) and
Rwanda Internet Exchange: This aims to
ensure the sustainability of ccTLD and
routingofnationaltraffictoremainlocal.
e) Support of projects aimed at ensuring
reliability and trust of secured electronic
transaction at national level for the
development of e-services and business.
3.8. OUTSTANDING ISSUES
The main outstanding issues in the ICT sector
are the delay in adoption and approval of
some policies and laws namely:
a) The ICT Bill which establishes a framework
for Information and Communication
Technologies (ICT) is yet to be enacted;
b) The Postal Policy is not yet in place;
c) Prime Minister’s Order which provides
thespecificmissionsofRURAwithregard
to the Media is not yet approved by the
Cabinet.

36 RURA ANNUAL REPORT 2014 - 2015
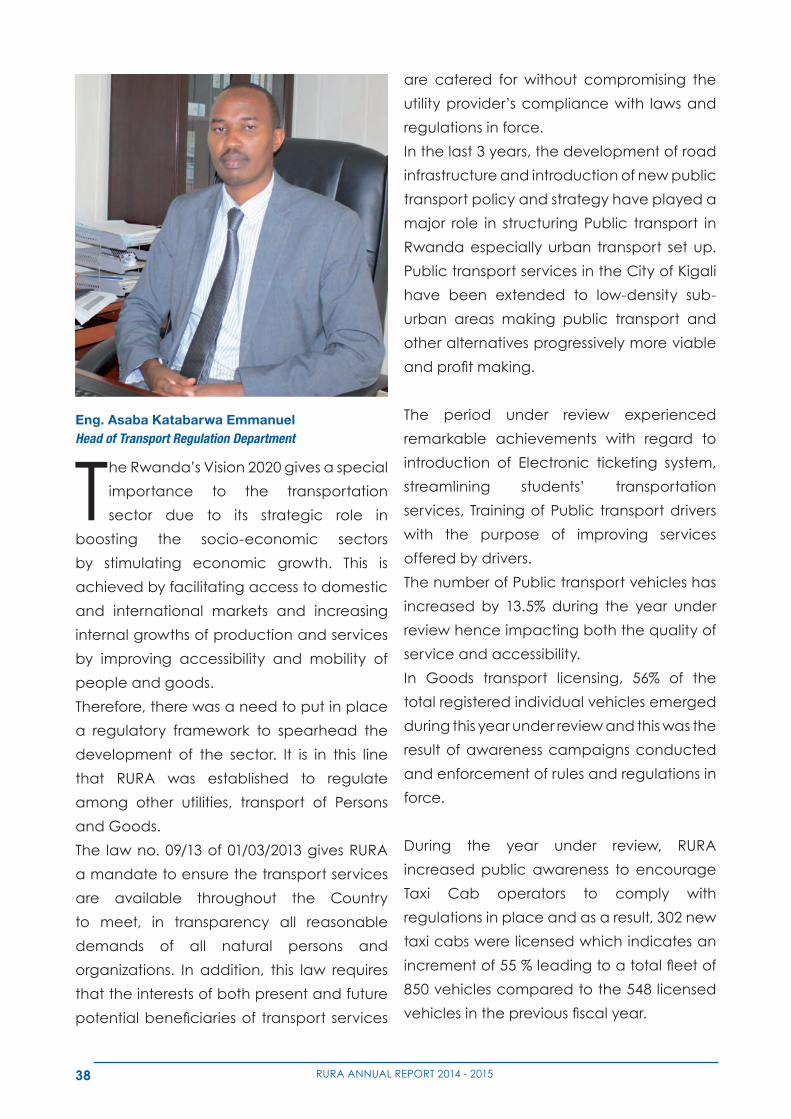
38 RURA ANNUAL REPORT 2014 - 2015
The Rwanda’s Vision 2020 gives a special
importance to the transportation
sector due to its strategic role in
boosting the socio-economic sectors
by stimulating economic growth. This is
achieved by facilitating access to domestic
and international markets and increasing
internal growths of production and services
by improving accessibility and mobility of
people and goods.
Therefore, there was a need to put in place
a regulatory framework to spearhead the
development of the sector. It is in this line
that RURA was established to regulate
among other utilities, transport of Persons
and Goods.
The law no. 09/13 of 01/03/2013 gives RURA
a mandate to ensure the transport services
are available throughout the Country
to meet, in transparency all reasonable
demands of all natural persons and
organizations. In addition, this law requires
that the interests of both present and future
potentialbeneficiariesof transport services
are catered for without compromising the
utility provider’s compliance with laws and
regulations in force.
In the last 3 years, the development of road
infrastructure and introduction of new public
transport policy and strategy have played a
major role in structuring Public transport in
Rwanda especially urban transport set up.
Public transport services in the City of Kigali
have been extended to low-density sub-
urban areas making public transport and
other alternatives progressively more viable
andprofitmaking.
The period under review experienced
remarkable achievements with regard to
introduction of Electronic ticketing system,
streamlining students’ transportation
services, Training of Public transport drivers
with the purpose of improving services
offered by drivers.
The number of Public transport vehicles has
increased by 13.5% during the year under
review hence impacting both the quality of
service and accessibility.
In Goods transport licensing, 56% of the
total registered individual vehicles emerged
during this year under review and this was the
result of awareness campaigns conducted
and enforcement of rules and regulations in
force.
During the year under review, RURA
increased public awareness to encourage
Taxi Cab operators to comply with
regulations in place and as a result, 302 new
taxi cabs were licensed which indicates an
incrementof55%leadingtoatotalfleetof
850 vehicles compared to the 548 licensed
vehiclesinthepreviousfiscalyear.
Eng. Asaba Katabarwa EmmanuelHead of Transport Regulation Department
39RURA ANNUAL REPORT 2014 - 2015
In Waterways transport, two hundred and
thirty seven (237) boats drivers and owners
were trained. Also, sensitization meetings
were conducted with Waterways transport
stakeholders that include transporters, Army
marine, Police Marine and concerned Local
GovernmentAuthorities.Asaresult,fifty-four
(54) new operators were licensed and one
hundred thirty two (132) authorizations were
renewed.
4.1. LEGAL AND REGULATORY FRAMEWORK
During the Fiscal Year under review, RURA
reviewed and approved the following
regulatory instruments:
o Regulations N°007/TRANS/RT/RURA/2015
of 01/06/2015 governing passenger road
transport services in Rwanda;
o Code of Conduct of Public Road Transport
Drivers
4.2. LICENSING AND MARKET PERFORMANCE
In general, the number of operators in
transport sector increased for sub sectors
like Buses, Minibuses, Taxi Cabs, and Goods
transport. This was brought about by the
awareness campaigns and enforcement
measures taken during the year under
review.
4.2.1. LICENSING
4.2.1.1. PASSENGER TRANSPORTATION SERVICE
During the fiscal year 2014/2015, three (3)
new passenger transportation companies
were recorded while five (5) companies
closed their activities. The fleet of those
companies which closed their activities
totaling to 44 vehicles joined other licensed
companies and hence the sector services
were not hindered.
A detailed list of licensed of public transport
operatorswiththeirrespectivefleetcapacity
is attached as Annex 2.
Belowfigureillustratestheevolutionoffleet
capacity from the 2013/2014 to 2014/2015
fiscalyears.
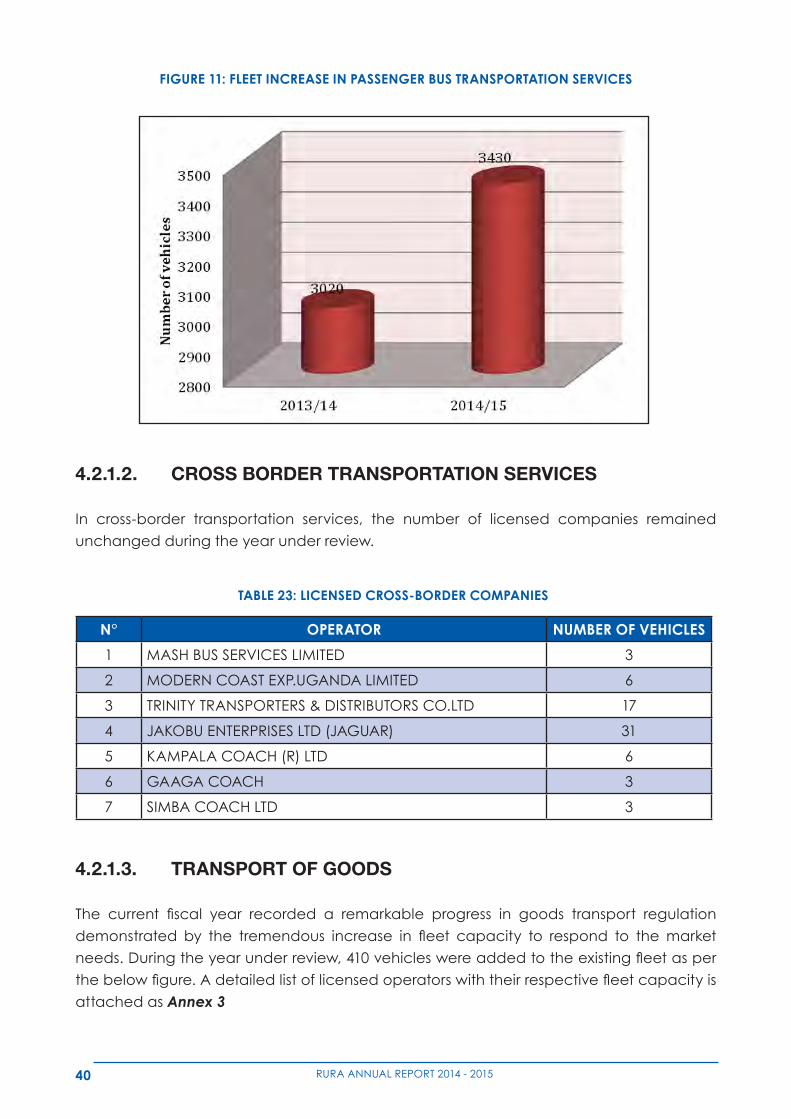
40 RURA ANNUAL REPORT 2014 - 2015
FIGURE 11: FLEET INCREASE IN PASSENGER BUS TRANSPORTATION SERVICES
4.3.1.1. Passenger Transportation Service
During the fiscal year 2014/2015, three (3) new passenger transportation companies were
recorded while five (5) companies closed their activities. The fleet of those companies which
closed their activities totaling to 44 vehicles joined other licensed companies and hence the
sector services were not hindered.
A detailed list of licensed of public transport operators with their respective fleet capacity is
attached as Annex 2.
Below figure illustrates the evolution of fleet capacity from the 2013/2014 to 2014/2015 fiscal
years.
Figure 11: Fleet increase in Passenger Bus Transportation Services
4.3.1.2. Cross Border Transportation Services
In cross-border transportation services, the number of licensed companies remained unchanged
during the year under review.
Table 23: Licensed Cross-border Companies
SN OPERATOR NUMBER OF
VEHICLES
1 MASH BUS SERVICES LIMITED 3
2 MODERN COAST EXP.UGANDA LIMITED 6
4.2.1.2. CROSS BORDER TRANSPORTATION SERVICES
In cross-border transportation services, the number of licensed companies remained
unchanged during the year under review.
4.2.1.3. TRANSPORT OF GOODS
The current fiscal year recorded a remarkable progress in goods transport regulation
demonstrated by the tremendous increase in fleet capacity to respond to themarket
needs.Duringtheyearunderreview,410vehicleswereaddedtotheexistingfleetasper
thebelowfigure.Adetailedlistoflicensedoperatorswiththeirrespectivefleetcapacityis
attached as Annex 3
TABLE 23: LICENSED CROSS-BORDER COMPANIES
N° OPERATOR NUMBER OF VEHICLES
1 MASH BUS SERVICES LIMITED 3
2 MODERN COAST EXP.UGANDA LIMITED 6
3 TRINITY TRANSPORTERS & DISTRIBUTORS CO.LTD 17
4 JAKOBU ENTERPRISES LTD (JAGUAR) 31
5 KAMPALA COACH (R) LTD 6
6 GAAGA COACH 3
7 SIMBA COACH LTD 3
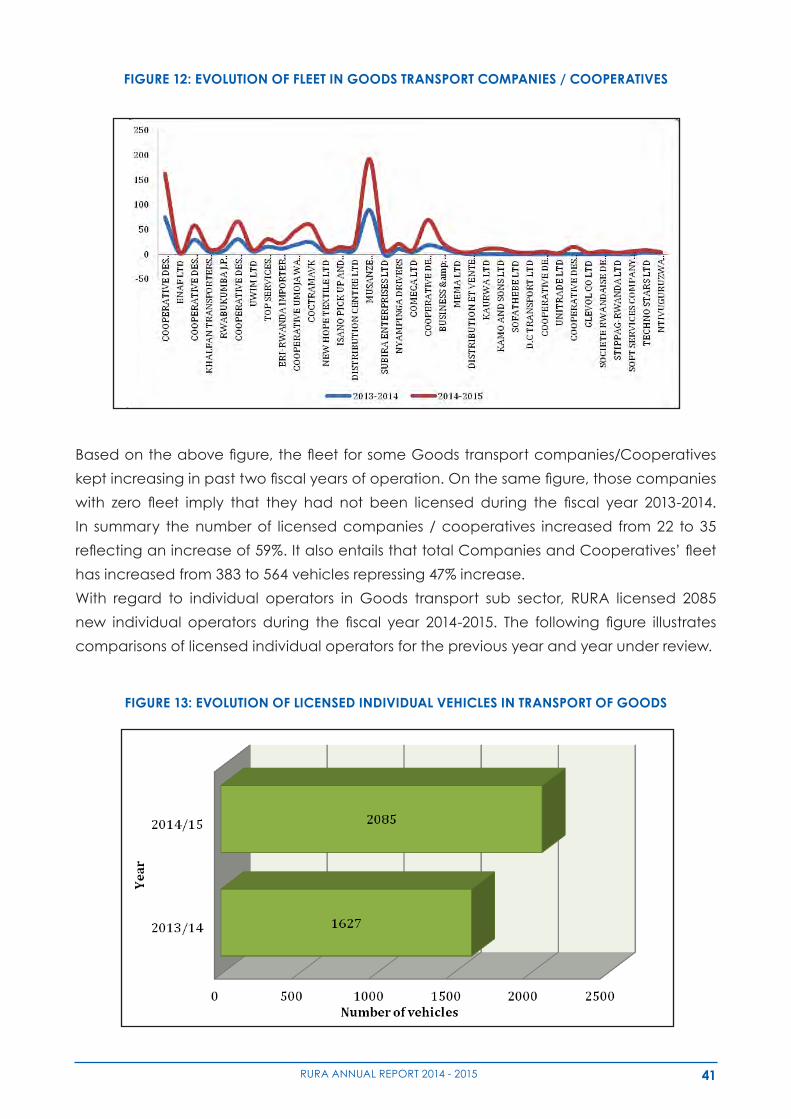
41RURA ANNUAL REPORT 2014 - 2015
FIGURE 12: EVOLUTION OF FLEET IN GOODS TRANSPORT COMPANIES / COOPERATIVES
3 TRINITY TRANSPORTERS & DISTRIBUTORS
CO.LTD
17
4 JAKOBU ENTERPRISES LTD (JAGUAR) 31
5 KAMPALA COACH (R) LTD 6
6 GAAGA COACH 3
7 SIMBA COACH LTD 3
4.3.1.3. Transport of Goods
The current fiscal year recorded a remarkable progress in goods transport regulation
demonstrated by the tremendous increase in fleet capacity to respond to the market needs.
During the year under review, 410 vehicles were added to the existing fleet as per the below
figure. A detailed list of licensed operators with their respective fleet capacity is attached as
Annex 3
Figure 12: Evolution of Fleet in Goods Transport Companies / Cooperatives
Based on the above figure, the fleet for some Goods transport companies/Cooperatives kept
increasing in past two fiscal years of operation. On the same figure, those companies with zero
fleet imply that they had not been licensed during the fiscal year 2013-2014. In summary the
number of licensed companies / cooperatives increased from 22 to 35 reflecting an increase of
Basedontheabovefigure,thefleetforsomeGoodstransportcompanies/Cooperatives
keptincreasinginpasttwofiscalyearsofoperation.Onthesamefigure,thosecompanies
with zero fleet imply that they had not been licensed during the fiscal year 2013-2014.
In summary the number of licensed companies / cooperatives increased from 22 to 35
reflectinganincreaseof59%.ItalsoentailsthattotalCompaniesandCooperatives’fleet
has increased from 383 to 564 vehicles repressing 47% increase.
With regard to individual operators in Goods transport sub sector, RURA licensed 2085
new individual operators during the fiscal year 2014-2015. The following figure illustrates
comparisons of licensed individual operators for the previous year and year under review.
FIGURE 13: EVOLUTION OF LICENSED INDIVIDUAL VEHICLES IN TRANSPORT OF GOODS
59%. It also entails that total Companies and Cooperatives’ fleet has increased from 383 to 564
vehicles repressing 47% increase.
With regard to individual operators in Goods transport sub sector, RURA licensed 2085 new
individual operators during the fiscal year 2014-2015. The following figure illustrates
comparisons of licensed individual operators for the previous year and year under review.
Figure 13: Evolution of Licensed individual vehicles in Transport of Goods
The above figure indicates that the number of licensed individual operators increased from 1627
as of June 2014 to 2085 as of June 2015 representing an increase of 12.3%. This increase was
due to regular inspections and enforcement measures taken against the non-licensed operators.
4.3.1.4. Motorcycle Transportation
During the year under review 147 Motorcycle cooperatives were licensed with the total fleet of
19,304 Motorcycles. These Motorcycles cooperatives are distributed in different parts of the
country and ply the feeder routes where public bus transportation in not easily accessed.
A detailed list of Licensed Motorcycle cooperatives with their respective fleet capacity is
attached as Annex 4
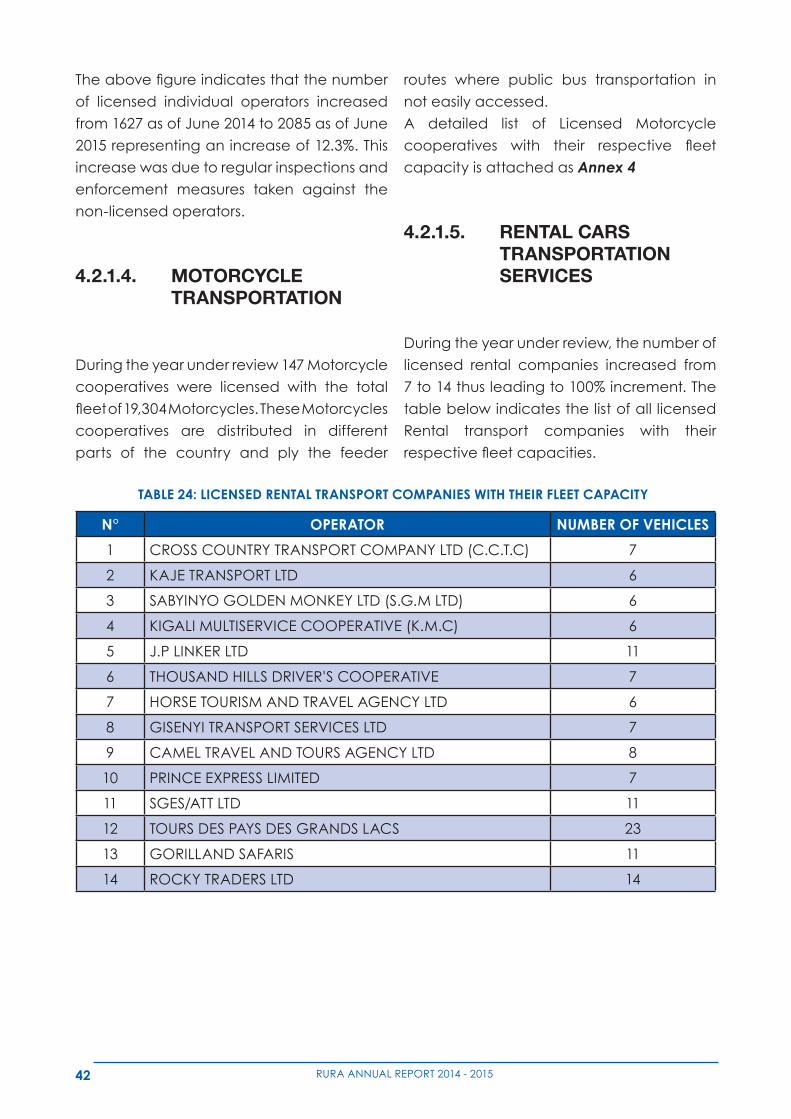
42 RURA ANNUAL REPORT 2014 - 2015
Theabovefigureindicatesthatthenumber
of licensed individual operators increased
from 1627 as of June 2014 to 2085 as of June
2015 representing an increase of 12.3%. This
increase was due to regular inspections and
enforcement measures taken against the
non-licensed operators.
4.2.1.4. MOTORCYCLE TRANSPORTATION
During the year under review 147 Motorcycle
cooperatives were licensed with the total
fleetof19,304Motorcycles.TheseMotorcycles
cooperatives are distributed in different
parts of the country and ply the feeder
routes where public bus transportation in
not easily accessed.
A detailed list of Licensed Motorcycle
cooperatives with their respective fleet
capacity is attached as Annex 4
4.2.1.5. RENTAL CARS TRANSPORTATION SERVICES
During the year under review, the number of
licensed rental companies increased from
7 to 14 thus leading to 100% increment. The
table below indicates the list of all licensed
Rental transport companies with their
respectivefleetcapacities.
TABLE 24: LICENSED RENTAL TRANSPORT COMPANIES WITH THEIR FLEET CAPACITY
N° OPERATOR NUMBER OF VEHICLES
1 CROSS COUNTRY TRANSPORT COMPANY LTD (C.C.T.C) 7
2 KAJE TRANSPORT LTD 6
3 SABYINYO GOLDEN MONKEY LTD (S.G.M LTD) 6
4 KIGALI MULTISERVICE COOPERATIVE (K.M.C) 6
5 J.P LINKER LTD 11
6 THOUSAND HILLS DRIVER'S COOPERATIVE 7
7 HORSE TOURISM AND TRAVEL AGENCY LTD 6
8 GISENYI TRANSPORT SERVICES LTD 7
9 CAMEL TRAVEL AND TOURS AGENCY LTD 8
10 PRINCE EXPRESS LIMITED 7
11 SGES/ATT LTD 11
12 TOURS DES PAYS DES GRANDS LACS 23
13 GORILLAND SAFARIS 11
14 ROCKY TRADERS LTD 14
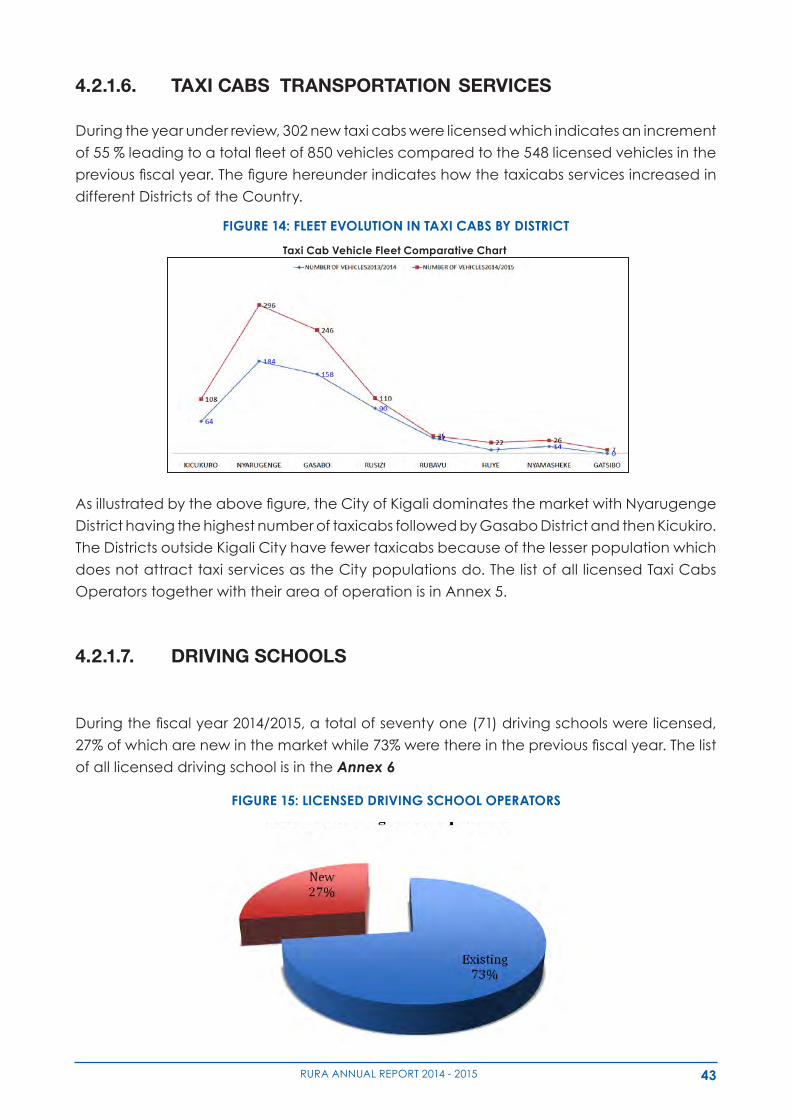
43RURA ANNUAL REPORT 2014 - 2015
4.2.1.6. TAXI CABS TRANSPORTATION SERVICES
During the year under review, 302 new taxi cabs were licensed which indicates an increment
of55%leadingtoatotalfleetof850vehiclescomparedtothe548licensedvehiclesinthe
previousfiscalyear.Thefigurehereunderindicateshowthetaxicabsservicesincreasedin
different Districts of the Country.
Asillustratedbytheabovefigure,theCityofKigalidominatesthemarketwithNyarugenge
District having the highest number of taxicabs followed by Gasabo District and then Kicukiro.
The Districts outside Kigali City have fewer taxicabs because of the lesser population which
does not attract taxi services as the City populations do. The list of all licensed Taxi Cabs
Operators together with their area of operation is in Annex 5.
4.2.1.7. DRIVING SCHOOLS
Duringthefiscalyear2014/2015,atotalofseventyone(71)drivingschoolswerelicensed,
27%ofwhicharenewinthemarketwhile73%werethereinthepreviousfiscalyear.Thelist
of all licensed driving school is in the Annex 6
FIGURE 14: FLEET EVOLUTION IN TAXI CABS BY DISTRICT
Figure 14: Fleet evolution in taxi cabs by District
As illustrated by the above figure, the City of Kigali dominates the market with Nyarugenge
District having the highest number of taxicabs followed by Gasabo District and then Kicukiro.
The Districts outside Kigali City have fewer taxicabs because of the lesser population which
does not attract taxi services as the City populations do. The list of all licensed Taxi Cabs
Operators together with their area of operation is in Annex 5.
4.3.1.7. Driving Schools
During the fiscal year 2014/2015, a total of seventy one (71) driving schools were licensed, 27%
of which are new in the market while 73% were there in the previous fiscal year. The list of all
licensed driving school
is in the Annex 6
Taxi Cab Vehicle Fleet Comparative Chart
FIGURE 15: LICENSED DRIVING SCHOOL OPERATORS
Figure 14: Fleet evolution in taxi cabs by District
As illustrated by the above figure, the City of Kigali dominates the market with Nyarugenge
District having the highest number of taxicabs followed by Gasabo District and then Kicukiro.
The Districts outside Kigali City have fewer taxicabs because of the lesser population which
does not attract taxi services as the City populations do. The list of all licensed Taxi Cabs
Operators together with their area of operation is in Annex 5.
4.3.1.7. Driving Schools
During the fiscal year 2014/2015, a total of seventy one (71) driving schools were licensed, 27%
of which are new in the market while 73% were there in the previous fiscal year. The list of all
licensed driving school
is in the Annex 6
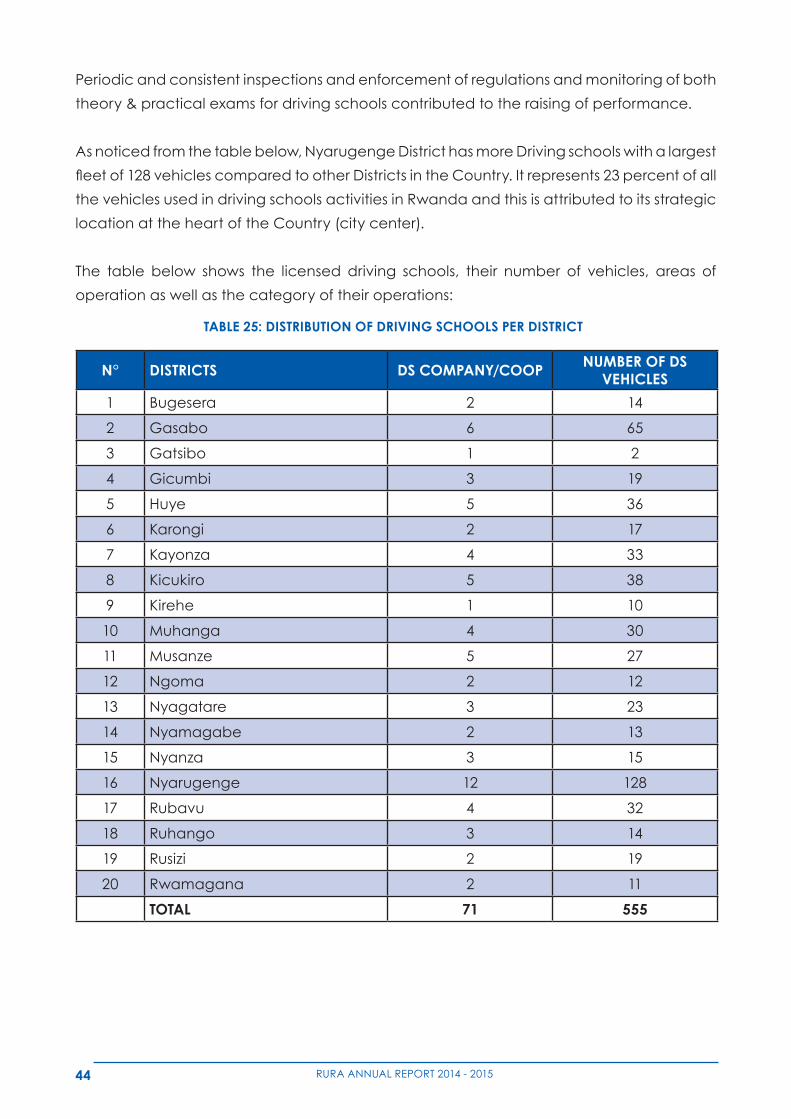
44 RURA ANNUAL REPORT 2014 - 2015
Periodic and consistent inspections and enforcement of regulations and monitoring of both
theory & practical exams for driving schools contributed to the raising of performance.
As noticed from the table below, Nyarugenge District has more Driving schools with a largest
fleetof128vehiclescomparedtootherDistrictsintheCountry.Itrepresents23percentofall
the vehicles used in driving schools activities in Rwanda and this is attributed to its strategic
location at the heart of the Country (city center).
The table below shows the licensed driving schools, their number of vehicles, areas of
operation as well as the category of their operations:
TABLE 25: DISTRIBUTION OF DRIVING SCHOOLS PER DISTRICT
N° DISTRICTS DS COMPANY/COOP NUMBER OF DS VEHICLES
1 Bugesera 2 14
2 Gasabo 6 65
3 Gatsibo 1 2
4 Gicumbi 3 19
5 Huye 5 36
6 Karongi 2 17
7 Kayonza 4 33
8 Kicukiro 5 38
9 Kirehe 1 10
10 Muhanga 4 30
11 Musanze 5 27
12 Ngoma 2 12
13 Nyagatare 3 23
14 Nyamagabe 2 13
15 Nyanza 3 15
16 Nyarugenge 12 128
17 Rubavu 4 32
18 Ruhango 3 14
19 Rusizi 2 19
20 Rwamagana 2 11
TOTAL 71 555
45RURA ANNUAL REPORT 2014 - 2015
4.2.1.8. SCHOOL BUSES TRANSPORTATION SERVICES
To establish a safe and efficient unified
system of transportation responsive to the
needs of eligible students and to guide the
provision of school transportation, students’
transportation services have been organized
to serve the following core objectives:
• Toensure thatall roaduserscan identify
easily school buses and give much
attention;
• To save both time and money wasted
by parents who always drop students at
their respective schools using their private
vehicles;
• Tofacilitatelowincomeearnerstoaccess
the affordable student’s transportation
services as compared to private vehicles;
• To facilitate schools administration and
parents to know the status of students
transportation system.
After identifying such gaps in students’
transportation, plans were put in place
to offer transport services to students for
their safety. In the process, bus operators
were encouraged to invest in pupils’
transportation services and two operators
were licensed during the year under review.
These are STUDENT SAFETY BUS LTD, and
VOLCANO EXPRESS LTD.
This market is new and the demand is still
higher than supply, therefore campaigns are
still underway to encourage more investors
to join the business.
4.2.2. TARIFF STRUCTURE
The year under review was characterised
by the decreasing trend of fuel prices
on world market calling for the review of
public transport fares. The public transport
fare was therefore reduced from 19 Rwf
per passenger per kilometre to 18 Rwf per
passenger kilometre effective from 6th
January 2015.
4.3. NEW PROJECTS INTRODUCED IN TRANSPORT SECTOR
4.3.1. ELECTRONIC- TICKETING SYSTEM
Due to challenges in Public transport
service delivery related to fare collection,
data collection and compliance with
service standards, RURA together with other
stakeholders initiated and introduced the use
of e-ticketing system. Different awareness
forums and sensitizations were conducted to
encourage passenger transport operators
to adopt the system and start using it in their
daily transport activities.
This project has the following objectives:
• To reduce losses incurred by operators
during fare collection process;
• Toensureeasy informationcollection for
planning purposes;
•Protectconsumerrights;
• TofacilitateTransportinspectionservicein
monitoring regulations compliance;
• TocomputerizePublictransportsystems.
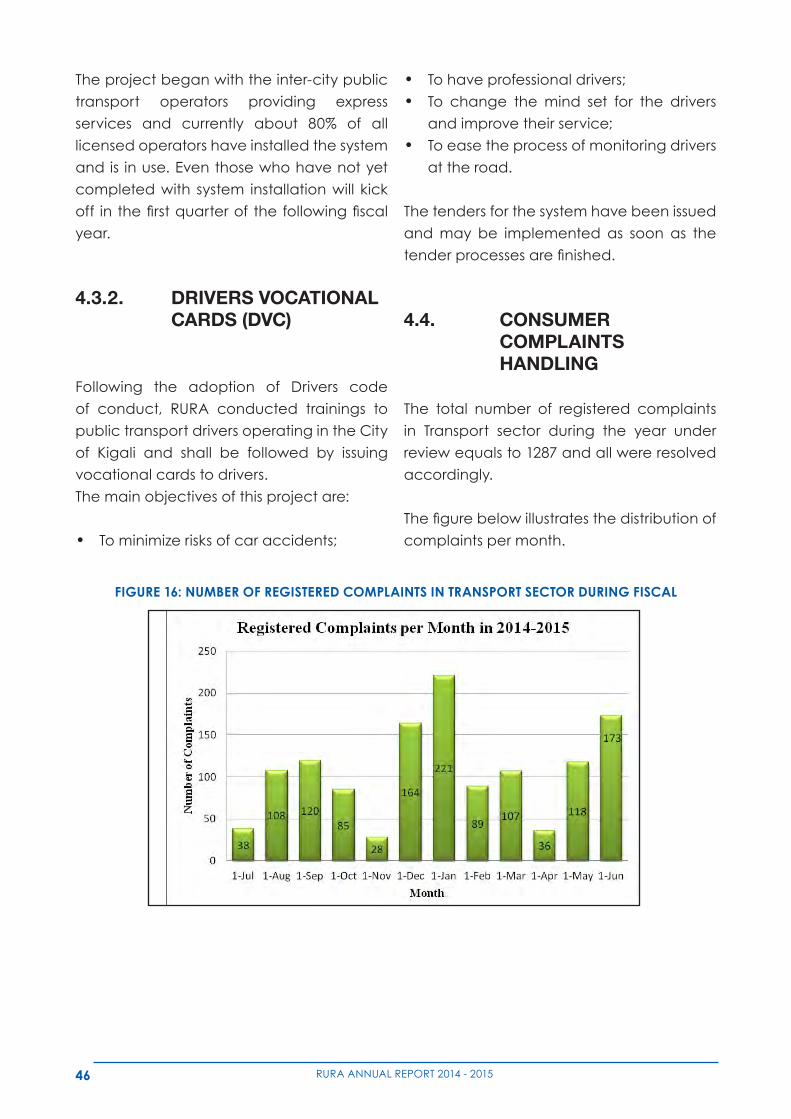
46 RURA ANNUAL REPORT 2014 - 2015
The project began with the inter-city public
transport operators providing express
services and currently about 80% of all
licensed operators have installed the system
and is in use. Even those who have not yet
completed with system installation will kick
off inthefirstquarterofthefollowingfiscal
year.
4.3.2. DRIVERS VOCATIONAL CARDS (DVC)
Following the adoption of Drivers code
of conduct, RURA conducted trainings to
public transport drivers operating in the City
of Kigali and shall be followed by issuing
vocational cards to drivers.
The main objectives of this project are:
• To minimize risks of car accidents;
• To have professional drivers;
• To change the mind set for the drivers
and improve their service;
• To ease the process of monitoring drivers
at the road.
The tenders for the system have been issued
and may be implemented as soon as the
tenderprocessesarefinished.
4.4. CONSUMER COMPLAINTS HANDLING
The total number of registered complaints
in Transport sector during the year under
review equals to 1287 and all were resolved
accordingly.
Thefigurebelowillustratesthedistributionof
complaints per month.
FIGURE 16: NUMBER OF REGISTERED COMPLAINTS IN TRANSPORT SECTOR DURING FISCAL
Figure 16: Number of Registered Complaints in Transport sector during fiscal
The following diagram describes the number of registered complaints per category during the
period under review.
The diagram below shows the nature of complaints that were received during the period under
review.
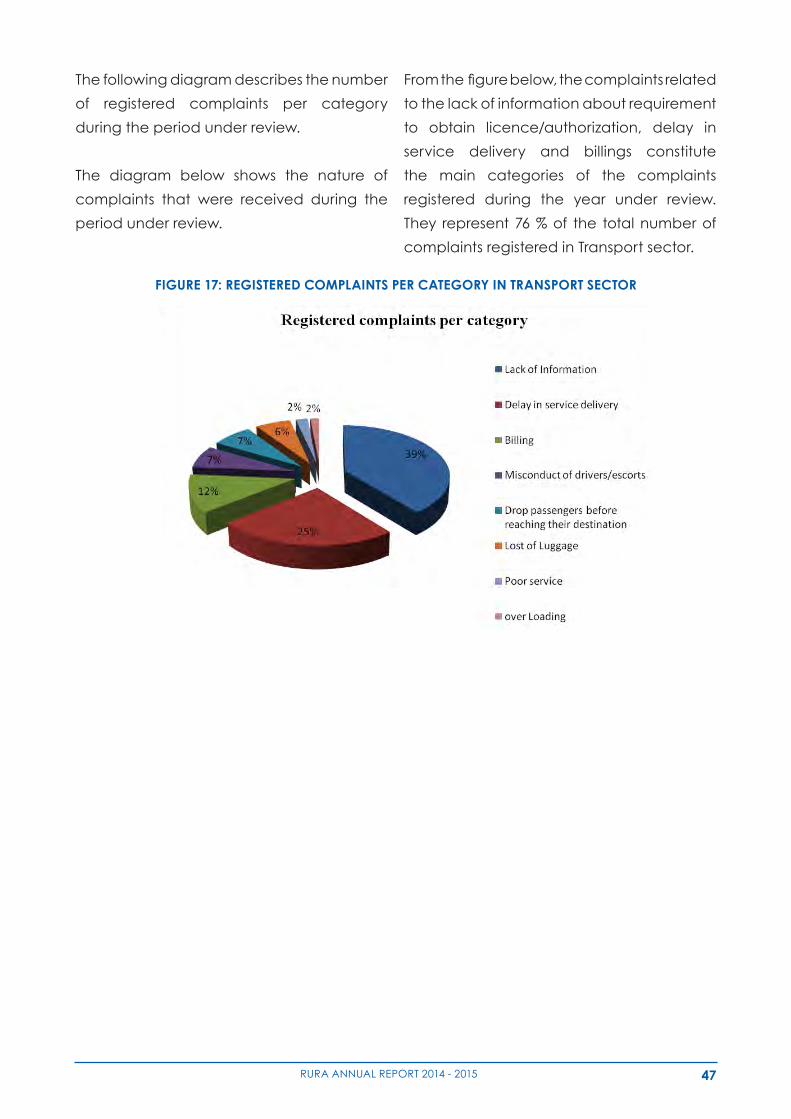
47RURA ANNUAL REPORT 2014 - 2015
The following diagram describes the number
of registered complaints per category
during the period under review.
The diagram below shows the nature of
complaints that were received during the
period under review.
FIGURE 17: REGISTERED COMPLAINTS PER CATEGORY IN TRANSPORT SECTOR
Figure 17: Registered complaints per category in Transport Sector
From the above figure, the complaints related to the lack of information about requirement to
obtain licence/authorization, delay in service delivery and billings constitute the main categories
of the complaints registered during the year under review. They represent 76 % of the total
number of complaints registered in Transport sector.
Fromthefigurebelow,thecomplaintsrelated
to the lack of information about requirement
to obtain licence/authorization, delay in
service delivery and billings constitute
the main categories of the complaints
registered during the year under review.
They represent 76 % of the total number of
complaints registered in Transport sector.

48 RURA ANNUAL REPORT 2014 - 2015
49RURA ANNUAL REPORT 2014 - 2015
ENERGY, WATER & SANITATION SECTOR
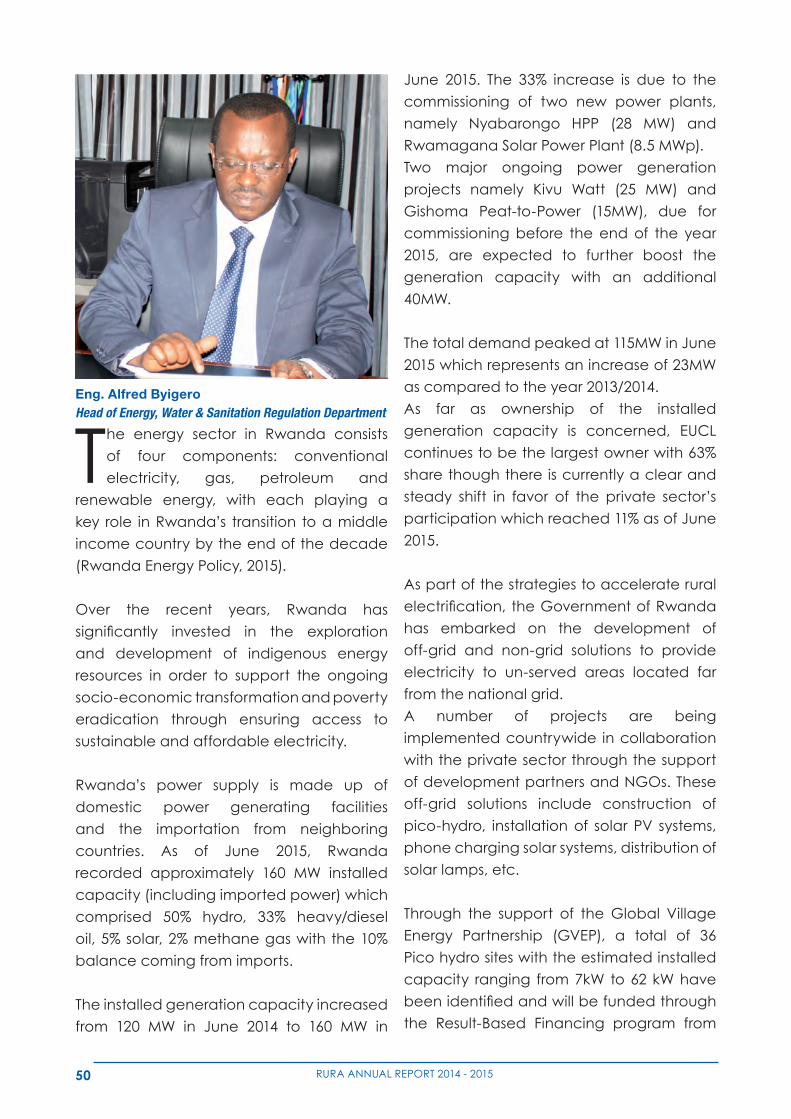
50 RURA ANNUAL REPORT 2014 - 2015
The energy sector in Rwanda consists
of four components: conventional
electricity, gas, petroleum and
renewable energy, with each playing a
key role in Rwanda’s transition to a middle
income country by the end of the decade
(Rwanda Energy Policy, 2015).
Over the recent years, Rwanda has
significantly invested in the exploration
and development of indigenous energy
resources in order to support the ongoing
socio-economic transformation and poverty
eradication through ensuring access to
sustainable and affordable electricity.
Rwanda’s power supply is made up of
domestic power generating facilities
and the importation from neighboring
countries. As of June 2015, Rwanda
recorded approximately 160 MW installed
capacity (including imported power) which
comprised 50% hydro, 33% heavy/diesel
oil, 5% solar, 2% methane gas with the 10%
balance coming from imports.
The installed generation capacity increased
from 120 MW in June 2014 to 160 MW in
June 2015. The 33% increase is due to the
commissioning of two new power plants,
namely Nyabarongo HPP (28 MW) and
Rwamagana Solar Power Plant (8.5 MWp).
Two major ongoing power generation
projects namely Kivu Watt (25 MW) and
Gishoma Peat-to-Power (15MW), due for
commissioning before the end of the year
2015, are expected to further boost the
generation capacity with an additional
40MW.
The total demand peaked at 115MW in June
2015 which represents an increase of 23MW
as compared to the year 2013/2014.
As far as ownership of the installed
generation capacity is concerned, EUCL
continues to be the largest owner with 63%
share though there is currently a clear and
steady shift in favor of the private sector’s
participation which reached 11% as of June
2015.
As part of the strategies to accelerate rural
electrification,theGovernmentofRwanda
has embarked on the development of
off-grid and non-grid solutions to provide
electricity to un-served areas located far
from the national grid.
A number of projects are being
implemented countrywide in collaboration
with the private sector through the support
of development partners and NGOs. These
off-grid solutions include construction of
pico-hydro, installation of solar PV systems,
phone charging solar systems, distribution of
solar lamps, etc.
Through the support of the Global Village
Energy Partnership (GVEP), a total of 36
Pico hydro sites with the estimated installed
capacity ranging from 7kW to 62 kW have
beenidentifiedandwillbefundedthrough
the Result-Based Financing program from
Eng. Alfred ByigeroHead of Energy, Water & Sanitation Regulation Department
51RURA ANNUAL REPORT 2014 - 2015
GiZ. Another important project is being
implemented by MOBISOL in partnership
with REG and aims at providing off-grid solar
energy systems to households and schools in
remote rural areas.
As far as regional power trade is concerned
and under the Northern Corridor Integration
Projects framework, a tripartite MoU was
signed between the Government of
Kenya, Uganda and Rwanda to promote
power generation and interconnection of
transmission lines in the three partner states.
As part of this initiative, Power Purchase and
Wheeling Agreements for the import of 30
MW Power from Kenya to Rwanda through
Uganda was signed in December 2014. This
power exchange is set to commence in the
last Quarter of 2015 upon commissioning of
the interconnection transmission lines of the
three countries.
On the side of the petroleum sub-sector,
the far reaching objective is to ensure
safe, sufficient, reliable, sustainable and
affordable supply of petroleum products
including LPG. So far, Rwanda continues to
depend entirely on imported fuel products,
because its petroleum resources are yet to
be commercially proven and developed.
Rwanda not only plans to expand domestic
exploration and production, but it is equally
committed to boosting investment in supply
and storage infrastructure, and promoting
sound management of downstream
resources.
The country so far imports bulk petroleum
products through the central and the
northern corridors by means of road
tankers. The existing oil depots of 30,545 m3
total capacity owned by the Government
and private operators are used to store
petroleum products that are supplied to
different retail sites as well as to various
production industries around the country.
In addition to the above mentioned existing
depots located at Gatsata (15,900 m3),
Kabuye (5,745 m3), Rwabuye (3,900 m3) and
Bigogwe (5,000m3), new petroleum storage
facilities are under construction by two
companies:
OILCOM has been erecting a storage depot
of 20,375 m3 while Société Pétrolière (SP)
has been constructing a storage depot of
21,500m3inthefirstphase,eventuallytobe
upgraded to 40,000 m3 in the second phase.
SP project is almost at 90% completion stage
whereasOILCOMLtdis inthefinalstageof
construction works.
As per the Downstream Petroleum Policy
of 2014, the Government of Rwanda is
targeting to increase the storage capacity
to 150,000 m3 by 2017/18.
Access to improved drinking water
and sanitation services is a basic
right that every citizen must enjoy.
This has been recognized globally both in
Millennium Development Goals (MDGs) that
will be concluded in 2015 and Sustainable
Development Goals (SDGs) with the target
to achieve universal access to safe drinking
water and sanitation for all by 2030.
Specifically, Rwanda acknowledges the
importance of adequate water supply and
sanitation services in the development of the
country due to their impact on environment
and public health. This was clearly stated
in various Government’s flagship policy
documents and political goals with an
ambitious target to achieve 100% service
coverage by 2017.
52 RURA ANNUAL REPORT 2014 - 2015
In the period under review, the water supply
sub-sector recorded an increase of 2.1 % in
water production and 1.4% in water supply.
Non-Revenue Water was reduced from
42% to 40%. Further improvements were
recorded in customers’ connections: in
2013/2014 the total number of customers was
138,728 and 153,580 in 2014/2015 making an
increase of 9.7%. In rural water supply, Private
Public Partnership schemes were promoted
and this resulted in the delegation of the
management of 40% of rural water systems
to private operators.
Sanitation sub-sector also recorded
developments in terms of number
of licensed operators from 9 to 18 in
solid waste collection and transportation
and from 100 to 151 in cleaning service
provision. New waste disposal facilities were
constructed in the Districts of Kamonyi,
Ruhango, Karongi and Rusizi.
5 ENERGY
5.1. LEGAL AND REGULATORY FRAMEWORK
During the period under review, RURA put in
place the following regulatory instruments:
• SolarWater Heating Regulations on 15th
February 2015 with an aim of promoting
energyefficiencyandconservation.
•AmendmentoftheElectrical Installations
Regulations
5.2. LICENSING AND MARKET PERFORMANCE
5.2.1. LICENSING
5.2.1.1. ELECTRICITY
The main licensing activities carried out
in the electricity sub-sector relate to the
licensing of electrical power generation
companies and that of Electrical Installations
Practitioners.
a) Licensing of Electrical Power Generation Projects
During the period under review, RURA issued
a 25-year license for electricity generation to
YUMN Ltd for an 80MW peat-to-power plant
in the Southern Province. Furthermore, six (6)
provisional electricity generation licenses
were issued (including 2 provisional licenses
that were extended) to allow developers to
carry out assessments, studies and any other
necessary activities prior to conducting
electricity generation activities.
b) Licensing of Electrical Installations Practitioners
The Regulations on Electrical Installations
were issued by the Regulatory Board in
October 2012 with the purpose to restrict
electrical installations to competent and
qualifiedpractitionerswhoaretobeissued
permits by RURA.
The 146 applicants who were registered
during the 1st phase in Kigali City were
examined through written and/or oral
exams to ascertain their ability to undertake
electrical installations works associated to the
class of permit applied for. In collaboration
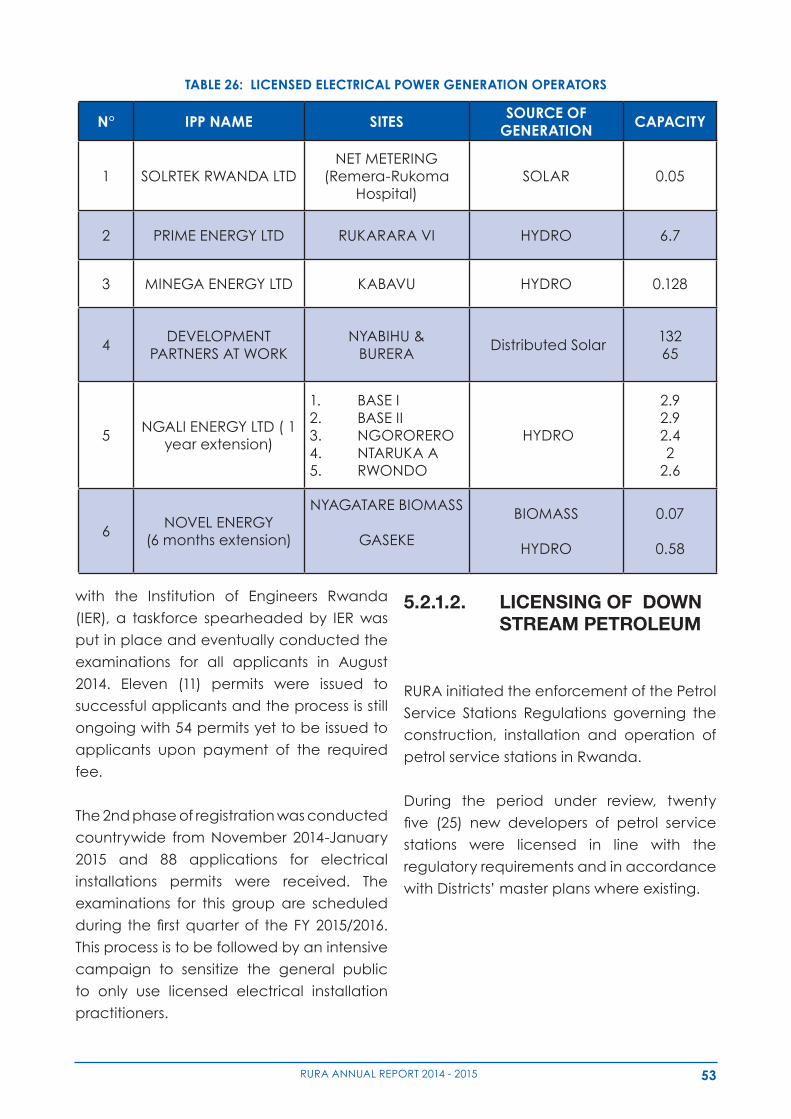
53RURA ANNUAL REPORT 2014 - 2015
TABLE 26: LICENSED ELECTRICAL POWER GENERATION OPERATORS
N° IPP NAME SITES SOURCE OF GENERATION CAPACITY
1 SOLRTEK RWANDA LTDNET METERING
(Remera-Rukoma Hospital)
SOLAR 0.05
2 PRIME ENERGY LTD RUKARARA VI HYDRO 6.7
3 MINEGA ENERGY LTD KABAVU HYDRO 0.128
4DEVELOPMENT
PARTNERS AT WORKNYABIHU &
BURERA Distributed Solar
132 65
5NGALI ENERGY LTD ( 1
year extension)
1. BASE I 2. BASE II 3. NGORORERO 4. NTARUKA A5. RWONDO
HYDRO
2.92.92.42
2.6
6NOVEL ENERGY
(6 months extension)
NYAGATARE BIOMASS
GASEKE
BIOMASS
HYDRO
0.07
0.58
with the Institution of Engineers Rwanda
(IER), a taskforce spearheaded by IER was
put in place and eventually conducted the
examinations for all applicants in August
2014. Eleven (11) permits were issued to
successful applicants and the process is still
ongoing with 54 permits yet to be issued to
applicants upon payment of the required
fee.
The 2nd phase of registration was conducted
countrywide from November 2014-January
2015 and 88 applications for electrical
installations permits were received. The
examinations for this group are scheduled
during thefirstquarterof theFY2015/2016.
This process is to be followed by an intensive
campaign to sensitize the general public
to only use licensed electrical installation
practitioners.
5.2.1.2. LICENSING OF DOWN STREAM PETROLEUM
RURA initiated the enforcement of the Petrol
Service Stations Regulations governing the
construction, installation and operation of
petrol service stations in Rwanda.
During the period under review, twenty
five (25) new developers of petrol service
stations were licensed in line with the
regulatory requirements and in accordance
with Districts’ master plans where existing.
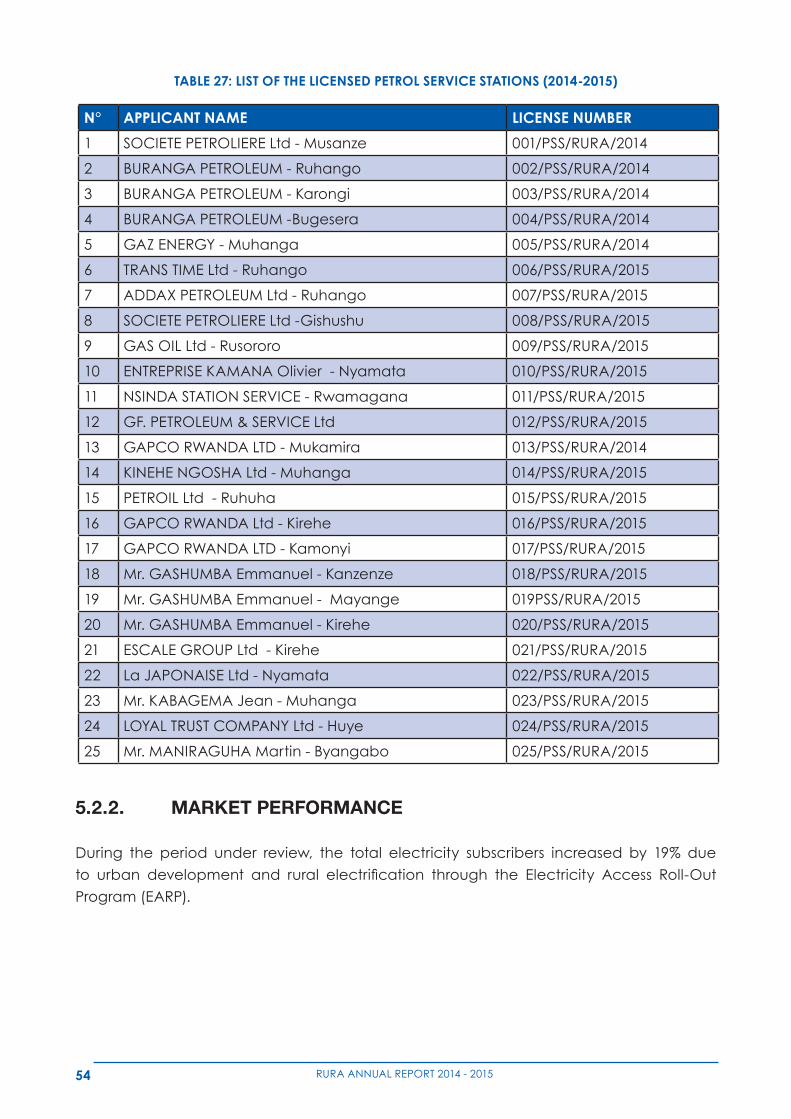
54 RURA ANNUAL REPORT 2014 - 2015
5.2.2. MARKET PERFORMANCE
During the period under review, the total electricity subscribers increased by 19% due
to urban development and rural electrification through the Electricity Access Roll-Out
Program (EARP).
TABLE 27: LIST OF THE LICENSED PETROL SERVICE STATIONS (2014-2015)
N° APPLICANT NAME LICENSE NUMBER
1 SOCIETE PETROLIERE Ltd - Musanze 001/PSS/RURA/2014
2 BURANGA PETROLEUM - Ruhango 002/PSS/RURA/2014
3 BURANGA PETROLEUM - Karongi 003/PSS/RURA/2014
4 BURANGA PETROLEUM -Bugesera 004/PSS/RURA/2014
5 GAZ ENERGY - Muhanga 005/PSS/RURA/2014
6 TRANS TIME Ltd - Ruhango 006/PSS/RURA/2015
7 ADDAX PETROLEUM Ltd - Ruhango 007/PSS/RURA/2015
8 SOCIETE PETROLIERE Ltd -Gishushu 008/PSS/RURA/2015
9 GAS OIL Ltd - Rusororo 009/PSS/RURA/2015
10 ENTREPRISE KAMANA Olivier - Nyamata 010/PSS/RURA/2015
11 NSINDA STATION SERVICE - Rwamagana 011/PSS/RURA/2015
12 GF. PETROLEUM & SERVICE Ltd 012/PSS/RURA/2015
13 GAPCO RWANDA LTD - Mukamira 013/PSS/RURA/2014
14 KINEHE NGOSHA Ltd - Muhanga 014/PSS/RURA/2015
15 PETROIL Ltd - Ruhuha 015/PSS/RURA/2015
16 GAPCO RWANDA Ltd - Kirehe 016/PSS/RURA/2015
17 GAPCO RWANDA LTD - Kamonyi 017/PSS/RURA/2015
18 Mr. GASHUMBA Emmanuel - Kanzenze 018/PSS/RURA/2015
19 Mr. GASHUMBA Emmanuel - Mayange 019PSS/RURA/2015
20 Mr. GASHUMBA Emmanuel - Kirehe 020/PSS/RURA/2015
21 ESCALE GROUP Ltd - Kirehe 021/PSS/RURA/2015
22 La JAPONAISE Ltd - Nyamata 022/PSS/RURA/2015
23 Mr. KABAGEMA Jean - Muhanga 023/PSS/RURA/2015
24 LOYAL TRUST COMPANY Ltd - Huye 024/PSS/RURA/2015
25 Mr. MANIRAGUHA Martin - Byangabo 025/PSS/RURA/2015
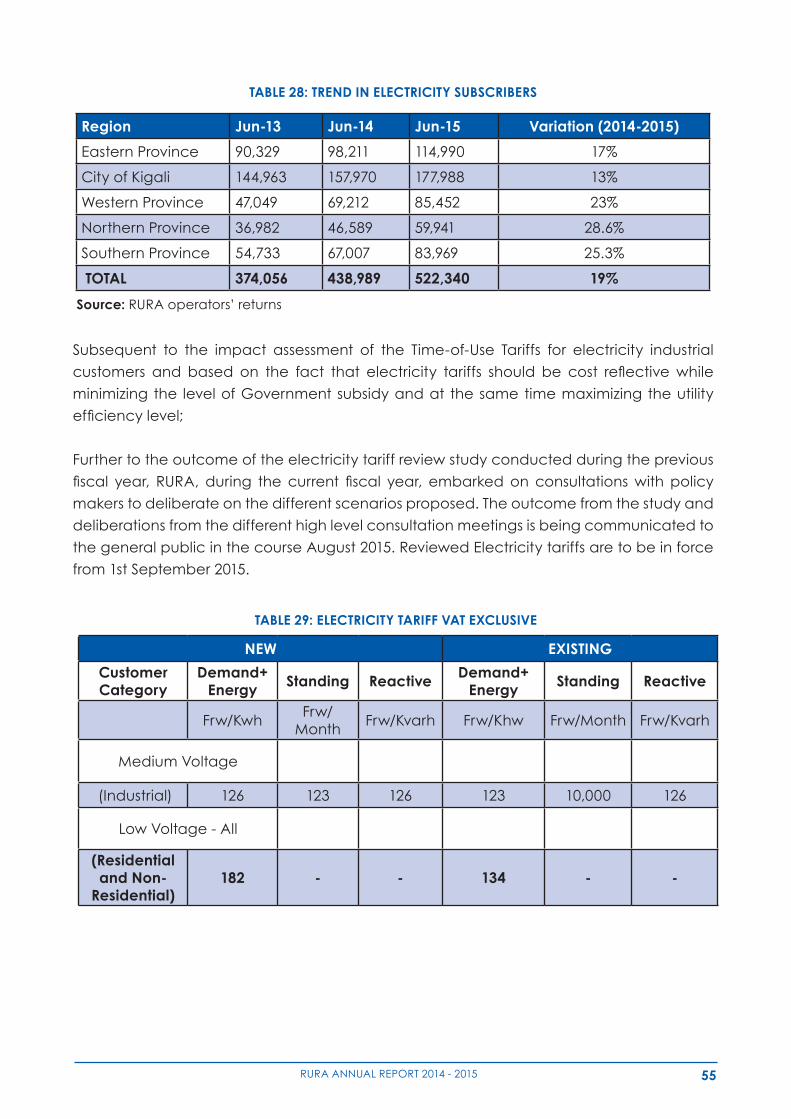
55RURA ANNUAL REPORT 2014 - 2015
TABLE 28: TREND IN ELECTRICITY SUBSCRIBERS
Region Jun-13 Jun-14 Jun-15 Variation (2014-2015)
Eastern Province 90,329 98,211 114,990 17%
City of Kigali 144,963 157,970 177,988 13%
Western Province 47,049 69,212 85,452 23%
Northern Province 36,982 46,589 59,941 28.6%
Southern Province 54,733 67,007 83,969 25.3%
TOTAL 374,056 438,989 522,340 19%
Subsequent to the impact assessment of the Time-of-Use Tariffs for electricity industrial
customers and based on the fact that electricity tariffs should be cost reflectivewhile
minimizing the level of Government subsidy and at the same time maximizing the utility
efficiencylevel;
Further to the outcome of the electricity tariff review study conducted during the previous
fiscal year, RURA, during the current fiscal year, embarkedonconsultationswith policy
makers to deliberate on the different scenarios proposed. The outcome from the study and
deliberations from the different high level consultation meetings is being communicated to
the general public in the course August 2015. Reviewed Electricity tariffs are to be in force
from 1st September 2015.
Source: RURA operators’ returns
TABLE 29: ELECTRICITY TARIFF VAT EXCLUSIVE
NEW EXISTING
Customer Category
Demand+ Energy Standing Reactive Demand+
Energy Standing Reactive
Frw/KwhFrw/
MonthFrw/Kvarh Frw/Khw Frw/Month Frw/Kvarh
Medium Voltage
(Industrial) 126 123 126 123 10,000 126
Low Voltage - All
(Residential and Non-
Residential)182 - - 134 - -
56 RURA ANNUAL REPORT 2014 - 2015
5.3. MONITORING
Within the framework of monitoring the
performance of regulated utilities and
service providers in energy sector, RURA
carried out a number of inspections and
monitoring to assess the level of quality of
service delivered to the customers.
5.3.1. ELECTRICITY
RURA is required to continuously monitor
and evaluate the technical operational
performance of the regulated utilities
with regard to reliability and quality of the
services rendered to consumers. In that line,
two inspections were carried out in Eastern
Province and Kigali City to inspect the quality
of electricity supply and services rendered
to electricity customers. The network
performance (power plants production,
network peak values, consumption statistics,
lake levels, blackouts, accidents and losses)
were also assessed on quarterly basis.
Furthermore, four inspections were carried
out to power plants that were reported to
have recurrent technical problems (Keya,
Cyimbili, Nkora, Rugezi, Mukungwa II,
Nyabahanga and Gashashi) as well as to
new power projects under development or
newly completed (Gishoma, Nyabarongo,
Gigawatt Solar, GICIYE I & II, Kivuwatt,
Rukarara II) in order to assess the situation on
ground and propose/recommend remedial
actions where required.
5.3.2. GAS, PETROLEUM AND RENEWABLE ENERGY
5.3.2.1. LAKE KIVU METHANE GAS AND INDUSTRIAL GASES
During the period under review, RURA
participated in the harmonization of
Management Prescriptions (MPs) for
Development of Lake Kivu Natural Gas
Resources.
Three technical inspections were carried
out to evaluate the progress of the on-
site construction works of methane gas
extraction and power generation plants for
the Kivu Watt project.
With regard to medical and industrial gases,
RURA organized and carried out a survey on
various sites equipped with medical piped
gas facilities and to gas manufacturing
plants, to assess the current status of installed
medical piped gas systems and to get up-to-
date information to help formulate a reliable
database of medical gases equipment
standards that will eventually contribute
to the development of the regulations on
medical gases.
5.3.2.2. DOWNSTREAM PETROLEUM
During the year under review, eighteen (18)
site inspections were carried out countrywide
to monitor the compliance with regulations’
provisions with respect to construction and
operation of petrol stations. A database of
215 existing petrol stations was developed
by recording technical data relating to
infrastructure features as well as operations.
RURA also provided technical assistance to
potential petrol stations operators by visiting
and assessing different plots proposed for
the construction of petrol stations and LPG
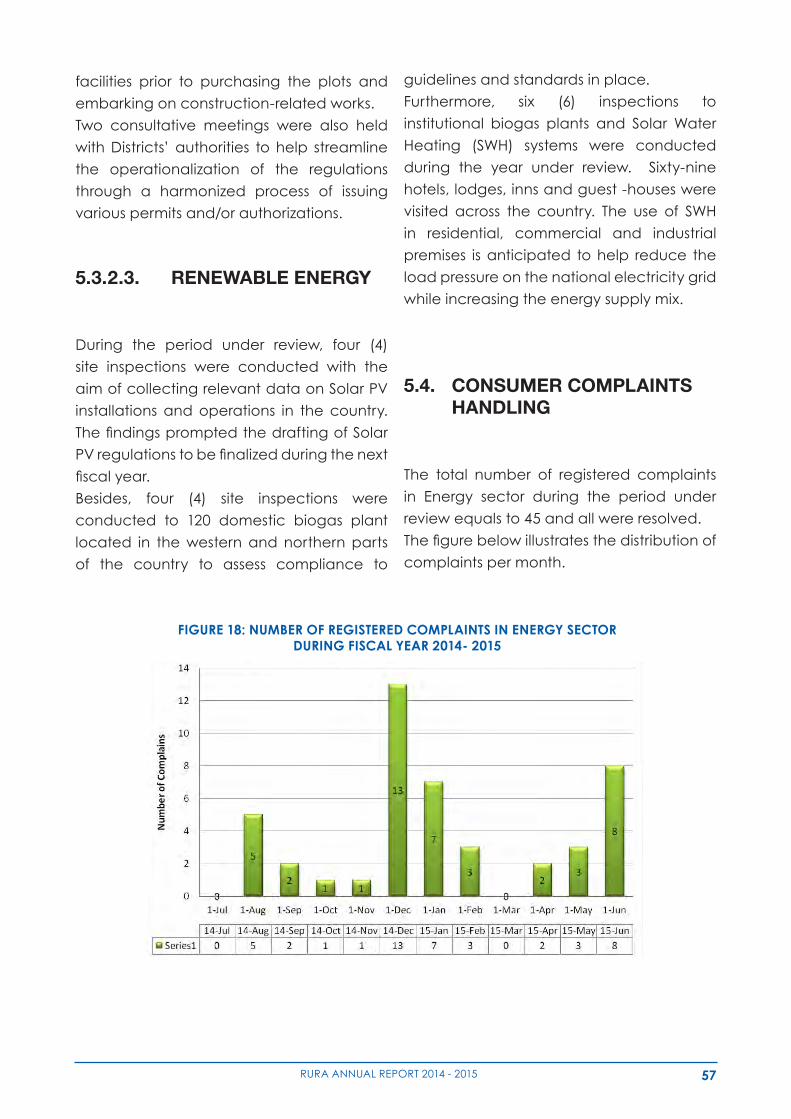
57RURA ANNUAL REPORT 2014 - 2015
facilities prior to purchasing the plots and
embarking on construction-related works.
Two consultative meetings were also held
with Districts’ authorities to help streamline
the operationalization of the regulations
through a harmonized process of issuing
various permits and/or authorizations.
5.3.2.3. RENEWABLE ENERGY
During the period under review, four (4)
site inspections were conducted with the
aim of collecting relevant data on Solar PV
installations and operations in the country.
ThefindingspromptedthedraftingofSolar
PVregulationstobefinalizedduringthenext
fiscalyear.
Besides, four (4) site inspections were
conducted to 120 domestic biogas plant
located in the western and northern parts
of the country to assess compliance to
guidelines and standards in place.
Furthermore, six (6) inspections to
institutional biogas plants and Solar Water
Heating (SWH) systems were conducted
during the year under review. Sixty-nine
hotels, lodges, inns and guest -houses were
visited across the country. The use of SWH
in residential, commercial and industrial
premises is anticipated to help reduce the
load pressure on the national electricity grid
while increasing the energy supply mix.
5.4. CONSUMER COMPLAINTS HANDLING
The total number of registered complaints
in Energy sector during the period under
review equals to 45 and all were resolved.
Thefigurebelowillustratesthedistributionof
complaints per month.
FIGURE 18: NUMBER OF REGISTERED COMPLAINTS IN ENERGY SECTOR DURING FISCAL YEAR 2014- 2015
The total number of registered complaints in Energy sector during the period under review
equals to 45 and all were resolved.
The figure below illustrates the distribution of complaints per month.
Figure 18: Number of Registered Complaints in Energy sector during fiscal year 2014-
2015
5.6. OUTSTANDING ISSUES
The main outstanding issues recorded in the Energy Sector during the reporting period consist of
the following:
• Delays in commissioning a number of projects from cheaper sources of power such as
Kivu Watt methane-to-power and Gishoma peat-to-power projects have negatively
affected the energy sector planning and that implied continuous reliance on expensive
thermal power plants to bridge the deficit in electrical power generation. These delays
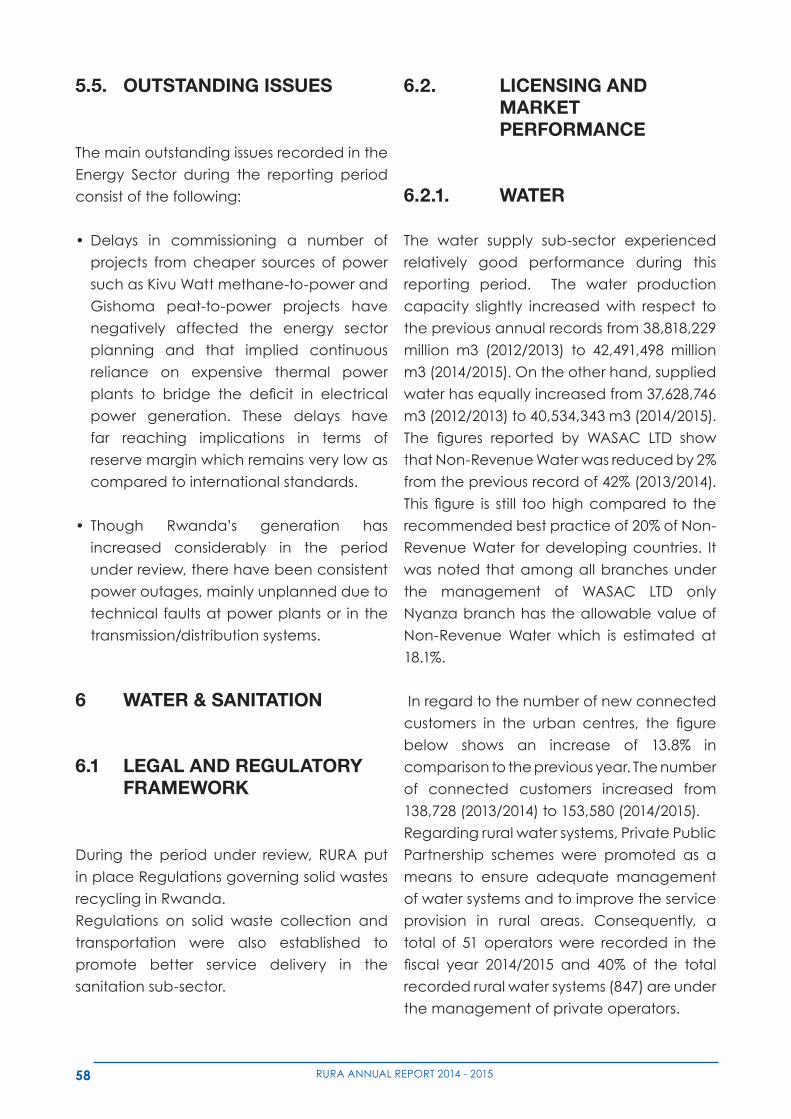
58 RURA ANNUAL REPORT 2014 - 2015
5.5. OUTSTANDING ISSUES
The main outstanding issues recorded in the
Energy Sector during the reporting period
consist of the following:
•Delays in commissioning a number of
projects from cheaper sources of power
such as Kivu Watt methane-to-power and
Gishoma peat-to-power projects have
negatively affected the energy sector
planning and that implied continuous
reliance on expensive thermal power
plants to bridge the deficit in electrical
power generation. These delays have
far reaching implications in terms of
reserve margin which remains very low as
compared to international standards.
• Though Rwanda’s generation has
increased considerably in the period
under review, there have been consistent
power outages, mainly unplanned due to
technical faults at power plants or in the
transmission/distribution systems.
6 WATER & SANITATION
6.1 LEGAL AND REGULATORY FRAMEWORK
During the period under review, RURA put
in place Regulations governing solid wastes
recycling in Rwanda.
Regulations on solid waste collection and
transportation were also established to
promote better service delivery in the
sanitation sub-sector.
6.2. LICENSING AND MARKET PERFORMANCE
6.2.1. WATER
The water supply sub-sector experienced
relatively good performance during this
reporting period. The water production
capacity slightly increased with respect to
the previous annual records from 38,818,229
million m3 (2012/2013) to 42,491,498 million
m3 (2014/2015). On the other hand, supplied
water has equally increased from 37,628,746
m3 (2012/2013) to 40,534,343 m3 (2014/2015).
The figures reported by WASAC LTD show
that Non-Revenue Water was reduced by 2%
from the previous record of 42% (2013/2014).
This figure is still toohighcompared to the
recommended best practice of 20% of Non-
Revenue Water for developing countries. It
was noted that among all branches under
the management of WASAC LTD only
Nyanza branch has the allowable value of
Non-Revenue Water which is estimated at
18.1%.
In regard to the number of new connected
customers in the urban centres, the figure
below shows an increase of 13.8% in
comparison to the previous year. The number
of connected customers increased from
138,728 (2013/2014) to 153,580 (2014/2015).
Regarding rural water systems, Private Public
Partnership schemes were promoted as a
means to ensure adequate management
of water systems and to improve the service
provision in rural areas. Consequently, a
total of 51 operators were recorded in the
fiscal year 2014/2015 and 40% of the total
recorded rural water systems (847) are under
the management of private operators.
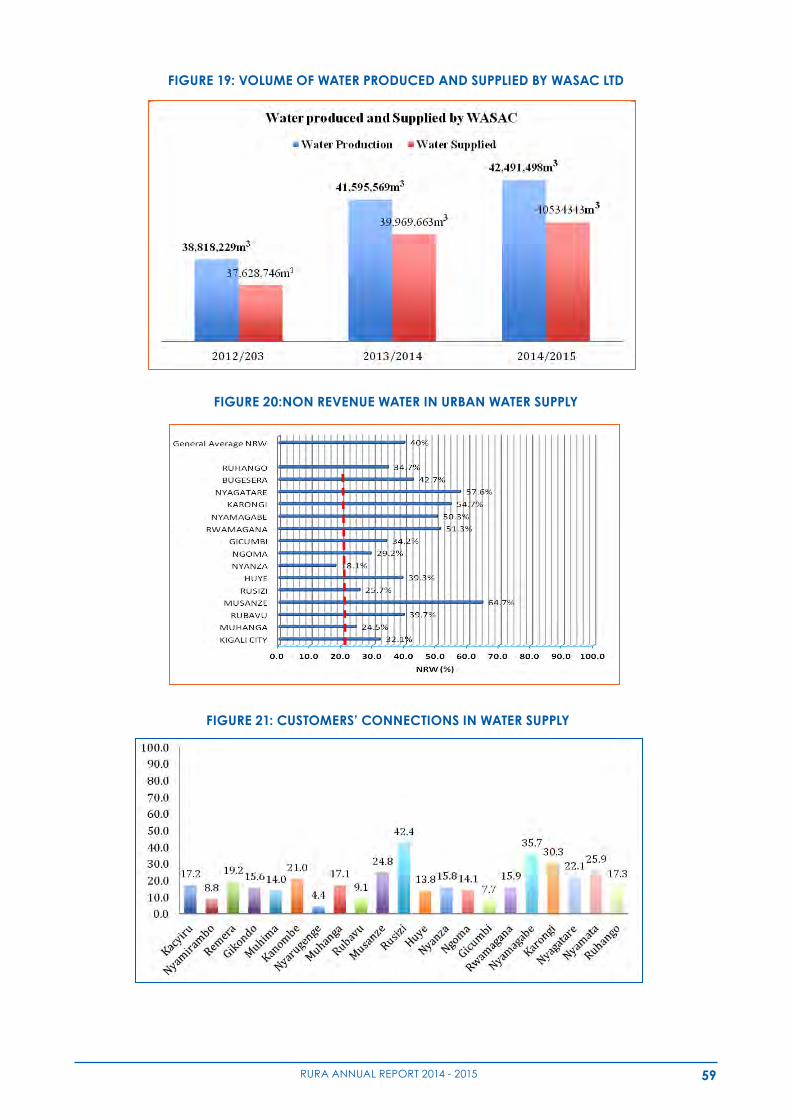
59RURA ANNUAL REPORT 2014 - 2015
FIGURE 19: VOLUME OF WATER PRODUCED AND SUPPLIED BY WASAC LTD
During the period under review, RURA put in place Regulations governing solid wastes
recycling in Rwanda.
Regulations on solid waste collection and transportation were also established to promote better
service delivery in the sanitation sub-sector.
6.3. LICENSING AND MARKET PERFORMANCE
6.3.1. WATER
The water supply sub-sector experienced relatively good performance during this reporting
period. The water production capacity slightly increased with respect to the previous annual
records from 38,818,229 million m3 (2012/2013) to 42,491,498 million m3 (2014/2015). On the
other hand, supplied water has equally increased from 37,628,746 m3 (2012/2013) to 40,534,343
m3 (2014/2015).
Figure 19: Volume of water produced and supplied by WASAC LTD
The figures reported by WASAC LTD show that Non-Revenue Water was reduced by 2% from
the previous record of 42% (2013/2014). This figure is still too high compared to the
recommended best practice of 20% of Non-Revenue Water for developing countries. It was
FIGURE 20:NON REVENUE WATER IN URBAN WATER SUPPLYnoted that among all branches under the management of WASAC LTD only Nyanza branch has
the allowable value of Non-Revenue Water which is estimated at 18.1%.
Figure 20:Non Revenue Water in urban water supply
In regard to the number of new connected customers in the urban centres, the figure below shows
an increase of 13.8% in comparison to the previous year. The number of connected customers
increased from 138,728 (2013/2014) to 153,580 (2014/2015).
Figure 21: Customers' connections in water supply
FIGURE 21: CUSTOMERS’ CONNECTIONS IN WATER SUPPLY
noted that among all branches under the management of WASAC LTD only Nyanza branch has
the allowable value of Non-Revenue Water which is estimated at 18.1%.
Figure 20:Non Revenue Water in urban water supply
In regard to the number of new connected customers in the urban centres, the figure below shows
an increase of 13.8% in comparison to the previous year. The number of connected customers
increased from 138,728 (2013/2014) to 153,580 (2014/2015).
Figure 21: Customers' connections in water supply
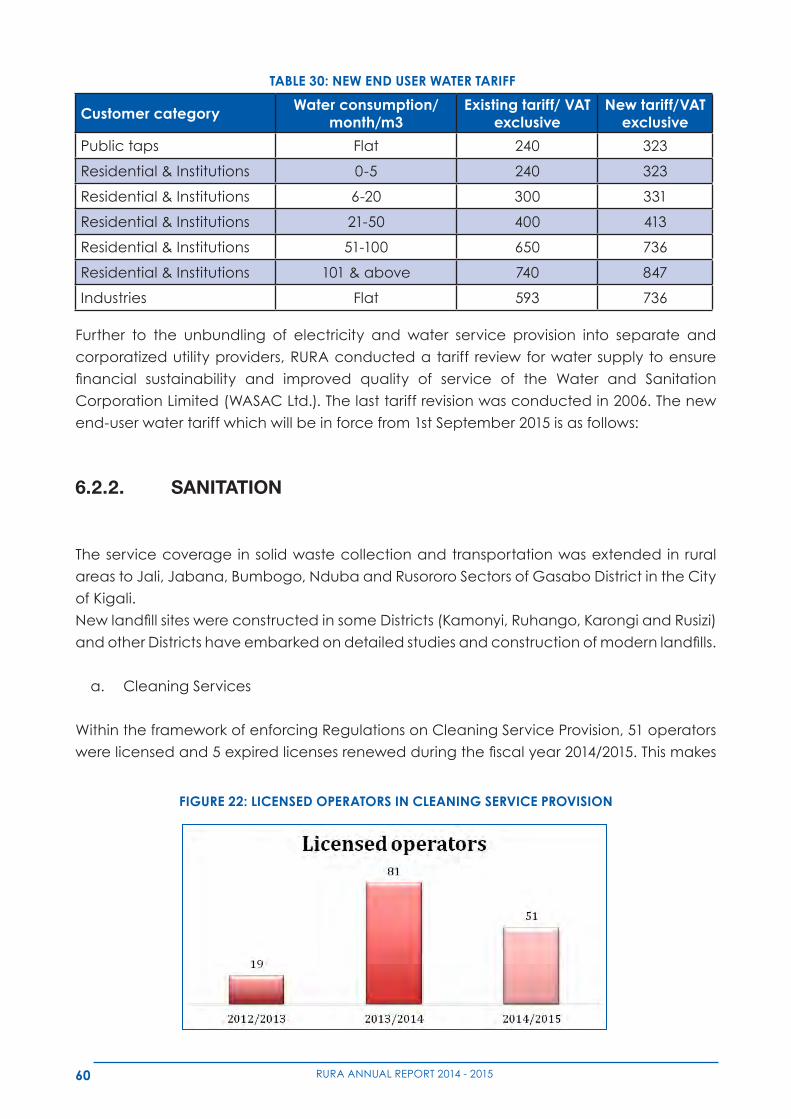
60 RURA ANNUAL REPORT 2014 - 2015
Further to the unbundling of electricity and water service provision into separate and
corporatized utility providers, RURA conducted a tariff review for water supply to ensure
financial sustainability and improved quality of service of the Water and Sanitation
Corporation Limited (WASAC Ltd.). The last tariff revision was conducted in 2006. The new
end-user water tariff which will be in force from 1st September 2015 is as follows:
6.2.2. SANITATION
The service coverage in solid waste collection and transportation was extended in rural
areas to Jali, Jabana, Bumbogo, Nduba and Rusororo Sectors of Gasabo District in the City
of Kigali.
NewlandfillsiteswereconstructedinsomeDistricts(Kamonyi,Ruhango,KarongiandRusizi)
andotherDistrictshaveembarkedondetailedstudiesandconstructionofmodernlandfills.
a. Cleaning Services
Within the framework of enforcing Regulations on Cleaning Service Provision, 51 operators
werelicensedand5expiredlicensesrenewedduringthefiscalyear2014/2015.Thismakes
TABLE 30: NEW END USER WATER TARIFF
Customer category Water consumption/month/m3
Existing tariff/ VAT exclusive
New tariff/VAT exclusive
Public taps Flat 240 323
Residential & Institutions 0-5 240 323
Residential & Institutions 6-20 300 331
Residential & Institutions 21-50 400 413
Residential & Institutions 51-100 650 736
Residential & Institutions 101 & above 740 847
Industries Flat 593 736
FIGURE 22: LICENSED OPERATORS IN CLEANING SERVICE PROVISION
a. Cleaning Services
Within the framework of enforcing Regulations on Cleaning Service Provision, 51 operators
were licensed and 5 expired licenses renewed during the fiscal year 2014/2015. This makes a
total of 151 licensed operators in cleaning service provision since 2012/2013 when the licensing
process started.
Figure 22: Licensed operators in cleaning service provision
The licensed cleaning service operators are distributed throughout the country with the majority
(79%) of them being based in the City of Kigali as illustrated in the table below.
Table 31: Distribution of licensed operators per region
Provinces / City
of Kigali
City of
Kigali
Eastern
Province
Western
Province
Northern
Province
Southern
Province
TOTAL
Number of
licensed
operators
120 9 2 10 10 151
Percentage 79.49% 5.96% 1.32% 6.62% 6.62% 100%
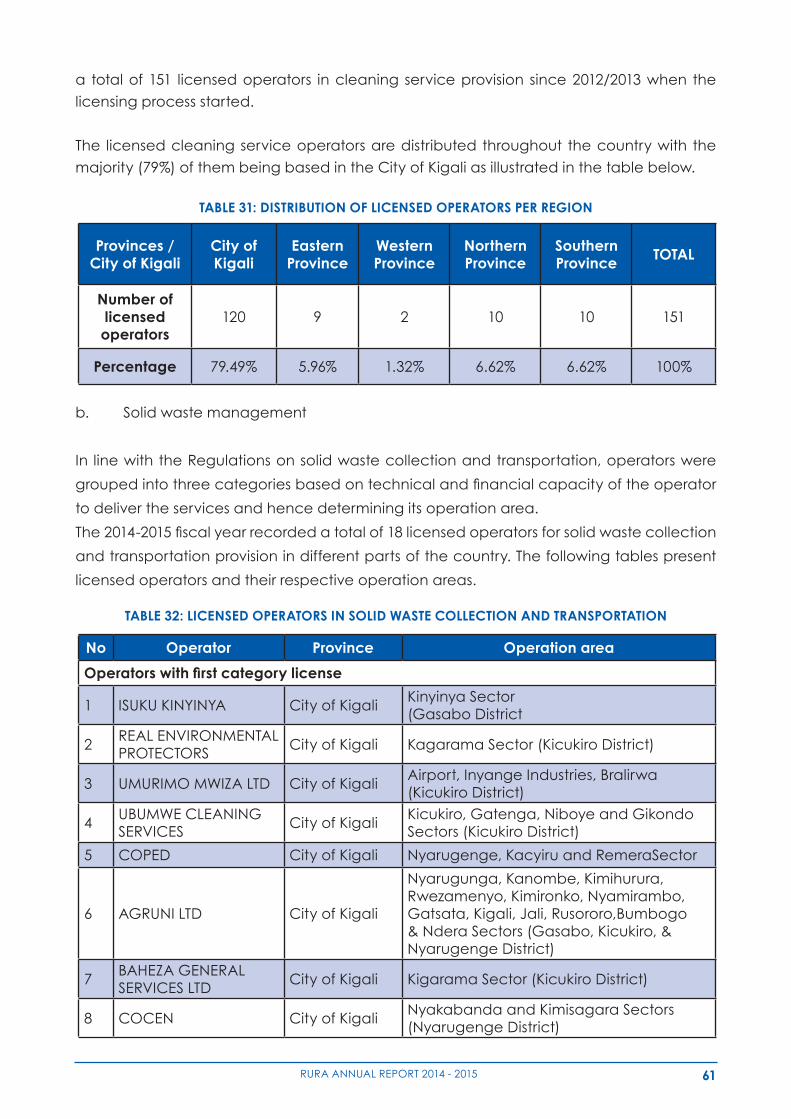
61RURA ANNUAL REPORT 2014 - 2015
a total of 151 licensed operators in cleaning service provision since 2012/2013 when the
licensing process started.
The licensed cleaning service operators are distributed throughout the country with the
majority (79%) of them being based in the City of Kigali as illustrated in the table below.
TABLE 31: DISTRIBUTION OF LICENSED OPERATORS PER REGION
Provinces / City of Kigali
City of Kigali
Eastern Province
Western Province
Northern Province
Southern Province TOTAL
Number of licensed operators
120 9 2 10 10 151
Percentage 79.49% 5.96% 1.32% 6.62% 6.62% 100%
b. Solid waste management
In line with the Regulations on solid waste collection and transportation, operators were
groupedintothreecategoriesbasedontechnicalandfinancialcapacityoftheoperator
to deliver the services and hence determining its operation area.
The2014-2015fiscalyearrecordedatotalof18licensedoperatorsforsolidwastecollection
and transportation provision in different parts of the country. The following tables present
licensed operators and their respective operation areas.
TABLE 32: LICENSED OPERATORS IN SOLID WASTE COLLECTION AND TRANSPORTATION
No Operator Province Operation area
Operatorswithfirstcategorylicense
1 ISUKU KINYINYA City of KigaliKinyinya Sector (Gasabo District
2REAL ENVIRONMENTAL PROTECTORS
City of Kigali Kagarama Sector (Kicukiro District)
3 UMURIMO MWIZA LTD City of KigaliAirport, Inyange Industries, Bralirwa (Kicukiro District)
4UBUMWE CLEANING SERVICES
City of KigaliKicukiro, Gatenga, Niboye and Gikondo Sectors (Kicukiro District)
5 COPED City of Kigali Nyarugenge, Kacyiru and RemeraSector
6 AGRUNI LTD City of Kigali
Nyarugunga, Kanombe, Kimihurura, Rwezamenyo, Kimironko, Nyamirambo, Gatsata, Kigali, Jali, Rusororo,Bumbogo & Ndera Sectors (Gasabo, Kicukiro, & Nyarugenge District)
7BAHEZA GENERAL SERVICES LTD
City of Kigali Kigarama Sector (Kicukiro District)
8 COCEN City of KigaliNyakabanda and Kimisagara Sectors (Nyarugenge District)
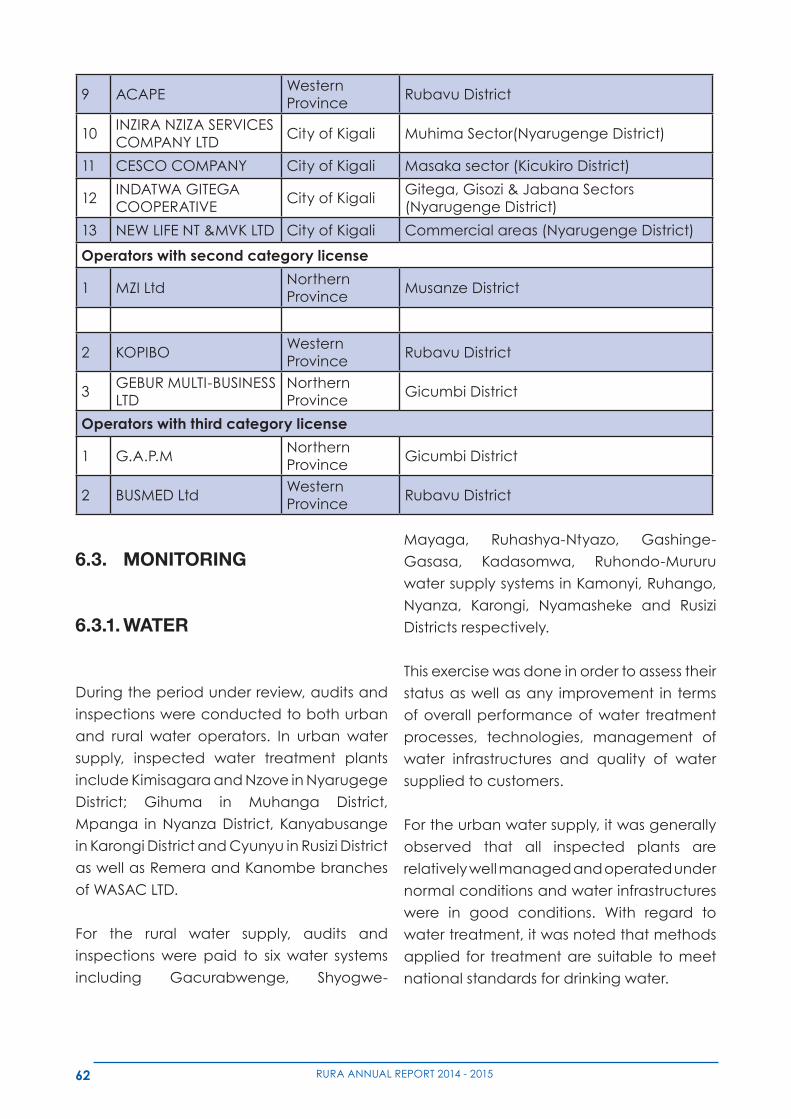
62 RURA ANNUAL REPORT 2014 - 2015
6.3. MONITORING
6.3.1. WATER
During the period under review, audits and
inspections were conducted to both urban
and rural water operators. In urban water
supply, inspected water treatment plants
include Kimisagara and Nzove in Nyarugege
District; Gihuma in Muhanga District,
Mpanga in Nyanza District, Kanyabusange
in Karongi District and Cyunyu in Rusizi District
as well as Remera and Kanombe branches
of WASAC LTD.
For the rural water supply, audits and
inspections were paid to six water systems
including Gacurabwenge, Shyogwe-
Mayaga, Ruhashya-Ntyazo, Gashinge-
Gasasa, Kadasomwa, Ruhondo-Mururu
water supply systems in Kamonyi, Ruhango,
Nyanza, Karongi, Nyamasheke and Rusizi
Districts respectively.
This exercise was done in order to assess their
status as well as any improvement in terms
of overall performance of water treatment
processes, technologies, management of
water infrastructures and quality of water
supplied to customers.
For the urban water supply, it was generally
observed that all inspected plants are
relatively well managed and operated under
normal conditions and water infrastructures
were in good conditions. With regard to
water treatment, it was noted that methods
applied for treatment are suitable to meet
national standards for drinking water.
9 ACAPE Western Province
Rubavu District
10INZIRA NZIZA SERVICES COMPANY LTD
City of Kigali Muhima Sector(Nyarugenge District)
11 CESCO COMPANY City of Kigali Masaka sector (Kicukiro District)
12INDATWA GITEGA COOPERATIVE
City of Kigali Gitega, Gisozi & Jabana Sectors (Nyarugenge District)
13 NEW LIFE NT &MVK LTD City of Kigali Commercial areas (Nyarugenge District)
Operators with second category license
1 MZI LtdNorthern Province
Musanze District
2 KOPIBO Western Province
Rubavu District
3GEBUR MULTI-BUSINESS LTD
Northern Province
Gicumbi District
Operators with third category license
1 G.A.P.MNorthern Province
Gicumbi District
2 BUSMED LtdWestern Province
Rubavu District
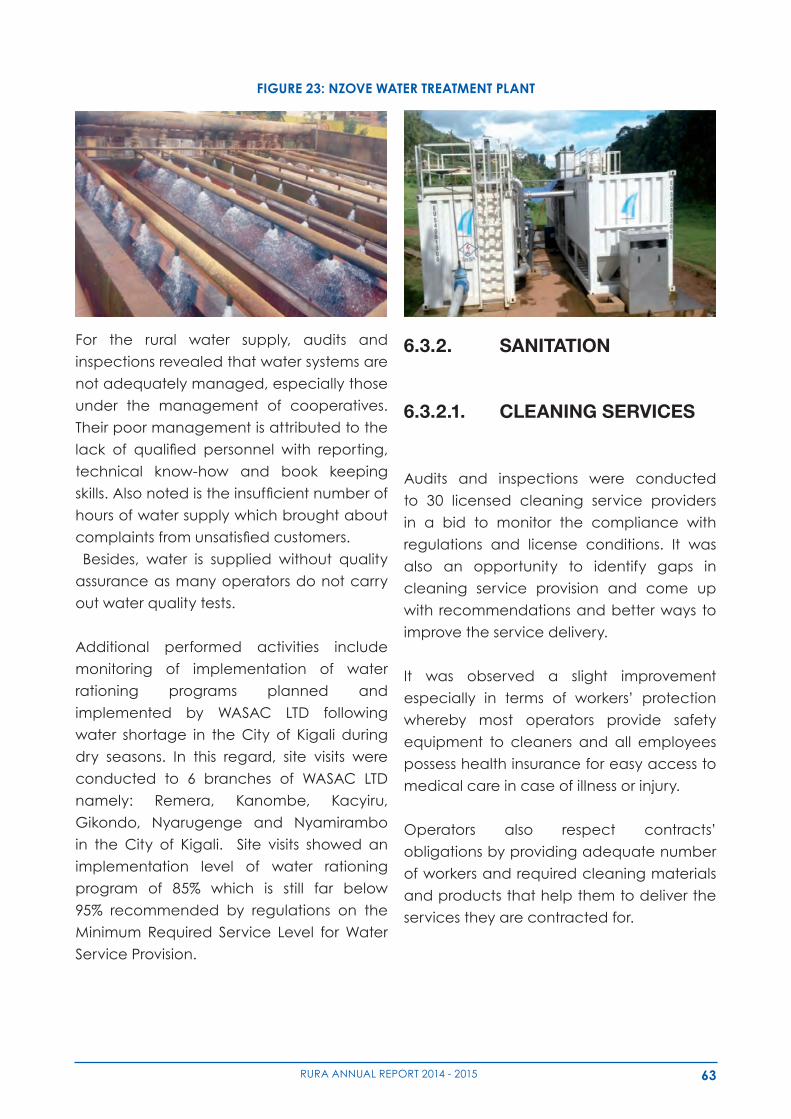
63RURA ANNUAL REPORT 2014 - 2015
FIGURE 23: NZOVE WATER TREATMENT PLANT
For the rural water supply, audits and
inspections revealed that water systems are
not adequately managed, especially those
under the management of cooperatives.
Their poor management is attributed to the
lack of qualified personnel with reporting,
technical know-how and book keeping
skills.Alsonotedistheinsufficientnumberof
hours of water supply which brought about
complaintsfromunsatisfiedcustomers.
Besides, water is supplied without quality
assurance as many operators do not carry
out water quality tests.
Additional performed activities include
monitoring of implementation of water
rationing programs planned and
implemented by WASAC LTD following
water shortage in the City of Kigali during
dry seasons. In this regard, site visits were
conducted to 6 branches of WASAC LTD
namely: Remera, Kanombe, Kacyiru,
Gikondo, Nyarugenge and Nyamirambo
in the City of Kigali. Site visits showed an
implementation level of water rationing
program of 85% which is still far below
95% recommended by regulations on the
Minimum Required Service Level for Water
Service Provision.
6.3.2. SANITATION
6.3.2.1. CLEANING SERVICES
Audits and inspections were conducted
to 30 licensed cleaning service providers
in a bid to monitor the compliance with
regulations and license conditions. It was
also an opportunity to identify gaps in
cleaning service provision and come up
with recommendations and better ways to
improve the service delivery.
It was observed a slight improvement
especially in terms of workers’ protection
whereby most operators provide safety
equipment to cleaners and all employees
possess health insurance for easy access to
medical care in case of illness or injury.
Operators also respect contracts’
obligations by providing adequate number
of workers and required cleaning materials
and products that help them to deliver the
services they are contracted for.
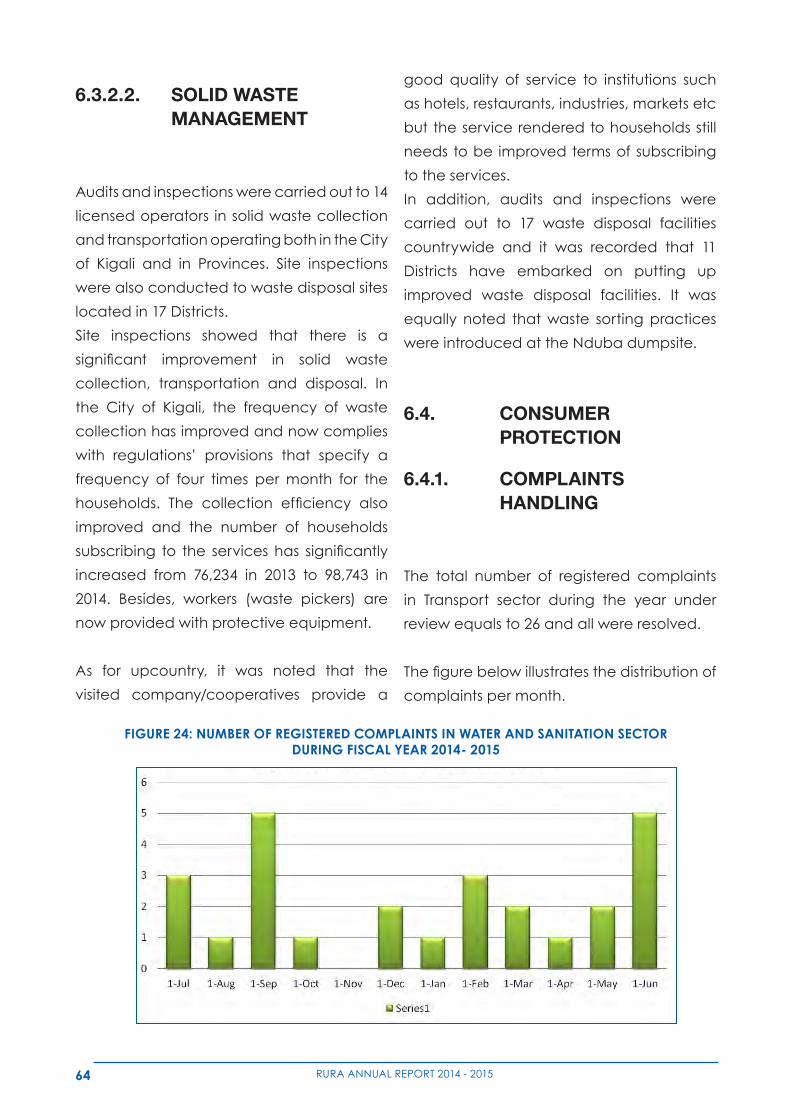
64 RURA ANNUAL REPORT 2014 - 2015
6.3.2.2. SOLID WASTE MANAGEMENT
Audits and inspections were carried out to 14
licensed operators in solid waste collection
and transportation operating both in the City
of Kigali and in Provinces. Site inspections
were also conducted to waste disposal sites
located in 17 Districts.
Site inspections showed that there is a
significant improvement in solid waste
collection, transportation and disposal. In
the City of Kigali, the frequency of waste
collection has improved and now complies
with regulations’ provisions that specify a
frequency of four times per month for the
households. The collection efficiency also
improved and the number of households
subscribing to the serviceshas significantly
increased from 76,234 in 2013 to 98,743 in
2014. Besides, workers (waste pickers) are
now provided with protective equipment.
As for upcountry, it was noted that the
visited company/cooperatives provide a
good quality of service to institutions such
as hotels, restaurants, industries, markets etc
but the service rendered to households still
needs to be improved terms of subscribing
to the services.
In addition, audits and inspections were
carried out to 17 waste disposal facilities
countrywide and it was recorded that 11
Districts have embarked on putting up
improved waste disposal facilities. It was
equally noted that waste sorting practices
were introduced at the Nduba dumpsite.
6.4. CONSUMER PROTECTION
6.4.1. COMPLAINTS HANDLING
The total number of registered complaints
in Transport sector during the year under
review equals to 26 and all were resolved.
Thefigurebelowillustratesthedistributionof
complaints per month.
FIGURE 24: NUMBER OF REGISTERED COMPLAINTS IN WATER AND SANITATION SECTOR DURING FISCAL YEAR 2014- 2015
Figure 24: Number of Registered Complaints in Water and Sanitation Sector during fiscal
year 2014- 2015
6.5.2. Inspections and Review of Contracts between Consumers and Operators
Contracts between operators and consumers were analysed and amended where necessary. This
aimed at improving the quality of service and reducing consumer complaints by removing
abusive clauses. This exercise is now leading to a model contract.
In Sanitation, inspections were performed in order to monitor the compliance of regularity of
service providers in collecting and transportation of solid waste.
6.6. OUTSTANDING ISSUES
Sector outstanding issues recorded within the year under review consist of the following:
• High non-revenue water recorded in urban water supply;
• Challenge relating to water quality control in rural areas;
• Insufficient water production especially in urban areas where the demand is not met.
7. CONCLUSIONS AND WAY FORWARD
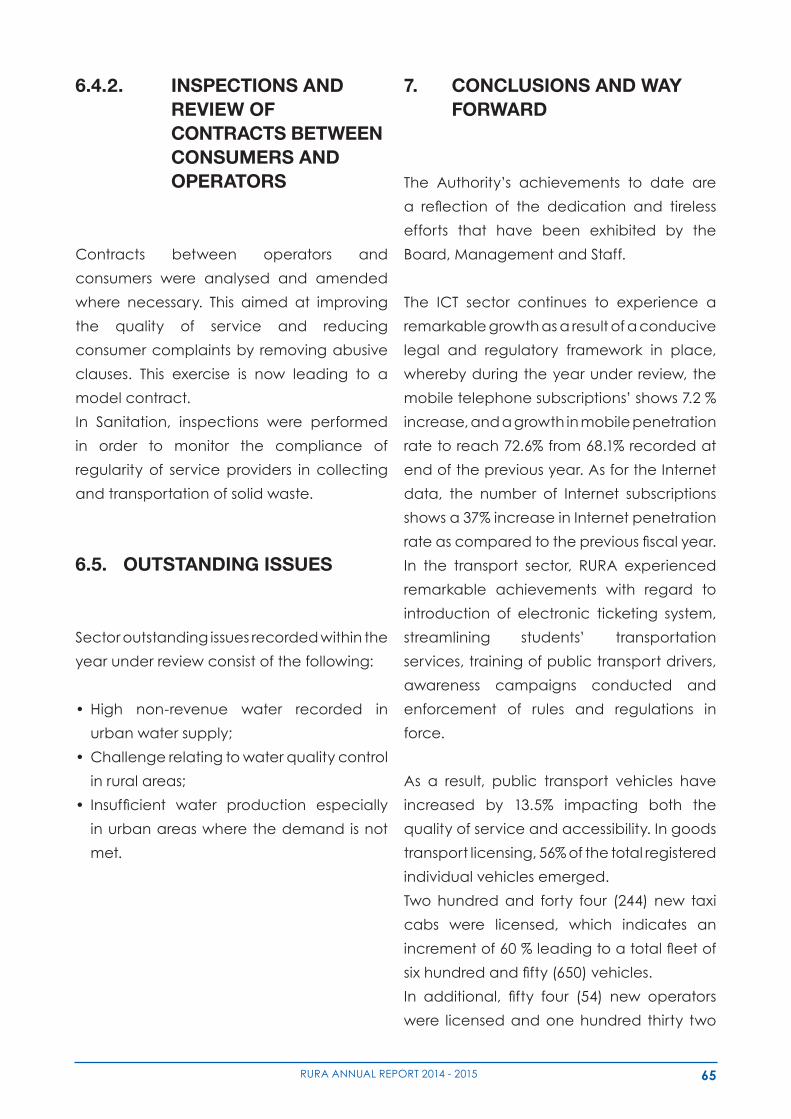
65RURA ANNUAL REPORT 2014 - 2015
6.4.2. INSPECTIONS AND REVIEW OF CONTRACTS BETWEEN CONSUMERS AND OPERATORS
Contracts between operators and
consumers were analysed and amended
where necessary. This aimed at improving
the quality of service and reducing
consumer complaints by removing abusive
clauses. This exercise is now leading to a
model contract.
In Sanitation, inspections were performed
in order to monitor the compliance of
regularity of service providers in collecting
and transportation of solid waste.
6.5. OUTSTANDING ISSUES
Sector outstanding issues recorded within the
year under review consist of the following:
•High non-revenue water recorded in
urban water supply;
•Challengerelatingtowaterqualitycontrol
in rural areas;
• Insufficient water production especially
in urban areas where the demand is not
met.
7. CONCLUSIONS AND WAY FORWARD
The Authority’s achievements to date are
a reflection of the dedication and tireless
efforts that have been exhibited by the
Board, Management and Staff.
The ICT sector continues to experience a
remarkable growth as a result of a conducive
legal and regulatory framework in place,
whereby during the year under review, the
mobile telephone subscriptions’ shows 7.2 %
increase, and a growth in mobile penetration
rate to reach 72.6% from 68.1% recorded at
end of the previous year. As for the Internet
data, the number of Internet subscriptions
shows a 37% increase in Internet penetration
rateascomparedtothepreviousfiscalyear.
In the transport sector, RURA experienced
remarkable achievements with regard to
introduction of electronic ticketing system,
streamlining students’ transportation
services, training of public transport drivers,
awareness campaigns conducted and
enforcement of rules and regulations in
force.
As a result, public transport vehicles have
increased by 13.5% impacting both the
quality of service and accessibility. In goods
transport licensing, 56% of the total registered
individual vehicles emerged.
Two hundred and forty four (244) new taxi
cabs were licensed, which indicates an
incrementof60%leadingtoatotalfleetof
sixhundredandfifty(650)vehicles.
In additional, fifty four (54) new operators
were licensed and one hundred thirty two
66 RURA ANNUAL REPORT 2014 - 2015
(132) authorizations were renewed in water
ways transport.
In the Energy, Water and Sanitation Sector,
the following regulatory instruments were
put in place: Solar Water Heating Regulations
withanaimofpromotingenergyefficiency
and conservation and amendment of the
electrical installations regulations.
Authority issued a 25-year license for
electricity generation to YUMN Ltd for an
80MW peat-to-power plant in the Southern
Province.
Furthermore, within the framework of
enforcing Regulations six (6) provisional
electricity generation licenses were issued
to allow developers to carry out assessments
and studies prior to conducting electricity
generation activities, twenty five (25) new
developers of petrol service stations were
licensed and 51 operators in cleaning
Service were licensed
Going forward, the Authority shall continue
to create opportunities that will facilitate
and expand the diversity of choices and
quality of services for the public utilities. In so
doing, the Authority shall consider the pros
and cons of introducing and implementing
the programs which are anticipated in the
nextfiscalyear:
In the ICT sector, the management promised
the establishment of a well-designed
online short codes management system,
assessing the technology trend and plan
for future frequency, finalize and enforce
the regulations on type approval and
importation of electronic communication
equipment, establishment of cost based
transmission fee for Digital Terrestrial TV in
Rwanda, implementation of the guidelines
for fiber optic cables underground
installation, establishment of regulatory
security guidelines for telecommunication
networks in Rwanda, Establishment of
National Cyber Security Strategic Plan,
Implementation of EAC harmonized short
codes, Implementation of an integrated
finance and administration information
systems, Put in place licensing regime and
regulations governing broadcasting services
in Rwanda and enforce related international
standards.
In the Transport Sector, Authority will
enhance the monitoring and enforcement
of transport regulations in Road transport
subsector, electronic ticketing, and issuance
of vocational cards to public transport
drivers, participate in developing transport
law & regulations and country wide sensitize
goods transport operators to work jointly
under either cooperatives or company.
In the Energy, Water and Sanitation Sector,
RURA will focus in Public Education and
sensitization on regulatory mandate in
sanitation, harmonization of the best
regulatory practices with regional regulatory
bodies, issuance of licenses to electricity
operators, implementation of the electricity
QoS regulations, acquisition of appropriate
instruments for technical inspections
and creation of appropriate regulatory
frameworks for Petroleum and Renewable
energy sector.
RURA will continue to support different
projects through Universal Access Fund,
67RURA ANNUAL REPORT 2014 - 2015
those are support to MINEDUC for
connecting schools in rural and underserved
areas on broadband internet Services,
subsidizing bandwidth acquisition to rural
communities where Operator’s networks
are not available, also shall support VIZIYO
Project: Providing ICT tools (4G/LTE) in rural
and remote areas of the country.
In additional, Authority shall collaborate with
wider stakeholders to ensure Independence,
Accountability, Transparency and Firmness.

68 RURA ANNUAL REPORT 2014 - 2015

69RURA ANNUAL REPORT 2014 - 2015
ANNEXES
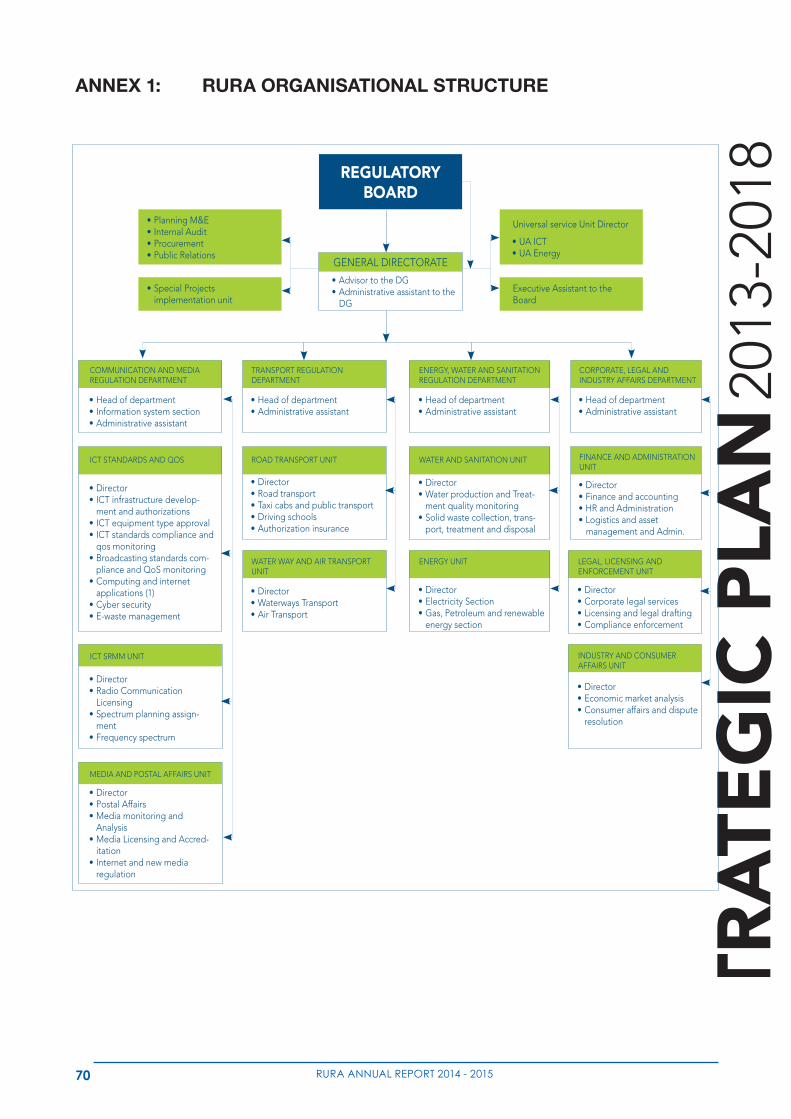
70 RURA ANNUAL REPORT 2014 - 2015
ANNEX 1: RURA ORGANISATIONAL STRUCTURE
STRATEGIC PLAN 2013-2018
17
STR
ATE
GIC
PLA
N20
13-2
018
Figure 2: Organizational Chart
REGULATORY BOARD
GENERAL DIRECTORATE
•Advisor to the DG•Administrative assistant to the DG
•UA ICT•UA Energy
•Head of department•Information system section•Administrative assistant
•Director•ICT infrastructure develop-
ment and authorizations•ICT equipment type approval•ICT standards compliance and
qos monitoring•Broadcasting standards com-
pliance and QoS monitoring•Computing and internet
applications (1)•Cyber security•E-waste management
•Director•Radio Communication
Licensing•Spectrum planning assign-
ment•Frequency spectrum
•Director•Postal Affairs•Media monitoring and
Analysis•Media Licensing and Accred-
itation•Internet and new media
regulation
•Head of department•Administrative assistant
•Director•Road transport•Taxi cabs and public transport•Driving schools•Authorization insurance
•Director•Waterways Transport•Air Transport
•Head of department•Administrative assistant
•Director•Water production and Treat-
ment quality monitoring•Solid waste collection, trans-
port, treatment and disposal
•Director•Electricity Section•Gas, Petroleum and renewable
energy section
•Director•Corporate legal services•Licensing and legal drafting•Compliance enforcement
•Director•Economic market analysis•Consumer affairs and dispute
resolution
•Head of department•Administrative assistant
•Director•Finance and accounting•HR and Administration•Logistics and asset management and Admin.
Universal service Unit Director
COMMUNICATION AND MEDIA REGULATION DEPARTMENT
ICT STANDARDS AND QOS
ICT SRMM UNIT
MEDIA AND POSTAL AFFAIRS UNIT
TRANSPORT REGULATION DEPARTMENT
ROAD TRANSPORT UNIT
WATER WAY AND AIR TRANSPORT UNIT
ENERGY, WATER AND SANITATION REGULATION DEPARTMENT
WATER AND SANITATION UNIT
ENERGY UNIT LEGAL, LICENSING AND ENFORCEMENT UNIT
INDUSTRY AND CONSUMER AFFAIRS UNIT
CORPORATE, LEGAL AND INDUSTRY AFFAIRS DEPARTMENT
FINANCE AND ADMINISTRATION UNIT
Executive Assistant to the Board
•Planning M&E•Internal Audit•Procurement•Public Relations
•Special Projects implementation unit
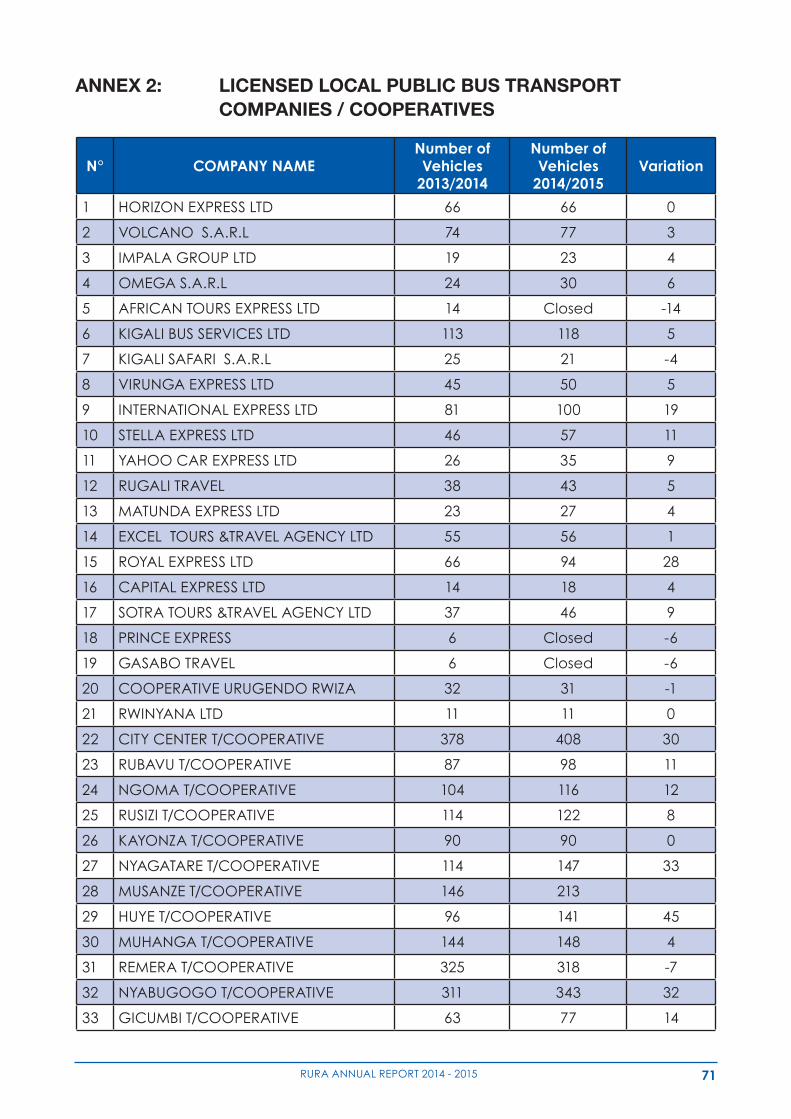
71RURA ANNUAL REPORT 2014 - 2015
ANNEX 2: LICENSED LOCAL PUBLIC BUS TRANSPORT COMPANIES / COOPERATIVES
N° COMPANY NAMENumber of Vehicles
2013/2014
Number of Vehicles
2014/2015Variation
1 HORIZON EXPRESS LTD 66 66 0
2 VOLCANO S.A.R.L 74 77 3
3 IMPALA GROUP LTD 19 23 4
4 OMEGA S.A.R.L 24 30 6
5 AFRICAN TOURS EXPRESS LTD 14 Closed -14
6 KIGALI BUS SERVICES LTD 113 118 5
7 KIGALI SAFARI S.A.R.L 25 21 -4
8 VIRUNGA EXPRESS LTD 45 50 5
9 INTERNATIONAL EXPRESS LTD 81 100 19
10 STELLA EXPRESS LTD 46 57 11
11 YAHOO CAR EXPRESS LTD 26 35 9
12 RUGALI TRAVEL 38 43 5
13 MATUNDA EXPRESS LTD 23 27 4
14 EXCEL TOURS &TRAVEL AGENCY LTD 55 56 1
15 ROYAL EXPRESS LTD 66 94 28
16 CAPITAL EXPRESS LTD 14 18 4
17 SOTRA TOURS &TRAVEL AGENCY LTD 37 46 9
18 PRINCE EXPRESS 6 Closed -6
19 GASABO TRAVEL 6 Closed -6
20 COOPERATIVE URUGENDO RWIZA 32 31 -1
21 RWINYANA LTD 11 11 0
22 CITY CENTER T/COOPERATIVE 378 408 30
23 RUBAVU T/COOPERATIVE 87 98 11
24 NGOMA T/COOPERATIVE 104 116 12
25 RUSIZI T/COOPERATIVE 114 122 8
26 KAYONZA T/COOPERATIVE 90 90 0
27 NYAGATARE T/COOPERATIVE 114 147 33
28 MUSANZE T/COOPERATIVE 146 213
29 HUYE T/COOPERATIVE 96 141 45
30 MUHANGA T/COOPERATIVE 144 148 4
31 REMERA T/COOPERATIVE 325 318 -7
32 NYABUGOGO T/COOPERATIVE 311 343 32
33 GICUMBI T/COOPERATIVE 63 77 14
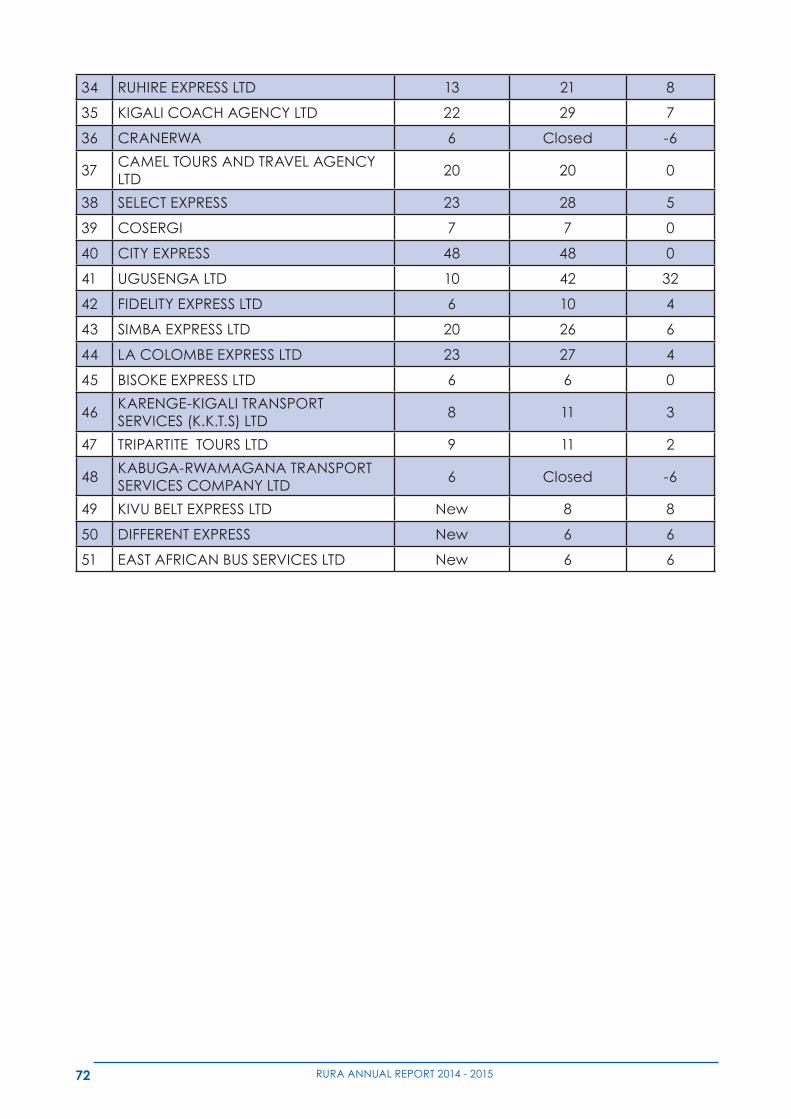
72 RURA ANNUAL REPORT 2014 - 2015
34 RUHIRE EXPRESS LTD 13 21 8
35 KIGALI COACH AGENCY LTD 22 29 7
36 CRANERWA 6 Closed -6
37CAMEL TOURS AND TRAVEL AGENCY LTD
20 20 0
38 SELECT EXPRESS 23 28 5
39 COSERGI 7 7 0
40 CITY EXPRESS 48 48 0
41 UGUSENGA LTD 10 42 32
42 FIDELITY EXPRESS LTD 6 10 4
43 SIMBA EXPRESS LTD 20 26 6
44 LA COLOMBE EXPRESS LTD 23 27 4
45 BISOKE EXPRESS LTD 6 6 0
46KARENGE-KIGALI TRANSPORT SERVICES (K.K.T.S) LTD
8 11 3
47 TRIPARTITE TOURS LTD 9 11 2
48KABUGA-RWAMAGANA TRANSPORT SERVICES COMPANY LTD
6 Closed -6
49 KIVU BELT EXPRESS LTD New 8 8
50 DIFFERENT EXPRESS New 6 6
51 EAST AFRICAN BUS SERVICES LTD New 6 6
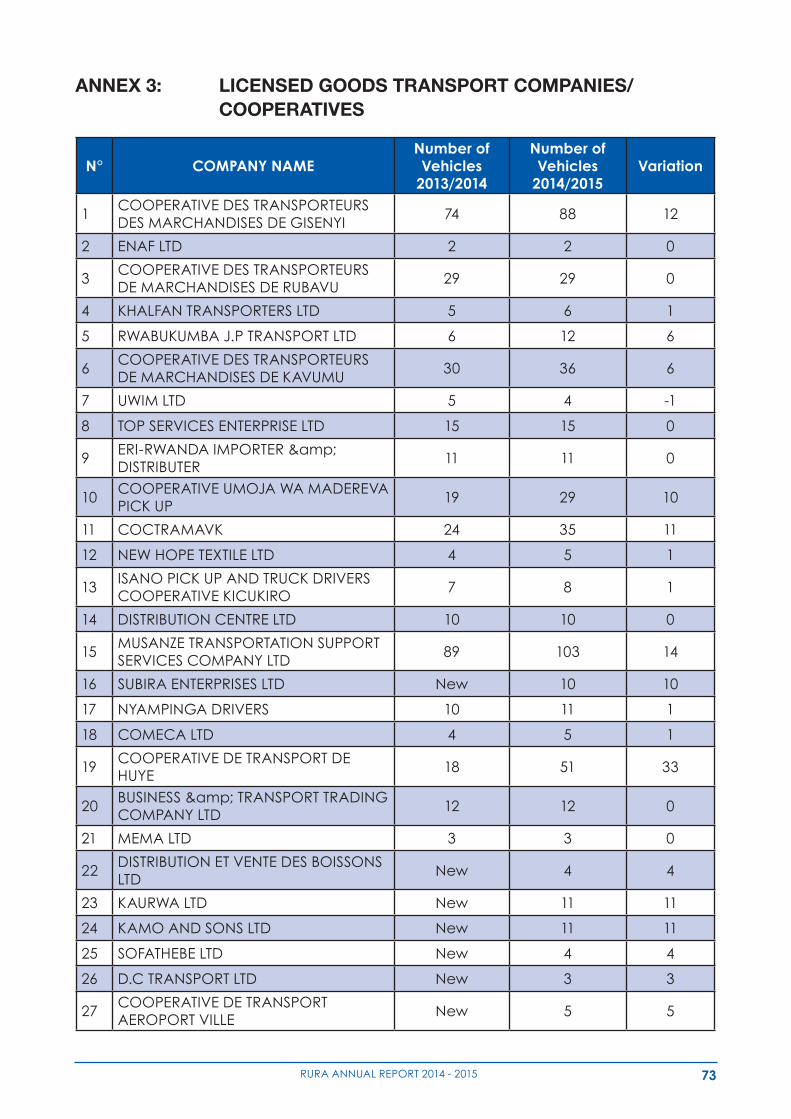
73RURA ANNUAL REPORT 2014 - 2015
ANNEX 3: LICENSED GOODS TRANSPORT COMPANIES/ COOPERATIVES
N° COMPANY NAMENumber of Vehicles
2013/2014
Number of Vehicles
2014/2015Variation
1COOPERATIVE DES TRANSPORTEURS DES MARCHANDISES DE GISENYI
74 88 12
2 ENAF LTD 2 2 0
3COOPERATIVE DES TRANSPORTEURS DE MARCHANDISES DE RUBAVU
29 29 0
4 KHALFAN TRANSPORTERS LTD 5 6 1
5 RWABUKUMBA J.P TRANSPORT LTD 6 12 6
6COOPERATIVE DES TRANSPORTEURS DE MARCHANDISES DE KAVUMU
30 36 6
7 UWIM LTD 5 4 -1
8 TOP SERVICES ENTERPRISE LTD 15 15 0
9ERI-RWANDA IMPORTER & DISTRIBUTER
11 11 0
10COOPERATIVE UMOJA WA MADEREVA PICK UP
19 29 10
11 COCTRAMAVK 24 35 11
12 NEW HOPE TEXTILE LTD 4 5 1
13ISANO PICK UP AND TRUCK DRIVERS COOPERATIVE KICUKIRO
7 8 1
14 DISTRIBUTION CENTRE LTD 10 10 0
15MUSANZE TRANSPORTATION SUPPORT SERVICES COMPANY LTD
89 103 14
16 SUBIRA ENTERPRISES LTD New 10 10
17 NYAMPINGA DRIVERS 10 11 1
18 COMECA LTD 4 5 1
19COOPERATIVE DE TRANSPORT DE HUYE
18 51 33
20BUSINESS & TRANSPORT TRADING COMPANY LTD
12 12 0
21 MEMA LTD 3 3 0
22DISTRIBUTION ET VENTE DES BOISSONS LTD
New 4 4
23 KAURWA LTD New 11 11
24 KAMO AND SONS LTD New 11 11
25 SOFATHEBE LTD New 4 4
26 D.C TRANSPORT LTD New 3 3
27COOPERATIVE DE TRANSPORT AEROPORT VILLE
New 5 5
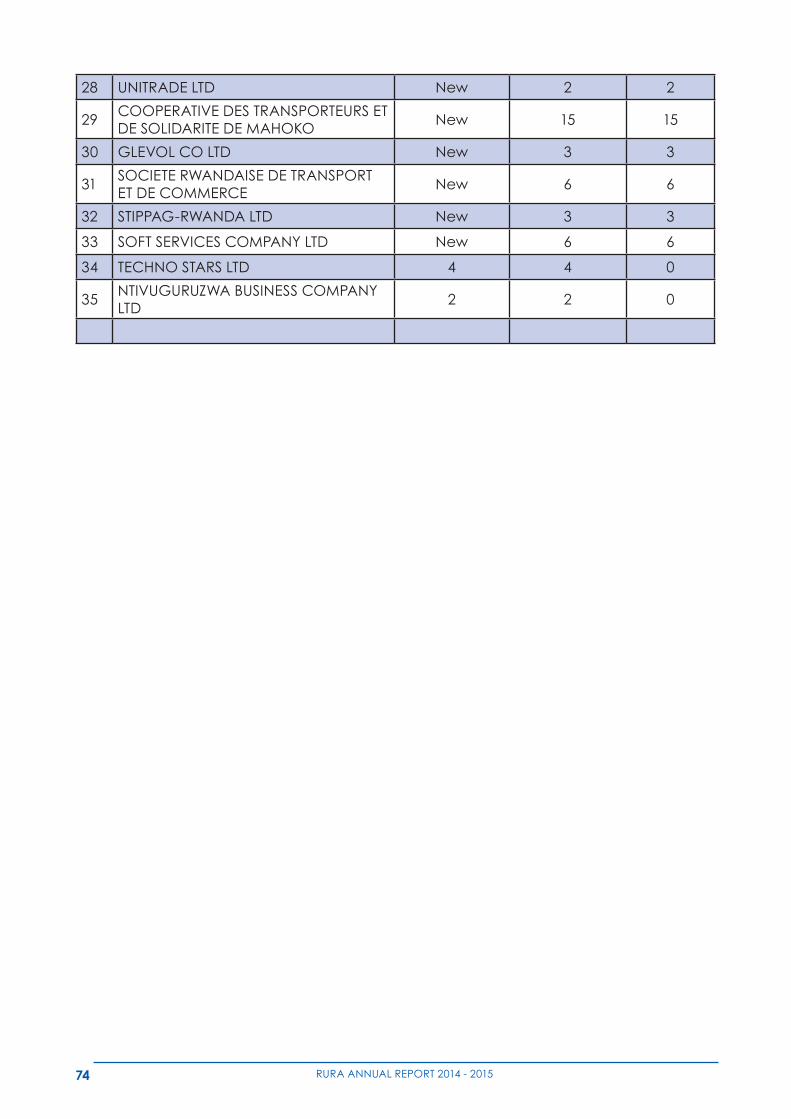
74 RURA ANNUAL REPORT 2014 - 2015
28 UNITRADE LTD New 2 2
29COOPERATIVE DES TRANSPORTEURS ET DE SOLIDARITE DE MAHOKO
New 15 15
30 GLEVOL CO LTD New 3 3
31SOCIETE RWANDAISE DE TRANSPORT ET DE COMMERCE
New 6 6
32 STIPPAG-RWANDA LTD New 3 3
33 SOFT SERVICES COMPANY LTD New 6 6
34 TECHNO STARS LTD 4 4 0
35NTIVUGURUZWA BUSINESS COMPANY LTD
2 2 0
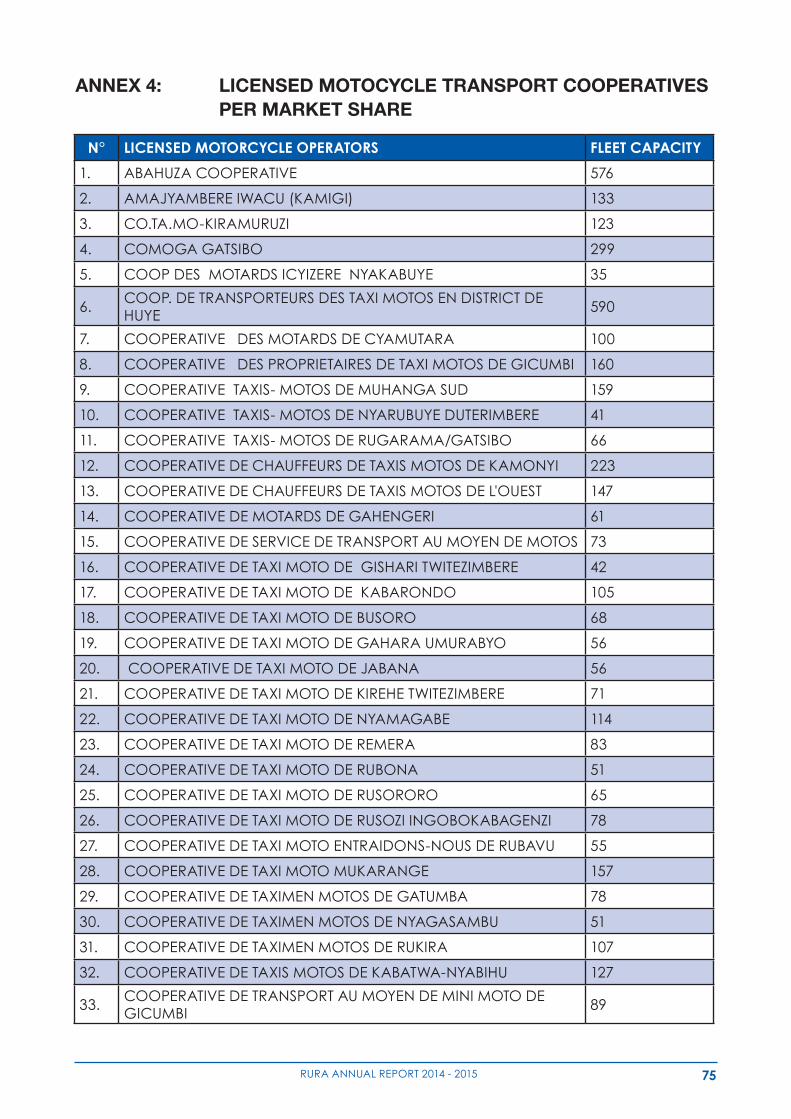
75RURA ANNUAL REPORT 2014 - 2015
ANNEX 4: LICENSED MOTOCYCLE TRANSPORT COOPERATIVES PER MARKET SHARE
N° LICENSED MOTORCYCLE OPERATORS FLEET CAPACITY
1. ABAHUZA COOPERATIVE 576
2. AMAJYAMBERE IWACU (KAMIGI) 133
3. CO.TA.MO-KIRAMURUZI 123
4. COMOGA GATSIBO 299
5. COOP DES MOTARDS ICYIZERE NYAKABUYE 35
6.COOP. DE TRANSPORTEURS DES TAXI MOTOS EN DISTRICT DE HUYE
590
7. COOPERATIVE DES MOTARDS DE CYAMUTARA 100
8. COOPERATIVE DES PROPRIETAIRES DE TAXI MOTOS DE GICUMBI 160
9. COOPERATIVE TAXIS- MOTOS DE MUHANGA SUD 159
10. COOPERATIVE TAXIS- MOTOS DE NYARUBUYE DUTERIMBERE 41
11. COOPERATIVE TAXIS- MOTOS DE RUGARAMA/GATSIBO 66
12. COOPERATIVE DE CHAUFFEURS DE TAXIS MOTOS DE KAMONYI 223
13. COOPERATIVE DE CHAUFFEURS DE TAXIS MOTOS DE L'OUEST 147
14. COOPERATIVE DE MOTARDS DE GAHENGERI 61
15. COOPERATIVE DE SERVICE DE TRANSPORT AU MOYEN DE MOTOS 73
16. COOPERATIVE DE TAXI MOTO DE GISHARI TWITEZIMBERE 42
17. COOPERATIVE DE TAXI MOTO DE KABARONDO 105
18. COOPERATIVE DE TAXI MOTO DE BUSORO 68
19. COOPERATIVE DE TAXI MOTO DE GAHARA UMURABYO 56
20. COOPERATIVE DE TAXI MOTO DE JABANA 56
21. COOPERATIVE DE TAXI MOTO DE KIREHE TWITEZIMBERE 71
22. COOPERATIVE DE TAXI MOTO DE NYAMAGABE 114
23. COOPERATIVE DE TAXI MOTO DE REMERA 83
24. COOPERATIVE DE TAXI MOTO DE RUBONA 51
25. COOPERATIVE DE TAXI MOTO DE RUSORORO 65
26. COOPERATIVE DE TAXI MOTO DE RUSOZI INGOBOKABAGENZI 78
27. COOPERATIVE DE TAXI MOTO ENTRAIDONS-NOUS DE RUBAVU 55
28. COOPERATIVE DE TAXI MOTO MUKARANGE 157
29. COOPERATIVE DE TAXIMEN MOTOS DE GATUMBA 78
30. COOPERATIVE DE TAXIMEN MOTOS DE NYAGASAMBU 51
31. COOPERATIVE DE TAXIMEN MOTOS DE RUKIRA 107
32. COOPERATIVE DE TAXIS MOTOS DE KABATWA-NYABIHU 127
33.COOPERATIVE DE TRANSPORT AU MOYEN DE MINI MOTO DE GICUMBI
89
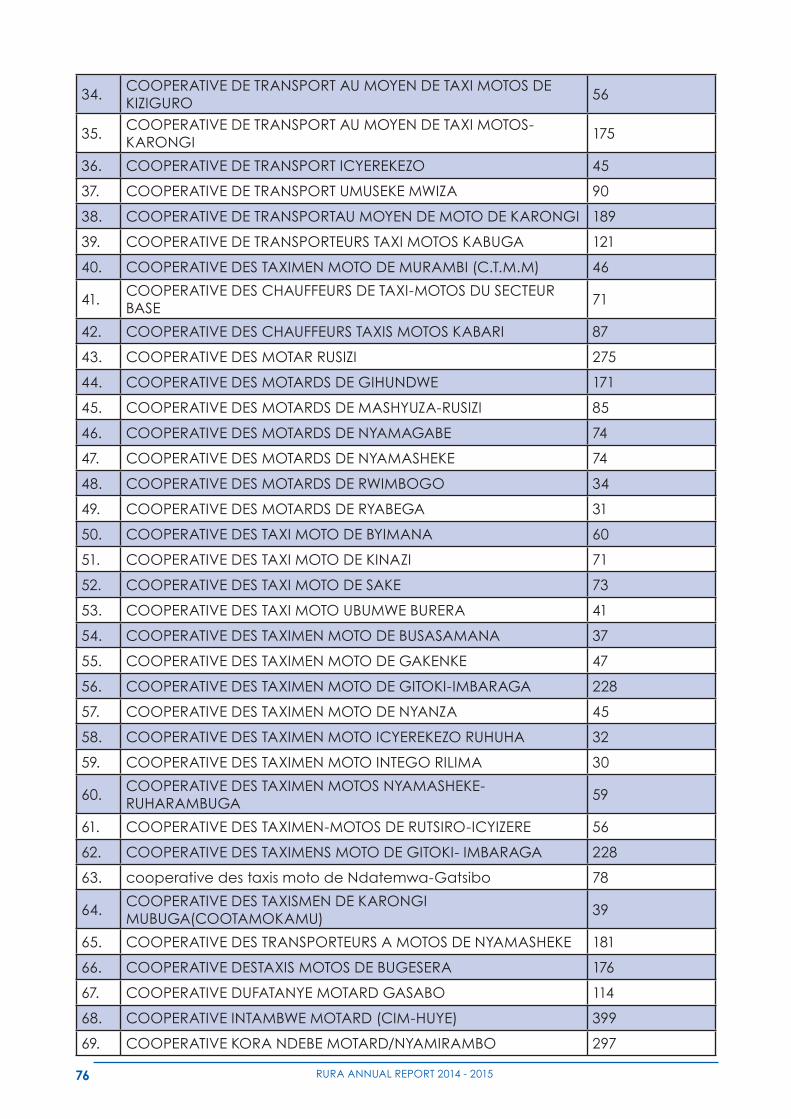
76 RURA ANNUAL REPORT 2014 - 2015
34.COOPERATIVE DE TRANSPORT AU MOYEN DE TAXI MOTOS DE KIZIGURO
56
35.COOPERATIVE DE TRANSPORT AU MOYEN DE TAXI MOTOS-KARONGI
175
36. COOPERATIVE DE TRANSPORT ICYEREKEZO 45
37. COOPERATIVE DE TRANSPORT UMUSEKE MWIZA 90
38. COOPERATIVE DE TRANSPORTAU MOYEN DE MOTO DE KARONGI 189
39. COOPERATIVE DE TRANSPORTEURS TAXI MOTOS KABUGA 121
40. COOPERATIVE DES TAXIMEN MOTO DE MURAMBI (C.T.M.M) 46
41.COOPERATIVE DES CHAUFFEURS DE TAXI-MOTOS DU SECTEUR BASE
71
42. COOPERATIVE DES CHAUFFEURS TAXIS MOTOS KABARI 87
43. COOPERATIVE DES MOTAR RUSIZI 275
44. COOPERATIVE DES MOTARDS DE GIHUNDWE 171
45. COOPERATIVE DES MOTARDS DE MASHYUZA-RUSIZI 85
46. COOPERATIVE DES MOTARDS DE NYAMAGABE 74
47. COOPERATIVE DES MOTARDS DE NYAMASHEKE 74
48. COOPERATIVE DES MOTARDS DE RWIMBOGO 34
49. COOPERATIVE DES MOTARDS DE RYABEGA 31
50. COOPERATIVE DES TAXI MOTO DE BYIMANA 60
51. COOPERATIVE DES TAXI MOTO DE KINAZI 71
52. COOPERATIVE DES TAXI MOTO DE SAKE 73
53. COOPERATIVE DES TAXI MOTO UBUMWE BURERA 41
54. COOPERATIVE DES TAXIMEN MOTO DE BUSASAMANA 37
55. COOPERATIVE DES TAXIMEN MOTO DE GAKENKE 47
56. COOPERATIVE DES TAXIMEN MOTO DE GITOKI-IMBARAGA 228
57. COOPERATIVE DES TAXIMEN MOTO DE NYANZA 45
58. COOPERATIVE DES TAXIMEN MOTO ICYEREKEZO RUHUHA 32
59. COOPERATIVE DES TAXIMEN MOTO INTEGO RILIMA 30
60.COOPERATIVE DES TAXIMEN MOTOS NYAMASHEKE-RUHARAMBUGA
59
61. COOPERATIVE DES TAXIMEN-MOTOS DE RUTSIRO-ICYIZERE 56
62. COOPERATIVE DES TAXIMENS MOTO DE GITOKI- IMBARAGA 228
63. cooperative des taxis moto de Ndatemwa-Gatsibo 78
64.COOPERATIVE DES TAXISMEN DE KARONGI MUBUGA(COOTAMOKAMU)
39
65. COOPERATIVE DES TRANSPORTEURS A MOTOS DE NYAMASHEKE 181
66. COOPERATIVE DESTAXIS MOTOS DE BUGESERA 176
67. COOPERATIVE DUFATANYE MOTARD GASABO 114
68. COOPERATIVE INTAMBWE MOTARD (CIM-HUYE) 399
69. COOPERATIVE KORA NDEBE MOTARD/NYAMIRAMBO 297
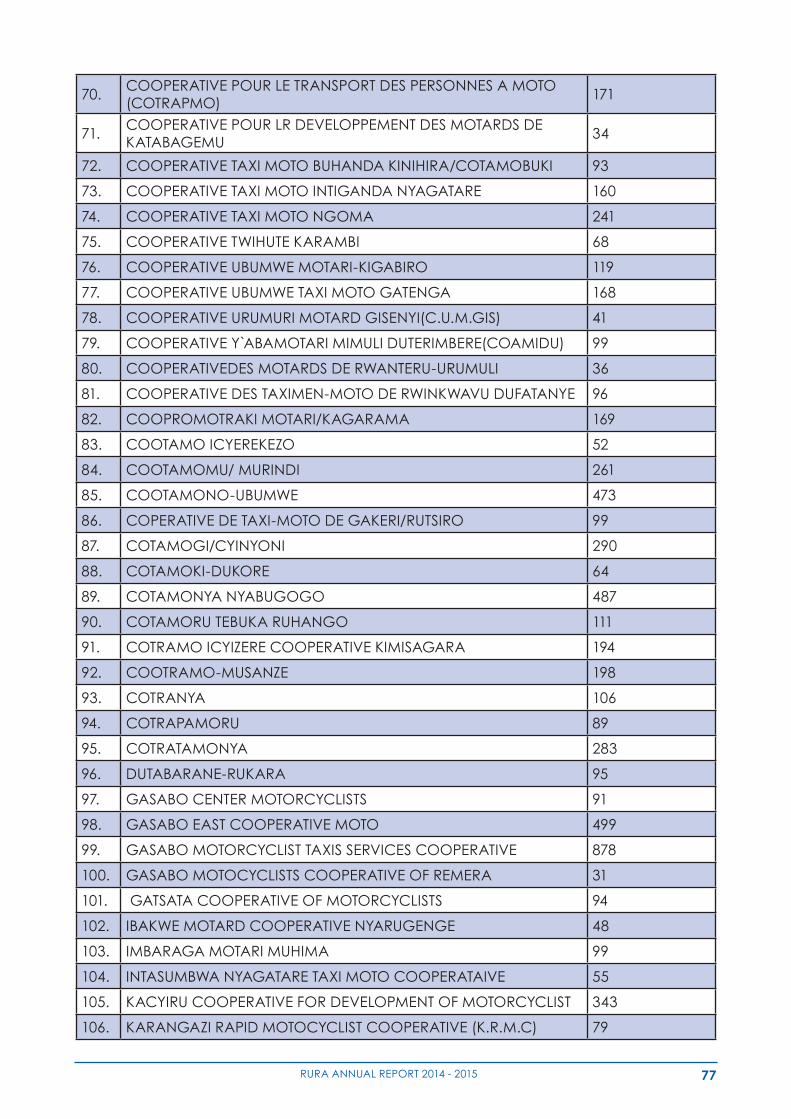
77RURA ANNUAL REPORT 2014 - 2015
70.COOPERATIVE POUR LE TRANSPORT DES PERSONNES A MOTO (COTRAPMO)
171
71.COOPERATIVE POUR LR DEVELOPPEMENT DES MOTARDS DE KATABAGEMU
34
72. COOPERATIVE TAXI MOTO BUHANDA KINIHIRA/COTAMOBUKI 93
73. COOPERATIVE TAXI MOTO INTIGANDA NYAGATARE 160
74. COOPERATIVE TAXI MOTO NGOMA 241
75. COOPERATIVE TWIHUTE KARAMBI 68
76. COOPERATIVE UBUMWE MOTARI-KIGABIRO 119
77. COOPERATIVE UBUMWE TAXI MOTO GATENGA 168
78. COOPERATIVE URUMURI MOTARD GISENYI(C.U.M.GIS) 41
79. COOPERATIVE Y ABAMOTARI MIMULI DUTERIMBERE(COAMIDU) 99
80. COOPERATIVEDES MOTARDS DE RWANTERU-URUMULI 36
81. COOPERATIVE DES TAXIMEN-MOTO DE RWINKWAVU DUFATANYE 96
82. COOPROMOTRAKI MOTARI/KAGARAMA 169
83. COOTAMO ICYEREKEZO 52
84. COOTAMOMU/ MURINDI 261
85. COOTAMONO-UBUMWE 473
86. COPERATIVE DE TAXI-MOTO DE GAKERI/RUTSIRO 99
87. COTAMOGI/CYINYONI 290
88. COTAMOKI-DUKORE 64
89. COTAMONYA NYABUGOGO 487
90. COTAMORU TEBUKA RUHANGO 111
91. COTRAMO ICYIZERE COOPERATIVE KIMISAGARA 194
92. COOTRAMO-MUSANZE 198
93. COTRANYA 106
94. COTRAPAMORU 89
95. COTRATAMONYA 283
96. DUTABARANE-RUKARA 95
97. GASABO CENTER MOTORCYCLISTS 91
98. GASABO EAST COOPERATIVE MOTO 499
99. GASABO MOTORCYCLIST TAXIS SERVICES COOPERATIVE 878
100. GASABO MOTOCYCLISTS COOPERATIVE OF REMERA 31
101. GATSATA COOPERATIVE OF MOTORCYCLISTS 94
102. IBAKWE MOTARD COOPERATIVE NYARUGENGE 48
103. IMBARAGA MOTARI MUHIMA 99
104. INTASUMBWA NYAGATARE TAXI MOTO COOPERATAIVE 55
105. KACYIRU COOPERATIVE FOR DEVELOPMENT OF MOTORCYCLIST 343
106. KARANGAZI RAPID MOTOCYCLIST COOPERATIVE (K.R.M.C) 79
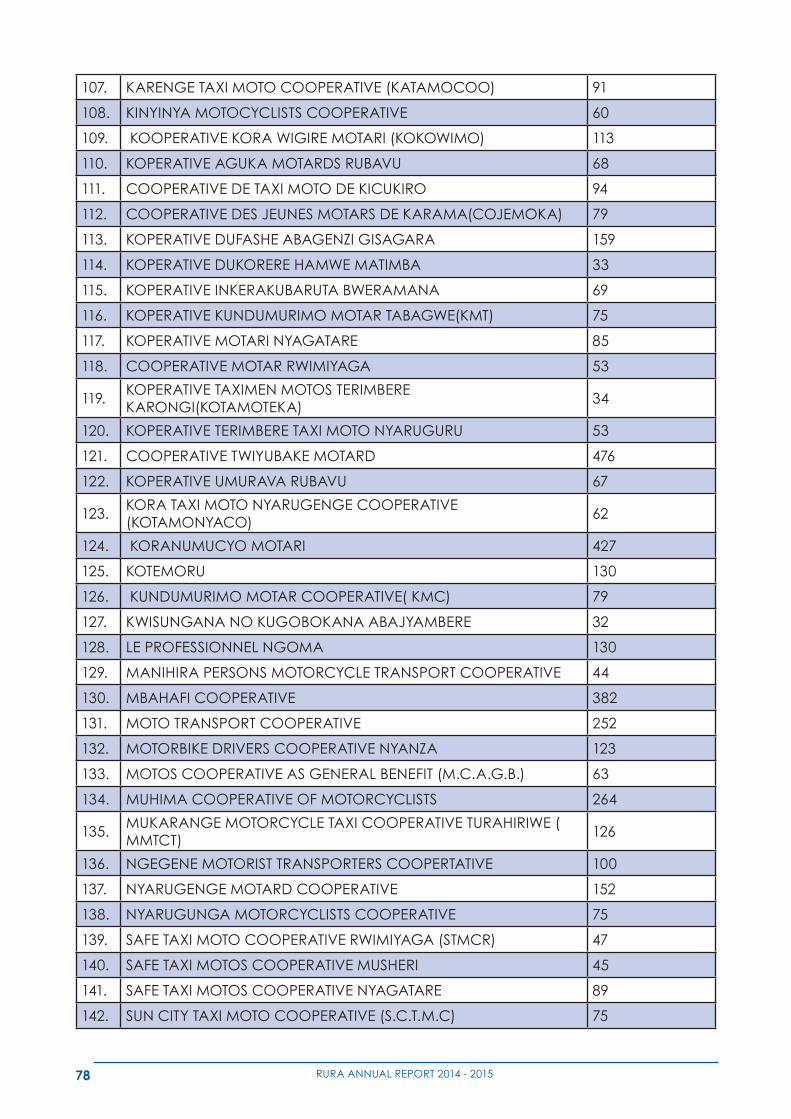
78 RURA ANNUAL REPORT 2014 - 2015
107. KARENGE TAXI MOTO COOPERATIVE (KATAMOCOO) 91
108. KINYINYA MOTOCYCLISTS COOPERATIVE 60
109. KOOPERATIVE KORA WIGIRE MOTARI (KOKOWIMO) 113
110. KOPERATIVE AGUKA MOTARDS RUBAVU 68
111. COOPERATIVE DE TAXI MOTO DE KICUKIRO 94
112. COOPERATIVE DES JEUNES MOTARS DE KARAMA(COJEMOKA) 79
113. KOPERATIVE DUFASHE ABAGENZI GISAGARA 159
114. KOPERATIVE DUKORERE HAMWE MATIMBA 33
115. KOPERATIVE INKERAKUBARUTA BWERAMANA 69
116. KOPERATIVE KUNDUMURIMO MOTAR TABAGWE(KMT) 75
117. KOPERATIVE MOTARI NYAGATARE 85
118. COOPERATIVE MOTAR RWIMIYAGA 53
119.KOPERATIVE TAXIMEN MOTOS TERIMBERE KARONGI(KOTAMOTEKA)
34
120. KOPERATIVE TERIMBERE TAXI MOTO NYARUGURU 53
121. COOPERATIVE TWIYUBAKE MOTARD 476
122. KOPERATIVE UMURAVA RUBAVU 67
123.KORA TAXI MOTO NYARUGENGE COOPERATIVE (KOTAMONYACO)
62
124. KORANUMUCYO MOTARI 427
125. KOTEMORU 130
126. KUNDUMURIMO MOTAR COOPERATIVE( KMC) 79
127. KWISUNGANA NO KUGOBOKANA ABAJYAMBERE 32
128. LE PROFESSIONNEL NGOMA 130
129. MANIHIRA PERSONS MOTORCYCLE TRANSPORT COOPERATIVE 44
130. MBAHAFI COOPERATIVE 382
131. MOTO TRANSPORT COOPERATIVE 252
132. MOTORBIKE DRIVERS COOPERATIVE NYANZA 123
133. MOTOS COOPERATIVE AS GENERAL BENEFIT (M.C.A.G.B.) 63
134. MUHIMA COOPERATIVE OF MOTORCYCLISTS 264
135.MUKARANGE MOTORCYCLE TAXI COOPERATIVE TURAHIRIWE ( MMTCT)
126
136. NGEGENE MOTORIST TRANSPORTERS COOPERTATIVE 100
137. NYARUGENGE MOTARD COOPERATIVE 152
138. NYARUGUNGA MOTORCYCLISTS COOPERATIVE 75
139. SAFE TAXI MOTO COOPERATIVE RWIMIYAGA (STMCR) 47
140. SAFE TAXI MOTOS COOPERATIVE MUSHERI 45
141. SAFE TAXI MOTOS COOPERATIVE NYAGATARE 89
142. SUN CITY TAXI MOTO COOPERATIVE (S.C.T.M.C) 75
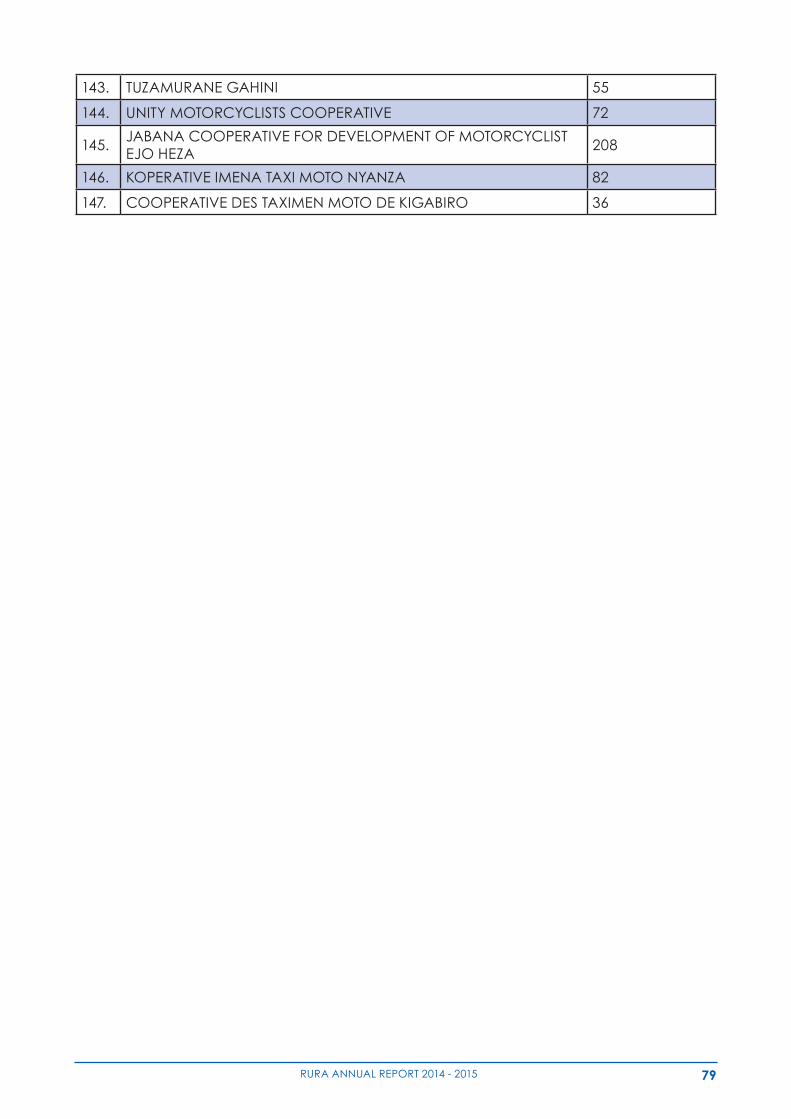
79RURA ANNUAL REPORT 2014 - 2015
143. TUZAMURANE GAHINI 55
144. UNITY MOTORCYCLISTS COOPERATIVE 72
145.JABANA COOPERATIVE FOR DEVELOPMENT OF MOTORCYCLIST EJO HEZA
208
146. KOPERATIVE IMENA TAXI MOTO NYANZA 82
147. COOPERATIVE DES TAXIMEN MOTO DE KIGABIRO 36
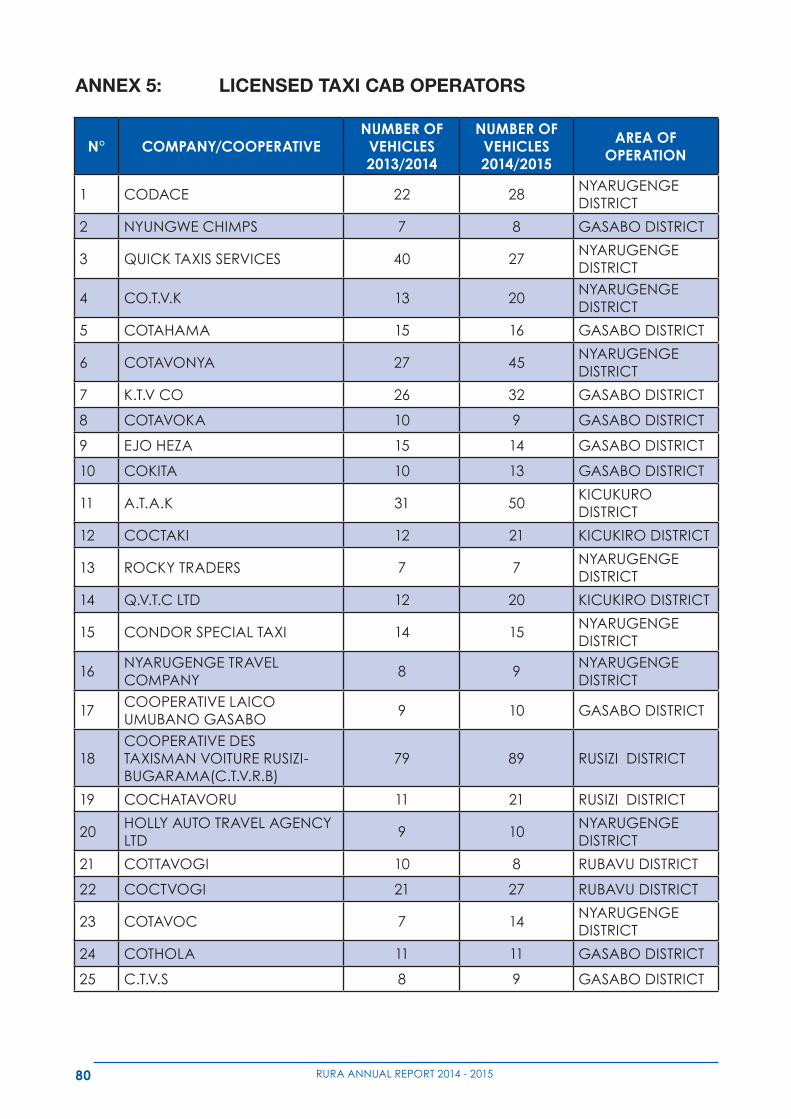
80 RURA ANNUAL REPORT 2014 - 2015
ANNEX 5: LICENSED TAXI CAB OPERATORS
N° COMPANY/COOPERATIVENUMBER OF VEHICLES2013/2014
NUMBER OF VEHICLES2014/2015
AREA OF OPERATION
1 CODACE 22 28NYARUGENGE DISTRICT
2 NYUNGWE CHIMPS 7 8 GASABO DISTRICT
3 QUICK TAXIS SERVICES 40 27NYARUGENGE DISTRICT
4 CO.T.V.K 13 20NYARUGENGE DISTRICT
5 COTAHAMA 15 16 GASABO DISTRICT
6 COTAVONYA 27 45NYARUGENGE DISTRICT
7 K.T.V CO 26 32 GASABO DISTRICT
8 COTAVOKA 10 9 GASABO DISTRICT
9 EJO HEZA 15 14 GASABO DISTRICT
10 COKITA 10 13 GASABO DISTRICT
11 A.T.A.K 31 50KICUKURO DISTRICT
12 COCTAKI 12 21 KICUKIRO DISTRICT
13 ROCKY TRADERS 7 7NYARUGENGE DISTRICT
14 Q.V.T.C LTD 12 20 KICUKIRO DISTRICT
15 CONDOR SPECIAL TAXI 14 15NYARUGENGE DISTRICT
16NYARUGENGE TRAVEL COMPANY
8 9NYARUGENGE DISTRICT
17COOPERATIVE LAICO UMUBANO GASABO
9 10 GASABO DISTRICT
18COOPERATIVE DES TAXISMAN VOITURE RUSIZI-BUGARAMA(C.T.V.R.B)
79 89 RUSIZI DISTRICT
19 COCHATAVORU 11 21 RUSIZI DISTRICT
20HOLLY AUTO TRAVEL AGENCY LTD
9 10NYARUGENGE DISTRICT
21 COTTAVOGI 10 8 RUBAVU DISTRICT
22 COCTVOGI 21 27 RUBAVU DISTRICT
23 COTAVOC 7 14NYARUGENGE DISTRICT
24 COTHOLA 11 11 GASABO DISTRICT
25 C.T.V.S 8 9 GASABO DISTRICT
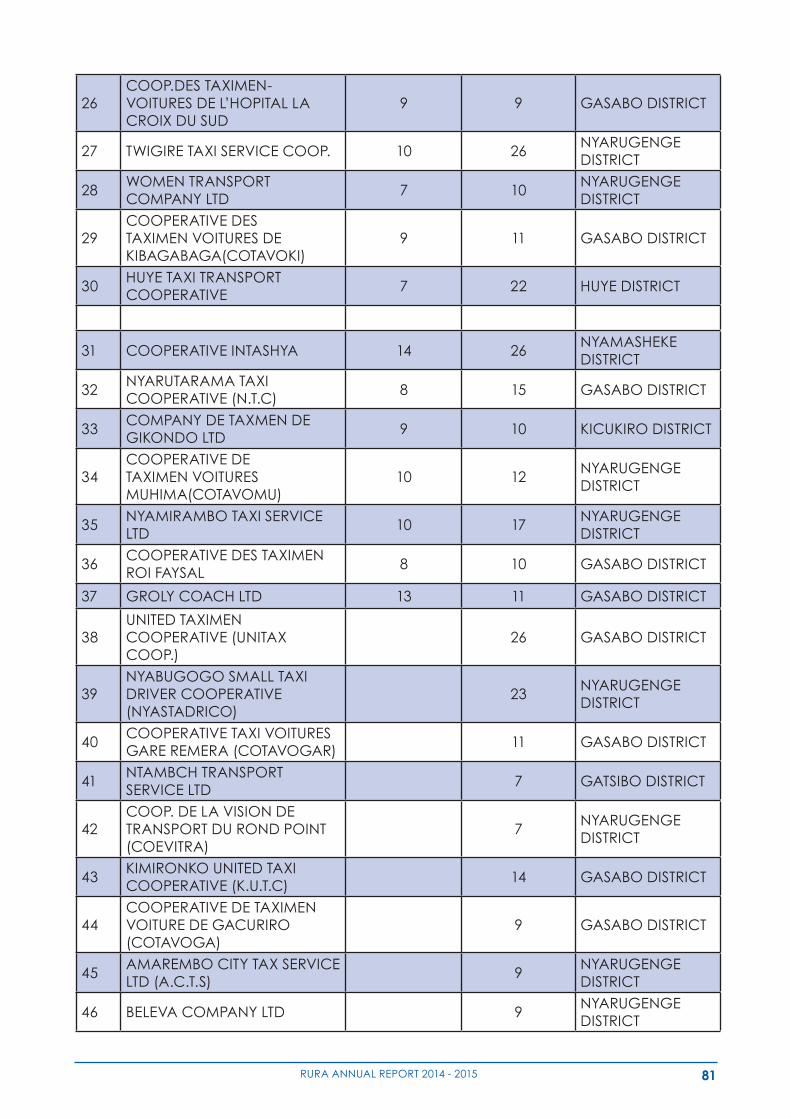
81RURA ANNUAL REPORT 2014 - 2015
26COOP.DES TAXIMEN- VOITURES DE L’HOPITAL LA CROIX DU SUD
9 9 GASABO DISTRICT
27 TWIGIRE TAXI SERVICE COOP. 10 26NYARUGENGE DISTRICT
28WOMEN TRANSPORT COMPANY LTD
7 10NYARUGENGE DISTRICT
29COOPERATIVE DES TAXIMEN VOITURES DE KIBAGABAGA(COTAVOKI)
9 11 GASABO DISTRICT
30HUYE TAXI TRANSPORT COOPERATIVE
7 22 HUYE DISTRICT
31 COOPERATIVE INTASHYA 14 26NYAMASHEKE DISTRICT
32NYARUTARAMA TAXI COOPERATIVE (N.T.C)
8 15 GASABO DISTRICT
33COMPANY DE TAXMEN DE GIKONDO LTD
9 10 KICUKIRO DISTRICT
34COOPERATIVE DE TAXIMEN VOITURES MUHIMA(COTAVOMU)
10 12NYARUGENGE DISTRICT
35NYAMIRAMBO TAXI SERVICE LTD
10 17NYARUGENGE DISTRICT
36COOPERATIVE DES TAXIMEN ROI FAYSAL
8 10 GASABO DISTRICT
37 GROLY COACH LTD 13 11 GASABO DISTRICT
38UNITED TAXIMEN COOPERATIVE (UNITAX COOP.)
26 GASABO DISTRICT
39NYABUGOGO SMALL TAXI DRIVER COOPERATIVE (NYASTADRICO)
23NYARUGENGE DISTRICT
40COOPERATIVE TAXI VOITURES GARE REMERA (COTAVOGAR)
11 GASABO DISTRICT
41NTAMBCH TRANSPORT SERVICE LTD
7 GATSIBO DISTRICT
42COOP. DE LA VISION DE TRANSPORT DU ROND POINT (COEVITRA)
7NYARUGENGE DISTRICT
43KIMIRONKO UNITED TAXI COOPERATIVE (K.U.T.C)
14 GASABO DISTRICT
44COOPERATIVE DE TAXIMEN VOITURE DE GACURIRO (COTAVOGA)
9 GASABO DISTRICT
45AMAREMBO CITY TAX SERVICE LTD (A.C.T.S)
9NYARUGENGE DISTRICT
46 BELEVA COMPANY LTD 9NYARUGENGE DISTRICT
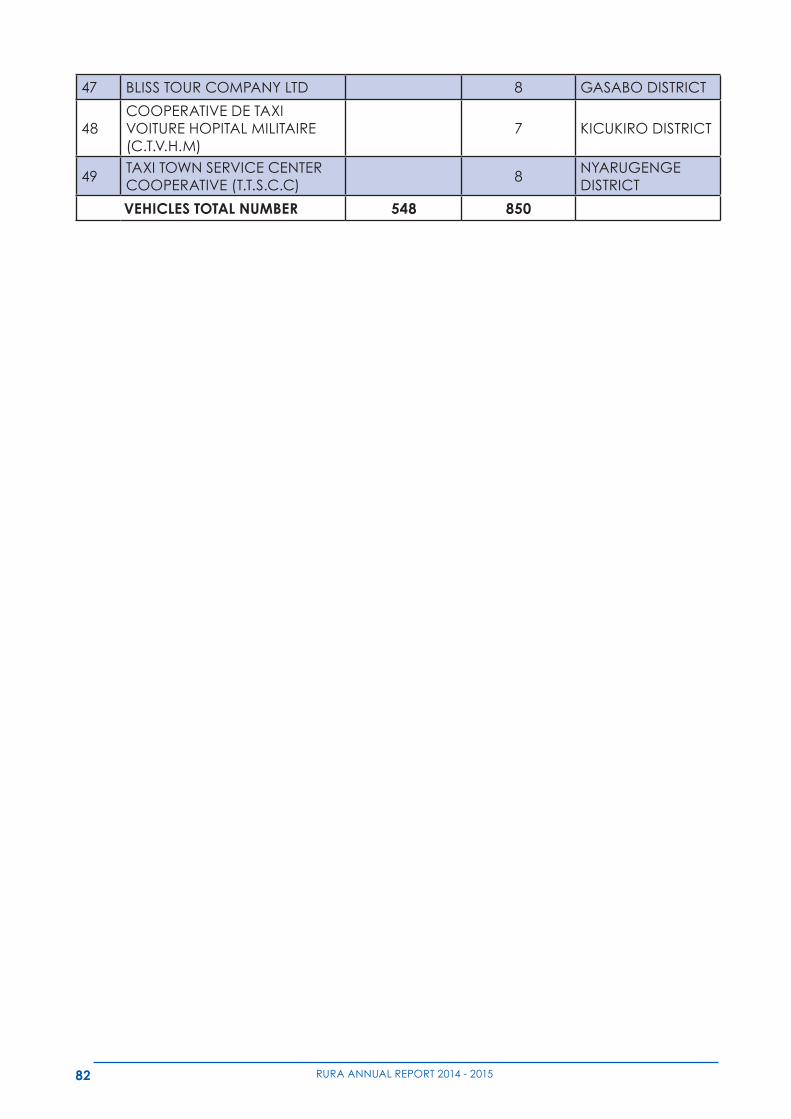
82 RURA ANNUAL REPORT 2014 - 2015
47 BLISS TOUR COMPANY LTD 8 GASABO DISTRICT
48COOPERATIVE DE TAXI VOITURE HOPITAL MILITAIRE (C.T.V.H.M)
7 KICUKIRO DISTRICT
49TAXI TOWN SERVICE CENTER COOPERATIVE (T.T.S.C.C)
8NYARUGENGE DISTRICT
VEHICLES TOTAL NUMBER 548 850
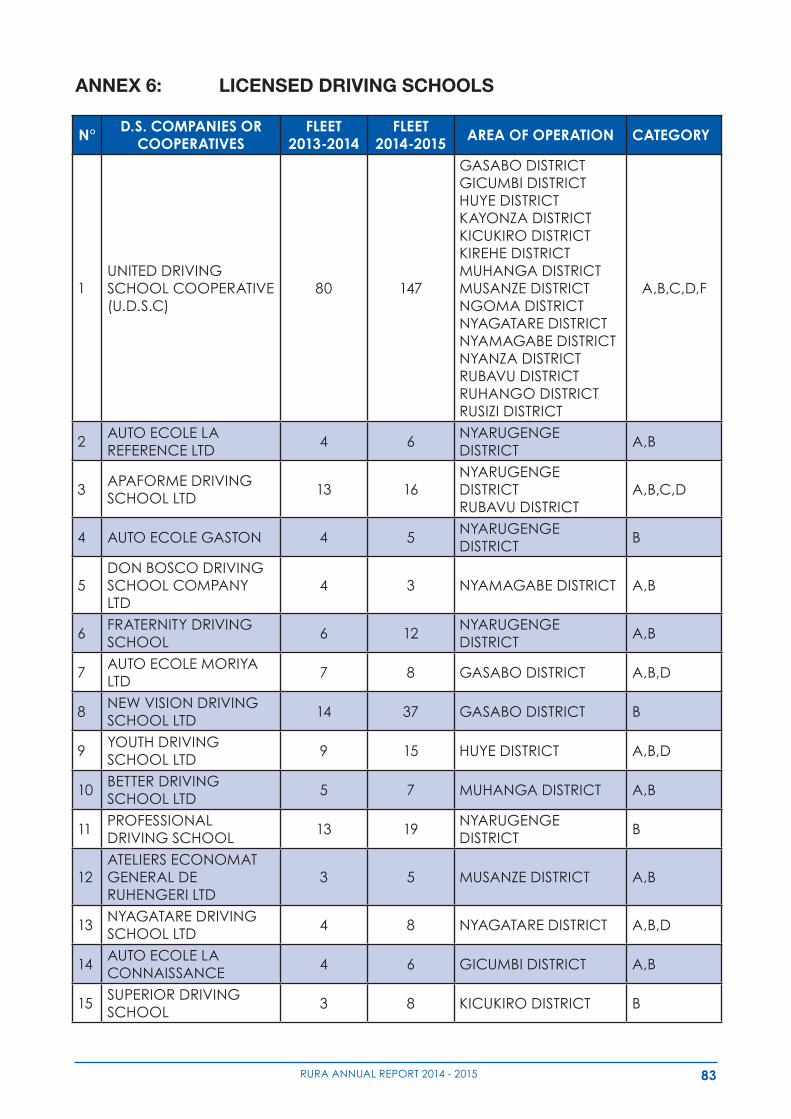
83RURA ANNUAL REPORT 2014 - 2015
ANNEX 6: LICENSED DRIVING SCHOOLS
N° D.S. COMPANIES OR COOPERATIVES
FLEET2013-2014
FLEET 2014-2015 AREA OF OPERATION CATEGORY
1UNITED DRIVING SCHOOL COOPERATIVE(U.D.S.C)
80 147
GASABO DISTRICTGICUMBI DISTRICTHUYE DISTRICTKAYONZA DISTRICTKICUKIRO DISTRICTKIREHE DISTRICTMUHANGA DISTRICT MUSANZE DISTRICTNGOMA DISTRICTNYAGATARE DISTRICTNYAMAGABE DISTRICTNYANZA DISTRICTRUBAVU DISTRICTRUHANGO DISTRICTRUSIZI DISTRICT
A,B,C,D,F
2AUTO ECOLE LA REFERENCE LTD
4 6NYARUGENGE DISTRICT
A,B
3APAFORME DRIVING SCHOOL LTD
13 16NYARUGENGE DISTRICTRUBAVU DISTRICT
A,B,C,D
4 AUTO ECOLE GASTON 4 5NYARUGENGE DISTRICT
B
5DON BOSCO DRIVING SCHOOL COMPANY LTD
4 3 NYAMAGABE DISTRICT A,B
6FRATERNITY DRIVING SCHOOL
6 12NYARUGENGE DISTRICT
A,B
7AUTO ECOLE MORIYA LTD
7 8 GASABO DISTRICT A,B,D
8NEW VISION DRIVING SCHOOL LTD
14 37 GASABO DISTRICT B
9YOUTH DRIVING SCHOOL LTD
9 15 HUYE DISTRICT A,B,D
10BETTER DRIVING SCHOOL LTD
5 7 MUHANGA DISTRICT A,B
11PROFESSIONAL DRIVING SCHOOL
13 19NYARUGENGE DISTRICT
B
12ATELIERS ECONOMAT GENERAL DE RUHENGERI LTD
3 5 MUSANZE DISTRICT A,B
13NYAGATARE DRIVING SCHOOL LTD
4 8 NYAGATARE DISTRICT A,B,D
14AUTO ECOLE LA CONNAISSANCE
4 6 GICUMBI DISTRICT A,B
15SUPERIOR DRIVING SCHOOL
3 8 KICUKIRO DISTRICT B
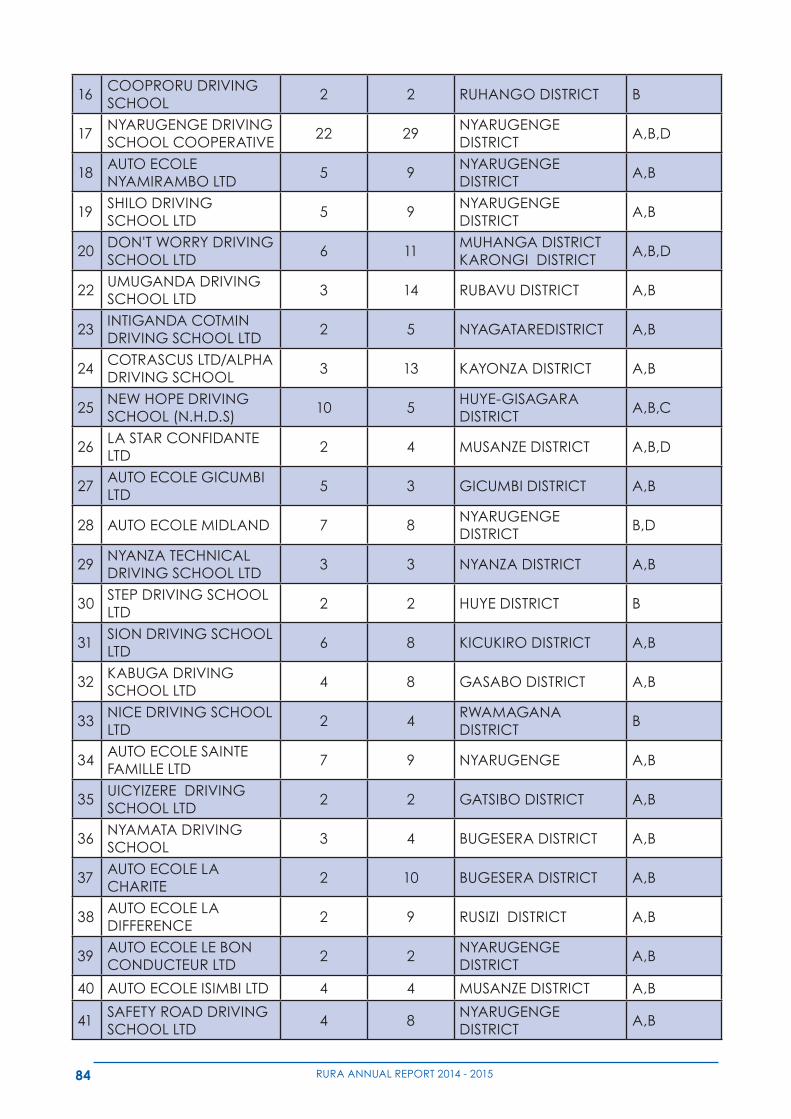
84 RURA ANNUAL REPORT 2014 - 2015
16COOPRORU DRIVING SCHOOL
2 2 RUHANGO DISTRICT B
17NYARUGENGE DRIVING SCHOOL COOPERATIVE
22 29NYARUGENGE DISTRICT
A,B,D
18AUTO ECOLE NYAMIRAMBO LTD
5 9NYARUGENGE DISTRICT
A,B
19SHILO DRIVING SCHOOL LTD
5 9NYARUGENGE DISTRICT
A,B
20DON'T WORRY DRIVING SCHOOL LTD
6 11MUHANGA DISTRICTKARONGI DISTRICT
A,B,D
22UMUGANDA DRIVING SCHOOL LTD
3 14 RUBAVU DISTRICT A,B
23INTIGANDA COTMIN DRIVING SCHOOL LTD
2 5 NYAGATAREDISTRICT A,B
24COTRASCUS LTD/ALPHA DRIVING SCHOOL
3 13 KAYONZA DISTRICT A,B
25NEW HOPE DRIVING SCHOOL (N.H.D.S)
10 5HUYE-GISAGARA DISTRICT
A,B,C
26LA STAR CONFIDANTE LTD
2 4 MUSANZE DISTRICT A,B,D
27AUTO ECOLE GICUMBI LTD
5 3 GICUMBI DISTRICT A,B
28 AUTO ECOLE MIDLAND 7 8NYARUGENGE DISTRICT
B,D
29NYANZA TECHNICAL DRIVING SCHOOL LTD
3 3 NYANZA DISTRICT A,B
30STEP DRIVING SCHOOL LTD
2 2 HUYE DISTRICT B
31SION DRIVING SCHOOL LTD
6 8 KICUKIRO DISTRICT A,B
32KABUGA DRIVING SCHOOL LTD
4 8 GASABO DISTRICT A,B
33NICE DRIVING SCHOOL LTD
2 4RWAMAGANA DISTRICT
B
34AUTO ECOLE SAINTE FAMILLE LTD
7 9 NYARUGENGE A,B
35UICYIZERE DRIVING SCHOOL LTD
2 2 GATSIBO DISTRICT A,B
36NYAMATA DRIVING SCHOOL
3 4 BUGESERA DISTRICT A,B
37AUTO ECOLE LA CHARITE
2 10 BUGESERA DISTRICT A,B
38AUTO ECOLE LA DIFFERENCE
2 9 RUSIZI DISTRICT A,B
39AUTO ECOLE LE BON CONDUCTEUR LTD
2 2NYARUGENGE DISTRICT
A,B
40 AUTO ECOLE ISIMBI LTD 4 4 MUSANZE DISTRICT A,B
41SAFETY ROAD DRIVING SCHOOL LTD
4 8NYARUGENGE DISTRICT
A,B
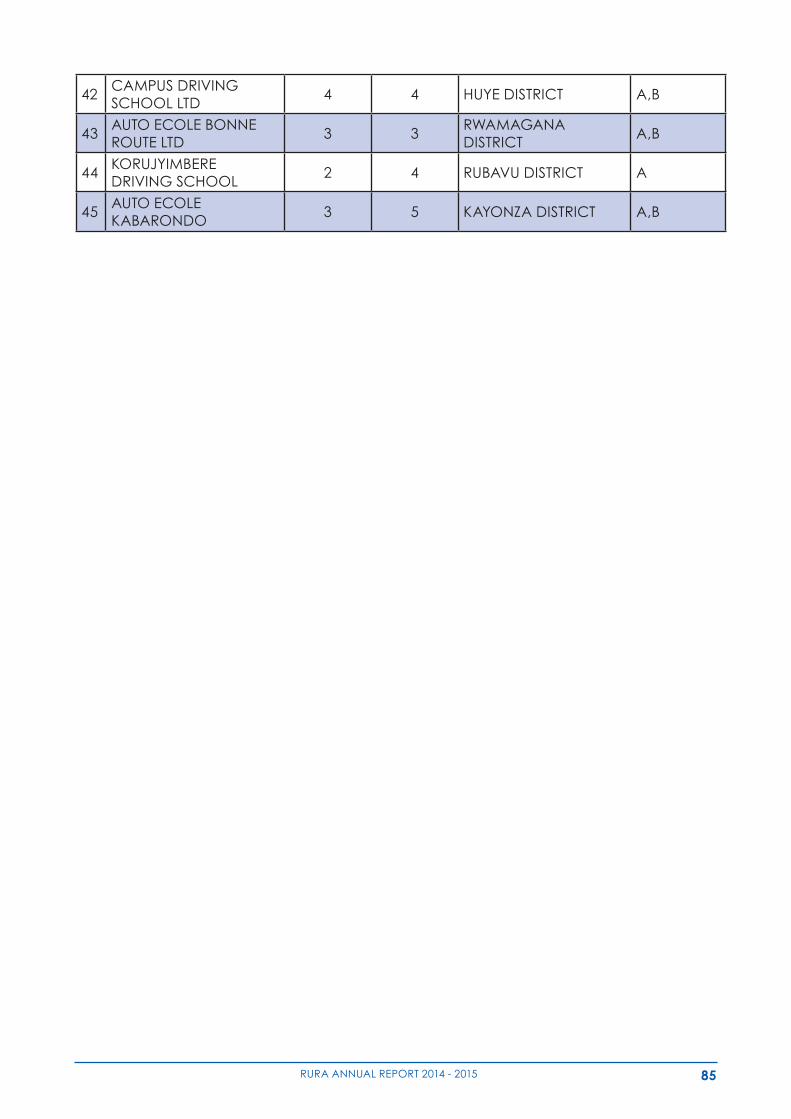
85RURA ANNUAL REPORT 2014 - 2015
42CAMPUS DRIVING SCHOOL LTD
4 4 HUYE DISTRICT A,B
43AUTO ECOLE BONNE ROUTE LTD
3 3RWAMAGANA DISTRICT
A,B
44KORUJYIMBERE DRIVING SCHOOL
2 4 RUBAVU DISTRICT A
45AUTO ECOLE KABARONDO
3 5 KAYONZA DISTRICT A,B
Kiyovu-Rue Bigogwe, KN 6 Av 11, P.O Box 7289 KIGALITel: (250) 252 584562, Fax: (250) 252 584563-Hotline: 3988
Website: www.rura.rw, Email: [email protected]