Embed Size (px)
Citation preview
DSTO-HUMS2001 CDROM
Paper 5-12 page - 1
MODEL-BASED DECISION SUPPORT TOOLS FOR T700 ENGINE HEALTHMONITORING.
Peter Frith and George KarvounisAirframes & Engines Division, DSTO
ABSTRACT
This paper describes the progress made by DSTO in developing a model-based approach to thediagnosis and prognosis of engine gas path health in the Australian Defence Force (ADF)helicopters powered by General Electric T700 engines. In particular, two new model-based toolsare presented: one for estimating power assurance and one for detecting abnormal engineoperation. These tools have been developed to take advantage of the engine parameters recordedby modern Health and Usage Monitoring System (HUMS). Such systems are under considerationfor fitting to ADF helicopters as part of mid-life upgrade and acquisition projects. The first tool,the T700 model-based power assurance estimator is proposed for use with the current HealthIndicator Test (HIT) check and it links the HIT check value to the power available for a givenflight condition and scenario of component degradation. The second tool, a combined model–based detector and fuzzy-logic decision-maker is proposed initially for use in a HUMS groundstation to reduce the amount of data manually processed or interrogated. The DSTO developedMATLAB-Simulink true twin T700 engine model with its demonstrated accurate tracking oftransient flight data provides the means of detecting major shifts in in-flight engine condition overa given flight. A fuzzy logic formulation then provides the means to automate this detectionprocess and provide an end of flight estimate for future prognostic trending.
INTRODUCTION
An international collaborative program has been set up,under the auspices of the Aerospace Systems Group of TheTechnical Cooperation Program (TTCP), to develop newmethods for the diagnosis and prognosis of engine gas pathhealth in military helicopters. Participating nations includethe United States, Canada, New Zealand and Australia. Inthis program, DSTO has taken the lead role in developingmodel-based methods for helicopters powered by theGeneral Electric T700 turboshaft engine [1].
The collaborative program seeks to provide bothmaintenance and mission planners with better decision-making tools for assessing firstly, the gas path condition ofin-service turboshaft engines and secondly, the mission-worthiness of the engines. Maintenance planners requirean enhanced capability to assess gas path condition toensure that the on-condition maintenance policy of modernturboshaft engines is operationally effective. Missionplanners also require new tools to relate the condition of in-service degraded engines to the power available at any partof the flight envelope. Such power assurance algorithmswill enable decisions on system suitability for full missions
and provide the ability to plan and schedule reducedcapability missions.
Gas Path Analysis (GPA) serves a different role to the othermain Health Monitoring Technologies of VibrationAnalysis (VA) and Oil Condition Monitoring (OCM). VAand OCM attempt to diagnose events that lead tocatastrophic failure of an engine component, and so theyhave a safety or airworthiness impact. In contrast, GPAattempts to diagnose events that lead to graceful failure inthe function of the engine (degradation), and so it has aperformance or mission-worthiness impact.
GPA seeks to diagnose the loss of engine condition due tocauses such as: eroded, corroded and fouled blades andvanes; tip clearance changes, turbine bowed vanes andblade untwist; bleed and air-seal leaks, mis-scheduledvariable geometry, control system failures and sensorfailures. GPA seeks to infer the condition of the engine’sgas path from the changes in the engine’s thermodynamicparameters, ie the measured pressures, temperatures,speeds, torque, air and fuel flows, from their referencevalues. In the model-based approach, the engine modelprovides these reference values.
DSTO-HUMS2001 CDROM
Paper 5-12 page - 2
However, on current production engines, the isolation ofgas path faults to a modular level has proven to be adifficult task given the limited set of engine gas pathparameters that are available. Production engines aretypically instrumented to measure torque, engine speed,power turbine speed and turbine gas temperature, and to alesser extent to measure fuel flow and compressor pressure.Indeed, this situation, of a lack of gas path instrumentation,has not improved with the proposed new Health andUsage Monitoring Systems.
For the above reason, DSTO has focused initially on thedevelopment of improved tools for assessing overall enginecondition and power assurance so that better decisions canbe made on when to remove an engine. Two such tools, amodel-based power assurance estimator and a combinedmodel–based detector and fuzzy-logic decision-maker arepresented below.
WHY A MODEL-BASED APPROACH?
DSTO has pursued a model-based approach to thedevelopment of improved tools for the diagnosis andprognosis of engine gas path health, as a result of twoearlier analyses of existing and proposed health monitoringmethods.
In the first study, the usefulness of the existing HealthIndicator Test (HIT) was assessed. The HIT check is usedby Black Hawk operators as a first flight of the day checkon engine condition. The HIT check indicates whether anengine has suffered a significant performance shift; it is asimple measure of the difference of the Turbine GasTemperature (TGT) from a reference value at a low powersetting of 60% Torque (TQ). A fleet-wide analysis ofAustralian operations showed that useful trends in long-term condition could be extracted from the HIT checkrecords, even given the ±12°C uncertainty in the individualHIT check values. The average fleet-wide trend showed a2.5°C increase in TGT per 100 engine hours.
Whilst these long term trends provide useful indicators ofengine condition, what is missing in the current HIT checkprocedure is a link between how hot the engine is running -the TGT margin - and what power is available across theflight envelope. Carrying out a power check at themaximum TGT limiter setting does provide a measure ofthe maximum power available but it is not suitable for adaily check. Firstly, not all missions require the assuranceof maximum rated power. Secondly, the in-flight testmanoeuvre is more time consuming than is desirable for aquick daily engine check. Thirdly, and most importantly,such excursions to maximum power are detrimental toengine life and so unnecessary operation at maximumconditions should be avoided. Consequently, the use of a
model-based approach was seen as the way to relate thedaily HIT check margins to the power available and tominimise the number of power checks required.
In the second study, the usefulness of a new PowerPerformance Index (PPI) developed by General Electric wasassessed. DSTO participated in this assessment as part of aTTCP collaborative effort with the US Navy on itsHelicopter Integrated Diagnostic System (HIDS) program[2]. Essentially, the PPI is based on the difference betweenthe operating TGT and a simple TGT versus Torque (TQ)reference curve. Overall, the PPI provided an improvedHIT check, ie indication of condition, but not the requiredmeasure of acceptable power. It extended the applicationof the HIT check from the specified 60% TQ value to arange of low to medium power levels but it was notapplicable to the higher engine power settings. Theresultant increased capture of PPI values, from the onevalue a flight for the HIT check to some two hundred PPIvalues over a flight, provided sufficient numbers of PPIestimates to establish an accurate end of flight indicator ofcondition. However, it suffers from the same weaknesses asthe HIT check and for the same reasons a model-basedapproach to power assurance was deemed necessary.
T700 TURBOSHAFT ENGINE
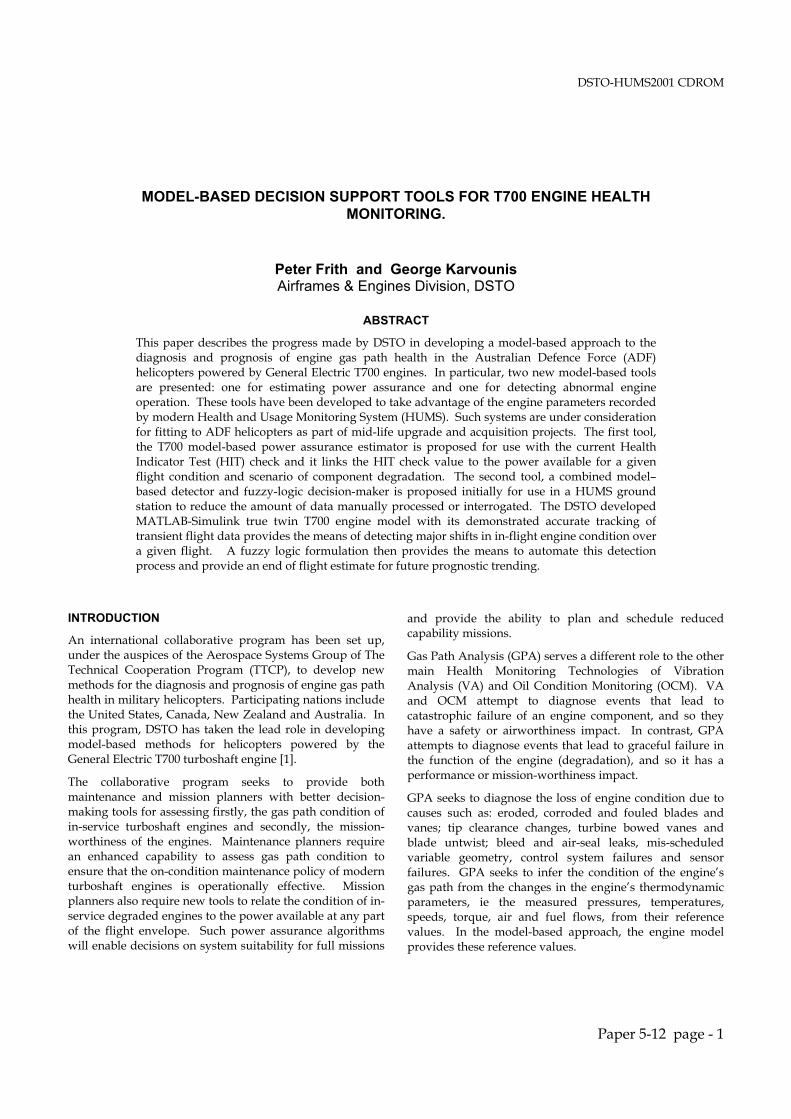
The General Electric (GE) T700 turboshaft engine [3]powers three helicopters in the ADF fleet, the SikorskyBlack Hawk and Seahawk and the Kaman Super Seasprite.The engine variants are respectively, the GE-T700-701A, theGE-T700-401C and the GE-T700-401. As well as the abovehelicopters, the T700 engine powers a number of otherhelicopters operated by TTCP nations, such as theCormorant, Apache, and Cobra.
Figure 1: Twin Engine Installation [3]
DSTO-HUMS2001 CDROM
Paper 5-12 page - 3
The T700 engine is designed as a modular engine with fourmain modules, they are: cold section, hot section, powerturbine section, and accessory section. The basic T700engine system is controlled through the interaction of anElectrical Control Unit (ECU) and a HydromechanicalControl Unit (HMU). The engine control system providesfor the more common functions of fuel handling andcomputation, compressor bleed and variable geometrycontrol, power modulation for rotor speed control, over-speed protection, and load sharing between engines formultiple-engine installations. Importantly, the propulsionsystems of the ADF helicopters consist of two T700 enginesoperating in parallel with torque matching. This isillustrated in Figure 1.
MODEL-BASED POWER ASSURANCE ESTIMATOR
The T700 Model-Based Power Assurance Estimator wasdeveloped to provide a capability to assess the poweravailable from a twin engine helicopter when the twoengines are operating with significantly different levels ofcomponent degradation. Traditionally, simulations andmission planning studies have modelled the performanceand behaviour of twin engine helicopters by simplydoubling the power available from a single engine ofspecification performance.
The function of the model-based estimator is to link theoperational indicator of overall engine condition with thepower available at a specified flight condition andcomponent degradation scenario. In the case of the currentT700 engine health monitoring scheme, the manuallyrecorded HIT Check, the estimator links the operationalHIT check TGT values (how hot the engines are running)with the power available. In the case of a future HUMS,operating the proposed automated engine health detector,the estimator will link the end of flight estimate of enginecondition with the power available.
Adaptive Degradation Model of the T700 engine
The key activity in the development of the power assuranceestimator was the development and validation of anadaptive degradation model of the T700 engine. Theadaptive model provides the required capability to modelengine operation under varying scenarios of componentdegradation. It is based on a high fidelity, transient, aero-thermodynamic model of the T700 engine that wasdeveloped by NASA Ames [4,5] and coded as a Fortrancomputer program. In the NASA model, the engine wasmodelled as four major thermodynamic components, acompressor, combustor, gas generator and free-powerturbine. As well, the NASA model included acomprehensive set of models of the HMU and ECU.
The NASA model was modified by DSTO to adaptivelyimplement the effect of changes to the major componentcharacteristics. These components included: the intake, thescavenge and anti-ice and starting bleeds, the compressor,the compressor and customer bleeds, the combustor, thegas generator turbine, the power turbine and the exhaustnozzle. The component changes or deltas were introducedin two parts. The first part covers engine to enginevariations. This handles the use of different T700 engineversions, such as -700, -701A, -701C, -401, and -401C, aswell as the normal fleet-wide variations seen in healthyengines, the result of build variations, and so provides theinitial individual engine baseline against which to trendperformance changes. The second part covers thecomponent degradation – the changes- from the initialbaseline.
The T700 adaptive degradation model was validatedagainst a database of manufacturer's specification data andUS Navy test-cell data. The database included: GEspecification model data for the T700-701A and T700-401Cengines; and US Navy HIDS test–cell data for some fiveengines, of which three engines were rejected, from thefleet, for performance related problems. The adaptivemodel was shown to be able to provide a good fit across thepower range for each engine. The model matches the GEspecification data on major thermodynamic parameters tobetter than 1.5% overall. The model’s fidelity was found tobe more than adequate for the purpose of power assurance,although some further refinements will be necessary formodular diagnostics.
Model-Based Sensitivity Analysis
The relationship between the change in the HIT check TGTtemperatures and the power available, under differentscenarios of component degradation, was established by amodel-based sensitivity analysis. This analysis examinedthe effect of degradation in the three major gas pathcomponents, the compressor, the gas generator turbine andthe power turbine; and it involved scenarios of both singleand multiple component degradation. The results of thisanalysis have been incorporated into the Power AssuranceEstimator program.
Using the T700 adaptive degradation model, the individualcharacteristic component maps of the compressor, gasgenerator turbine, and power turbine were changed tomodel the effect of degradation. The two dimensionaldomain of all possible component degradations wasgenerated by varying the characteristic parameters ofefficiency and mass flow by up to five percent from theirreference values. Five per cent was considered to be arealistic upper limit beyond which the component
DSTO-HUMS2001 CDROM
Paper 5-12 page - 4
degradation was expected to be very obvious and out of theregion of interest.
For each component, the following process was followed.Firstly, the T700 adaptive degradation model was run tocalculate the changes in TGT at the HIT Check powersetting of 60% Torque. Secondly, the contours of TGTchanges, in intervals of 10 °C, were calculated across thecomponent degradation domain. Thirdly, for each HITcheck TGT contour, the efficiency and mass flow parameterpairs were extracted. Fourthly, the model was re-run at themaximum rated power setting, maximum TGT, using theappropriate efficiency and mass flow degradation pairscalculated above. This provided the estimate of the poweravailable for an engine operating at the given HIT checkTGT value under the proposed degradation scenario.Fifthly, this was also done for the two other engineparameters available on the Black Hawk, the gas generatorspeed (NG) and the fuel flow.
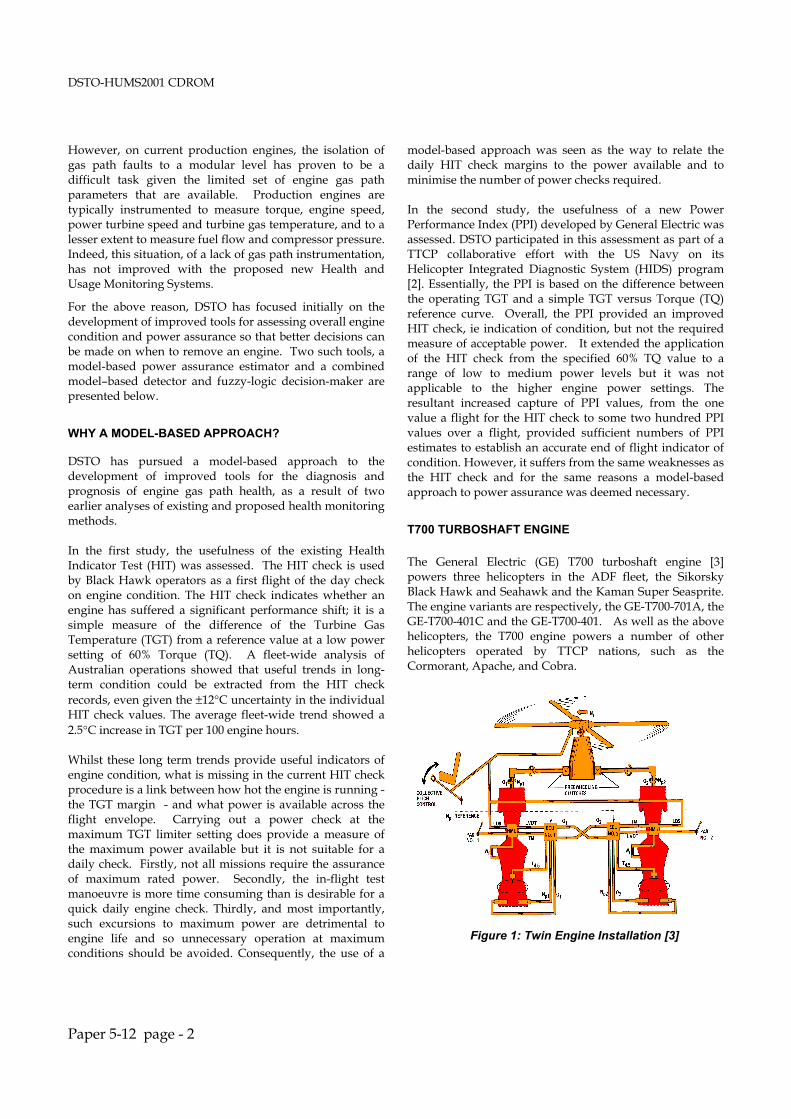
The results for the case of compressor degradation arepresented here. Figure 2 shows the contour plot of HITcheck TGT increases for the given degradation domain. Italso includes a specific fault signature for changes tocompressor rotor tip clearances. This signature wasextracted from an early experimental study by DSTO on asimilar turboshaft engine [6,7]. Figure 2 also shows theresultant drop in power for HIT check margins of 20, 40and 60 (°C). Whilst the band of possible power drops forthe given domain of compressor degradations is reasonablywide, some 3 to 4%, it does provide a good guide to theHIT check value at which the engine will fail the powercheck - at some 8% below specification power. Thenarrower power band for the compressor tip clearance faultclearly demonstrates the benefit of knowing the faultsignature more accurately, in terms of the componentefficiency and mass flow pair. Here, there is gooddiscrimination (no overlap) between the power loss at eachHIT check level.
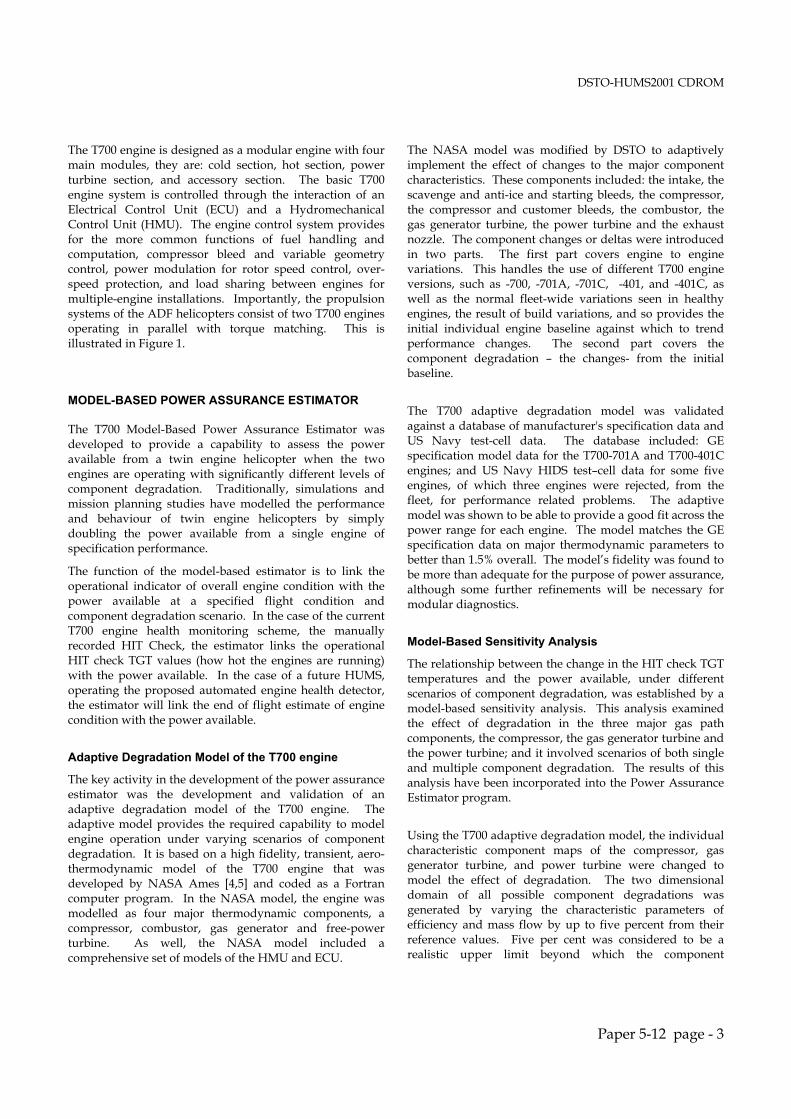
Some typical power loss results for a range of single andmultiple component degradation scenarios are shown inFigure 3. These are for a HIT check TGT rise of 40 °C. Themultiple component scenarios involve any two of the threecomponents, combined together in the proportions of25/75% and vice versa, and 50/50%. The single componentonly is 100%. The results show a wide range of possiblepower check values for a given HIT check of 40 °C.Importantly, for correct engine matching, the results werevery sensitive to the introduction of power turbinedegradation. In combination with either compressor or gasgenerator turbine degradation, the power turbinedegradation produces a significant increase in the possiblepower loss. In such circumstances, the engine may reach
Case of Compressor Degradation
Figure 2: HIT and Power Check Relationship
-5 -4 -3 -2 -1
-5
-4
-3
-2
-1
0
% Decrease in Mass Flow
% D
ecre
ase
in E
ffic
ien
cy
100
80
60
40
20
Contours of TGT Margins
-10
-8
-6
-4
-2
0
20 40 60
TGT Margins (0C)
% L
oss
in P
ow
er
Full DomainTip Clearance
Power Loss for TGT
Power Check
-15
-10
-5
0
% L
oss
in P
ow
er
100%C 50%C50%G
25%C75%G
50%C50%P
25%C75%P
50%G50%P
25%G75%P
C: CompressorG: Gas TurbineP: Power Turbine
% of Component Degradation
Minimum
100%G
Figure 3: Loss in Power due to Multiple ComponentDegradation Scenarios
DSTO-HUMS2001 CDROM
Paper 5-12 page - 5
the minimum acceptable power range at a relatively lowHIT check TGT value of 40 °C.
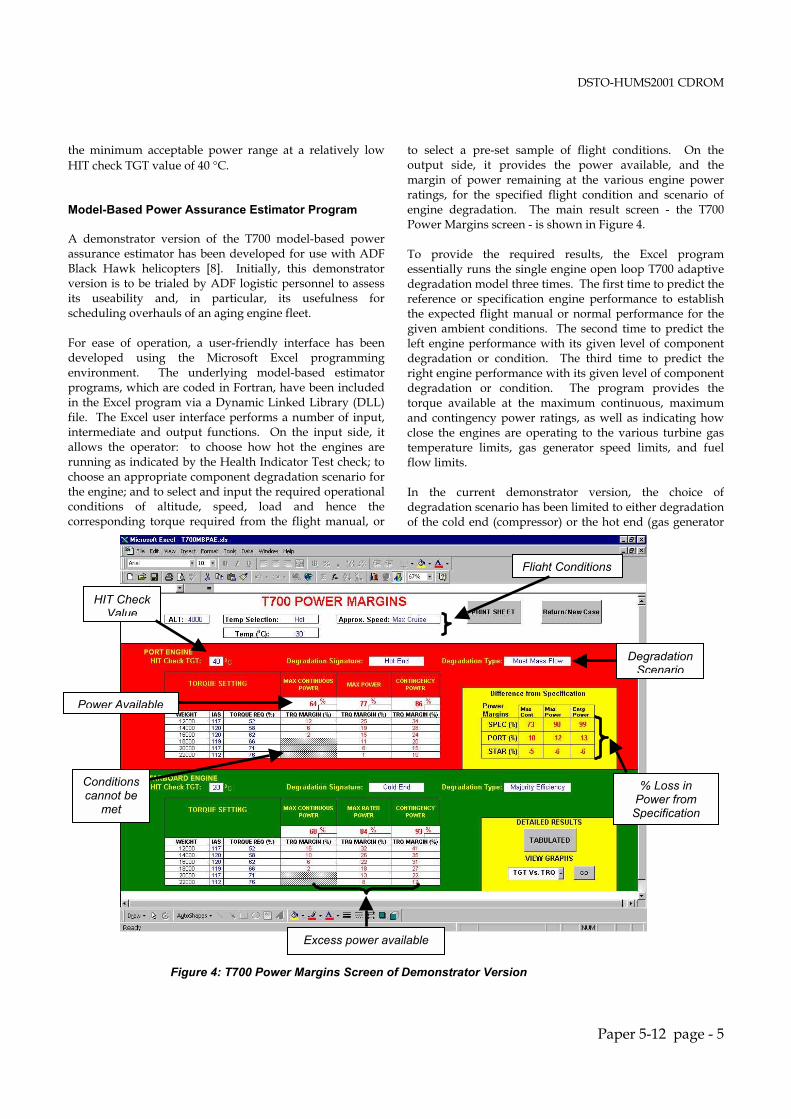
Model-Based Power Assurance Estimator Program
A demonstrator version of the T700 model-based powerassurance estimator has been developed for use with ADFBlack Hawk helicopters [8]. Initially, this demonstratorversion is to be trialed by ADF logistic personnel to assessits useability and, in particular, its usefulness forscheduling overhauls of an aging engine fleet.
For ease of operation, a user-friendly interface has beendeveloped using the Microsoft Excel programmingenvironment. The underlying model-based estimatorprograms, which are coded in Fortran, have been includedin the Excel program via a Dynamic Linked Library (DLL)file. The Excel user interface performs a number of input,intermediate and output functions. On the input side, itallows the operator: to choose how hot the engines arerunning as indicated by the Health Indicator Test check; tochoose an appropriate component degradation scenario forthe engine; and to select and input the required operationalconditions of altitude, speed, load and hence thecorresponding torque required from the flight manual, or
to select a pre-set sample of flight conditions. On theoutput side, it provides the power available, and themargin of power remaining at the various engine powerratings, for the specified flight condition and scenario ofengine degradation. The main result screen - the T700Power Margins screen - is shown in Figure 4.
To provide the required results, the Excel programessentially runs the single engine open loop T700 adaptivedegradation model three times. The first time to predict thereference or specification engine performance to establishthe expected flight manual or normal performance for thegiven ambient conditions. The second time to predict theleft engine performance with its given level of componentdegradation or condition. The third time to predict theright engine performance with its given level of componentdegradation or condition. The program provides thetorque available at the maximum continuous, maximumand contingency power ratings, as well as indicating howclose the engines are operating to the various turbine gastemperature limits, gas generator speed limits, and fuelflow limits.
In the current demonstrator version, the choice ofdegradation scenario has been limited to either degradationof the cold end (compressor) or the hot end (gas generator
HIT CheckValue
Excess power available
% Loss inPower from
Specification
Conditionscannot be
met
Flight Conditions
DegradationScenario
Power Available
Figure 4: T700 Power Margins Screen of Demonstrator Version
DSTO-HUMS2001 CDROM
Paper 5-12 page - 6
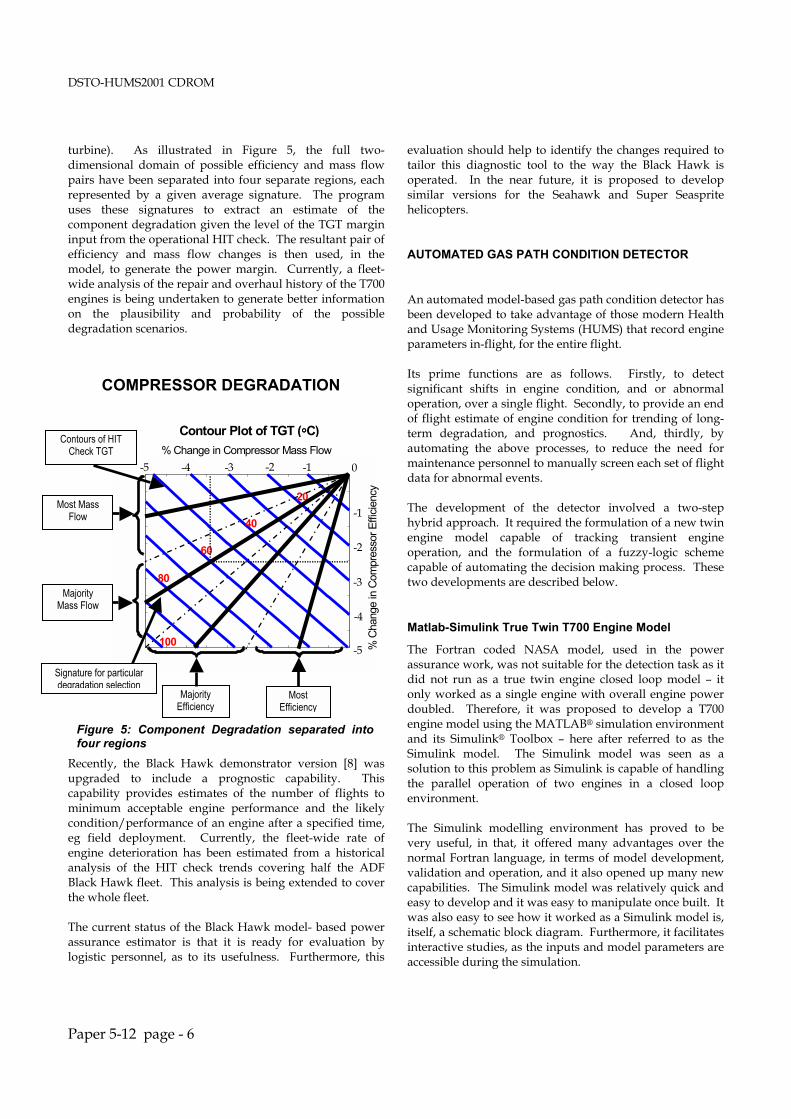
turbine). As illustrated in Figure 5, the full two-dimensional domain of possible efficiency and mass flowpairs have been separated into four separate regions, eachrepresented by a given average signature. The programuses these signatures to extract an estimate of thecomponent degradation given the level of the TGT margininput from the operational HIT check. The resultant pair ofefficiency and mass flow changes is then used, in themodel, to generate the power margin. Currently, a fleet-wide analysis of the repair and overhaul history of the T700engines is being undertaken to generate better informationon the plausibility and probability of the possibledegradation scenarios.
Recently, the Black Hawk demonstrator version [8] wasupgraded to include a prognostic capability. Thiscapability provides estimates of the number of flights tominimum acceptable engine performance and the likelycondition/performance of an engine after a specified time,eg field deployment. Currently, the fleet-wide rate ofengine deterioration has been estimated from a historicalanalysis of the HIT check trends covering half the ADFBlack Hawk fleet. This analysis is being extended to coverthe whole fleet.
The current status of the Black Hawk model- based powerassurance estimator is that it is ready for evaluation bylogistic personnel, as to its usefulness. Furthermore, this
evaluation should help to identify the changes required totailor this diagnostic tool to the way the Black Hawk isoperated. In the near future, it is proposed to developsimilar versions for the Seahawk and Super Seaspritehelicopters.
AUTOMATED GAS PATH CONDITION DETECTOR
An automated model-based gas path condition detector hasbeen developed to take advantage of those modern Healthand Usage Monitoring Systems (HUMS) that record engineparameters in-flight, for the entire flight.
Its prime functions are as follows. Firstly, to detectsignificant shifts in engine condition, and or abnormaloperation, over a single flight. Secondly, to provide an endof flight estimate of engine condition for trending of long-term degradation, and prognostics. And, thirdly, byautomating the above processes, to reduce the need formaintenance personnel to manually screen each set of flightdata for abnormal events.
The development of the detector involved a two-stephybrid approach. It required the formulation of a new twinengine model capable of tracking transient engineoperation, and the formulation of a fuzzy-logic schemecapable of automating the decision making process. Thesetwo developments are described below.
Matlab-Simulink True Twin T700 Engine Model
The Fortran coded NASA model, used in the powerassurance work, was not suitable for the detection task as itdid not run as a true twin engine closed loop model – itonly worked as a single engine with overall engine powerdoubled. Therefore, it was proposed to develop a T700engine model using the MATLAB® simulation environmentand its Simulink® Toolbox – here after referred to as theSimulink model. The Simulink model was seen as asolution to this problem as Simulink is capable of handlingthe parallel operation of two engines in a closed loopenvironment.
The Simulink modelling environment has proved to bevery useful, in that, it offered many advantages over thenormal Fortran language, in terms of model development,validation and operation, and it also opened up many newcapabilities. The Simulink model was relatively quick andeasy to develop and it was easy to manipulate once built. Itwas also easy to see how it worked as a Simulink model is,itself, a schematic block diagram. Furthermore, it facilitatesinteractive studies, as the inputs and model parameters areaccessible during the simulation.
-5 -4 -3 -2 -1
-5
-4
-3
-2
-1
0
20
40
60
80
100
Contour Plot of TGT (°°°°C)
% Change in Compressor Mass Flow
% C
hang
e in
Com
pres
sor
Effi
cien
cy
Most MassFlow
MajorityMass Flow
MostEfficiency
MajorityEfficiency
Contours of HITCheck TGT
Signature for particulardegradation selection
COMPRESSOR DEGRADATION
Figure 5: Component Degradation separated intofour regions
DSTO-HUMS2001 CDROM
Paper 5-12 page - 7
The ability of the Simulink model to truly implement thetwin engine torque share, as carried out by the ElectricalControl Unit (ECU), by itself, opened up a number ofuseful capabilities. These capabilities included: the abilityto look at condition assessment and fault diagnosis fromtransient flight data; the ability to look at engine controlrelated problems; the ability to look at retro-fitting FullAuthority Digital Electronic Control Systems (FADECS);and the ability to look at care-free handling issues. As well,the use of the MATLAB environment facilitates the use ofother advanced analytical tools, as they can be readily usedand interfaced with the Simulink model. These includesuch MATLAB analysis toolboxes or extensions as, signalprocessing, parameter identification, robust control andfuzzy logic toolboxes, and the MATLAB Real-TimeWorkshop™, etc.
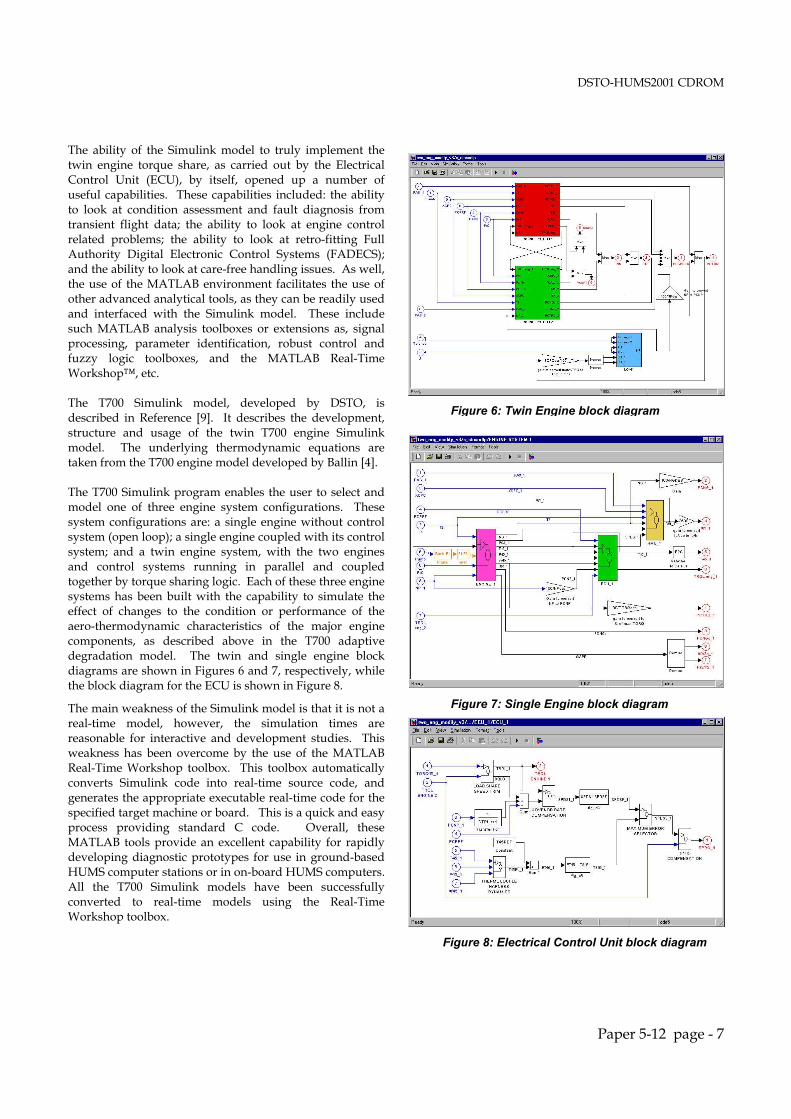
The T700 Simulink model, developed by DSTO, isdescribed in Reference [9]. It describes the development,structure and usage of the twin T700 engine Simulinkmodel. The underlying thermodynamic equations aretaken from the T700 engine model developed by Ballin [4].
The T700 Simulink program enables the user to select andmodel one of three engine system configurations. Thesesystem configurations are: a single engine without controlsystem (open loop); a single engine coupled with its controlsystem; and a twin engine system, with the two enginesand control systems running in parallel and coupledtogether by torque sharing logic. Each of these three enginesystems has been built with the capability to simulate theeffect of changes to the condition or performance of theaero-thermodynamic characteristics of the major enginecomponents, as described above in the T700 adaptivedegradation model. The twin and single engine blockdiagrams are shown in Figures 6 and 7, respectively, whilethe block diagram for the ECU is shown in Figure 8.
The main weakness of the Simulink model is that it is not areal-time model, however, the simulation times arereasonable for interactive and development studies. Thisweakness has been overcome by the use of the MATLABReal-Time Workshop toolbox. This toolbox automaticallyconverts Simulink code into real-time source code, andgenerates the appropriate executable real-time code for thespecified target machine or board. This is a quick and easyprocess providing standard C code. Overall, theseMATLAB tools provide an excellent capability for rapidlydeveloping diagnostic prototypes for use in ground-basedHUMS computer stations or in on-board HUMS computers.All the T700 Simulink models have been successfullyconverted to real-time models using the Real-TimeWorkshop toolbox.
Figure 6: Twin Engine block diagram
Figure 7: Single Engine block diagram
Figure 8: Electrical Control Unit block diagram
DSTO-HUMS2001 CDROM
Paper 5-12 page - 8
Ability of the T700 Simulink Model to Track Flight Data
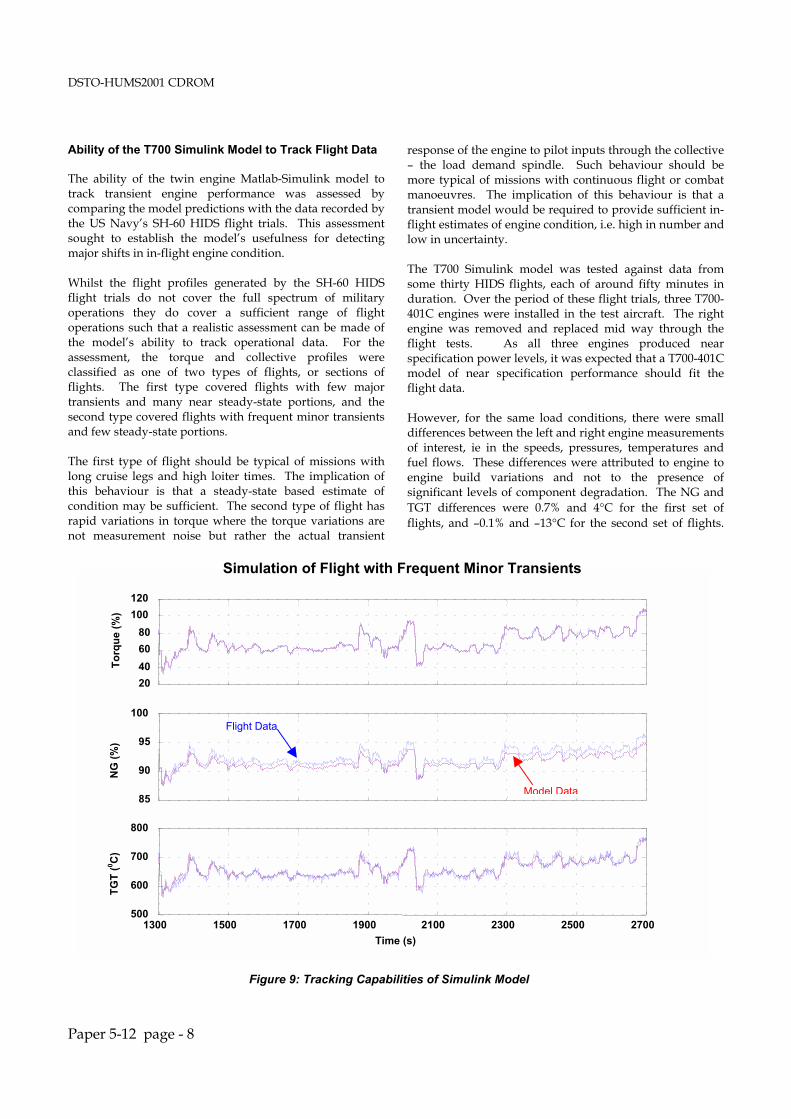
The ability of the twin engine Matlab-Simulink model totrack transient engine performance was assessed bycomparing the model predictions with the data recorded bythe US Navy’s SH-60 HIDS flight trials. This assessmentsought to establish the model’s usefulness for detectingmajor shifts in in-flight engine condition.
Whilst the flight profiles generated by the SH-60 HIDSflight trials do not cover the full spectrum of militaryoperations they do cover a sufficient range of flightoperations such that a realistic assessment can be made ofthe model’s ability to track operational data. For theassessment, the torque and collective profiles wereclassified as one of two types of flights, or sections offlights. The first type covered flights with few majortransients and many near steady-state portions, and thesecond type covered flights with frequent minor transientsand few steady-state portions.
The first type of flight should be typical of missions withlong cruise legs and high loiter times. The implication ofthis behaviour is that a steady-state based estimate ofcondition may be sufficient. The second type of flight hasrapid variations in torque where the torque variations arenot measurement noise but rather the actual transient
response of the engine to pilot inputs through the collective– the load demand spindle. Such behaviour should bemore typical of missions with continuous flight or combatmanoeuvres. The implication of this behaviour is that atransient model would be required to provide sufficient in-flight estimates of engine condition, i.e. high in number andlow in uncertainty.
The T700 Simulink model was tested against data fromsome thirty HIDS flights, each of around fifty minutes induration. Over the period of these flight trials, three T700-401C engines were installed in the test aircraft. The rightengine was removed and replaced mid way through theflight tests. As all three engines produced nearspecification power levels, it was expected that a T700-401Cmodel of near specification performance should fit theflight data.
However, for the same load conditions, there were smalldifferences between the left and right engine measurementsof interest, ie in the speeds, pressures, temperatures andfuel flows. These differences were attributed to engine toengine build variations and not to the presence ofsignificant levels of component degradation. The NG andTGT differences were 0.7% and 4°C for the first set offlights, and –0.1% and –13°C for the second set of flights.
Figure 9: Tracking Capabilities of Simulink Model
20
40
60
80
100
120
Simulation of Flight with Frequent Minor Transients
To
rqu
e (%
)
85
90
95
100
NG
(%
)
1300 1500 1700 1900 2100 2300 2500 2700500
600
700
800
Time (s)
TG
T (
0 C)
Flight Data
Model Data
DSTO-HUMS2001 CDROM
Paper 5-12 page - 9
Consequently, the above parameter differences betweenthe left engine and right engine provided an estimate ofthat part of the error between the model simulations andthe flight data – or bias error - which could be attributed toactual engine to engine variation rather than model error.The model simulations were carried out using thefollowing input parameters, the ambient temperature,pressure altitude, torque, and load demand collective.These parameters were extracted from the HIDS flight datathat was acquired at one hertz.
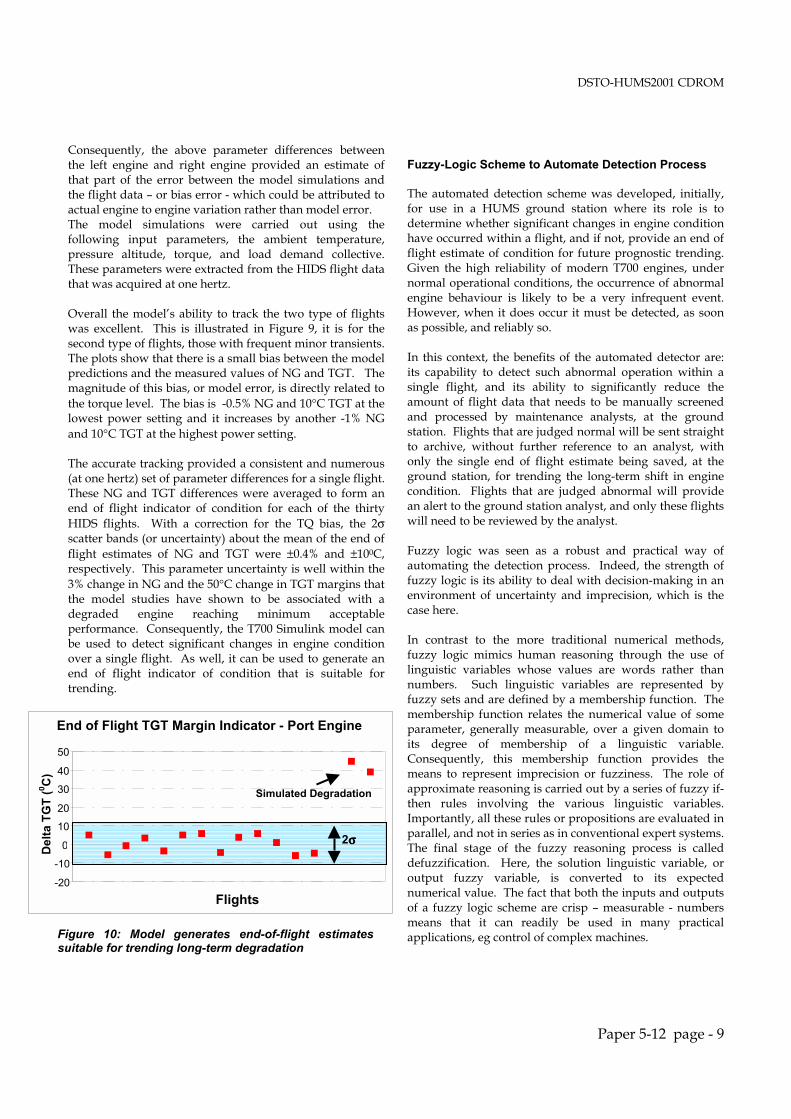
Overall the model’s ability to track the two type of flightswas excellent. This is illustrated in Figure 9, it is for thesecond type of flights, those with frequent minor transients.The plots show that there is a small bias between the modelpredictions and the measured values of NG and TGT. Themagnitude of this bias, or model error, is directly related tothe torque level. The bias is -0.5% NG and 10°C TGT at thelowest power setting and it increases by another -1% NGand 10°C TGT at the highest power setting.
The accurate tracking provided a consistent and numerous(at one hertz) set of parameter differences for a single flight.These NG and TGT differences were averaged to form anend of flight indicator of condition for each of the thirtyHIDS flights. With a correction for the TQ bias, the 2σscatter bands (or uncertainty) about the mean of the end offlight estimates of NG and TGT were ±0.4% and ±100C,respectively. This parameter uncertainty is well within the3% change in NG and the 50°C change in TGT margins thatthe model studies have shown to be associated with adegraded engine reaching minimum acceptableperformance. Consequently, the T700 Simulink model canbe used to detect significant changes in engine conditionover a single flight. As well, it can be used to generate anend of flight indicator of condition that is suitable fortrending.
Fuzzy-Logic Scheme to Automate Detection Process
The automated detection scheme was developed, initially,for use in a HUMS ground station where its role is todetermine whether significant changes in engine conditionhave occurred within a flight, and if not, provide an end offlight estimate of condition for future prognostic trending.Given the high reliability of modern T700 engines, undernormal operational conditions, the occurrence of abnormalengine behaviour is likely to be a very infrequent event.However, when it does occur it must be detected, as soonas possible, and reliably so.
In this context, the benefits of the automated detector are:its capability to detect such abnormal operation within asingle flight, and its ability to significantly reduce theamount of flight data that needs to be manually screenedand processed by maintenance analysts, at the groundstation. Flights that are judged normal will be sent straightto archive, without further reference to an analyst, withonly the single end of flight estimate being saved, at theground station, for trending the long-term shift in enginecondition. Flights that are judged abnormal will providean alert to the ground station analyst, and only these flightswill need to be reviewed by the analyst.
Fuzzy logic was seen as a robust and practical way ofautomating the detection process. Indeed, the strength offuzzy logic is its ability to deal with decision-making in anenvironment of uncertainty and imprecision, which is thecase here.
In contrast to the more traditional numerical methods,fuzzy logic mimics human reasoning through the use oflinguistic variables whose values are words rather thannumbers. Such linguistic variables are represented byfuzzy sets and are defined by a membership function. Themembership function relates the numerical value of someparameter, generally measurable, over a given domain toits degree of membership of a linguistic variable.Consequently, this membership function provides themeans to represent imprecision or fuzziness. The role ofapproximate reasoning is carried out by a series of fuzzy if-then rules involving the various linguistic variables.Importantly, all these rules or propositions are evaluated inparallel, and not in series as in conventional expert systems.The final stage of the fuzzy reasoning process is calleddefuzzification. Here, the solution linguistic variable, oroutput fuzzy variable, is converted to its expectednumerical value. The fact that both the inputs and outputsof a fuzzy logic scheme are crisp – measurable - numbersmeans that it can readily be used in many practicalapplications, eg control of complex machines.
End of Flight TGT Margin Indicator - Port Engine
-20
-10
0
10
20
30
40
50
Flights
Del
ta T
GT
(0 C
)
Simulated Degradation
2σσσσ
Figure 10: Model generates end-of-flight estimatessuitable for trending long-term degradation
DSTO-HUMS2001 CDROM
Paper 5-12 page - 10
Fuzzy-logic was used to carry out three tasks, they were: tocorrect the biases in the Simulink model output; todetermine the instantaneous level of engine condition ateach flight data point; and to combine the instantaneousindicators into an overall end of flight indicator ofcondition. These three tasks were implemented using theMatlab fuzzy logic toolbox and the Simulink codingenvironment. These three tasks are described, in moredetail, below.
The role of the T700 Simulink model in the detectionscheme is to provide the reference point, for an engine ingood condition and behaving normally, against whichcurrent engine behaviour can be compared. Whilst theT700 Simulink model has demonstrated a capability toaccurately track real engine data, small model biases didexist and these needed to be corrected for to provide amore accurate end of flight indicator. The process ofmanually correcting the biases at the end of each flight, asdone in the evaluation of the T700 Simulink model, was atedious and time consuming process, and so an automatedapproach to the task was sought.
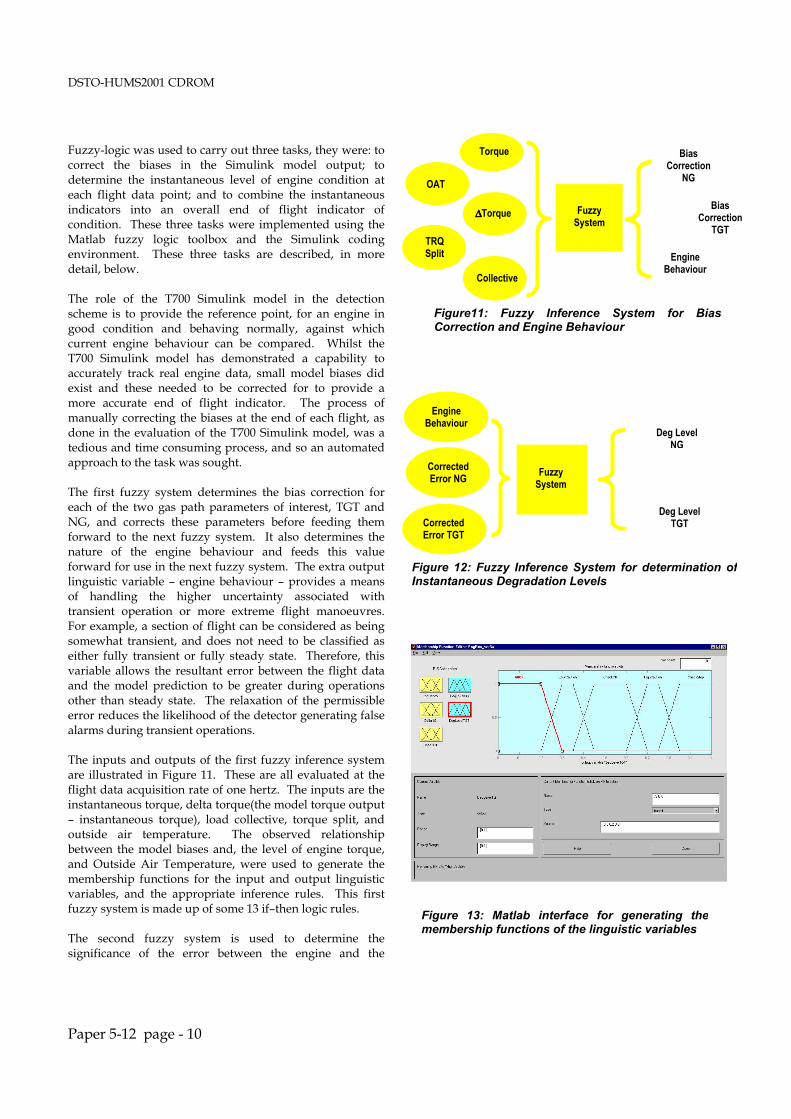
The first fuzzy system determines the bias correction foreach of the two gas path parameters of interest, TGT andNG, and corrects these parameters before feeding themforward to the next fuzzy system. It also determines thenature of the engine behaviour and feeds this valueforward for use in the next fuzzy system. The extra outputlinguistic variable – engine behaviour – provides a meansof handling the higher uncertainty associated withtransient operation or more extreme flight manoeuvres.For example, a section of flight can be considered as beingsomewhat transient, and does not need to be classified aseither fully transient or fully steady state. Therefore, thisvariable allows the resultant error between the flight dataand the model prediction to be greater during operationsother than steady state. The relaxation of the permissibleerror reduces the likelihood of the detector generating falsealarms during transient operations.
The inputs and outputs of the first fuzzy inference systemare illustrated in Figure 11. These are all evaluated at theflight data acquisition rate of one hertz. The inputs are theinstantaneous torque, delta torque(the model torque output– instantaneous torque), load collective, torque split, andoutside air temperature. The observed relationshipbetween the model biases and, the level of engine torque,and Outside Air Temperature, were used to generate themembership functions for the input and output linguisticvariables, and the appropriate inference rules. This firstfuzzy system is made up of some 13 if–then logic rules.
The second fuzzy system is used to determine thesignificance of the error between the engine and the
Figure 13: Matlab interface for generating themembership functions of the linguistic variables
FuzzySystem
∆∆∆∆TorqueBias
CorrectionTGT
BiasCorrection
NGOAT
Collective
TRQSplit
Torque
EngineBehaviour
Figure11: Fuzzy Inference System for BiasCorrection and Engine Behaviour
FuzzySystem
EngineBehaviour
Deg LevelTGT
CorrectedError NG
CorrectedError TGT
Deg LevelNG
Figure 12: Fuzzy Inference System for determination ofInstantaneous Degradation Levels

DSTO-HUMS2001 CDROM
Paper 5-12 page - 11
reference Simulink model, at each instance of the flight.Hence, it seeks to provide an instantaneous indication ofengine condition throughout the flight.
The inputs and outputs of this second fuzzy inferencesystem are illustrated in Figure 12. These are againevaluated at the flight data acquisition rate of one hertz.The inputs are the engine behaviour variable, and thecorrected model error of TGT and NG. The outputs are theinstantaneous levels of degradation of TGT and NG.Essentially, the membership functions and inference ruleswere generated heuristically. The engine behaviourvariable allowed greater error levels during transientoperation and lower error levels in steady-state operation.The interface used to generate the membership functions,fuzzy sets, is illustrated in Figure 13. It shows the outputlinguistic variable for the degradation level of TGT. Thefive fuzzy sets are all_OK, low_caution, caution,high_caution, and warning. Some 42 if-then rules wereused to determine the instantaneous level of degradation.
The third fuzzy inference system involves a two stepprocess to determine the end of flight estimate of condition.In the first step, the five output degradation variables areinput into a fuzzy system that examines the instantaneousdegradation level over an eight point interval to eliminaterogue error spikes, and reduce the output variable to onlythree possible outcomes. These are: all_OK, caution, andwarning. The typical output of this system is shown inFigure 14. In the second step, the overall end of flightindicator is generated. For this purpose, as illustrated inFigure 14, the flight is separated into 5-minute sections, andwith the use of fuzzy logic, the classification of each sectionis determined. A final classification of the flight isdetermined by inputting the classifications of the currentand previous sections, together with their location in theflight into a final fuzzy system. This system adds extraweight to degradation occurring at the end of the flight,and less to degradation occurring at the start of a flight.
Counter TGT Port Engine
0
1
2
3
1 101 201 301 401 501 601 701 801 901 1001Time (s)1.
D
egra
dat
ion
Lev
el 1 2 3
Figure 14: Classification of Degradation Levels intoFlight Sections
Figure 15: Automated Gas Path Detector - HighLevel Interface
Figure 16: Automated Gas Path Detector - SecondaryInterface
DSTO-HUMS2001 CDROM
Paper 5-12 page - 12
A Matlab interface has been developed to display theoverall results of the detection process and to allow ananalyst to further interrogate the results, if desired, rightback to the HUMS flight parameters. The high levelinterface and a secondary interface are shown in Figures 15and 16, respectively. This interface will facilitate theassessment and verification of the automated detector’sperformance.
The detector has been tested against flight data from somethirty SH-60 HIDS flights and it appears to be quite robust.Importantly, for these good engines it did not generatefalse alarms when dealing with the wide range of flightconditions involved. The detector’s performance in dealingwith abnormal operation was assessed by simulatingengine degradation, through variations in NG and TGTover the flight. Figure 14 is an example of a flight where a30°C bias was added to the TGT profile. In this case, thedetector produced the appropriate end of flight caution.Indeed, the performance of this initial formulation has beenbetter than expected and it is handling this complex taskwith relative ease. What now needs to be done is to extendthe evaluation to a much larger sample of HUMS flight testdata. This will be carried out under the auspices of theTTCP collaborative program.
CONCLUSION
Good progress has been made towards the development ofmodel-based decision support tools for T700 engine healthmonitoring. Two prototype tools have been presentedhere, the Model–Based Power Assurance Estimator and theAutomated Gas Path Condition Detector. These tools areproposed for use in military helicopters that will be retro-fitted with modern Health and Usage Monitoring Systems(HUMS), in particular, with HUMS that record engineparameters over the entire flight.
The capabilities of both prototypes have been successfullydemonstrated against a limited set of operational and trialdata. The next step is to undertake a more comprehensiveevaluation of these tools using data from AustralianDefence Force Black Hawk operations, and from the USNavy Integrated Mechanical Diagnostics Program’s flighttrials.
REFERENCES
1. Frith, P.C.W., Karvounis, G. and Carter, S.H., A Model-Based Approach to Engine Health Monitoring of MilitaryHelicopters. AHS, Third Australian Pacific VertifliteConference, Canberra, July 12-14, 2000.
2. Hardman,B., Hess,A., and Neubert,C., SH-60 HelicopterIntegrated Diagnostic System (HIDS) Program Experienceand Results of Seeded Fault Testing. American HelicopterSociety 54th Annual Forum, Washington, DC, May 20-22,1998.
3. Prescot Warren E., T700-701 Training Guide, SEI-734, GEAircraft Engines Technical Training Operation, Lynn, Mass,USA, February 1988.
4. Ballin, Mark G., A High Fidelity Real-Time Simulation ofa Small Turboshaft Engine, NASA Technical Memorandum100991, NASA Ames Research Centre, Moffet Field,California, USA, July 1988.
5. Ballin, Mark G., Validation of a Real-Time EngineeringSimulation of the UH-60A Helicopter, NASA TechnicalMemorandum 88360, NASA Ames Research Centre, MoffetField, California, USA, February 1987.
6. Frith P.C.W., The Effect of Compressor Rotor Tip Cropson Turboshaft Engine Performance. ASME Journal ofEngineering for Gas Turbines and Power,Vol.116,No.1,January 1994, pp184-189, also 37th ASME IGTI Conference,Cologne,Germany, Paper 92-GT-83, June 1992.
7. Frith, P.C.W., Diagnosis of Compressor Degradation inHelicopter Engines. 5th Australian AeronauticalConference, Melbourne, September 1993, pp389-395.I.E.(Aust) Publication No. 93/6.
8. Karvounis, G. and Frith, P.C.W., A Model-Based PowerAssurance Program for Black Hawk Helicopter Engines: AUser’s Guide. DSTO, Aeronautical and Maritime ResearchLaboratory, DSTO-GD-, 2001.
9. Carter,S.H. and Frith, P.C.W., A MATLAB-Simulinkmodel of a twin engine helicopter installation of the T700turboshaft engine. DSTO, Aeronautical and MaritimeResearch Laboratory, DSTO-TR-0795, March 1999.