Embed Size (px)
DESCRIPTION
5 challenges facing neighborhoods-tucson presentation by Susan Williams
Citation preview
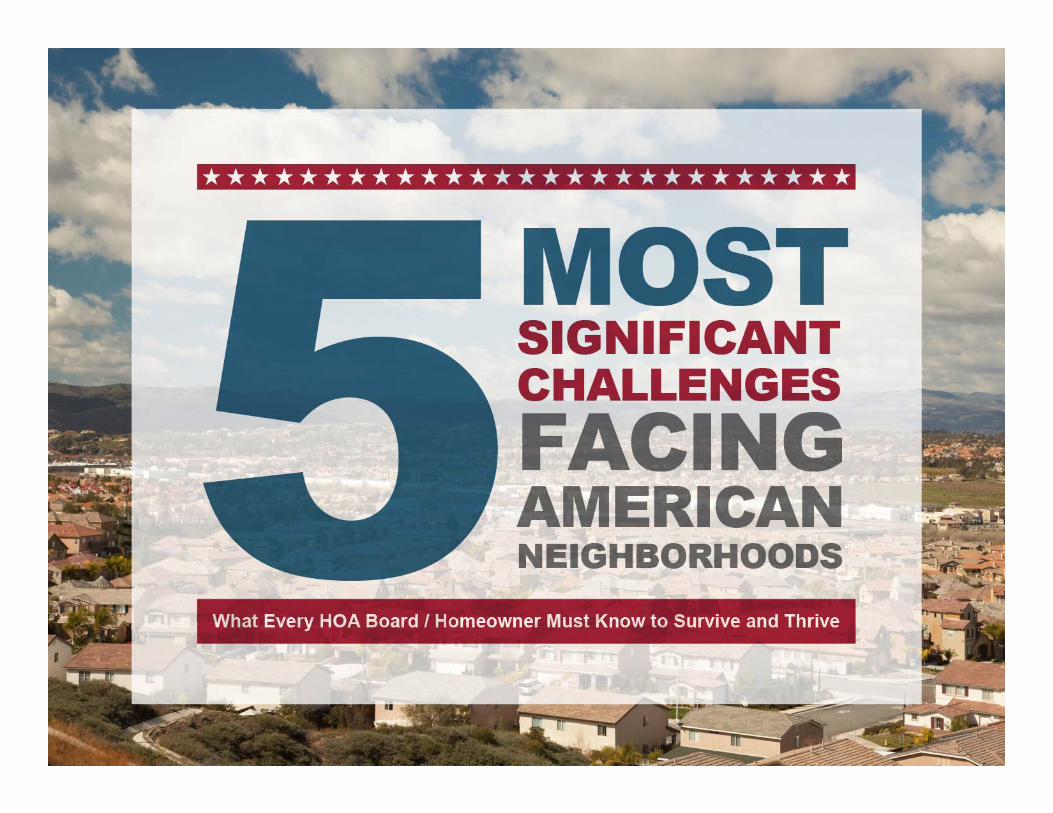
CHALLENGES FACING AMERICAN NEIGHBORHOODS
Researched and produced as a service to our industry by:
Presented by Susan WilliamsVice President, Business Development and Marketing
As the US population changes, our communities are becoming more diverse and homeowners are experiencing new and challenging situations.
As the pace of life speeds up and technology expands people are connecting with each other less.
We began to get a different picture of the state of American neighborhoods.
As a service to our clients, we committed to a full research study, to investigate these trends, particularly in the communities we serve.
THE LANDSCAPE
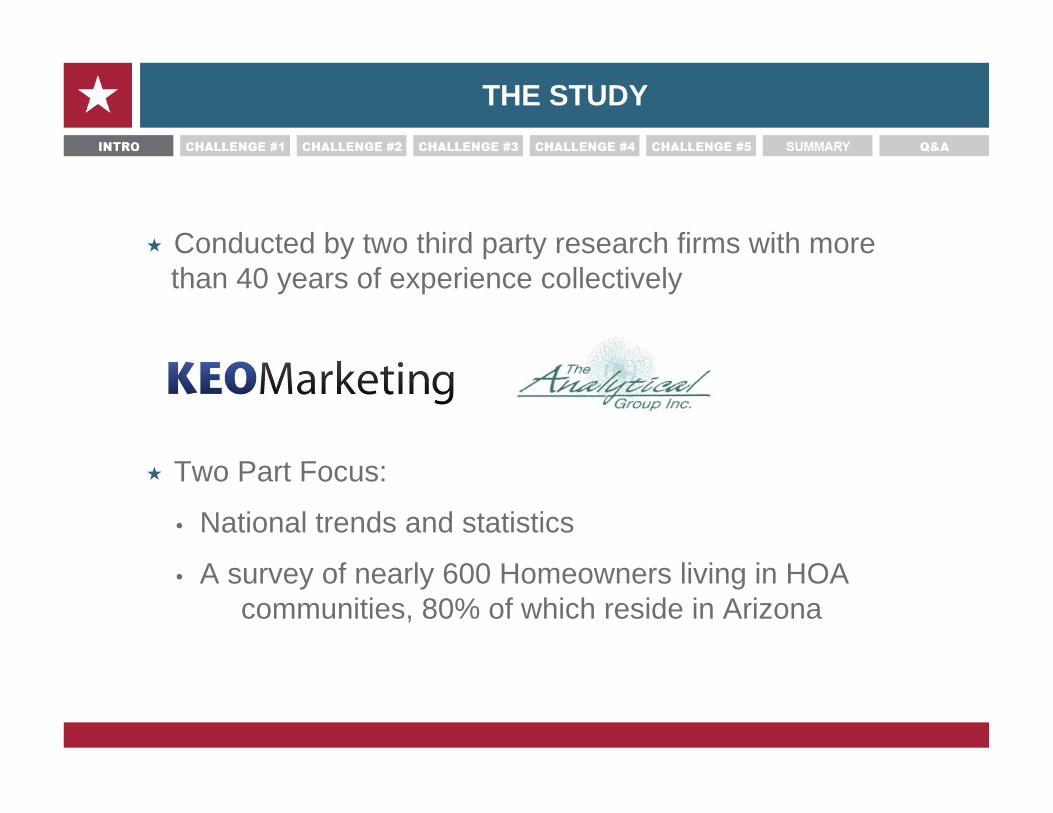
Conducted by two third party research firms with more than 40 years of experience collectively
Two Part Focus:
• National trends and statistics
• A survey of nearly 600 Homeowners living in HOA communities, 80% of which reside in Arizona
THE STUDY
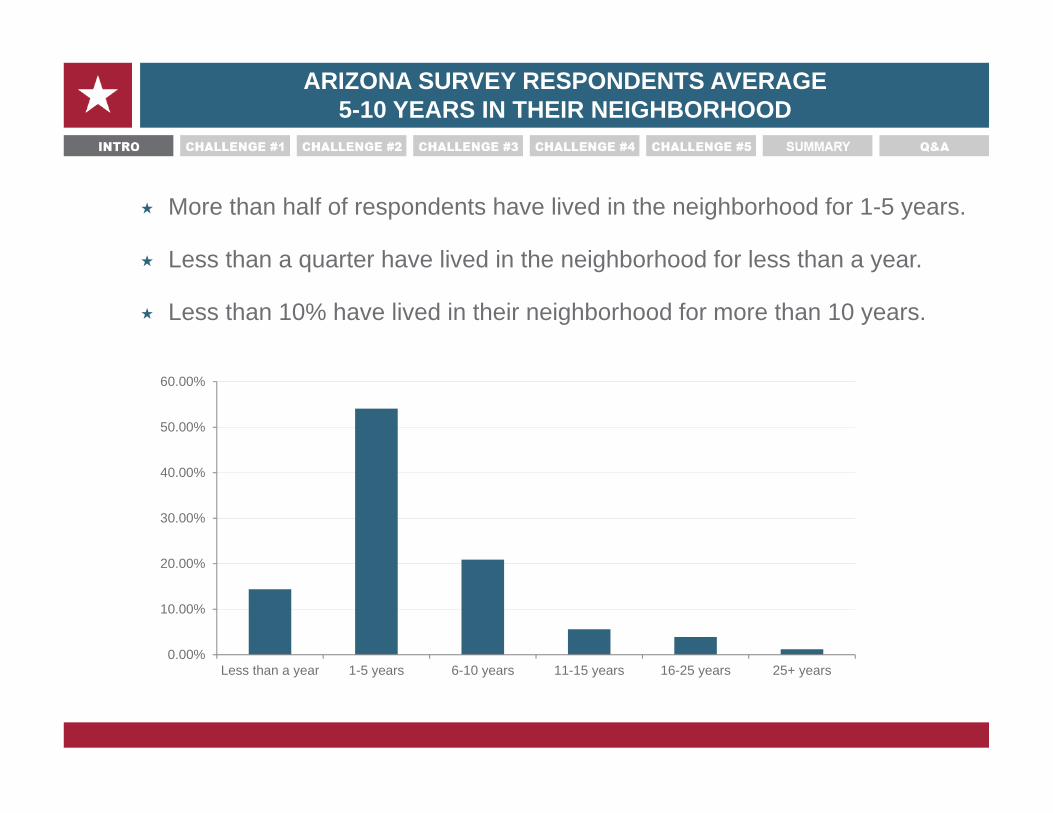
More than half of respondents have lived in the neighborhood for 1-5 years.
Less than a quarter have lived in the neighborhood for less than a year.
Less than 10% have lived in their neighborhood for more than 10 years.
ARIZONA SURVEY RESPONDENTS AVERAGE 5-10 YEARS IN THEIR NEIGHBORHOOD
0.00%
10.00%
20.00%
30.00%
40.00%
50.00%
60.00%
Less than a year 1-5 years 6-10 years 11-15 years 16-25 years 25+ years
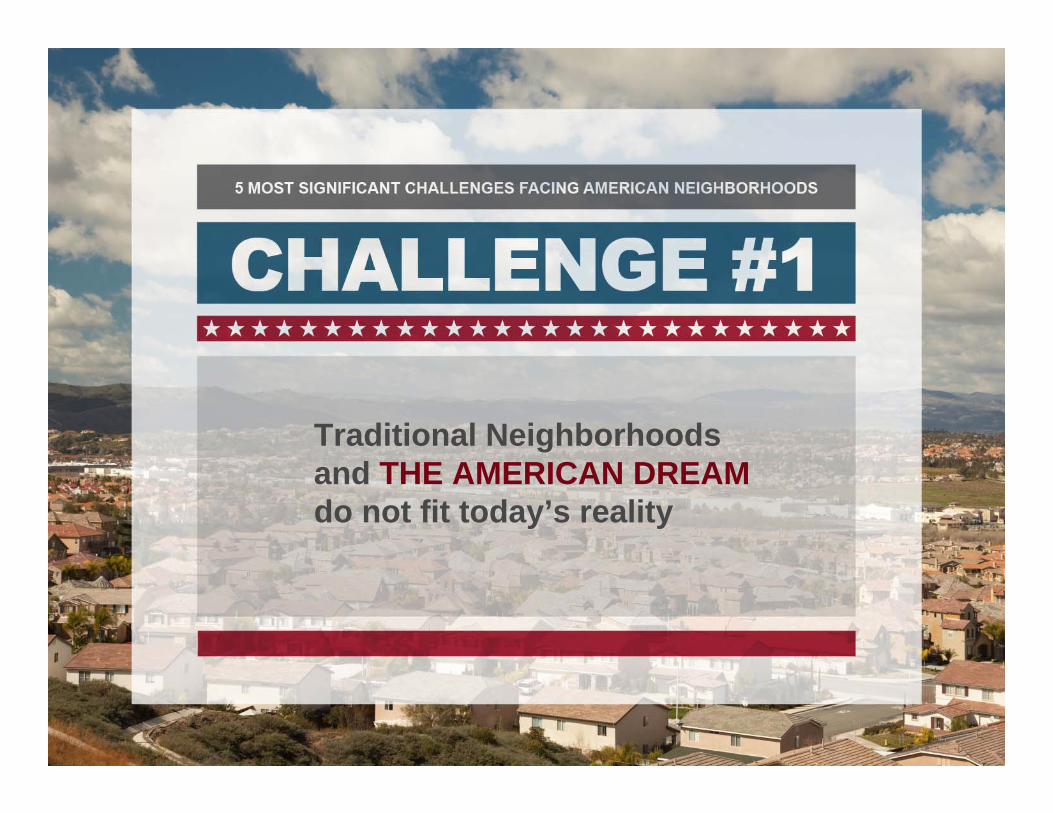
Traditional Neighborhoods and THE AMERICAN DREAMdo not fit today’s reality
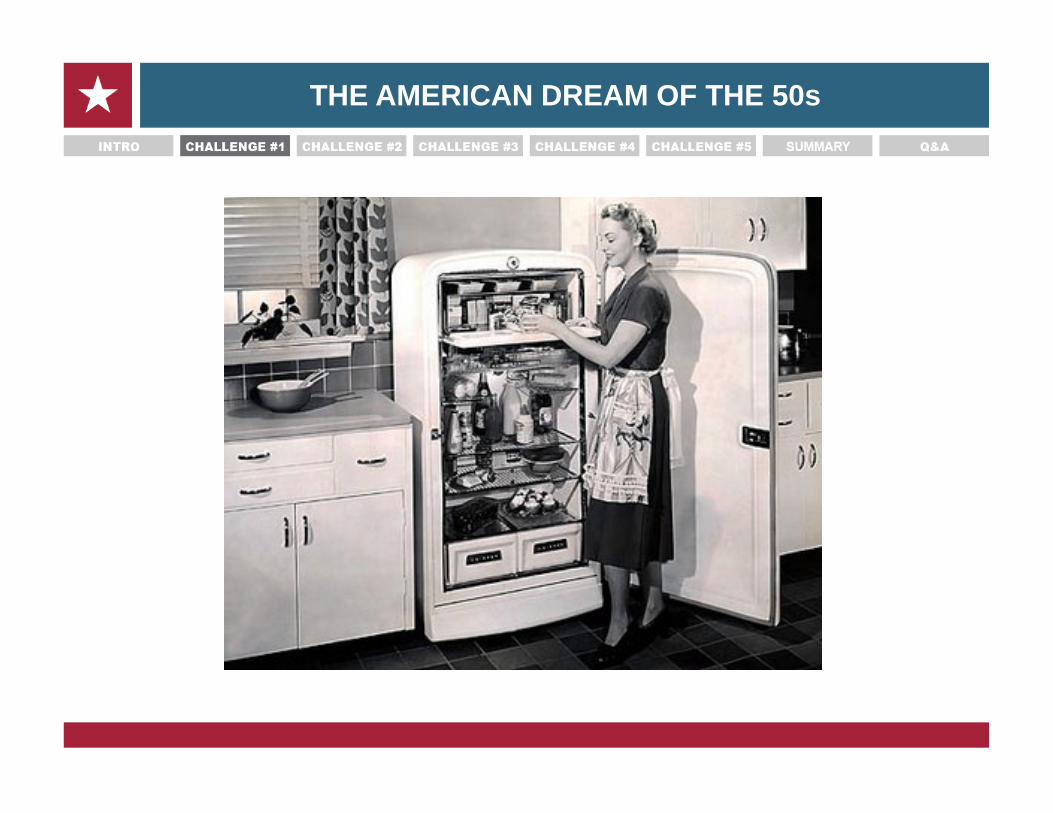
THE AMERICAN DREAM OF THE 50s
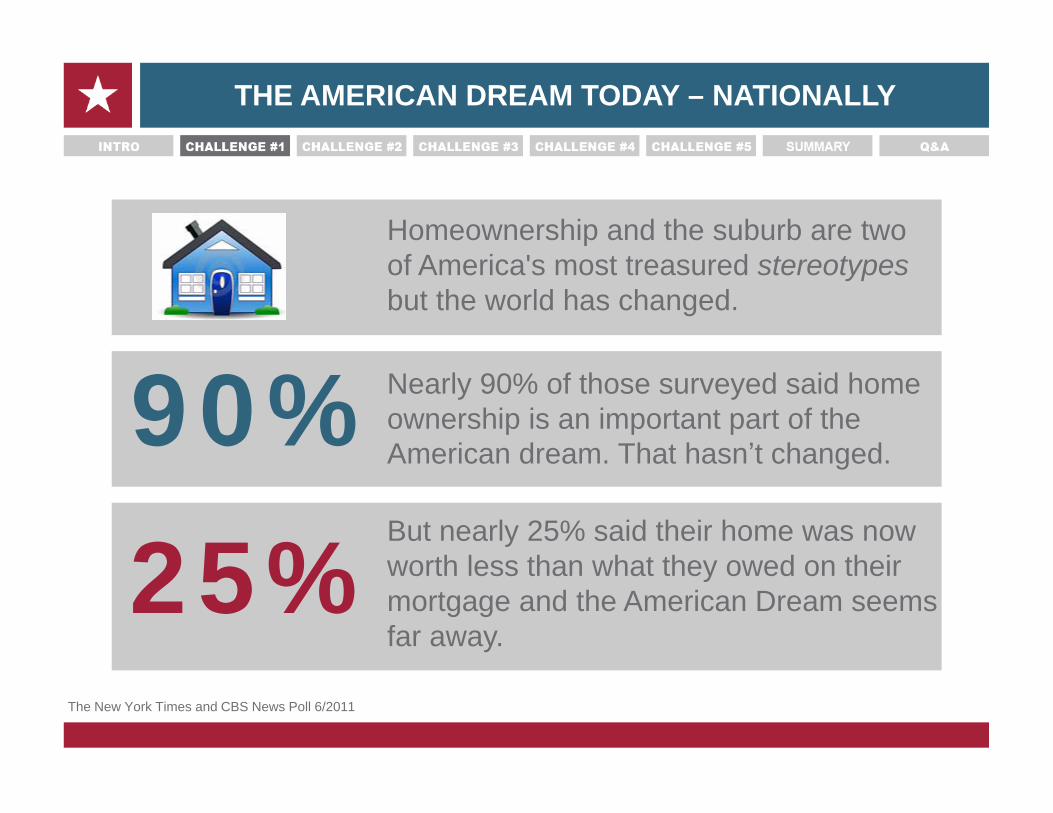
THE AMERICAN DREAM TODAY – NATIONALLY
Homeownership and the suburb are two of America's most treasured stereotypes but the world has changed.
Nearly 90% of those surveyed said home ownership is an important part of the American dream. That hasn’t changed.
But nearly 25% said their home was now worth less than what they owed on their mortgage and the American Dream seems far away.
90%25%
The New York Times and CBS News Poll 6/2011
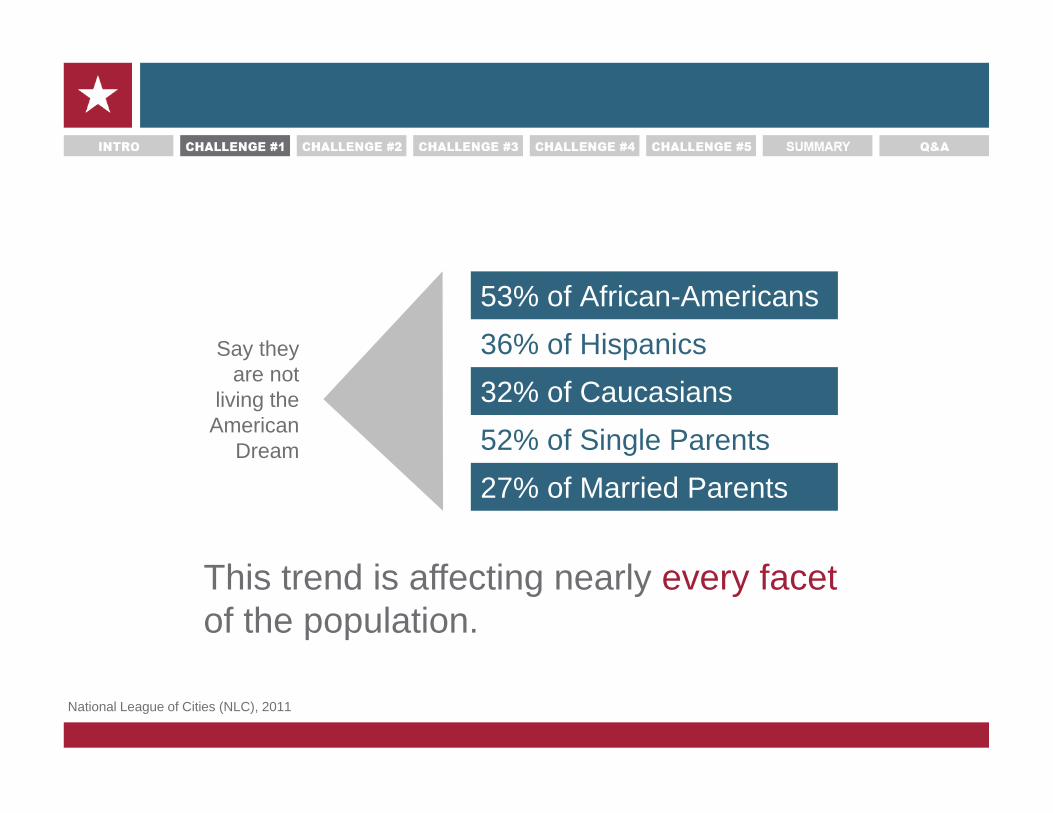
53% of African-Americans
This trend is affecting nearly every facetof the population.
36% of Hispanics32% of Caucasians52% of Single Parents27% of Married Parents
Say they are not
living the American
Dream
National League of Cities (NLC), 2011
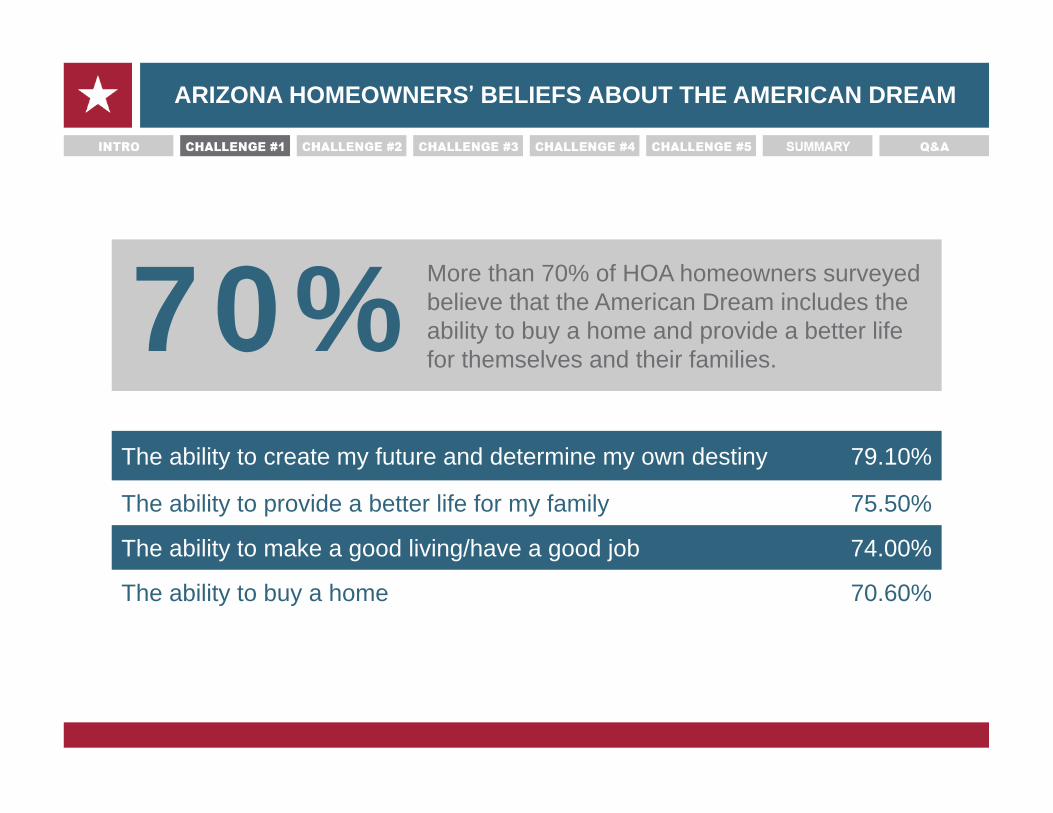
The ability to create my future and determine my own destiny 79.10%
The ability to provide a better life for my family 75.50%
The ability to make a good living/have a good job 74.00%
The ability to buy a home 70.60%
More than 70% of HOA homeowners surveyed believe that the American Dream includes the ability to buy a home and provide a better life for themselves and their families.
ARIZONA HOMEOWNERS’ BELIEFS ABOUT THE AMERICAN DREAM
70%
US Population andLiving Situations are MORE DIVERSEthan ever before
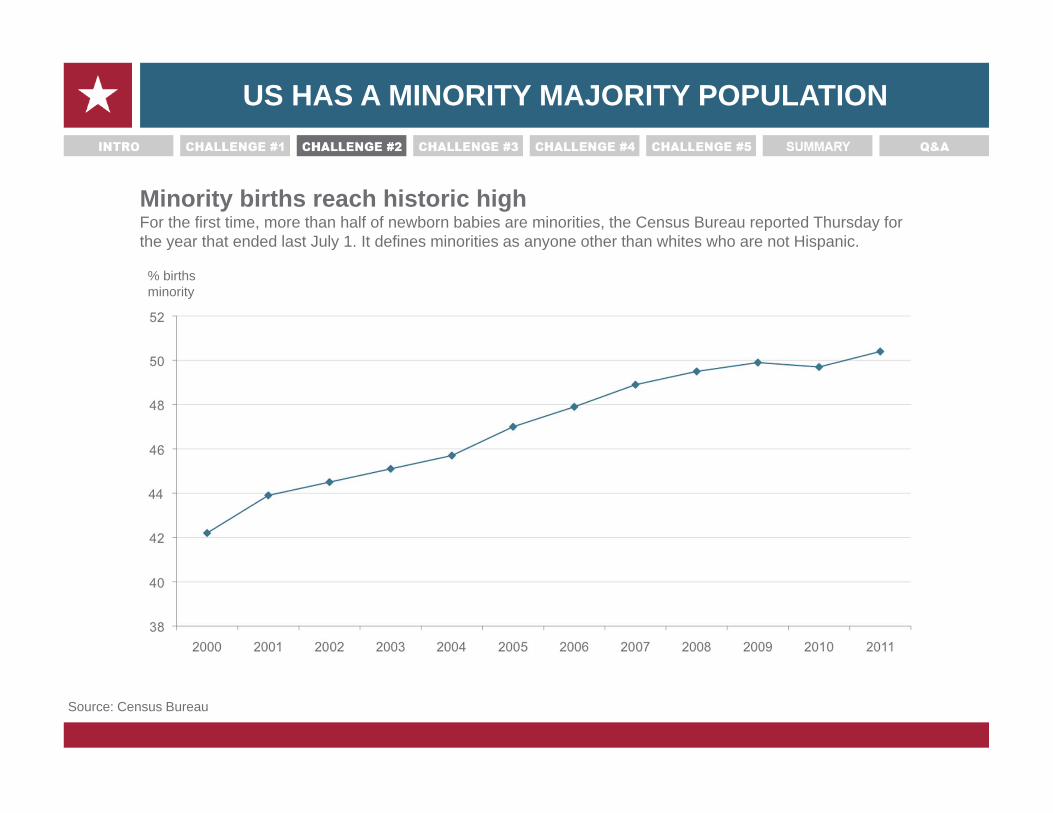
US HAS A MINORITY MAJORITY POPULATION
Minority births reach historic highFor the first time, more than half of newborn babies are minorities, the Census Bureau reported Thursday for the year that ended last July 1. It defines minorities as anyone other than whites who are not Hispanic.
Source: Census Bureau
% birthsminority
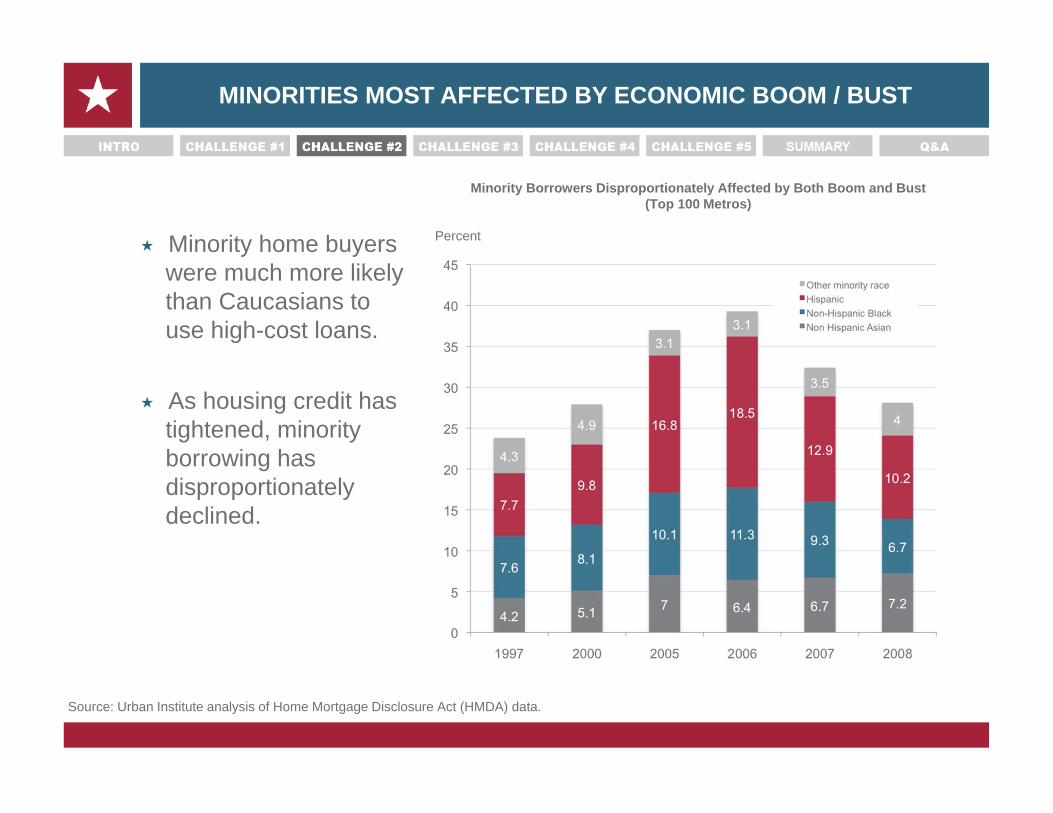
MINORITIES MOST AFFECTED BY ECONOMIC BOOM / BUST
Minority home buyers were much more likely than Caucasians to use high-cost loans.
As housing credit has tightened, minority borrowing has disproportionately declined.
Minority Borrowers Disproportionately Affected by Both Boom and Bust(Top 100 Metros)
Source: Urban Institute analysis of Home Mortgage Disclosure Act (HMDA) data.
Percent
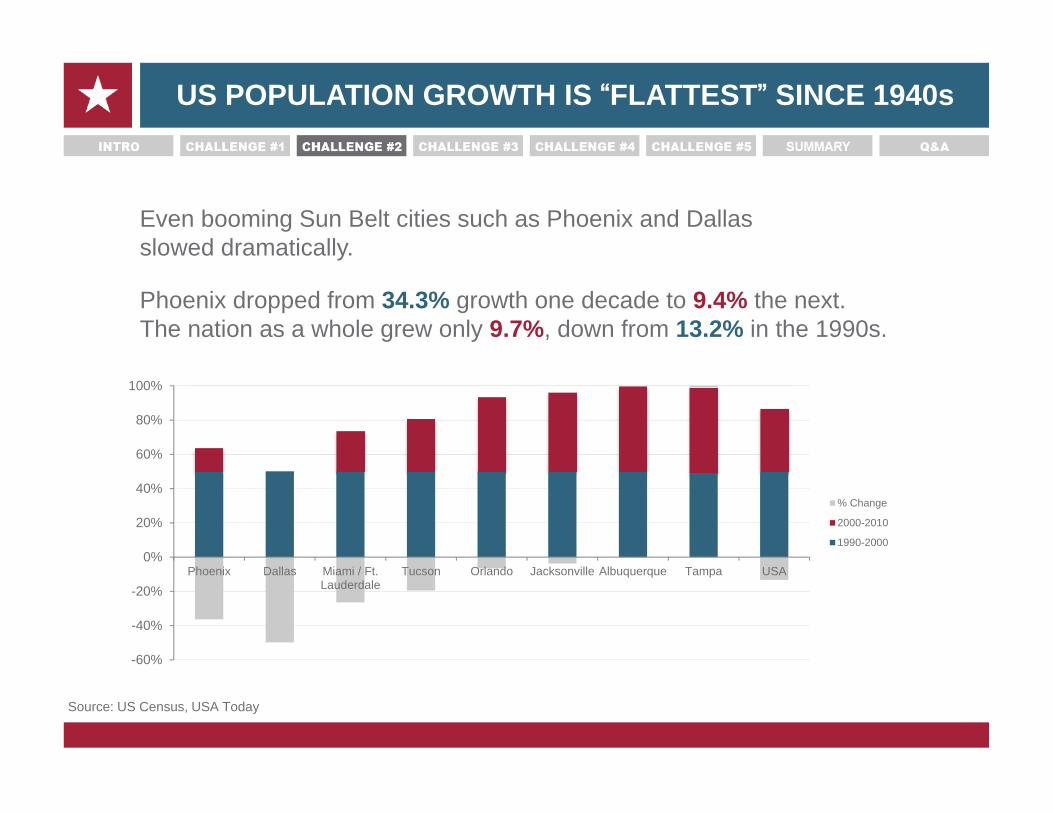
Even booming Sun Belt cities such as Phoenix and Dallas slowed dramatically.
Phoenix dropped from 34.3% growth one decade to 9.4% the next. The nation as a whole grew only 9.7%, down from 13.2% in the 1990s.
US POPULATION GROWTH IS “FLATTEST” SINCE 1940s
-60%
-40%
-20%
0%
20%
40%
60%
80%
100%
Phoenix Dallas Miami / Ft.Lauderdale
Tucson Orlando Jacksonville Albuquerque Tampa USA
% Change
2000-2010
1990-2000
Source: US Census, USA Today
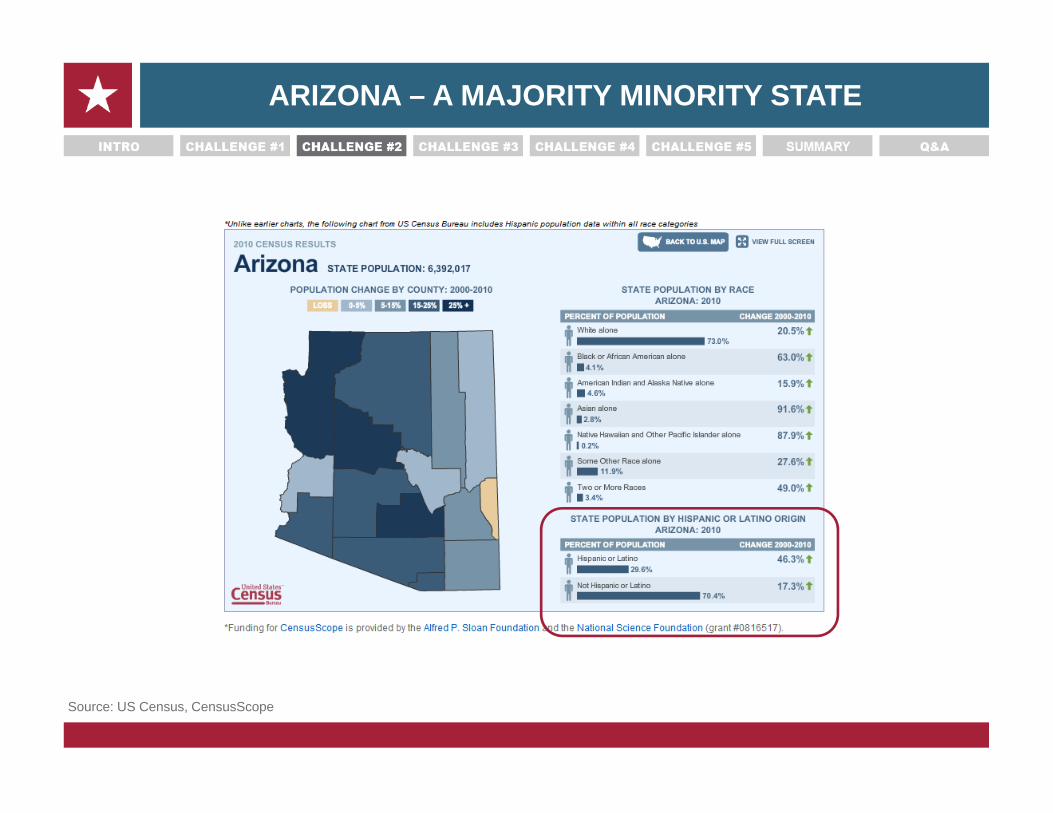
ARIZONA – A MAJORITY MINORITY STATE
Source: US Census, CensusScope
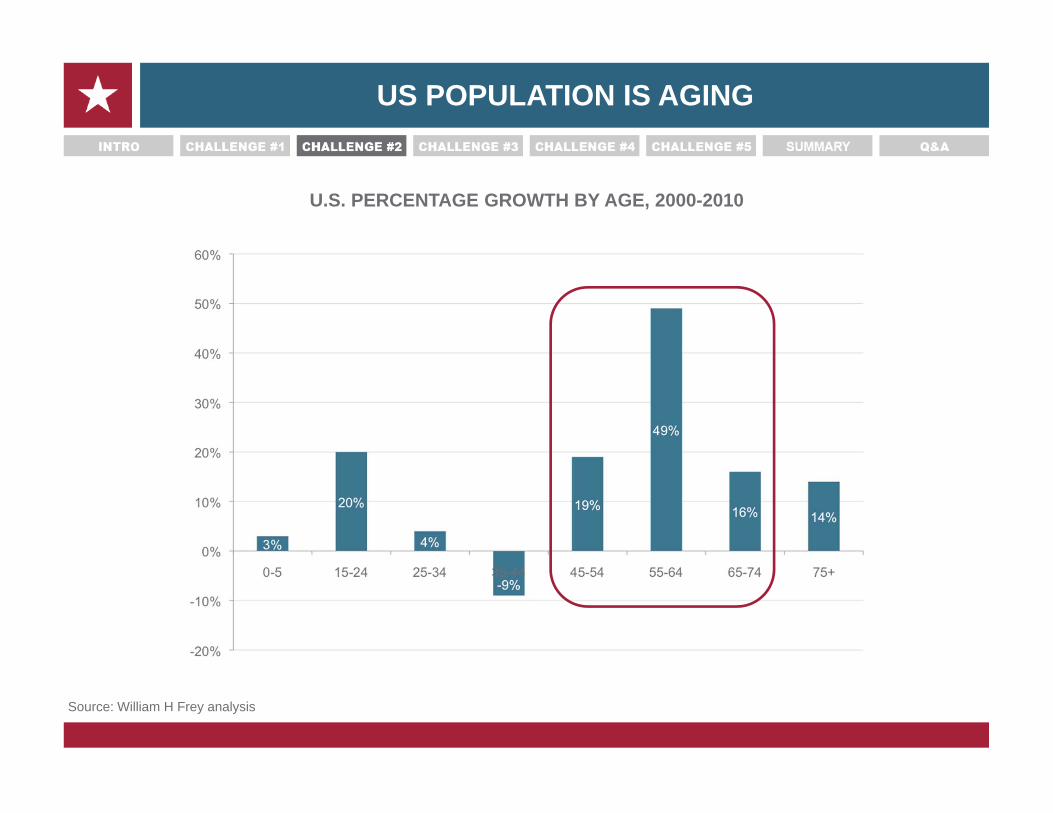
US POPULATION IS AGING
Source: William H Frey analysis
U.S. PERCENTAGE GROWTH BY AGE, 2000-2010
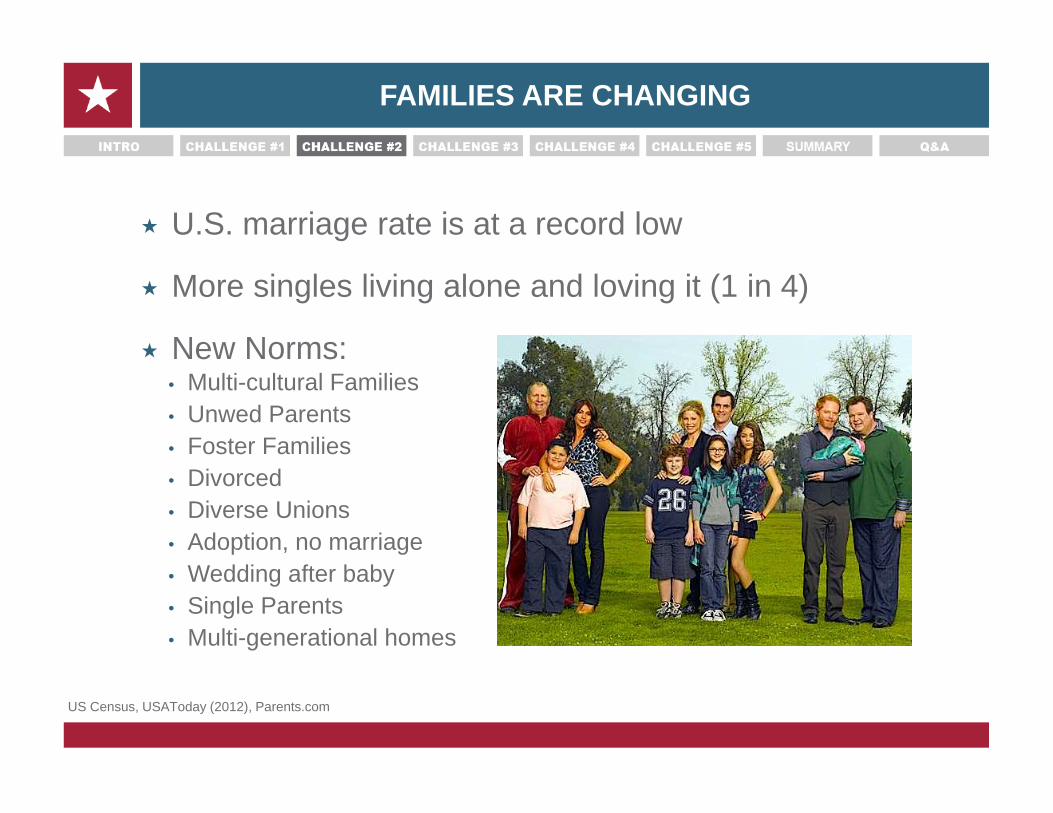
FAMILIES ARE CHANGING
U.S. marriage rate is at a record low
More singles living alone and loving it (1 in 4)
New Norms:• Multi-cultural Families• Unwed Parents• Foster Families• Divorced • Diverse Unions• Adoption, no marriage• Wedding after baby• Single Parents• Multi-generational homes
US Census, USAToday (2012), Parents.com
AS A RESULT, THERE IS NO NEW NORM
Catalyst Analytics 2011
In a large city, for example, the price of a home in one area of the city can be dramatically different from the exact same home 8 miles away.
So can the make-up of the individuals living in the virtually same homes just 8 miles apart.
There can be major differences in income, age, ethnicities, number of persons occupying the home and significant differences in their lifestyles and spending patterns.
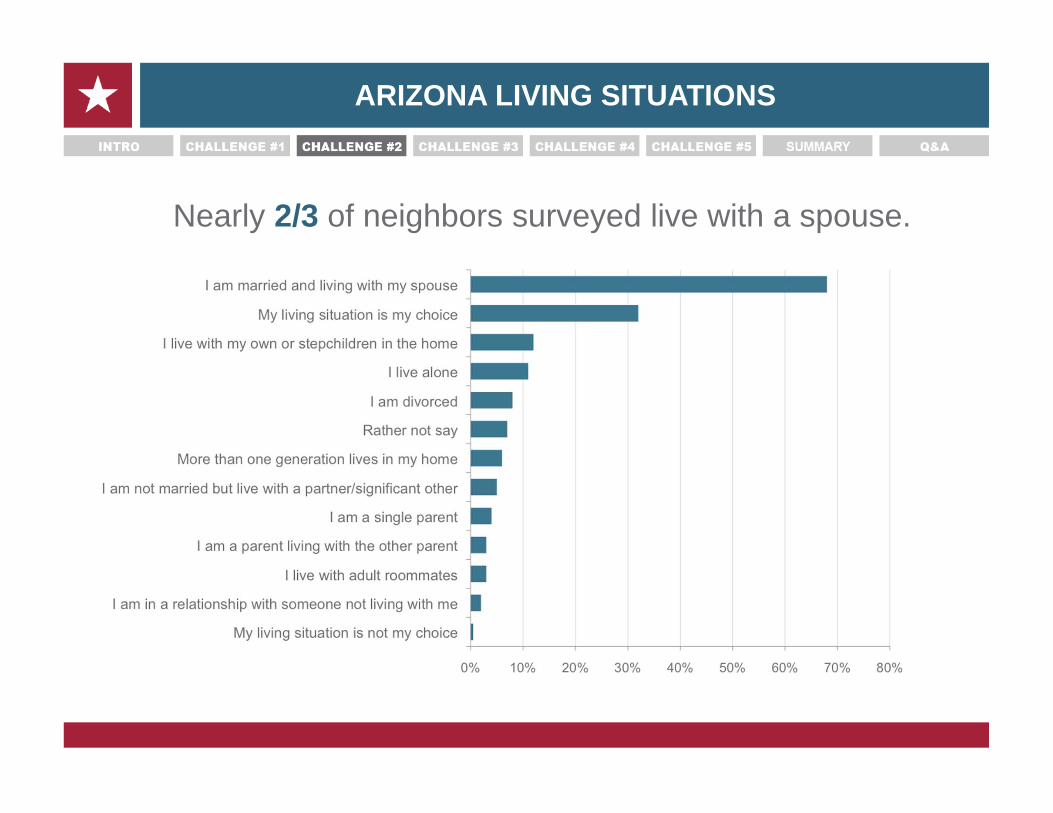
ARIZONA LIVING SITUATIONS
Nearly 2/3 of neighbors surveyed live with a spouse.
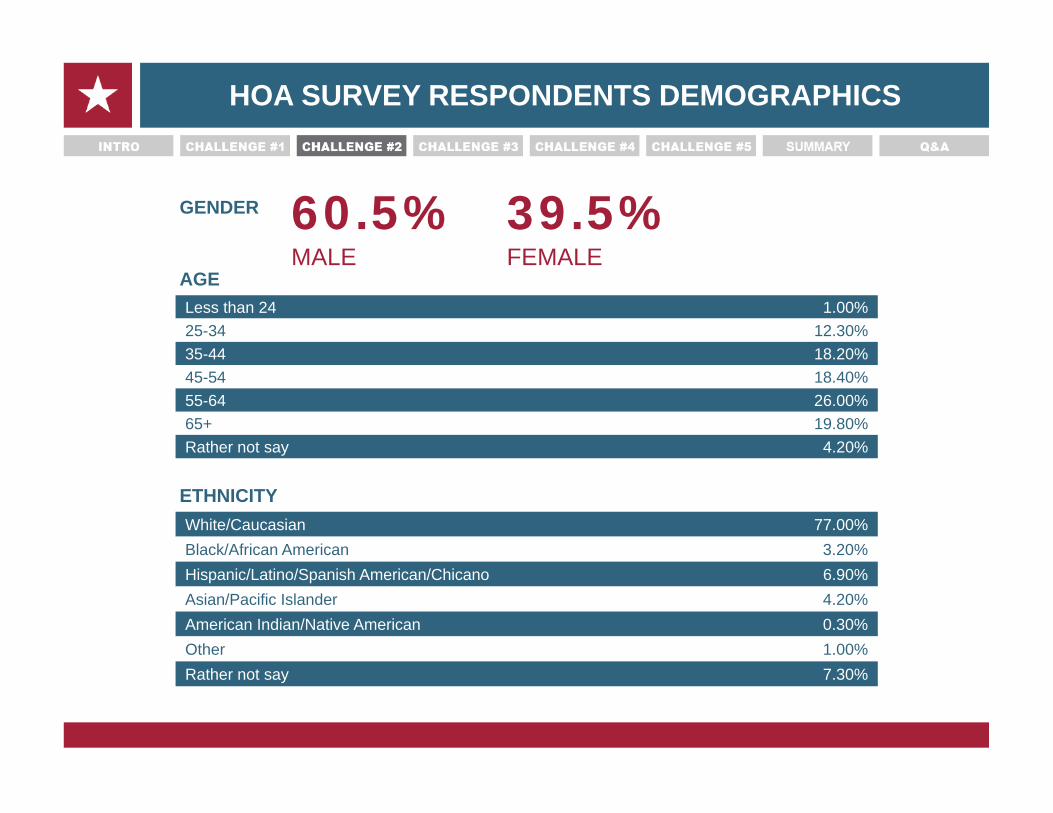
HOA SURVEY RESPONDENTS DEMOGRAPHICS
Less than 24 1.00%25-34 12.30%35-44 18.20%45-54 18.40%55-64 26.00%65+ 19.80%Rather not say 4.20%
AGE
White/Caucasian 77.00%Black/African American 3.20%Hispanic/Latino/Spanish American/Chicano 6.90%Asian/Pacific Islander 4.20%American Indian/Native American 0.30%Other 1.00%Rather not say 7.30%
ETHNICITY
GENDER 60.5% MALE
39.5%FEMALE
Americans are Feeling INSTABILITY
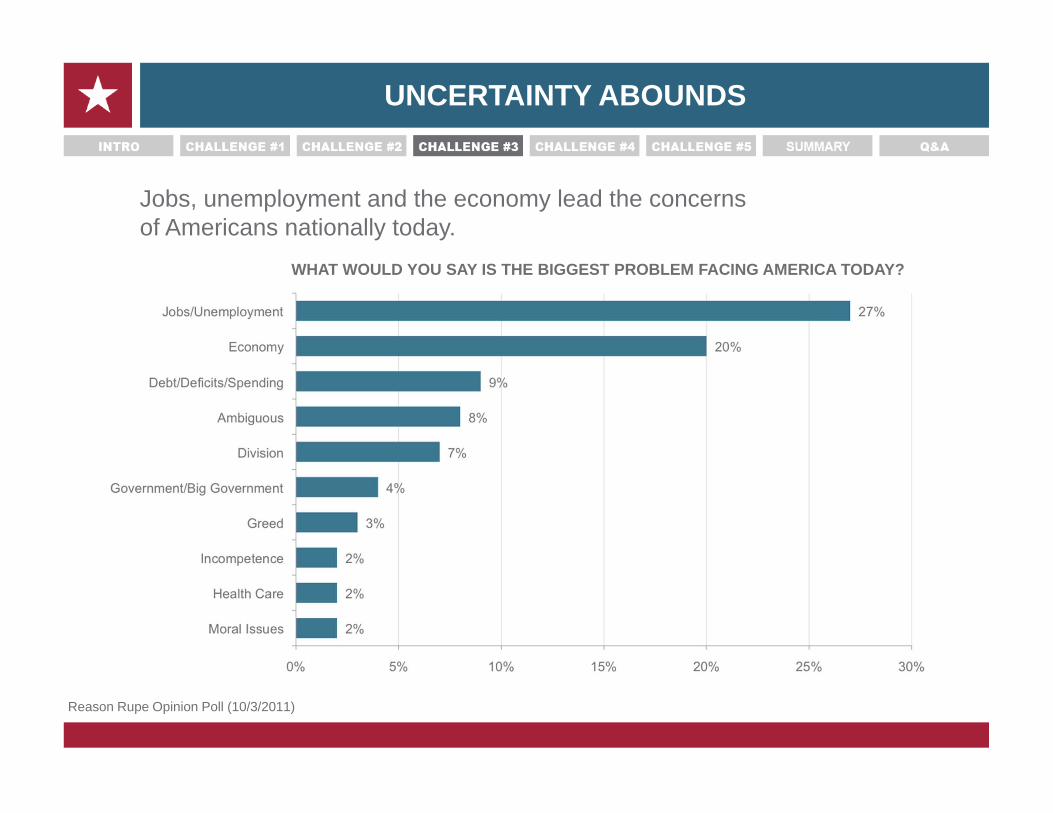
UNCERTAINTY ABOUNDS
Reason Rupe Opinion Poll (10/3/2011)
Jobs, unemployment and the economy lead the concerns of Americans nationally today.
WHAT WOULD YOU SAY IS THE BIGGEST PROBLEM FACING AMERICA TODAY?
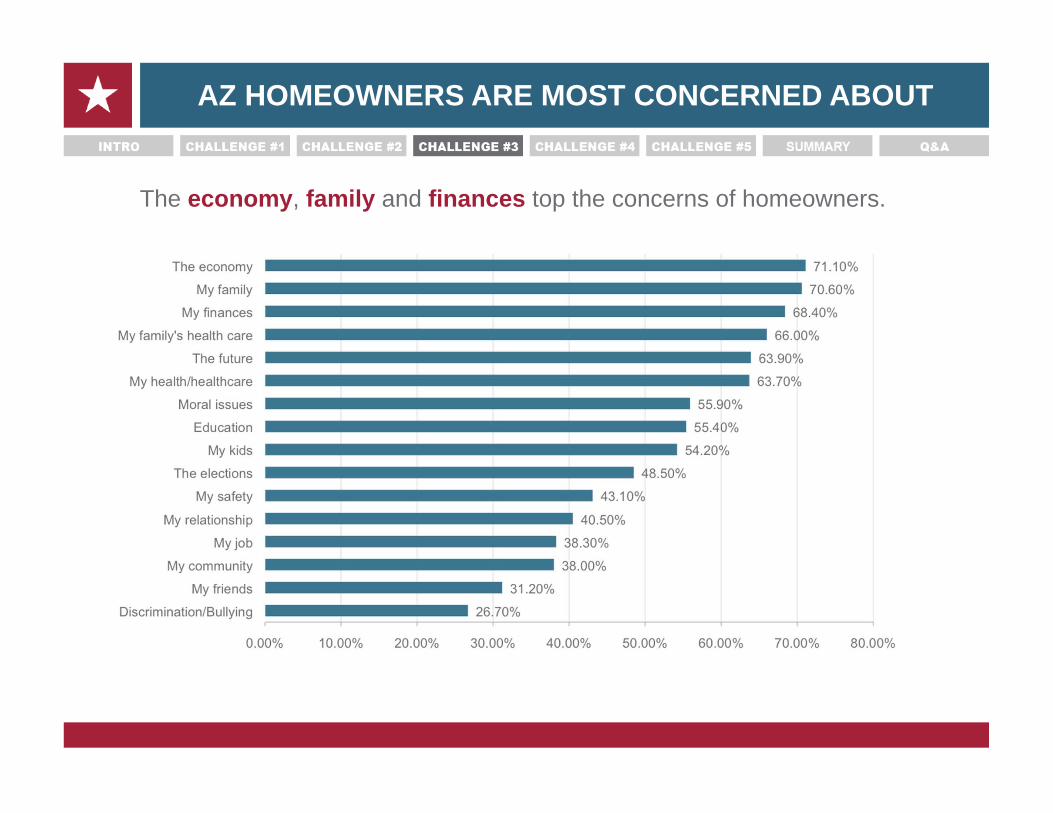
AZ HOMEOWNERS ARE MOST CONCERNED ABOUT
The economy, family and finances top the concerns of homeowners.
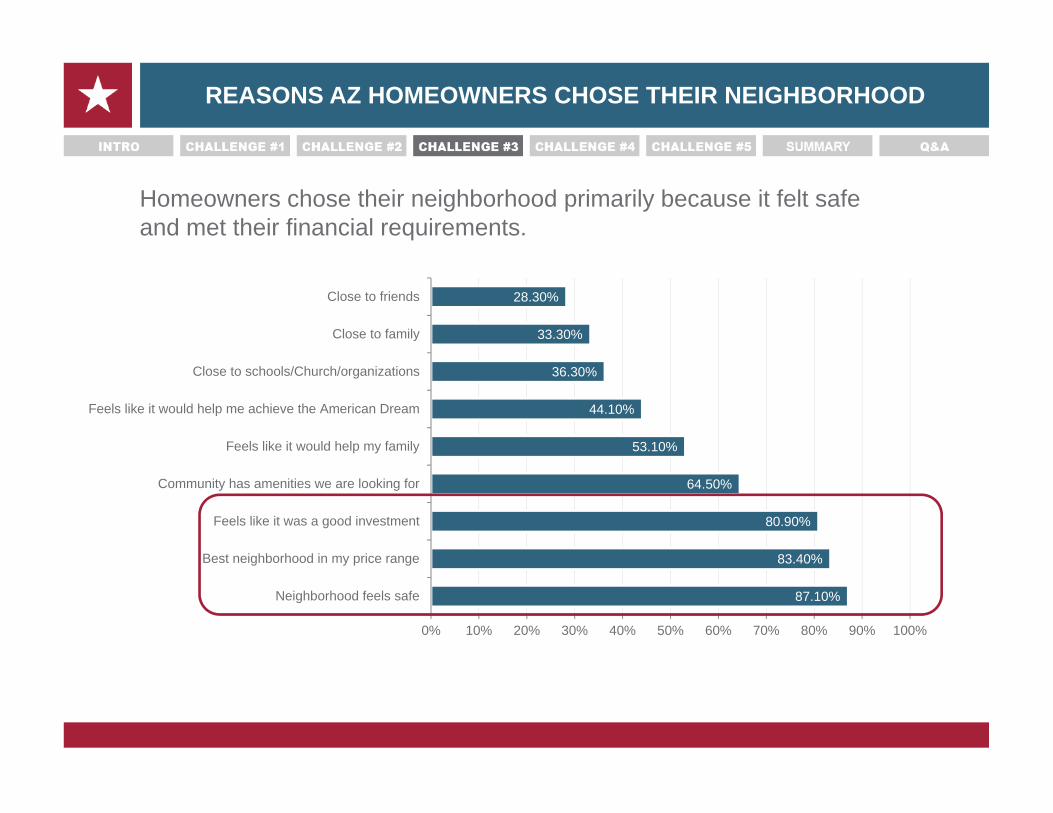
REASONS AZ HOMEOWNERS CHOSE THEIR NEIGHBORHOOD
87.10%
83.40%
80.90%
64.50%
53.10%
44.10%
36.30%
33.30%
28.30%
0% 10% 20% 30% 40% 50% 60% 70% 80% 90% 100%
Neighborhood feels safe
Best neighborhood in my price range
Feels like it was a good investment
Community has amenities we are looking for
Feels like it would help my family
Feels like it would help me achieve the American Dream
Close to schools/Church/organizations
Close to family
Close to friends
Homeowners chose their neighborhood primarily because it felt safe and met their financial requirements.
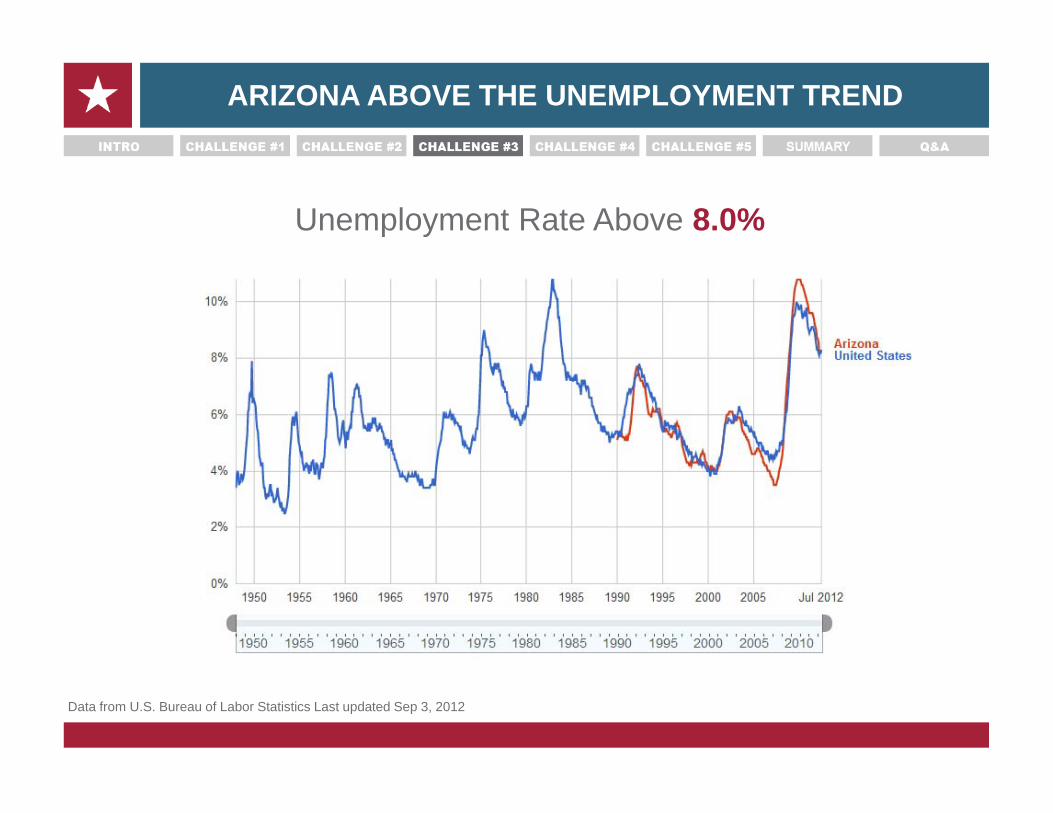
Unemployment Rate Above 8.0%
Data from U.S. Bureau of Labor Statistics Last updated Sep 3, 2012
ARIZONA ABOVE THE UNEMPLOYMENT TREND
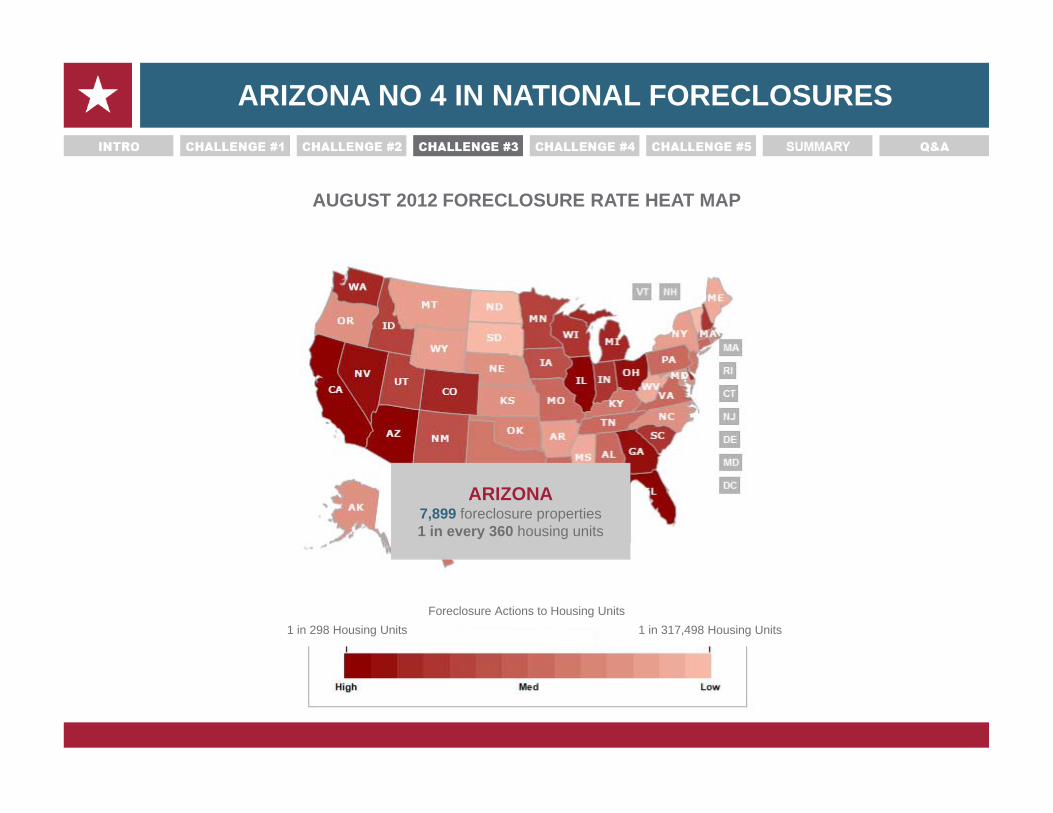
ARIZONA NO 4 IN NATIONAL FORECLOSURES
AUGUST 2012 FORECLOSURE RATE HEAT MAP
ARIZONA7,899 foreclosure properties1 in every 360 housing units
Foreclosure Actions to Housing Units1 in 317,498 Housing Units1 in 298 Housing Units
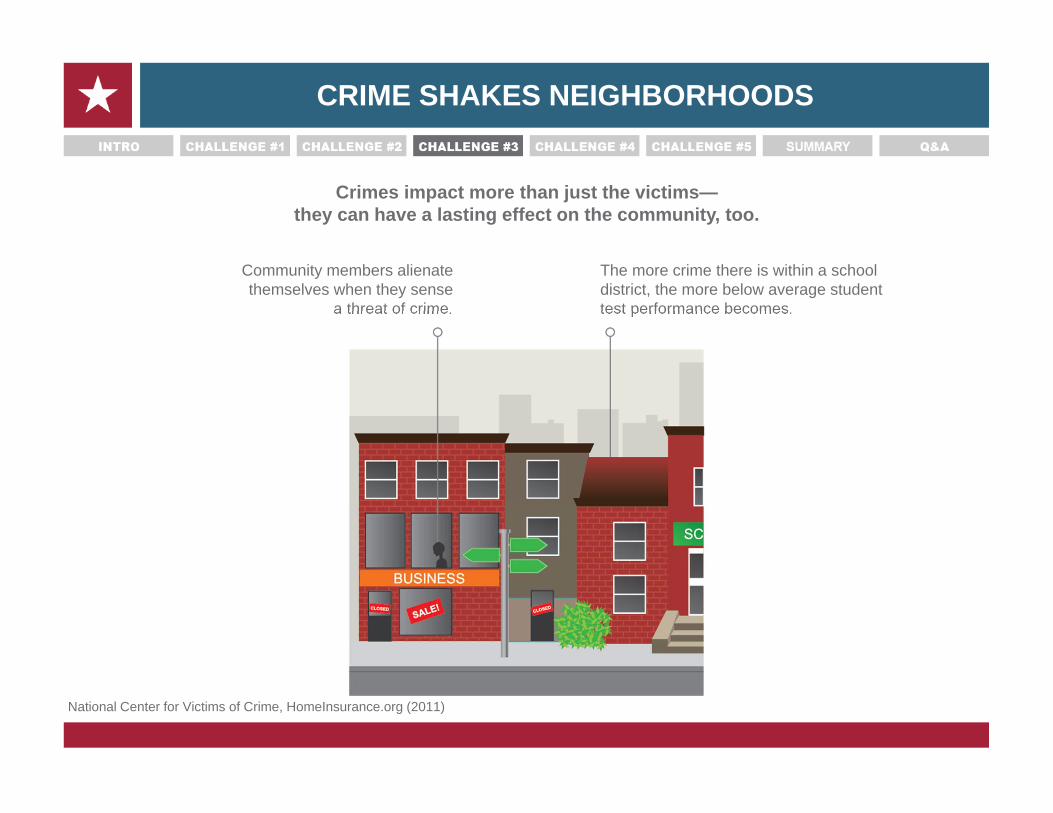
CRIME SHAKES NEIGHBORHOODS
National Center for Victims of Crime, HomeInsurance.org (2011)
Crimes impact more than just the victims—they can have a lasting effect on the community, too.
Community members alienate themselves when they sense
a threat of crime.
The more crime there is within a school district, the more below average studenttest performance becomes.
People are Distracted and DISCONNECTED
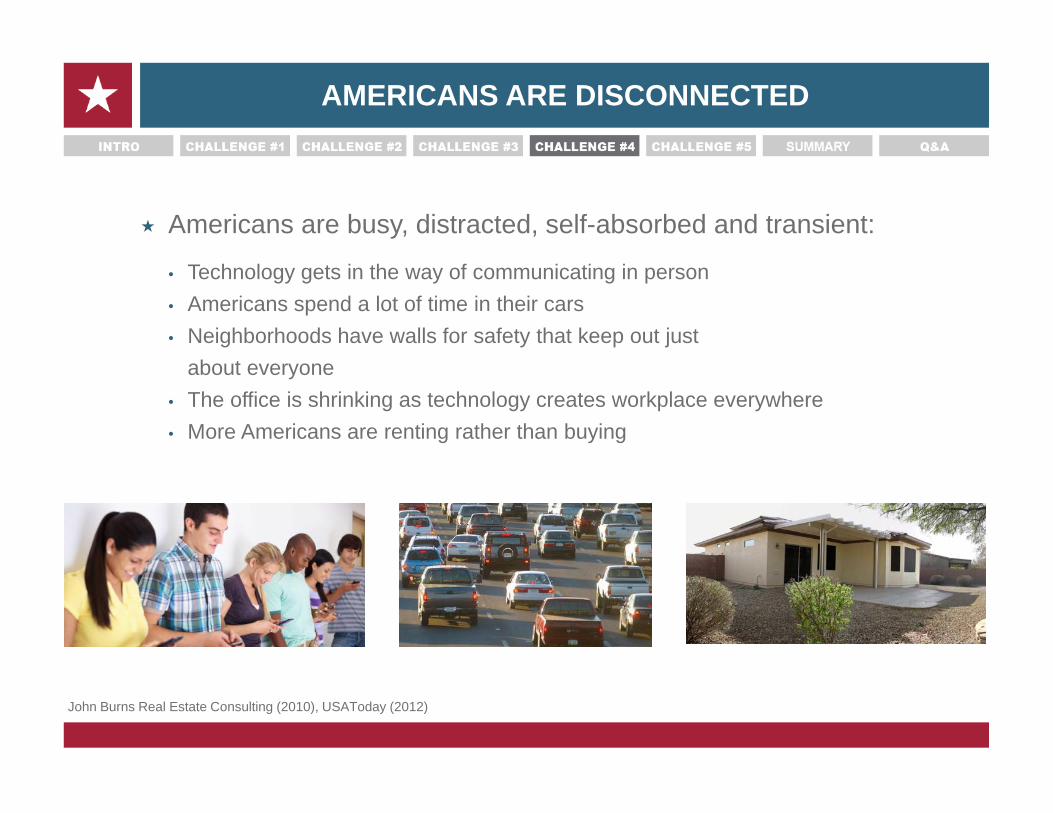
Americans are busy, distracted, self-absorbed and transient:
• Technology gets in the way of communicating in person• Americans spend a lot of time in their cars• Neighborhoods have walls for safety that keep out just
about everyone• The office is shrinking as technology creates workplace everywhere• More Americans are renting rather than buying
AMERICANS ARE DISCONNECTED
John Burns Real Estate Consulting (2010), USAToday (2012)
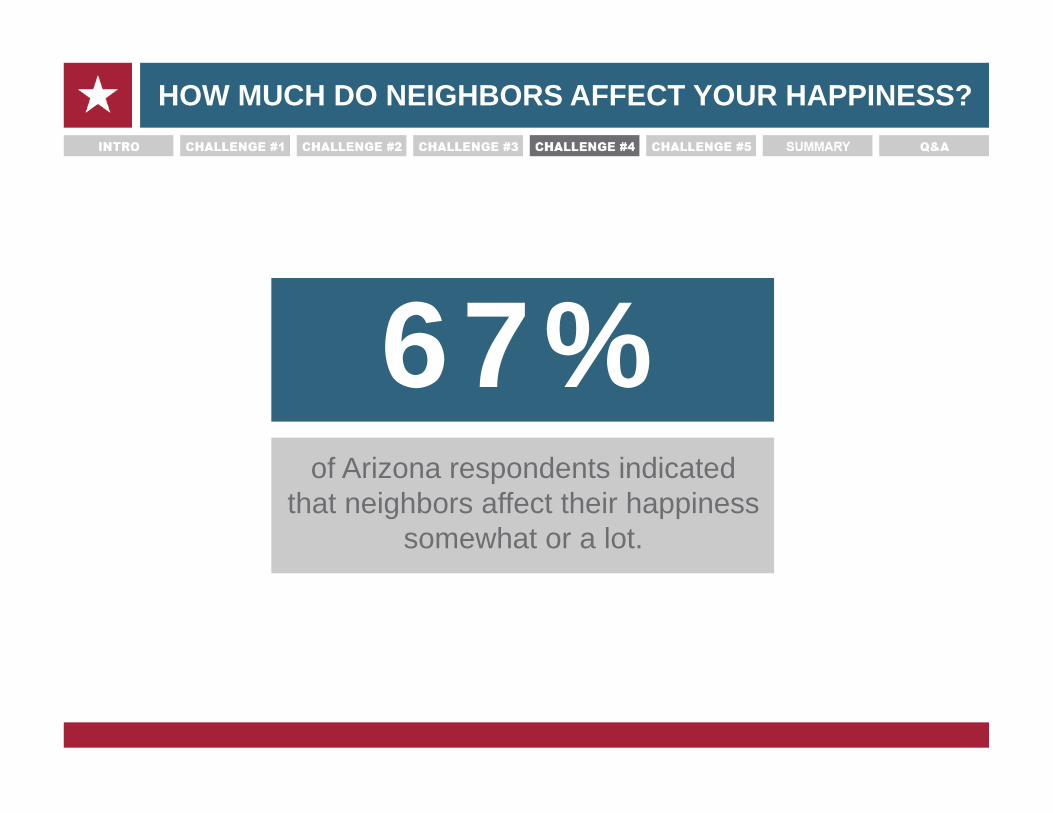
of Arizona respondents indicated that neighbors affect their happiness
somewhat or a lot.
67%
HOW MUCH DO NEIGHBORS AFFECT YOUR HAPPINESS?
Neighborhoods are NOT WORKING IN AMERICA but we want them to
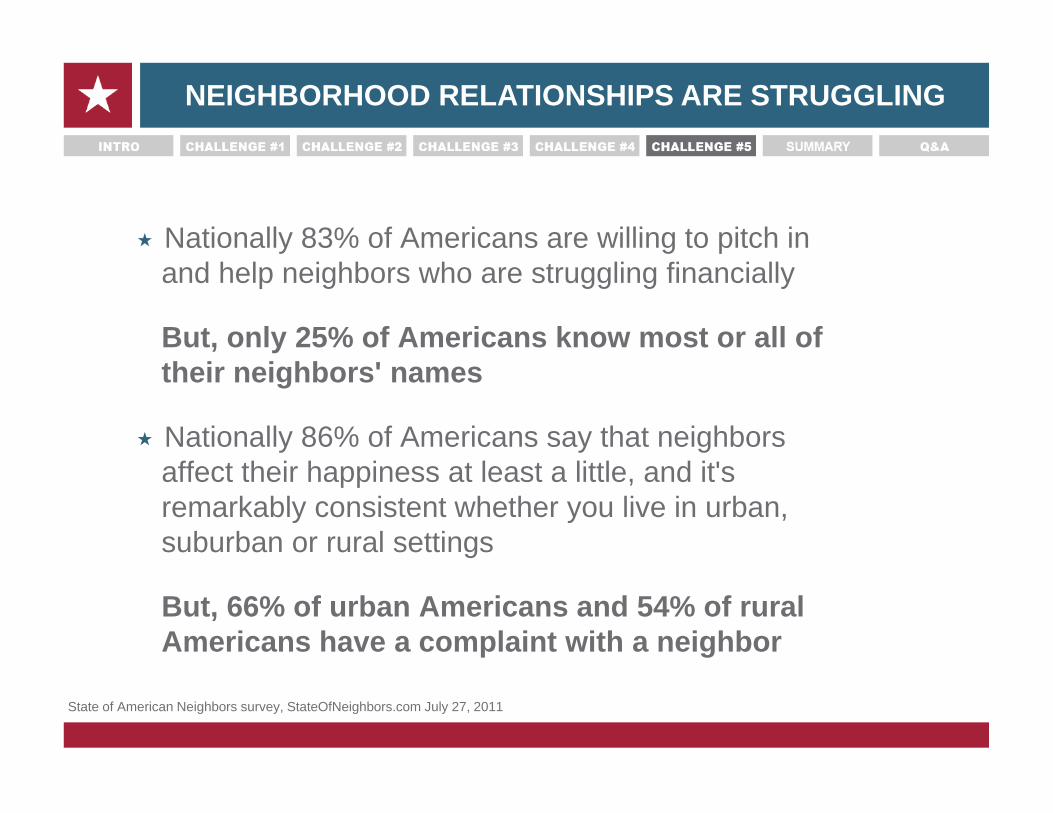
Nationally 83% of Americans are willing to pitch in and help neighbors who are struggling financially
But, only 25% of Americans know most or all of their neighbors' names
Nationally 86% of Americans say that neighbors affect their happiness at least a little, and it's remarkably consistent whether you live in urban, suburban or rural settings
But, 66% of urban Americans and 54% of rural Americans have a complaint with a neighbor
NEIGHBORHOOD RELATIONSHIPS ARE STRUGGLING
State of American Neighbors survey, StateOfNeighbors.com July 27, 2011
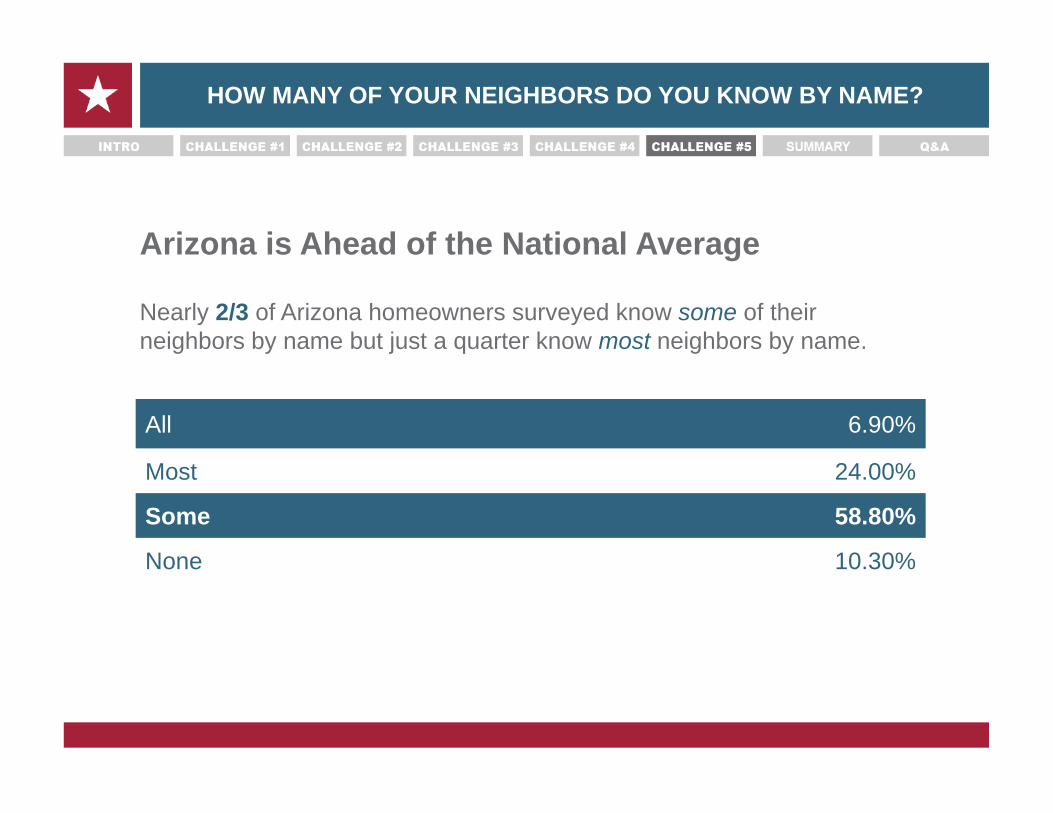
Arizona is Ahead of the National Average
Nearly 2/3 of Arizona homeowners surveyed know some of their neighbors by name but just a quarter know most neighbors by name.
HOW MANY OF YOUR NEIGHBORS DO YOU KNOW BY NAME?
All 6.90%
Most 24.00%
Some 58.80%
None 10.30%
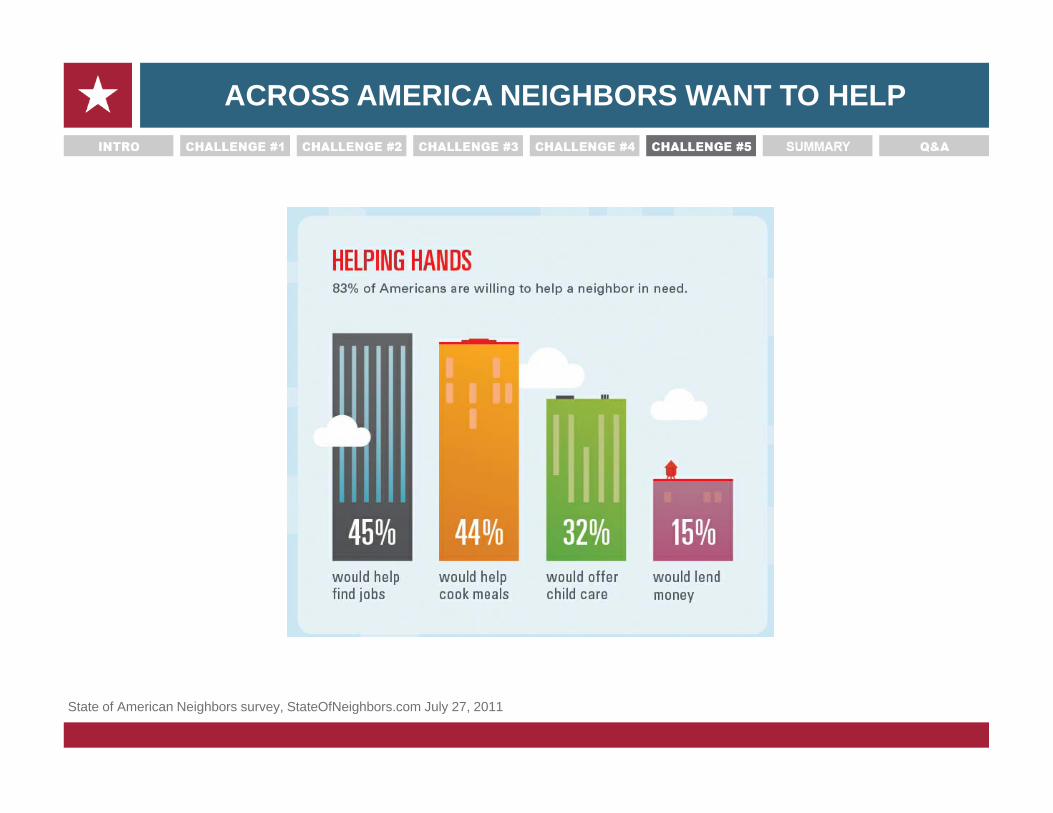
ACROSS AMERICA NEIGHBORS WANT TO HELP
State of American Neighbors survey, StateOfNeighbors.com July 27, 2011
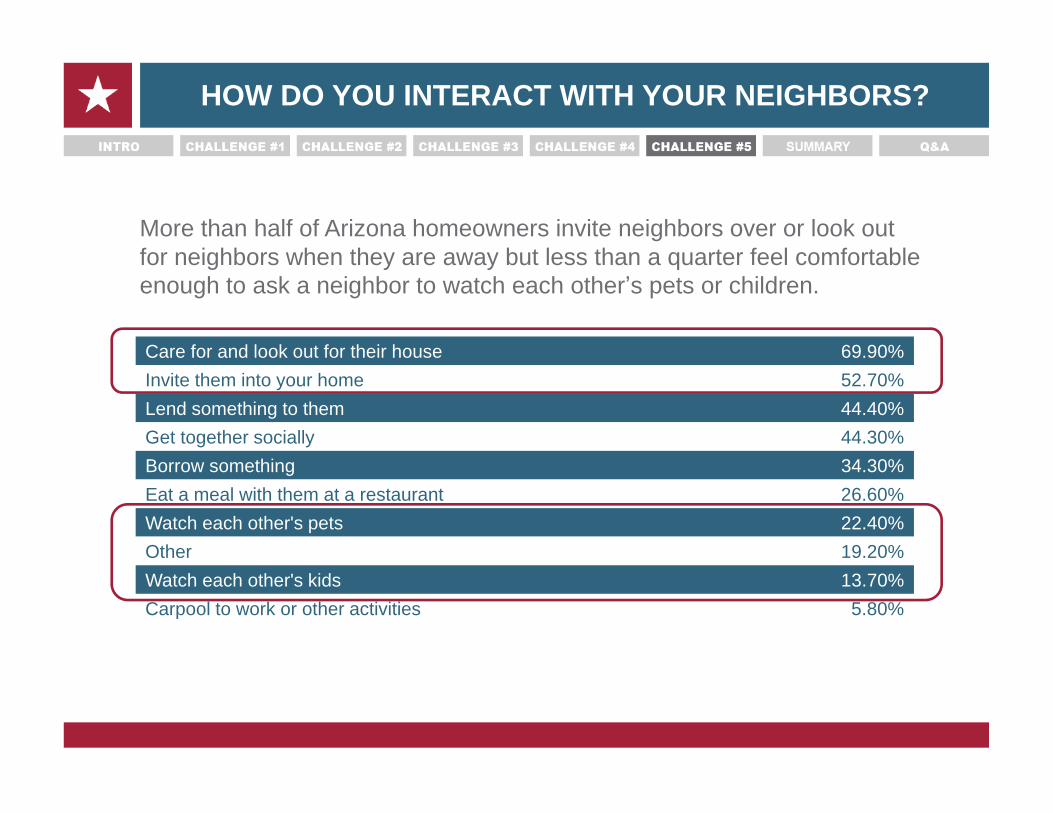
HOW DO YOU INTERACT WITH YOUR NEIGHBORS?
Care for and look out for their house 69.90%Invite them into your home 52.70%Lend something to them 44.40%Get together socially 44.30%Borrow something 34.30%Eat a meal with them at a restaurant 26.60%Watch each other's pets 22.40%Other 19.20%Watch each other's kids 13.70%Carpool to work or other activities 5.80%
More than half of Arizona homeowners invite neighbors over or look out for neighbors when they are away but less than a quarter feel comfortable enough to ask a neighbor to watch each other’s pets or children.
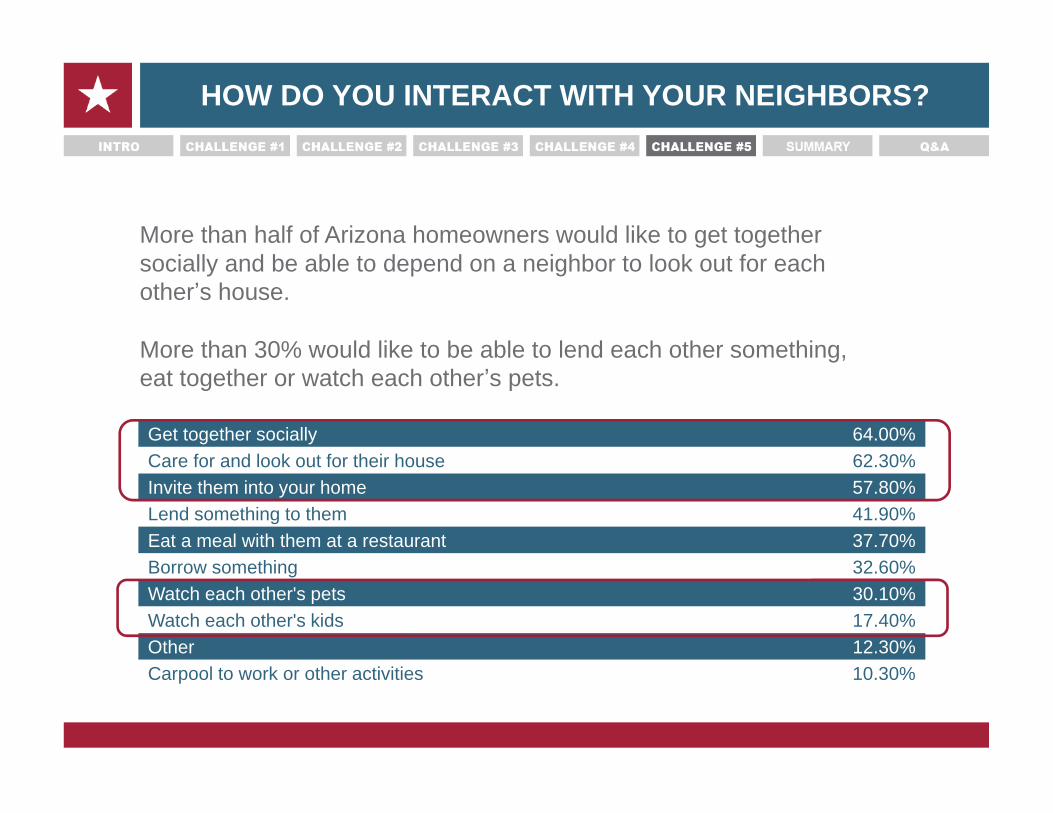
HOW DO YOU INTERACT WITH YOUR NEIGHBORS?
Get together socially 64.00%Care for and look out for their house 62.30%Invite them into your home 57.80%Lend something to them 41.90%Eat a meal with them at a restaurant 37.70%Borrow something 32.60%Watch each other's pets 30.10%Watch each other's kids 17.40%Other 12.30%Carpool to work or other activities 10.30%
More than half of Arizona homeowners would like to get together socially and be able to depend on a neighbor to look out for each other’s house.
More than 30% would like to be able to lend each other something, eat together or watch each other’s pets.
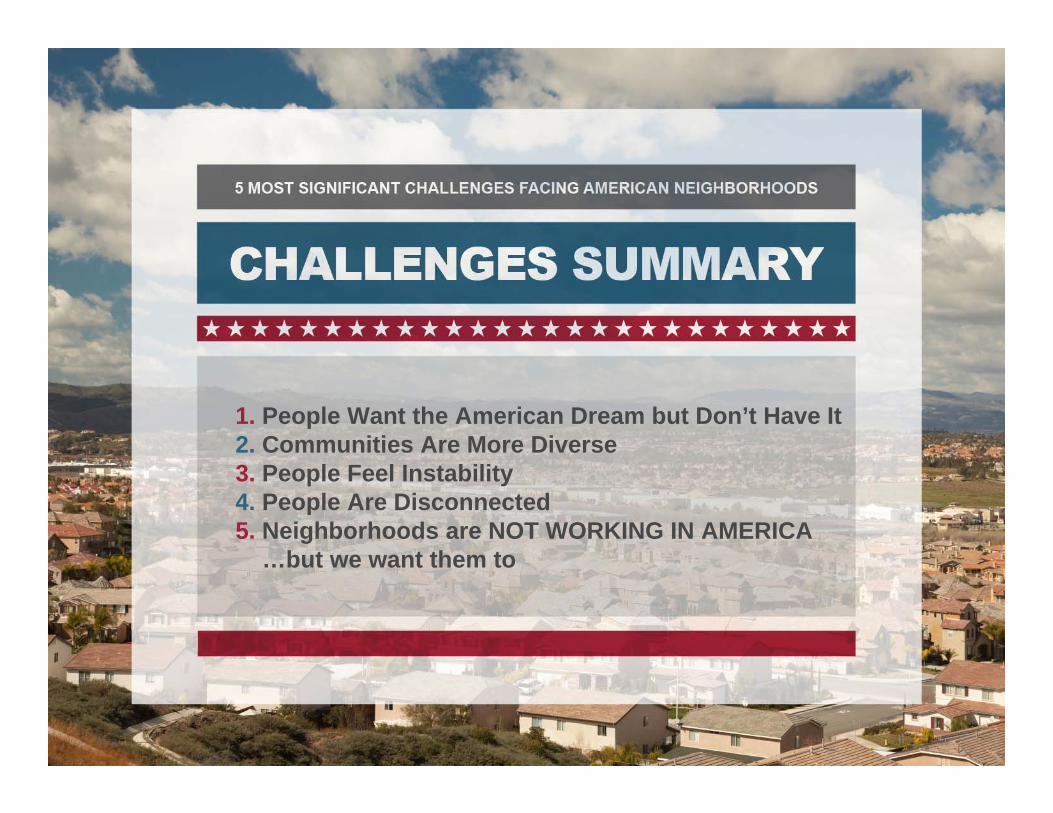
1. People Want the American Dream but Don’t Have It2. Communities Are More Diverse3. People Feel Instability4. People Are Disconnected5. Neighborhoods are NOT WORKING IN AMERICA
…but we want them to
There is a light at the end of the tunnel
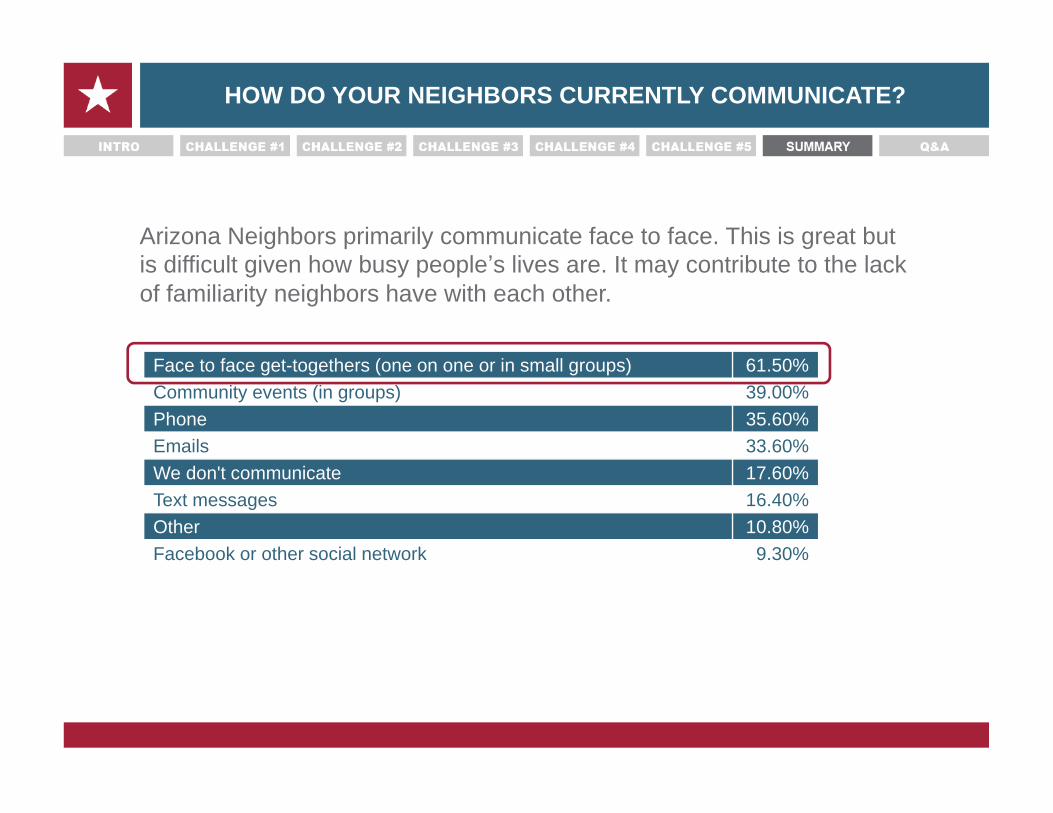
Face to face get-togethers (one on one or in small groups) 61.50%Community events (in groups) 39.00%Phone 35.60%Emails 33.60%We don't communicate 17.60%Text messages 16.40%Other 10.80%Facebook or other social network 9.30%
Arizona Neighbors primarily communicate face to face. This is great but is difficult given how busy people’s lives are. It may contribute to the lack of familiarity neighbors have with each other.
HOW DO YOUR NEIGHBORS CURRENTLY COMMUNICATE?
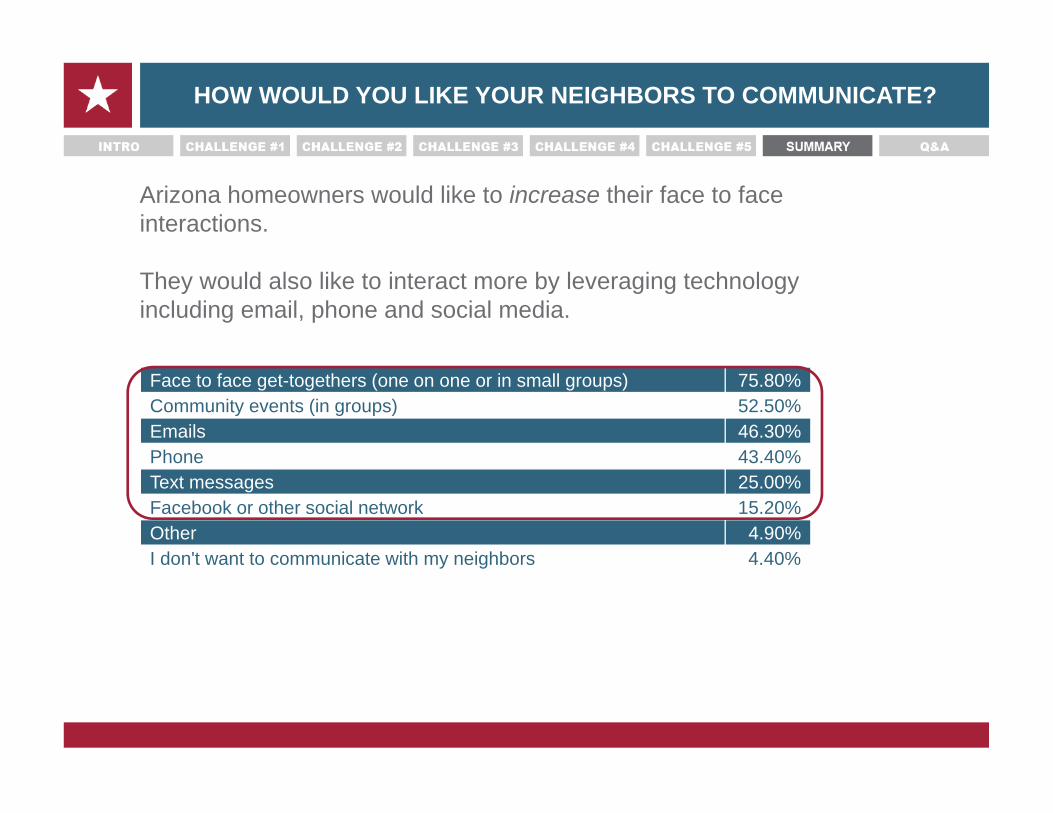
Face to face get-togethers (one on one or in small groups) 75.80%Community events (in groups) 52.50%Emails 46.30%Phone 43.40%Text messages 25.00%Facebook or other social network 15.20%Other 4.90%I don't want to communicate with my neighbors 4.40%
Arizona homeowners would like to increase their face to face interactions.
They would also like to interact more by leveraging technology including email, phone and social media.
HOW WOULD YOU LIKE YOUR NEIGHBORS TO COMMUNICATE?
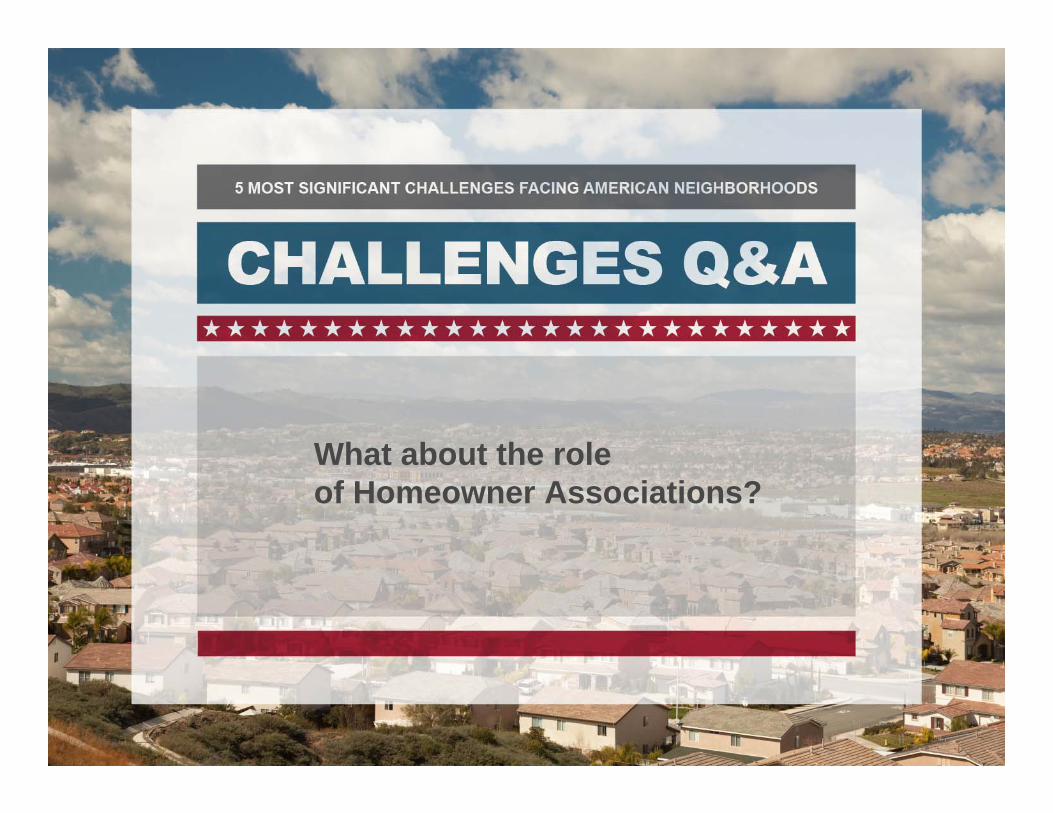
What about the role of Homeowner Associations?
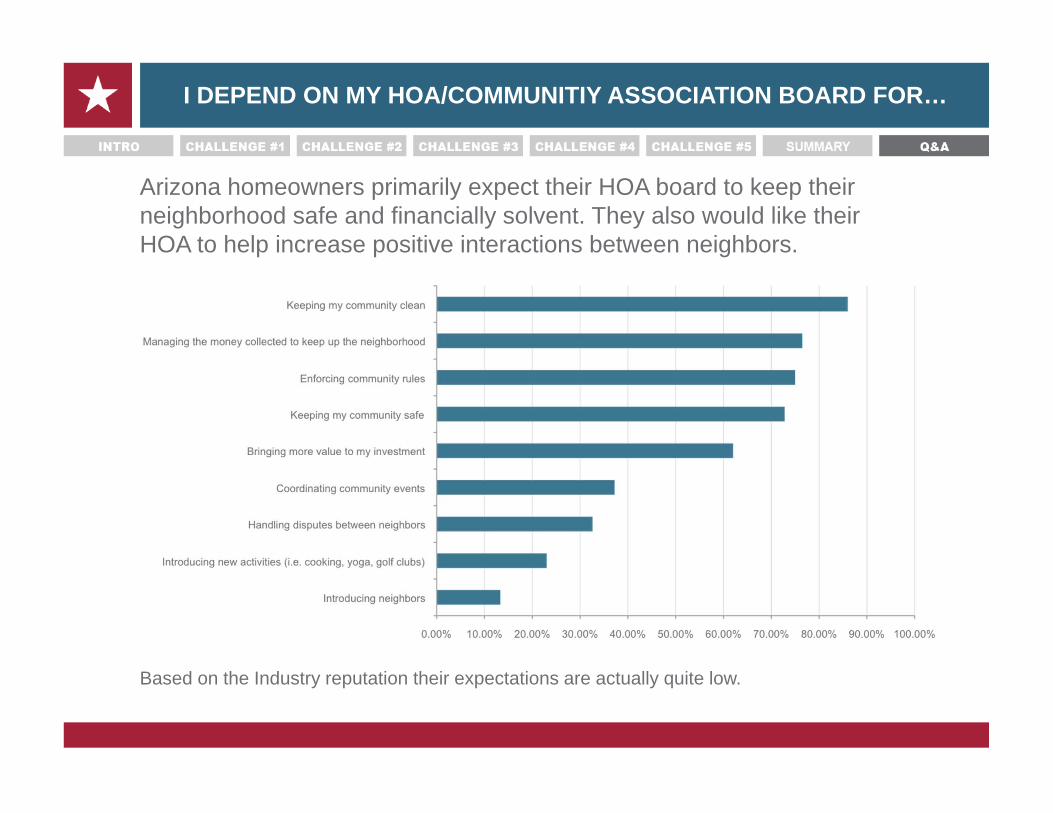
Arizona homeowners primarily expect their HOA board to keep their neighborhood safe and financially solvent. They also would like their HOA to help increase positive interactions between neighbors.
Based on the Industry reputation their expectations are actually quite low.
I DEPEND ON MY HOA/COMMUNITIY ASSOCIATION BOARD FOR…
What kind of services do homeowners want?
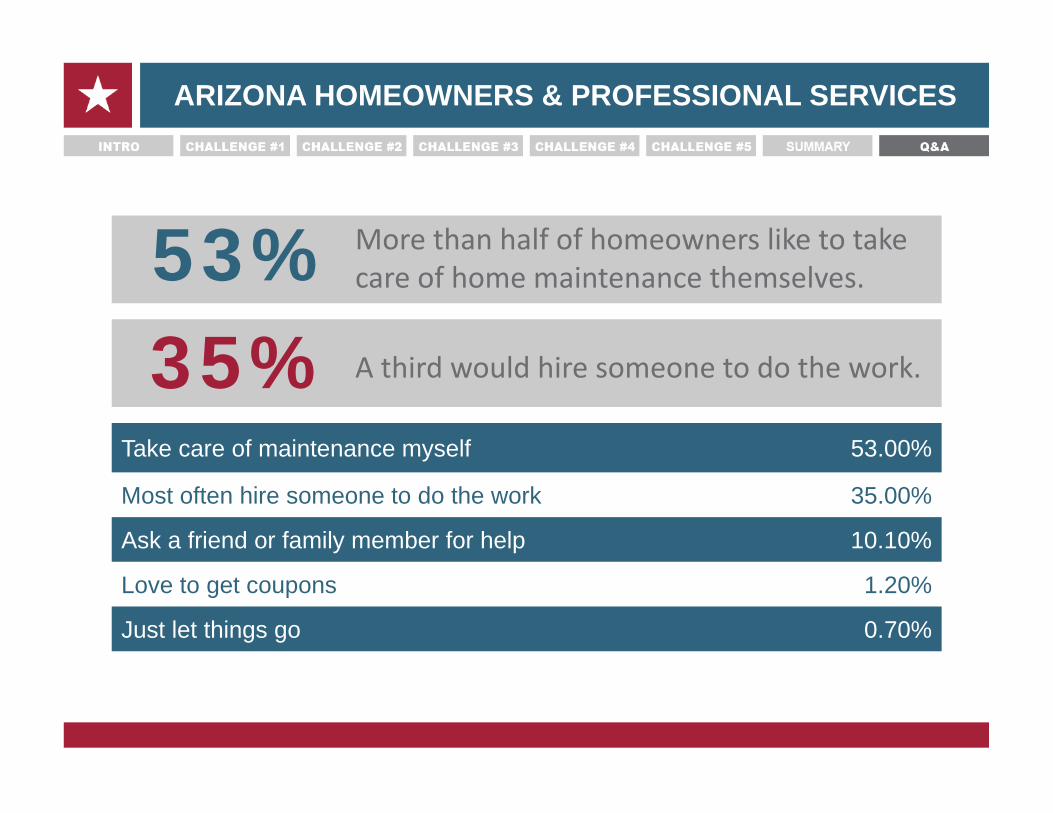
More than half of homeowners like to take care of home maintenance themselves.
A third would hire someone to do the work.
53%35%
Take care of maintenance myself 53.00%
Most often hire someone to do the work 35.00%
Ask a friend or family member for help 10.10%
Love to get coupons 1.20%
Just let things go 0.70%
ARIZONA HOMEOWNERS & PROFESSIONAL SERVICES
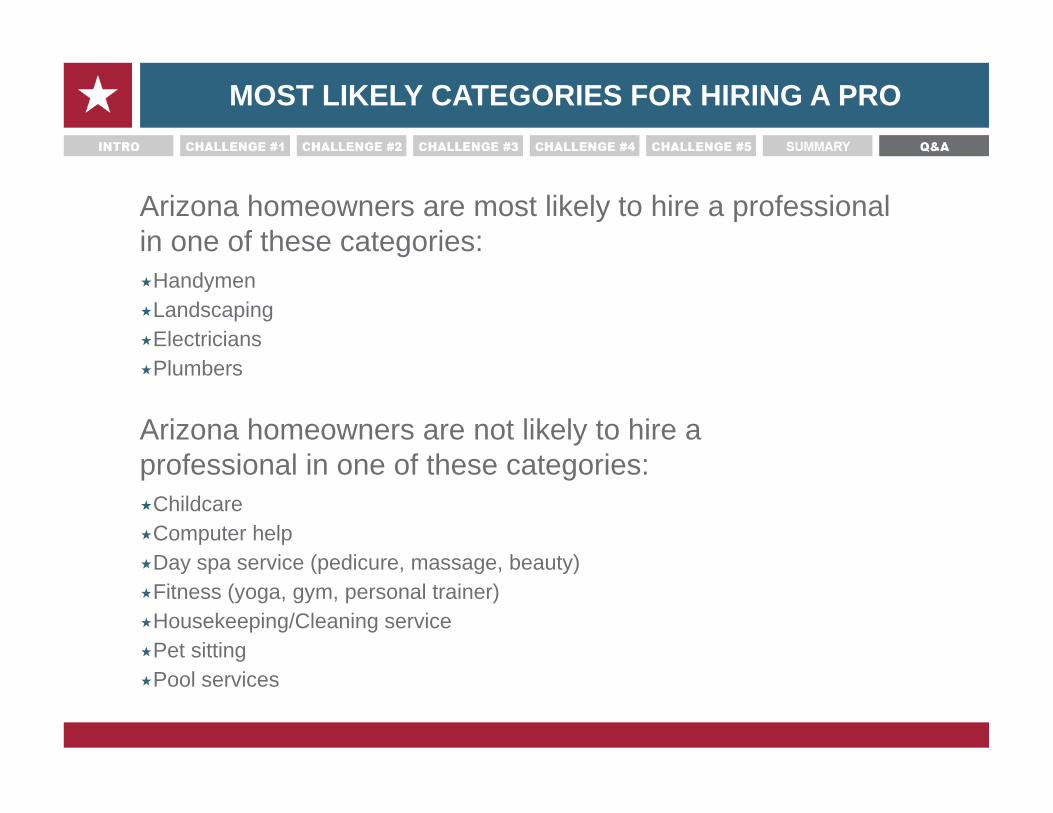
Arizona homeowners are most likely to hire a professional in one of these categories:HandymenLandscapingElectriciansPlumbers
Arizona homeowners are not likely to hire a professional in one of these categories:ChildcareComputer helpDay spa service (pedicure, massage, beauty)Fitness (yoga, gym, personal trainer)Housekeeping/Cleaning servicePet sittingPool services
MOST LIKELY CATEGORIES FOR HIRING A PRO
The American Homeowner Wants and Deserves More
THE DATA LEADS US TO BELIEVE
Where do we go from here?
OUR MISSION
AAM is committed to:
Developing and cultivating long term relationships with developers and HOAs that enable us all to continue to “Create a Better America One Neighborhood at a Time”
Delivering real value for Developers, HOAs and Homeowners
Improving the quality of connections between of homeowners and boards
Improving the financial health of the communities where we work
Raising the bar for the industry
WHAT THIS MEANS
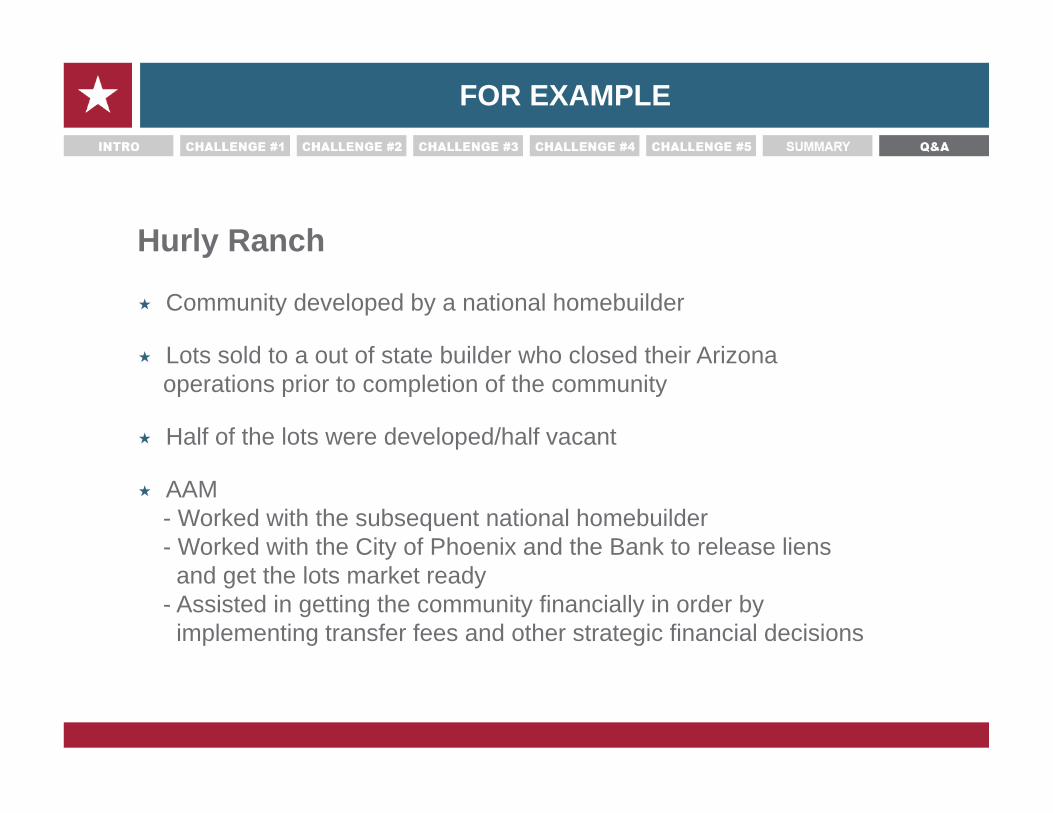
FOR EXAMPLE
Hurly Ranch
Community developed by a national homebuilder
Lots sold to a out of state builder who closed their Arizona operations prior to completion of the community
Half of the lots were developed/half vacant
AAM- Worked with the subsequent national homebuilder - Worked with the City of Phoenix and the Bank to release liens
and get the lots market ready- Assisted in getting the community financially in order by
implementing transfer fees and other strategic financial decisions
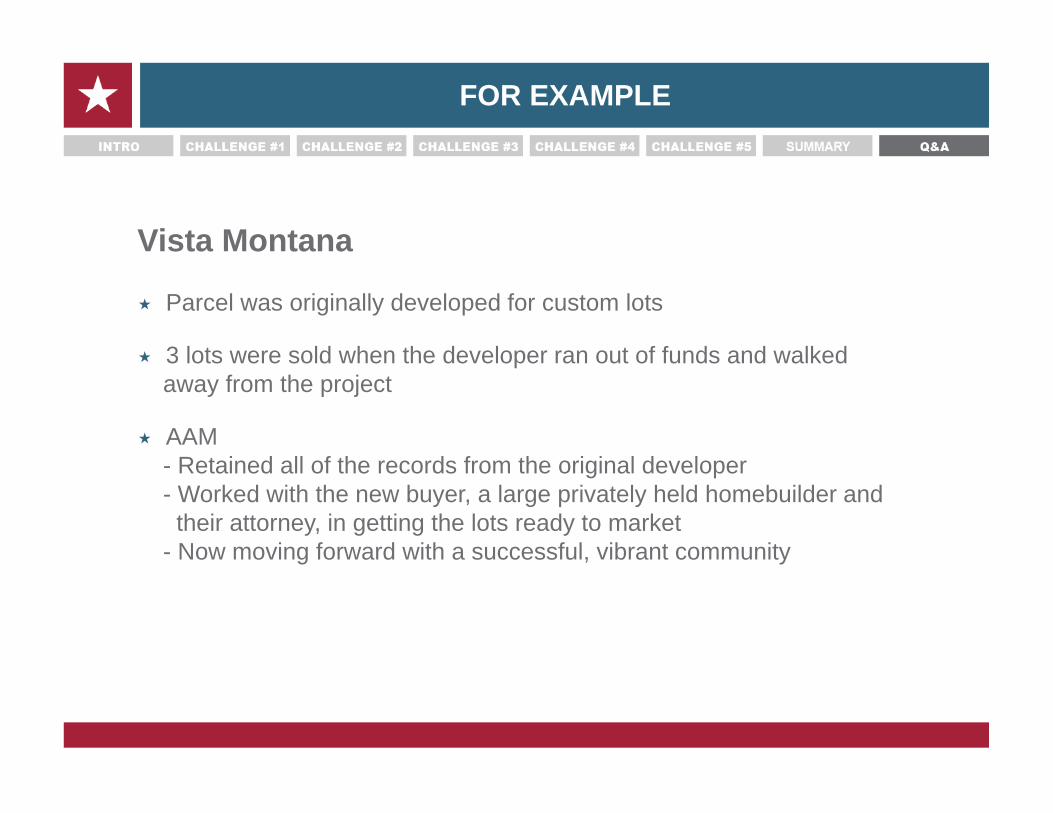
FOR EXAMPLE
Vista Montana
Parcel was originally developed for custom lots
3 lots were sold when the developer ran out of funds and walked away from the project
AAM- Retained all of the records from the original developer - Worked with the new buyer, a large privately held homebuilder and
their attorney, in getting the lots ready to market- Now moving forward with a successful, vibrant community
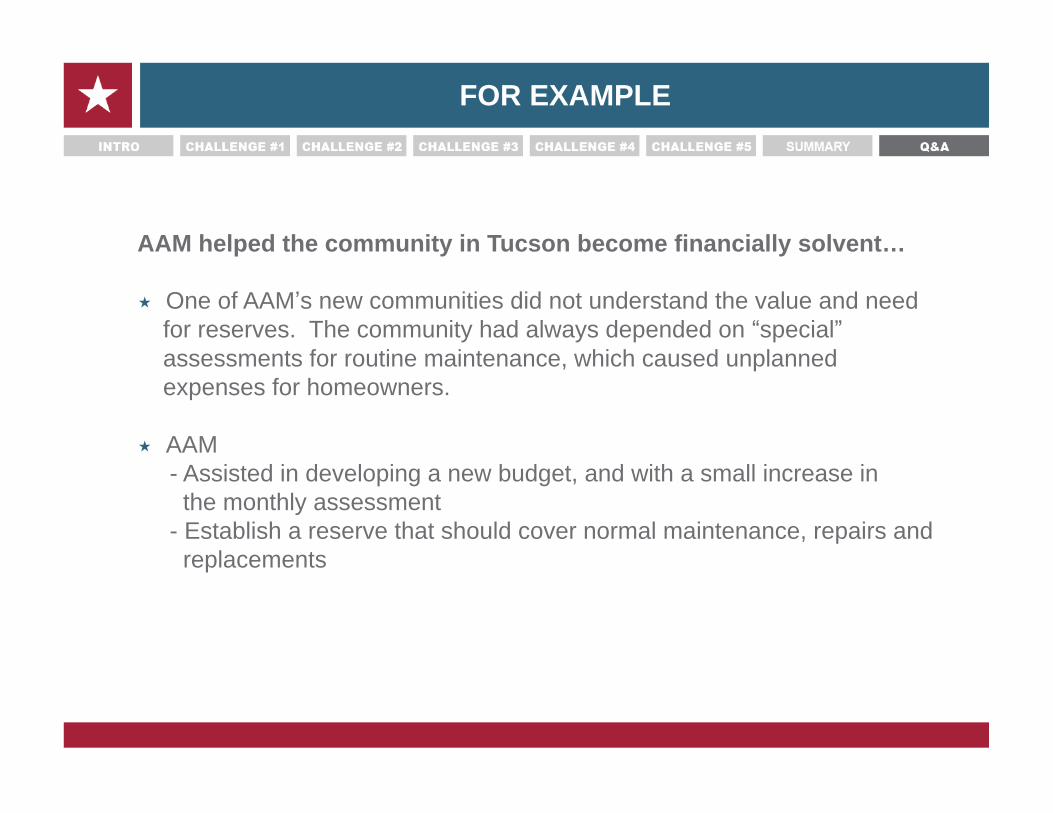
FOR EXAMPLE
AAM helped the community in Tucson become financially solvent…
One of AAM’s new communities did not understand the value and need for reserves. The community had always depended on “special”assessments for routine maintenance, which caused unplanned expenses for homeowners.
AAM - Assisted in developing a new budget, and with a small increase in
the monthly assessment- Establish a reserve that should cover normal maintenance, repairs and
replacements
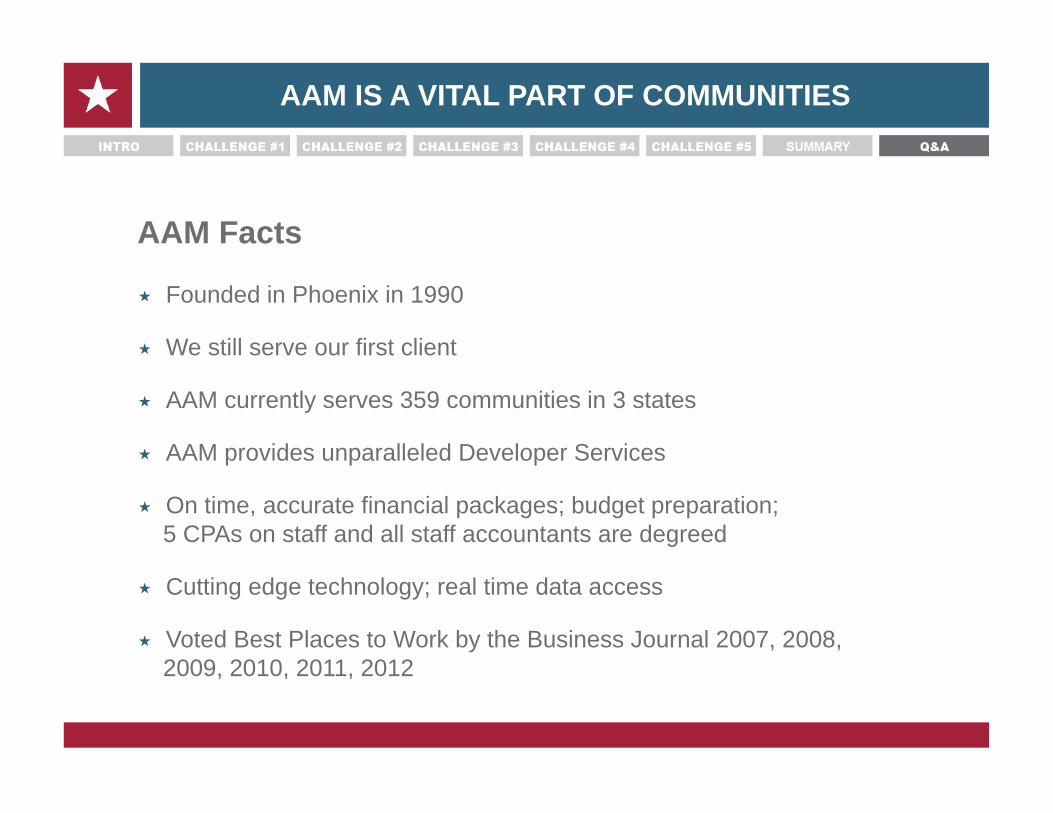
AAM IS A VITAL PART OF COMMUNITIES
AAM Facts
Founded in Phoenix in 1990
We still serve our first client
AAM currently serves 359 communities in 3 states
AAM provides unparalleled Developer Services
On time, accurate financial packages; budget preparation; 5 CPAs on staff and all staff accountants are degreed
Cutting edge technology; real time data access
Voted Best Places to Work by the Business Journal 2007, 2008,2009, 2010, 2011, 2012
AAM IS A VITAL PART OF COMMUNITIES
AAM Facts
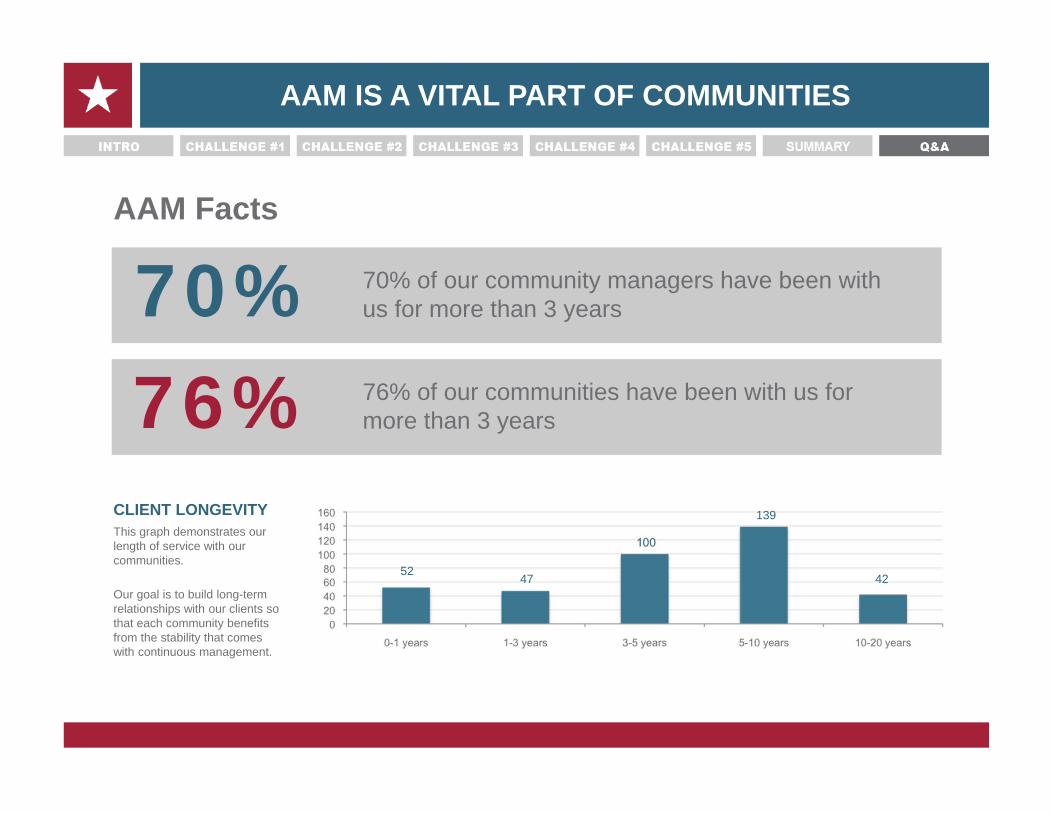
70%76%
70% of our community managers have been with us for more than 3 years
CLIENT LONGEVITYThis graph demonstrates our length of service with our communities.
Our goal is to build long-term relationships with our clients so that each community benefits from the stability that comes with continuous management.
5247
139
42
76% of our communities have been with us for more than 3 years