Embed Size (px)
Citation preview
I I I I I I I I I I I I I I I I
Surveying Hawaii's Youth: Neighborhoods, Delinquency and
Gangs
i~fi
c,.O C~ LO C.O LO
Social
Prepared by: Anna Rockhill
Meda Chesney-Lind Joe Allen
Nestor Batalon Elise Garvin
Karen Joe M~chele Spina
Science Research Inst i tute University of Hawaii at Manoa
2424 Maile Way Honolulu, Hawaii 96822
March 25, 1993
I I I
If you have issues viewing or accessing this file contact us at NCJRS.gov.
I I I I I I I I I I I I I I I I I I I
I /~-~ ~-~.~ I I | Surveying Hawaii's Youth:
Neighborhoods, Delinquency and I I
Gangs ! '
I Prepared by: i Anna Rockhill
Meda Chesney-Lind Joe Alien
I Nestor Batalon Elise Garvin
Karen Joe I Michele Spina
4 > ~ " " "~ " " , ~
I I
Social Science Research Institute University of Hawaii at Manoa
2424 Maile Way Honolulu, Hawaii 96822
I I I I I I
March 25, 1993
U.S. Depar tmen t o f Justice Nat iona l Inst i tu te o f Justice
This document has been reproduced exactly as received from the person or organization originating it. Points of view or opinions stated in this document are those of the authors and do not necessarily represent the official position or policies of the National Institute of Justice.
Permission to reproduce this copyrighted material has been
gr(~iP~J.J~r f o r Y o u t h R e s e a r c h
University of Hawaii
156526
to the National Criminal Justice Reference Service (NCJRS).
Further reproduction outside of the NCJRS system requires permission of the copyright owner.
I I I I I I I I I I I I I I I I I I I
I I I I I I I I I I I I I I I I I I
Acknowledgements
This report would not have been possible without the support, encouragement, and effort of the Youth Gang Response System's Working Committee Members, their staff, and of course, their program's participants. Our thanks to the Working Committee members for their input on the instrument and their complete cooperation in surveying their own programs, their staffs for administering the surveys and helping the children understand what was being asked of them, and finally our deepest thanks to the youth who participated, for their honesty in answering the questions and for giving up a portion of their program time to assist us. Without these youth, this report would not be a reality. Participating programs include:
Mr. John Fujioka Ms. Frances Rivera Mr. Kimo Bajet Mr. Mike Kahikina Mr. Kim Winegar Mr. Bob Nakata Ms. Ruthann Quitaquit Mr. Dominic Inocelda Ms. Thelma Akita Ms. Pauline Pavao &
Mr. Sampson Kela Mr. Vernon Yoshida Ms. Annette Yamaguchi Mr. Tony Pfaltzgraf Mr. Tom Tannery Sgt. Rodney Goo Mr. Carl Takeshita Mr. Roger Watanabe
Boys and Girls Club-McCully Unit Boys and Girls Club-Ewa Beach Unit Boys and Girls Club-Kaneohe Unit Boys and Girls Club-Waianae Unit Catholic Immigration Center Kokua Kalihi Valley Parents and Children Together Susannah Wesley Community Center Maui Youth and Family Services
Hilo Interim Home YMCA -Kaimuki YMCA-Leeward YMCA-Outreach YMCA-Kauai Honolulu Police Department Department of Education Department of Parks and Recreation
Also of invaluable assistance to us were Dr. Karen Joe, Professor of Sociology, University of Hawaii at Manoa, and Nancy Marker, Center for Youth Research, University of Hawaii at Manoa for their guidance, support and encouragement. Any errors in this report remain, of course, the authors' own.
I f

I I I I I I I I I I I I I I I I I I I
I I I I I I I I I I I I I I I I I I
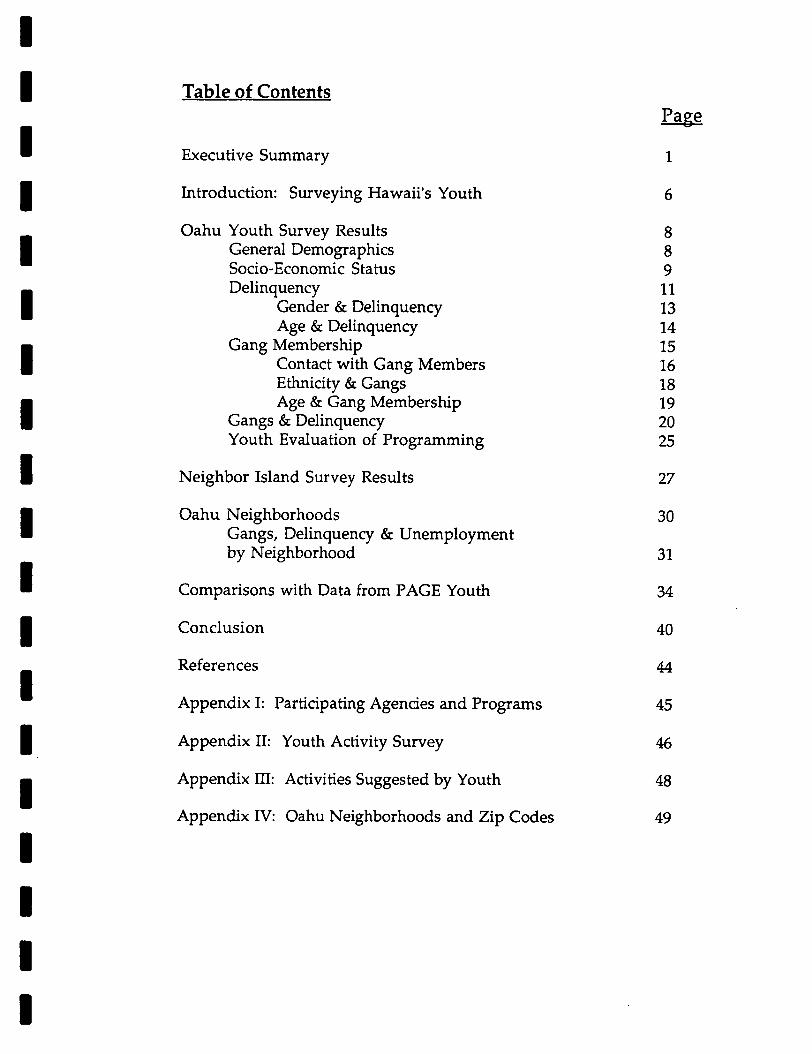
Table of Contents
Executive Summary
Introduction: Surveying Hawaii's Youth
Oahu Youth Survey Results General Demographics Socio-Economic Status Delinquency
Gender & Delinquency Age & Delinquency
Gang Membership Contact with Gang Members Ethnicity & Gangs Age & Gang Membership
Gangs & Delinquency Youth Evaluation of Programming
Neighbor Island Survey Results
Oahu Neighborhoods Gangs, Delinquency & Unemployment by Neighborhood
Comparisons with Data from PAGE Youth
Conclusion
References
Appendix I: Participating Agencies and Programs
Appendix II: Youth Activity Survey
Appendix III: Activities Suggested by Youth
Appendix IV: Oahu Neighborhoods and Zip Codes
Pa_a~
6
8 8 9 11 13 14 15 16 18 19 20 25
27
30
31
34
40
44
45
46
48
49
I
I I I I I I I I I I I I I I I I I I I
I I I I I I I I I I I I I I I I I I I
EXECUTIVE SUMMARY
The Social Science Research Institute has been assisting the State of Hawaii in the
evaluation of the state's Youth Gang Response System (YGRS). Two previous
publications, Gangs and Delinquency in Hawaii and An Evaluation of Act 189: Hawaii's Youth Gang Response System summarize the first two years of our
research. In recent months we have continued to monitor the problem of youth
gangs in our community. We are utilizing two methodologies to assist us in this
work. First, we have conducted a survey of youth participating in programs run by
the agencies funded by the Youth Gang Response System. This report is a summary
of the findings of this research. Other observations about Hawaii's at risk youth are
being gathered via interviews with youth gang members.
This study was undertaken at the request of YGRS service providers for data which
would document the problems facing the youth and the communities they serve.
Our findings are based on self-report data collected on an average day this December
from youth attending recreational programming funded as part of Hawaii's Youth
Gang Response System. We surveyed nearly 800 youth, primarily on Oahu, and
included youth attending programming in a variety of Oahu neighborhoods. Our
survey consisted of two pages of questions regarding demographic information,
program participation, and the extent of their involvement in delinquency and
youth gangs. Many of the self-report questions on delinquency were pulled from
the National Youth Survey. We asked youth questions regarding household
composition, family size and their parents' employment status and used these to
form a rough approximation of sociooeconomic status. We also inquired as to the
youth's attitudes regarding gangs and their contact with gang members.
Ours is not a random sample of gang members, nor of Oahu youth. We are
confident however, that our data represent an accurate picture of youth served by
these agencies and that they provide valuable information regarding populations
residing in some of Oahu's more troubled neighborhoods.
The major findings are as follows:
The bulk of this paper focuses on the youth who are involved in a variety of anti-
social behaviors. However, the large majority, even those youth living in tl~e most
"at-risk" neighborhoods, are not gang members, and are not committing serious
delinquent acts. In eight of our ten delinquency categories, over eighty percent of
the youth answered none or zero when asked the number of times they had
committed the various acts in the past twelve months.
The youth surveyed come from Oahu neighborhoods that are poor and their living
situations reflect the personal costs of that poverty. Twenty percent of the youth
live in single parent households, and another 7% live with neither parent. The
average household size is 6.5 compared to the Oahu average of 3. Unemployment
among respondents' parents is much higher than the 1991 state average of 2.8%.
Nearly 20% report that their father is unemployed, and 31% of mothers are not
working. Forty percent of single mothers and 15% of single fathers are unemployed.
Thirty percent of youth living in a single parent household report that neither of
their parents is working. Less than 15% of the 16 year olds in our survey have jobs.
Most of the youth being served by YGRS agencies on Oahu are "at risk" for
delinquency and involvement in gangs. The youth are primarily between the ages
of 12 and 14, the period our data suggest youth are most likely to begin to become
involved in delinquency and gangs. Of the youth surveyed, a quarter had been in
gangs, and 12% were current gang members. Another striking finding is the extent
of regular contact that youth have with gang members. Over fifty percent said they
knew gang members in their neighborhood and a majority had friends in gangs.
Over a quarter of the youth said that at least one member of their family is in a gang.
These were typically uncles, brothers and cousins, though there were a few sisters,
aunties and mothers. Not surprisingly, it is also the case that the youth reported
rates of delinquency that are well above official statistics.
The ethnic distribution of the gang membership revealed in this study varies
somewhat from that found in official statistics maintained by the Honolulu Police
Department. In essence, 41% of the self-reported gang members in this study were
of Hawaiian/Part-Hawaiian ancestry, 16% were Samoan and 20% were Filipino.
Stated differently, about a third (32%) of the Samoan youth in our sample were
2
I I I I I I I I I I I I I I I I I I I
I I I I I I I I I I i I I I I I I I I
current gang members, compared to thirteen percent of the Hawaiian/Part-
Hawaiians, nineteen percent of the cosmopolitans, and eleven percent of the
Filipinos.
We also found significant gender differences. Boys are delinquent more frequently
than girls and tend to engage in a wider variety of delinquent acts. The biggest
discrepancies involve the more serious or violent activities. For example, boys were
twice as likely to be involved in drug dealing or carry a weapon than girls. Gender
differences in alcohol use are less marked, however. In additions, boys are more
likely to be gang members. Eighteen percent reported currently belonging to a gang
versus 7% of the girls. One of our more interesting findings is that 17% of current
gang members do not want to be in a gang. However, more boys want out than in,
and more girls want in than out.
Gang membership is clearly associated in the Oahu sample with chronic
delinquency. For example, gang members were ten times more likely than non-
gang members to carry a weapon more than ten times in the past year (36%
compared to 3%), ten times more likely to have been frequently involved in gang
fights (56% compared to 5%), and four times more likely to use drugs or alcohol
than non-gang members, and at least five times more likely to steal or buy drugs
"alot".
We also looked at the variation of a variety of statistics by neighborhood. We sorted
the data by zip code and found significant differences between neighborhoods in
terms of their socio-economic status, potential for contact with gang members, and
delinquency statistics, particularly those regarding drug and alcohol use, weapons,
gang fights and gang membership.
For example, youth living in poorer neighborhoods were more likely to have
regular contact with gang members (83% of Kalihi youth know gang members in
their area, 75% have friends in gangs). These youth were also more delinquent than
their peers in less troubled neighborhoods. A disproportionate number of gang
members in our sample came from these neighborhoods. For example, 31% of self-
reported gang members live in Kalihi, while these youth make up only 15% of our
sample population. It is also the case that youth gang members commit delinquent
acts more frequently, particularly more serious offenses such as stealing, vandalism,
3
carrying weapons and, not surprisingly, gang fights than their peers who are not in
gangs.
Data collected from participants in a gang education program (PAGE) at five Oahu
intermediate schools corroborate these findings. We have assumed these youth to
represent a random sample of students at these schools. Three of the schools draw
from neighborhoods previous research has indicated are troubled: Kalakaua, Jarrett
and Dole. The other two, King and Wahiawa, are located in areas less heavily beset
by socio-economic disadvantage, and youth from these neighborhoods report lower
levels of contact with gang members, of serious delinquency, and involvement in
gang activity. These youth are not significantly less delinquent that their more "at-
risk" peers across all categories of delinquent activities, however. For example,
alcohol use is in fact more common at a couple of the higher income
neighborhoods.
Youth participating in the recreational programs funded by the YGRS rate these
programs very high with dance the favorite activity and counseling the least
favorite. Neighbor Island youth ranked the programs in the same order and also
evaluated them positively.
Over 90% of the participants said that they "felt better with other people and about
themselves" as a result of program participation and about 80% reported "doing
better in school".
Neighbor Island youth are less involved in gangs than youth on Oahu, with only
about 10% of those surveyed (n=94) reporting they are currently in gangs. Neighbor Island youth, though, do report about the same level of gang activity in
their neighborhoods as their counterparts on Oahu with roughly half reporting they
have friends in gangs (54%) and 21% reporting they have family members in gangs.
Self-reported delinquency among Neighbor Island youth is higher than that found
on Oahu. For example, 81% of youth reported that they had never done graffiti
compared to only 86% of Oahu youth. Similarly, 68% of Neighbor Island youth in
these programs had never carried a hidden weapon compared to 86% of Oahu
youth. Less difference was seen in drug dealing (88% compared to 90%) and gang
fighting (80% compared to 89%).
4
I I I I I I I I I I I I I I I I I I I
I I I I I I I I I I I I I I I I I I I
Data suggest that Youth Gang Response System agencies, through the Office of
Youth Services are serving the appropriate population. They are reaching the kids
most at risk for gang membership and delinquency. The good news is that even if
there is a large gang presence in the neighborhood, youth are joining the gangs in
relatively low numbers. Eternal vigilance is, however, a watchword in crime
prevention. These data suggest that absent strong prevention and intervention
efforts, the gangs might well become more attractive to youth surrounded by their
influence. Future research should build on current work and include better efforts
to understand the roles that gangs are playing in the communities and, in particular,
the lives of the youth who join them.
5
INTRODUCTION: SURVEYING HAWAII'S YOUTH
The Social Science Research Institute has been assisting the State of Hawaii in
the evaluation of the state's Youth Gang Response System (YGRS). Two Previous
publications, Gangs and Delinquency in Hawaii, and An Evaluation of Act 189:
Hawaii's Youth Gang Response System summarize the first two years of our
research. In recent months, we have continued to monitor the problem of youth
gangs in our community. This report is a summary of some of the findings from
our analysis of the Youth Activity Surveys administered by 13 Act 300 funded
agencies, the Department of Parks and Recreation and the PAGE and SAP
programs.1 The survey was a self-report instrument distributed to the various
agencies and administered by agency staff on what they considered an "average" day
between November 30th and December 5th, 1992. 2 Many of the self-report questions
on delinque.ncy were pulled from the National Youth Survey (Elliot and Ageton,
1980). In addition, we have incorporated information from the 1990 Census and
other studies to provide perspective on the populations being served by these
agencies. We have also supplemented our discussion with statistics generated by
the Honolulu Police Department regarding gang membership and juvenile
delinquency.
Act 300 agencies include a wide range of youth serving organizations. These
agencies will serve approximately 3200 youth between November 1992 and June
1993. The findings outlined below are based on approximately 456 completed
surveys from Oahu youth and 94 completed surveys from youth on the neighbor
islands. We ask that you keep in mind that our study is not a random sample of
gang members, nor even of youth on Oahu. We are confident, however, that we
have an accurate picture of youth served by Act 300 agencies in a variety of Oahu
1 A complete list of participating agencies and programs is included as Appendix I. 2 A copy of the survey instrument is included as Appendix II.
I I I I I I I I I I I I I I I I I I I
I I I I I I I I I I I I I I I I I I I
neighborhoods and to a lesser extent the neighbor islands. Part of our mandate
includes reviewing and updating information on what may be considered troubled
neighborhoods as well as evaluating the state's efforts in the prevention of youth
gang activity. This study provides valuable information regarding youth,
delinquency, and gangs in some of Hawaii's more troubled neighborhoods.
We first present our findings concerning Oahu youth, including data on
delinquency and gangs and the youths' evaluation of the recreational programming
offered by Act 300 agencies. We do the same for data collected on the Neighbor
Islands. We then take a closer look at the Oahu data by breaking it down by
neighborhood. Finally, results from surveys administered to participants in the
PAGE program are used to compare youth from those less troubled areas with the
at-risk youth served by participating agendes in higher risk neighborhoods.
7
I OAHU YOUTH I
GENERAL DEMOGRAPHICS I
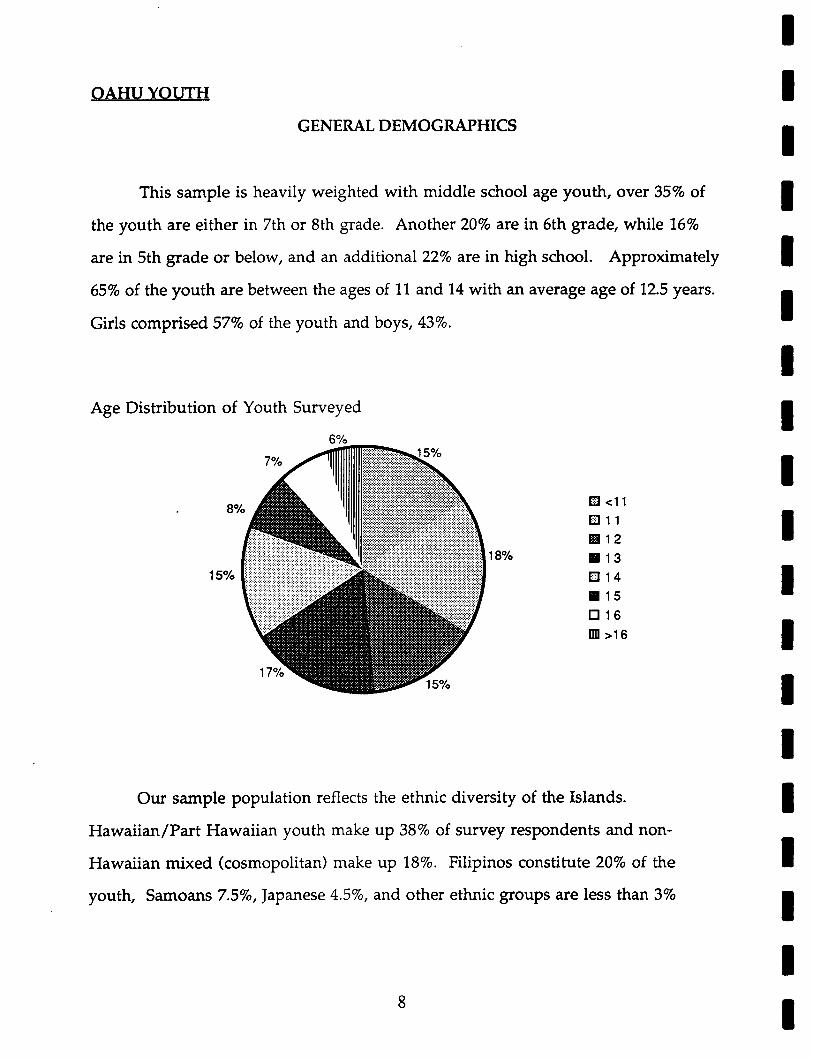
This sample is heavily weighted with middle school age youth, over 35% of I
the youth are either in 7th or 8th grade. Another 20% are in 6th grade, while 16%
are in 5th grade or below, and an additional 22% are in high school. Approximately I
65% of the youth are between the ages of 11 and 14 with an average age of 12.5 years. I
Girls comprised 57% of the youth and boys, 43%.
I Age Distribution of Youth Surveyed I
6%
I D l l I
~!~!~ii~i!~i~!iE!~!~iiiii::::~::::::::::::::::!!~!~i~ii::iii::~iiii~i::::ii~i~ii::ii~::::s::!:;:;i~i~::~::~i~::~,,~::~i~i~::~::~::~:;i~ li 18'/o° [] 1 3 I 15% [] 14
BI15 I-I16 [] >16 I
I I
Our sample population reflects the ethnic diversity of the Islands.
Hawaiian/Part Hawaiian youth make up 38% of survey respondents and non-
Hawaiian mixed (cosmopolitan) make up 18%. Filipinos constitute 20% of the
I I
youth, Samoans 7.5%, Japanese 4.5%, and other ethnic groups are less than 3% I I I
I I I I I I I I I I I I I I I I I I I
each.3 This ethnic distribution differs considerably from the composition of Oahu's
total population; Hawaiian/Part-Hawaiians constitute 11%, Samoans, 1.7%,
Caucasians, 22.5%, and Filipinos, 4.3%. In essence, these data indicate that the less
economically privileged ethnic groups are over-represented among the youth
served by Act 300 agencies (Okamura, 1990).
SOCIO-ECONOMIC STATUS
The household composition statistics reported by the youth are not markedly
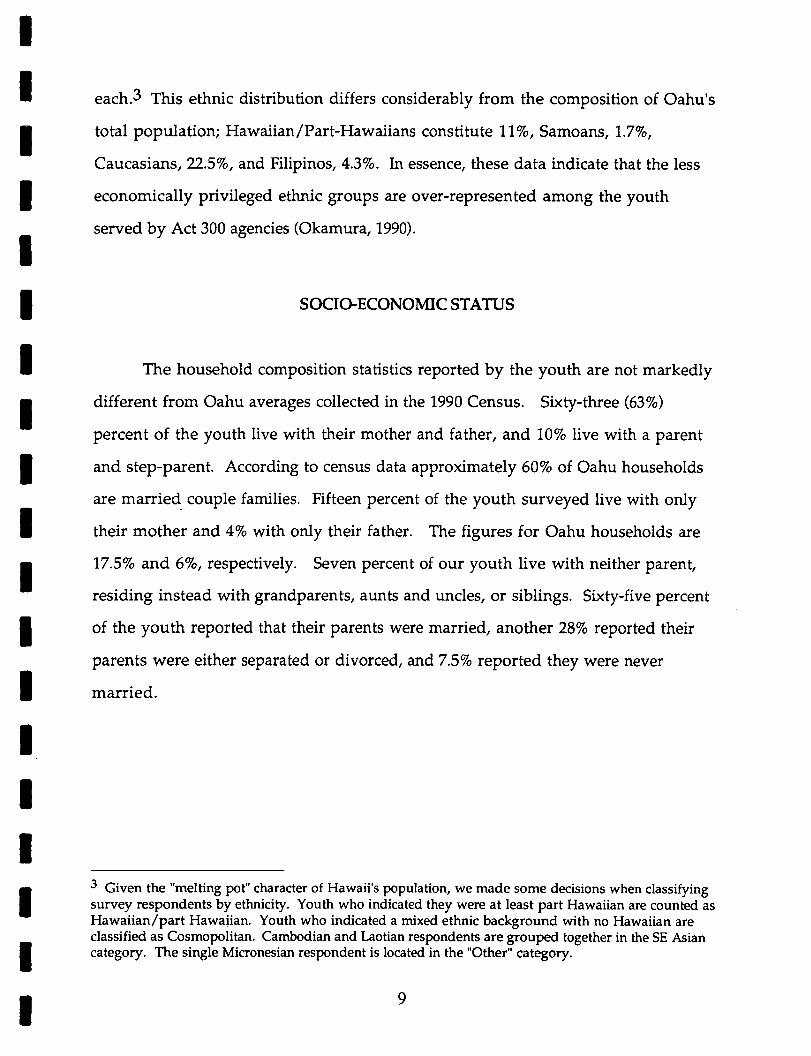
different from Oahu averages collected in the 1990 Census. Sixty-three (63%)
percent of the youth live with their mother and father, and 10% live with a parent
and step-parent. According to census data approximately 60% of Oahu households
are married couple families. Fifteen percent of the youth surveyed live with only
their mother and 4% with only their father. The figures for Oahu households are
17.5% and 6%, respectively. Seven percent of our youth live with neither parent,
residing instead with grandparents, aunts and uncles, or siblings. Sixty-five percent
of the youth reported that their parents were married, another 28% reported their
parents were either separated or divorced, and 7.5% reported they were never
married.
3 Given the "melting pot" character of Hawaii's population, we made some decisions when classifying survey respondents by ethnicity. Youth who indicated they were at least part Hawaiian are counted as Hawaiian/part Hawaiian. Youth who indicated a mixed ethnic background with no Hawaiian are classified as Cosmopolitan. Cambodian and Laotian respondents are grouped together in the SE Asian category. The single Micronesian respondent is located in the "Other" category.
63%
Family Composition
3% 3% .7%
[] Mom
[ ] father IN mother & father
• mother and step [ ] father and step
• grandparents
[ ] aunt & uncle [ ] brother/s ister
We found significant variations in household composition among the
different ethnic groups. Over eighty percent of all the Filipinos surveyed live with
two parents. Cosmopolitans have the second highest percentage of two parent
households with 77%. Among Samoan youth, a little more than 70% live with
two parents and Hawaiian youth have the lowest percentage at 67%.
The youth surveyed come from some of Oahu's poorer neighborhoods and
this is reflected in many of our statistics. The average household size found by this
sample was 6.5 which is twice as large as the average size for O a h u (3.02). Almost
20% of the youth reported that their fathers were unemployed and 31% reported
that their mothers were unemployed. By contrast, the state unemployment rate was
only 2.8% in 1991. At least 11% of the youth live in a household with n___oo employed
parents. Over 40% of single mothers are unemployed and 15% of single fathers do
not work outside the home. In addition, of all the youth living in single parent
families 30% reported that neither parent, whether living with them or not, is
employed.
I 0
I I I I I I I I I I I I I I I I I I I
I I I I I I I I I I I I I I I I I I I
Youth employment statistics are also cause for concern. Nearly 80% of all
youth 16 years of age and older who were surveyed were unemployed. Compared
with an Oahu average which is closer to 50% (Glauberman, 1992), those surveyed
have a much higher rate of unemployment.
Parental employment status varies by ethnicity. Most cosmopolitan and
Filipino youth reported that their fathers are employed, (85% and 84% respectively).
Seventy eight percent of Hawaiian youth and 69% of Samoan youth reported that
their father was working. Eighty five percent of Filipino mothers are working,
however, only about two thirds of Hawaiian and cosmopolitan mothers are
employed. The figure for Samoan mothers is slightly less than 50%.
DELINQUENCY
The survey asked youth the number of times in the last year they had
committed a variety of delinquent acts: cutting class, graffiti, stealing items worth
between $5 and $50, running away, carrying a weapon other than a pocket knife,
drug dealing, drug and alcohol use, gang fights, and vandalizing school property.
The good news is that in eight of ten of our delinquency categories, over eighty
percent of the youth answered zero when asked the number of times they had
committed the various acts in the past twelve months.
Alcohol use is the most common form of delinquent behavior; twenty-six
percent of the youth reported using alcohol in the last twelve months. Twenty-two
percent have cut class and 20% have been involved in a gang fight. At least 17%
reported acts of graffiti or stealing in the past twelve months. Approximately 15% of
youth reported having run away in the past twelve months. The percentage of
youth carrying a weapon, dealing or using drugs, and damaging school property is at
least 10% for each category.
11
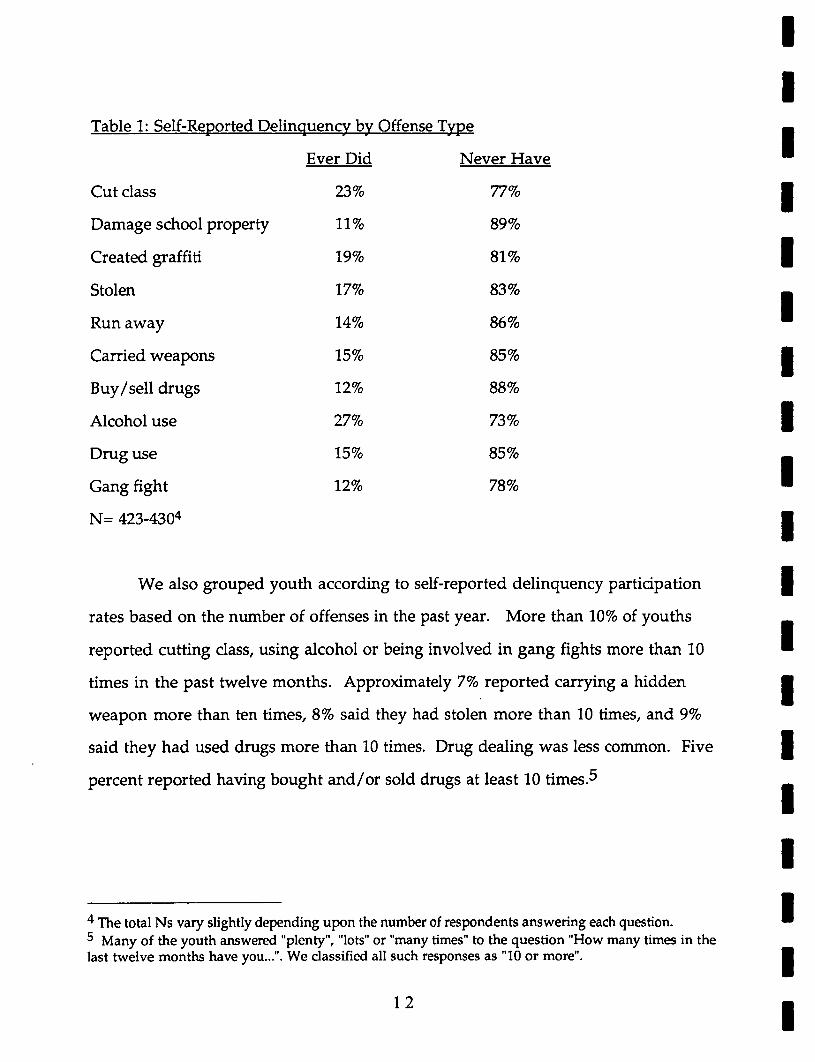
Table 1" Self-Reported Delinquency by Offense Type
Ever Did Never Have
Cut class 23% 77%
Damage school property 11% 89%
Created graffiti 19% 81%
Stolen 17% 83%
Run away 14% 86%
Carried weapons 15% 85%
Buy/sell drugs 12% 88%
Alcohol use 27% 73%
Drug use 15% 85%
Gang fight 12% 78%
N= 423-4304
We also grouped youth according to self-reported delinquency participation
rates based on the number of offenses in the past year. More than 10% of youths
reported cutting class, using alcohol or being involved in gang fights more than 10
times in the past twelve months. Approximately 7% reported carrying a hidden
weapon more than ten times, 8% said they had stolen more than 10 times, and 9%
said they had used drugs more than 10 times. Drug dealing was less common. Five
percent reported having bought and/or sold drugs at least 10 times. 5
4 The total Ns vary slightly depending upon the number of respondents answering each question. 5 Many of the youth answered "plenty", "lots" or "many times" to the question "How many times in the last twelve months have you...". We classified all such responses as "10 or more".
12
I I I I I I I I I I I I I I I I I I I
I I I I I I I I I I I I I I I I I I I
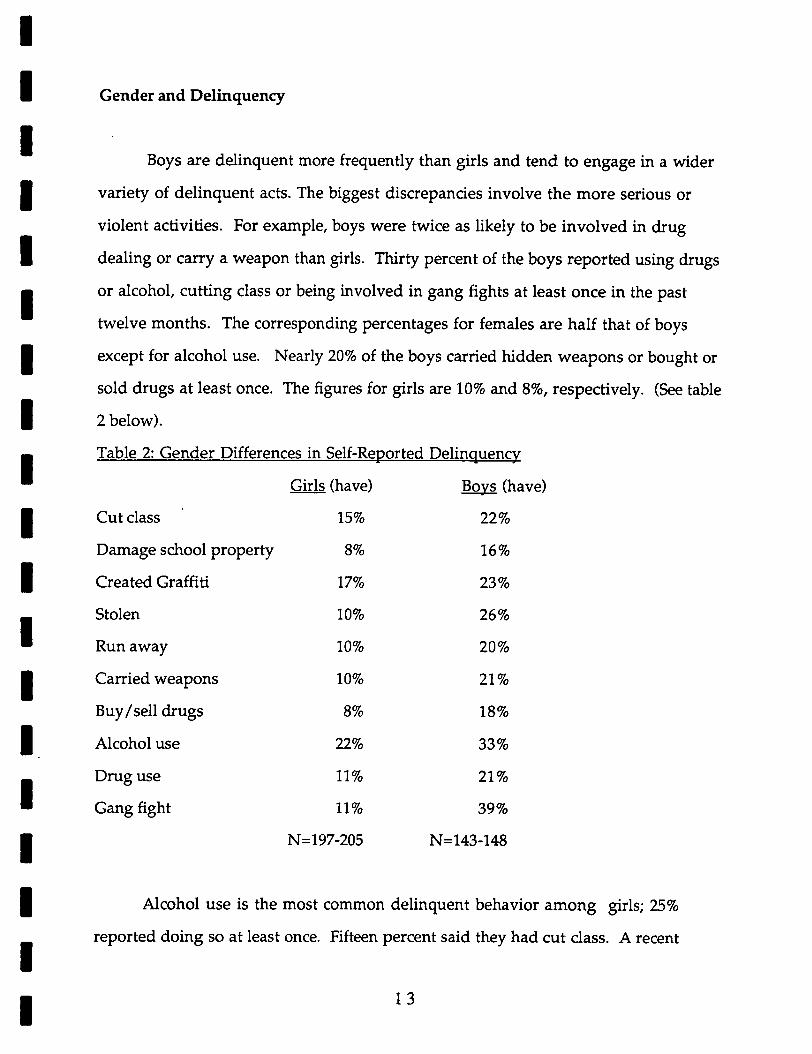
Gender and Delinquency
Boys are delinquent more frequently than girls and tend to engage in a wider
variety of delinquent acts. The biggest discrepancies involve the more serious or
violent activities. For example, boys were twice as likely to be involved in drug
dealing or carry a weapon than girls. Thirty percent of the boys reported using drugs
or alcohol, cutting class or being involved in gang fights at least once in the past
twelve months. The corresponding percentages for females are half that of boys
except for alcohol use. Nearly 20% of the boys carried hidden weapons or bought or
sold drugs at least once. The figures for girls are 10% and 8%, respectively. (See table
2 below).
Table 2: Gender Differences in Self-Reported Delinquency
Girls (have) Boy_s (have)
Cut class 15% 22%
Damage school property 8% 16%
Created Graffiti 17% 23%
Stolen 10% 26%
Run away 10% 20%
Carried weapons 10% 21%
Buy/sell drugs 8% 18%
Alcohol use 22% 33%
Drug use 11% 21%
Gang fight 11% 39%
N=197-205 N=143-148
Alcohol use is the most common delinquent behavior among girls; 25%
reported doing so at least once. Fifteen percent said they had cut class. A recent
13
survey done by the Hawaii Department of Education and the Northwest Regional
Educational Laboratory discovered that alcohol is by far the first substance of choice
for all students regardless of gender (1991, p. 45).
Age and Delinquency
The frequency of delinquent behavior also increases with age; thirteen and
fourteen year olds, for example, report significantly more delinquent acts than
younger youth. In the thirteen and under age group, less than 6% said they had cut
class ten or more times in the past twelve months. However, for fourteen year olds
this figure doubles to 12.7% and for fifteen year olds it more than triples to 39.39%.
Over 10% of thirteen year old respondents reported that they stole items between $5
and $50 ten or more times in the past year. This is over three times the percentage
for twelve year olds in the same category of delinquent behavior.
Eight percent of thirteen year olds said that they had carried a hidden weapon
ten or more times in the past twelve months, compared to over 11% of fourteen
year olds. These figures are four and five times higher than that reported by twelve
year olds (1.6%). Just over 3% of twelve year olds reported that they have been
involved in ten or more gang fights in the past year. In contrast, over 15% of
thirteen year olds reported the same level of involvement. Alcohol use jumps
drastically from 6% of twelve year olds using ten or more times a year to 13.5% of 13
year olds at the same usage level. Again, the statewide survey done by Hawaii's
Department of Education and NWREL show figures that are lower by as much as
50% (Hawaii Department of Education, 1991, p. 45).
14
I I I I I I I I I I I I I I I I I I I
I I I I I I I I I I I I I I I I I I I
GANG MEMBERSHIP
As of November , 1991, the Honolulu Police Department had identified 45
gangs and 1020 individuals as possible or suspected youth gang members. Although
referred to as "youth" gang members, this group includes males and females
between the ages of 13 and 58. A profile of this population (Chesney-Lind et.al.,
1992) determined that approximately 23% of HPD identified gang members were
juveniles, less than 18 years of age. The average age was 16.4 years for this group.
Over 70% were 16 or 17 years old, 21% were 15 years old, and less than 10% were 14
years old or younger.
Our self-report data shows that approximately 12% of the youth within this
sample are currently in a gang. This represents 18% of the boys and about 7% of the
girls. We also inquired about the youth's attitudes towards gang membership.
Eleven percent of the youth said that they wanted to be in a gang, of which 14% were
boys and 9% were girls. One of our most interesting findings was that nearly 17% of
current gang members said "no" when asked if they wanted to be in a gang. The
number of boys who wanted to be in a gang was less than the number who are
currently members. This relationship is reversed for girls; more girls want to be in
a gang than are currently in one.
Gang membership varies by age with 8% of 12 year olds reporting that they
were currently gang members and 12% to 15% of 13-15 year olds were in gangs as
well. "Wannabe's", or those youth who wish to be an active participant in a gang,
show a similar trend. Eight percent of 12 year olds and 19% of 13 year olds want to
be in a gang. By contrast, only about 11% of the 14 and 15 year olds are "wannabe's".
About a quarter of all respondents reported having been in a gang at some point.
Not surprisingly, the percentage increases as youth get older.
15
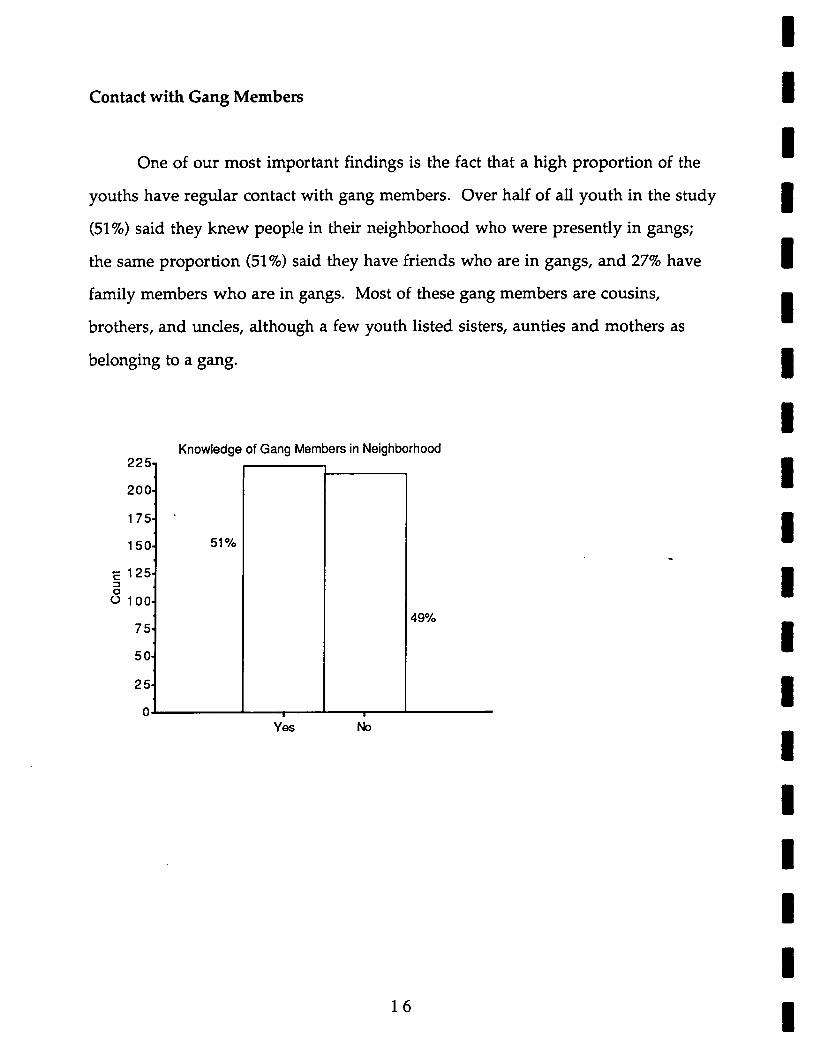
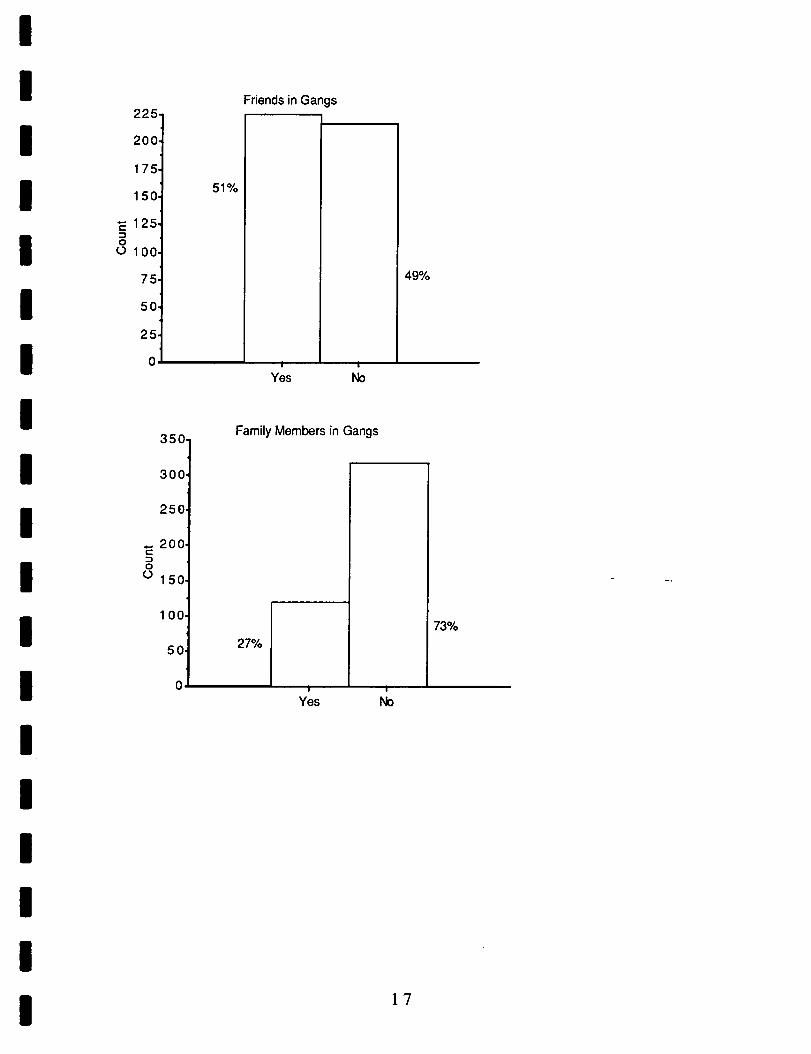
Contact with Gang Members
One of our most important findings is the fact that a high proportion of the
youths have regular contact with gang members. Over half of all youth in the study
(51%) said they knew people in their neighborhood who were presently in gangs;
the same proportion (51%) said they have friends who are in gangs, and 27% have
family members who are in gangs. Most of these gang members are cousins,
brothers, and uncles, although a few youth listed sisters, aunties and mothers as
belonging to a gang.
225,
2OO.
175.
150.
E 125. O
o 100.
75.
50.
251
0'
Knowledge of Gang Members in Neighborhood
51%
49%
| l
Yes No
16
I I I I I I I I I I I I I I I I I I I
I I I I I I I I I I I I I I I I I I I
225-
2001
175-
1501 E 125~ O
o I00-
75£ 50£ 25-
350
300,
259,
.- 200, ¢--
O
0 150.
100.
50.
0
51%
Friends in Gangs
49%
! |
Yes No
Family Members in Gangs
27% 73%
, i
Yes No
17
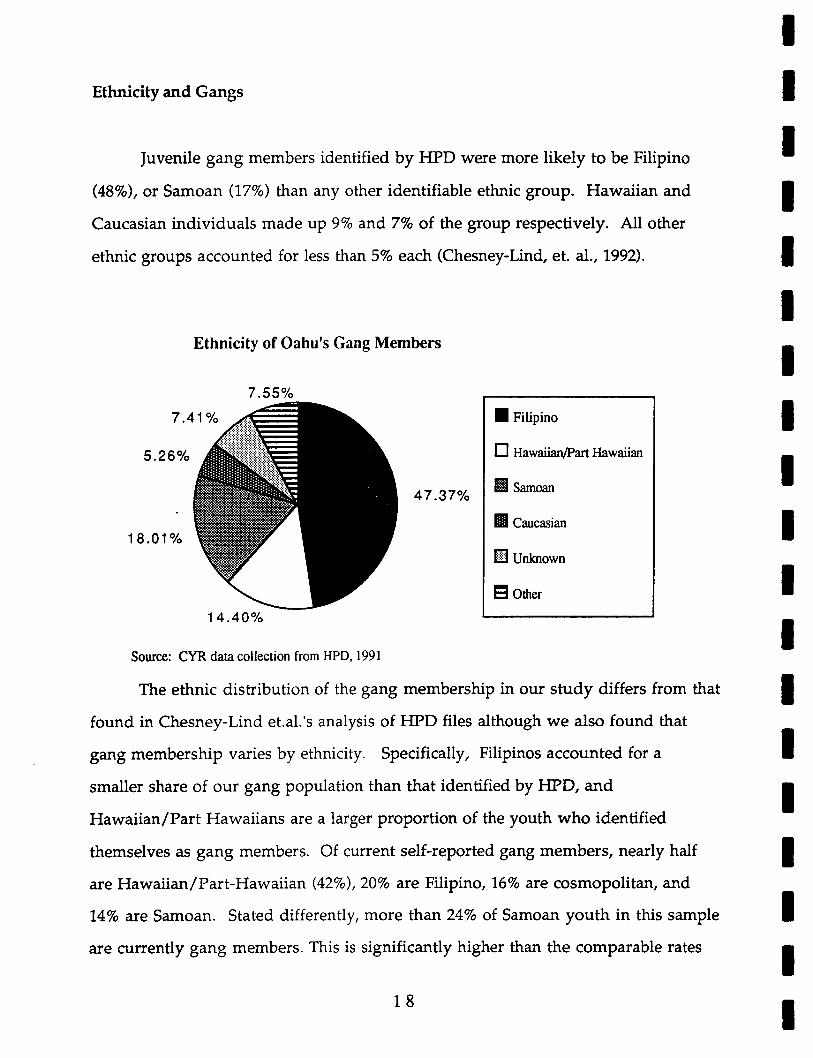
Ethnicity and Gangs
Juvenile gang members identified by HPD were more likely to be Filipino
(48%), or Samoan (17%) than any other identifiable ethnic group. Hawaiian and
Caucasian individuals made up 9% and 7% of the group respectively. All other
ethnic groups accounted for less than 5% each (Chesney-Lind, et. al., 1992).
Ethnicity of Oahu's Gang Members
7 . /
5.26%
7.55%
18.01%
47.37%
14.40%
Source: CYR data collection from HPD, 1991
[ ] Filipino
[ ] Hawaiian/Part Hawaiian
[] Samoan
[ ] Caucasian
[ ] Unknown
[ ] Other
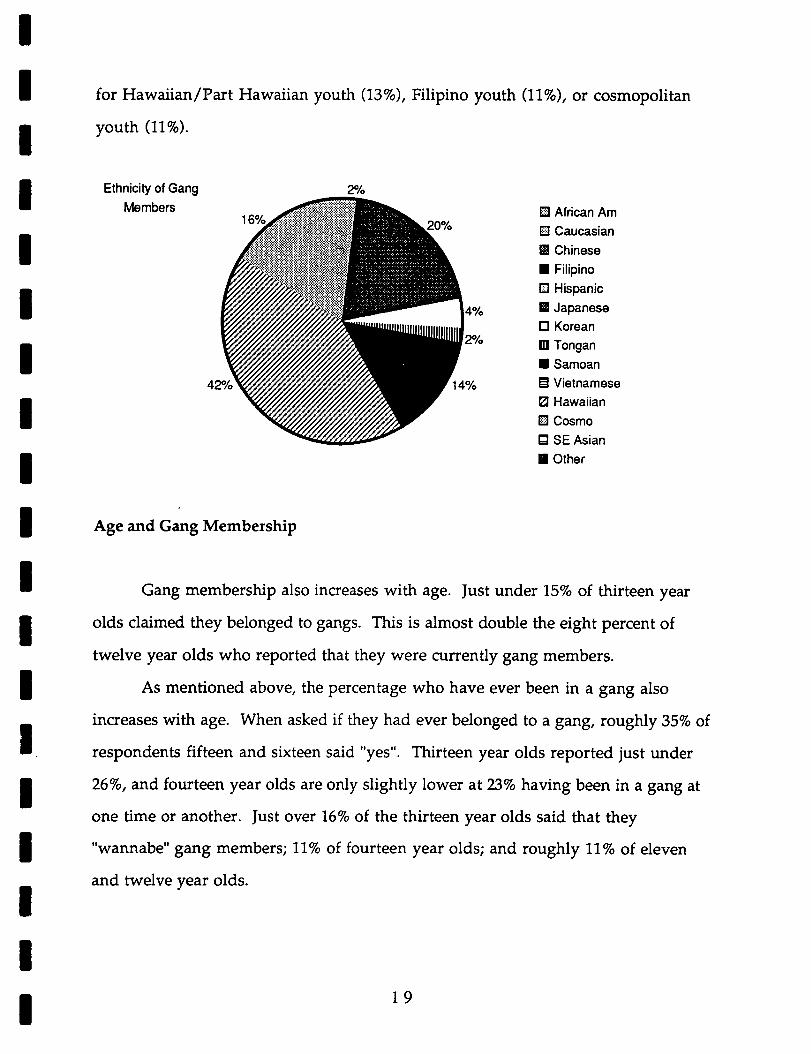
The ethnic distribution of the gang membership in our s tudy differs from that
found in Chesney-Lind et.al.'s analysis of HPD files although we also found that
gang membership varies by ethnicity. Specifically, Filipinos accounted for a
smaller share of our gang population than that identified by HPD, and
Hawaiian/Part Hawaiians are a larger proportion of the youth who identified
themselves as gang members. Of current self-reported gang members, nearly half
are Hawaiian/Part-Hawaiian (42%), 20% are Filipino, 16% are cosmopolitan, and
14% are Samoan. Stated differently, more than 24% of Samoan youth in this sample
are currently gang members. This is significantly higher than the comparable rates
18
I I I I I I I I I I I I I I I I I I I
I I i youth (11%).
i Ethnicity of Gang Members
16 ~ i ~ o ..::i::i:i~i~iii~i~$: /~~-..-..~-.:~--.-..-..--.
| ~ ~
! 4
I
for Hawaiian/Part Hawaiian youth (13%), Filipino youth (11%), or cosmopolitan
2%
p 4%
2%
14%
[] African Am [] Caucasian [] Chinese [] Filipino [] Hispanic [] Japanese [] Korean [] Tongan [] Samoan [] Vietnamese [] Hawaiian [] Cosmo [] SE Asian [] Other
I Age and Gang Membership
I I I I I I I
Gang membership also increases with age. Just under 15% of thirteen year
olds claimed they belonged to gangs. This is almost double the eight percent of
twelve year olds who reported that they were currently gang members.
As mentioned above, the percentage who have ever been in a gang also
increases with age. When asked if they had ever belonged to a gang, roughly 35% of
respondents fifteen and sixteen said "yes". Thirteen year olds reported just under
26%, and fourteen year olds are only slightly lower at 23% having been in a gang at
one time or another. Just over 16% of the thirteen year olds said that they
"wannabe" gang members; 11% of fourteen year olds; and roughly 11% of eleven
and twelve year olds.
I I 19
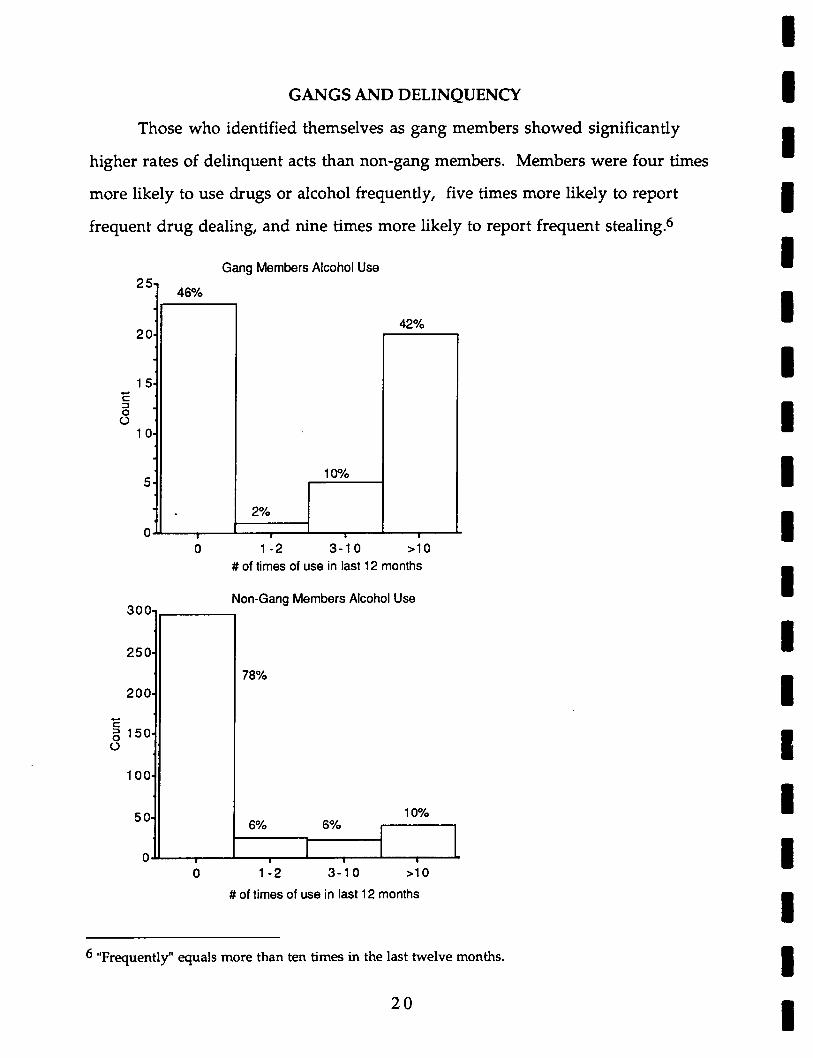
GANGS AND DELINQUENCY
Those who identified themselves as gang members showed significantly
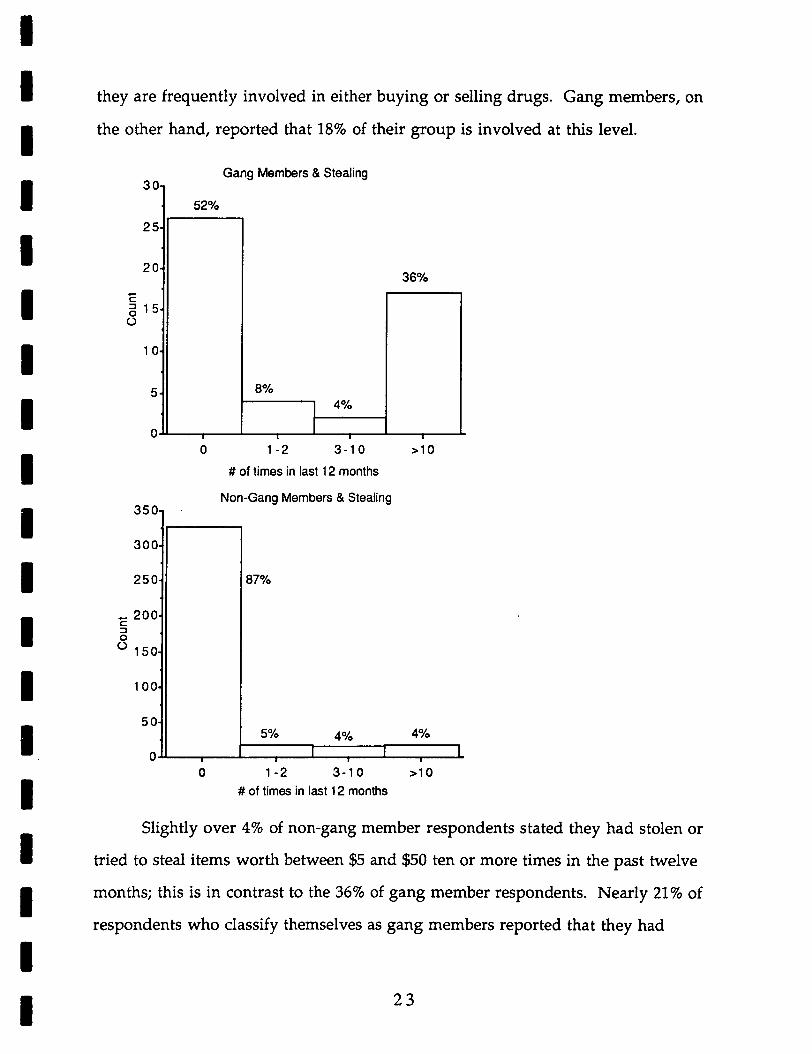
higher rates of delinquent acts than non-gang members. Members were four times
more likely to use drugs or alcohol frequently, five times more likely to report
frequent drug dealing, and nine times more likely to report frequent stealing. 6
25-
20
15 E 0 o
10 ̧
300,
250.
200.
E 150.
O
100.
50.
011
Gang Members Alcohol Use
46%
42%
10%
! I |
1 -2 3-10 >10 # of times of use in last 12 months
Non-Gang Members Alcohol Use
!
0
78%
10% 6% 6%
!
1 -2 3-1 0 >10
# of times of use in last 12 months
6 "Frequently" equals more than ten t imes in the last twelve months .
20
I I I I I I I I I I I I I I I I I I I
I I I I I I I I I I I I I I I I I I i
35- i
30-1
25
_ 2 0
0
O 1 5
10,
,
66%
|
0
Gang Members Drug Use
28%
4% 2%
I | | •
1-2 3-10 >10
# of time of use in last 12 months
350. Non-Gang Members Drug Use
300.
250.
,-, 200. t -
O
o 150.
100-
50-
0
89%
6% 3% 2o/0
v I I il I l l
0 1-2 3-10 >10 # of times in last 12 months
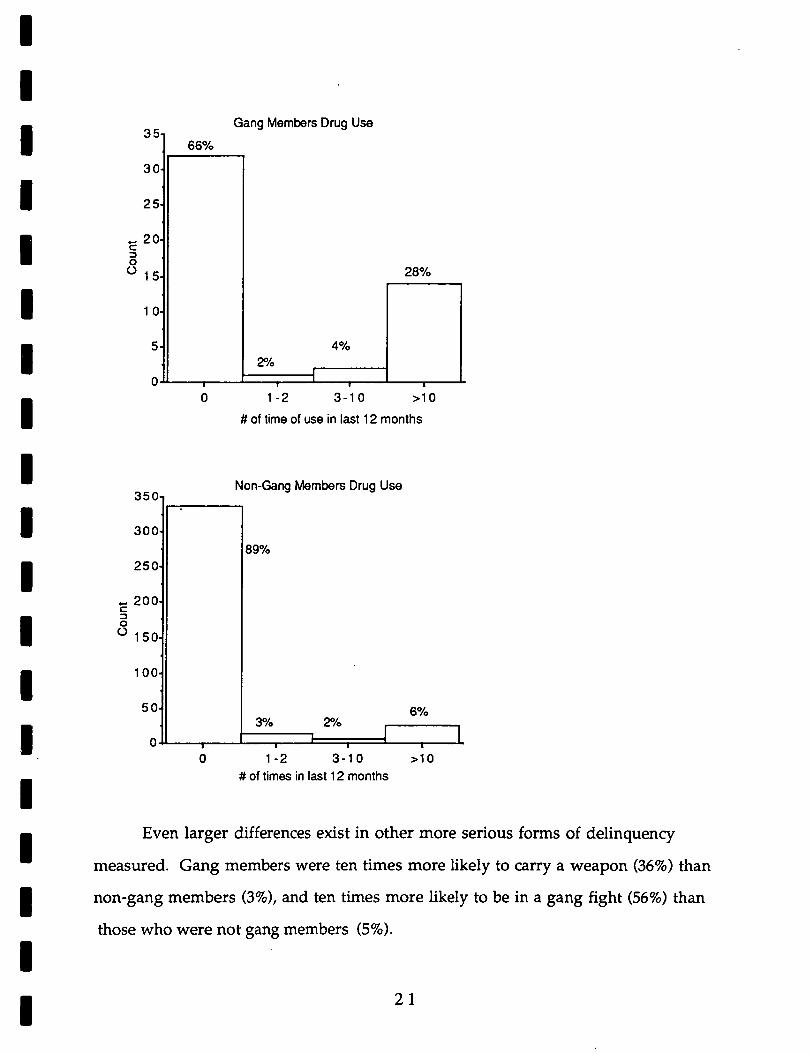
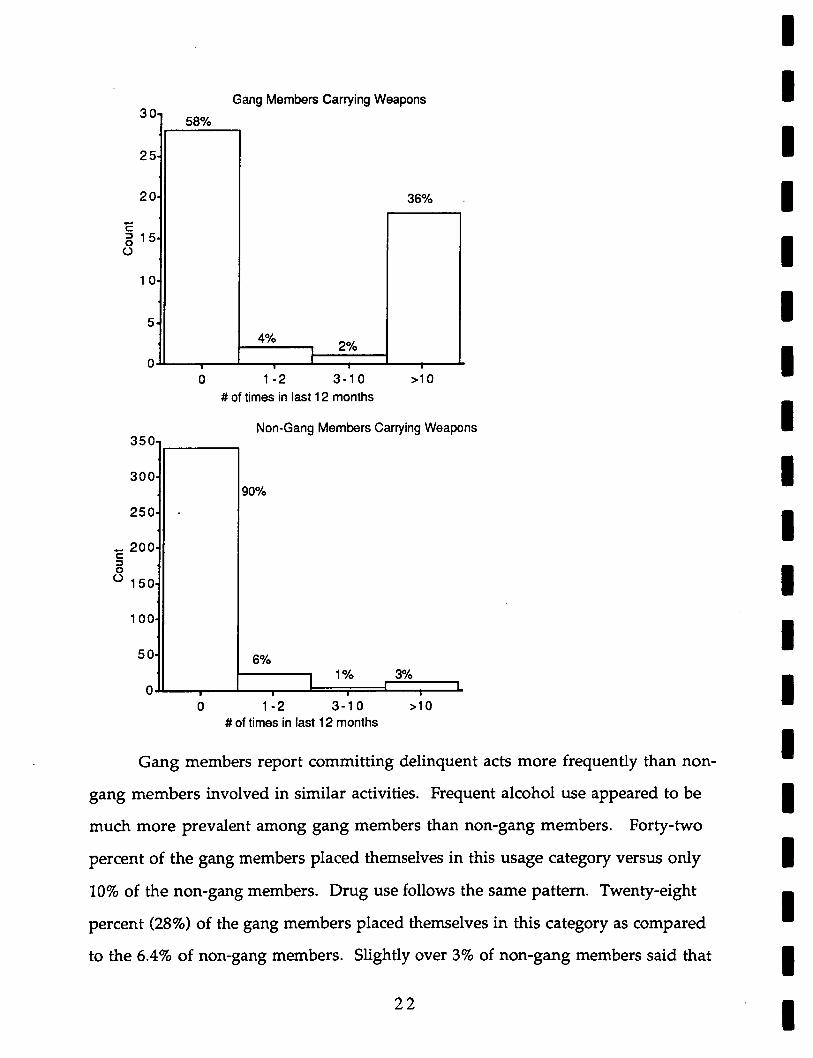
Even larger differences exist in other more serious forms of delinquency
measured. Gang members were ten times more likely to carry a weapon (36%) than
non-gang members (3%), and ten times more likely to be in a gang fight (56%) than
those who were not gang members (5%).
21
30,
2 5
2 0
E ~15
10.
5.
oll
350-
300-
250-
,.. 200. C
100
58%
Gang Members Carrying Weapons
36%
I
0
4% 2% I | |
1-2 3-10 # of times in last 12 months
|
>10
Non-Gang Members Carrying Weapons
90%
6%
I 1% 3% I
i I |
1 -2 3 -1 0 >10 # of times in last 12 months
Gang members report committing delinquent acts more frequently than non-
gang members involved in similar activities. Frequent alcohol use appeared to be
much more prevalent among gang members than non-gang members. Forty-two
percent of the gang members placed themselves in this usage category versus only
10% of the non-gang members. Drug use follows the same pattern. Twenty-eight
percent (28%) of the gang members placed themselves in this category as compared
to the 6.4% of non-gang members. Slightly over 3% of non-gang members said that
22
I I I I I I I I I I I I I I I I I I I
I I I I I I I I I I I I I I I I I I I
they are frequently involved in either buying or selling drugs. Gang members, on
the other hand, reported that 18% of their group is involved at this level.
3 0
25,
20,
E ~ 1 5 O
10.
.
350.
300.
250-
200.
° 11 o 150
100-
50-
Gang Members & Stealing
52%
36%
8%
i ! i |
0 1 -2 3 -10 >10
# of times in last 12 months
Non-Gang Members & Stealing
87%
5% 4% 4%
I I | i ! |
0 1 -2 3 -10 >10
# of times in last 12 months
Slightly over 4% of non-gang member respondents stated they had stolen or
tried to steal items worth between $5 and $50 ten or more times in the past twelve
months; this is in contrast to the 36% of gang member respondents. Nearly 21% of
respondents who classify themselves as gang members reported that they had
23
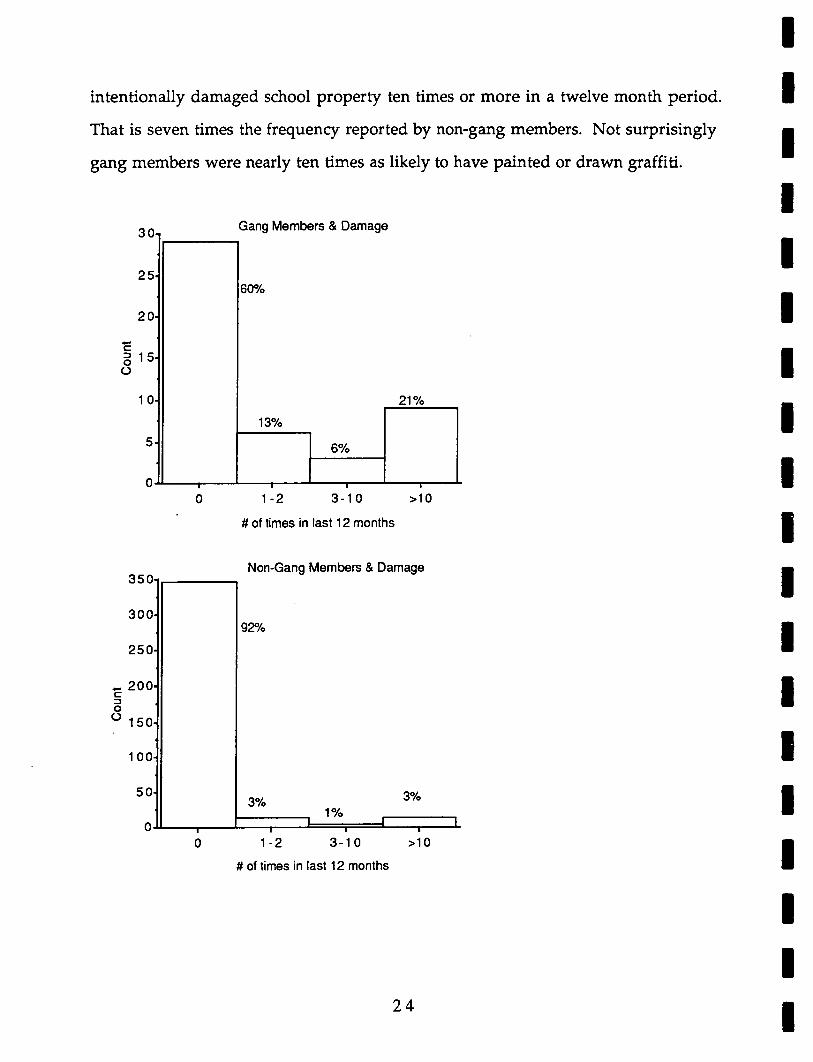
intentionally damaged school property ten times or more in a twelve month period.
That is seven times the frequency reported by non-gang members. Not surprisingly
gang members were nearly ten times as likely to have painted or drawn graffiti.
3O
2O
10,
,
Gang Members & Damage
60%
13%
6%
21%
| | | |
0 1-2 3 -10 >10
# of times in last 12 months
350. Non-Gang Members & Damage
300.
250.
- 200. t ' - - I
o JI o 150
100-
50-
0 0
92°1o
3% 3% 1%
I I ! ! i
1-2 3 -10 >10
# of times in last 12 months
24
I I I I I I I I I I I I I I I I I I I
I I I I I I I I I I I I I I I I I I I
Very few youth in either of these groups reported running away from home.
However, gang members reported that 8% had left home frequently versus just
under 3% of non-gang members.
The differences are equally striking when considering boys and girls
separately. For male gang members, the incidence rate for all delinquent behaviors
except for school vandalism is 50% or greater. More than 40% of male gang
members had destroyed school property at least once in the past twelve months.
The rates for non-gang members are consistently less than one third that for gang
members except for the category of alcohol use. This pattern was even more
pronounced when we looked at the percentage committing a delinquent act more
than ten times in the past twelve months.
Over 50% of female gang members used alcohol, cut class and painted graffiti
at least once in the previous twelve months. Roughly 25% of these girls carried a
weapon or used drugs, and over 30% were involved in a gang fight or intentionally
damaged school property. As with the boys, female gang members are significantly
more delinquent than their peers who are not in gangs. Gang members are four
times as likely to have been in a gang fight or cut class, and five times as likely to
have damaged school property. They are more than twice as likely to have used
alcohol. The differences in the number of delinquent acts committed are less
dramatic than those for the boys, however, primarily because female gang members
are less delinquent than their male counter parts.
YOUTH EVALUATION OF PROGRAMMING
We devoted a portion of the survey questions to the youth's evaluation of
the programming provided by the various agencies. The four program areas of
Sports, Dance, Games/Activities and Counseling were rated highly by survey
25
respondents with dance being the favorite with an average score of 4.0 out of 5, and
counseling the least favorite with a score of 3.8.
Over ninety percent (90%) of respondents said they felt better with other people
and about themselves as a result of program participation. Approximately eighty
percent (80%) reported doing better in school. Girls were slightly more likely to
report feeling better about themselves and with other people, while boys reported
doing better in school more frequently.
The youth had a number of suggestions for programs not currently offered at
their site which include: tennis, bowling, archery, chess, Sumo and hula. The most
frequently requested options were football, soccer, drama, baseball and video games,
particularly Street Fighter II. A complete list of suggestions is included in Appendix
III.
26
I I I I I I I I I I I I I I I I I I I
I I I I I I I I I I I I I I I I I I I
NEIGHBOR ISLAND SURVEY RESULTS
We received nearly one hundred surveys from neighbor-island youth.
However, the majority came from Maul (70%). This fact severely limits our ability
to reach conclusions about Kauai or Hawaii youth. It is also the case that out of the
94 respondents, 10% or 9 youth identify themselves as gang members, and 4 of those
are from Maul. This should be kept in mind when considering features of gang
membership on the Neighbor Islands. Due to the low numbers of respondents, we
will compare the Neighbor Islands as a group to Oahu and then talk about Maui
specifically.
The demographic profile of Neighbor Island youth surveyed shows some
similarities to Oahu as well as some important differences. The ethnic composition
is essentially the same: Hawaiian/part Hawaiian youth are 51% of the respondents,
Filipino youth are 20%, and Caucasians 12%, of the respondents. Thirteen year olds
are again the largest age group. Twenty-eight percent of the respondents are in the
8th grade, 18% are in sixth, and 17% are in the 10th grade. Sex composition, though,
differs with males accounting for 62% of the respondents and females for 38%.
Only fifty-two percent of neighbor-island respondents' parents are married in
contrast to 63% on Oahu. Just under 14% of the respondents' mothers are
unemployed and over 11% of their fathers are not working outside the home.
These are lower levels of unemployment than found on Oahu where 31% of
mothers and 20% of fathers were reported unemployed by their children.
As with the Oahu sample, a high percentage of youth have contact with gang
members in their neighborhoods and families. Just under 51% of the respondents
said they knew gang members in their own neighborhoods. Sixty-two percent (62%)
of thirteen year olds say there are gang members in their neighborhoods. Thirteen
year olds also have the highest number of friends in gangs, 60%, compared to 54% of
27
the respondents overall. Over 21% of the respondents said that they had family
members who were currently in gangs. Roughly 25% of 12-14 year olds said they
had family members presently in gangs.
Fifty percent of the gang members are from Maui, however, it must be noted
that nearly 70% of the survey respondents are Maui residents. Only 7%, or four, of
Maui respondents identified themselves as gang members. The percentage of gang
members for all Neighbor Island youth was just under 10%, while Oahu
respondents reported a rate of 12%. Hawaiian/part Hawaiian youth comprise 56%
of the self-identified gang members while Caucasian, Tongan and cosmopolitan
each comprise roughly 10% of the gang members.
Data gathered from the Neighbor Islands shows about the same level of gang
activity as on Oahu and a considerably higher delinquency rate. For example, 19% of
Oahu youth reported that they had created graffiti compared to 32% of Neighbor
Island youth. Similarly 34% of Neighbor Island youth in these programs have
carried a hidden weapon compared to 14% of Oahu youth. There was less of a
difference seen between drug dealing (13% compared to 10%) and gang fighting (23%
compared to 11%). Also, similar to the findings on Oahu is the fact that 13 and 14
year olds seem to be the most delinquent youth involved in the recreational
programs.
A significantly higher percentage of Maui youth had participated in a variety
of delinquent behavior "ten or more times in the last twelve months" as compared
with Oahu respondents. The rates for creating graffiti and stealing items worth
between $5 and $50 were twice as high for Maui youth. It was three times as high for
running away, carrying hidden weapons, and vandalizing school property. Drug
and alcohol use, along with drug dealing (more than ten times in the last twelve
months), were also roughly twice as likely among Maui youth.
28
I I I I i i I I i i I I i i i i I I i
I I I I I I I I I I I I I I I I I I I
Almost 10% of the respondents identified themselves as gang members. The
age groups with the highest numbers of gang members are the 13 year olds, 19%, and
the 14 year olds, 14%. When asked if they had ever been gang members, the figures
rose quite a bit. Almost 43% of the 13 year old said they had been in a gang.
Fourteen and fifteen year olds reported that 21% had been in a gang. Twenty-seven
percent of all respondents stated they had been in a gang at one time or another.
Other results are similar to Oahu youth with those who identify themselves
as gang members having higher delinquency rates than non-gang members.
However, these results should be viewed with caution due to the small sample size.
Sixty-seven percent of those who are gang members have carried a hidden weapon
more than ten times in the past year versus 21% of the non-gang members. This
compares to 36% for Oahu gang members and 3% for Oahu's non-gang members. In
the category of buying and selling drugs frequently, the rates are higher for Neighbor
Island gang" members than Oahu gang members: 38% for Neighbor Island and 18%
for oahu, but similar for non-gang members (6% for Neighbor Island and 4% for
Oahu).
Interestingly, the numbers differed quite drastically when the category of
alcohol use was reviewed. Seventy-five percent of Neighbor Island gang members
used alcohol frequently compared to only 19% of non-gang members. By contrast,
nearly half of Oahu gang members, (42%), reported using alcohol frequently
compared to only 10% of non-gang members.
29
I OAHU NEIGHBORHOODS i
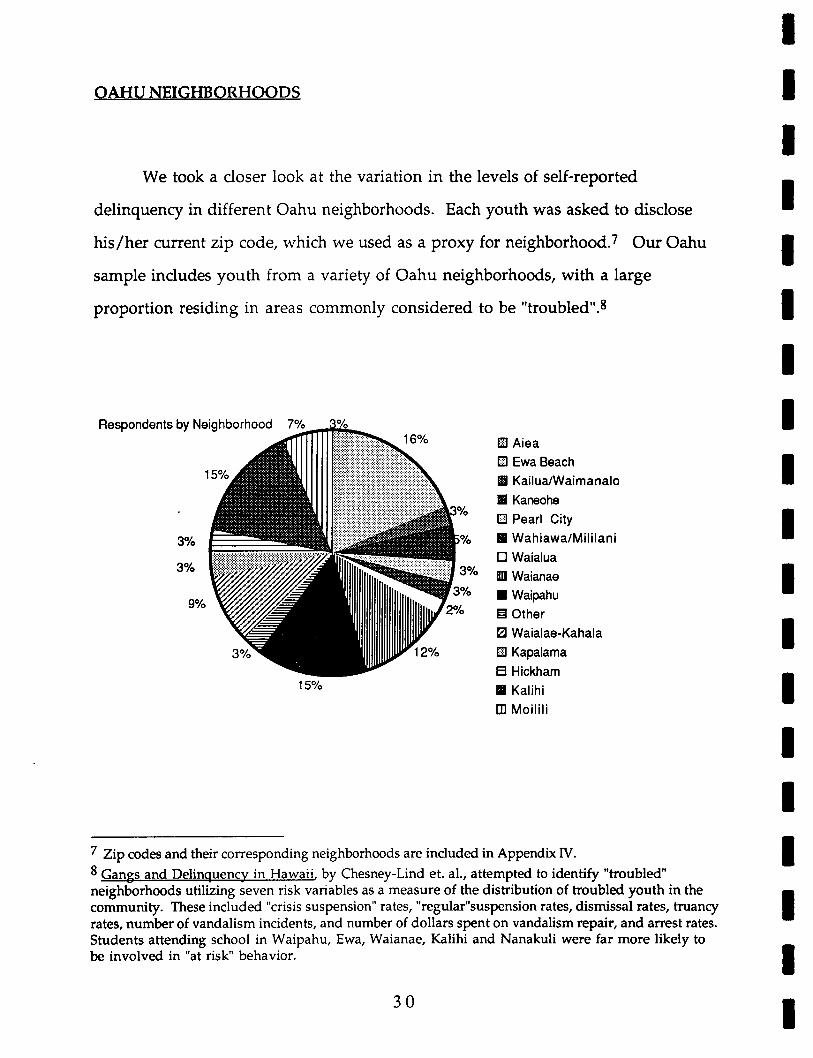
! We took a closer look at the variation in the levels of self-reported
delinquency in different Oahu neighborhoods. Each youth was asked to disclose i
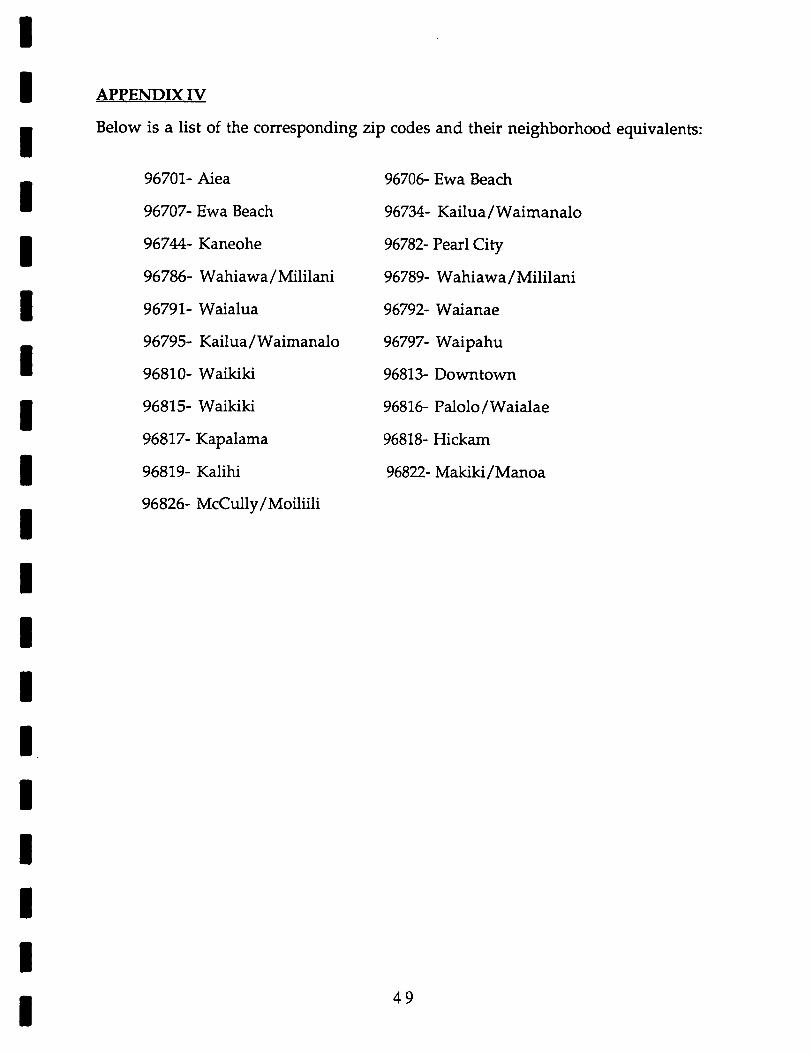
his/her current zip code, which we used as a proxy for neighborhood. 7 Our Oahu i
sample includes youth from a variety of Oahu neighborhoods, with a large
proportion residing in areas commonly considered to be "troubled". 8 I
I Respondents by Neighborhood ! 6% ~ Aiea i
[] Ewa Beach i • KailuaJWaimanalo • Kaneohe
:':': . . . . . . . . . :' ":" ":':" ":':':" ":':':':':':':':':':':':':':':':':':""" 0/¢ I
3% ~ % • Wahiawa/Mililani
~ " ~ ~ [] Waialua 3°/° 3% • Waianae I
g% 3% • Waipahu 2% [] Other
[] Waialae-Kahala I o [] Kapalama
3 '/o ~ [] Hickham 15% [] Kalihi
m Moil•l• I I I
7 Zip codes and their corresponding neighborhoods are included in Appendix W. 8 Gangs and Delinquency in Hawaii, by Chesney-Lind et. al., attempted to identify "troubled" neighborhoods utilizing seven risk variables as a measure of the distribution of troubled youth in the community. These included "crisis suspension" rates, "regular"suspension rates, dismissal rates, truancy rates, number of vandalism incidents, and number of dollars spent on vandalism repair, and arrest rates. Students attending school in Waipahu, Ewa, Waianae, Kalihi and Nanakuli were far more likely to be involved in "at risk" behavior.
I I I
30 I
I I I I I I I I I I I I I I I I I I I
GANGS, DELINQUENCY & UNEMPLOYMENT BY NEIGHBORHOOD
Forty-four percent (44%) of Palolo/Waialae and 26% of Kalihi youth reported
that their father is unemployed. Four out of every five Palolo/Waialae youth and
over one third of Kalihi youth said that their mother did not have a job. As
mentioned above, the state unemployment figure in 1991 was 2.8%.
Gang membership varies significantly by neighborhood. Youth surveyed
from Ewa Beach, Palolo/Waialae, Waianae, Waipahu and Kalihi are more likely to
be involved in gangs than youth from other neighborhoods. Nearly 80% of all
youth who report currently being in a gang are from one of these five
neighborhoods, with Kalihi comprising 31% of this figure, yet these respondents
comprised only 69% of those surveyed. Of the neighborhoods with youth who had
been in a gang at one time or another, Palolo/Waialae and Kalihi have the highest
percentagesi 44% and 39%. Kalihi and Waianae have the highest number of youth
who want to be in a gang, 25% and 20% of all youth surveyed respectively.
Contact with gang members also varies by neighborhood with these same five
neighborhoods prominent. Nearly 27% of all youth surveyed said that at least one
of their family members is currently in a gang; however, three of the five targeted
neighborhoods show significantly higher figures. Forty-five percent (45%) of
Palolo/Waialae youth and 44% of Kalihi youth said that at least one of their family
members is a gang member. Over one third of Waipahu youth said the same.
Slightly over half of the surveyed youth acknowledged knowing gang
members in their neighborhood or having friends in gangs. Palolo/Waialae,
Waipahu, and Kalihi figures prove to be significantly higher than the overall Oahu
average (50%) in both of these categories. Most noteworthy is our finding that 83%
of Kalihi youth know gang members in their neighborhood, and over three quarters
of the Kalihi youth have friends in gangs. Sixty-four percent (64%) of
31
Palolo/Waialae youth know gang members in their neighborhood and the same
percentage have friends who are in gangs.
Delinquency also proves to be higher in the neighborhoods of Ewa Beach,
Palolo/Waialae, Waianae, Waipahu, and Kalihi. For example, seventeen percent of
the youth in Waipahu and 12% in Kalihi reported using drugs 10 or more times in
the last year, as compared to the Oahu average of 9%. Twenty-three percent of youth
in Kalihi and 21% of Waipahu youth reported using alcohol 10 or more times in the
last year, and 15% of Waianae and Palolo/Waialae youth reported the same. The
overall Oahu average is 14%.
Seventeen percent (17%) of Waipahu youth and 14% of Kalihi youth reported
buying or selling drugs in the last year as compared to the 10% Oahu average.
Waipahu, Kalihi and Waianae also have an above average percentage of youth
dealing drugs more than 10 times in the last year. The Windward neighborhoods of
Kailua/Wa~manalo and Kaneohe comprise 26% of the youth who said they have
bought or sold drugs more than 10 times in the last year, although they make up
only 6% of the total youths surveyed.
One-fourth (25%) of Waipahu youth reported carrying a weapon at least once
in the last year and 16% of Kalihi youth, 13% of Palolo/Waialae youth and 11% of
Waianae youth reported the same. Twelve percent of Waipahu youth reported
carrying a weapon 10 or more times compared to 9% of Waianae youth and 8% of
Kalihi youth. The Oahu average for this frequency of weapon carrying is 7%.
Twenty-two percent of Kalihi youth and 18% of Palolo/Waialae youth
reported being involved in gang fights on more than 10 occasions in the last years,
compared to the 11% Oahu average. Thirty-two percent of Kalihi youth reported
involvement in gang fights on 3 or more occasions and Palolo/Waialae youth
reported over 20% in the same category. The Oahu average is 15%. Of all the youth
surveyed participating in gang fights 10 or more times in the last year, 75% were
32
I I I I I I I I I I I I I I I I I I I
I I I I I I I I I I I I I I I I I I I
from one of these five neighborhoods even though they comprise only two-thirds
of all youth surveyed. Of those involved in gang fights 10 or more times, nearly
30% of the youth are from the Kalihi area.
33
COMPARISON WITH DATA FROM PAGE YOUTH
We also analyzed data collected from PAGE programs (Positive Alternatives
to Gangs Education) at five Oahu schools: Dole, Kalakaua, King, Jarrett and
Wahiawa Intermediates. We have assumed these surveys to represent a random
sample of youth attending these schools and compare these data with those
garnered from youth attending Act 300 programming. This analysis, then, can serve
as one measure of the success of agencies' efforts to reach youth at particular risk for
gang and other anti-social activity.
Of the 163 PAGE respondents, 39% are Hawaiian/Part Hawaiian, 20% are
Filipino, 12% are cosmopolitan, 9% are Samoan, and 8% are Japanese.
Approximately 79% are 12 years old, and 14% are 13 years old, with 96% of the
respondents being in 7th grade. Males and females each comprised 50% of this
sample.
The socio-economic characteristics of the PAGE program youth are slightly
more positive than those of the Oahu agencies sample. Approximately 72% of the
youth reported that their parents are married which is higher than the 65% reported
by the agency sample. Another 19% reported that their parents are either separated
or divorced as compared to 28%, and 8.6% reported that their parents were never
married, just slightly over the 7.5% of the agency sample. In addition, parental
unemployment figures are slightly lower. PAGE youth reported that 21% of their
mothers are unemployed as compared to the agency sample's 31%. In addition, 17%
of the PAGE fathers are unemployed, which is just under the 20% reported by the
Oahu sample, although still significantly higher than the state average of 2.8%.
The PAGE youth, taken as a whole, report lower rates of gang membership
and fewer incidences of delinquent activities than our agency sample. In other
words, youth participating in agency programming appear to be more troubled on a
34
I I I I I I I I I I I I I I I I I I I
I I I I I I I I I I I I I I I I I I I
variety of measures than the random sample of intermediate school students
surveyed through the PAGE program. Although there are significant differences
between the five schools, (discussed in detail below) this finding suggests that Act
300 agencies are successfully targeting "at risk" youth.
For instance, when we look at the prevalence of gang membership among
youth at these five schools, only Dole Intermediate, with 15%, has a higher rate than
the agency sample average of 11%. Kalakaua and Jarrett Intermediate reported 10%
and 5% respectively and neither King nor Wahiawa had any respondents who
reported currently being in a gang. Only Kalakaua has a higher rate of youth having
ever been in a gang (29%) than the agency sample of 24%. Dole (15%), Wahiawa
(14%), Jarrett (13%) and King (3%) all are significantly lower. Finally, the percentage
of youth who reported that they want to be in a gang at all five PAGE schools is
equal to or lower than the rate of 12% found in the agency sample. (See Table 3
below).
Overall, the PAGE youth reported lower rates of delinquent activities than
the agency sample. For example, when the category of buying and selling drugs is
looked at, all five PAGE schools have lower rates of delinquency than the agency
youths' participation rate of 10%. Wahiawa, King and Kalakaua report that none of
their respondents have bought or sold drugs in the last year. Jarrett has a rate of 4%,
followed by Dole at 7%. (See Table 4.)
35
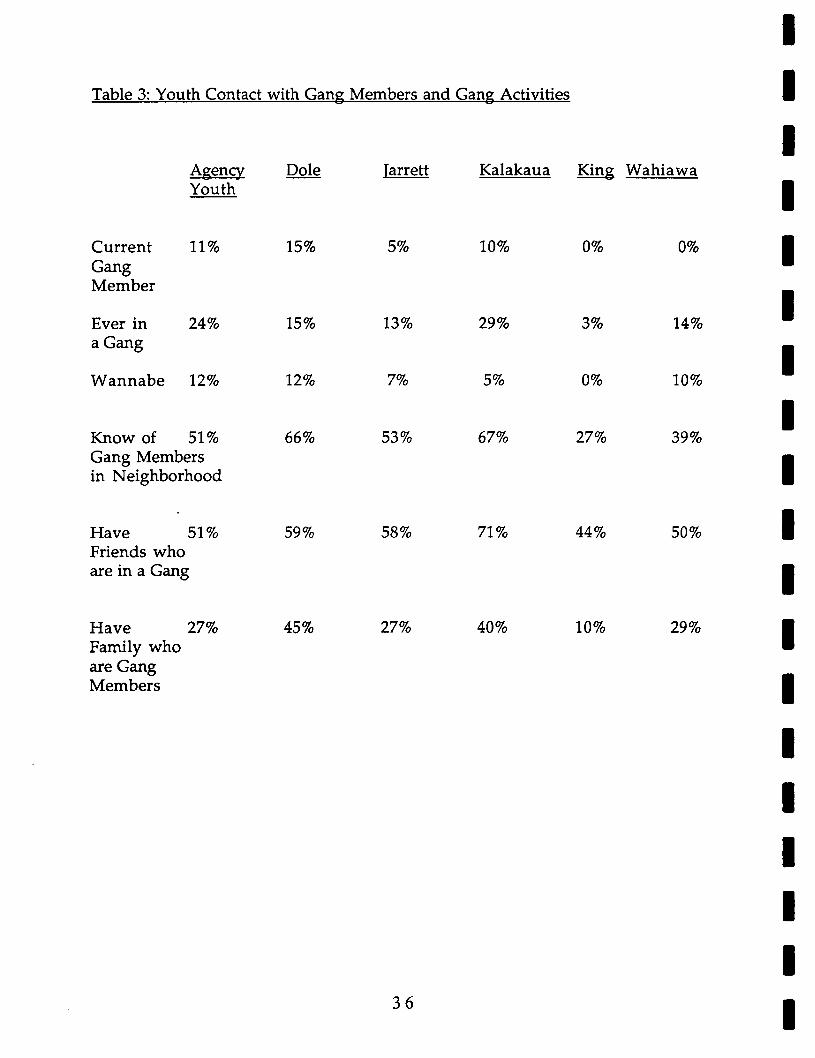
Table 3: Youth Contact with Gang Members and Gang Activities
Agency Dole Iarrett Kalakaua Youth
Current Gang Member
Ever in a Gang
King Wahiawa
11% 15% 5% 10% 0% 0%
24% 15% 13% 29% 3% 14%
Wannabe 12% 12% 7% 5% 0% 10%
Know of 51% Gang Members in Neighborhood
66% 53% 67% 27% 39%
Have 51% Friends who are in a Gang
59% 58% 71% 44% 50%
27% 45% 27% 40% 10% 29% Have Family who are Gang Members
36
I I I I I I I I I I I I I I I I I I I
I I I I I I I I I I I I I I I I I I I
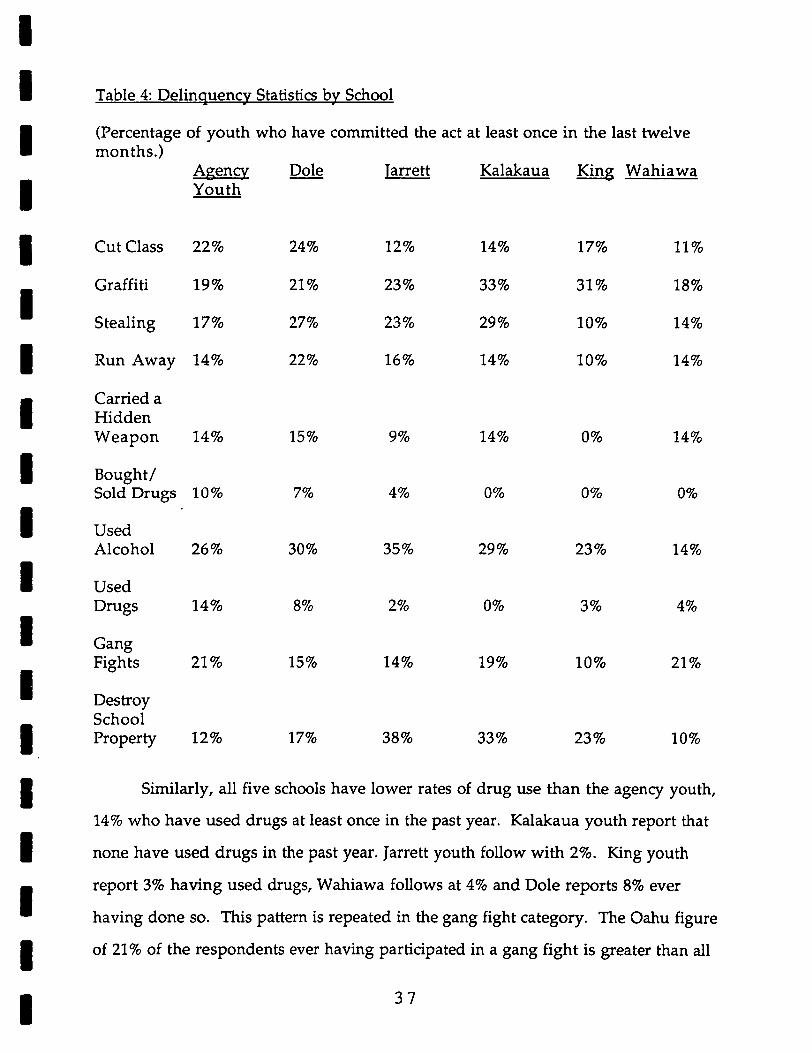
Table 4: Delinquency Statistics by School
(Percentage of youth who have committed the act at least once in the last twelve months.)
Agency Dole Jarrett Kalakaua King Wahiawa Youth
Cut Class 22% 24% 12% 14% 17% 11%
Graffiti 19% 21% 23% 33% 31% 18%
Stealing 17% 27% 23% 29% 10% 14%
Run Away 14% 22% 16% 14% 10% 14%
Carried a Hidden Weapon 14% 15% 9% 14% 0% 14%
Bought/ Sold Drugs 10% 7% 4% 0% 0% 0%
Used Alcohol 26% 30% 35% 29% 23% 14%
Used Drugs 14% 8% 2% 0% 3% 4%
Gang Fights 21% 15% 14% 19% 10% 21%
Destroy School Property 12% 17% 38% 33% 23% 10%
Similarly, all five schools have lower rates of drug use than the agency youth,
14% who have used drugs at least once in the past year. Kalakaua youth report that
none have used drugs in the past year. Jarrett youth follow with 2%. King youth
report 3% having used drugs, Wahiawa follows at 4% and Dole reports 8% ever
having done so. This pattern is repeated in the gang fight category. The Oahu figure
of 21% of the respondents ever having participated in a gang fight is greater than all
37
five PAGE schools. King reported 10% of youth ever having done so followed by
Jarrett at 14%, Dole at 15%, Kalakaua at 19% and Wahiawa at 20%.
Not all delinquency statistics are consistent with this trend, however. The
vandalism category shows four of the five schools with higher delinquency rates
than the agency sample. Twelve percent of these youth have intentionally
damaged school property. Wahiawa is the one school that has a lower rate with 10%
of its youth ever having intentionally damaged school property. In contrast, Dole
youth reported a partidpation rate of 17%, King reported 23%, Kalakaua follows
with 33% and Jarrett with 38%.
Our research suggests that agendes funded by the Youth Gang Response
System are, in fact, targeting youth residing in troubled areas. These youth are more
heavily impacted by gang activity, as evidenced by our data assessing contact with
gang members, and they appear tO be engaging more frequently in anti-social
activity. It is also useful to compare the five PAGE schools with each other. Three
of the schools draw from neighborhoods previous research has indicated are
troubled. King and Wahiawa are located in areas less heavily beset by socio-
economic disadvantage and youth from these neighborhoods report lower levels of
delinquency. Our research suggests a relationship between socio-economic factors
such as unemployment and household composition, the level of gang activity and
related delinquency within a community, and youth involvement in anti-social
activities.
For example, we examined the statistics concerning whether youth know
gang members in their neighborhoods. Two thirds of Kalakaua and Dole youth and
over fifty percent of the youth from Jarrett reported that they know gang members.
However, the Wahiawa and King figures are significantly lower at 39% and 27%
respectively. When we look at who has friends in gangs, Wahiawa and King youth
report lower figures than the 51% of agency youth with 50% and 44% respectively.
38
I I I I I I I I i i I I I I I I I i I
I I I I I I I I I I I I I I I I I I I
In contrast, respondents from Kalakaua Intermediate report that 71% have friends
in gangs, followed by Dole at 59% and Jarrett at 58%.
The agency sample's figure of 27% of the youth reporting that they have
family members in gangs is met or surpassed by four of the five PAGE schools. Dole
at 45% and Kalakaua at 40% are significantly higher than the Oahu figure, with
Wahiawa following at 29% and Jarrett even at 27%. Only King Intermediate shows
a significantly lower figure, with their youth reporting that only 10% have family
members in gangs.
Delinquency statistics correspond to a similar pattern. When we compare the
two samples' figures for delinquent activities, we find that Wahiawa youth report
lower rates of delinquency in all ten categories, and King youth report lower rates in
eight of the ten categories. Kalakaua and Jarrett youth are equal or higher in five of
the ten categories and Dole Intermediate is higher in seven of the ten categories.
For example, youth from King and Wahiawa are significantly less likely to
have stolen items worth between $5 and $50 than Jarrett, Dole and Kalakaua youth.
In fact, youth at the last three schools are more than twice as likely to have done so
in the past twelve months. Wahiawa youth report that 14% have used alcohol in
the past year, with King youth reporting 23% also having used alcohol. In contrast
Kalakaua, Dole and Jarrett youth report 29%, 30% and 35% respectively having used
alcohol in the past twelve months.
39
CONCLUSION
While much of this report focuses on the problems of gangs and delinquency,
there is a brighter side. The bulk of this paper reports on the activities of the youth
who are involved in a variety of anti-social behaviors. However, a substantial
majority of youth living in the most "at-risk" neighborhoods are not gang members
and are not committing serious delinquent acts. In eight of our ten delinquency
categories, over eighty percent of the youth answered none or zero when asked the
number of times they had committed the various acts in the past twelve months.
As part of our conclusion, we want to make a point about the use of official
statistics on gang membership. We found significant ethnic variation in terms of
gang membership. However, our findings differ from the statistics compiled by the
Honolulu Police Department. Filipinos accounted for a smaller share of our gang
population than that identified by HPD and Hawaiian/Part Hawaiians are a larger
proportion of the youth who identified themselves as gang members. There are no
doubt a variety of reasons for this disparity such as the context in which HPD
compiles its information and the methodology employed. What this finding
highlights for use is the importance of being cautious in the use of official statistics,
particularly given the influence of such statistics in decisions regarding the
allocation of social service or prevention funds.
While our research indicates gender differences in delinquency and gang
membership, consistent with much of conventional wisdom, a number of findings
are particularly relevant to the design of prevention programming and should
inform future policy decisions. Boys are delinquent more frequently than girls and
tend to engage in a wider variety of delinquent acts. The biggest discrepancies
involve the more serious or violent activities. For example, boys were twice as
likely to be involved in drug dealing or carry a weapon than girls. The figures for
40
I I I I I I I I I I I I I I I I I I I
I I I I I I I I I I I I I I I I I I I
using alcohol are more similar, however. In addition, boys are more likely to be
gang members. Eighteen percent reported currently belonging to a gang versus 7%
of the girls. One of our more interesting findings is that 17% of current gang
members do not want to be in a gang. However, more boys want out than in, and
more girls want in than out, although the overall number of female gang members
was quite small.
As we mentioned earlier, we are particularly interested in the role played by
social context in the dynamics of gang formation, and in this study that meant
neighborhood, peer group and family. We looked specifically at the presence of
gangs, socio-economic conditions and delinquent activity. With that in mind, a
striking finding is the extent of regular contact that youth have with gang members.
Over fifty percent said they knew gang members in their neighborhood and a
majority had friends in gangs. Over a quarter of the youth said that at least one
member of their family is in a gang. These were typically uncles, brothers and
cousins, though there were a few sisters, aunties and mothers. Not surprisingly, it
is also the case that the youth reported rates of delinquency that are well above
official statistics.
We also looked at the variation of a variety of statistics by neighborhood. We
sorted the data by zip code and found significant differences between neighborhoods
in terms of their socio-economic status, potential for contact with gang members,
and delinquency statistics, particularly those regarding drug and alcohol use,
weapons, gang fights and gang membership.
For example, youth living in poorer neighborhoods were more likely to have
regular contact with gang members. These youth were also more delinquent than
their peers in less troubled neighborhoods. A disproportionate number of gang
members in our sample came from these neighborhoods. It is also the case that
youth gang members commit delinquent acts more frequently, particularly more
41
serious offenses such as stealing, vandalism, carrying weapons and, not surprisingly,
gang fights than their peers who are not in gangs. These findings suggest a
relationship between the socio-economic status of a neighborhood, the level of gang
activity and youth involvement in a variety of anti-social behaviors including
belonging to a gang.
As mentioned above, data collected from participants in a gang education
program at five Oahu intermediate schools corroborate these findings. The schools
located in areas less heavily beset by socio-economic disadvantage report that their
youth have lower levels of contact with gang members, of serious delinquency, and
involvement in gang activity. These youth are not significantly less delinquent that
their more "at-risk" peers across all categories of delinquent activities, however. For
example, alcohol use is in fact more common at a couple of the higher income
neighborhoods.
We believe this research supports the idea that gang and delinquency
problems are in large part neighborhood based. This idea has a number of
important policy implications. Youth gang and delinquency problems are largely
neighborhood based but are not evenly distributed throughout the Islands. Effective
prevention efforts require that funding for social services not be considered political
"pork" and instead be targeted to those areas most "at-risk" for these kinds of
problems. Our research also implies that the ability of the criminal justice system to
address these issues by itself is limited. The conditions within the community and
neighborhood most closely linked to problems of delinquent youth are largely
outside the functions of the police. Prevention must be driven by an understanding
of the characteristics of and processes at work within the different community
contexts.
These data highlight the relevance of interaction between youth and their
environment including the family, peer group, social service agencies and the
42
I I I I I I I I I I I I I I I I I I I
I I I I I I I I I I I I I I I I I I I
broader neighborhood context. There are no doubt a variety of important variables
this project says less about such as the role played by schools and the police and
immigration, something we are currently particularly interested in, which also
merit investigation. Clearly much work remains to be done to understand more
fully the dynamics of gang formation, the relationship between gangs and
delinquency and the role that gangs play in the lives of youth.
43
REFERENCES
Chesney-Lind, Meda., Marker, N., Rodriguez Stern, I., Yap, A., Song, V., Reyes, H., Reyes, Y., Stern, J., and Taira, J. Gangs and Delinquency in Hawaii. Center for Youth Research, University of Hawaii: Manoa, 1992.
Elliot, Delbert S., and Ageton, Suzanne S., Reconciling Race and Class Differences in Self-Reported and Official Estimates of Delinquency. American Sociological Review 1980, Vol. 45 (February):95-110
Glauberman, S. (1992, April 29). Islanders earn more but housing gobbling it up. The Honolulu Advertiser, sec. A, p. 1.
Hawaii, Department of Education, Hawaii Youth Risk Behavior Survey Report Honolulu: Hawaii Department of Education, 1991, p. 45.
Okamura, Johnathan. Ethnicity and Stratification in Hawaii. Operation Manong Resource Papers, No. 1. Honolulu: Office of Student Affairs, University of Hawaii at Manoa.
4-4
I I I I I I I I I I I I II I I I I I I
I I I I I I I I i I I I I I I I I I I
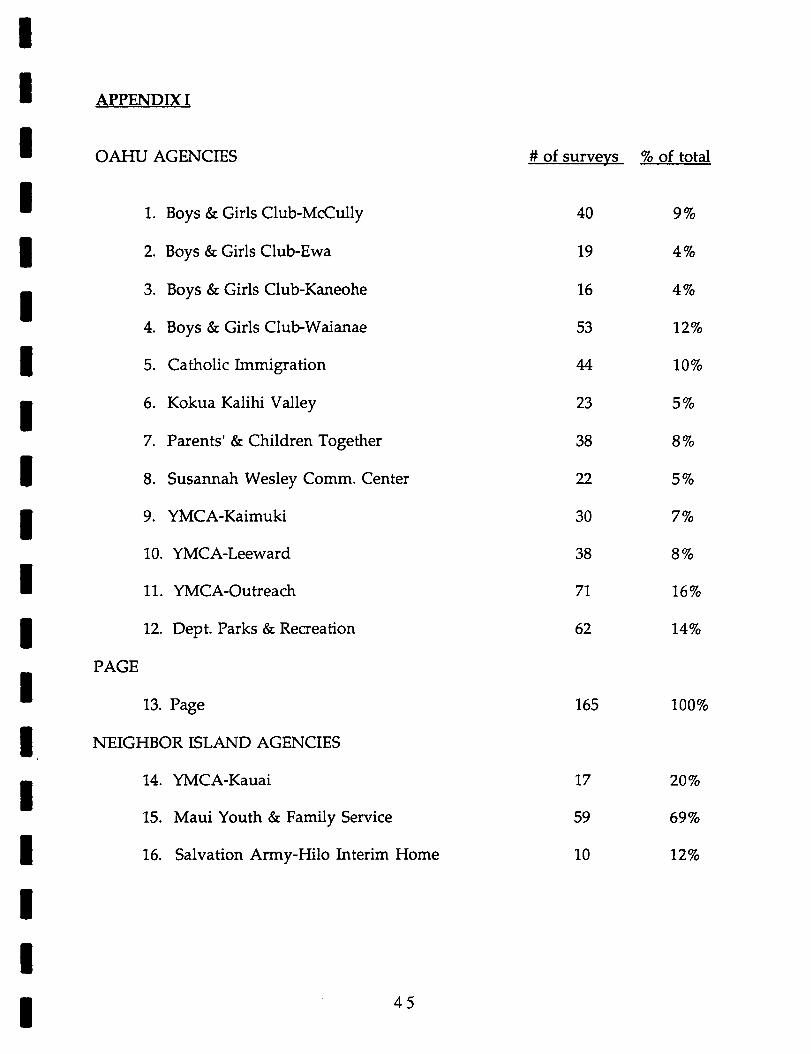
APPENDIX I
OAHU AGENCIES
PAGE
1. Boys & Girls Club-McCully
2. Boys & Girls Club-Ewa
3. Boys & Girls Club-Kaneohe
4. Boys & Girls Club-Waianae
5. Catholic Immigration
6. Kokua Kalihi Valley
7. Parents' & Children Together
8. Susannah Wesley Comm. Center
9. YMCA-Kaimuki
10. YMCA-Leeward
11. YMCA-Outreach
12. Dept. Parks & Recreation
13. Page
NEIGHBOR ISLAND AGENCIES
14. YMCA-Kauai
15. Maui Youth & Family Service
16. Salvation Army-Hilo Interim Home
45
# of surveys
40
19
16
53
44
23
38
22
30
38
71
62
165
17
59
10
% of total
9%
4%
4%
12%
10%
5%
8%
5%
7%
8%
16%
14%
100%
20%
69%
12%
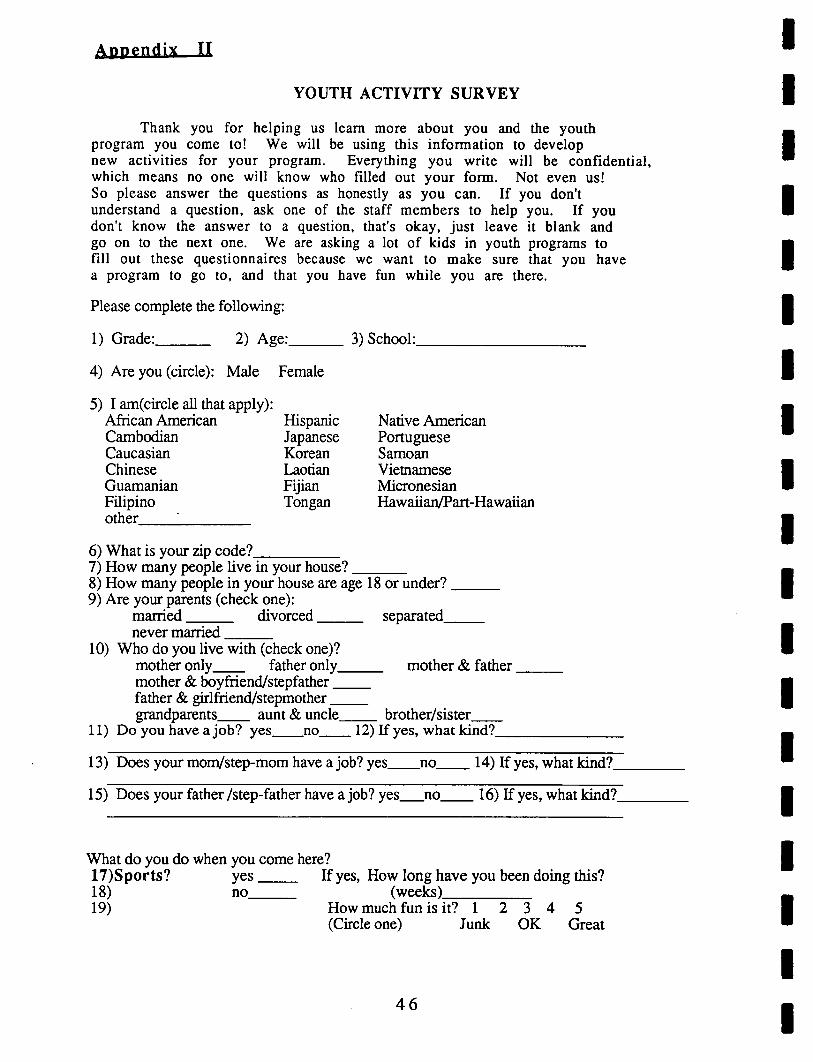
~ppendix II
YOUTH ACTIVITY SURVEY
Thank you for helping us learn more about you and the youth program you come to! We will be using this information to develop new activities for your program. Everything you write will be confidential, which means no one will know who filled out your form. Not even us! So please answer the questions as honestly as you can. If you don't understand a question, ask one of the staff members to help you. If you don't know the answer to a question, that's okay, just leave it blank and go on to the next one. We are asking a lot of kids in youth programs to fill out these questionnaires because we want to make sure that you have a program to go to, and that you have fun while you are there.
Please complete the following:
1) Grade: 2) Age: 3) School:
4) Are you (circle): Male Female
5) I am(circle all that apply): African American Hispanic Cambodian Japanese Caucasian Korean Chinese Laotian Guamanian Fijian Filipino Tongan other
Native American Portuguese Samoan Vietnamese Micronesian Hawaiian/Part-Hawaiian
6) What is your zip code? 7) How many people live in your house? 8) How many people in your house are age 18 or under? 9) Are your parents (check one):
married d i v o r c e d _ _ separated never married
10) Who do you live with (check one)? mother o n l y . _ _ father o n l y . _ _ mother & boyfriend/stepfather _ _ father & girlfriend/stepmother _ _ g r a n d p a r e n t s aunt & uncle
11) Do you have a job? yes no
mother & father
_ _ brother/sister 12) ff yes, what kind?
13) Does your mom/step-mom have a job? yes no 14) If yes, what kind?
15) Does your father/step-father have a job? yes no 16) If yes, what kind?
What do you do when you come here? 17)Sports? yes _ _ If yes, How long have you been doing this? 18) no (weeks) 19) How much fun is it? 1 2 3 4 5
(Circle one) Junk OK Great
46
I I I I I I i I i I I I I I I i I I I
I I I I I I I I I I I I I I I I I I I
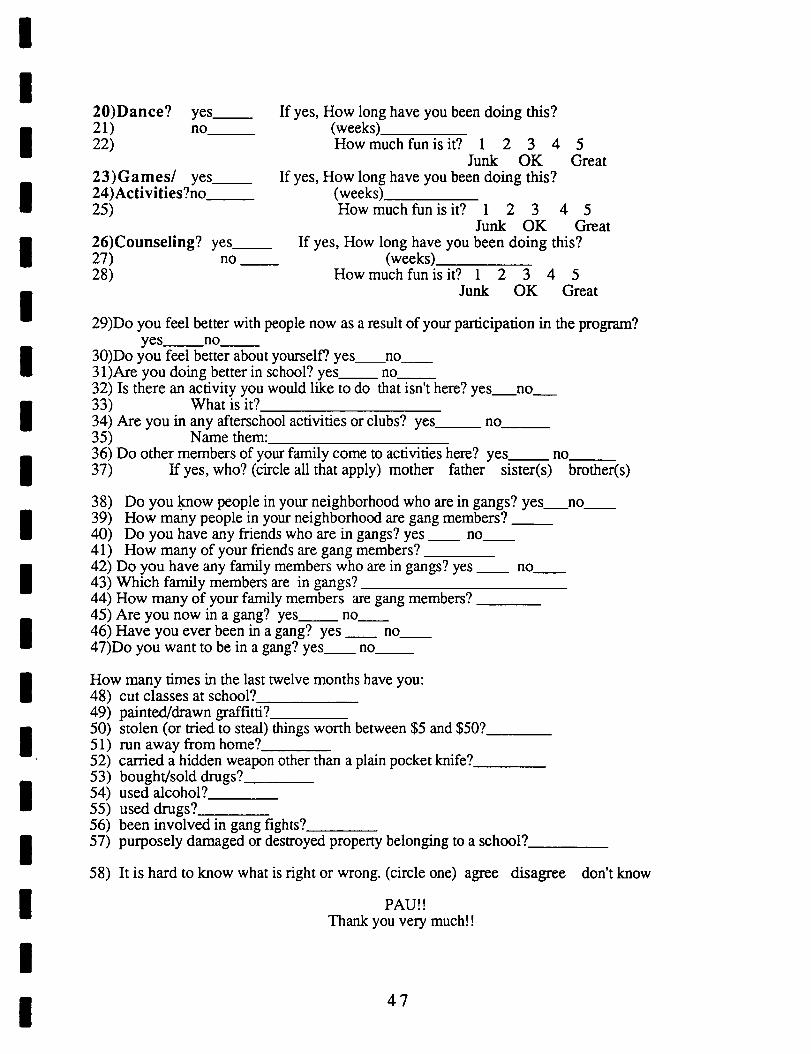
20)Dance? yes 21) no 22)
2 3 ) G a m e s / y e s 24)Activities?no 25)
26)Counseling? y e s 27) no _ _ 28)
If yes, How long have you been doing this? (weeks) How much fun is it? 1 2 3 4 5
Junk OK Great If yes, How long have you been doing this?
(weeks) How much fun is it? 1 2 3 4 5
Junk OK Great If yes, How long have you been doing this?
(weeks). How much fun is it? 1 2 3 4 5
Junk OK Great
29)Do you feel better with people now as a result of your participation in the program? yes no
30)Do you feel better about yourself?, yes no 31)Are you doing better in school? yes no 32) Is there an activity you would like to do that isn't-here? yes no 33) What is it? 34) Are you in any afterschool activities or clubs? yes no 35) Name them: 36) Do other members of your family come to activities here? yes no 37) If yes, who? (circle all that apply) mother father sister(s) brother(s)
38) 39) 4O) 41) 42) 43) 44) 45) 46) Have you ever been in a gang? yes 47)Do you want to be in a gang? yes
Do you .know people in your neighborhood who are in gangs? yes How many people in your neighborhood are gang members? Do you have any friends who are in gangs? yes _ _ n o How many of your friends are gang members?
Do you have any family members who are in gangs? yes _ _ no Which family members are in gangs? How many of your family members are gang members? Are you now in a gang? yes no
n o
n o
n o
How many times in the last twelve months have you: 48) cut classes at school? 49) painted/drawn graffitti? 50) stolen (or tried to steal) things worth between $5 and $50? 51) run away from home? 52) carried a hidden weapon other than a plain pocket knife? 53) bought/sold drugs? 54) used alcohol? 55) used drugs? 56) been involved in gang fights? 57) purposely damaged or destroyed property belonging to a school?
58) It is hard to know what is right or wrong. (circle one) agree disagree don't know
PAU ! ! Thank you very much!!
4 7
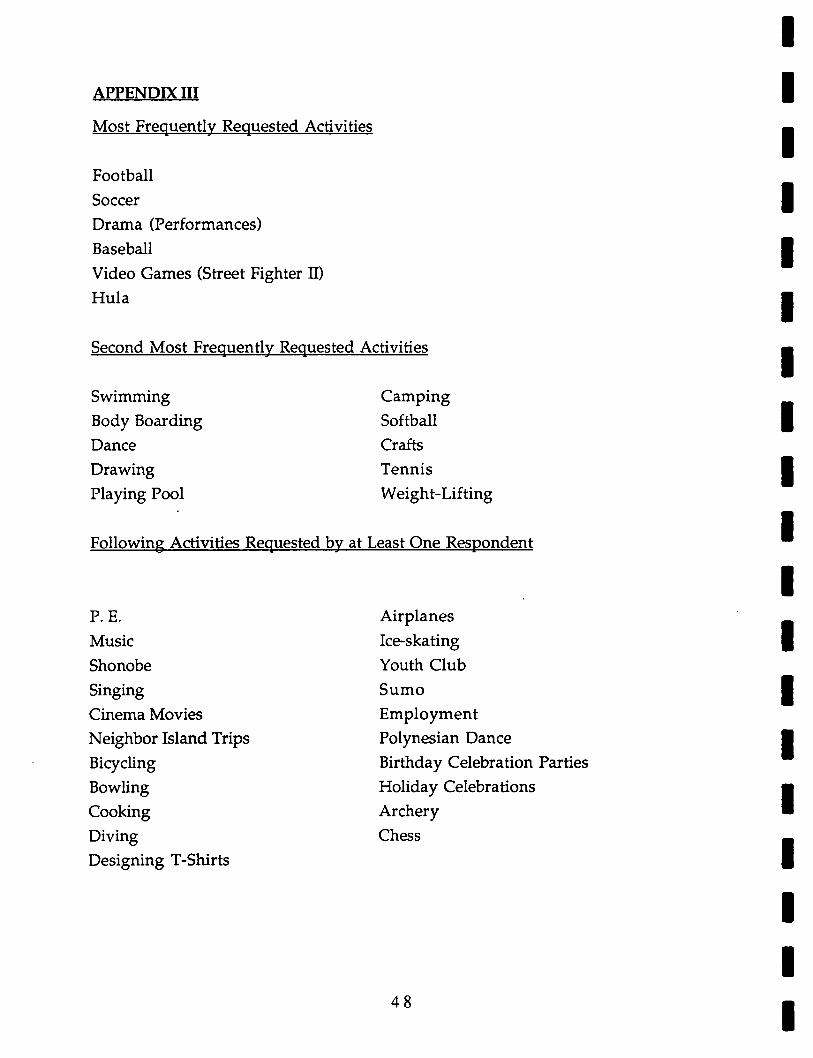
APPENDIX III
Most Frequently Requested Activities
Football Soccer Drama (Performances) Baseball Video Games (Street Fighter II) Hula
Second Most Frequently Requested Activities
Swimming Camping Body Boarding Softball Dance Crafts Drawing Tennis Playing Pool Weight-Lifting
Following Activities Requested by at Least One Respondent
P°Eo
Music Shonobe Singing Cinema Movies Neighbor Island Trips Bicycling Bowling Cooking Diving Designing T-Shirts
Airplanes Ice-skating Youth Club Sumo Employment Polynesian Dance Birthday Celebration Parties Holiday Celebrations Archery Chess
48
I I I I I I I I I I I I I I I I I I I
I I I I I I I I I I I I I I I I I I I
APPENDIX IV
Below is a list of the corresponding zip codes and their neighborhood equivalents:
96701- Aiea
96707- Ewa Beach
96744- Kaneohe
96786- Wahiawa/Mililani
96791- Waialua
96795- Kailua/Waimanalo
96810- Waikiki
96815- Waikiki
96817- Kapalama
96819- Kalihi
96826- McCully/Moiliili
96706- Ewa Beach
96734- Kailua/Waimanalo
96782- Pearl City
96789- Wahiawa/Mili lani
96792- Waianae
96797- Waipahu
96813- Downtown
96816- Palolo/Waialae
96818- Hickam
96822- Makiki/Manoa
49
m
i I I I I I I I I I I I I I I I I I