Embed Size (px)
Citation preview
5 Childhood cancer
Studies of the incidence of cancer in childhood in Africa are even more difficult than those of adults. Because of the relative rarity of cancer in this age group, population-based studies must involve rather large populations (or long time periods) in order that sufficient cases be assembled to permit calculation of valid rates. For this reason, most African studies have been of case series, with inevitable difficulties in interpretation.
The rather special nature of the tumours affecting children requires the use of a classification system other than the familiar ICD, which is based upon cancer site (and designed primarily for the study of epithelial neoplasms, which comprise only a small proportion of childhood cancers). Childhood cancers, in contrast, are histologically very diverse and some types can occur in many different sites. A classification based principally on histological type is therefore more appropriate. The current standard is the lnternational Classification of Childhood Cancer (ICCC: Kramarova et al., 1996) that was used for the IARC monograph International Incidence of Childhood Cancer, Volume II (IlCC-2: Parkin et a/., 1998). An earlier version (Birch & Marsden, 1987) was used for the first volume of lnternational Incidence of Childhood Cancer (IlCC-1: Parkin et a/., 1988). There are 12 main diagnostic groups, as follows: leukaemia; lymphomas and reticuloendothelial neoplasms; central nervous system (CNS) and miscellaneous intracranial and intraspinal neoplasms; sympathetic nervous system tumours; retinoblastoma; renal tumours; hepatic tumours; malignant bone tumours; soft-tissue sarcomas; germ-cell, trophoblastic and other gonadal neoplasms; carcinomas and other malignant epithelial neoplasms; other and unspecified malignant neoplasms. All except retinoblastoma are divided into a number of subgroups. In this chapter, geographical and ethnic patterns of incidence will be considered for each major diagnostic group in turn. A series of tables summarizes the data on childhood cancers from the cancer registries contributing to this volume.
Leukaemia In white populations of Europe, the Americas and Oceania, and also in much of eastern Asia, around a third of all childhood cancers are leukaemias, with age-standardized incidence rates (ASR) of 35-50 per million. Acute lymphoblastic leukaemia (ALL) comprises 75-80% of the total in these populations, with ASRs generally in the range 25-40 per million, and a marked peak in incidence at age 2-3 years. In black children in the United States, leukaemia accounts for about a quarter of all childhood cancer; the incidence of ALL is only half that among whites, largely because of a much reduced early childhood peak. In the United Kingdom, however, the incidence among children of West Indian origin is only slightly less than that among whites (Stiller etal., 1991).
In North Africa, although data are relatively sparse, it appears that the incidence of leukaemia is not far below that in Europe, with a similar distribution by subtype, and a peak in incidence of ALL in young children. In a case series from the National Cancer Institute, Cairo, (El Bolkainy etal., 1984), 87% of 123 childhood leukaemias were ALL, with a modest peak in frequency at ages 3-6 years.
- - - - - - - - - - - - - - - - - -
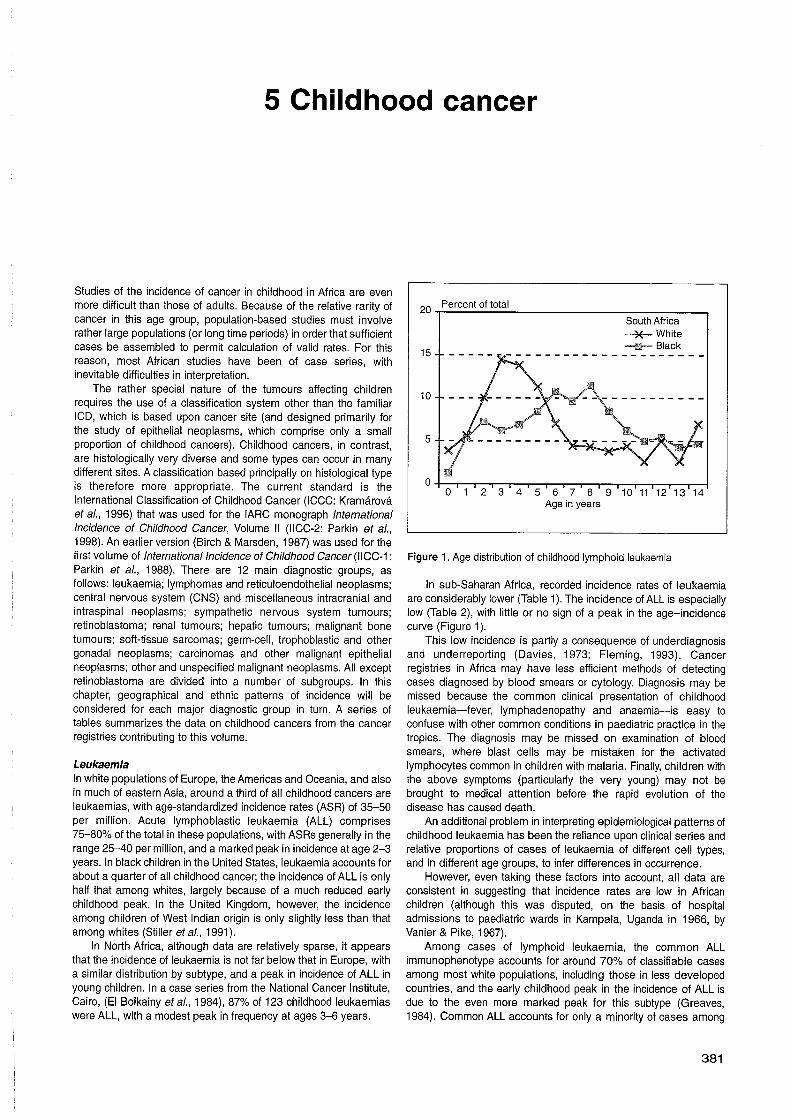
Age in years
Figure 1. Age distribution of childhood lymphoid leukaemia
In sub-Saharan Africa, recorded incidence rates of leukaemia are considerably lower (Table 1). The incidence of ALL is especially low (Table 2), with little or no sign of a peak in the age-incidence curve (Figure 1).
This low incidence is partly a consequence of underdiagnosis and underreporting (Davies, 1973; Fleming, 1993). Cancer registries in Africa may have less efficient methods of detecting cases diagnosed by blood smears or cytology. Diagnosis may be missed because the common clinical presentation of childhood leukaemia-fever, lymphadenopathy and anaemia-is easy to confuse with other common conditions in paediatric practice in the tropics. The diagnosis may be missed on examination of blood smears, where blast cells may be mistaken for the activated lymphocytes common in children with malaria. Finally, children with the above symptoms (particularly the very young) may not be brought to medical attention before the rapid evolution of the disease has caused death.
An additional problem in interpreting epidemiological patterns of childhood leukaemia has been the reliance upon clinical series and relative proportions of cases of leukaemia of different cell types, and in different age groups, to infer differences in occurrence.
However, even taking these factors into account, all data are consistent in suggesting that incidence rates are low in African children (although this was disputed, on the basis of hospital admissions to paediatric wards in Kampala, Uganda in 1966, by Vanier & Pike, 1967).
Among cases of lymphoid leukaemia, the common ALL immunophenotype accounts for around 70% of classifiable cases among most white populations, including those in less developed countries, and the early childhood peak in the incidence of ALL is due to the even more marked peak for this subtype (Greaves, 1984). Common ALL accounts for only a minority of cases among
Cancer in Africa
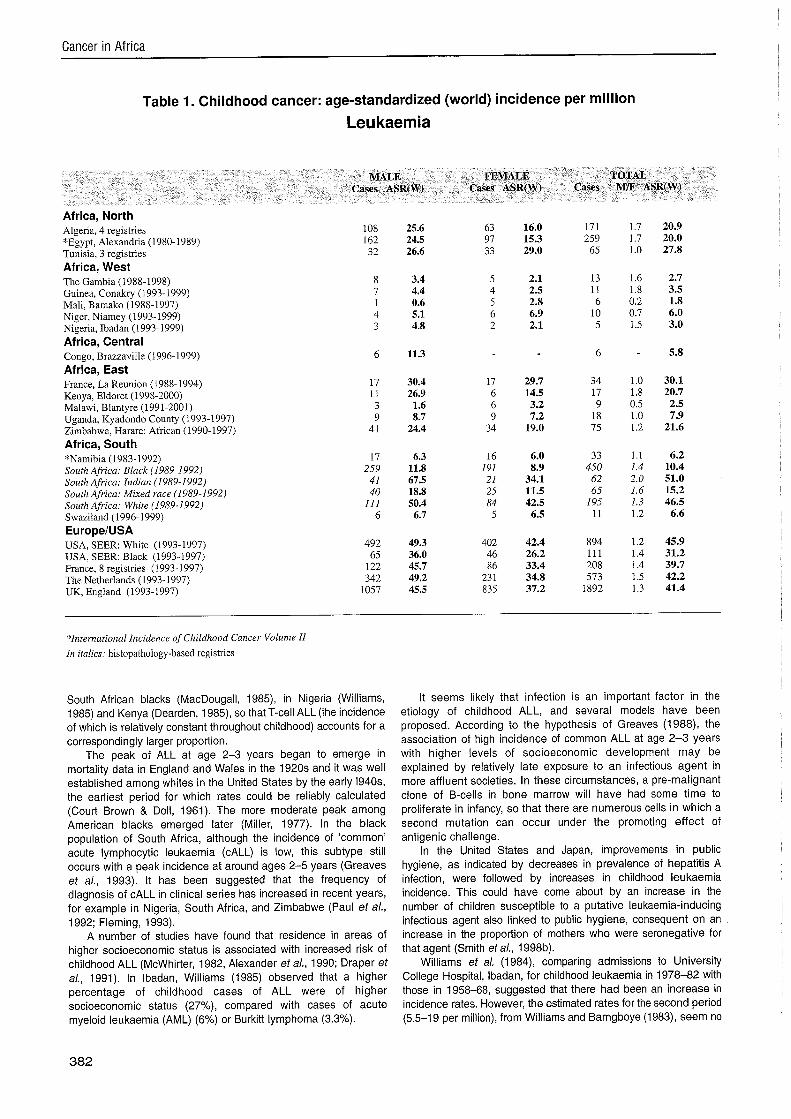
Table 1. Childhood cancer: age-standardized (world) incidence per million
Leu kaemia
MALE FEMALE TOTAL Cases ASR(W) Cases ASR(W) Cases MIF ASR(W)
Africa, North Algeria, 4 registries "Egypt, Alexandria (1 980-1989) Tunisia, 3 registries Africa, West The Gambia (1988-1998) Guinea, Conakry (1993-1999) Mali, Bamako (1988-1997) Niger, Niamey (1993-1999) Nigeria, Ibadan (1993.1999) Africa, Central Congo, Brazzaville (1996-1999) Africa, East France, La Reunion (1988-1994) Kenya, Eldoret (1998-2000) Malawi, Blantyre (1991-2001) Uganda, Kyadondo County (1993-1997) Zimbabwe, Harare: African (1990-1997) Africa, South "Namibia (1983- 1992) South Africa: Black (1989-1 992) South Africa: Indian (1989-1992) South Africa: Mixed race (1989-1992) South Afrca: White (1989-1992) Swaziland (1996-1999) EuropeIUSA USA, SEER: White (1993-1997) USA, SEER: Black (1993-1997) France, 8 registries (1993-1997) The Netherlands (1993-1997) UK, England (1993-1997)
*International Incidence of Childhood Cancer Volume 11 In italics: histopathology-based registries
South African blacks (MacDougall, 1985), in Nigeria (Williams, 1985) and Kenya (Dearden, 1985), so that T-cell ALL (the incidence of which is relatively constant throughout childhood) accounts for a correspondingly larger proportion.
The peak of ALL at age 2-3 years began to emerge in mortality data in England and Wales in the 1920s and it was well established among whites in the United States by the early 1940s, the earliest period for which rates could be reliably calculated (Court Brown & Doll, 1961). The more moderate peak among American blacks emerged later (Miller, 1977). In the black population of South Africa, although the incidence of 'common' acute lymphocytic leukaemia (CALL) is low, this subtype still occurs with a peak incidence at around ages 2-5 years (Greaves et a/., 1993). It has been suggested that the frequency of diagnosis of CALL in clinical series has increased in recent years, for example in Nigeria, South Africa, and Zimbabwe (Paul et a/., 1992; Fleming, 1993).
A number of studies have found that residence in areas of higher socioeconomic status is associated with increased risk of childhood ALL (McWhirter, 1982, Alexander eta/., 1990; Draper et a/., 1991). In Ibadan, Williams (1985) observed that a higher percentage of childhood cases of ALL were of higher socioeconomic status (27%), compared with cases of acute myeloid leukaemia (AML) (6%) or Burkitt lymphoma (3.3%).
It seems likely that infection is an important factor in the etiology of childhood ALL, and several models have been proposed. According to the hypothesis of Greaves (1988), the association of high incidence of common ALL at age 2-3 years with higher levels of socioeconomic development may be explained by relatively late exposure to an infectious agent in more affluent societies. In these circumstances, a pre-malignant clone of B-cells in bone marrow will have had some time to proliferate in infancy, so that there are numerous cells in which a second mutation can occur under the promoting effect of antigenic challenge.
In the United States and Japan, improvements in public hygiene, as indicated by decreases in prevalence of hepatitis A infection, were followed by increases in childhood leukaemia incidence. This could have come about by an increase in the number of children susceptible to a putative leukaemia-inducing infectious agent also linked to public hygiene, consequent on an increase in the proportion of mothers who were seronegative for that agent (Smith et a/., 1998b).
Williams et a/. (1984), comparing admissions to University College Hospital, Ibadan, for childhood leukaemia in 1978-82 with those in 1958-68, suggested that there had been an increase in incidence rates. However, the estimated rates for the second period (5.5-19 per million), from Williams and Bamgboye (1983), seem no
Childhood cancer
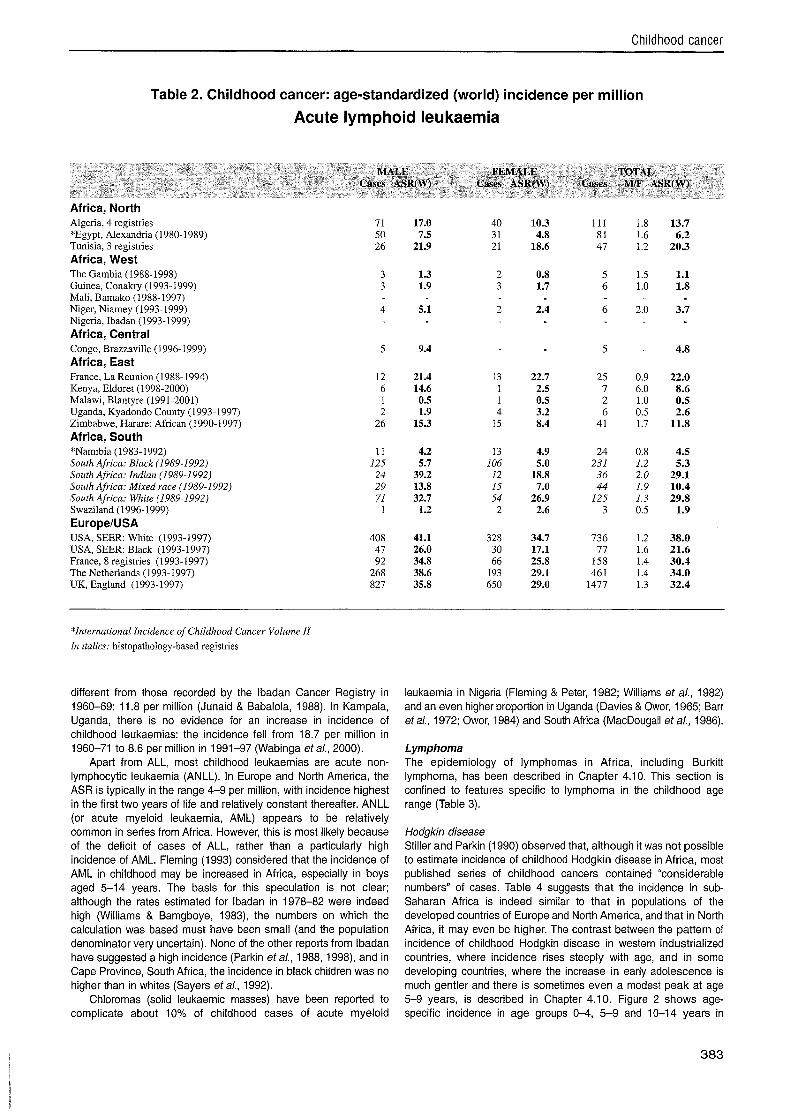
Table 2. Childhood cancer: age-standardized (world) incidence per million
Acute lymphoid leukaemia
MALE FEMALE TOTAL Cases ASR(W) Cases ASR(W) Cases M/F ASR(W)
Africa, North Algeria, 4 registries "Egypt, Alexandria (1980-1989) Tunisia, 3 registries Africa, West The Gambia (1988-1998) Guinea, Conakry (1993-1999) Mali, Bamako (1988-1997) Niger, Niamey (1993-1999) Nigeria, Ibadan (1993-1999) Africa, Central Congo, Brazzaville (1996-1999) Africa, East France, La Reunion (1988-1994) Kenya, Eldoret (1998-2000) Malawi, Blantyre (1991-2001) Uganda, Kyadondo County (1993-1997) Zimbabwe, Harare: African (1990-1997) Africa, South *Namibia (1983-1992) South Africa: Black (I989-1992) South Africa: Indian (1989-1992) South Africa: Mixed race (1989-1992) South Africa: White (1989-1992) Swaziland (1996-1999) EuropeIUSA USA, SEER: White (1993-1997) USA, SEER: Black (1993-1997) France, 8 registries (1993-1997) The Netherlands (1993-1997) UK, England (1993-1997)
*International Incidence of Childhood Cancer Volume II In italics: histopathology-based registries
different from those recorded by the lbadan Cancer Registry in 1960-69: 11.8 per million (Junaid & Babalola, 1988). In Kampala, Uganda, there is no evidence for an increase in incidence of childhood leukaemias: the incidence fell from 18.7 per million in 1960-71 to 8.6 per million in 1991-97 (Wabinga etal., 2000).
Apart from ALL, most childhood leukaemias are acute non- lymphocytic leukaemia (ANLL). In Europe and North America, the ASR is typically in the range 4-9 per million, with incidence highest in the first two years of life and relatively constant thereafter. ANLL (or acute myeloid leukaemia, AML) appears to be relatively common in series from Africa. However, this is most likely because of the deficit of cases of ALL, rather than a particularly high incidence of AML. Fleming (1 993) considered that the incidence of AML in childhood may be increased in Africa, especially in boys aged 5-14 years. The basis for this speculation is not clear; although the rates estimated for lbadan in 1978-82 were indeed high (Williams & Bamgboye, 1983), the numbers on which the calculation was based must have been small (and the population denominator very uncertain). None of the other reports from lbadan have suggested a high incidence (Parkin etal., 1988, 1998), and in Cape Province, South Africa, the incidence in black children was no higher than in whites (Sayers et a/., 1992).
Chloromas (solid leukaemic masses) have been reported to complicate about 10% of childhood cases of acute myeloid
leukaemia in Nigeria (Fleming & Peter, 1982; Williams et a/., 1982) and an even higher proportion in Uganda (Davies & Owor, 1965; Barr etal., 1972; Owor, 1984) and South Africa (MacDougall etal., 1986).
Lymphoma The epidemiology of lymphomas in Africa, including Burkitt lymphoma, has been described in Chapter 4.10. This section is confined to features specific to lymphoma in the childhood age range (Table 3).
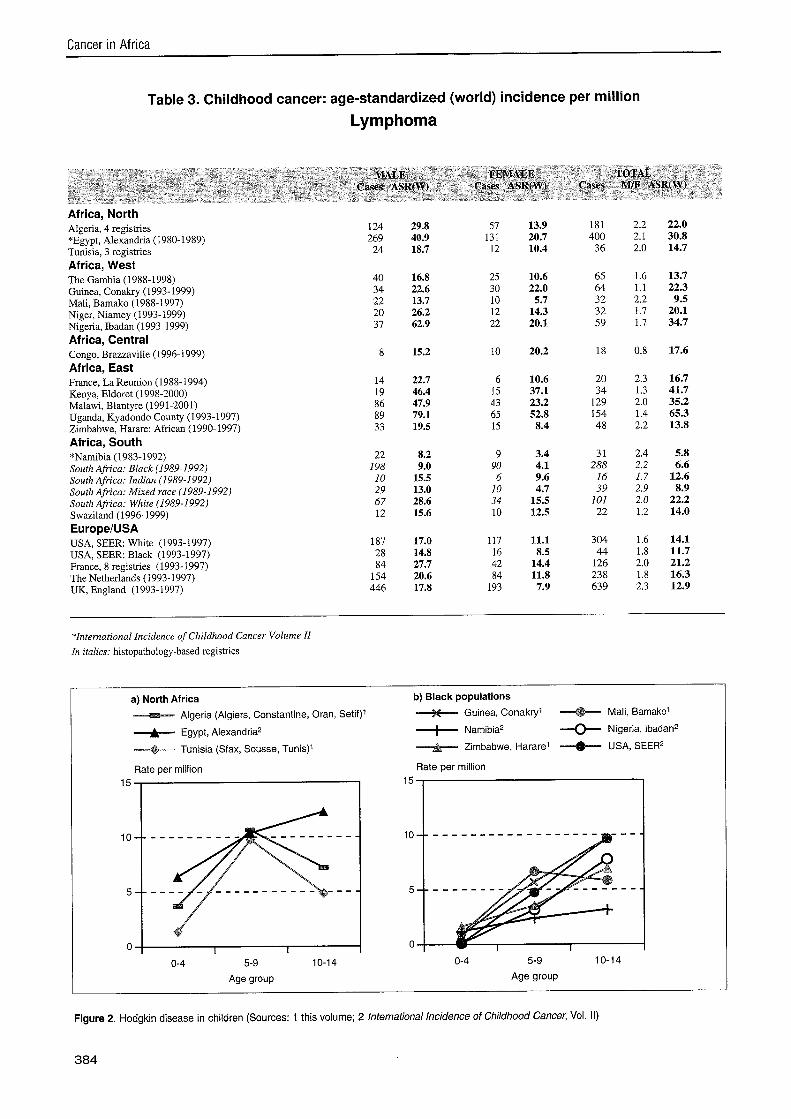
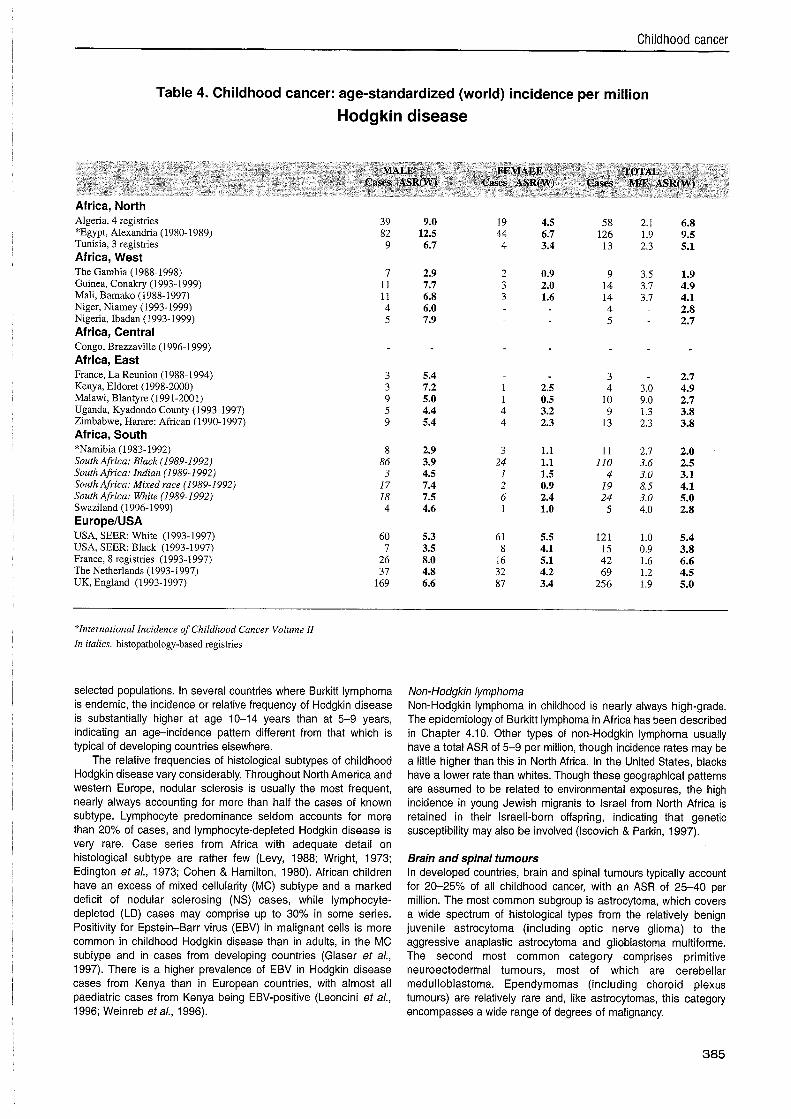
Hodgkin disease Stiller and Parkin (1990) observed that, although it was not possible to estimate incidence of childhood Hodgkin disease in Africa, most published series of childhood cancers contained "considerable numbers" of cases. Table 4 suggests that the incidence in sub- Saharan Africa is indeed similar to that in populations of the developed countries of Europe and North America, and that in North Africa, it may even be higher. The contrast between the pattern of incidence of childhood Hodgkin disease in western industrialized countries, where incidence rises steeply with age, and in some developing countries, where the increase in early adolescence is much gentler and there is sometimes even a modest peak at age 5-9 years, is described in Chapter 4.10. Figure 2 shows age- specific incidence in age groups 0-4, 5-9 and 10-14 years in
Cancer in Africa
Table 3. Childhood cancer: age-standardized (world) incidence per million
Lymphoma
MALE FEMALE TOTAL Cases ASR(W) Cases ASR(W) Cases MIF ASR(W)
Africa, North Algeria, 4 registries *Egypt, Alexandria (1980-1989) Tunisia, 3 registries Africa, West The Gambia (1988-1998) Guinea, Conakry (1993-1999) Mali, Bamako (1988-1997) Niger, Niamey (1993-1999) Nigeria, Ibadan (1993-1999) Africa, Central Congo, Brazzaville (1996-1999) Africa, East France, La Reunion (1988-1994) Kenya, Eldoret (1998-2000) Malawi, Blantyre (1991-2001) Uganda, Kyadondo County (1993-1997) Zimbabwe, Harare: African (1990-1997) Africa, South *Namibia (1983-1992) South Africa: Black (1989-1992) South Afn'ca: Indian (1989-1992) South Africa: Mixed race (1989-1992) South Africa: White (1989-1992) Swaziland (1996-1999) EuropelUSA USA, SEER: White (1993-1997) USA, SEER: Black (1993-1997) France, 8 registries (1993-1997) The Netherlands (1993-1997) UK, England (1993-1997)
*International Incidence of Childhood Cancer Volume I1
In italics: histopathology-based registries
a) North Africa b) Black populations
Algeria (Algiers, Constantine, Oran, Setif)'
Egypt, Alexandria2
Tunisia (Sfax, Sousse, Tunis)' Zimbabwe, Hararei --@--- USA, SEER2
Rate per million
0-4 5-9 10-1 4 0-4 5-9 10-14
Age group Age group
Figure 2. Hodgkin disease in children (Sources: 1 this volume; 2 International Incidence of Childhood Cancer, Vol. II)
384
Childhood cancer
Table 4. Childhood cancer: age-standardized (world) incidence per million
Hodgkin disease
Africa, North Algeria, 4 registries *Egypt, Alexandria (1980-1989) Tunisia, 3 registries Africa, West The Gambia (1988-1998) Guinea, Conakry (1993-1999) Mali, Bamako (1988-1997) Niger, Niamey (1993-1999) Nigeria, Ibadan (1993- 1999) Africa, Central Congo, Brazzaville (1996-1999) Africa, East France, La Reunion (1988-1994) Kenya, Eldoret (1998-2000) Malawi, Blantyre (1991-2001) Uganda, Kyadondo County (1993-1997) Zimbabwe, Harare: African (1990-1997) Africa, South *Namibia (1983-1992) South Africa: Black (1989-1992) South Afn'ca: Indian (1989-1992) South Africa: Mixed race (1 989-1 992) South Africa: White (1989-1992) Swaziland (1996-1999) EuropeIUSA USA, SEER: White (1993-1997) USA, SEER: Black (1993-1997) France, 8 registries (1993-1997) The Netherlands (1993-1997) UK, England (1993-1997)
*International Incidence of Childhood Cancer Volume I1 In italics: histopathology-based registries
selected populations. In several countries where Burkitt lymphoma is endemic, the incidence or relative frequency of Hodgkin disease is substantially higher at age 10-14 years than at 5-9 years, indicating an age-incidence pattern different from that which is typical of developing countries elsewhere.
The relative frequencies of histological subtypes of childhood Hodgkin disease vary considerably. Throughout North America and western Europe, nodular sclerosis is usually the most frequent, nearly always accounting for more than half the cases of known subtype. Lymphocyte predominance seldom accounts for more than 20% of cases, and lymphocyte-depleted Hodgkin disease is very rare. Case series from Africa with adequate detail on histological subtype are rather few (Levy, 1988; Wright, 1973; Edington et a/., 1973; Cohen & Hamilton, 1980). African children have an excess of mixed cellularity (MC) subtype and a marked deficit of nodular sclerosing (NS) cases, while lymphocyte- depleted (LD) cases may comprise up to 30% in some series. Positivity for Epstein-Barr virus (EBV) in malignant cells is more common in childhood Hodgkin disease than in adults, in the MC subtype and in cases from developing countries (Glaser et a/., 1997). There is a higher prevalence of EBV in Hodgkin disease cases from Kenya than in European countries, with almost all paediatric cases from Kenya being EBV-positive (Leoncini et a/., 1996; Weinreb eta/., 1996).
Non-Hodgkin lymphoma Non-Hodgkin lymphoma in childhood is nearly always high-grade. The epidemiology of Burkitt lymphoma in Africa has been described in Chapter 4.10. Other types of non-Hodgkin lymphoma usually have a total ASR of 5-9 per million, though incidence rates may be a little higher than this in North Africa. In the United States, blacks have a lower rate than whites. Though these geographical patterns are assumed to be related to environmental exposures, the high incidence in young Jewish migrants to Israel from North Africa is retained in their Israeli-born offspring, indicating that genetic susceptibility may also be involved (Iscovich & Parkin, 1997).
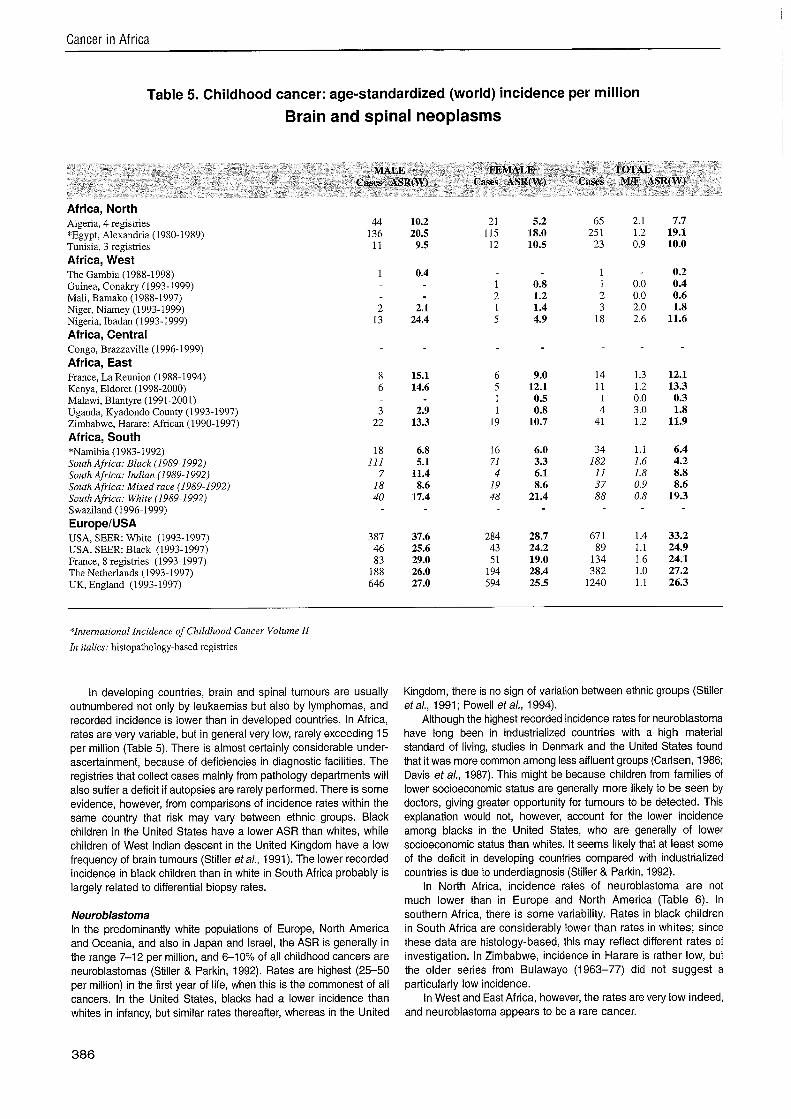
Brain and spinal tumours In developed countries, brain and spinal tumours typically account for 20-25% of all childhood cancer, with an ASR of 25-40 per million. The most common subgroup is astrocytoma, which covers a wide spectrum of histological types from the relatively benign juvenile astrocytoma (including optic nerve glioma) to the aggressive anaplastic astrocytoma and glioblastoma multiforme. The second most common category comprises primitive neuroectodermal tumours, most of which are cerebellar medulloblastoma. Ependymomas (including choroid plexus tumours) are relatively rare and, like astrocytomas, this category encompasses a wide range of degrees of malignancy.
Cancer in Africa
Table 5. Childhood cancer: age-standardized (world) incidence per million
Brain and spinal neoplasms
MALE FEMALE TOTAL Cases ASR(W) Cases ASR(W) Cases k1IF ASR(W)
Africa, North Algeria, 4 registries "Egypt, Alexandria (1980-1989) Tunisia, 3 registries Africa, West The Gambia (1988-1998) Guinea, Conakry (1993-1999) Mali, Bamako (1988-1997) Niger, Niamey (1993-1999) Nigeria, Ibadan (1993-1999) Africa, Central Congo, Brazzaville (1996-1999) Africa, East France, La Reunion (1988.1994) Kenya, Eldoret (1998-2000) Malawi, Blantyre (1991-2001) Uganda, Kyadondo County (1993-1997) Zimbabwe, Harare: African (1990-1997) Africa, South "Namibia (1983-1992) South Africa: Black (1989-1992) South Africa: Indian (1989-1992) South Africa: Mixed race (1989-1992) South Afiica: White (1 989-1 992) Swaziland (1996.1999) EuropeIUSA USA, SEER: White (1993-1997) USA, SEER: Black (1993-1997) France, 8 registries (1993-1997) The Netherlands (1993-1997) UK, England (1993-1997)
2gInternational Incidence of Childhood Cancer Volume I1
In italics: histopathology-based registries
In developing countries, brain and spinal tumours are usually outnumbered not only by leukaemias but also by lymphomas, and recorded incidence is lower than in developed countries. In Africa, rates are very variable, but in general very low, rarely exceeding 15 per million (Table 5). There is almost certainly considerable under- ascertainment, because of deficiencies in diagnostic facilities. The registries that collect cases mainly from pathology departments will also suffer a deficit if autopsies are rarely performed. There is some evidence, however, from comparisons of incidence rates within the same country that risk may vary between ethnic groups. Black children in the United States have a lower ASR than whites, while children of West Indian descent in the United Kingdom have a low frequency of brain tumours (Stiller etal., 1991). The lower recorded incidence in black children than in white in South Africa probably is largely related to differential biopsy rates.
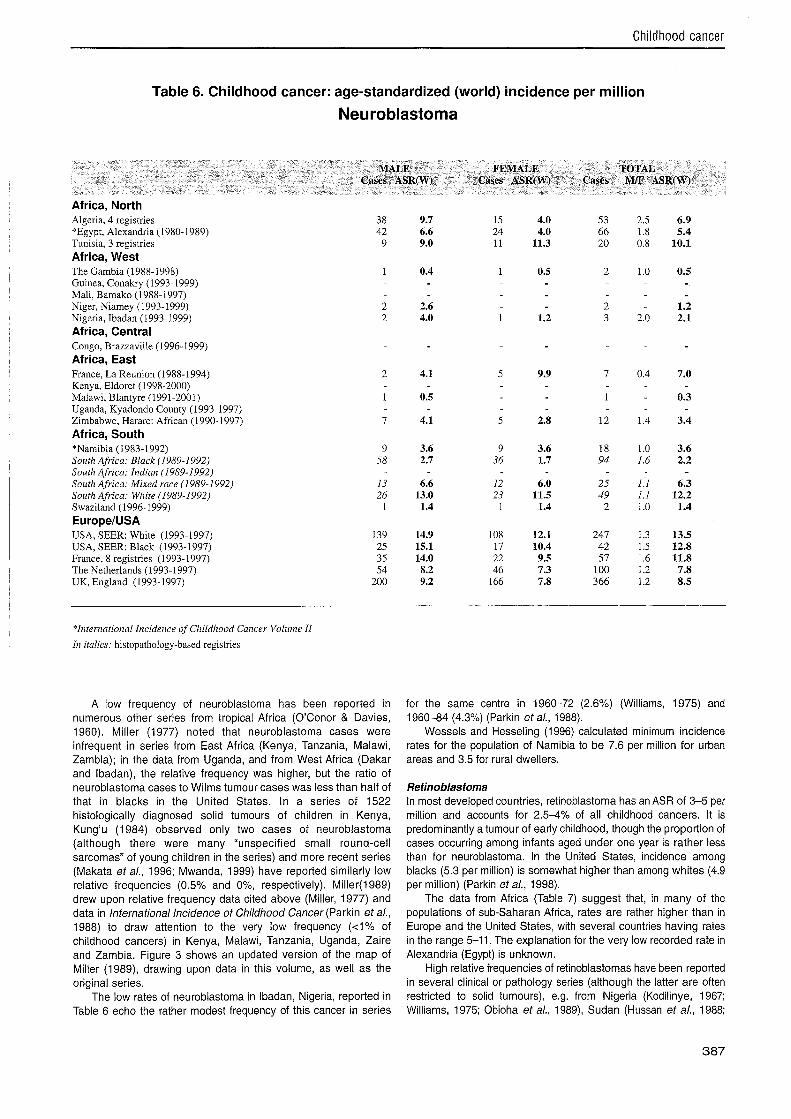
Neuroblastoma In the predominantly white populations of Europe, North America and Oceania, and also in Japan and Israel, the ASR is generally in the range 7-12 per million, and 6-10% of all childhood cancers are neuroblastomas (Stiller & Parkin, 1992). Rates are highest (25-50 per million) in the first year of life, when this is the commonest of all cancers. In the United States, blacks had a lower incidence than whites in infancy, but similar rates thereafter, whereas in the United
Kingdom, there is no sign of variation between ethnic groups (Stiller et a/., 1991 ; Powell et a/., 1994).
Although the highest recorded incidence rates for neuroblastoma have long been in industrialized countries with a high material standard of living, studies in Denmark and the United States found that it was more common among less affluent groups (Carlsen, 1986; Davis etal., 1987). This might be because children from families of lower socioeconomic status are generally more likely to be seen by doctors, giving greater opportunity for tumours to be detected. This explanation would not, however, account for the lower incidence among blacks in the United States, who are generally of lower socioeconomic status than whites. It seems likely that at least some of the deficit in developing countries compared with industrialized countries is due to underdiagnosis (Stiller & Parkin, 1992).
In North Africa, incidence rates of neuroblastoma are not much lower than in Europe and North America (Table 6). In southern Africa, there is some variability. Rates in black children in South Africa are considerably lower than rates in whites; since these data are histology-based, this may reflect different rates of investigation. In Zimbabwe, incidence in Harare is rather low, but the older series from Bulawayo (1963-77) did not suggest a particularly low incidence.
In West and East Africa, however, the rates are very low indeed, and neuroblastoma appears to be a rare cancer.
Childhood cancer
Table 6. Childhood cancer: age-standardized (world) incidence per million
Neuroblastoma
MALE FEMALE TOTAL Cases ASR(W) Cases ASR(W) Cases M/F ASR(W)
Africa, North Algeria, 4 registries "Egypt, Alexandria (1980-1989) Tunisia, 3 registries Africa, West The Gambia (1988-1998) Guinea, Conakry (1993.1999) Mali, Bamako (1988-1997) Niger, Niamey (1993-1999) Nigeria, Ibadan (1993.1999) Africa, Central Congo, Brazzaville (1996-1999) Africa, East France, La Reunion (1988-1994) Kenya, Eldoret (1998-2000) Malawi, Blantyre (1991-2001) Uganda, Kyadondo County (1993.1997) Zimbabwe, Harare: African (1990-1997) Africa, South :@Namibia (1983-1992) South Africa: Black (1989-1992) South Africa: Indian (1989-1 992) South Africa: Mixed race (1 989-1 992) South Africa: White (1 989-1 992) Swaziland (1996-1999) EuropelUSA USA, SEER: White (1993-1997) USA, SEER: Black (1993-1997) France, 8 registries (1993-1997) The Netherlands (1993-1997) UK, England (1993-1997)
"International Incidence of Childhood Cancer Volume I1
In italics: histopathology-based registries
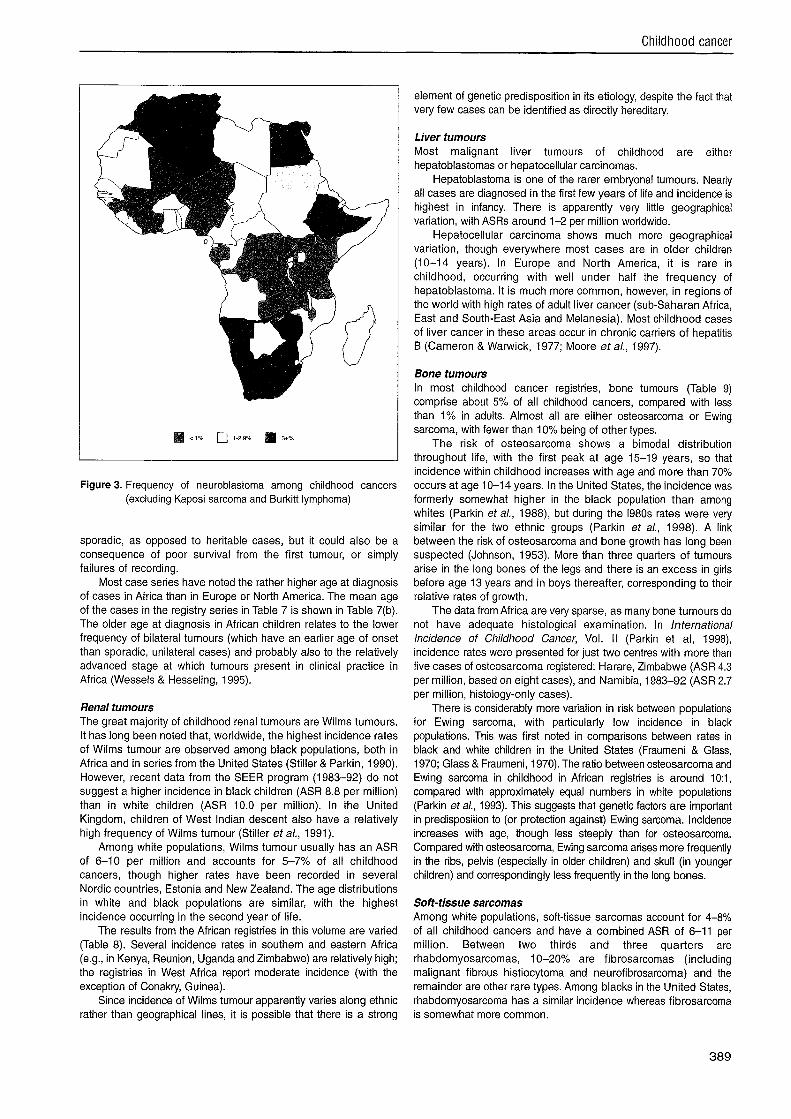
A low frequency of neuroblastoma has been reported in numerous other series from tropical Africa (O'Conor & Davies, 1960). Miller (1977) noted that neuroblastoma cases were infrequent in series from East Africa (Kenya, Tanzania, Malawi, Zambia); in the data from Uganda, and from West Africa (Dakar and Ibadan), the relative frequency was higher, but the ratio of neuroblastoma cases to Wilms tumour cases was less than half of that in blacks in the United States. In a series of 1522 histologically diagnosed solid tumours of children in Kenya, Kung'u (1984) observed only two cases of neuroblastoma (although there were many "unspecified small round-cell sarcomas" of young children in the series) and more recent series (Makata et a/., 1996; Mwanda, 1999) have reported similarly low relative frequencies (0.5% and 0%, respectively). Miller(1989) drew upon relative frequency data cited above (Miller, 1977) and data in International Incidence of Childhood Cancer (Parkin et al., 1988) to draw attention to the very low frequency (<I% of childhood cancers) in Kenya, Malawi, Tanzania, Uganda, Zaire and Zambia. Figure 3 shows an updated version of the map of Miller (1989), drawing upon data in this volume, as well as the original series.
The low rates of neuroblastoma in Ibadan, Nigeria, reported in Table 6 echo the rather modest frequency of this cancer in series
for the same centre in 1960-72 (2.6%) (Williams, 1975) and 1960-84 (4.3%) (Parkin et al., 1988).
Wessels and Hesseling (1996) calculated minimum incidence rates for the population of Namibia to be 7.6 per million for urban areas and 3.5 for rural dwellers.
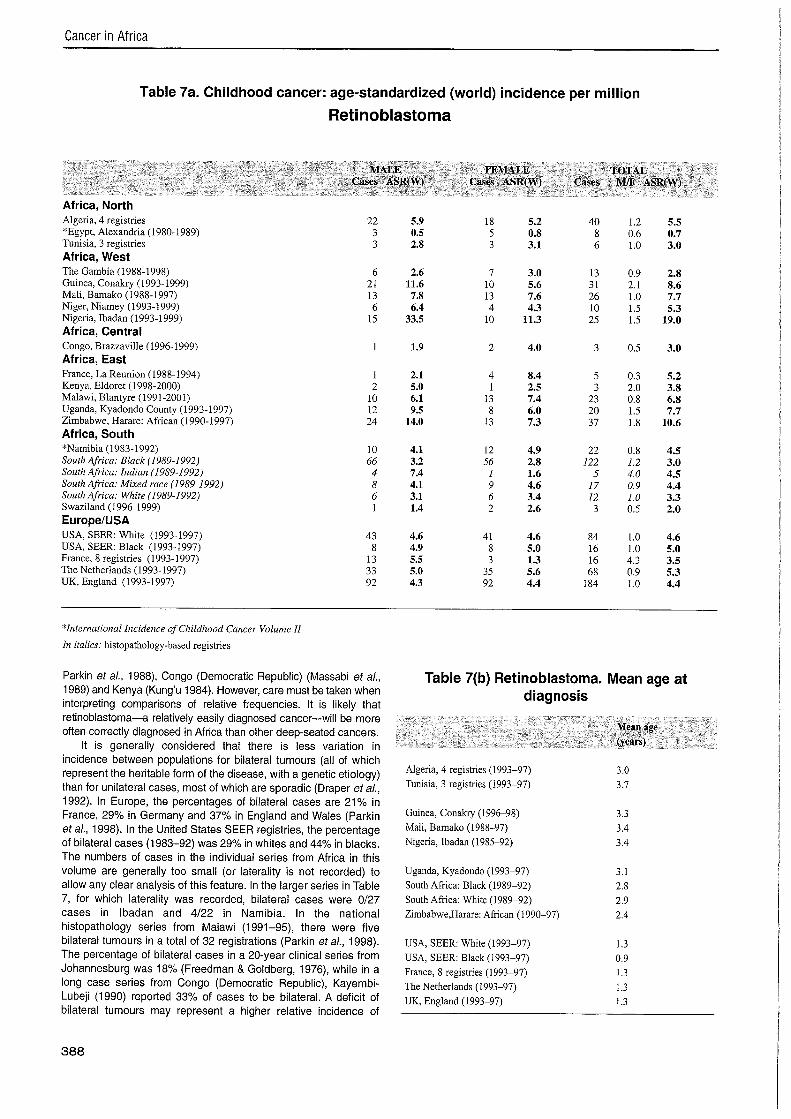
Retinoblastoma In most developed countries, retinoblastoma has an ASR of 3-5 per million and accounts for 2.5-4% of all childhood cancers. It is predominantly a tumour of early childhood, though the proportion of cases occurring among infants aged under one year is rather less than for neuroblastoma. In the United States, incidence among blacks (5.3 per million) is somewhat higher than among whites (4.9 per million) (Parkin et a/., 1998).
The data from Africa (Table 7) suggest that, in many of the populations of sub-Saharan Africa, rates are rather higher than in Europe and the United States, with several countries having rates in the range 5-11. The explanation for the very low recorded rate in Alexandria (Egypt) is unknown.
High relative frequencies of retinoblastomas have been reported in several clinical or pathology series (although the latter are often restricted to solid tumours), e.g. from Nigeria (Kodilinye, 1967; Williams, 1975; Obioha et al., 1989), Sudan (Hussan et al., 1988;
Cancer in Africa
Table 7a. Childhood cancer: age-standardized (world) incidence per million
Retinoblastoma
MALE FEMALE TOTAL Cases ASR(VI') Cases ASR(W) Cases MIF ASR(W)
Africa, North Algeria, 4 registries *Egypt, Alexandria (1980-1989) Tunisia, 3 registries Africa, West The Gambia (1988-1998) Guinea, Conakry (1993- 1999) Mali, Bamako (1988-1997) Niger, Niamey (1993-1999) Nigeria, Ibadan (1993-1999) Africa, Central Congo, Brazzaville (1996-1999) Africa, East France, La Reunion (1988-1994) Kenya, Eldoret (1998-2000) Malawi, Biantyre (1991-2001) Uganda, Kyadondo County (1993-1997) Zimbabwe, Harare: African (1990-1997) Africa, South *Namibia (1983-1992) South Africa: Black (1989-1992) South Afica: Indian (1989-1992) South Africa: Mixed race (1989-1992) South Africa: White (1989-1992) Swaziland (1996-1999) Europe/USA USA, SEER: White (1993-1997) USA, SEER: Black (1993-1997) France, 8 registries (1993-1997) The Netherlands (1993-1997) UK, England (1993-1997)
*International Incidence of Childhood Cancer Volume II
In italics: histopathology-based registries
Parkin et a/., 1988), Congo (Democratic Republic) (Massabi et a/., 1989) and Kenya (Kung'u 1984). However, care must be taken when interpreting comparisons of relative frequencies. It is likely that
Table 7(b) Retinoblastoma. Mean age at diagnosis
retinoblastoma-a relatively easily diagnosed cancer-will be more often correctly diagnosed in Africa than other deep-seated cancers. Mean age
It is generally considered that there is less variation in (years)
incidence between populations for bilateral tumours (all of which represent the heritable form of the disease, with a genetic etiology) than for unilateral cases, most of which are sporadic (Draper etal., 1992). In Europe, the percentages of bilateral cases are 21% in France, 29% in Germany and 37% in England and Wales (Parkin etal., 1998). In the United States SEER registries, the percentage of bilateral cases (1 983-92) was 29% in whites and 44% in blacks. The numbers of cases in the individual series from Africa in this volume are generally too small (or laterality is not recorded) to allow any clear analysis of this feature. In the larger series in Table 7, for which laterality was recorded, bilateral cases were 0127 cases in lbadan and 4/22 in Namibia. In the national histopathology series from Malawi (1991-95), there were five bilateral tumours in a total of 32 registrations (Parkin et a/., 1998). The percentage of bilateral cases in a 20-year clinical series from Johannesburg was 18% (Freedman & Goldberg, 1976), while in a long case series from Congo (Democratic Republic), Kayembi- Lubeji (1990) reported 33% of cases to be bilateral. A deficit of bilateral tumours may represent a higher relative incidence of
Algeria, 4 registries (1993-97) Tunisia, 3 registries (1993-97)
Guinea, Conakry (1996-98) Mali, Bamako (1988-97) Nigeria, Ibadan (1985-92)
Uganda, Kyadondo (1993-97) South Africa: Black (1989-92) South Africa: White (1989-92) Zimbabwe,Harare: African (1990-97)
USA, SEER: White (1993-97) USA, SEER: Black (1993-97) France, 8 registries (1993-97) The Netherlands (1993-97) UK, England (1993-97)
Childhood cancer
Figure 3. Frequency of neuroblastoma among childhood cancers (excluding Kaposi sarcoma and Burkitt lymphoma)
sporadic, as opposed to heritable cases, but it could also be a consequence of poor survival from the first tumour, or simply failures of recording.
Most case series have noted the rather higher age at diagnosis of cases in Africa than in Europe or North America. The mean age of the cases in the registry series in Table 7 is shown in Table 7(b). The older age at diagnosis in African children relates to the lower frequency of bilateral tumours (which have an earlier age of onset than sporadic, unilateral cases) and probably also to the relatively advanced stage at which tumours present in clinical practice in Africa (Wessels & Hesseling, 1995).
Renal tumours The great majority of childhood renal tumours are Wilms tumours. It has long been noted that, worldwide, the highest incidence rates of Wilms tumour are observed among black populations, both in Africa and in series from the United States (Stiller & Parkin, 1990). However, recent data from the SEER program (1983-92) do not suggest a higher incidence in black children (ASR 8.8 per million) than in white children (ASR 10.0 per million). In the United Kingdom, children of West Indian descent also have a relatively high frequency of Wilms tumour (Stiller et al., 1991).
Among white populations, Wilms tumour usually has an ASR of 6-10 per million and accounts for 5-7% of all childhood cancers, though higher rates have been recorded in several Nordic countries, Estonia and New Zealand. The age distributions in white and black populations are similar, with the highest incidence occurring in the second year of life.
The results from the African registries in this volume are varied (Table 8). Several incidence rates in southern and eastern Africa (e.g., in Kenya, Reunion, Uganda and Zimbabwe) are relatively high; the registries in West Africa report moderate incidence (with the exception of Conakry, Guinea).
Since incidence of Wilms tumour apparently varies along ethnic rather than geographical lines, it is possible that there is a strong
element of genetic predisposition in its etiology, despite the fact that very few cases can be identified as directly hereditary.
Liver tumours Most malignant liver tumours of childhood are either hepatoblastomas or hepatocellular carcinomas.
Hepatoblastoma is one of the rarer embryonal tumours. Nearly all cases are diagnosed in the first few years of life and incidence is highest in infancy. There is apparently very little geographical variation, with ASRs around 1-2 per million worldwide.
Hepatocellular carcinoma shows much more geographical variation, though everywhere most cases are in older children (10-14 years). In Europe and North America, it is rare in childhood, occurring with well under half the frequency of hepatoblastoma. It is much more common, however, in regions of the world with high rates of adult liver cancer (sub-Saharan Africa, East and South-East Asia and Melanesia). Most childhood cases of liver cancer in these areas occur in chronic carriers of hepatitis B (Cameron & Warwick, 1977; Moore et a/., 1997).
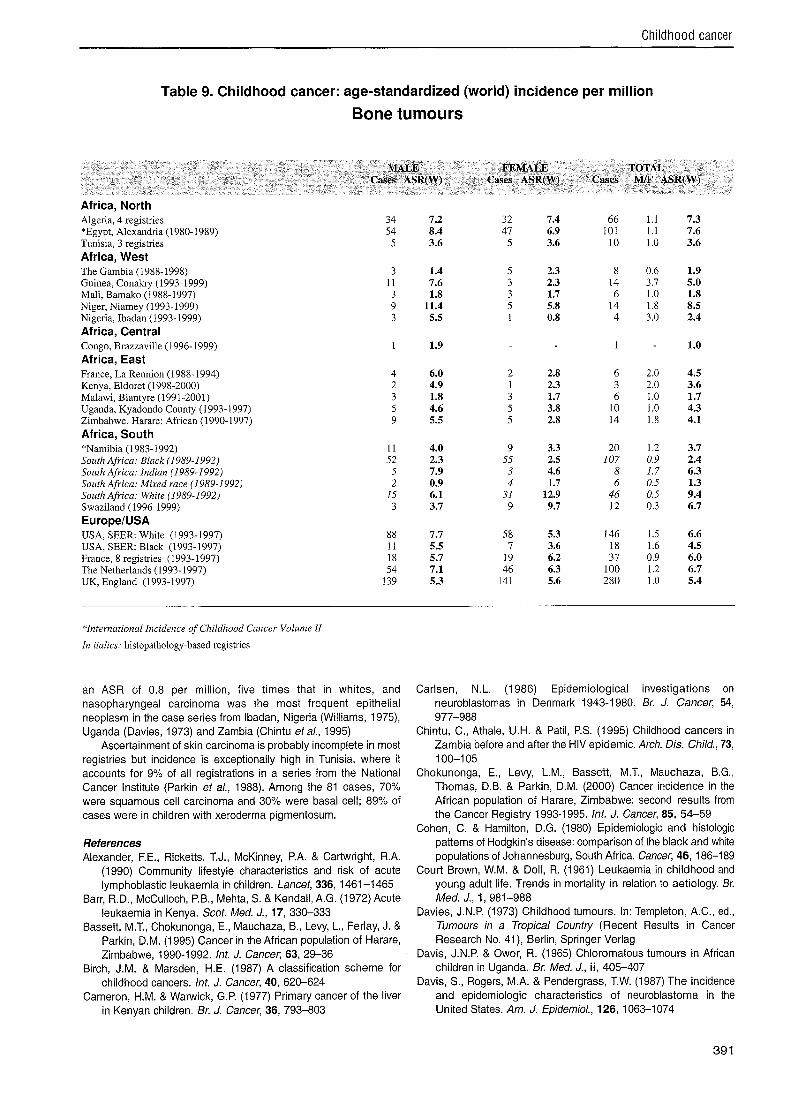
Bone tumours In most childhood cancer registries, bone tumours (Table 9) comprise about 5% of all childhood cancers, compared with less than 1% in adults. Almost all are either osteosar~oma or Ewing sarcoma, with fewer than 10% being of other types.
The risk of osteosarcoma shows a bimodal distribution throughout life, with the first peak at age 15-19 years, so that incidence within childhood increases with age and more than 70% occurs at age 10-14 years. In the United States, the incidence was formerly somewhat higher in the black population than among whites (Parkin et al., 1988), but during the 1980s rates were very similar for the two ethnic groups (Parkin et a/., 1998). A link between the risk of osteosarcoma and bone growth has long been suspected (Johnson, 1953). More than three quarters of tumours arise in the long bones of the legs and there is an excess in girls before age 13 years and in boys thereafter, corresponding to their relative rates of growth.
The data from Africa are very sparse, as many bone tumours do not have adequate histological examination. In International lncidence of Childhood Cancer, Vol. II (Parkin et al, 1998), incidence rates were presented for just two centres with more than five cases of osteosarcoma registered: Harare, Zimbabwe (ASR 4.3 per million, based on eight cases), and Namibia, 1983-92 (ASR 2.7 per million, histology-only cases).
There is considerably more variation in risk between populations for Ewing sarcoma, with particularly low incidence in black populations. This was first noted in comparisons between rates in black and white children in the United States (Fraumeni & Glass, 1970; Glass & Fraumeni, 1970). The ratio between osteosarcoma and Ewing sarcoma in childhood in African registries is around 10:1, compared with approximately equal numbers in white populations (Parkin eta/., 1993). This suggests that genetic factors are important in predisposition to (or protection against) Ewing sarcoma. lncidence increases with age, though less steeply than for osteosarcoma. Compared with osteosarcoma, Ewing sarcoma arises more frequently in the ribs, pelvis (especially in older children) and skull (in younger children) and correspondingly less frequently in the long bones.
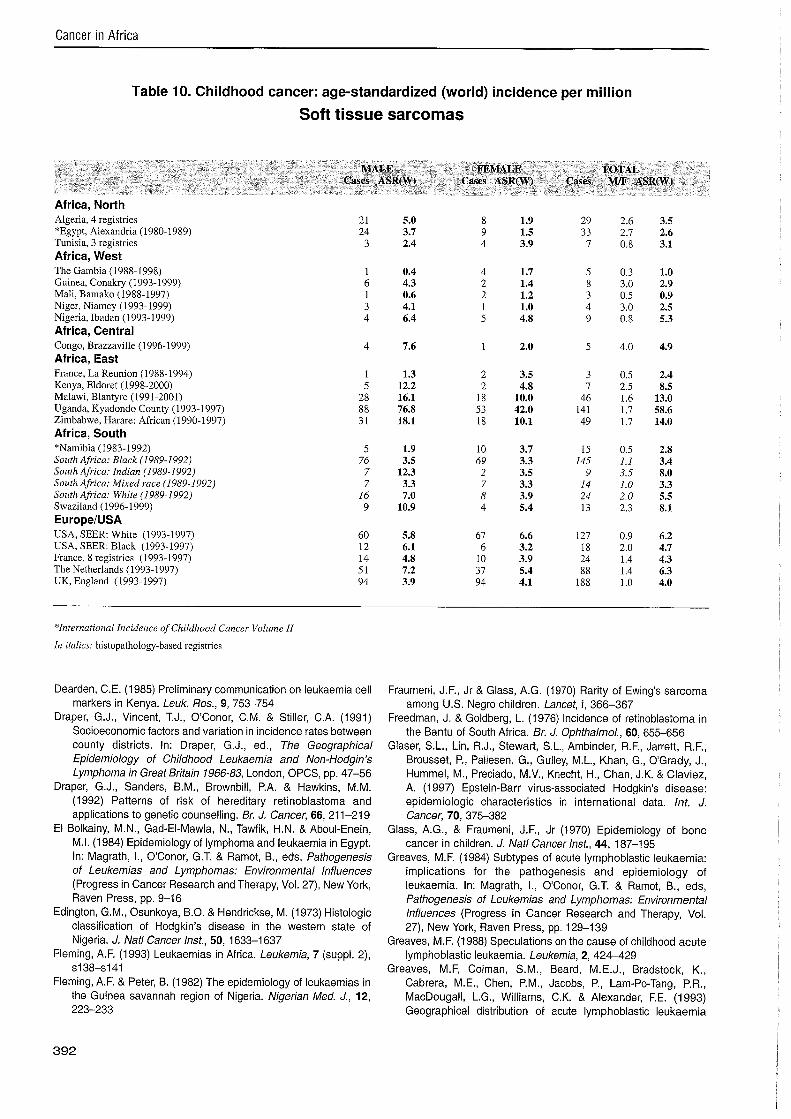
Soft-tissue sarcomas Among white populations, soft-tissue sarcomas account for 4-8% of all childhood cancers and have a combined ASR of 6-11 per million. Between two thirds and three quarters are rhabdomyosarcomas, 10-20% are fibrosarcomas (including malignant fibrous histiocytoma and neurofibrosarcoma) and the remainder are other rare types. Among blacks in the United States, rhabdomyosarcoma has a similar incidence whereas fibrosarcoma is somewhat more common.

Cancer in Africa
Table 8. Childhood cancer: age-standardized (world) incidence per million
Wilms tumour
MALE FEMALE TOTAL Cases ASR(W) Cases ASR(W) Cases M/F ASR(W)
Africa, North Algeria, 4 registries "Egypt, Alexandria (1980-1989) Tunisia, 3 registries Africa, West The Gambia (1988-1998) Guinea, Conakry (1993-1999) Mali, Bamako (1988-1997) Niger, Niamey (1993-1999) Nigeria, Ibadan (1993.1999) Africa, Central Congo, Brazzaville (1996- 1999) Africa, East France, La Reunion (1988-1994) Kenya, Eldoret (1998-2000) Malawi, Blantyre (1991-2001) Uganda, Kyadondo County (1993-1997) Zimbabwe, Harare: African (1990-1997) Africa, South "Namibia (1983-1992) South Africa: Black (1989-1992) Sozlth Africa: Indian (1989-1992) Sozttlz Africa: Mixed race (1989-1992) South Africa: White (1989-1992) Swaziland (1996- 1999) EuropeIUSA USA, SEER: White (1993-1997) USA, SEER: Black (1993-1997) France, 8 registries (1993-1997) The Netherlands (1993-1997) UK, England (1993-1997)
"International Incidence of Childhood Cancer Volume I1
In italics: histopathology-based registries
In Africa, incidence rates of childhood soft-tissue sarcomas other than Kaposi sarcoma are unremarkable (Table 10).
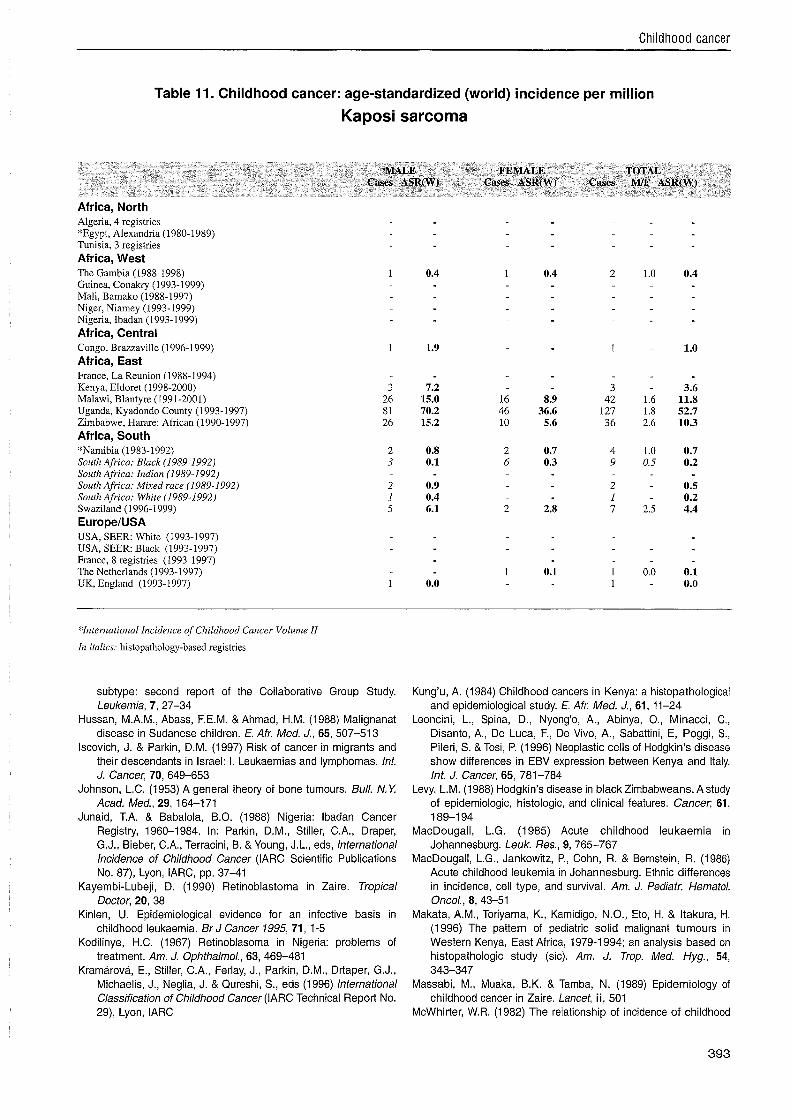
In the 1970s, Kaposi sarcoma had an ASR of 2-2.5 per million in Kampala, Uganda, and Bulawayo, Zimbabwe, and in Bulawayo it was the most common childhood soft-tissue sarcoma (Parkin etal., 1988). These data from the period preceding the AlDS epidemic in sub-Saharan Africa give an indication of the incidence of childhood Kaposi sarcoma attributable to the endemic form of the disease. Since then, there have been very large increases in the incidence of Kaposi sarcoma among children in East and Central Africa. In Kampala during 1993-97, the ASR was 52.7 per million and among African residents of Harare, Zimbabwe, during 1990-97 it was 10.3 per million (Table 11). In these two series, Kaposi sarcoma accounted for 33% and 10% of all childhood cancers respectively. In Zambia over a similar period, the relative frequency was 19% (Chintu etal., 1995). It is clear that the great majority of the increase in incidence is related to the AlDS epidemic, which has been particularly severe in East and Central Africa. As very high rates of HIV infection are a more recent phenomenon in western and southern Africa, the peak incidence of childhood Kaposi sarcoma may also occur later in these countries. In Harare, however, while the incidence of Kaposi sarcoma at all ages combined doubled between 1990-92 and 1993-95, in children it rose by only around 15% (Bassett etal., 1995; Chokunonga etal., 2000).
Even before the onset of the AlDS epidemic, however, Kaposi sarcoma in childhood had very different clinical features from endemic Kaposi sarcoma of adults, and more resembled epidemic AIDS-related Kaposi sarcoma. Thus, it was often poly- lymphadenopathic, with either absent or sparse and anomalously sited skin lesions. Progression was rapid (Slavin et a/., 1970; Olweny et a/., 1976).
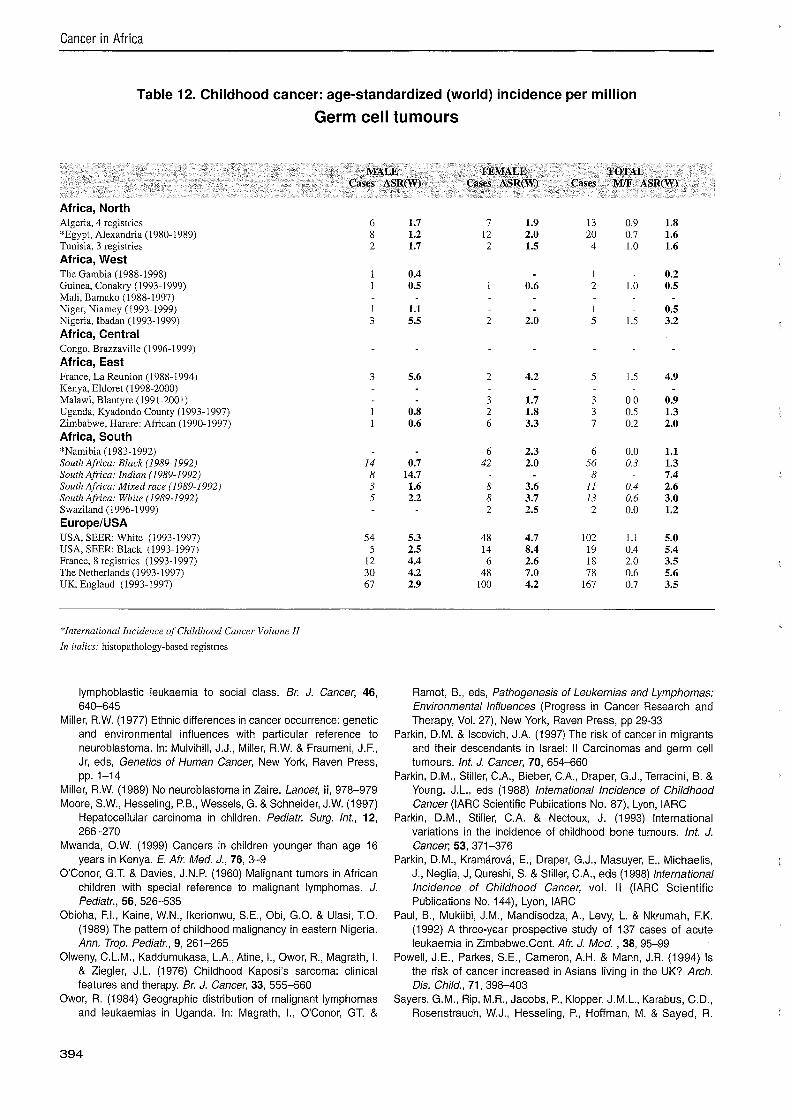
Germ-cell and gonadal tumours Germ-cell tumours generally account for less than 4% of all childhood cancers. Testicular tumours are rare in black children in the United States (Miller, 1977); incidence rates for germ-cell tumours are about one third to one quarter those in white children (Parkin et a/., 1998). These cancers are rare in all series of childhood cancers from Africa (Davies, 1973; Williams, 1975). Table 12 shows the rates from the series in this volume.
Epithelial tumours By far the highest relative frequency of childhood nasopharyngeal carcinoma is in North Africa, a region of intermediate risk for adults, where it accounts for 7-1 5% of all childhood cancers; the ASR in Algeria was 2.6 per million. Among Israeli-born Jews, the highest incidence is among those whose parents were born in North Africa (Parkin & Iscovich, 1997). In the United States, black children had
Childhood cancer
Table 9. Childhood cancer: age-standardized (world) incidence per million
Bone tumours
MALE FEMALE TOTAL Cases ASR(W) Cases ASR(W) Cases M/F ASR(W)
Africa, North Algeria, 4 registries *Egypt, Alexandria (1980-1989) Tunisia, 3 registries Africa, West The Gambia (1988-1998) Guinea, Conakry (1993- 1999) Mali, Bamako (1988-1997) Niger, Niamey (1993- 1999) Nigeria, Ibadan (1993-1999) Africa, Central Congo, Brazzaville (1996-1999) Africa, East France, La Reunion (1988-1994) Kenya, Eldoret (1998-2000) Malawi, Blantyre (199 1-2001) Uganda, Kyadondo County (1993-1997) Zimbabwe, Harare: African (1990-1997) Africa, South "Namibia (1983-1992) South Africa: Black (1989-1992) South Africa: Indian (1989-1992) South Africa: Mixed race (1989-1992) South Africa: White (1 989-1 992) Swaziland (1996-1999) EuropeIUSA USA, SEER: White (1993-1997) USA, SEER: Black (1993-1997) France, 8 registries (1993-1997) The Netherlands (1993-1997) UK, England (1993-1997)
*International Incidence of Childhood Cancer Volume II
Itz italics: histopathology-based registries
an ASR of 0.8 per million, five times that in whites, and nasopharyngeal carcinoma was the most frequent epithelial neoplasm in the case series from Ibadan, Nigeria (Williams, 1975), Uganda (Davies, 1973) and Zambia (Chintu et a/., 1995)
Ascertainment of skin carcinoma is probably incomplete in most registries but incidence is exceptionally high in Tunisia, where it accounts for 9% of all registrations in a series from the National Cancer Institute (Parkin et a/., 1988). Among the 81 cases, 70% were squamous cell carcinoma and 30% were basal cell; 89% of cases were in children with xeroderma pigmentosum.
References Alexander, F.E., Ricketts, T.J., McKinney, P.A. & Cartwright, R.A.
(1990) Community lifestyle characteristics and risk of acute lymphoblastic leukaemia in children. Lancet, 336, 1461-1465
Barr, R.D., McCulloch, P.B., Mehta, S. & Kendall, A.G. (1 972) Acute leukaemia in Kenya. Scot. Med. J., 17, 330-333
Bassett, M.T., Chokunonga, E., Mauchaza, B., Levy, L., Ferlay, J. & Parkin, D.M. (1995) Cancer in the African population of Harare, Zimbabwe, 1990-1992. Int. J. Cancer; 63, 29-36
Birch, J.M. & Marsden, H.E. (1987) A classification scheme for childhood cancers. Int. J. Cancer, 40, 620-624
Cameron, H.M. & Warwick, G.P. (1977) Primary cancer of the liver in Kenyan children. Br. J. Cancer, 36, 793-803
Carlsen, N.L. (1986) Epidemiological investigations on neuroblastomas in Denmark 1943-1 980. Br. J. Cancer, 54, 977-988
Chintu, C., Athale, U.H. & Patil, P.S. (1995) Childhood cancers in Zambia before and after the HIV epidemic. Arch. Dis. Child., 73, 100-1 05
Chokunonga, E., Levy, L.M., Bassett, M.T., Mauchaza, B.G., Thomas, D.B. & Parkin, D.M. (2000) Cancer incidence in the African population of Harare, Zimbabwe: second results from the Cancer Registry 1993-1 995. Int. J. Cancer, 85, 54-59
Cohen, C. & Hamilton, D.G. (1980) Epidemiologic and histologic patterns of Hodgkin's disease: comparison of the black and white populations of Johannesburg, South Africa. Cancer, 46, 186-189
Court Brown, W.M. & Doll, R. (1961) Leukaemia in childhood and young adult life. Trends in mortality in relation to aetiology. Br. Med. J., 1 , 981-988
Davies, J.N.P. (1973) Childhood tumours. In: Templeton, A.C., ed., Tumours in a Tropical Country (Recent Results in Cancer Research No. 41), Berlin, Springer Verlag
Davis, J.N.P. & Owor, R. (1965) Chloromatous tumours in African children in Uganda. Br. Med. J., i i , 405-407
Davis, S., Rogers, M.A. & Pendergrass, T.W. (1987) The incidence and epidemiologic characteristics of neuroblastoma in the United States. Am. J. Epidemiol., 126, 1063-1074
Cancer in Africa
Table 10. Childhood cancer: age-standardized (world) incidence per million
Soft tissue sarcomas
MALE FEMALE TOTAL Cases ASR(W) Cases ASR(W) Cases M/F ASR(W)
Africa, North Algeria, 4 registries "Egypt, Alexandria (1980.1989) Tunisia, 3 registries Africa, West The Gambia (1988-1998) Guinea, Conakry (1993-1999) Mali, Bamako (1988-1997) Niger, Niamey (1993-1999) Nigeria, Ibadan (1993-1999) Africa, Central Congo, Brazzaville (1996-1999) Africa, East France, La Reunion (1988-1994) Kenya, Eldoret (1998-2000) Malawi, Blantyre (1991-2001) Uganda, Kyadondo County (1993-1997) Zimbabwe, Harare: African (1990-1997) Africa, South "Namibia (1983-1992) South Africa: Black (1 989-1 992) South Africa: Indian (1989-1992) South Africa: Mixed race (1989-1992) South Africa: White (1989-1992) Swaziland (1996-1999) EuropeIUSA USA, SEER: White (1993-1997) USA, SEER: Black (1993-1997) France, 8 registries (1993-1997) The Netherlands (1993-1997) UK, England (1993-1997)
"International Incidence of Childhood Cancer Volume II
In italics: histopathology-based registries
Dearden, C.E. (1 985) Preliminary communication on leukaemia cell markers in Kenya. Leuk. Res., 9,753-754
Draper, G.J., Vincent, T.J., O'Conor, C.M. & Stiller, C.A. (1991) Socioeconomic factors and variation in incidence rates between county districts. In: Draper, G.J., ed., The Geographical Epidemiology of Childhood Leukaemia and Non-Hodgin's Lymphoma in Great Britain 1966-83, London, OPCS, pp. 47-56
Draper, G.J., Sanders, B.M., Brownbill, P.A. & Hawkins, M.M. (1992) Patterns of risk of hereditary retinoblastoma and applications to genetic counselling. Br. J. Cancer, 66, 211-219
El Bolkainy, M.N., Gad-El-Mawla, N., Tawfik, H.N. & Aboul-Enein, M.I. (1984) Epidemiology of lymphoma and Ieukaemia in Egypt. In: Magrath, I., O'Conor, G.T. & Ramot, B., eds, Pathogenesis of Leukemias and Lymphomas: Environmental Influences (Progress in Cancer Research and Therapy, Vol. 27), New York, Raven Press, pp. 9-16
Edington, G.M., Osunkoya, B.O. & Hendrickse, M. (1973) Histologic classification of Hodgkin's disease in the western state of Nigeria. J. Natl Cancer Inst., 50, 1633-1 637
Fleming, A.F. (1993) Leukaemias in Africa. Leukemia, 7 (suppl. 2), ~138-~141
Fleming, A.F. & Peter, B. (1982) The epidemiology of leukaemias in the Guinea savannah region of Nigeria. Nigerian Med. J., 12, 223-233
Fraumeni, J.F., Jr & Glass, A.G. (1970) Rarity of Ewing's sarcoma among U.S. Negro children. Lancet, i, 366-367
Freedman, J. & Goldberg, L. (1976) Incidence of retinoblastoma in the Bantu of South Africa. Br. J. Ophthalmol., 60, 655-656
Glaser, S.L., Lin, R.J., Stewart, S.L., Ambinder, R.F., Jarrett, R.F., Brousset, P., Pallesen, G., Gulley, M.L., Khan, G., O'Grady, J., Hummel, M., Preciado, M.V., Knecht, H., Chan, J.K. & Claviez, A. (1 997) Epstein-Barr virus-associated Hodgkin's disease: epidemiologic characteristics in international data. Int. J. Cancer, 70,375-382
Glass, A.G., & Fraumeni, J.F., Jr (1970) Epidemiology of bone cancer in children. J. Natl Cancer Inst., 44, 187-1 95
Greaves, M.F. (1984) Subtypes of acute lymphoblastic leukaemia: implications for the pathogenesis and epidemiology of leukaemia. In: Magrath, I., O'Conor, G.T. & Ramot, B., eds, Pathogenesis of Leukemias and Lymphomas: Environmental lnfluences (Progress in Cancer Research and Therapy, Vol. 27), New York, Raven Press, pp. 129-139
Greaves, M.F. (1988) Speculations on the cause of childhood acute lymphoblastic leukaemia. Leukemia, 2, 424-429
Greaves, M.F, Colman, S.M., Beard, M.E.J., Bradstock, K., Cabrera, M.E., Chen, P.M., Jacobs, P., Lam-Po-Tang, P.R., MacDougall, L.G., Williams, C.K. & Alexander, F.E. (1993) Geographical distribution of acute lymphoblastic leukaemia
Childhood cancer
Table 11. Childhood cancer: age-standardized (world) incidence per million
Kaposi sarcoma
MALE FEMALE TOTAL Cases ASR(W) Cases ASR(W) Cases M/F ASR(W)
Africa, North Algena, 4 reglstnes *Egypt, Alexandna (1980-1989) Tunisia, 3 registnes Africa, West The Gambia (1988-1998) Gu~nea, Conakry (1993-1999) Mall, Bamako (1988-1997) N~ger, Niamey (1993-1999) Nigena, Ibadan (1993.1999) Africa, Central Congo, Brazzaville (1996-1999) Africa, East France, La Reun~on (1988-1994) Kenya, Eldoret (1998-2000) ma law^, Blantyre (1991-2001) Uganda, Kyadondo County (1993-1997) Z~mbabwe, Harare Afr~can (1990-1997) Africa, South *Narmbia (1983-1992) South Afr~ca Black (1989-1992) South Afr~ca Ind~an (1989-1992) South Afnca Mlxed race (1989-1992) South Afrlca . Wh~te (1989-1992) Swaz~land (1996-1999) EuropelUSA USA, SEER Wh~te (1993-1997) USA, SEER Black (1993-1997) France, 8 reglstnes (1993-1997) The Netherlands (1993-1997) UK, England (1993- 1997)
"International Incidence of Childhood Cancer Volume II
In italics: histopathology-based registries
subtype: second report of the Collaborative Group Study. Leukem~a, 7 , 2 7 3 4
Hussan, M.A.M., Abass, F.E.M. & Ahmad, H.M. (1 988) Malignanat disease in Sudanese children. E. Afr. Med. J., 65, 507-51 3
Iscovich, J. & Parkin, D.M. (1997) Risk of cancer in migrants and their descendants in Israel: I. Leukaemias and lymphomas. Int. J. Cancer, 70, 649-653
Johnson, L.C. (1953) A general theory of bone tumours. Bull. N.Y Acad. Med., 29, 164-171
Junaid, T.A. & Babalola, B.O. (1988) Nigeria: lbadan Cancer Registry, 1960-1984. In: Parkin, D.M., Stiller, C.A., Draper, G.J., Bieber, C.A., Terracini, B. &Young, J.L., eds, lnternational Incidence of Childhood Cancer (IARC Scientific Publications No. 87), Lyon, IARC, pp. 37-41
Kayembi-Lubeji, D. (1 990) Retinoblastoma in Zaire. Tropical Doctor, 20, 38
Kinlen, U. Epidemiological evidence for an infective basis In childhood leukaemia. Br J Cancer 1995,71, 1-5
Kodilinye, H.C. (1967) Retinoblasoma in Nigeria: problems of treatment. Am. J. Ophthalmol., 63, 469-481
Kramarova, E., Stiller, C.A., Ferlay, J., Parkin, D.M., Drtaper, G.J., Michaelis, J., Neglia, J. & Qureshi, S., eds (1996) lnternational Classification of Childhood Cancer (IARC Technical Report No. 29), Lyon, IARC
Kung'u, A. (1984) Childhood cancers in Kenya: a histopathological and epidemiological study. E. Afr. Med. J., 61, 11-24
Leoncini, L., Spina, D., Nyong'o, A., Abinya, O., Minacci, C., Disanto, A,, De Luca, F., De Vivo, A., Sabattini, E, Poggi, S., Pileri, S. & Tosi, P. (1996) Neoplastic cells of Hodgkin's disease show differences in EBV expression between Kenya and Italy. Int. J. Cancer, 65, 781-784
Levy, L.M. (1 988) Hodgkin's disease in black Zimbabweans. A study of epidemiologic, histologic, and clinical features. Cancer; 61, 189-1 94
MacDougall, L.G. (1985) Acute childhood leukaemia in Johannesburg. Leuk. Res., 9,765-767
MacDougall, L.G., Jankowitz, P., Cohn, R. & Bernstein, R. (1986) Acute childhood leukemia in Johannesburg. Ethnic differences in incidence, cell type, and survival. Am. J. Pediatr. Hematol. Oncol., 8, 43-51
Makata, A.M., Toriyama, K., Kamidigo, N.O., Eto, H. & Itakura, H. (1996) The pattern of pediatric solid malignant tumours in Western Kenya, East Africa, 1979-1994; an analysis based on histopathologic study (sic). Am. J. Trop. Med. Hyg., 54, 343-347
Massabi, M., Muaka, B.K. & Tamba, N. (1989) Epidemiology of childhood cancer in Zaire. Lancet, ii, 501
McWhirter, W.R. (1982) The relationship of incidence of childhood
Cancer in Africa
Table 12. Childhood cancer: age-standardized (world) incidence per million
Germ cell tumours
MALE FEMALE TOTAL Cases ASR(W) Cases ASR(W) Cases ivI/F ASR(W)
Africa, North Algeria, 4 registries *Egypt, Alexandria (1980-1989) Tunisia, 3 registries Africa, West The Gambia (1988-1998) Guinea, Conakry (1993.1999) Mali, Bamako (1988-1997) Niger, Niamey (1993-1999) Nigeria, Ibadan (1993-1999) Africa, Central Congo, Brazzaville (1996-1999) Africa, East France, La Reunion (1988-1994) Kenya, Eldoret (1998-2000) Malawi, Blantyre (1991-2001) Uganda, Kyadondo County (1993-1997) Zimbabwe, Harare: African (1990-1997) Africa, South "Namibia (1983- 1992) South Africa: Black (1989-1992) South Africa: Indian (1989-1992) South Africa: Mined race (1989-1992) South Africa: White (1 989-1992) Swaziland (1996-1 999) EuropeIUSA USA, SEER: White (1993-1997) USA, SEER: Black (1993-1997) France, 8 registries (1993-1997) The Netherlands (1993-1997) UK, England (1993-1997)
*International Incidence of Childhood Cancer Volwne I1
112 italics: histopathology-based registries
lymphoblastic leukaemia to social class. Br. J. Cancer, 46, 640-645
Miller, R.W. (1977) Ethnic differences in cancer occurrence: genetic and environmental influences with particular reference to neuroblastoma. In: Mulvihill, J.J., Miller, R.W. & Fraumeni, J.F., Jr, eds, Genetics of Human Cancer, New York, Raven Press, pp. 1-14
Miller, R.W. (1989) No neuroblastoma in Zaire. Lancet, ii, 978-979 Moore, S.W., Hesseling, P.B., Wessels, G. & Schneider, J.W. (1997)
Hepatocellular carcinoma in children. Pediatr. Surg. Int., 12, 266-270
Mwanda, O.W. (1999) Cancers in children younger than age 16 years in Kenya. E. Afr. Med. J., 76, 3-9
O'Conor, G.T. & Davies, J.N.P. (1960) Malignant tumors in African children with special reference to malignant lymphomas. J. Pediatr., 56, 526-535
Obioha, F.I., Kaine, W.N., Ikerionwu, S.E., Obi, G.O. & Ulasi, T.O. (1 989) The pattern of childhood malignancy in eastern Nigeria. Ann. Trop. Pediatr., 9, 261-265
Olweny, C.L.M., Kaddumukasa, L.A., Atine, I., Owor, R., Magrath, I. & Ziegler, J.L. (1976) Childhood Kaposi's sarcoma: clinical features and therapy. Br. J. Cancer, 33, 555-560
Owor, R. (1984) Geographic distribution of malignant lymphomas and leukaemias in Uganda. In: Magrath, I., O'Conor, GT. &
Ramot, B., eds, Pathogenesis of Leukemias and Lymphomas: Environmental Influences (Progress in Cancer Research and Therapy, Vol. 27), New York, Raven Press, pp 29-33
Parkin, D.M. & Iscovich, J.A. (1997) The risk of cancer in migrants and their descendants in Israel: II Carcinomas and germ cell tumours. Int. J. Cancer, 70, 654-660
Parkin, D.M., Stiller, C.A., Bieber, C.A., Draper, G.J., Terracini, B. & Young, J.L., eds (1988) International Incidence of Childhood Cancer (IARC Scientific Publications No. 87), Lyon, IARC
Parkin, D.M., Stiller, C.A. & Nectoux, J. (1993) lnternational variations in the incidence of childhood bone tumours. Int. J. Cancer; 53,371-376
Parkin, D.M., Kramarova, E., Draper, G.J., Masuyer, E., Michaelis, J., Neglia, J, Qureshi, S. & Stiller, C.A., eds (1998) lnternational Incidence of Childhood Cancer, vol. II (IARC Scientific Publications No. 144), Lyon, IARC
Paul, B., Mukiibi, J.M., Mandisodza, A., Levy, L. & Nkrumah, F.K. (1992) A three-year prospective study of 137 cases of acute leukaemia in Zimbabwe.Cent. Afr. J. Med. , 38, 95-99
Powell, J.E., Parkes, S.E., Cameron, A.H. & Mann, J.R. (1 994) Is the risk of cancer increased in Asians living in the UK? Arch. Dis. Child., 71, 398-403
Sayers, G.M., Rip, M.R., Jacobs, P., Klopper, J.M.L., Karabus, C.D., Rosenstrauch, W.J., Hesseling, P., Hoffman, M. & Sayed, R.
Childhood cancer
Table 13. Childhood cancer: age-standardized (world) incidence per million
All cancers
MALE FEMALE TOTAL Cases ASR(W) Cases ASR(W) Cases M/F ASR(W)
Africa, North Algeria, 4 registries "Egypt, Alexandria (1980-1989) Tunisia, 3 registries Africa, West The Gambia (1988-1998) Guinea, Conakry (1993-1999) Mali, Bamako (1988-1997) Niger, Niamey (1993-1999) Nigeria, Ibadan (1993-1999) Africa, Central Congo, Brazzaville (1996-1999) Africa, East France, La Reunion (1988-1994) Kenya, Eldoret (1998.2000) Malawi, Blantyre (1991-2001) Uganda, Kyadondo County (1993-1997) Zimbabwe, Harare: African (1990.1997) Africa, South "Namibia (1983-1992) Soutlz Africa: Black (1989.1992) South Africa: Indian (1989-1992) Solrtlz Africa: Mixed race (1989-1992) South Africa: White (1989-1992) Swaziland (1996-1999) EuropelUSA USA, SEER: White (1993-1997) USA, SEER: Black (1993-1997) France, 8 registries (1993-1997) The Netherlands (1993-1997) UK, England (1993-1997)
"International Incidence of Childhood Cancer Vol~lnze I1
In italics: histopathology-based registries
(1 992) Epidemiology of acute leukaemia in the Cape Province of South Africa. Leuk. Res., 16, 961-966
Slavin, G., Cameron, H.M., Forbes, C. & Morton Mitchell, R. (1970) Kaposi's sarcoma in East African children. A report of 51 cases. J. Path. Bacteriol., 100, 187-1 99
Smith, M.A., Simon, R., Strickler, H.D., McQuillan, G., Ries, L.A.G. & Linet, M.S. (1998b) Evidence that childhood acute lymphoblastic leukemia is associated with an infectious agent linked to hygiene conditions. Cancer Causes Control, 9, 285-298
Stiller, C.A. & Parkin, D.M. (1990) International variations in the incidence of childhood lymphomas. Paediat. Perinatal Epidemiol., 4, 303-324
Stiller, C.A. & Parkin, D.M. (1992) International variations in the incidence of childhood renal tumours. Br. J. Cancer, 62, 1026-1 030
Stiller, C.A., McKinney, P.A., Bunch, K.J., Bailey, C.C. & Lewis, I.J. (1991) Childhood cancer and ethnic group in Britain: a United Kingdom Children's Cancer Study Group (UKCCSG) study. Br. J. Cancer, 64,543-548
Vanier, T.M. & Pike, M.C. (1967) Leukaemia incidence in tropical Africa. Lancet, i , 512-51 3
Wabinga, H.R., Parkin, D.M., Wabwire-Mangen, F. & Nambooze, S. (2000) Trends in cancer incidence in Kyadondo County,
Uganda, 1960-1 997. Br. J. Cancer, 82, 1585-1 592 Weinreb, M., Day, P.J., Niggli, F., Green, E.K., Nyong'o, A.O.,
Othieno-Abinya, N.A., Riyat, M.S., Raafat, F. & Mann, J.R. (1996) The consistent association between Epstein-Barr virus and Hodgkin's disease in children in Kenya. Blood, 87, 3828-3836
Wessels, G. & Hesseling, P.B. (1995) Epidemiology of childhood cancer in Africa. Int. J. Pediatr. Hematol. Oncol., 2, 263-268
Wessels, G. & Hesseling, P.B. (1996) Unusual distribution of childhood cancer in Namibia. Pediatr. Hematol. Oncol., 13, 9-29
Williams, A.O. (1975) Tumors of childhood in Ibadan, Nigeria. Cancer, 36,370-378
Williams, C.K., Folami, A.O., Laditan, A.A. & Ukaejiofo, E.O. (1 982) Childhood acute leukaemia in a tropical population. Br. J, Cancer, 46, 89-94
Williams, C.K.O. & Bamgboye, E.A. (1983) Estimation of incidence of human leukaemia subtypes in an urban African population. Oncology, 40,381-386
Williams, C.K.O., Essien, E.M. & Bangboye, E.A. (1984) Trends in leukaemia incidence in Ibadan, Nigeria. In: Magrath, I., O'Conor, GT. & Ramot, B., eds, Pathogenesis of Leukemias and Lymphomas: Environmental Influences (Progress in Cancer Research and Therapy, Vol. 27), New York, Raven Press, pp 17-27
Cancer in Africa
Williams, C.K.O. (1985) Influence of life style on the pattern of Wright, D.H. (1973) Epidemiology and histology of Hodgkin's leukaemia and lymphoma subtypes among Nigerians, Leuk. disease in Uganda. Natl Cancer Inst. Monogr., 36,25-30 Res., 9, 741-745