Embed Size (px)
Citation preview

P a g e | 57
5. Demographic imperatives
A range of socio-demographic factors impacts on spatial
development. The following section gives a short overview
of the most important aspects.
5.1 Population density and distribution
The following map shows the population distribution and
densities in the municipal area. The impact of topography
on population settlement is evident from Map 20.
The population of Mogale City is heavily concentrated to
the east in and around the CDB. The largest part of the
white population is concentrated north of the M36 while
south of the M36 blacks and Asians are concentrated
south, separated from the CBD by the mining areas. There
are also concentrations of people around Magaliesburg and
Tarlton. The increased densities around the N14-R28
crossing and in the Muldersdrift area are also evident.
Map 20: Population distribution

P a g e | 58
5.2 Age distribution
Map 21 describes the age distribution per census sub-
place.
The following is evident from the age distribution patterns:
Age characteristics of the population are closely
linked to population groups. There are
proportionally more pre-primary and primary school
aged children in the urban areas than in the rural
areas. The highest proportion is in the south in the
Kagiso area. This trend is confirmed by the
population dynamics addressed later in this report.
There is a general absence of young adults in the
municipal area. The exception is the area around
the industrial area to the south west of the CBD.
There seems to be few elderly people in the
municipal area.
All areas show the majority in the economically
active age group.
The key issue to consider from the age distribution of the
people is the extent to which the life cycle needs of the
different age groups can be met through the spatial
planning process.
Map 21: Age distribution

P a g e | 59
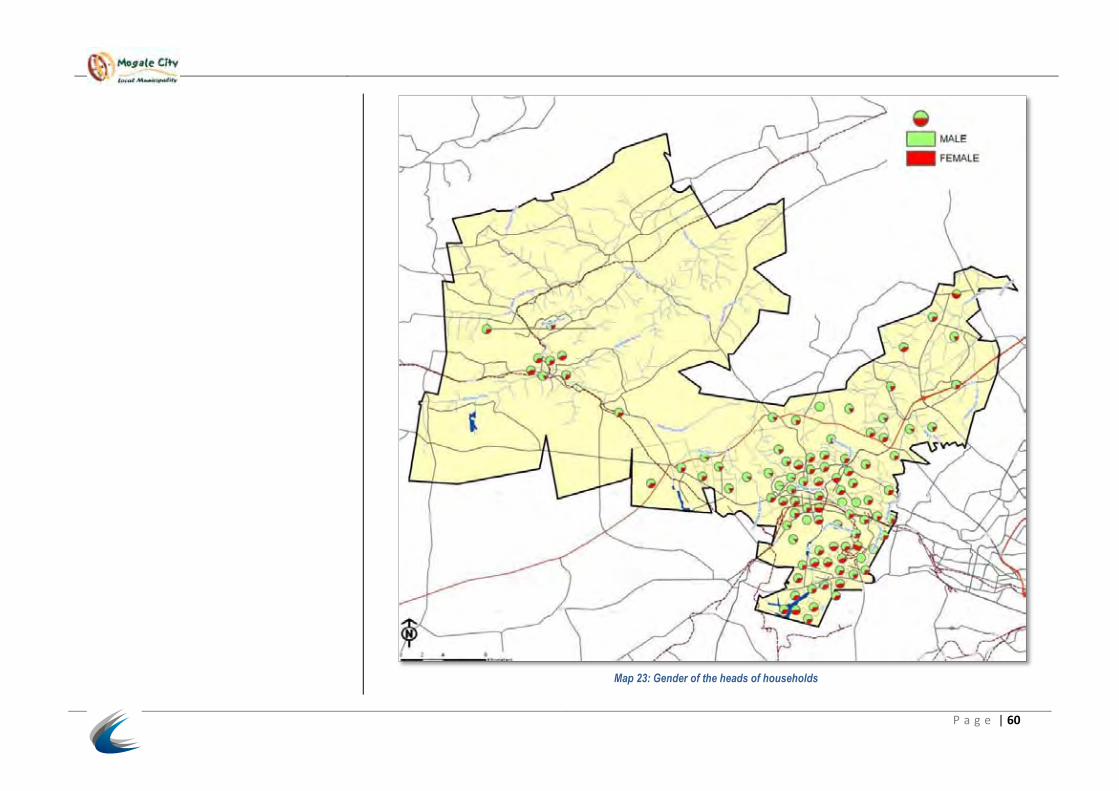
5.3 Gender distribution
The gender of the heads of households is particularly
revealing if it is viewed in conjunction with age
distribution and the general male/female ratios in the
area.
A surplus male persons in an area is usually a good
indication of migrant labour. With the mining activities
in the south of the municipal area one should have
expected indications that there are more males than
females. This is however not the case. There are
some exceptions but it is rather in the Muldersdrift and
Magaliesburg areas that this tendency is more
noticeable. The same applies to the areas immediately
to the west of the town.
Male headed households dominate across the
municipal area. However, there are substantially more
female headed households in the older urban areas
and to the south in Kagiso. The extent of male headed
households also tends to correlate with general
gender distribution patterns. A female headed
household has close links to socio-economic
conditions. If this is linked to varying household sizes it
might point a need for a range of housing types, not
only to accommodate life cycle demands but also
different demands in terms of family sizes.
Map 22: Gender distribution
P a g e | 60
Map 23: Gender of the heads of households

P a g e | 61
5.4 Level of education
The distribution of levels of education confirms the
broad socio-economic patterns in the municipal area.
The area shows high levels of people with secondary
education. There are very few areas indicating people
with no schooling. Low schooling levels are prevalent
in Kagiso, the rural areas and areas associated with
agricultural holdings. These are the areas linked with
higher demands for manual labour. The urban core
also shows some people with tertiary educations. This
is because of the nature of employment and the strong
service orientation of the CBD and adjacent areas. .
Map 24: Level of education