Embed Size (px)
Citation preview

5 Growth Mysteries in Search of a Broader Innovation Policy
William F. Maloney
Policy Research Talk
Development Research Group
World Bank
May 19, 2014

References
• “Engineers, Innovative Capacity, and Development” (2014) with Felipe Valencia Caicedo
• “Why Don’t Poor Countries Do R&D?” (2014) with Edwin Goñi Pacchioni
• “The Persistence of Fortune” (2013) with Felipe Valencia Caicedo.
• “Does What You Export Matter?: In Search of Guidance for Industrial Policies “ with Daniel Lederman
• “Immigrants, Entrepreneurship and Development”
• “Risk and Quality Upgrading” with Pravin Krishna
http://www.worldbank.org/en/about/people/william-maloney

ANCIENT HISTORY
Mystery I: Same good, different development results
0
500
1000
1500
2000
2500
3000
3500
4000
4500
5000
0
5
10
15
20
25
30
35
40
45
1870 1880 1890 1900 1910 1920 1930 1940 1950
Copper in Chile, 1870-1950: Production and Share of World Production
Chilean Production
Share of World Production

Mystery I: Same good, different development results
0
500
1000
1500
2000
2500
3000
3500
4000
4500
5000
0
5
10
15
20
25
30
35
40
45
1870 1880 1890 1900 1910 1920 1930 1940 1950
Copper in Chile, 1870-1950: Production and Share of World Production
Chilean Production
Share of World Production
Introduction of New Technologies

Mystery II: Same climate, differing abilities to introduce new products/firms
Country Year Immigrants
as % Owners Immigrants as % Population Ratio
Argentina 1900 80 30 2.7
Brazil (Sao Paulo) 1920-1950 50 16.5 3.0
Chile 1880 70 2.9 24.1
Colombia (Antioquia) 1900 5 4.7 1.1
Colombia (Barranquilla) 1888 60 9.5 6.3
Colombia (Santander) 1880 50 3 16.7
Mexico 1935 50 0.97 51.5
Ex Samurai
Japan (Shizoku) 1868-1912 50 5 10
Source: Maloney (2014)
Percentage of Firms Owned/Managed by Immigrants
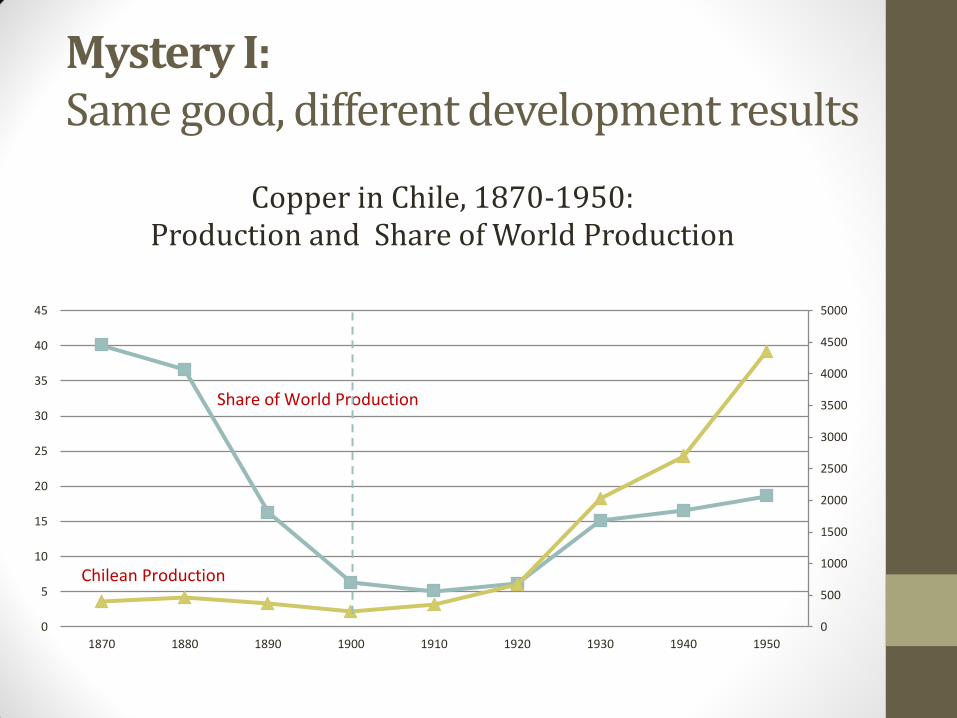
Weak innovative capacity explains why new technologies introduced by foreigners.
Fuente: Maloney y Valencia (2014)
Density of Engineers and GDP/Capita (1900)

Mystery III: Why are we not seeing catch up in export quality?
Fuente: Krishna and Maloney (2011)
Gro
wth
in
Ex
po
rt Q
ua
lity
Growth in Export Unit Values

Innovation implies risk
Risk
Ret
urn
Fuente: Krishna and Maloney (2013)
Rich Countries

Summary
• Goods can be produced with very different levels of sophistication and quality.
• Not enough to focus on narrow measures of technological progress- # engineers, patents, R&D.
• Management
• Financial Markets etc?

MYSTERY IV: WHY DON’T POOR COUNTRIES DO R&D?

Estimated returns to R&D are very high
US firm level/industry data- social returns
Bloom et al (2013) US 55%
Griffith, Redding, Van Reenen (2004) US 57%
Jones and Williams (1998) US 28%
Jones and Williams (1998): US should quadruple investment in RD
Doraszelski and Jaumandreu (2013) Spain 40%

…and get higher with distance from the frontier Two Faces of R&D (Cohen and Levinthal 1989)
Invention
Learning\Catch-up
Poor countries should have much greater returns
Griffith, Redding, Van Reenen (2004)
Dist. Frontier RoR R&D
USA -.18 57%
UK -.53 77%
Italy -.73 88%
What should the rate of return be for Korea (-1.33), Malaysia (-2.28), Indonesia (-3.74)? 200%? 300%?

When we consider that
1. 50% of growth is attributed to factor productivity a large part of which is probably innovation.
2. Innovation is essential for the diversification of the economy, and taking advantage of FTAs.
3. Key to address Dutch Disease and resource curse.
4. Essential to generate more challenging jobs.
To paraphrase Lucas (1978), it’s hard to think of anything else!!!!!

Mystery IV: So why don’t poor countries do more R&D?
R&D/GDP vs. Income/capita

Returns to R&D vs Distance to the Frontier
Distance to the economic frontier (z)
Poor countries Advanced Innovators
Source: Goñi, and Maloney (2014)
Distance from the technological frontier
Because maybe they don’t get Griffith et al’s high returns to R&D!

MISSING INGREDIENTS IN THE NATIONAL INNOVATION SYSTEM?

The Greater National Innovation System

SUPPLY SIDE

The Greater National Innovation System
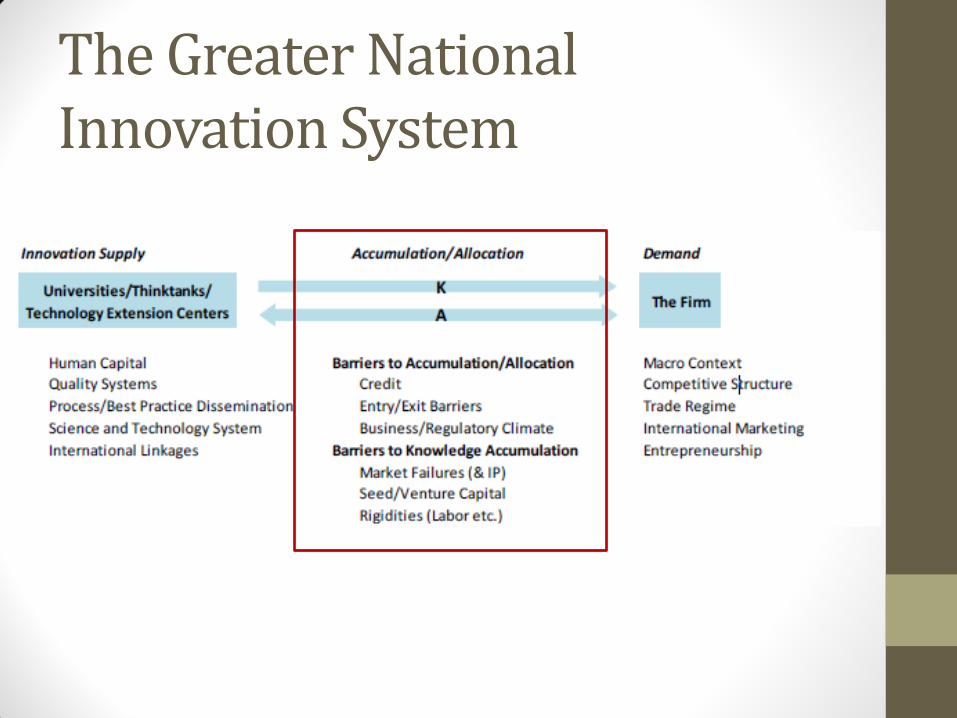
The Greater National Innovation System

BARRIERS TO ACCUMULATION

Policy Issues
• Measurement
• Can’t focus on accumulation of Knowledge capital without overall system of accumulation
• Whole business climate
• Is the financial sector diversifying risk?
• Entry and Exit. Bankruptcy laws?
• Social attitudes toward failure?
• Clear property rights in distributing winnings?

DEMAND SIDE

The Greater National Innovation System

Management Quality and GDP
Source: Bloom, Van Reenen et al World Management Survey 2014

Sub-Dimensions of Management
Fuente: Bloom et al. 2010, DNP, WB
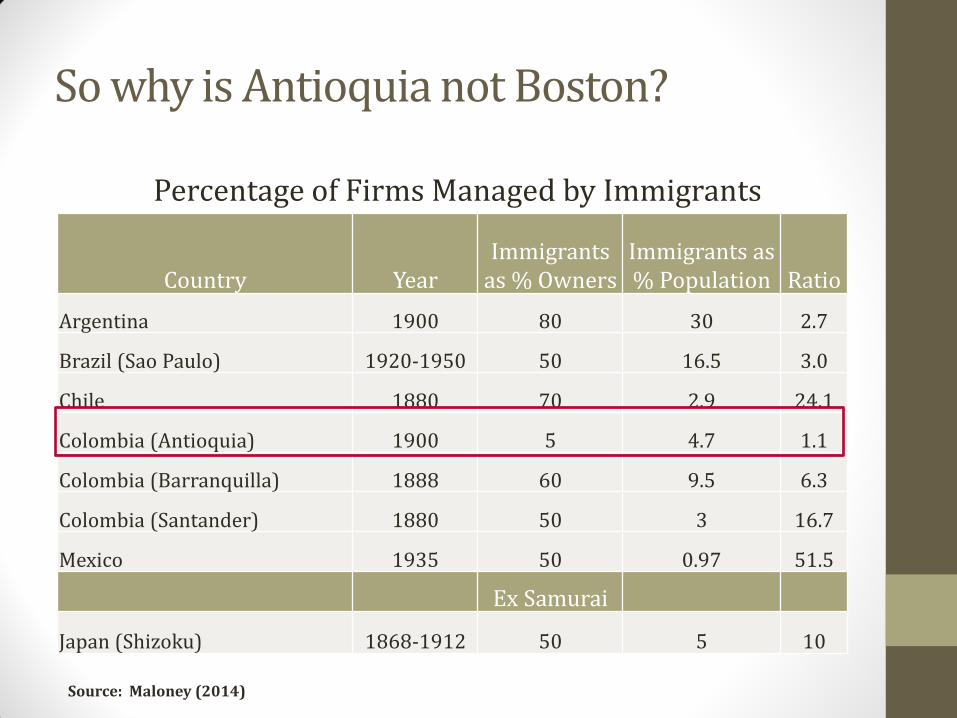
So why is Antioquia not Boston?
Country Year Immigrants
as % Owners Immigrants as % Population Ratio
Argentina 1900 80 30 2.7
Brazil (Sao Paulo) 1920-1950 50 16.5 3.0
Chile 1880 70 2.9 24.1
Colombia (Antioquia) 1900 5 4.7 1.1
Colombia (Barranquilla) 1888 60 9.5 6.3
Colombia (Santander) 1880 50 3 16.7
Mexico 1935 50 0.97 51.5
Ex Samurai
Japan (Shizoku) 1868-1912 50 5 10
Source: Maloney (2014)
Percentage of Firms Managed by Immigrants

Antioquia lost its Mojo!!!
0
1
2
3
4
Sco
re
Management Monitor Target People
Fuente: DNP, BM (2014)

Antioquia is where US South was in 1900..lack of demand for innovation?
Fuente: Maloney y Valencia (2014)
Density of Engineers and GDP/Capita (1900)
Antioquia 1976=40

Mean all countries China's Value Rank (of 21
countries)
Management Average of all management questions 2.9391 2.8757 14
Sub-subcomponents
O1 Introduction to Lean (Modern) Manufacturing 2.8464 2.5917 16
O2 Rationale for Lean (Modern) Manufacturing 2.9161 2.6095 17
M1 Process Documentation 3.1904 2.9588 16
M2 Performance Tracking 3.3595 3.3941 8
M3 Performance Review 3.3236 3.4647 6
M4 Performance Dialogue 3.1674 2.9647 18
M5 Consequence Management 3.1082 2.8765 19
T1 Type of Targets 2.9063 2.5706 19
T2 Interconnection of Goals 3.0623 3.0882 9
T3 Time Horizon 2.8714 2.6294 17
T4 Goals are Stretching 2.9744 2.7588 17
T5 Clarity of Goals and Measurement 2.6862 3.1824 1
P1 Instilling a Talent Mindset 2.4244 2.5647 7
P2 Building a High-Performance Culture 2.5484 3.0765 2
P3 Making Room for Talent 3.0080 2.8765 14
P4 Developing Talent 2.9888 2.7353 17
PI5 Creating a Distinctive EVP 3.0270 2.9941 13
P6 Retaining Talent 2.4948 2.4294 11
See Annex for detail on categories. Rank: 1 correspond to the country with the highest value
China, too, lacks management skills for innovative firms
Source: Maloney 2014

In sum
• Latin America
• Potemkin Industrialization? No capital goods, no potential for advance?
• Never developed either managerial or innovative capacity
• Doomed to do whatever it does in a low-tech fashion?
• China???

Mystery V: So why does China do so much R&D?: China imported US and Taiwan’s NIS!
Source: Branstetter 2012
USTPO Grants to China

Policies
• Japan, Korea, Singapore: All employ programs supporting management-Kaizen, 5S- see SME’s being left behind by Chaebol and MNCs
• Japan: National Productivity Center; Deming Quality System.
• Korea: The Small and Medium Industries Promotion program
• Singapore: Local Industry Upgrading Program (LIUP)
• India: (Bloom, McKenzie… 2013)
• Colombia Technolology Extension Pilot (Maloney, McKenzie, Iacovone)
• Establish the foundation to progressively better adoption of new technologies.

Conclusion
• Perhaps ad nauseum: Not what, but how you produce
• Effort to improve productivity through adoption of existing technologies is one of central development tasks
• Requires a broad view of the National Innovation System.

Fin