Embed Size (px)
Citation preview
JANE AMBACHTSHEERAMSTERDAM, 15 JANUARY 2020
CFA Society VBA Netherlands
5 YEARS AFTER COP 21, WHERE ARE WE AND WHAT LIES AHEAD?
marketing communication
1. TAKEAWAYS FROM COP 25
2. WHY WILL THERE BE AN INEVITABLE POLICY RESPONSE?
3. THE INEVITABLE POLICY RESPONSE
4. FROM TOP DOWN TO BOTTOM UP: INTRODUCING EROCI
5. TAKE AWAYS FOR INVESTORS WITH A 3-5 YEAR TIME HORIZON
CONTENTS
15/01/2020 25 years after COP 21, where are we and what lies ahead?
TAKEAWAYS FROM COP 251.
35 years after COP 21, where are we and what lies ahead? 15/01/2020
Takeaways from COP 25
45 years after COP 21, where are we and what lies ahead? 15/01/2020
Source: Google
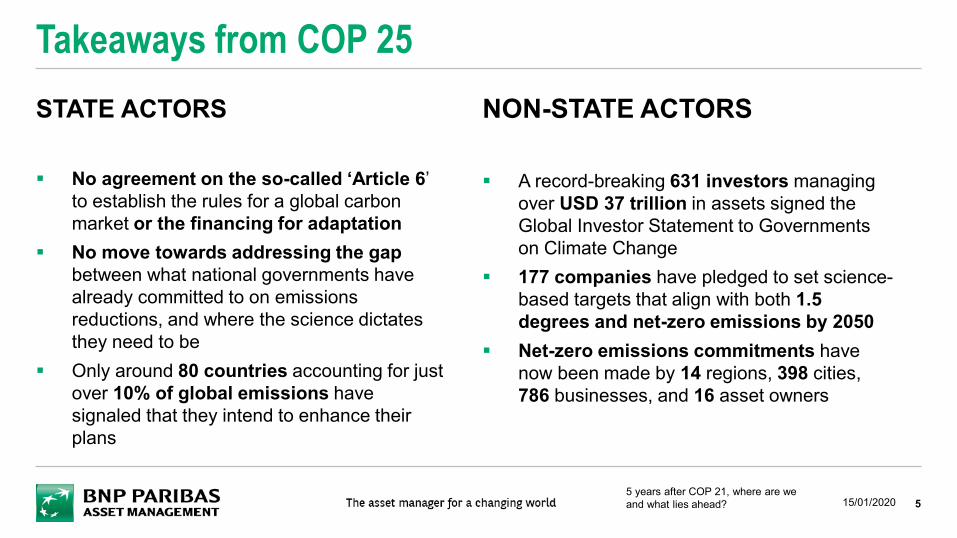
STATE ACTORS
No agreement on the so-called ‘Article 6’ to establish the rules for a global carbon market or the financing for adaptation
No move towards addressing the gap between what national governments have already committed to on emissions reductions, and where the science dictates they need to be
Only around 80 countries accounting for just over 10% of global emissions have signaled that they intend to enhance their plans
Takeaways from COP 25
5
NON-STATE ACTORS
A record-breaking 631 investors managing over USD 37 trillion in assets signed the Global Investor Statement to Governments on Climate Change
177 companies have pledged to set science-based targets that align with both 1.5 degrees and net-zero emissions by 2050
Net-zero emissions commitments have now been made by 14 regions, 398 cities, 786 businesses, and 16 asset owners
5 years after COP 21, where are we and what lies ahead? 15/01/2020

6
Today’s focus is on … A forecast policy response to climate
Developedby
5 years after COP 21, where are we and what lies ahead? 15/01/2020
Trademark, copyright, and other intellectual property rights are and remain the property of their respective owners.
WHY WILL THERE BE AN INEVITABLE POLICY RESPONSE?
2.
75 years after COP 21, where are we and what lies ahead? 15/01/2020
8
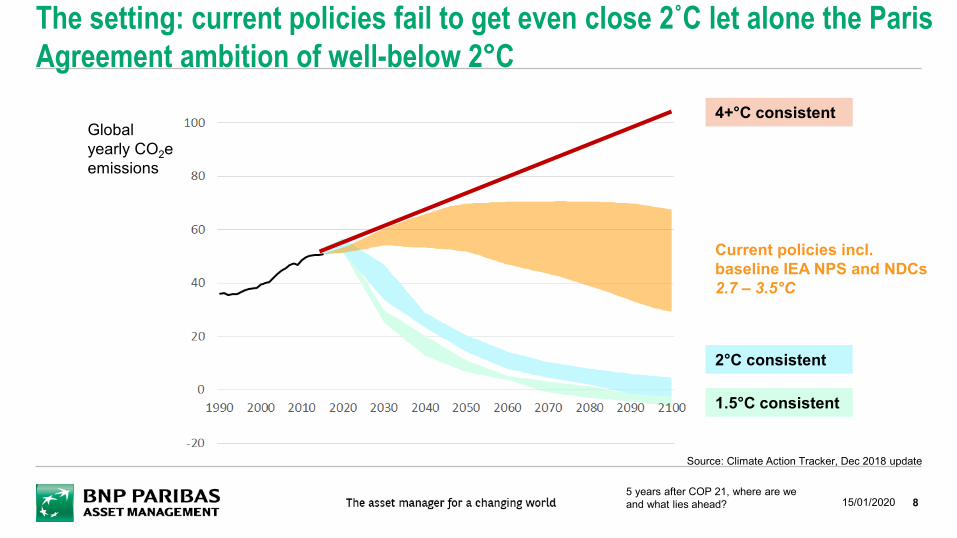
The setting: current policies fail to get even close 2˚C let alone the Paris Agreement ambition of well-below 2°C
Source: Climate Action Tracker, Dec 2018 update
Current policies incl. baseline IEA NPS and NDCs2.7 – 3.5°C
2°C consistent
1.5°C consistent
Global yearly CO2e emissions
4+°C consistent
5 years after COP 21, where are we and what lies ahead? 15/01/2020
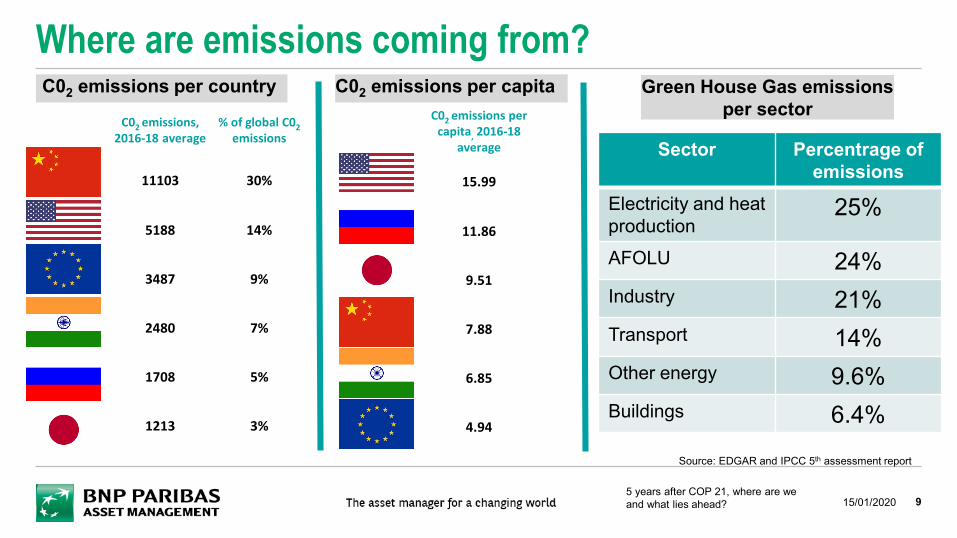
Where are emissions coming from?
9
Source: EDGAR and IPCC 5th assessment report
C02 emissions, 2016-18 average
% of global C02 emissions
11103 30%
5188 14%
3487 9%
2480 7%
1708 5%
1213 3%
C02 emissions per country C02 emissions per capita C02 emissions per
capita, 2016-18 average
15.99
11.86
9.51
7.88
6.85
4.94
Green House Gas emissionsper sector
Sector Percentrage of emissions
Electricity and heatproduction
25%
AFOLU 24%Industry 21%Transport 14%Other energy 9.6%Buildings 6.4%
5 years after COP 21, where are we and what lies ahead? 15/01/2020
10
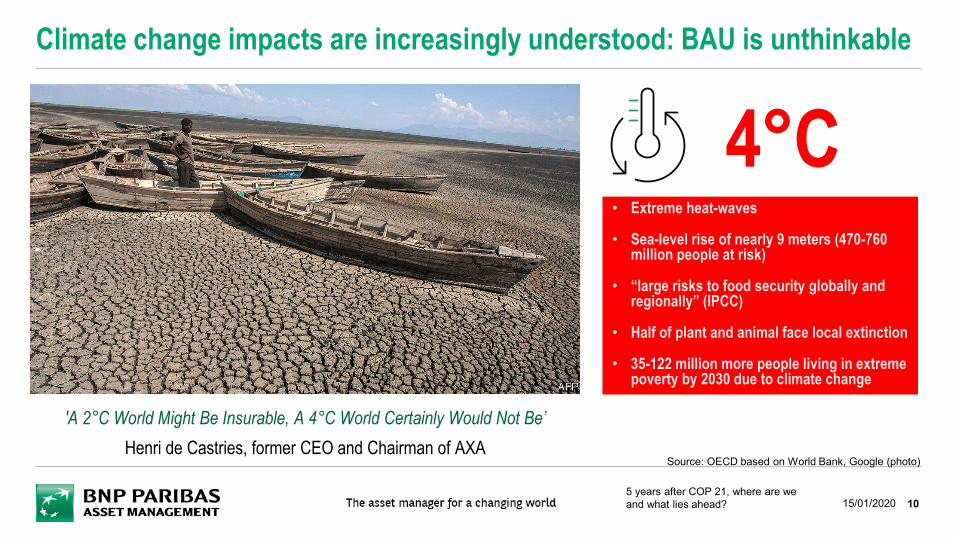
Climate change impacts are increasingly understood: BAU is unthinkable
'A 2°C World Might Be Insurable, A 4°C World Certainly Would Not Be’ Henri de Castries, former CEO and Chairman of AXA
• Extreme heat-waves
• Sea-level rise of nearly 9 meters (470-760 million people at risk)
• “large risks to food security globally and regionally” (IPCC)
• Half of plant and animal face local extinction
• 35-122 million more people living in extreme poverty by 2030 due to climate change
4°C
Source: OECD based on World Bank, Google (photo)
5 years after COP 21, where are we and what lies ahead? 15/01/2020
11
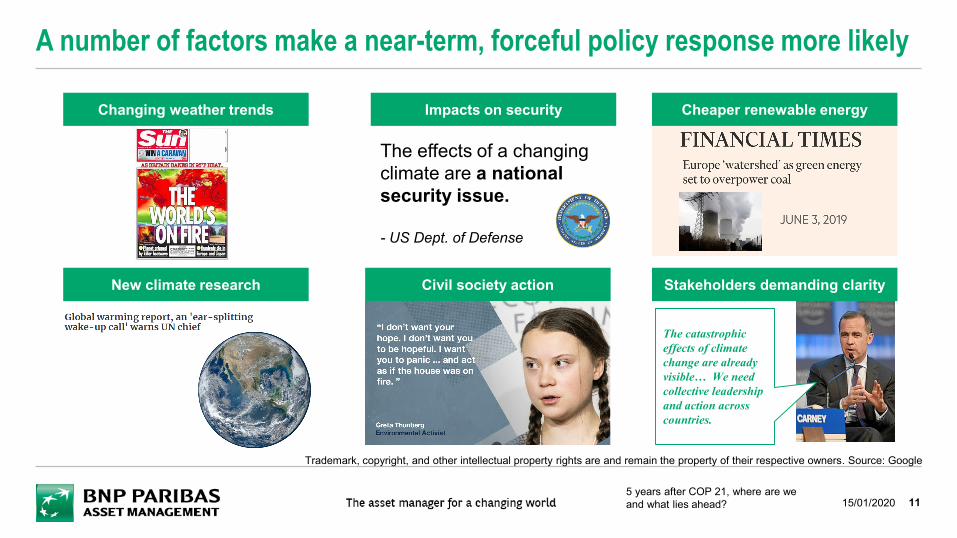
A number of factors make a near-term, forceful policy response more likely
The catastrophic effects of climate change are already visible… We need collective leadership and action across countries.
Changing weather trends
New climate research
Impacts on security Cheaper renewable energy
Stakeholders demanding clarity Civil society action
The effects of a changing climate are a national security issue.
- US Dept. of Defense
5 years after COP 21, where are we and what lies ahead? 15/01/2020
Trademark, copyright, and other intellectual property rights are and remain the property of their respective owners. Source: Google
THE INEVITABLE POLICY RESPONSE 3.
125 years after COP 21, where are we and what lies ahead? 15/01/2020
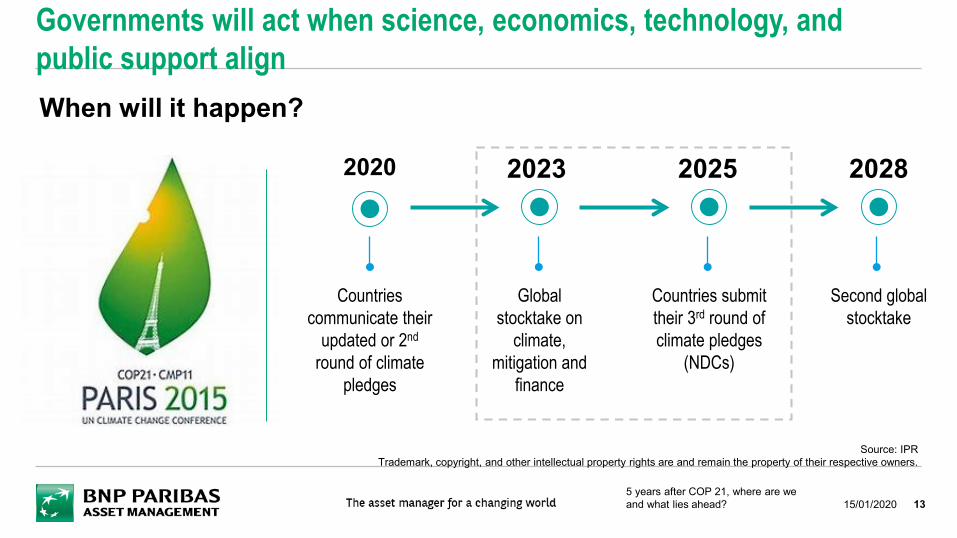
Governments will act when science, economics, technology, and public support align
13
When will it happen?
2020
Countries communicate their
updated or 2nd
round of climate pledges
2025
Countries submit their 3rd round of climate pledges
(NDCs)
2023
Global stocktake on
climate, mitigation and
finance
2028
Second global stocktake
Source: IPRTrademark, copyright, and other intellectual property rights are and remain the property of their respective owners.
5 years after COP 21, where are we and what lies ahead? 15/01/2020
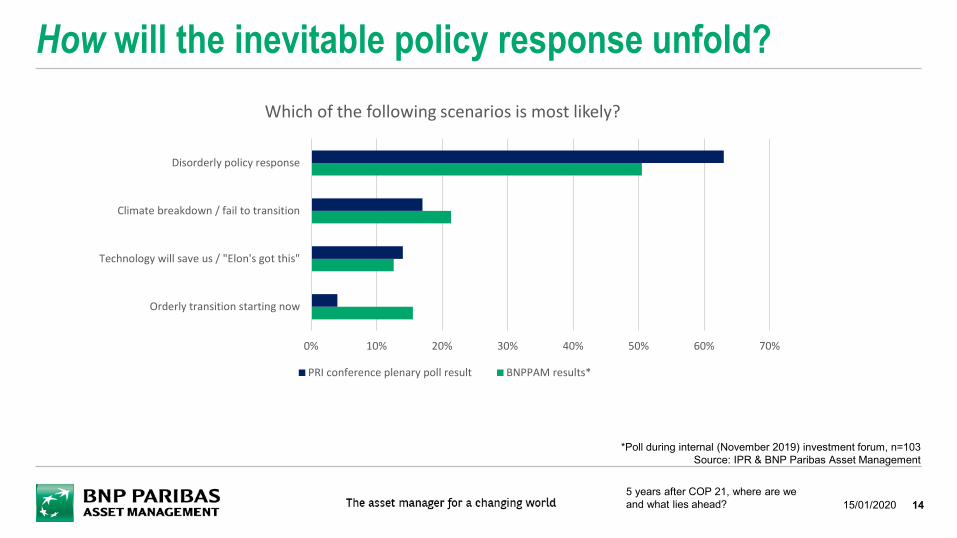
How will the inevitable policy response unfold?
14
0% 10% 20% 30% 40% 50% 60% 70%
Orderly transition starting now
Technology will save us / "Elon's got this"
Climate breakdown / fail to transition
Disorderly policy response
Which of the following scenarios is most likely?
PRI conference plenary poll result BNPPAM results*
*Poll during internal (November 2019) investment forum, n=103Source: IPR & BNP Paribas Asset Management
5 years after COP 21, where are we and what lies ahead? 15/01/2020
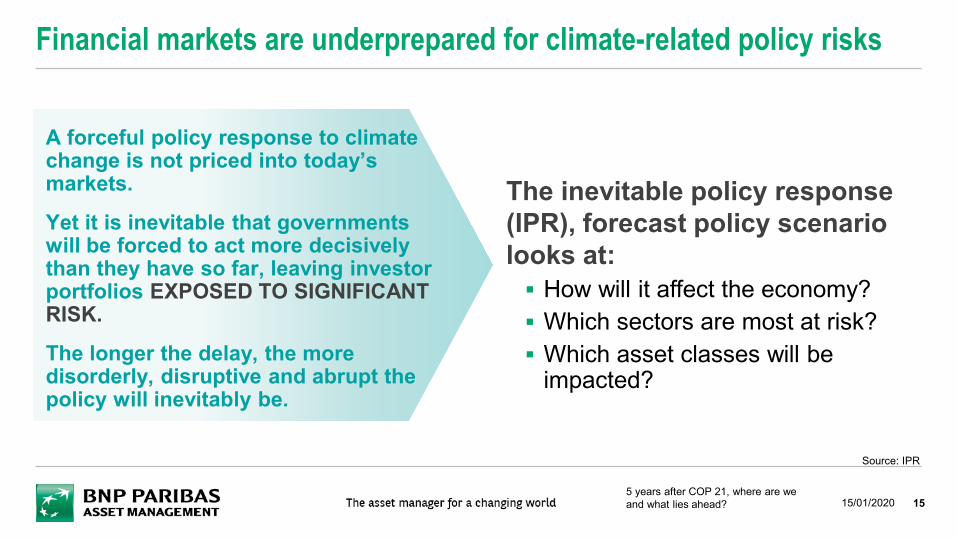
The inevitable policy response (IPR), forecast policy scenario looks at: How will it affect the economy? Which sectors are most at risk? Which asset classes will be
impacted?
Financial markets are underprepared for climate-related policy risks
15
A forceful policy response to climate change is not priced into today’s markets.
Yet it is inevitable that governments will be forced to act more decisively than they have so far, leaving investor portfolios EXPOSED TO SIGNIFICANT RISK.
The longer the delay, the more disorderly, disruptive and abrupt the policy will inevitably be.
Source: IPR
5 years after COP 21, where are we and what lies ahead? 15/01/2020
16
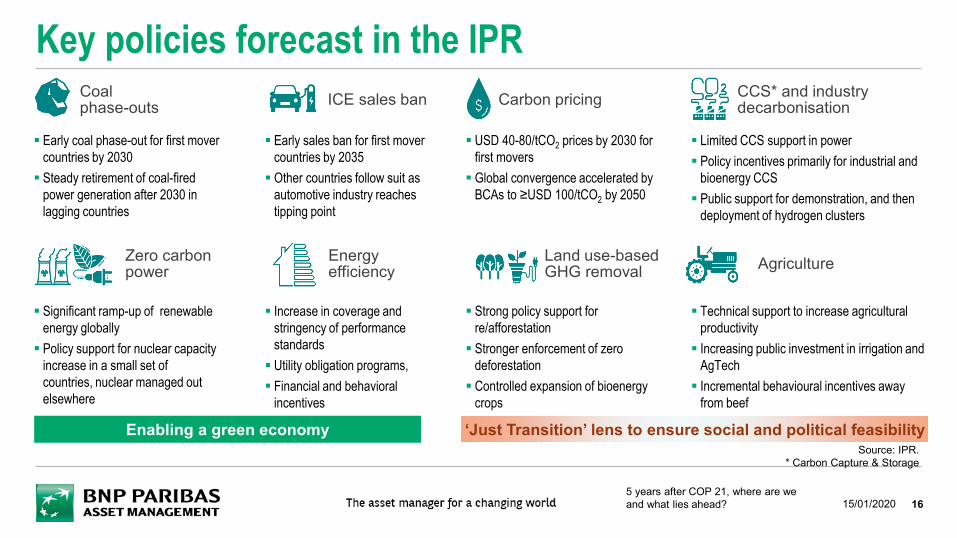
Key policies forecast in the IPR Coalphase-outs ICE sales ban Carbon pricing CCS* and industry
decarbonisation
Zero carbon power
Energy efficiency
Land use-based GHG removal Agriculture
Early sales ban for first mover countries by 2035 Other countries follow suit as
automotive industry reaches tipping point
Early coal phase-out for first mover countries by 2030 Steady retirement of coal-fired
power generation after 2030 in lagging countries
USD 40-80/tCO2 prices by 2030 for first movers Global convergence accelerated by
BCAs to ≥USD 100/tCO2 by 2050
Limited CCS support in power Policy incentives primarily for industrial and
bioenergy CCS Public support for demonstration, and then
deployment of hydrogen clusters
Increase in coverage and stringency of performance standards Utility obligation programs, Financial and behavioral
incentives
Significant ramp-up of renewable energy globally Policy support for nuclear capacity
increase in a small set of countries, nuclear managed out elsewhere
Technical support to increase agricultural productivity Increasing public investment in irrigation and
AgTech Incremental behavioural incentives away
from beef
Strong policy support for re/afforestation Stronger enforcement of zero
deforestation Controlled expansion of bioenergy
crops
Enabling a green economy ‘Just Transition’ lens to ensure social and political feasibilitySource: IPR.
* Carbon Capture & Storage
5 years after COP 21, where are we and what lies ahead? 15/01/2020
17
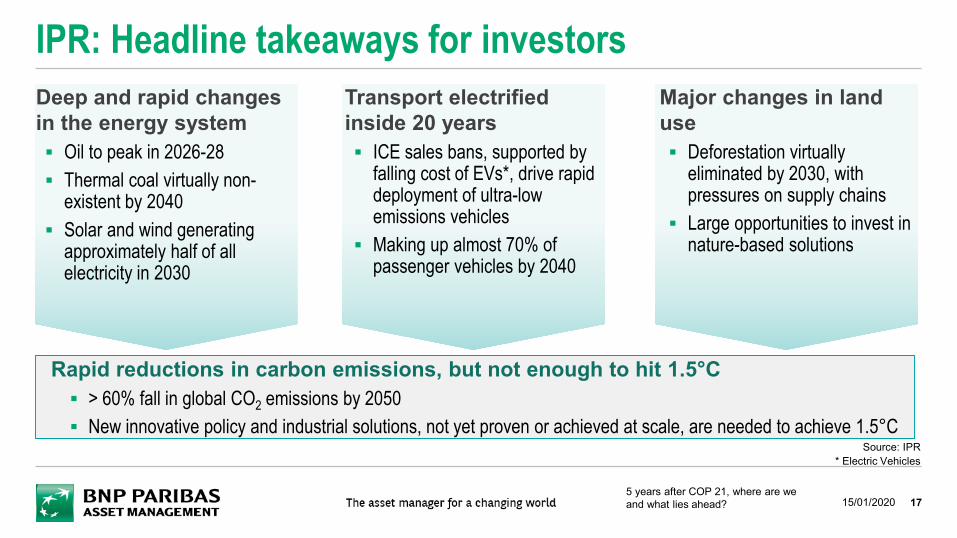
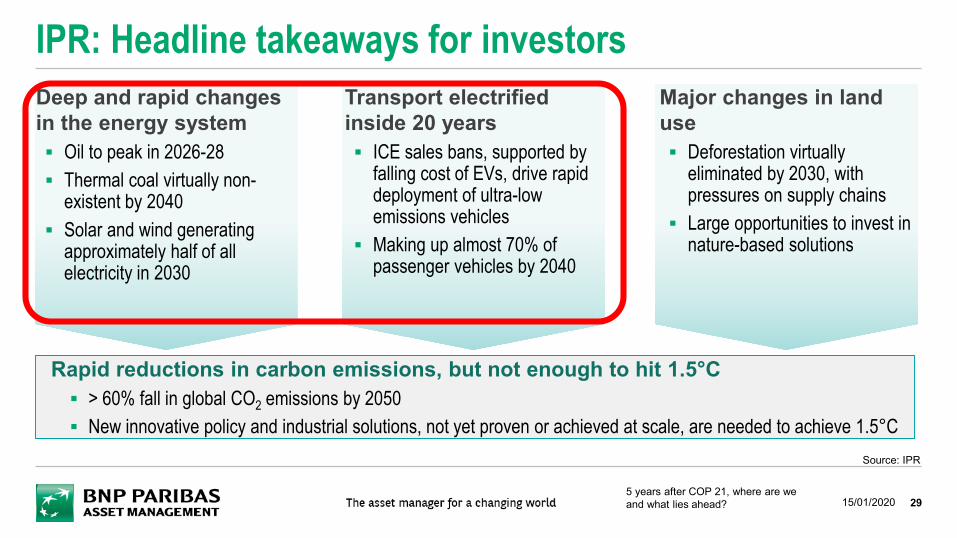
IPR: Headline takeaways for investorsDeep and rapid changesin the energy system Oil to peak in 2026-28 Thermal coal virtually non-
existent by 2040 Solar and wind generating
approximately half of all electricity in 2030
Transport electrified inside 20 years ICE sales bans, supported by
falling cost of EVs*, drive rapid deployment of ultra-low emissions vehicles
Making up almost 70% of passenger vehicles by 2040
Major changes in land use Deforestation virtually
eliminated by 2030, with pressures on supply chains
Large opportunities to invest in nature-based solutions
Rapid reductions in carbon emissions, but not enough to hit 1.5°C > 60% fall in global CO2 emissions by 2050 New innovative policy and industrial solutions, not yet proven or achieved at scale, are needed to achieve 1.5°C
Source: IPR* Electric Vehicles
5 years after COP 21, where are we and what lies ahead? 15/01/2020
18
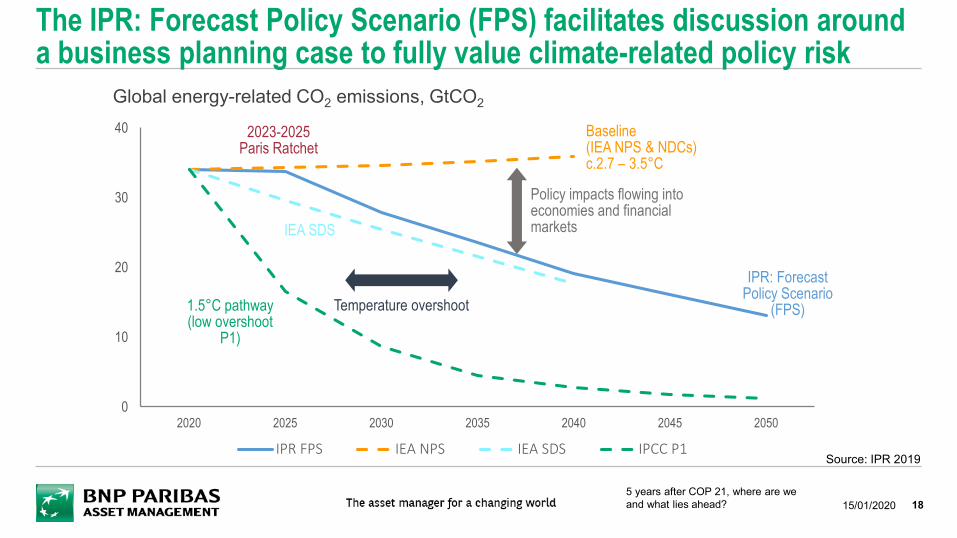
The IPR: Forecast Policy Scenario (FPS) facilitates discussion around a business planning case to fully value climate-related policy risk
0
10
20
30
40
2020 2025 2030 2035 2040 2045 2050
IPR FPS IEA NPS IEA SDS IPCC P1
2023-2025Paris Ratchet
Baseline(IEA NPS & NDCs)c.2.7 – 3.5°C
Policy impacts flowing into economies and financial markets
IPR: Forecast Policy Scenario
(FPS)Temperature overshoot1.5°C pathway (low overshoot
P1)
IEA SDS
Global energy-related CO2 emissions, GtCO2
Source: IPR 2019
5 years after COP 21, where are we and what lies ahead? 15/01/2020
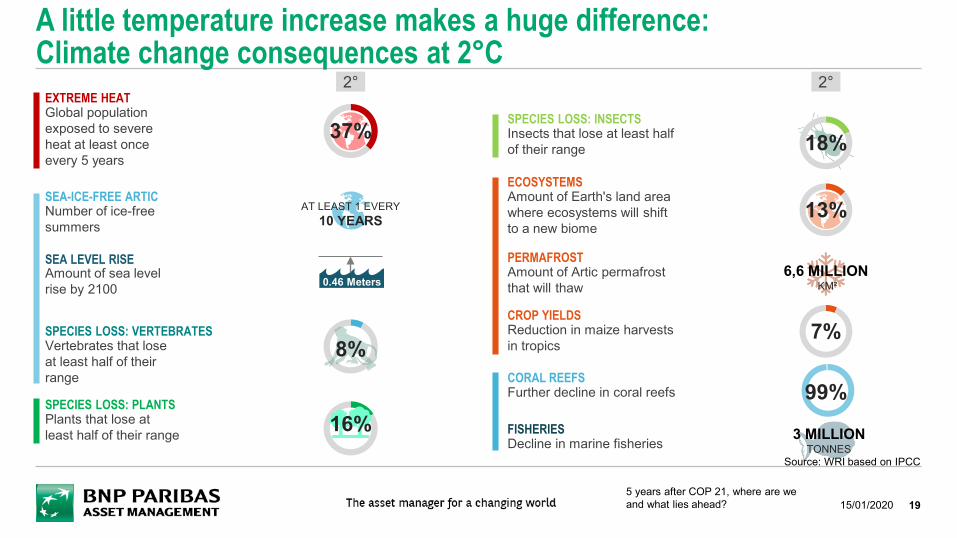
A little temperature increase makes a huge difference:Climate change consequences at 2°C
EXTREME HEATGlobal population exposed to severe heat at least once every 5 years
SEA-ICE-FREE ARTICNumber of ice-free summers
SEA LEVEL RISEAmount of sea level rise by 2100
SPECIES LOSS: VERTEBRATESVertebrates that lose at least half of their range
SPECIES LOSS: PLANTSPlants that lose at least half of their range
SPECIES LOSS: INSECTSInsects that lose at least half of their range
ECOSYSTEMSAmount of Earth's land area where ecosystems will shift to a new biome
PERMAFROSTAmount of Artic permafrost that will thaw
CROP YIELDSReduction in maize harvests in tropics
CORAL REEFSFurther decline in coral reefs
FISHERIESDecline in marine fisheries
2°
0.46 Meters
37%
AT LEAST 1 EVERY10 YEARS
8%
16%
18%
13%
99%
3 MILLIONTONNES
6,6 MILLIONKM²
7%
2°
Source: WRI based on IPCC
195 years after COP 21, where are we and what lies ahead? 15/01/2020
20
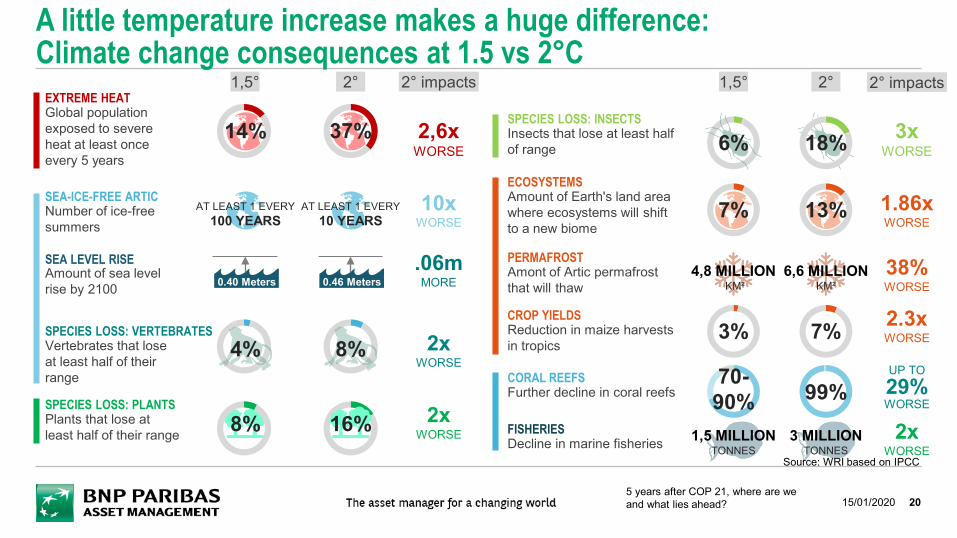
A little temperature increase makes a huge difference:Climate change consequences at 1.5 vs 2°C
EXTREME HEATGlobal population exposed to severe heat at least once every 5 years
SEA-ICE-FREE ARTICNumber of ice-free summers
SEA LEVEL RISEAmount of sea level rise by 2100
SPECIES LOSS: VERTEBRATESVertebrates that lose at least half of their range
SPECIES LOSS: PLANTSPlants that lose at least half of their range
SPECIES LOSS: INSECTSInsects that lose at least half of range
ECOSYSTEMSAmount of Earth's land area where ecosystems will shift to a new biome
PERMAFROSTAmont of Artic permafrost that will thaw
CROP YIELDSReduction in maize harvests in tropics
CORAL REEFSFurther decline in coral reefs
FISHERIESDecline in marine fisheries
0.40 Meters
14%
AT LEAST 1 EVERY100 YEARS
4%
8%
6%
7%
70-90%
1,5 MILLIONTONNES
4,8 MILLIONKM²
1,5° 2°
0.46 Meters
37%
AT LEAST 1 EVERY10 YEARS
8%
16%
18%
13%
99%
3 MILLIONTONNES
6,6 MILLIONKM²
3% 7%
2,6xWORSE
10xWORSE
.06mMORE
2xWORSE
2xWORSE
2° impacts 1,5° 2°
3xWORSE
1.86xWORSE
UP TO29%WORSE
2xWORSE
2° impacts
38%WORSE
2.3xWORSE
Source: WRI based on IPCC
5 years after COP 21, where are we and what lies ahead? 15/01/2020
21
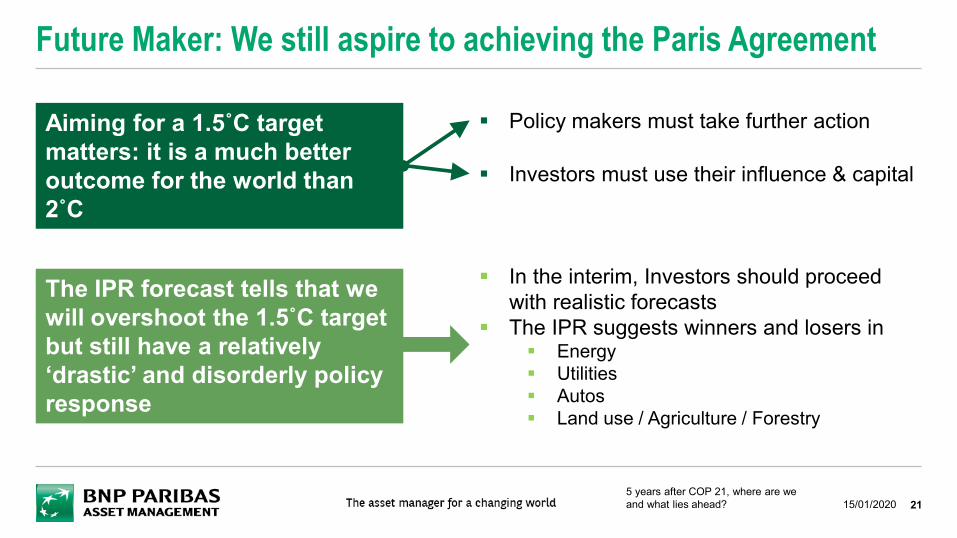
Future Maker: We still aspire to achieving the Paris Agreement
The IPR forecast tells that we will overshoot the 1.5˚C target but still have a relatively ‘drastic’ and disorderly policy response
Aiming for a 1.5˚C target matters: it is a much better outcome for the world than 2˚C
Policy makers must take further action
Investors must use their influence & capital
In the interim, Investors should proceed with realistic forecasts
The IPR suggests winners and losers in Energy Utilities Autos Land use / Agriculture / Forestry
5 years after COP 21, where are we and what lies ahead? 15/01/2020

FROM TOP DOWN TO BOTTOM UP: INTRODUCING EROCI
4.
225 years after COP 21, where are we and what lies ahead? 15/01/2020
23
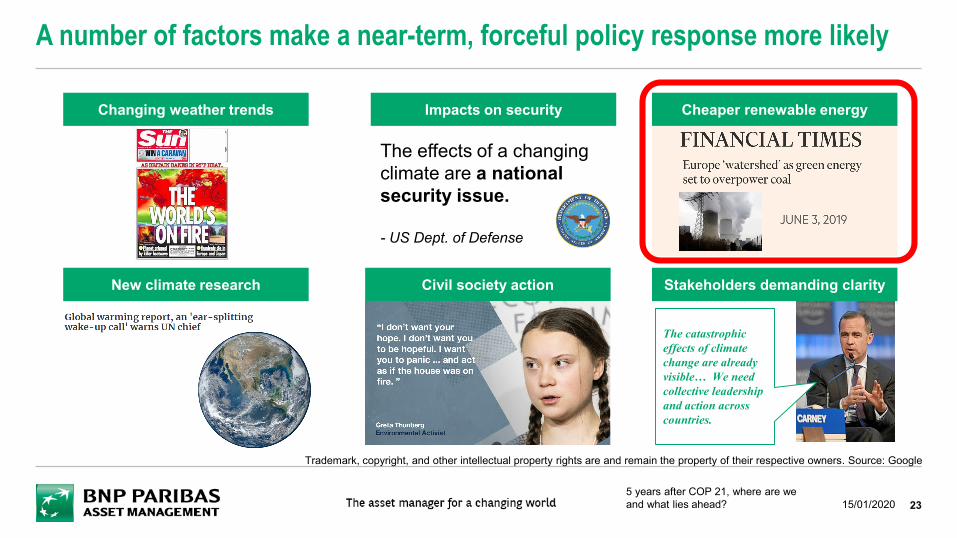
A number of factors make a near-term, forceful policy response more likely
The catastrophic effects of climate change are already visible… We need collective leadership and action across countries.
Changing weather trends
New climate research
Impacts on security Cheaper renewable energy
Stakeholders demanding clarity Civil society action
The effects of a changing climate are a national security issue.
- US Dept. of Defense
5 years after COP 21, where are we and what lies ahead? 15/01/2020
Trademark, copyright, and other intellectual property rights are and remain the property of their respective owners. Source: Google
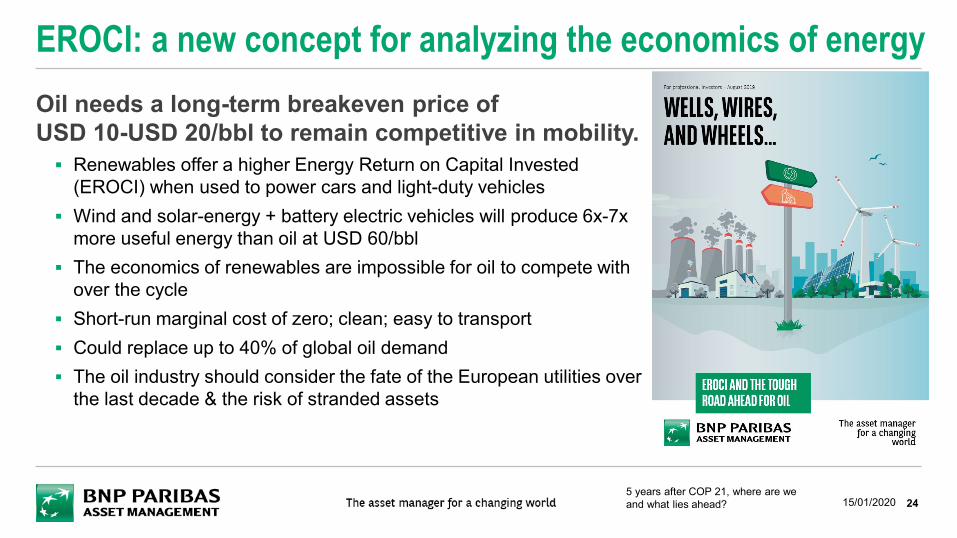
Oil needs a long-term breakeven price of USD 10-USD 20/bbl to remain competitive in mobility. Renewables offer a higher Energy Return on Capital Invested
(EROCI) when used to power cars and light-duty vehicles Wind and solar-energy + battery electric vehicles will produce 6x-7x
more useful energy than oil at USD 60/bbl The economics of renewables are impossible for oil to compete with
over the cycle Short-run marginal cost of zero; clean; easy to transport Could replace up to 40% of global oil demand The oil industry should consider the fate of the European utilities over
the last decade & the risk of stranded assets
EROCI: a new concept for analyzing the economics of energy
245 years after COP 21, where are we and what lies ahead? 15/01/2020
25
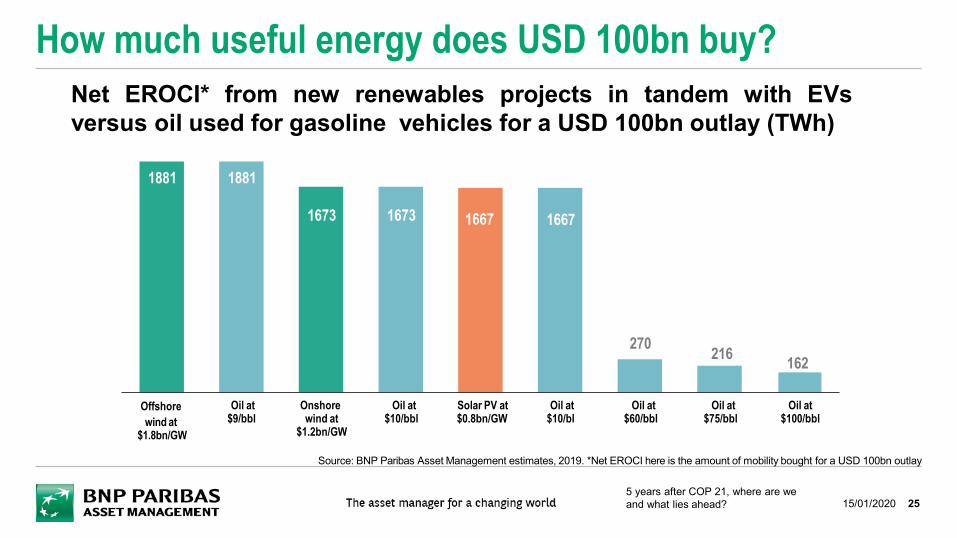
How much useful energy does USD 100bn buy?
1881 1881
1673 1673 1667 1667
270 216 162
Offshorewind at
$1.8bn/GW
Oil at$9/bbl
Onshore wind at
$1.2bn/GW
Oil at$10/bbl
Solar PV at$0.8bn/GW
Oil at$10/bl
Oil at$60/bbl
Oil at$75/bbl
Oil at$100/bbl
Net EROCI* from new renewables projects in tandem with EVsversus oil used for gasoline vehicles for a USD 100bn outlay (TWh)
Source: BNP Paribas Asset Management estimates, 2019. *Net EROCI here is the amount of mobility bought for a USD 100bn outlay
5 years after COP 21, where are we and what lies ahead? 15/01/2020
26
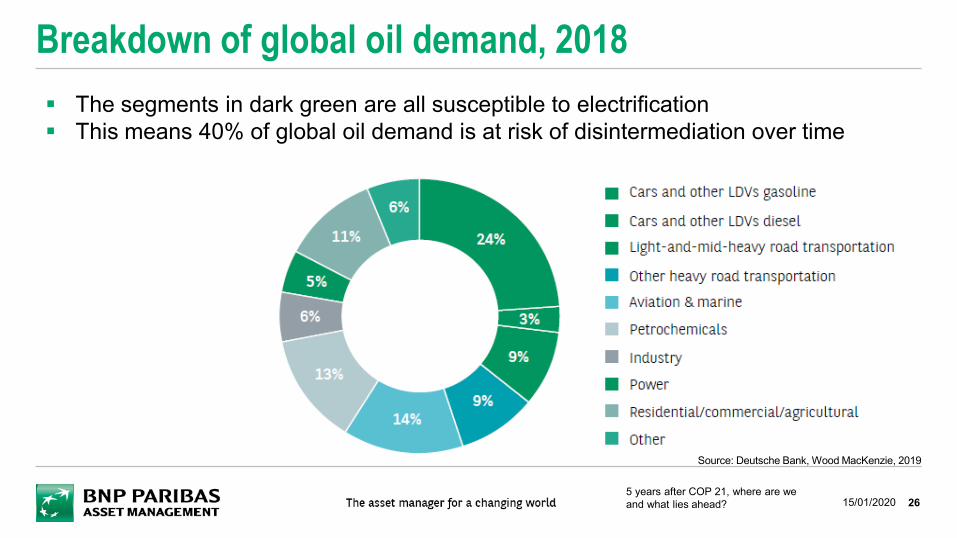
Breakdown of global oil demand, 2018 The segments in dark green are all susceptible to electrification This means 40% of global oil demand is at risk of disintermediation over time
Source: Deutsche Bank, Wood MacKenzie, 2019
5 years after COP 21, where are we and what lies ahead? 15/01/2020
27
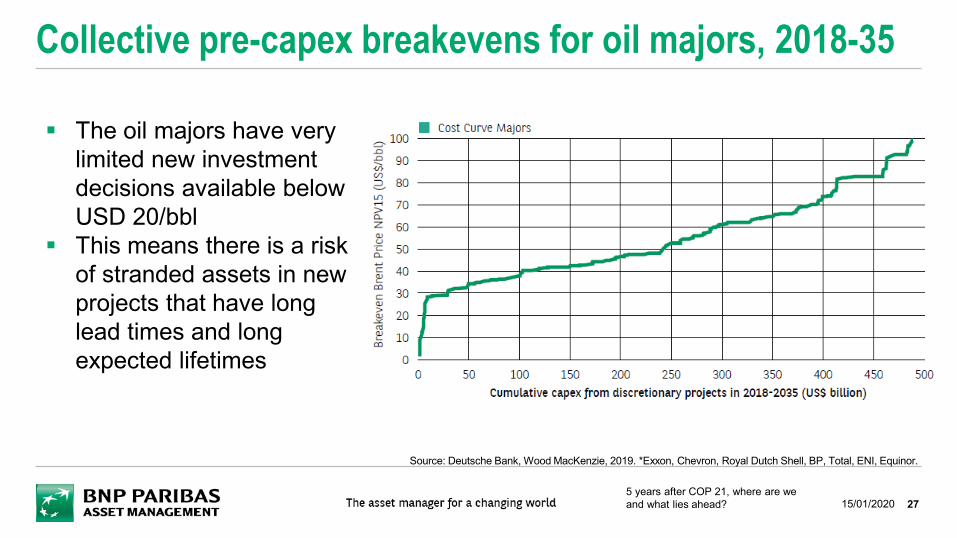
Collective pre-capex breakevens for oil majors, 2018-35
The oil majors have very limited new investment decisions available below USD 20/bbl
This means there is a risk of stranded assets in new projects that have long lead times and long expected lifetimes
Source: Deutsche Bank, Wood MacKenzie, 2019. *Exxon, Chevron, Royal Dutch Shell, BP, Total, ENI, Equinor.
5 years after COP 21, where are we and what lies ahead? 15/01/2020
CONCLUSION5.
285 years after COP 21, where are we and what lies ahead? 15/01/2020
29
IPR: Headline takeaways for investorsDeep and rapid changesin the energy system Oil to peak in 2026-28 Thermal coal virtually non-
existent by 2040 Solar and wind generating
approximately half of all electricity in 2030
Transport electrified inside 20 years ICE sales bans, supported by
falling cost of EVs, drive rapid deployment of ultra-low emissions vehicles
Making up almost 70% of passenger vehicles by 2040
Major changes in land use Deforestation virtually
eliminated by 2030, with pressures on supply chains
Large opportunities to invest in nature-based solutions
Rapid reductions in carbon emissions, but not enough to hit 1.5°C > 60% fall in global CO2 emissions by 2050 New innovative policy and industrial solutions, not yet proven or achieved at scale, are needed to achieve 1.5°C
Source: IPR
5 years after COP 21, where are we and what lies ahead? 15/01/2020
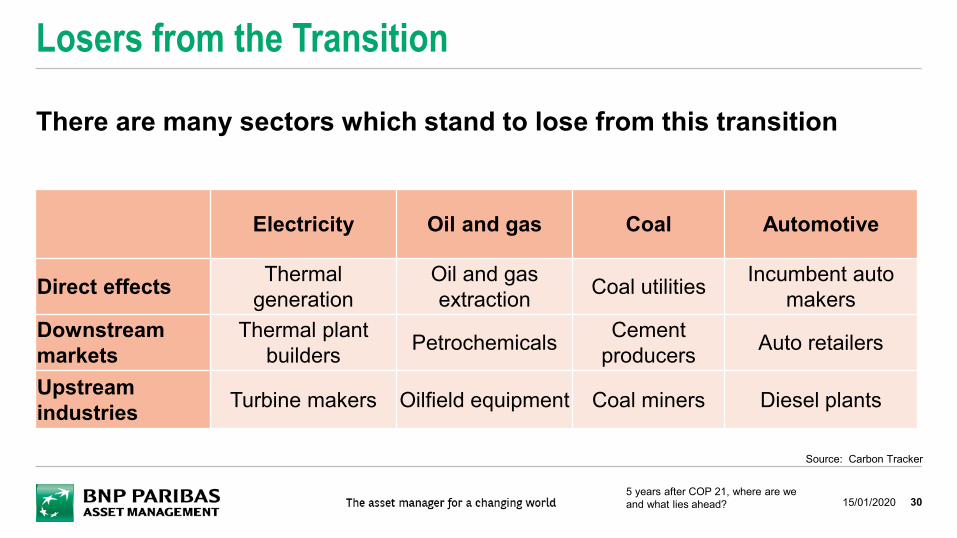
Losers from the Transition
30
There are many sectors which stand to lose from this transition
Electricity Oil and gas Coal Automotive
Direct effects Thermal generation
Oil and gas extraction Coal utilities Incumbent auto
makersDownstream markets
Thermal plant builders Petrochemicals Cement
producers Auto retailers
Upstream industries Turbine makers Oilfield equipment Coal miners Diesel plants
Source: Carbon Tracker
5 years after COP 21, where are we and what lies ahead? 15/01/2020
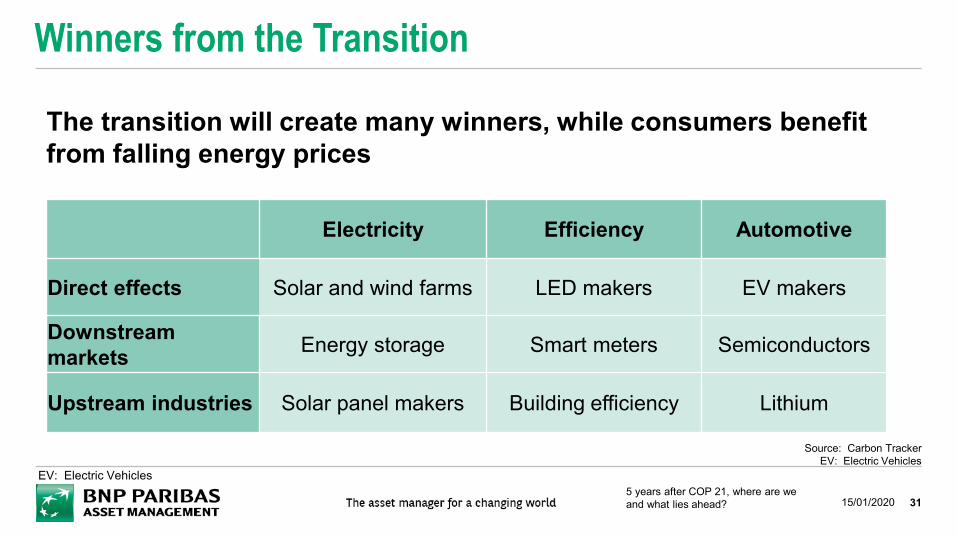
Winners from the Transition
31
The transition will create many winners, while consumers benefit from falling energy prices
Electricity Efficiency Automotive
Direct effects Solar and wind farms LED makers EV makers
Downstream markets Energy storage Smart meters Semiconductors
Upstream industries Solar panel makers Building efficiency Lithium
Source: Carbon TrackerEV: Electric Vehicles
EV: Electric Vehicles5 years after COP 21, where are we and what lies ahead? 15/01/2020
32
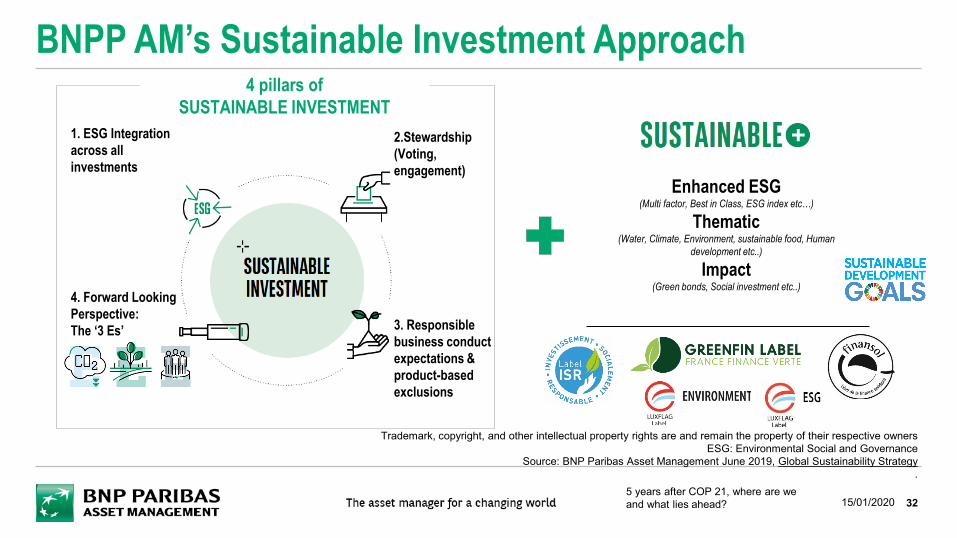
BNPP AM’s Sustainable Investment Approach
1. ESG Integration across all investments
2.Stewardship(Voting, engagement)
4. Forward Looking Perspective: The ‘3 Es’ 3. Responsible
business conduct expectations & product-based exclusions
4 pillars of SUSTAINABLE INVESTMENT
Enhanced ESG(Multi factor, Best in Class, ESG index etc…)
Thematic(Water, Climate, Environment, sustainable food, Human
development etc..)
Impact(Green bonds, Social investment etc..)
Trademark, copyright, and other intellectual property rights are and remain the property of their respective ownersESG: Environmental Social and Governance
Source: BNP Paribas Asset Management June 2019, Global Sustainability Strategy.
5 years after COP 21, where are we and what lies ahead? 15/01/2020
BNP PARIBAS ASSET MANAGEMENT France, “the investment management company,” is a simplified joint stock company with its registered office at 1 boulevard Haussmann 75009 Paris, France, RCS Paris 319 378 832, registered with the “Autorité des marchés financiers” under number GP 96002. This material is issued and has been prepared by the investment management company.This material is produced for information purposes only and does not constitute:1. an offer to buy nor a solicitation to sell, nor shall it form the basis of or be relied upon in connection with any contract or commitment whatsoever or2. investment advice.Opinions included in this material constitute the judgement of the investment management company at the time specified and may be subject to change without notice. The investment management company is not obliged to update or alter the information or opinions contained within this material. Investors should consult their own legal and tax advisors in respect of legal, accounting, domicile and tax advice prior to investing in the financial instrument(s) in order to make an independent determination of the suitability and consequences of an investment therein, if permitted. Please note that different types of investments, if contained within this material, involve varying degrees of risk and there can be no assurance that any specific investment may either be suitable, appropriate or profitable for an investor’s investment portfolio.Given the economic and market risks, there can be no assurance that the financial instrument(s) will achieve its/their investment objectives. Returns may be affected by, amongst other things, investment strategies or objectives of the financial instrument(s) and material market and economic conditions, including interest rates, market terms and general market conditions. The different strategies applied to the financial instruments may have a significant effect on the results portrayed in this material.All information referred to in the present document is available on www.bnpparibas-am.com
Disclaimer
335 years after COP 21, where are we and what lies ahead? 15/01/2020
BNP PARIBAS ASSET MANAGEMENTHerengracht 5951017 CE [email protected]: +31 20 527 5223