Embed Size (px)
Citation preview

04/18/2304/18/23
Property Claim ServicesProperty Claim Services
The PCS Process for Identifying The PCS Process for Identifying Catastrophes and Estimating Catastrophes and Estimating
the Related Lossesthe Related Losses
ByByGary Kerney, AIC, RPAGary Kerney, AIC, RPAAssistant Vice PresidentAssistant Vice President
PCSPCS

04/18/2304/18/23
IntroductionIntroduction
What is a Catastrophe?What is a Catastrophe?
The PCS process for estimating cat lossesThe PCS process for estimating cat losses
What’s ahead?What’s ahead?
Where and What are the challenges?Where and What are the challenges?

04/18/2304/18/23
What Is a Catastrophe?What Is a Catastrophe?
Catastrophe DefinitionCatastrophe Definition An event causing $25 million or more of An event causing $25 million or more of
insured property damage insured property damage ANDAND affecting a significant number of affecting a significant number of
policyholders and insurerspolicyholders and insurers

04/18/2304/18/23
What Is a Catastrophe?What Is a Catastrophe?
Catastrophe Definition Changes Over Catastrophe Definition Changes Over TimeTime
1949 to December 1982 - $1 million1949 to December 1982 - $1 million
1983 to December 1996 - $5 million1983 to December 1996 - $5 million
Since January 1, 1997 - $25 millionSince January 1, 1997 - $25 million
04/18/2304/18/23
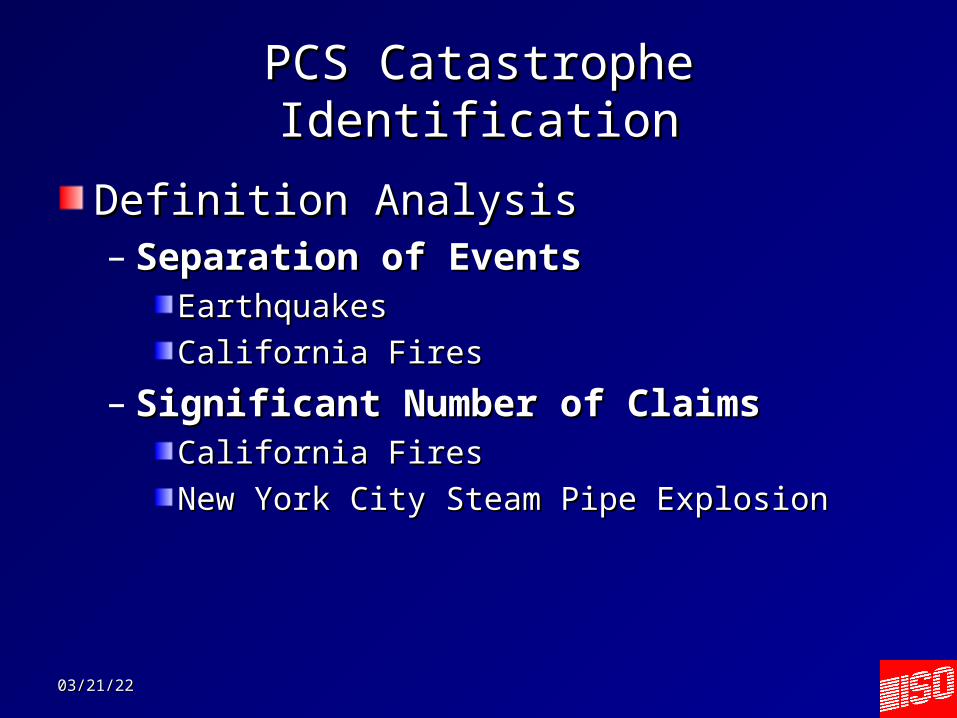
PCS Catastrophe IdentificationPCS Catastrophe Identification
Definition AnalysisDefinition Analysis– Separation of EventsSeparation of Events
EarthquakesEarthquakes
California Fires California Fires
– Significant Number of ClaimsSignificant Number of ClaimsCalifornia FiresCalifornia Fires
New York City Steam Pipe ExplosionNew York City Steam Pipe Explosion
04/18/2304/18/23
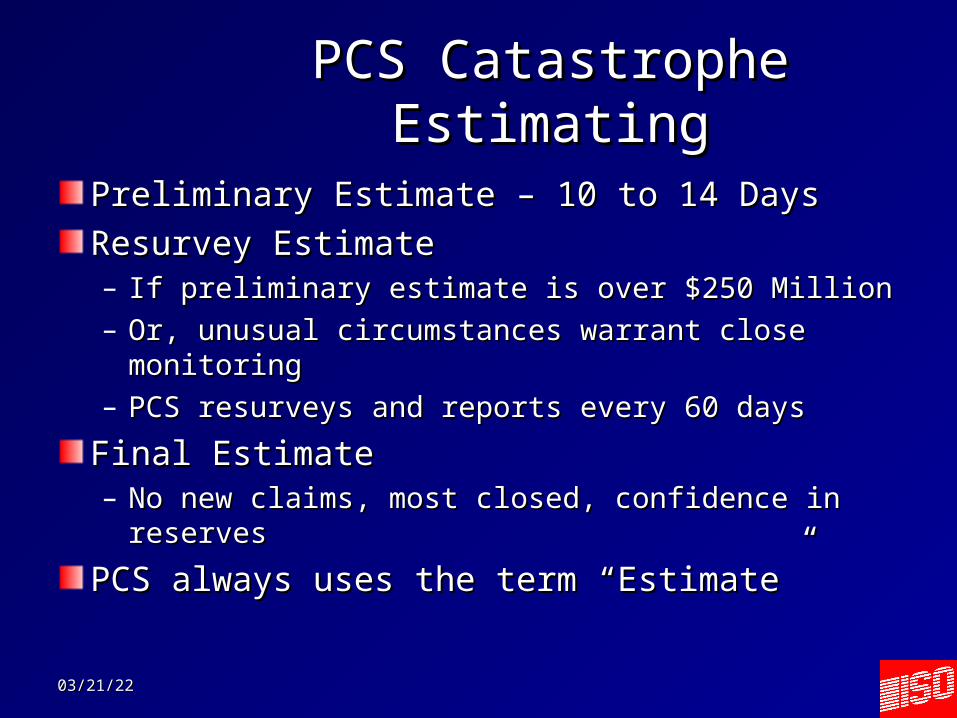
PCS Catastrophe EstimatingPCS Catastrophe Estimating
Preliminary Estimate – 10 to 14 DaysPreliminary Estimate – 10 to 14 Days
Resurvey EstimateResurvey Estimate– If preliminary estimate is over $250 MillionIf preliminary estimate is over $250 Million– Or, unusual circumstances warrant close monitoringOr, unusual circumstances warrant close monitoring– PCS resurveys and reports every 60 daysPCS resurveys and reports every 60 days
Final EstimateFinal Estimate– No new claims, most closed, confidence in reservesNo new claims, most closed, confidence in reserves
PCS always uses the term “Estimate”PCS always uses the term “Estimate”

04/18/2304/18/23
PCS Sources for Loss InformationPCS Sources for Loss Information
Insurer Loss ReportsInsurer Loss Reports
Market Share AnalysisMarket Share Analysis
On-Site Surveys or FlyoversOn-Site Surveys or Flyovers
National Insurance Risk Profile DataNational Insurance Risk Profile Data
ConfidentialityConfidentiality
Estimate CompilationsEstimate Compilations

04/18/2304/18/23
Insured Property Damage by PCS Storm FamilyInsured Property Damage by PCS Storm Family1950 to 20081950 to 2008
Storm FamilyStorm Family Estimated Insured LossEstimated Insured Loss
Hurricane (88)Hurricane (88) $135,556,445,790$135,556,445,790
Wind and Thunderstorm Event (1198)Wind and Thunderstorm Event (1198) $96,725,197,458$96,725,197,458
Winter StormWinter Storm $23,678,656,159$23,678,656,159
Fire - OtherFire - Other $20,050,753,604$20,050,753,604
EarthquakeEarthquake $13,964,150,000$13,964,150,000
Wildland FireWildland Fire $6,467,348,000$6,467,348,000
Tropical StormTropical Storm $3,974,320,000$3,974,320,000
RiotRiot $970,250,000$970,250,000
Water DamageWater Damage $300,000,000$300,000,000
Utility Service DisruptionUtility Service Disruption $180,000,000$180,000,000
Volcanic EruptionVolcanic Eruption $27,000,000$27,000,000
Total Insured Loss (1536)Total Insured Loss (1536) $301,104,121,011$301,104,121,011

04/18/2304/18/23
The PCS Top 10The PCS Top 10All Hurricanes except WTC and NorthridgeAll Hurricanes except WTC and Northridge
YEARYEAR CAT #CAT # STORM FAMILYSTORM FAMILY ESTIMATED ESTIMATED LOSS LOSS
20052005 4949 Hurricane KatrinaHurricane Katrina $41,100,000,000$41,100,000,000
20012001 4848 Fire - OtherFire - Other $18,778,500,000$18,778,500,000
19921992 2727 Hurricane AndrewHurricane Andrew $15,500,000,000$15,500,000,000
19941994 7878 EarthquakeEarthquake $12,500,000,000$12,500,000,000
20082008 6060 Hurricane IkeHurricane Ike $11,500,000,000$11,500,000,000
20052005 5454 Hurricane WilmaHurricane Wilma $10,300,000,000$10,300,000,000
20042004 2626 Hurricane CharleyHurricane Charley $7,475,000,000$7,475,000,000
20042004 3030 Hurricane IvanHurricane Ivan $7,110,000,000$7,110,000,000
20052005 5151 Hurricane RitaHurricane Rita $5,627,200,000$5,627,200,000
20042004 2828 Hurricane FrancesHurricane Frances $4,595,000,000$4,595,000,000

PCS Resurvey EstimatesPCS Resurvey Estimates
04/18/2304/18/23
Survey # 2 3 4 5 6 7 8 9 10 11 Final Est ($bn)1 Katrina (49-05) 10.9% 0.0% 6.5% 0.0% 0.0% 0.2% 0.0% 0.0% 1.0% 0.0% 41.12 Northridge (78-94) 80.0% 22.2% 30.9% 25.0% 15.6% 7.7% 4.5% 6.8% 0.0% 12.53 Wilma (54-05) 38.0% 11.1% 10.2% 0.0% 0.0% 0.0% 0.0% 10.34 Rita (51-05) 6.0% 0.0% 1.4% 5.4% 5.8% 0.0% 0.0% 5.65 Charley (26-04) 0.0% 9.9% 0.0% 0.0% 0.0% 7.56 Frances (28-04) 0.0% 3.7% 0.0% 0.0% 0.0% 4.67 W&T (61-02) 22.1% 50.3% 19.8% 8.8% 0.0% 1.78 WTC (48-01) 0.0% 22.6% 0.0% -7.7% 18.89 Ivan (30-04) 18.3% 0.0% 0.0% 0.0% 7.1
10 Jeanne (29-04) 6.0% 6.3% 0.0% 0.0% 3.711 W&T (38-01) 193.1% 11.8% 0.0% 15.8% 2.212 W&T (88-03) 101.9% 2.4% 0.0% 3.213 Georges (69-98) 15.9% 0.0% 0.0% 314 TS Allison (44-01) 104.9% 0.0% 0.0% 2.515 Floyd (97-99) 35.8% 8.9% 0.0% 216 Isabel (95-03) 44.0% 0.0% 0.0% 1.717 Andrew (27-92) 37.2% 44.9% 15.518 Gustav (58-08) 13.2% 0.0% 2.219 Ike (60-08)* 31.5% 7.9% 11.520 Opal (54-95) 0.0% 2.121 Oakland Hills (87-91) 41.7% 1.722 WS (46-93) 7.7% 1.823 Hugo (18-89) 5.3% 4.2
Avg 35.4% 10.6% 4.3% 4.3% 3.1% 2.0% 1.1% 3.4% 0.5% 0.0% 166.5

04/18/2304/18/23
Catastrophe Loss EstimatingCatastrophe Loss Estimating
PCS figures are not adjusted for inflation –PCS figures are not adjusted for inflation –– Stated in the dollar value of the year of Stated in the dollar value of the year of
occurrence, or in “nominal” dollarsoccurrence, or in “nominal” dollars
Also not adjusted for demographic or other Also not adjusted for demographic or other changes over timechanges over time– Value of comparing Elena (1985) to Katrina Value of comparing Elena (1985) to Katrina
(2005)?(2005)?
04/18/2304/18/23
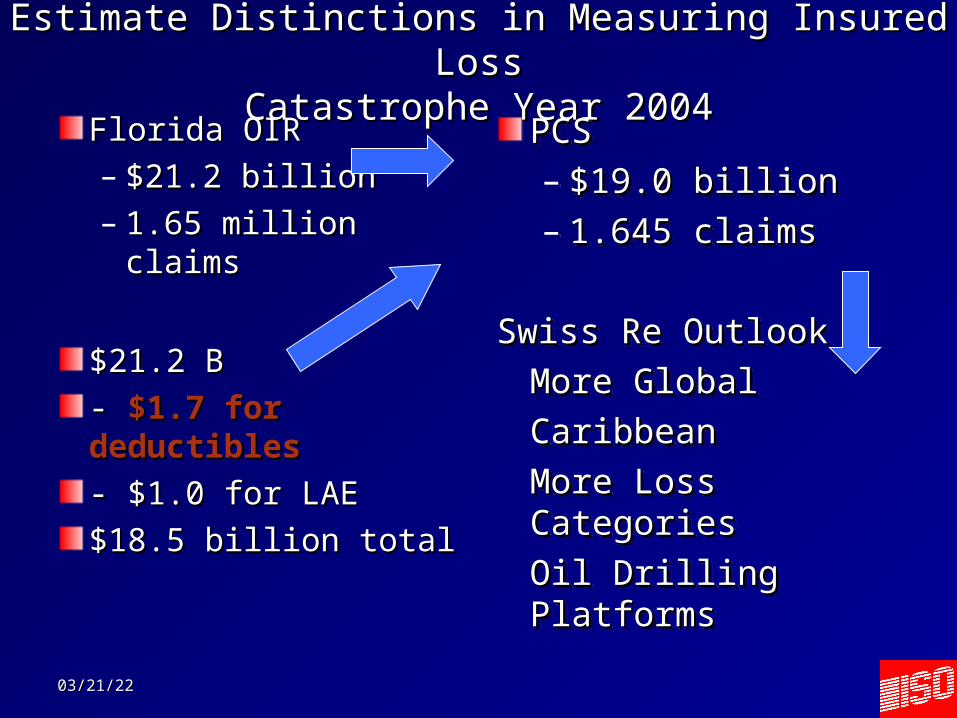
Estimate Distinctions in Measuring Insured LossEstimate Distinctions in Measuring Insured LossCatastrophe Year 2004Catastrophe Year 2004
PCSPCS– $19.0 billion$19.0 billion– 1.645 claims 1.645 claims
Swiss Re OutlookSwiss Re Outlook
More GlobalMore Global
CaribbeanCaribbean
More Loss CategoriesMore Loss Categories
Oil Drilling Oil Drilling PlatformsPlatforms
PCSPCS– $19.0 billion$19.0 billion– 1.645 claims 1.645 claims
Swiss Re OutlookSwiss Re Outlook
More GlobalMore Global
CaribbeanCaribbean
More Loss CategoriesMore Loss Categories
Oil Drilling Oil Drilling PlatformsPlatforms
Florida OIRFlorida OIR– $21.2 billion$21.2 billion– 1.65 million claims1.65 million claims
$21.2 B$21.2 B
- - $1.7 for $1.7 for deductiblesdeductibles
- $1.0 for LAE- $1.0 for LAE
$18.5 billion total$18.5 billion total
04/18/2304/18/23
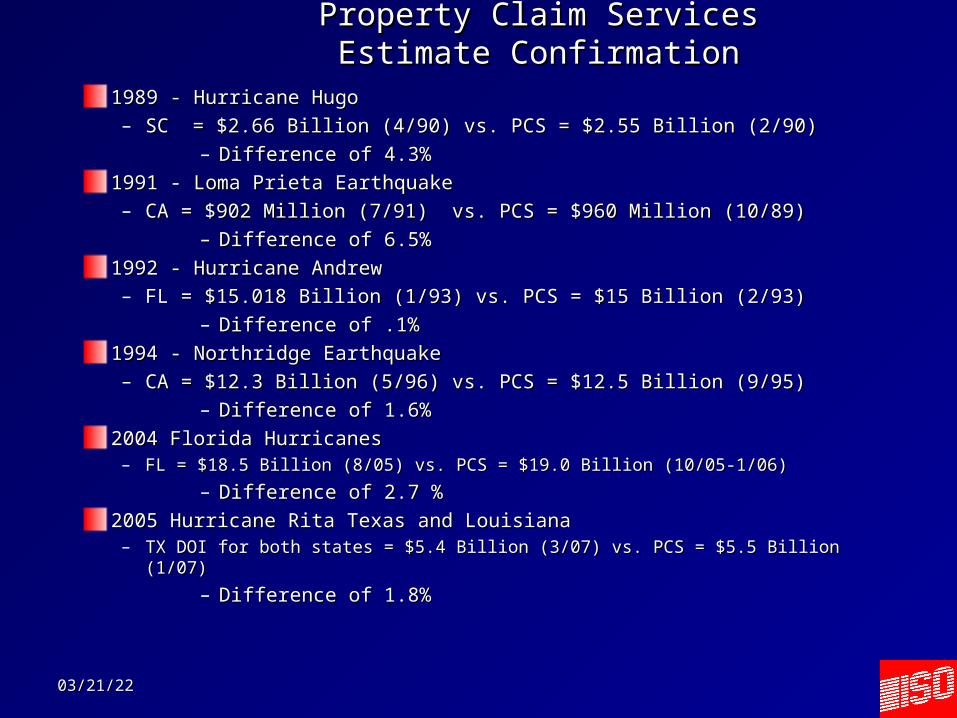
Property Claim ServicesProperty Claim ServicesEstimate ConfirmationEstimate Confirmation
1989 - Hurricane Hugo1989 - Hurricane Hugo– SC = $2.66 Billion (4/90) vs. PCS = $2.55 Billion (2/90)SC = $2.66 Billion (4/90) vs. PCS = $2.55 Billion (2/90)
– Difference of 4.3%Difference of 4.3%
1991 - Loma Prieta Earthquake1991 - Loma Prieta Earthquake– CA = $902 Million (7/91) vs. PCS = $960 Million (10/89)CA = $902 Million (7/91) vs. PCS = $960 Million (10/89)
– Difference of 6.5%Difference of 6.5%
1992 - Hurricane Andrew1992 - Hurricane Andrew– FL = $15.018 Billion (1/93) vs. PCS = $15 Billion (2/93)FL = $15.018 Billion (1/93) vs. PCS = $15 Billion (2/93)
– Difference of .1%Difference of .1%
1994 - Northridge Earthquake1994 - Northridge Earthquake– CA = $12.3 Billion (5/96) vs. PCS = $12.5 Billion (9/95)CA = $12.3 Billion (5/96) vs. PCS = $12.5 Billion (9/95)
– Difference of 1.6%Difference of 1.6%
2004 Florida Hurricanes2004 Florida Hurricanes– FL = $18.5 Billion (8/05) vs. PCS = $19.0 Billion (10/05-1/06)FL = $18.5 Billion (8/05) vs. PCS = $19.0 Billion (10/05-1/06)
– Difference of 2.7 %Difference of 2.7 %
2005 Hurricane Rita Texas and Louisiana2005 Hurricane Rita Texas and Louisiana– TX DOI for both states = $5.4 Billion (3/07) vs. PCS = $5.5 Billion (1/07)TX DOI for both states = $5.4 Billion (3/07) vs. PCS = $5.5 Billion (1/07)
– Difference of 1.8%Difference of 1.8%
04/18/2304/18/23
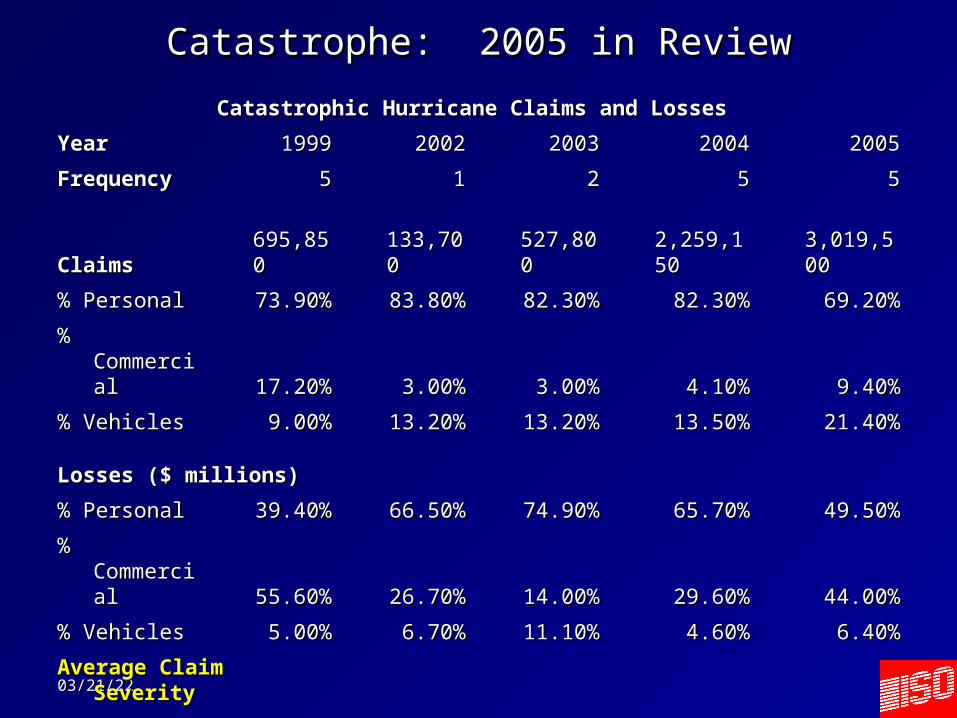
Catastrophe: 2005 in ReviewCatastrophe: 2005 in Review
Catastrophic Hurricane Claims and LossesCatastrophic Hurricane Claims and Losses
YearYear 19991999 20022002 20032003 20042004 20052005
FrequencyFrequency 55 11 22 55 55
ClaimsClaims 695,850695,850 133,700133,700 527,800527,800 2,259,1502,259,150 3,019,5003,019,500
% Personal% Personal 73.90%73.90% 83.80%83.80% 82.30%82.30% 82.30%82.30% 69.20%69.20%
% Commercial% Commercial 17.20%17.20% 3.00%3.00% 3.00%3.00% 4.10%4.10% 9.40%9.40%
% Vehicles% Vehicles 9.00%9.00% 13.20%13.20% 13.20%13.20% 13.50%13.50% 21.40%21.40%
Losses ($ millions)Losses ($ millions)
% Personal% Personal 39.40%39.40% 66.50%66.50% 74.90%74.90% 65.70%65.70% 49.50%49.50%
% Commercial% Commercial 55.60%55.60% 26.70%26.70% 14.00%14.00% 29.60%29.60% 44.00%44.00%
% Vehicles% Vehicles 5.00%5.00% 6.70%6.70% 11.10%11.10% 4.60%4.60% 6.40%6.40%
Average Claim SeverityAverage Claim Severity
PersonalPersonal $1,773 $1,773 $2,554 $2,554 $3,061 $3,061 $9,049 $9,049 $11,860 $11,860
CommercialCommercial $10,769 $10,769 $28,750 $28,750 $11,376 $11,376 $22,337 $22,337 $77,592 $77,592
VehiclesVehicles $1,856 $1,856 $1,638 $1,638 $2,755 $2,755 $3,626 $3,626 $4,988 $4,988

04/18/2304/18/23
Catastrophe Loss and ClaimsCatastrophe Loss and Claims
All Catastrophes 2004All Catastrophes 2004 $27.5 B$27.5 B 3.4 million3.4 millionHurricane Claims 2004Hurricane Claims 2004 $22.9 B$22.9 B 2.3 million 2.3 million
All Catastrophes 2005All Catastrophes 2005 $61.5 B$61.5 B 4.4 million4.4 millionHurricane Claims 2005Hurricane Claims 2005 $57.5 B$57.5 B 3.4 million 3.4 million
All Catastrophes 2006All Catastrophes 2006 $ 9.0 B$ 9.0 B 2.3 million2.3 millionHurricane Claims 2006Hurricane Claims 2006 0 0 0 0
All Catastrophes 2007All Catastrophes 2007 $ 6.7 B$ 6.7 B 1.2 million 1.2 millionHurricane ClaimsHurricane Claims 0 0 0 0
All Catastrophes 2008All Catastrophes 2008 $26.0 B$26.0 B 4.0 million4.0 millionHurricane Claims 2008Hurricane Claims 2008 $14.1 B$14.1 B 1.7 million1.7 million

04/18/2304/18/23
What’s AheadWhat’s AheadIn a recent report for the Organisation for Economic Co-In a recent report for the Organisation for Economic Co-operation and Development, researchers noted:operation and Development, researchers noted:– The first estimate of exposure to coastal flooding and high winds The first estimate of exposure to coastal flooding and high winds
finds 60% of worldwide exposure in 10 cities (ranked in order):finds 60% of worldwide exposure in 10 cities (ranked in order):MiamiMiami
Greater New YorkGreater New York
New OrleansNew Orleans
Osaka-KobeOsaka-Kobe
TokyoTokyo
AmsterdamAmsterdam
RotterdamRotterdam
NagoyaNagoya
Tampa-St. PeteTampa-St. Pete
Virginia BeachVirginia Beach

04/18/2304/18/23
What’s AheadWhat’s Ahead
How bad might it become?How bad might it become?– Remodel the 1938 hurricaneRemodel the 1938 hurricane– Infrastructure damageInfrastructure damage– Weather concernsWeather concerns– Time to repairTime to repair– Demand from other catastrophesDemand from other catastrophes

Expanded Catastrophe InformationExpanded Catastrophe Information
Loss TypeLoss Type– Workers CompWorkers Comp– Offshore and Related PropertyOffshore and Related Property– Madoff – D&O, E&O, Upscale HO TheftMadoff – D&O, E&O, Upscale HO Theft
Loss TerritoryLoss Territory– Europe (PERILS)Europe (PERILS)– JapanJapan– CaribbeanCaribbean– CanadaCanada– AustraliaAustralia
04/18/2304/18/23

04/18/2304/18/23
The Expanding Impact of The Expanding Impact of CatastrophesCatastrophes
Demand Surge – Demand Surge – – Basic Principle, Florida Contractors, LA & MS contractors, WilmaBasic Principle, Florida Contractors, LA & MS contractors, Wilma
Adjuster “Burnout”Adjuster “Burnout”– Fight the NeighborFight the Neighbor– Talking to the WallTalking to the Wall
Rebuilding ProcessRebuilding Process– Land useLand use– Building codesBuilding codes– Employee NeedsEmployee Needs– Availability of insuranceAvailability of insurance

04/18/2304/18/23
The Expanding Impact of CatastrophesThe Expanding Impact of Catastrophes
New Lines of Insurance AffectedNew Lines of Insurance Affected– World Trade Center AttackWorld Trade Center Attack
Life, Health, Workers CompLife, Health, Workers Comp
Use of PCS catastrophe serial numberUse of PCS catastrophe serial number
– Hurricane KatrinaHurricane KatrinaLife and Health Benefits InsuranceLife and Health Benefits Insurance
Mortgage InsuranceMortgage Insurance
– PandemicPandemicTXDOI Survey for Business ContinuityTXDOI Survey for Business Continuity

04/18/2304/18/23
Other Repercussions and IssuesOther Repercussions and Issues
There are other, major consequences that follow from mega-catastrophes:
Class action lawsuits spurred in part by a lack of appropriate coverage for perils that end up being uninsured.
Finding sympathetic juries for trials of those accused of perpetrating insurance fraud.
The debt incurred by the National Flood Insurance Program and other public entities, such as wind pools, requires taxpayers to assume a long term debt to support recovery efforts.
The political furor that results from either personal loss experience or from the perception of utter breakdown in response and recovery efforts.
A change in the way insurers manage risk and exposure that often includes increased premiums or higher deductibles or non-renewed policies.