Embed Size (px)
Citation preview

560 IEEE TRANSACTIONS ON IMAGE PROCESSING, VOL. 24, NO. 2, FEBRUARY 2015
A Methodology for Visually Lossless JPEG2000Compression of Monochrome Stereo Images
Hsin-Chang Feng, Michael W. Marcellin, Fellow, IEEE, and Ali Bilgin, Senior Member, IEEE
Abstract— A methodology for visually lossless compressionof monochrome stereoscopic 3D images is proposed. Visibilitythresholds are measured for quantization distortion inJPEG2000. These thresholds are found to be functions of notonly spatial frequency, but also of wavelet coefficient variance,as well as the gray level in both the left and right images.To avoid a daunting number of measurements during subjectiveexperiments, a model for visibility thresholds is developed.The left image and right image of a stereo pair are thencompressed jointly using the visibility thresholds obtained fromthe proposed model to ensure that quantization errors in eachimage are imperceptible to both eyes. This methodology is thendemonstrated via a particular 3D stereoscopic display systemwith an associated viewing condition. The resulting images arevisually lossless when displayed individually as 2D images, andalso when displayed in stereoscopic 3D mode.
Index Terms— Stereoscopic images, visually lossless coding,JPEG2000, crosstalk, human visual system.
I. INTRODUCTION
STEREOSCOPIC 3D imaging has been applied in diversefields such as aerial stereo photography, stereoscopic
surgery, and digital cinema [1]–[3]. Accordingly, it hasreceived considerable attention over the last few decades.Recently, consumers are viewing many different types ofstereoscopic content in television and gaming applications dueto inexpensive consumer-grade 3D displays becoming widelyavailable.
In order to simulate the parallax between the left and righteyes of a human observer, left and right images of a scene aretaken from two different positions. These two images makeup a stereo pair (stereo image). In a stereo viewing system,the left and right images of a stereo pair are presented to theleft and right eyes of the observer, respectively. The humanbrain fuses the two images to create the perception of 3D [4].
Manuscript received March 13, 2014; revised August 7, 2014 andNovember 19, 2014; accepted December 6, 2014. Date of publication Decem-ber 18, 2014; date of current version January 8, 2015. The associate editorcoordinating the review of this manuscript and approving it for publicationwas Dr. Anthony Vetro.
H.-C. Feng and M. W. Marcellin are with the Department of Electricaland Computer Engineering, University of Arizona, Tucson, AZ 85721 USA(e-mail: [email protected]; [email protected]).
A. Bilgin is with the Department of Biomedical Engineering, theDepartment of Electrical and Computer Engineering, University of Arizona,Tucson, AZ 85721 USA (e-mail: [email protected]).
This paper has supplementary downloadable material availableat http://ieeexplore.ieee.org., provided by the author. The materialincludes stereo images. The total size of the file is 85.3 MB.Contact [email protected], [email protected], [email protected] for further questions about this work.
Color versions of one or more of the figures in this paper are availableonline at http://ieeexplore.ieee.org.
Digital Object Identifier 10.1109/TIP.2014.2384273
Typical display technologies for stereoscopic 3D viewingemploy passive or active glasses, although other technologiesare currently available [5], [6]. For passive systems, the leftand right images are displayed sequentially on a display whichpolarizes them clockwise and anti-clockwise, respectively.Polarized glasses enable only the correct image to pass throughto each eye. For active display technologies, active shutterglasses are synchronized to the display [6]. The left and rightlenses of these glasses switch to an ON state and a DARKstate alternately to allow only the correct signals to be passedthrough to each eye [7]. In this paper, we focus on a systemwhich employs active shutter glasses, based on liquid crystaltechnology [7]–[11].
Since two 2D images together form a stereoscopic3D pair, the amount of data for an uncompressed stereoimage is doubled compared to that for an uncompressed2D image. Thus efficient compression techniques are ofparamount importance. This paper considers visually losslesscompression of stereoscopic 3D images.
A simple approach to this problem might be to compresseach of the component images of a stereoscopic pair in avisually lossless manner. To this end, our initial experimentsused the method of [12] to compress the left and rightimages of a stereo pair independently. It was verified thateven experienced viewers were unable to perceive any codingartifacts when the original and compressed left images wereviewed side-by-side as 2D images. The same held for the rightimage. Interestingly however, when viewed as a stereo pair,visual artifacts were readily apparent. Indeed, three separateobservers examined the images. All three could easily identifysignificant differences between the original and compressedstereo pairs when viewed side-by-side in 3D mode.
To investigate the source of these artifacts, a compressedleft image (as prepared above) was paired with an originaluncompressed right image. This pair was then displayedin 3D mode. The display was then observed with the left eyecovered, yet artifacts were still perceived (by the right eyeviewing the right image), despite the fact that no such artifactswere present in the right image. This experiment, coupledwith the fact that only still images are considered, firmlyestablishes that compression noise leakage is present fromone channel to the other due to crosstalk in the stereoscopicdisplay system (and not due to any persistence properties of thehuman visual system). This phenomenon is discussed furtherin Section V.
From the preceding discussion, it can be concluded thatcrosstalk must be carefully considered in the design of visuallylossless 3D compression systems. Crosstalk occurs when one
1057-7149 © 2014 IEEE. Personal use is permitted, but republication/redistribution requires IEEE permission.See http://www.ieee.org/publications_standards/publications/rights/index.html for more information.

FENG et al.: METHODOLOGY FOR VISUALLY LOSSLESS JPEG2000 COMPRESSION 561
eye can see a signal that is intended to be seen only by theother eye. Since these unintended signals are usually dim,the crosstalk effect is also sometimes called the ghost effect.It can lead not only to degradation in the perceived qualityof 3D images, but also to discomfort in some individuals.Crosstalk is caused by leakage between the left and right chan-nels. For active display technologies, crosstalk is contributedto by a glasses-dependent factor and a display-dependentfactor [7]. The first factor is related to synchronization betweenactive shutter glasses and 3D displays, response time betweenthe ON state and the DARK state of active shutter glasses,and the various transmittance ratios of the center parts andmarginal parts of active shutter glasses. The second factorcorresponds to the response time of the display not allowingthe correct luminance values of pixels to be reached duringthe short transition time of switching between the left andright images.
There are ongoing efforts to quantify the amount ofcrosstalk between the two channels in systems using activeshutter glasses [8], [9], [11], [13]. In these four works, constantgray level images are displayed in the left and right channels.The gray levels of these two images are set to various com-binations. A photometer is placed behind a lens of the activeshutter glasses (where an eye would normally be) to measureluminance values. The crosstalk is then characterized by com-paring various measured luminance values. In [14], crosstalk isquantified via subjective experiments for a CRT display systembased on liquid crystal shutter glasses. Two side-by-side spatialregions R1 and R2 in the left image are set to constant graylevels g1 and g2, respectively. Two spatial regions R3 and R4,at the same locations as R1 and R2, but in the right imageare set to constant gray levels g3 = 0 and g4, respectively.Since g3 = 0, it is hypothesized that R3 does not inducecrosstalk in R1. However, R4 does induce crosstalk in R2.Subjects are asked to adjust g1 until the pixel intensity ofR1 and R2 appear identical to the left eye. The crosstalk in R2due to R4 is then computed as the gray level difference g1–g2.These works and others (see [15], [16]) have consistentlydemonstrated that crosstalk from one channel to another isa function of the gray levels in both channels. Additionally,it was found in [10] that crosstalk is also a function of spatialfrequency, which is consistent with earlier results publishedin [17].
As mentioned above, we investigate here the visuallylossless compression of 3D stereoscopic images. To thisend, we consider the contrast sensitivity function (CSF) forstereoscopic 3D images in the presence of crosstalk. The CSFdescribes the sensitivity of the human visual system (HVS) todifferent spatial frequencies (in cycles/degree) and has beena popular avenue of investigation with respect to perceptuallybased compression of 2D images. In early work, sinusoidalgratings were used in perceptual experiments to measure theCSF. Peak contrast sensitivity has been found to lie between2 and 6 cycles/degree [18], [19]. More recently, the CSF hasbeen modeled using the discrete wavelet transform [20]. In thatwork, uniform noise was added to each wavelet subband(one at a time) of an 8-bit constant 128 grayscale image togenerate a stimulus image. Visibility thresholds (VTs) were
measured for each subband by subjective experiments inwhich the level of the noise was adjusted to the point whereit just became imperceptible to a human viewer.
The method of [20] was extended to a more realisticnoise model in [12] and [21]. Specifically, a quantizationnoise model was developed for the dead-zone quantizationof JPEG2000 as applied to wavelet transform coefficients.Then, rather than adding uniform noise to a wavelet subbandas in [20], stimulus images were produced by adding noisegenerated via the dead-zone quantization noise model. Theresulting visibility thresholds are functions not only of quanti-zation step size � and spatial frequency/orientation as in [20],but also of the variance σ 2 of the wavelet data in each subband.A 2D image compression system was then developed to ensurethat the magnitudes of all quantization errors in a waveletsubband fall below the corresponding VT.
Building on previous efforts [17], [22], [23], the workpresented in this paper provides a methodology for measuringVTs in the presence of crosstalk via stimulus images. Sincethe crosstalk observed in one channel is a function of thegray levels in both channels, it is reasonable to suspect thatthe resulting VTs depend not only on the parameters studiedpreviously for 2D images in [12] and [20], but also on thecombination of gray levels displayed in the left and rightchannels. Indeed, experimental results presented in Section IVconfirm this suspicion.
Based on all relevant parameters, a model for VTs instereoscopic 3D images is proposed. Appropriate VTs derivedfrom this model are then used to design a JPEG2000 codingscheme which compresses the left and right images of astereo pair jointly. The performance of the proposed JPEG2000coding scheme is demonstrated by compressing monochromestereo pairs. The resulting left and right compressed imagefiles can be decoded separately by a standard JPEG2000decoder. The decompressed images are visually lossless whenviewed separately as 2D images, and also when viewed as a 3Dstereo pair. This claim is validated via subjective experiments.
The remainder of this paper is organized as follows.In Section II, the modeling of visibility thresholds is described.Methods for measurement of visibility thresholds are presentedin Section III. The proposed visually lossless coding schemefor stereo pairs is given in Section IV. In Section V, we presentthe resulting parameters for the proposed VT model, resultsfrom our proposed coding scheme, as well as validation thatthe resulting compressed stereo pairs are visually lossless.Section VI concludes the work.
II. MODELING OF VISIBILITY THRESHOLDS
To facilitate visually losslessly compression via JPEG2000,VT models are developed in this section, for both the leftand right images of stereo pairs. Since the procedures formeasuring VTs for one image are identical to the other, thefocus of the following discussion is the measurement of VTsfor the left image.
The VT for a JPEG2000 codeblock of a 2D image isdefined [12] as the largest quantization step size � for whichquantization distortion remains invisible. It is modeled as afunction of the wavelet coefficient variance σ 2 within the

562 IEEE TRANSACTIONS ON IMAGE PROCESSING, VOL. 24, NO. 2, FEBRUARY 2015
codeblock, as well as the orientation θ ∈ {LL, LH, HL, HH},and level k of the (dyadic wavelet decomposition) subband towhich the codeblock belongs.
As mentioned in the introduction, extension to the caseof stereoscopic 3D images requires careful consideration ofthe crosstalk effect. The crosstalk effect is considered hereto be a luminance leakage from one channel to the otherchannel [7]. When crosstalk occurs, signals intended for theleft eye can be seen by right eye. Therefore, VTs for theleft image must be chosen so that any quantization distortion(in the left image) is invisible to both the left and right eyes.To this end, we find two VTs t ′ and t ′′. We emphasize thatboth thresholds correspond to the visibility of distortion dueto quantization of the left image. The first VT, t ′, is chosen sothat the resulting distortion is invisible to the left eye, whilethe second VT, t ′′, ensures that the distortion is invisible tothe right eye. The final VT t is then taken as the minimumof t ′ and t ′′.
Consistent with the properties of crosstalk observedin [7], [11], and [13], our experiments indicate that theperceived visibility of distortion by the left and right eyesis a function of luminance levels in both the left and rightimages. Thus, t ′ and t ′′ are functions not only of σ 2, θ and kin the left image, but also of the gray level I in both theleft and right images. Mathematically, the VT for a givencodeblock in the left image at level k and orientation θ isthen
tθ,k,l(σ 2
θ,k,l , Iθ,k,l , Iθ,k,r) = min
{t ′θ,k,l
(σ 2
θ,k,l , Iθ,k,l , Iθ,k,r),
t ′′θ,k,l
(σ 2
θ,k,l , Iθ,k,l , Iθ,k,r)}
,
(1)
where σ 2θ,k,l is the variance of wavelet coefficients within
the codeblock and Iθ,k,l is a gray level for the left imagerepresentative of the spatial region (in the image domain)associated with the codeblock. Similarly, Iθ,k,r is a gray levelrepresentative of the same spatial region, but in the rightimage. In our experiments, we employ K = 5 levels of dyadic9/7 wavelet transform so that 1 ≤ k ≤ 5. The four orienta-tions θ are indexed as {LL, HL, LH, HH}. For example, theVT associated with the visibility by the right eye of distortionintroduced in a codeblock of the HL subband of level 2 ofthe left image is denoted by t ′′H L ,2,l(σ
2H L ,2,l, IH L ,2,l , IH L ,2,r ).
The computation of Iθ,k,l and Iθ,k,r is discussed in Section IV.The measurement of VTs via psycho-visual experiments
is discussed in Section III. However, exhaustively measuringVTs for all possible parameter choices would be a dauntingtask. For a given σ 2, there are 2 thresholds × 16 subbands ×2562 combinations of I , for a total of more than 2 × 10⁶
thresholds to be measured. When σ 2 is varied, the total numberof thresholds to be measured increases proportionally. Measur-ing this number of thresholds through subjective experimentsis prohibitive. Thus, to reduce the number of experiments toa manageable level, we consider a separable model for VTsgiven by
t̂θ,k,l(σ 2
θ,k,l , Iθ,k,l , Iθ,k,r) = Sθ,k,l
(σ 2
θ,k,l
)
× Tθ,3,l(Iθ,3,l , Iθ,3,r
). (2)
In this model, we begin with “nominal thresholds”Tθ,3,l(Iθ,3,l , Iθ,3,r ) measured for level k = 3 and varianceσ 2 = 50 via
Tθ,3,l(Iθ,3,l , Iθ,3,r
)
= min{t ′θ,3,l
(50, Iθ,3,l , Iθ,3,r
), t ′′θ,3,l
(50, Iθ,3,l, Iθ,3,r
)}.
(3)
For the 5 level wavelet decomposition employed here, k = 3represents the median transform level. As will be evidentfrom the results presented in Figure 5 of Section V, the valueof σ 2 = 50 is chosen as being near the middle of the rangein which the VTs vary most as a function of variance.
The nominal thresholds Tθ,3,l(Iθ,3,l , Iθ,3,r ) attempt to modelthe effect of crosstalk caused by different intensities in the leftand right images for different orientations, but fixed varianceand transform level. The nominal thresholds are then scaledby a factor Sθ,k,l (σ
2θ,k,l ) which attempts to model the effects
of orientation, variance, and transform level (as consideredin [12]), but with no crosstalk present. To achieve a state of nocrosstalk, the intensities in the left and right images are set tobe equal [11]. To limit the number of required measurements,as described below, only the median gray level is employedin Sθ,k,l (σ
2θ,k,l ). Specifically,
Sθ,k,l(σ 2
θ,k,l
) = tθ,k,l(σ 2
θ,k,l , 128, 128)
Tθ,3,l(128, 128). (4)
A methodology for the measurement of Tθ,3,l and Sθ,k,l isprovided in the next section.
III. MEASUREMENT OF VISIBILITY THRESHOLDS
The 3D vision system used in this work includes the NvidiaQuadro FX 3800 graphics card and active shutter glasses.A USB IR transmitter is used to synchronize the glasses with aSamsung SyncMaster 2233 RZ display (22” with 1680 × 1050resolution, 120 Hz refresh-rate, 300 cd/m2 brightness,1,000:1 typical contrast ratio, and 170°/160° viewingangle). The display resolution d for the SyncMaster displayis 35.45 pixels/cm. When the viewing distance υ betweensubject and display is 60 cm, the resulting visual resolution ris 37.12 pixels/degree, which is derived via in [20, eq. 1].
Since the above-mentioned 3D stereoscopic display systemis frequently used in the office/home, we chose a goal of ensur-ing visually lossless quality in the work environment [24].To this end, all visual experiments were conducted with normaloffice lighting conditions and a viewing distance of 60 cm.The results presented herein are only guaranteed to holdfor the specific stereo display system and particular viewingconditions considered. On the other hand, the methodologypresented can be used to obtain VTs for different displaydevices and/or more critical viewing conditions such as thosedescribed in [25] and [26]. It is worth noting that a straightfor-ward application of the proposed methodology would result ina fixed design for each display device and viewing condition.An interesting avenue for future work is the development ofa more general model for VTs that could take as input suchparameters as display resolution, veiling luminance, viewingdistance, etc. [27].

FENG et al.: METHODOLOGY FOR VISUALLY LOSSLESS JPEG2000 COMPRESSION 563
Fig. 1. Stimulus images derived by adding simulated quantization distortion in the HL3 subband with σ2 = 50. (a) IH L ,3,l is fixed to 128 but the valueof � varies among 30, 10, 5, and 1. (b) The value of � is fixed to 10 but the value of IH L ,3,l is varied among 255, 195, 60, and 0.
For the purpose of measuring VTs, stimulus images are gen-erated by performing the inverse wavelet transform of waveletcoefficient data containing simulated quantization distortion.Specially, the wavelet data for all subbands of an image ofsize 512 × 512 are initialized to 0, and then noise is addedto one subband. This noise is generated pseudo-randomlyaccording to the JPEG2000 quantization distortion modelof [12]. The inverse wavelet transform is performed, and theresult is added to a constant gray level image having all pixelintensities set to a fixed value Iθ,3,l between 0 and 255. Afterthe addition, the value of each pixel in this stimulus image isrounded to the closest integer between 0 and 255.
In order to measure the visibility thresholdst ′θ,3,l(50, Iθ,3,l , Iθ,3,r ) and t ′′θ,3,l(50, Iθ,3,l , Iθ,3,r ), as requiredby (3), left stimulus images are created by adding noise(as described above) to a level 3 subband with orientation θ .Figure 1 illustrates stimulus images generated by addingnoise to the HL3 subband (k = 3 and θ = HL). In particular,Figure 1 (a) demonstrates stimulus images for various valuesof � with σ 2 = 50 and IH L ,3,l = 128. As described above,the value of IH L ,3,l corresponds to the background gray levelof the stimulus image. The values of � and σ 2 correspondto an assumed quantization step size and variance of waveletcoefficients to be quantized, respectively. From this figure,we see that when σ 2 and IH L ,3,l are fixed, noise visibilitydecreases with � as expected.
In Figure 1 (b), the assumed coefficient variance and quanti-zation step size are held fixed at σ 2 = 50 and � = 10, whilethe background intensity IH L ,3,l is varied among 255, 195,60, and 0. This figure demonstrates, as is well known in theliterature [28], [29], that noise visibility is a function of thebackground gray level IH L ,3,l . In fact, as will be seen insubsequent sections, experiments indicate that when viewed
in 3D mode, the visibility of noise (introduced in only the leftimage) is a function of both Iθ,k,l and Iθ,k,r .
Accordingly, to find t ′θ,3,l(50, Iθ,3,l , Iθ,3,r ) andt ′′θ,3,l(50, Iθ,3,l , Iθ,3,r ), a value of � is chosen and a leftstimulus image (containing noise) is created with parameters,�, θ, Iθ,3,l , k = 3, and σ 2 = 50. This image is pairedwith a right constant gray image with all pixels set to Iθ,3,r
(and no noise). The value of � in the left stimulus imageis then adjusted until the noise is just invisible to the lefteye, with the right eye covered. The resulting value of � ist ′θ,3,l(50, Iθ,3,l , Iθ,3,r ). The experiment is then repeated withthe same setup, but with the left eye covered. The valueof � in the left stimulus image is then adjusted so that thenoise is just invisible to the right eye. The resulting valueof � is t ′′θ,3,l(50, Iθ,3,l, Iθ,3,r ). We emphasize again that noiseis introduced only in the left image for the measurement ofboth t ′ and t ′′.
The thresholds t ′θ,3,l(50, Iθ,3,l , Iθ,3,r ) andt ′′θ,3,l(50, Iθ,3,l , Iθ,3,r ) are measured for five values of Iθ,3,l
and nineteen values of Iθ,3,r . Specifically, Iθ,3,l ∈ {0, 60,128, 195, 255} while Iθ,3,r can take any of the eighteeninteger multiples of 15 between 0 and 255, plus theadditional value of 128. That is Iθ,3,r ∈ {0, 15, . . . , 120,128, 135, . . . , 240, 255}.
We now proceed to the measurement of Sθ,k,l (σ2θ,k,l ) as
given in (4). The denominator of (4) is a special caseof Tθ,3,l(Iθ,3,l , Iθ,3,r ) and is included in the measurementsdescribed above. The numerator tθ,k,l(σ
2θ,k,l , 128, 128) remains
to be discussed. To this end, the gray levels for both theleft and right images are fixed to 128 but the value of theassumed (left) codeblock variance σ 2
θ,k,l is varied. For a givenchoice of θ , k, and σ 2
θ,k,l , the value of � in the left stimulusimage is again adjusted to the point that the noise is just

564 IEEE TRANSACTIONS ON IMAGE PROCESSING, VOL. 24, NO. 2, FEBRUARY 2015
imperceptible for each eye, resulting in t ′θ,k,l (σ2θ,k,l , 128, 128)
and t ′′θ,k,l (σ2θ,k,l , 128, 128). Six values of σ 2
θ,k,l ∈ {10, 50,100, 200, 600, 1000} are tested for each value of θ and k.The total number of thresholds measured for the numeratorof (4) is then 6 variances × 2 thresholds = 12 per subband.Six values of tθ,k,l (σ
2θ,k,l , 128, 128) are then obtained for each
subband as the minimum between t ′θ,k,l (σ2θ,k,l , 128, 128) and
t ′′θ,k,l (σ2θ,k,l , 128, 128) for each θ and each k ∈ {1, 2, . . . , 5}.
During the experiments described above, an opaque maskis used to cover the right eye of the subject during themeasurement of t ′. Similarly, the left eye is covered duringthe measurement of t ′′. Due to the fact that the central partof the active shutter lenses is darker than the peripheral part,signals correctly blocked by the central part may be perceivedas crosstalk through the peripheral part. Thus, in order toobtain conservative values for the VTs, the subject is allowedto tilt their head during measurements.
Spatial three-alternative forced-choice (3AFC) testing isemployed to find the value of � for which the distortion is justinvisible in each case. Three stereoscopic images are shownon the display concurrently. One is placed at the top centerof the screen, and the other two are arranged at the bottomleft and bottom right, respectively. A stereoscopic stimulusimage (containing noise in only the left channel) is displayedrandomly at one of three locations. The other two stereoscopicimages contain no noise. The subject is asked to decide whichstereoscopic image contains the noise by means of keyboardinput.
For a given combination of θ , k, σ 2θ,k,l , Iθ,k,l and Iθ,k,r ,
32 trials (each with a different value of �) are conducted. Thevalue of � in each trial is controlled by the QUEST staircaseprocedure obtained from the Psychophysics Toolbox [30].In each trial, the three stereoscopic images are displayedfor 20 seconds. The subject can take an unlimited amount oftime to make a decision as to which stereoscopic image con-tains the stimulus after the stereoscopic images are removedfrom the display. The VT is then taken as the value of �derived from the 75% correct-point on the Weibull functionfitted from the 32 trails [31]. It is worth emphasizing that allVTs are measured using only (pseudo-randomly generated)stimulus images. No actual images are used in this regard.
In what follows, 4th order polynomial interpolation is usedto obtain values of the nominal thresholds Tθ,3,l(Iθ,3,l , Iθ,3,r )for values of Iθ,3,l and Iθ,3,r not employed in the visualmeasurements described above. Negative values may resultfrom this interpolation. Since VTs should be positive, thenominal threshold is taken as the maximum between itsinterpolated value and a small constant δ = 0.25, whichcorresponds to approximately 70% of the minimum of all nom-inal thresholds measured via psycho-physical tests. Similarly,two term power series interpolation is employed to obtainvalues of the numerator in (4) for values of σ 2
θ,k,l not employedin the measurements. The resulting values, when employedin (2), may cause t̂θ,k,l(σ
2θ,k,l , Iθ,k,l , Iθ,k,r ) to be negative
or overly small. Thus, the larger of t̂θ,k,l(σ2θ,k,l , Iθ,k,l , Iθ,k,r )
and a small constant ε = 0.025 is taken as the final VT.This value of ε corresponds to approximately 10% of the
minimum t̂θ,k,l (σ2θ,k,l , Iθ,k,l , Iθ,k,r ) calculated using only mea-
sured thresholds (i.e., before interpolation). The value of 10%is chosen as an overly conservative value, due to the fact thatit is applied to the final VTs.
IV. VISUALLY LOSSLESS CODING OF STEREO PAIRS
The proposed coding method for visually losslesscompression of 8-bit monochrome stereoscopic images isadapted from the coding method of [12]. In JPEG2000,a subband is partitioned into rectangular codeblocks.The coefficients of each codeblock are then quantizedand encoded via bit-plane coding. Three coding passes(significance propagation, magnitude refinement, and cleanup)are performed for each bit-plane except the most significantbit-plane which only has a cleanup pass. The maximumpossible number of coding passes for a codeblock is then3M − 2 where M denotes a number of bit-planes sufficientto represent the magnitude of all quantized coefficients in acodeblock [32]. The actual number of coding passes includedin a compressed code stream can vary from codeblock tocodeblock and is typically selected to optimize mean squarederror over the entire image for a given target bit rate [32].
Rather than minimizing mean squared error, the methodproposed in [12] includes the minimum number of codingpasses necessary to achieve visually lossless encoding of a 2Dimage. This is achieved by including a sufficient number ofcoding passes for a given codeblock such that the absoluteerror of every coefficient in that codeblock is less thanthe VT for that codeblock. This is extended to the codingof 3D images in what follows. Specifically, the coding ofthe left image of a stereo pair is carried out using theleft VT for each codeblock of the left image as computedvia the process described in Section III. The right imageis then encoded using the right VT for each codeblock ofthe right image. Asymmetries [33] are not considered inthis work. Thus, we compute right VTs in the identicalmanner as left VTs, by simply reversing the roles of theleft and right images.
For simplicity, we do not consider visual masking, norother more sophisticated perceptual coding tools such as thosedescribed in [12], [21], and [34]. Thus, the resulting compres-sion ratios reported in subsequent results should be consideredas lower bounds to what might be possible. Indeed, in [12]the VT for each codeblock is modified by a multiplicativefactor to account for visual masking. This masking factor iscomputed based on the image data in the supporting region ofa codeblock, and is always greater than or equal to 1.0. Theresulting increased VTs yield an increase in the compressionratio of approximately 10% over the unmodified VTs, whilestill maintaining visually lossless quality.
From (3) and (4), the VT of a codeblock in the left imagedepends not only on the variance of the wavelet coefficientswithin the codeblock, but also on gray levels from the left andright images representative of the spatial region correspondingto the codeblock. In our initial experiments, the requisite graylevels were computed as the average pixel intensity (in theleft and right images, respectively) over the supporting region
FENG et al.: METHODOLOGY FOR VISUALLY LOSSLESS JPEG2000 COMPRESSION 565
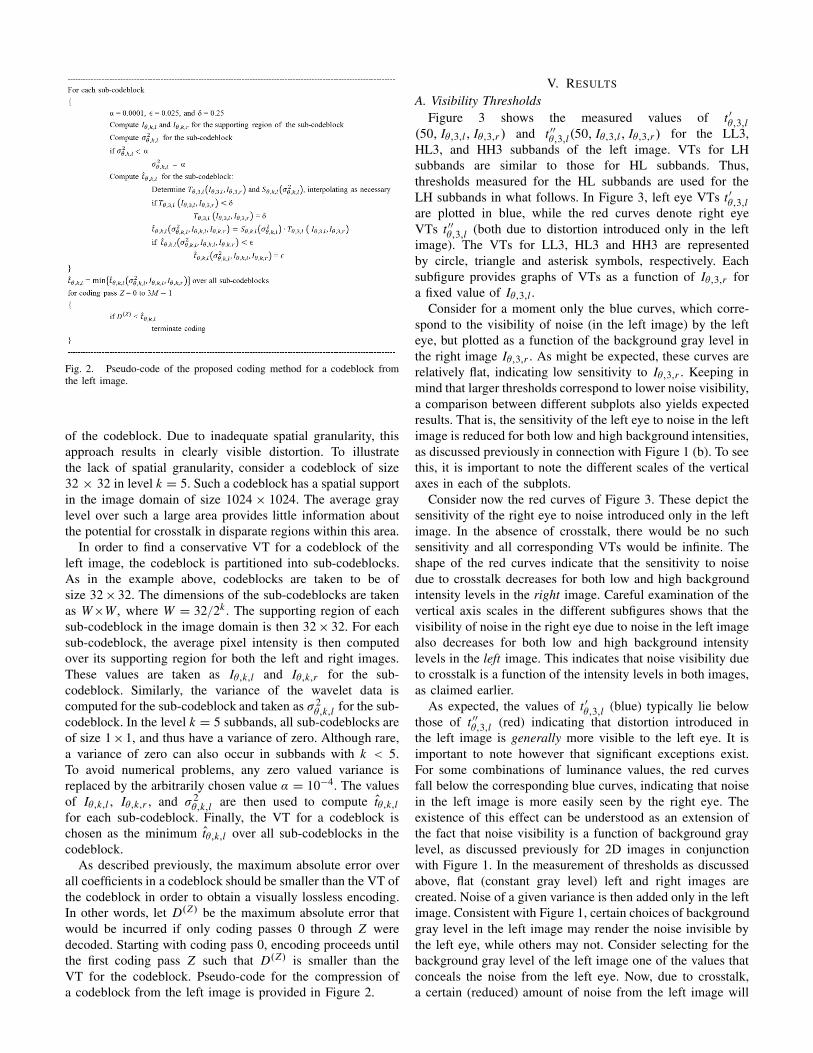
Fig. 2. Pseudo-code of the proposed coding method for a codeblock fromthe left image.
of the codeblock. Due to inadequate spatial granularity, thisapproach results in clearly visible distortion. To illustratethe lack of spatial granularity, consider a codeblock of size32 × 32 in level k = 5. Such a codeblock has a spatial supportin the image domain of size 1024 × 1024. The average graylevel over such a large area provides little information aboutthe potential for crosstalk in disparate regions within this area.
In order to find a conservative VT for a codeblock of theleft image, the codeblock is partitioned into sub-codeblocks.As in the example above, codeblocks are taken to be ofsize 32 × 32. The dimensions of the sub-codeblocks are takenas W×W, where W = 32/2k . The supporting region of eachsub-codeblock in the image domain is then 32 × 32. For eachsub-codeblock, the average pixel intensity is then computedover its supporting region for both the left and right images.These values are taken as Iθ,k,l and Iθ,k,r for the sub-codeblock. Similarly, the variance of the wavelet data iscomputed for the sub-codeblock and taken as σ 2
θ,k,l for the sub-codeblock. In the level k = 5 subbands, all sub-codeblocks areof size 1×1, and thus have a variance of zero. Although rare,a variance of zero can also occur in subbands with k < 5.To avoid numerical problems, any zero valued variance isreplaced by the arbitrarily chosen value α = 10−4. The valuesof Iθ,k,l , Iθ,k,r , and σ 2
θ,k,l are then used to compute t̂θ,k,l
for each sub-codeblock. Finally, the VT for a codeblock ischosen as the minimum t̂θ,k,l over all sub-codeblocks in thecodeblock.
As described previously, the maximum absolute error overall coefficients in a codeblock should be smaller than the VT ofthe codeblock in order to obtain a visually lossless encoding.In other words, let D(Z) be the maximum absolute error thatwould be incurred if only coding passes 0 through Z weredecoded. Starting with coding pass 0, encoding proceeds untilthe first coding pass Z such that D(Z) is smaller than theVT for the codeblock. Pseudo-code for the compression ofa codeblock from the left image is provided in Figure 2.
V. RESULTS
A. Visibility ThresholdsFigure 3 shows the measured values of t ′θ,3,l
(50, Iθ,3,l, Iθ,3,r ) and t ′′θ,3,l(50, Iθ,3,l , Iθ,3,r ) for the LL3,HL3, and HH3 subbands of the left image. VTs for LHsubbands are similar to those for HL subbands. Thus,thresholds measured for the HL subbands are used for theLH subbands in what follows. In Figure 3, left eye VTs t ′θ,3,lare plotted in blue, while the red curves denote right eyeVTs t ′′θ,3,l (both due to distortion introduced only in the leftimage). The VTs for LL3, HL3 and HH3 are representedby circle, triangle and asterisk symbols, respectively. Eachsubfigure provides graphs of VTs as a function of Iθ,3,r fora fixed value of Iθ,3,l .
Consider for a moment only the blue curves, which corre-spond to the visibility of noise (in the left image) by the lefteye, but plotted as a function of the background gray level inthe right image Iθ,3,r . As might be expected, these curves arerelatively flat, indicating low sensitivity to Iθ,3,r . Keeping inmind that larger thresholds correspond to lower noise visibility,a comparison between different subplots also yields expectedresults. That is, the sensitivity of the left eye to noise in the leftimage is reduced for both low and high background intensities,as discussed previously in connection with Figure 1 (b). To seethis, it is important to note the different scales of the verticalaxes in each of the subplots.
Consider now the red curves of Figure 3. These depict thesensitivity of the right eye to noise introduced only in the leftimage. In the absence of crosstalk, there would be no suchsensitivity and all corresponding VTs would be infinite. Theshape of the red curves indicate that the sensitivity to noisedue to crosstalk decreases for both low and high backgroundintensity levels in the right image. Careful examination of thevertical axis scales in the different subfigures shows that thevisibility of noise in the right eye due to noise in the left imagealso decreases for both low and high background intensitylevels in the left image. This indicates that noise visibility dueto crosstalk is a function of the intensity levels in both images,as claimed earlier.
As expected, the values of t ′θ,3,l (blue) typically lie belowthose of t ′′θ,3,l (red) indicating that distortion introduced inthe left image is generally more visible to the left eye. It isimportant to note however that significant exceptions exist.For some combinations of luminance values, the red curvesfall below the corresponding blue curves, indicating that noisein the left image is more easily seen by the right eye. Theexistence of this effect can be understood as an extension ofthe fact that noise visibility is a function of background graylevel, as discussed previously for 2D images in conjunctionwith Figure 1. In the measurement of thresholds as discussedabove, flat (constant gray level) left and right images arecreated. Noise of a given variance is then added only in the leftimage. Consistent with Figure 1, certain choices of backgroundgray level in the left image may render the noise invisible bythe left eye, while others may not. Consider selecting for thebackground gray level of the left image one of the values thatconceals the noise from the left eye. Now, due to crosstalk,a certain (reduced) amount of noise from the left image will

566 IEEE TRANSACTIONS ON IMAGE PROCESSING, VOL. 24, NO. 2, FEBRUARY 2015
Fig. 3. Visibility thresholds measured via subjective experiments. t ′θ,3,l (50, Iθ,3,l , Iθ,3,r ) and t ′′θ,3,l (50, Iθ,3,l , Iθ,3,r ) are represented by blue and red curves,respectively. Circle symbols, triangle symbols, and asterisk symbols are used for LL3, HL3, and HH3, respectively. From (3), it can be seen that thenominal thresholds are equal to the minimum between the red and blue curves for each set of parameter choices.
leak through to the right eye. It is reasonable to expect thatcertain choices of background gray level in the right imagemay result in no distortion perceived by the right eye, whileother choices may not. That is, there may exist choices forthe left and right gray levels which result in the noise beingimperceptible by the left eye, yet perceptible by the righteye. This effect is particularly evident in the subfigure withIθ,3,l = 195. This justifies the need to consider both t ′θ,3,l andt ′′θ,3,l and to choose tθ,3,l = min{t ′θ,3,l, t ′′θ,3,l} to ensure thatnoise introduced into the left image is imperceptible to boththe left and right eyes.
As mentioned previously, values of Tθ,3,l(Iθ,3,l , Iθ,3,r ) forvalues of Iθ,3,l and Iθ,3,r not employed in the psychovisualexperiments are rendered using 4thorder polynomial interpo-lation. Specifically,
Tθ,3,l(Iθ,3,l , Iθ,3,r )
= p00 + Iθ,3,l p10 + Iθ,3,r p01 + I 2θ,3,l p20
+ Iθ,3,l Iθ,3,r p11 + I 2θ,3,r p02 + I 3
θ,3,l p30
+ I 2θ,3,l Iθ,3,r p21 + Iθ,3,l I 2
θ,3,r p12 + I 3θ,3,r p03
+ I 4θ,3,l p40 + I 3
θ,3,l Iθ,3,r p31 + I 2θ,3,l I 2
θ,3,r p22
+ Iθ,3,l I 3θ,3,r p13 + I 4
θ,3,r p04. (5)
The interpolation parameters pi j are given in Table I, whileFigure 4 (a), (b), and (c) depict the interpolated surfacesfor Tθ,3,l(Iθ,3,l , Iθ,3,r ) with θ equal to LL, HL, and HH,respectively. As can be seen in the figures, the VT surfacesare somewhat “bowl shaped”. Consistent with previousdiscussions, this indicates that noise visibility is decreasedwhen the gray levels of either image are low or high, and
TABLE I
PARAMETERS FOR 4th ORDER POLYNOMIAL INTERPOLATION OF Tθ,3,l
clearly demonstrates that Tθ,3,l(Iθ,3,l , Iθ,3,r ) is a function ofboth Iθ,3,l and Iθ,3,r . It is worth noting (see (3)) that theinterpolation is performed after taking the point-by-pointminimum between the appropriate red and blue curvesof Figure 3. Thus, the interpolation does not need to preservethe sudden drops and peaks seen in the individual red andblue curves of Figure 3.
Figure 5 shows tθ,k,l(σ2θ,k,l , 128, 128) as a function of
σ 2θ,k,l for the LL, HL, and HH subbands for level
k ∈ {1, 2, 3, 4, 5}. As discussed previously, these thresholdsare used in the numerator of the scaling factor in (4),and are measured for σ 2
θ,k,l ∈ {10, 50, 100, 200, 600, 1000}.Measured tθ,k,l (σ
2θ,k,l , 128, 128) for levels 1, 2, 3, 4, and 5 are
represented by magenta asterisk, red triangle, green cross, cyan
FENG et al.: METHODOLOGY FOR VISUALLY LOSSLESS JPEG2000 COMPRESSION 567
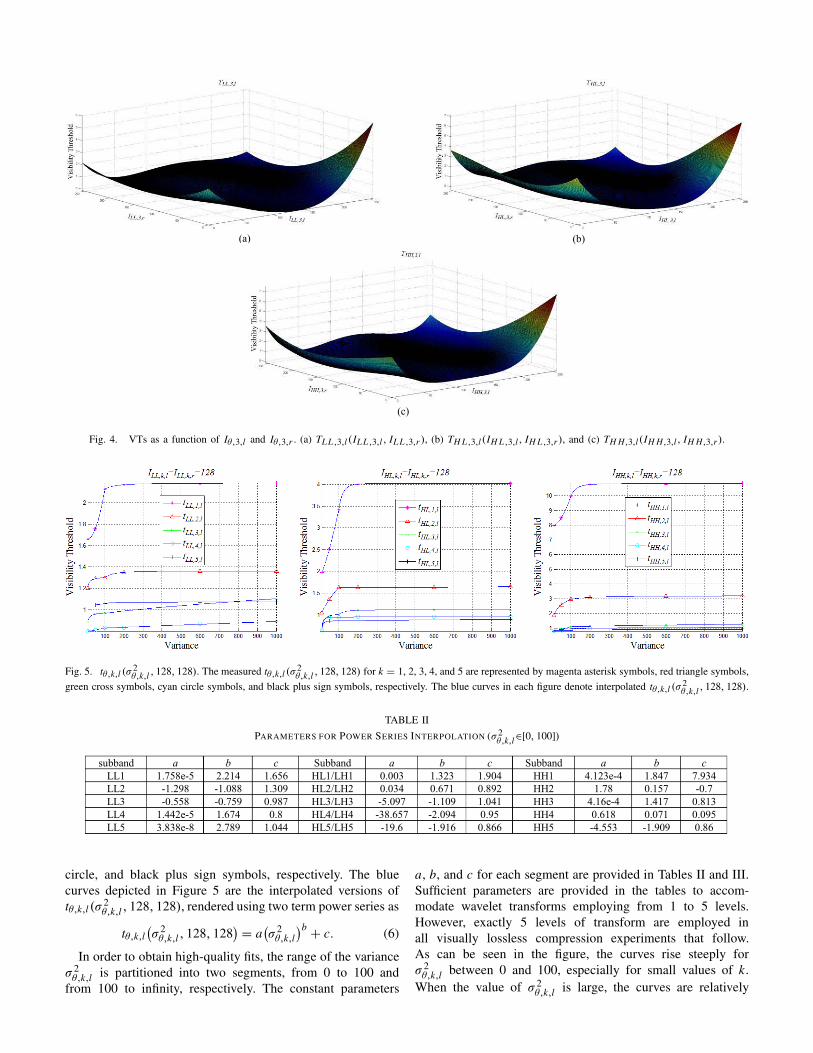
Fig. 4. VTs as a function of Iθ,3,l and Iθ,3,r . (a) TL L ,3,l(IL L ,3,l , IL L ,3,r ), (b) TH L ,3,l(IH L ,3,l, IH L ,3,r ), and (c) TH H,3,l(IH H,3,l, IH H,3,r ).
Fig. 5. tθ,k,l (σ2θ,k,l , 128, 128). The measured tθ,k,l (σ
2θ,k,l , 128, 128) for k = 1, 2, 3, 4, and 5 are represented by magenta asterisk symbols, red triangle symbols,
green cross symbols, cyan circle symbols, and black plus sign symbols, respectively. The blue curves in each figure denote interpolated tθ,k,l (σ2θ,k,l , 128, 128).
TABLE II
PARAMETERS FOR POWER SERIES INTERPOLATION (σ 2θ,k,l∈[0, 100])
circle, and black plus sign symbols, respectively. The bluecurves depicted in Figure 5 are the interpolated versions oftθ,k,l (σ
2θ,k,l , 128, 128), rendered using two term power series as
tθ,k,l(σ 2
θ,k,l , 128, 128) = a
(σ 2
θ,k,l
)b + c. (6)
In order to obtain high-quality fits, the range of the varianceσ 2
θ,k,l is partitioned into two segments, from 0 to 100 andfrom 100 to infinity, respectively. The constant parameters
a, b, and c for each segment are provided in Tables II and III.Sufficient parameters are provided in the tables to accom-modate wavelet transforms employing from 1 to 5 levels.However, exactly 5 levels of transform are employed inall visually lossless compression experiments that follow.As can be seen in the figure, the curves rise steeply forσ 2
θ,k,l between 0 and 100, especially for small values of k.When the value of σ 2
θ,k,l is large, the curves are relatively

568 IEEE TRANSACTIONS ON IMAGE PROCESSING, VOL. 24, NO. 2, FEBRUARY 2015
TABLE III
PARAMETERS FOR POWER SERIES INTERPOLATION (σ 2θ,k,l∈ [100, ∞])
constant. In general, the values of tθ,k,l (σ2θ,k,l , 128, 128) for
lower levels (higher frequency) are larger than those for higherlevels.
To conclude this sub-section, we discuss several practicalmatters regarding the measurement of VTs. First, we notethat the measured value of VTs can vary somewhat fromobserver to observer. The measured VTs may even varybetween the two eyes of a single observer. Thus, a veryconservative approach might be to employ many observersto obtain a VT for each eye of each observer for eachfixed choice of parameter settings. For each such choice, the“final measured VT” could then be taken as the minimumover all measured VTs for that choice. However, we do notfollow such a labor intensive approach here. Indeed, Figures3 and 5 represent measurements from only the right eye ofonly one observer, yet represent many weeks of observationeffort.
Second, also due to labor intensity, we had to carefully con-sider which parameter choices to employ in the measurementof VTs. The main motivation for this work is the surprisingfact that the right eye can sometimes perceive distortion inthe left image, even when that distortion is not visible bythe left eye. For this reason, we put more effort into themeasurement of the right eye thresholds t ′′θ,3,l(50, Iθ,3,l, Iθ,3,r ).From a limited set of experiments, it was determined thatthe perceived distortion to the right eye is more dependenton Iθ,3,r than Iθ,3,l . For this reason, nineteen values of Iθ,3,r
were employed, while only five values of Iθ,3,l wereutilized.
Although no theoretical justification has been provided tosupport our use of the proposed separable model, and it isnot possible to directly evaluate the “goodness of fit” ofthe proposed model for parameter values not used in theexperiments, it will be demonstrated in Subsection V.C that acompressor based on this model indeed yields visually losslessimagery. On the other hand, that does not imply that a moresophisticated model might not yield visually lossless imagerywith smaller compressed file sizes than those presented here.For example, a more sophisticated model might consider boththe variance of the wavelet data in left and right images.Similarly, the value of the variance used in the measurementof the nominal thresholds might be selected more carefully,even on a subband by subband basis, rather than using thefixed value of 50 as proposed herein.
B. Coding Results
Thirteen 8-bit monochrome stereo pairs are compressedand results are reported in units of bits/pixel. The stereo
pairs used in this experiment are from the Middlebury stereodatasets [35]–[38]. The left image of each stereo pair is shownin Figure 6. Each left image is compressed as describedin Section IV. The identical process is carried out for the rightimage, interchanging the roles of left and right. The encoderis implemented in Kakadu V6.1 [39]. Performance is reportedin Table IV for three encoding methods: information losslessJPEG2000, visually lossless JPEG2000 for 2D images [12],and our proposed visually lossless JPEG2000 for stereoscopic3D images. In every case, decompression can be performedusing as unmodified JPEG2000 decoder (kdu_expand).
As validated in the following section, the proposed codingmethod achieves visually lossless performance for each imagewhen viewed as a stereoscopic 3D pair, (as well as for theleft and right images viewed separately in 2D). On the otherhand, as mentioned in the Introduction, when the visuallylossless coding method for 2D images from [12] is adopted tocompress the left and right images independently, compressionartifacts are clearly visible when a compressed stereo pair isdisplayed in 3D mode. This is despite the fact that the leftand right images are indeed visually lossless when viewedseparately in 2D mode. This result holds for the VTs reportedin [12], as well as for VTs designed specifically for theSamsung monitor used in this work. The results reportedin Table IV are for the latter VTs. Evidently, larger bitratesare required to achieve visually lossless coding for 3D stereo-scopic images than for 2D images for the display and viewingconditions employed. This increased bit rate is due to crosstalkas discussed previously.
Comparing the performance of the method from [12] for2D images with the performance of our proposed method forstereoscopic 3D images, the average bitrate produced by theproposed method is higher, as expected. On the other hand,the average bitrate of the proposed coding method is lowerthan that for information lossless coding by roughly a factorof 1.36, for a compression ratio of about 4 to 1 without anyloss in visual quality.
C. Validation
In [12] and [40], spatial 3AFC testing was performed tovalidate that 2D images obtained after decompression werevisually lossless. As a part of that procedure, three copiesof a 2D image were displayed side-by-side on the screen.Unfortunately, three full resolution stereo pairs do not fitside-by-side on the screen. Visibility of artifacts, as wellas 3D perception of stereoscopic images can be adverselyimpacted if the dimensions of the images are decreased by

FENG et al.: METHODOLOGY FOR VISUALLY LOSSLESS JPEG2000 COMPRESSION 569
Fig. 6. The thirteen monochrome stereo images used in the experiments (only the left image of each stereo pair is shown). (1) Aloe, (2) Art, (3) Computer,(4) Wood2, (5) Teddy, (6) Moebius, (7) Dwarves, (8) Drumsticks, (9) Bowling2, (10) Dolls, (11) Midd1, (12) Reindeer, and (13) Books.
TABLE IV
BITRATES FOR (A) INFORMATION LOSSLESS JPEG2000, (B) VISUALLY LOSSLESS CODING FOR 2D IMAGES [12], AND
(C) THE PROPOSED VISUALLY LOSSLESS METHOD FOR STEREOSCOPIC 3D IMAGES
cropping or subsampling. Thus, such techniques should beavoided during perceptual testing. For this reason, spatial3AFC testing was found to be inappropriate for this work.Sequential 3AFC testing has been used previously in subjec-tive sound quality evaluations [41]. In this method, three audioclips were presented sequentially to subjects. Two of the clipswere original and one of the clips had been compressed. Thesubjects were forced to choose the clip that was different fromthe other two.
In this work, we employed sequential 3AFC testing forthe validation of compressed monochrome stereo pairs.Fifteen subjects with normal or corrected-to-normal visionparticipated in the validation. Each subject viewed the fullsequence of thirteen stereo pairs a total of six times. The orderof the thirteen stereo pairs was randomized in each of thesix sequences. The total number of subjective trials was then15 × 13 × 6 = 1170. In each such trial, one compressedcopy and two original copies of a stereo image were

570 IEEE TRANSACTIONS ON IMAGE PROCESSING, VOL. 24, NO. 2, FEBRUARY 2015
TABLE V
THE RESULTING SAMPLE PROPORTION OF CORRECT CHOICES FOR STEREOSCOPIC 3D IMAGES
displayed in stereo mode, with the subjects wearing 3D shutterglasses. These three copies were displayed sequentially inrandom order. The subjects could move backward/forwardbetween the three copies of the image via the left/right keyson the keyboard. The subjects were allowed to observe eachcopy of the image as many times and for however long theywanted. To avoid the phenomenon of persistence of vision,a black screen was displayed for 0.5 seconds while switchingbetween copies. Despite the fact that our VTs were designedat a typical viewing distance υ = 60 cm between subject anddisplay, the subjects were allowed to approach the screen asclosely as they wanted during the validation. According toa number shown in the upper left corner of the screen, thesubjects were asked to use the keyboard to indicate whichcopy was different from the other two. No guidance wasprovided to the subjects regarding the types of differences thatthey might encounter, e.g., image quality, depth, naturalness,or discomfort. Additionally, no feedback was provided to thesubjects to indicate whether their choices were correct.
It is possible that the 3AFC test detailed above may biasthe observer by implying that one image is different. However,it is worth noting that any resulting bias would be against thehypothesis that the images are visually lossless, and thus wouldnot invalidate a finding that the images were indeed visuallylossless.
For a given compressed stereo pair, the resulting sampleproportion of correct choices obtained from the subjectivevalidations is computed as
p̂ = nC/n, (7)
where nC is the number of correct choices out of then = 15 × 6 = 90 trials for that stereo pair. Under theassumption that the images are visually lossless, the populationproportion of correct choices would be 1/3. A confidenceinterval for the population percentage can becalculated [42] via
p̂ ± Z∗ ×√
p̂(1 − p̂
)/n, (8)
where the value of Z∗ is tabulated in [42] according to thedesired confidence level. For a 95% confidence interval, thevalue of Z∗ is 1.96. The number of correct responses foreach image, together with the resulting values of p̂ and 95%confidence intervals are provided in Table V. Figure 7 presentsthe same information in graphical form. Specifically, the heightof the blue bars represent the values of p̂, while the green
Fig. 7. Validation results. The blue rectangular bars represent the individualsample proportion of correct choices for each image individually. The greenvertical bars denote the 95% confidence interval for each image separately.The assumed population proportion of 1/3 is represented by the red dottedline.
error bars indicate the 95% confidence intervals. The valueof the hypothesized population fraction of correct responses(i.e., 1/3) is shown by the red dots. As can be seen in the figureand the table, the confidence intervals for individual images arerather loose (approximately ±0.1). On the other hand, takenin aggregate (over all 13 images), nC = 377 which resultsin p̂ = 377/1170 = 0.322, and a 95% confidence intervalwith lower and upper bounds of 0.349 and 0.295, respectively(0.322 ± 0.027). Since the hypothesized population meanof 1/3 is well within this 95% confidence interval, it is claimedthat the compressed monochrome stereo pairs are visuallylossless.
It should be emphasized that these results are forthe specific 3D stereoscopic display system and lightingconditions described in Section III. On the other hand, resultsfor other display systems and/or lighting conditions maybe obtained via the proposed methodology. Although onlyimages from the Middlebury stereo datasets [35]–[38] wereemployed in the formal validation studies, results are similarfor other stereo images. In particular, 3D images of naturalscenes were obtained by extracting the first frame fromvideo sequences in the RMIT3DV database [34], [43], [44].Informal validation studies verify that visually lossless qualityis also obtained for these images. This is not surprisingsince no actual images were employed in the design of VTs.

FENG et al.: METHODOLOGY FOR VISUALLY LOSSLESS JPEG2000 COMPRESSION 571
Indeed, only pseudo-randomly generated stimulus images wereused in this regard. Thus, while the compressor depends on theparticular stereoscopic display system and viewing conditionsemployed, it does not depend on any particular image source.
VI. CONCLUSIONS
A methodology for visually lossless compression ofmonochrome stereoscopic 3D images was provided. Sincethe crosstalk effect is an inherent perceivable problem incurrent 3D display technologies, the measurement of VTsin this work considered not only the factors characterizedfor 2D images in [12], but also the various combinationsof luminance values in both the left and right channels ofstereoscopic images. To ensure that neither eye can perceivequantization errors when crosstalk occurs, the final VT forthe left image is taken as the minimum between the VTsof the left eye and the right eye for distortion introduced inonly the left image. The same considerations apply to theright image, simply reversing the roles of left and right.
It is prohibitive to measure VTs for all possiblecombinations of coefficient variance and left/right image graylevels. Thus, a separable model for VTs was proposed. TheVTs obtained via the proposed model were then employedin the development of a visually lossless coding scheme formonochrome stereoscopic images. Compressed codestreamscreated via the proposed encoder can be decompressed usingany JPEG2000 compliant decoder.
The bitrate required for visually lossless compressionof 3D monochrome stereo pairs is larger than that requiredfor visually lossless 2D compression of the individual leftand right images. However, the resulting left and right imagesobtained via the proposed method are visually lossless in both2D and 3D mode, while the images compressed individuallyare not visually lossless in 3D mode. Additionally, theproposed method results in a significantly lower bit rate thanrequired for information lossless encoding, while still resultingin visually lossless quality. Sequential 3AFC testing wasconducted to validate that compressed monochrome stereopairs obtained from the proposed system are visually lossless.
REFERENCES
[1] A. P. Dal Poz, R. A. B. Gallis, J. F. C. da Silva, and E. F. O. Martins,“Object-space road extraction in rural areas using stereoscopic aerialimages,” IEEE Geosci. Remote Sens. Lett., vol. 9, no. 2, pp. 654–658,Jul. 2012.
[2] D. P. Noonan, P. Mountney, D. S. Elson, A. Darzi, and G.-Z. Yang,“A stereoscopic fibroscope for camera motion and 3D depth recoveryduring minimally invasive surgery,” in Proc. IEEE Int. Conf. Robot.Autom., Kobe, Japan, May 2009, pp. 4463–4468.
[3] L. Lipton, “The stereoscopic cinema: From film to digital projection,”SMPTE J., pp. 586–593, Sep. 2001.
[4] D. A. Bowman, 3D User Interfaces: Theory and Practice. Boston, MA,USA: Addison-Wesley, 2005.
[5] S. Pastoor and M. Wöpking, “3D displays: A review of current tech-nologies,” Displays, vol. 17, no. 2, pp. 100–110, Apr. 1997.
[6] H. Urey, K. V. Chellappan, E. Erden, and P. Surman, “State of the art instereoscopic and autostereoscopic displays,” Proc. IEEE, vol. 99, no. 4,pp. 540–555, Apr. 2011.
[7] M. Barkowsky, S. Tourancheau, K. Brunnström, K. Wang, andB. Andrén, “Crosstalk measurements of shutter glasses 3D displays,”in Proc. SID Int. Symp., 2011, pp. 812–815.
[8] S. Shestak, D. Kim, and S. Hwang, “Measuring of gray-to-gray crosstalkin a LCD based time-sequential stereoscopic display,” in SID Dig.,Seattle, WA, USA, May 2010, pp. 132–135.
[9] C.-C. Pan, Y.-R. Lee, K.-F. Huang, and T.-C. Huang, “Cross-talkevaluation of shutter-type stereoscopic 3D display,” in SID Dig., Seattle,WA, USA, May 2010, pp. 128–131.
[10] J. D. Yun, Y. Kwak, and S. Yang, “Evaluation of perceptual resolutionand crosstalk in stereoscopic displays,” J. Display Technol., vol. 9, no. 2,pp. 106–111, Feb. 2013.
[11] P. Boher, T. Leroux, V. C. Patton, and T. Bignon, “Optical characteriza-tion of shutter glasses stereoscopic 3D displays,” Proc. SPIE, vol. 7863,p. 786312, Feb. 2011.
[12] H. Oh, A. Bilgin, and M. W. Marcellin, “Visually lossless encoding forJPEG2000,” IEEE Trans. Image Process., vol. 22, no. 1, pp. 189–201,Jan. 2013.
[13] S.-M. Jung et al., “Improvement of 3D crosstalk with over-drivingmethod for the active retarder 3D displays,” in SID Symp. Dig. Tech.Papers, Seattle, WA, USA, May 2010, pp. 1264–1267.
[14] J. Konrad, B. Lacotte, and E. Dubois, “Cancellation of image crosstalkin time-sequential displays of stereoscopic video,” IEEE Trans. ImageProcess., vol. 9, no. 5, pp. 897–908, May 2000.
[15] S. Pastoor, “Human factors of 3D imaging: Results of recent researchat Heinrich-Hertz-Institute Berlin,” in Proc. 2nd Int. Display Workshop,1995, pp. 69–72.
[16] L. Wang et al., “Crosstalk evaluation in stereoscopic displays,”J. Display Technol., vol. 7, no. 4, pp. 208–214, Apr. 2011.
[17] H. C. Feng, M. W. Marcellin, and A. Bilgin, “Measurement of visibilitythresholds for compression of stereo images,” in Proc. Int. TelemeteringConf., San Diego, CA, USA, Oct. 2012.
[18] F. W. Campbell and J. G. Robson, “Application of Fourier analysis tothe visibility of gratings,” J. Physiol., vol. 197, pp. 551–566, Aug. 1968.
[19] S. J. Daly, “Visible differences predictor: An algorithm for the assess-ment of image fidelity,” Proc. SPIE, vol. 1666, pp. 2–15, Aug. 1992.
[20] A. B. Watson, G. Y. Yang, J. A. Solomon, and J. Villasenor, “Visibility ofwavelet quantization noise,” IEEE Trans. Image Process., vol. 6, no. 8,pp. 1164–1175, Aug. 1997.
[21] H. Oh, A. Bilgin, and M. W. Marcellin, “Multi-resolution visuallylossless image coding using JPEG2000,” in Proc. IEEE Int. Conf. ImageProcess., Hong Kong, Sep. 2010, pp. 2581–2584.
[22] H.-C. Feng, M. W. Marcellin, and A. Bilgin, “Visually lossless compres-sion of stereo images,” in Proc. IEEE Data Compress. Conf., Snowbird,UT, USA, Mar. 2013, p. 490.
[23] H. C. Feng, M. W. Marcellin, and A. Bilgin, “Validation for visuallylossless compression of stereo images,” in Proc. Int. Telemetering Conf.,Las Vegas, NV, USA, Oct. 2013.
[24] M. Menozzi, U. Näpflin, and H. Krueger, “CRT versus LCD: A pilotstudy on visual performance and suitability of two display technologiesfor use in office work,” Displays, vol. 20, no. 1, pp. 3–10, Feb. 1999.
[25] Methodology for the Subjective Assessment of the Quality of TelevisionPictures, document ITU-R Rec. BT.500-12, Sep. 2009.
[26] Subjective Assessment Methods for Image Quality in High-DefinitionTelevision, document ITU-R Rec. BT.710-4, Nov. 1998.
[27] A. J. Ahumada, Jr., and H. A. Peterson, “Luminance-model-based DCTquantization for color image compression,” Proc. SPIE, vol. 1666,pp. 365–374, Aug. 1992.
[28] C.-H. Chou and C.-W. Chen, “A perceptually optimized 3D subbandcodec for video communication over wireless channels,” IEEE Trans.Circuits Syst. Video Technol., vol. 6, no. 2, pp. 143–156, Apr. 1996.
[29] C.-H. Chou and Y.-C. Li, “A perceptually tuned subband image coderbased on the measure of just-noticeable-distortion profile,” IEEE Trans.Circuits Syst. Video Technol., vol. 5, no. 6, pp. 467–476, Dec. 1995.
[30] D. H. Brainard, “The psychophysics toolbox,” Spatial Vis., vol. 10, no. 4,pp. 433–436, 1997.
[31] A. B. Watson and D. G. Pelli, “QUEST: A Bayesian adaptive psycho-metric method,” Perception Psychophys., vol. 33, no. 2, pp. 113–120,1983.
[32] D. Taubman and M. Marcellin, JPEG2000: Image CompressionFundamentals, Standards and Practice. Boston, MA, USA: Kluwer,2002.
[33] G. Saygili, C. G. Gürler, and A. M. Tekalp, “Quality assessment ofasymmetric stereo video coding,” in Proc. 17th IEEE ICIP, Sep. 2010,pp. 4009–4012.
[34] H. R. Wu, A. R. Reibman, W. Lin, F. Pereira, and S. S. Hemami,“Perceptual visual signal compression and transmission,” Proc. IEEE,vol. 101, no. 9, pp. 2025–2043, Aug. 2013.

572 IEEE TRANSACTIONS ON IMAGE PROCESSING, VOL. 24, NO. 2, FEBRUARY 2015
[35] D. Scharstein and R. Szeliski. Middlebury Stereo Datasets. [Online].Available: http://vision.middlebury.edu/stereo/, accessed Dec. 6, 2011.
[36] D. Scharstein and R. Szeliski, “High-accuracy stereo depth maps usingstructured light,” in Proc. IEEE Comput. Soc. Conf. Comput. Vis. PatternRecognit. (CVPR), vol. 1. Madison, WI, USA, Jun. 2003, pp. 195–202.
[37] D. Scharstein and C. Pal, “Learning conditional random fields forstereo,” in Proc. IEEE Comput. Soc. Conf. Comput. Vis. PatternRecognit. (CVPR), Minneapolis, MN, USA, Jun. 2007, pp. 1–8.
[38] H. Hirschmüller and D. Scharstein, “Evaluation of cost functions forstereo matching,” in Proc. IEEE Comput. Soc. Conf. Comput. Vis. PatternRecognit. (CVPR), Minneapolis, MN, USA, Jun. 2007, pp. 1–8.
[39] Kakadu software. [Online]. Available: http://www.kakadusoftware.com,accessed Oct. 7, 2010.
[40] D. M. Chandler, N. L. Dykes, and S. S. Hemami, “Visually losslesscompression of digitized radiographs based on contrast sensitivity andvisual masking,” Proc. SPIE, vol. 5749, pp. 359–372, Apr. 2005.
[41] M. Frank, A. Sontacchi, T. Lindenbauer, and M. Opitz, “Subjectivesound quality evaluation of a codec for digital wireless transmission,”in Proc. Audio Eng. Soc. 132nd Conv., Budapest, Hungary, Apr. 2012.
[42] D. J. Rumsey, Statistics Workbook for Dummies. Hoboken, NJ, USA:Wiley, 2005.
[43] RMIT3DV: An Uncompressed Stereoscopic 3D HD Video Library.[Online]. Available: http://www.rmit3dv.com/index.php, accessed Jun. 5,2014.
[44] E. Cheng, P. Burton, J. Burton, A. Joseski, and I. Burnett, “RMIT3DV:Pre-announcement of a creative commons uncompressed HD 3Dvideo database,” in Proc. 4th Int. Workshop Quality MultimediaExper. (QoMEX), Jul. 2012, pp. 212–217.
Hsin-Chang Feng received the B.S. degree inelectronics engineering from the Oriental Instituteof Technology, Taipei, Taiwan, in 2002, and theM.S. degree in electrical engineering from TatungUniversity, Taipei, in 2008. He is currently pursuingthe Ph.D. degree in electrical and computer engi-neering from the University of Arizona, Tucson,AZ, USA. His current research interests includestereoscopic 3D image, perceptual image processing,and data compression.
Michael W. Marcellin (S’81–M’87–SM’93–F’02)was born in Bishop, CA, USA, in 1959. He receivedthe B.S. (summa cum laude) degree in electricalengineering from San Diego State University, SanDiego, CA, USA, in 1983, where he was recognizedas the most outstanding student in the College ofEngineering, and the M.S. and Ph.D. degrees inelectrical engineering from Texas A&M University,College Station, TX, USA, in 1985 and 1987,respectively.
He has been with the University of Arizona,Tucson, AZ, USA, since 1988, where he is currently a Regents’ Professor ofElectrical and Computer Engineering. He has authored or co-authored over250 papers in international journals and conferences, and has co-authoreda book entitled JPEG2000: Image Compression Fundamentals, Standardsand Practice (Boston, MA, USA: Kluwer Academic Publishers, 2002). Thisbook is a graduate level textbook on image compression fundamentals andthe definitive reference on JPEG2000. His current research interests includedigital communication and data storage systems, data compression, andsignal processing.
Dr. Marcellin is a major contributor to JPEG2000, the second-generationstandard for image compression. Throughout the standardization process, hewas the Chair of the JPEG2000 Verification Model Ad Hoc Group, whichwas responsible for the software implementation and documentation of theJPEG2000 algorithm. He was a Consultant to Digital Cinema Initiatives,a consortium of Hollywood studios, on the development of the JPEG2000profiles for digital cinema. He is a member of the Tau Beta Pi, Eta KappaNu, and Phi Kappa Phi. He was a recipient of the National ScienceFoundation Young Investigator Award in 1992, the IEEE Signal ProcessingSociety Senior (Best Paper) Award in 1993, the University of ArizonaTechnology Innovation Award in 2006, and Teaching Awards from NanyangTechnological University in 1990 and 2001, the IEEE/Eta Kappa Nu StudentSection in 1997, and the University of Arizona College of Engineeringin 2000, 2010, 2013. He was named as the San Diego State UniversityDistinguished Engineering Alumnus in 2003. From 2001 to 2006, he was theLitton Industries John M. Leonis Distinguished Professor of Engineering. Heis currently the International Foundation for Telemetering Chaired Professorof Electrical and Computer Engineering with the University of Arizona.
Ali Bilgin (S’94–M’03–SM’08) received theB.S. degree in electronics and telecommunicationsengineering from Istanbul Technical University,Istanbul, Turkey, in 1992, the M.S. degree in elec-trical engineering from San Diego State University,San Diego, CA, USA, in 1995, and the Ph.D. degreein electrical engineering from the University ofArizona, Tucson, AZ, USA, in 2002. He is cur-rently an Assistant Professor with the Departmentof Biomedical Engineering and the Department ofElectrical and Computer Engineering, University of
Arizona. He has authored or co-authored over 175 research papers ininternational journals and conferences. He holds nine granted and severalpending patents. Dr. Bilgin was on the Organizing Committees of manyconferences, and was an Associate Editor of the IEEE SIGNAL PROCESSING
LETTERS from 2010 to 2012 and the IEEE TRANSACTIONS ON IMAGE
PROCESSING from 2010 to 2014. He is currently an Associate Editor of theIEEE TRANSACTIONS ON COMPUTATIONAL IMAGING. His current researchinterests include signal and image processing, image and video coding, datacompression, and magnetic resonance imaging.


![560 – 579 560. The Festival of Temuir [celebrated] by … 560 to 579.pdf560 – 579 560. The Festival of Temuir [celebrated] by Diarmait, son of Cerball. 560 Annals of Ulster The](https://img.pdfslide.net/doc/110x75/5b0051c87f8b9a84338c75d3/560-579-560-the-festival-of-temuir-celebrated-by-560-to-579pdf560-.jpg)