Embed Size (px)
Citation preview
1
Characterization of the Thermophysical Properties of Riser Sleeve Materials
and Analysis of Riser Sleeve Performance
Thomas J Williams, Richard A Hardin, and Christoph Beckermann
Department of Mechanical and Industrial Engineering
The University of Iowa, Iowa City, 52242
Abstract
Riser sleeves are an effective tool in the steel foundry industry for minimizing riser size and
increasing casting yield. Reliable simulation of the performance of riser sleeves requires accurate
temperature dependent thermophysical properties. Unfortunately there is little or no such
property data available in the open literature. A limited number of sleeve manufacturers provide
advice and properties as “black box” databases. The “black box” temperature dependent property
data and boundary conditions are proprietary, hidden from the simulation software user.
Validated sleeve properties that are openly available to modelers are as necessary as the “open”
mold and metal properties they routinely use in designing casting processes. Here a procedure
for determining sleeve thermophysical properties and its results are presented. In the procedure,
temperature dependent properties of several commonly used sleeve materials are determined
through achieving agreement between measured and predicted temperatures throughout the
casting process. In order to address the lack of information regarding optimal use of riser sleeves,
the performance of different sleeve materials is analyzed using the properties in casting
simulations. The modulus extension factor, a quantity which describes sleeve performance, is
calculated for several sleeve materials. Analyzing the effect of sleeve performance characteristics
on casting yield, it is found that the exothermic reaction provides no discernable advantage to
casting yield improvement unless it also increases the modulus extension factor, regardless of
casting size for the sleeves tested in this study. From the analysis of the effect of sleeve thickness
on casting yield, it is found that most commercially available riser sleeves have thicknesses
which are too small to maximize the casting yield, particularly for risers of 8” diameter and
larger.
Introduction
The riser sleeve is a reliable tool for increasing casting yield and its use is ubiquitous throughout
the metal sand casting industry. It is estimated that about 80% of all steel castings are produced
using riser sleeves, and the U.S. steel foundry industry alone spends about $38 million per year
on riser sleeves. Riser sleeves used in steel casting are generally formulated as purely insulating
or exothermically insulating, where a thermite reaction is typically used for heat generation. In
short, they are referred to as insulating or exothermic sleeves. Despite the extent of sleeve use, a
survey of foundries found that there is a lack of consensus on how to properly use riser sleeves.1
Sleeve suppliers use different raw materials of unknown and proprietary compositions and
properties in their manufacturing processes. They provide advice and guidance on sleeve use. As
a result, application of riser sleeves in foundries is largely based on trusting the supplier,
guesswork, and trial-and-error testing by foundries. There is little quantitative data provided to
foundries for deciding which sleeve, from which supplier, is most effective for a given casting

2
application. Most foundries use computer casting simulation to determine riser sizes. However,
the sleeve material thermophysical properties required as input data for simulations either are
either not available, or are provided by a limited number of suppliers for their products as “black
box” databases. These “black box” property databases also include supplier recommended
temperature dependent heat transfer coefficients between various casting system materials (i.e.
the casting-sleeve and sleeve-mold interfaces); these are also hidden from the user. The accuracy
of these properties and coefficients is unknown. The foundry trusts that the suppliers’ databases
are accurate. Since the “black box” property data is hidden from the software user, thorough
calibration using measured temperatures to validate the data for a given foundry’s casting
practice is not possible. Finally, since the details of the thermophysical properties are unknown,
it is difficult to say what causes one sleeve to appear superior to another for a given application.
It is estimated by the Steel Founders’ Society of America (SFSA) that if the thermophysical
properties of riser sleeve materials were known accurately, selection of riser sizes could be
optimized such that the industry’s casting yield could be increased by at least 10% (from
approximately 50% currently to 55%). The resulting energy savings would be about 1.5 trillion
BTU per year for the U.S. steel foundry industry. Significant additional benefits would arise
from improved quality, reduced costs, and increased production capacity.
Literature on riser sleeve material properties and their measurements is scarce or incomplete if
available. Older literature presents some data on the sleeve performance and their effects on
cooling history and solidification time, effective increase in riser modulus, and their effect on
riser piping and resulting riser volume reduction2-5
. Foseco has provided guidance over the years
for many of their sleeve products in their Foundryman’s Handbook5, and nomographs and
Feedercalc software5. More recently general temperature dependent curves for density, specific
heat and thermal conductivity have been published6 but these curves are incomplete. The plots
of data in this work give no numerical values and only provide the reader trends of the
properties’ dependency on temperature. Because of the lack of property data for accurate
simulation, SFSA members have developed their own practices for using riser sleeve products,
such as deciding when to use an insulating or exothermic sleeve1. Sleeve manufacturers ASK
Chemicals and Foseco have provided sleeve material properties to users of the casting simulation
software MAGMAsoft7 through its property database. However, these are proprietary data and
hidden from the user.
In the work described here, temperature dependent sleeve material property data are developed
by matching experimental temperature data recorded during casting trials to simulation
temperature results through iteratively modifying the sleeve material properties used in the
simulations to achieve agreement. Such a property estimation technique is generally referred to
as inverse analysis. A similar inverse approach to sleeve and sand mold material property
estimation was taken by Ignaszak et al.8,9
. Rather than develop temperature dependent data, they
determined average exothermic sleeve material property data (single values) for use in
simulation. Their experiments were similar to the current work, where cylindrical castings were
poured. They placed two temperature sensors in the metal of each cylinder, one at the centerline
and one 30 mm from the outer diameter. In the experiments one cylinder was cast without a
3
sleeve, from which properties of the mold and metal were estimated. Here the experimental
casting without sleeve is referred to as a control casting. The property data determined by
Ignaszak et al. are for sleeve materials they describe as “insulating-exothermic” and are labeled
in their work as “L2” and “L5”. The relevant property data they determined for the sleeve
materials are: heat capacity, ρcp = 560 and 500 x 103 (kJ/m
3-K), conductivity, k = 1.09 and 0.98
(W/m-K), exothermic heat generation = 2,257 and 1,857 (kJ/kg), and exothermic ignition
temperature 150 (°C), respectively for the “L2” and “L5” sleeves. Ignaszak et al. acknowledge
this ignition temperature is “relatively low” and mention that is produced the lowest error when
compared with measurements in the inverse modeling.
In the current work, experiments are performed to measure temperatures for cylinder-shaped
steel castings for use in property estimation via inverse modeling. In these casting experiments,
thermocouples are used to record temperature data in the steel, riser sleeve, and sand mold as the
casting cools. The experiments were performed in heats of approximately 300 pounds per pour.
For each experimental heat, a control casting was poured having no sleeve. From the control
casting experiment the temperature dependent properties and solidification parameters for the
mold and metal were determined, such that the error between the measured temperatures and the
simulation temperatures was minimized for each heat of steel. In addition to the control casting
poured in each experimental heat, between two and five cylindrical castings with sleeves were
poured depending on the sizes of the sleeves used. Using the properties determined for the steel
and mold from the control experiment, iterative simulations were run for the sleeved cylinders
where the thermophysical properties of riser sleeve materials were estimated by adjusting the
sleeve properties. Final sleeve material properties are determined such that the error between the
experimental temperature data for the castings with sleeves and their simulated temperature data
is reduced to the smallest error obtainable over approximately 100 iterative simulations
performed per sleeve. The casting software MAGMAsoft is used for the simulations performed in
this study. After the sleeve material properties were determined, parametric studies were carried
out to understand how sleeve properties affect sleeve performance. Using the riser sleeve
properties estimated, a method of quantifying sleeve performance is proposed and detailed in the
current work using the modulus extension factor. A study of sleeve performance characteristics
on casting yield is presented. This study investigates how exothermic and insulating sleeve
characteristics influence riser size and casting yield. Finally, the effect of sleeve thickness on
sleeve performance through increasing casting yield is evaluated, and observations are made on
commercially available sleeve sizes and optimal sleeve thickness for maximizing casting yield.
Casting Experiments
Rather than perform bench top sleeve material property measurements outside of the casting
process, it was decided that the inverse modeling approach would be used to determine the best
effective sleeve material properties and boundary conditions for modeling sleeves in an actual
casting situation. In a real casting application, there are physical phenomena such as the gases
evolved by the sleeve exothermic reaction or the burning off of the sand mold binder which
affect heat transfer at the sleeve-metal and mold interfaces and cannot be ignored. Also, sleeve
properties before and after the exothermic reaction are expected to be different, introducing a
4
hysteresis effect as the casting cools. By using an actual casting process for estimating the
properties, issues like this can be taken into account in the property determination. In addition,
the accuracy of the properties developed can be readily evaluated by comparing measured and
predicted temperatures.
The casting experiments presented in this paper were conducted at the University of Northern
Iowa (UNI) Metal Casting Center. As described above, the casting experiments were performed
over multiple steel heats. Using a control casting in each heat ensures that accurate steel and
sand properties specific to each heat are used. Silica sand molds were used in all experiments
with a 1.25% Pepset polyurethane no bake binder based on total sand weight. All castings were
poured using a low-alloy steel, ASTM A216 Grade WCB steel. The range of liquidus and
solidus temperatures in the experiments found from the steel temperature measurements were
1470 to 1505 C (2678 to 2741 F) and 1340 to 1410 C (2444 to 2570 F), respectively. A formal
survey of riser sleeve use by SFSA member foundries was conducted10
. The most commonly
used riser sleeve products identified by the survey were investigated in this study as listed in
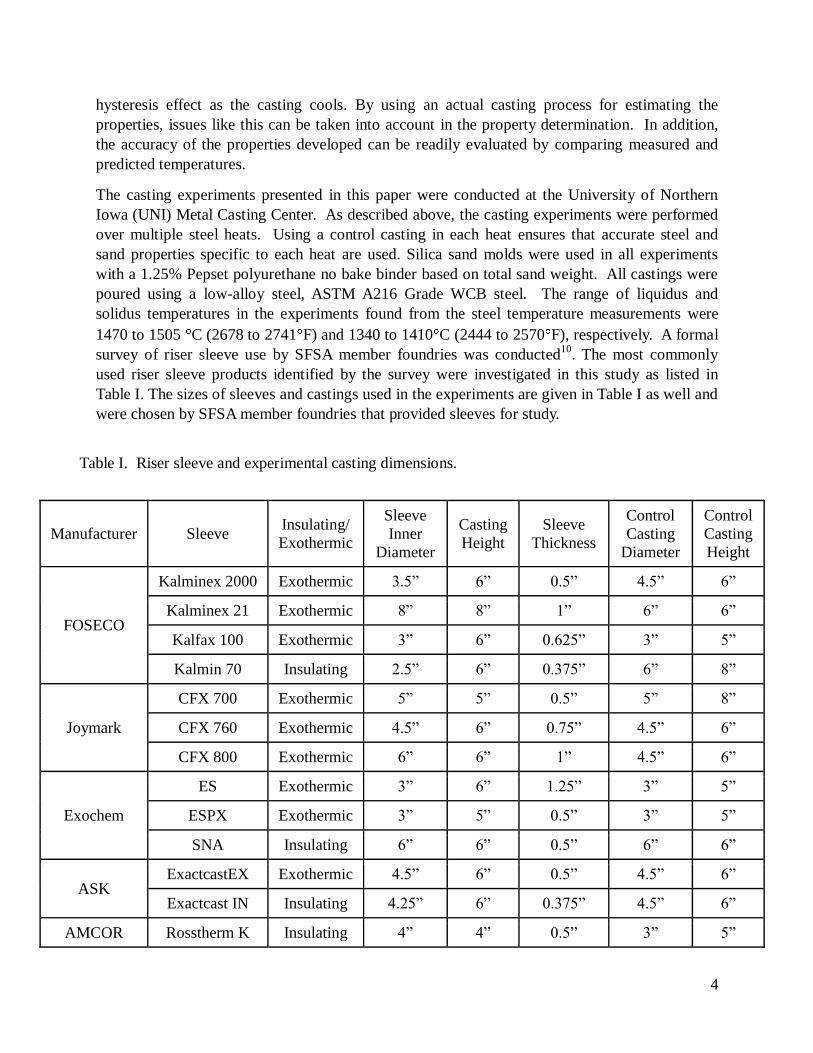
Table I. The sizes of sleeves and castings used in the experiments are given in Table I as well and
were chosen by SFSA member foundries that provided sleeves for study.
Table I. Riser sleeve and experimental casting dimensions.
Manufacturer Sleeve Insulating/
Exothermic
Sleeve
Inner
Diameter
Casting
Height
Sleeve
Thickness
Control
Casting
Diameter
Control
Casting
Height
FOSECO
Kalminex 2000 Exothermic 3.5” 6” 0.5” 4.5” 6”
Kalminex 21 Exothermic 8” 8” 1” 6” 6”
Kalfax 100 Exothermic 3” 6” 0.625” 3” 5”
Kalmin 70 Insulating 2.5” 6” 0.375” 6” 8”
Joymark
CFX 700 Exothermic 5” 5” 0.5” 5” 8”
CFX 760 Exothermic 4.5” 6” 0.75” 4.5” 6”
CFX 800 Exothermic 6” 6” 1” 4.5” 6”
Exochem
ES Exothermic 3” 6” 1.25” 3” 5”
ESPX Exothermic 3” 5” 0.5” 3” 5”
SNA Insulating 6” 6” 0.5” 6” 6”
ASK ExactcastEX Exothermic 4.5” 6” 0.5” 4.5” 6”
Exactcast IN Insulating 4.25” 6” 0.375” 4.5” 6”
AMCOR Rosstherm K Insulating 4” 4” 0.5” 3” 5”
5
An experimental setup was devised to measure the effect of the sleeve on the casting
solidification process without interference from other casting process variables. For example no
hot topping was used and a mold top of 2” thick was also used for a consistent heat loss through
the top surface of the castings. A sand mold pouring cup was placed on top of the mold through
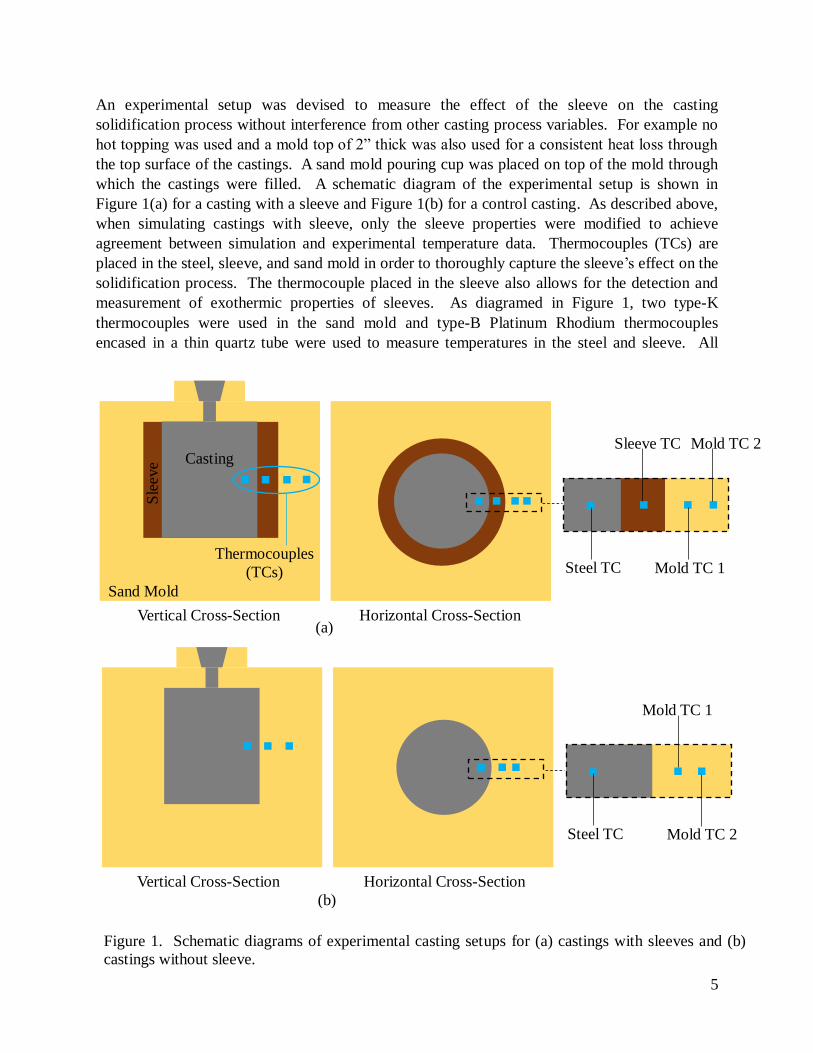
which the castings were filled. A schematic diagram of the experimental setup is shown in
Figure 1(a) for a casting with a sleeve and Figure 1(b) for a control casting. As described above,
when simulating castings with sleeve, only the sleeve properties were modified to achieve
agreement between simulation and experimental temperature data. Thermocouples (TCs) are
placed in the steel, sleeve, and sand mold in order to thoroughly capture the sleeve’s effect on the
solidification process. The thermocouple placed in the sleeve also allows for the detection and
measurement of exothermic properties of sleeves. As diagramed in Figure 1, two type-K
thermocouples were used in the sand mold and type-B Platinum Rhodium thermocouples
encased in a thin quartz tube were used to measure temperatures in the steel and sleeve. All
Sand Mold
Thermocouples
(TCs)
Casting
Vertical Cross-Section Horizontal Cross-Section
Steel TC Mold TC 1
Sleeve TC
Sle
eve
Mold TC 2
Vertical Cross-Section Horizontal Cross-Section
Steel TC Mold TC 2
Mold TC 1
(a)
(b)
Figure 1. Schematic diagrams of experimental casting setups for (a) castings with sleeves and (b)
castings without sleeve.
6
thermocouples were positioned at approximately the riser mid-height. The sand mold
thermocouples were positioned approximately 10 and 20 mm from the mold-steel or mold-sand
interfaces. The thermocouple in the metal was positioned approximately 50 mm from the metal-
mold or metal-sleeves interfaces, such that the initial cool down from pouring to liquidus
temperature, and the liquidus temperature and start of solidification could be sensed. The
thermocouple positions varied slightly experiment-by-experiment due to the limitations of
instrumenting the molds in a foundry setting; the average position variation was 2 mm and the
maximum was 5 mm. However, the final TC positions were carefully measured experiment-by-
experiment before pouring and were recorded for each experiment so the TC locations in the
simulations could match the experiments as closely as possible. Whenever and wherever
possible, TC positions were confirmed after the casting cooled to room temperature. It was
found that having accurate knowledge of the TC positions greatly reduces the inverse modeling
simulation iterations required to achieve decent agreement between all measured and simulated
TCs. This knowledge also reduces uncertainty in the final data judged by the error between the
final measured and predicted temperatures.
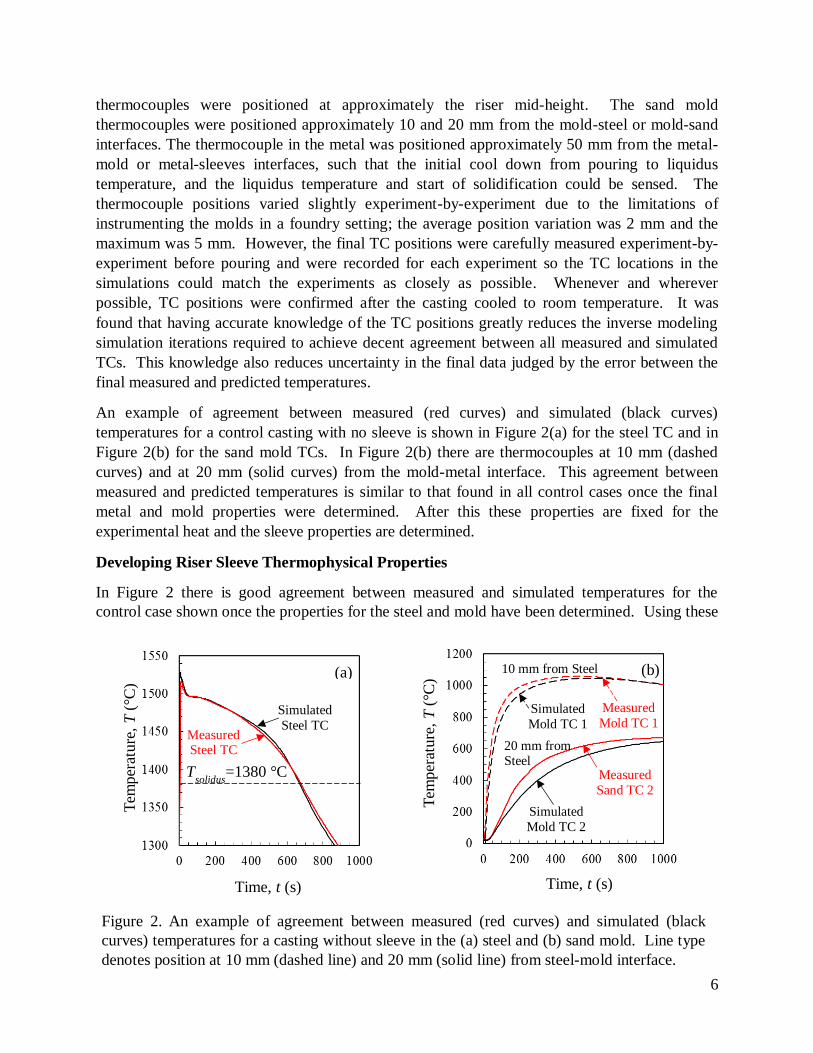
An example of agreement between measured (red curves) and simulated (black curves)
temperatures for a control casting with no sleeve is shown in Figure 2(a) for the steel TC and in
Figure 2(b) for the sand mold TCs. In Figure 2(b) there are thermocouples at 10 mm (dashed
curves) and at 20 mm (solid curves) from the mold-metal interface. This agreement between
measured and predicted temperatures is similar to that found in all control cases once the final
metal and mold properties were determined. After this these properties are fixed for the
experimental heat and the sleeve properties are determined.
Developing Riser Sleeve Thermophysical Properties
In Figure 2 there is good agreement between measured and simulated temperatures for the
control case shown once the properties for the steel and mold have been determined. Using these
Time, t (s) Time, t (s)
Tem
per
ature
, T
(°C
)
Tem
per
ature
, T
(°C
)
Tsolidus
=1380 °C
Measured Steel TC
Simulated
Steel TC
(a) (b)
Measured
Sand TC 2
Simulated
Mold TC 2
Figure 2. An example of agreement between measured (red curves) and simulated (black
curves) temperatures for a casting without sleeve in the (a) steel and (b) sand mold. Line type
denotes position at 10 mm (dashed line) and 20 mm (solid line) from steel-mold interface.
Simulated
Mold TC 1
Measured
Mold TC 1
10 mm from Steel
20 mm from Steel
7
mold and steel properties for a given heat poured, the properties are determined for the sleeved
risers poured in that heat. It was found that only small changes needed to be made to the mold
properties from one experimental control case dataset to the next to achieve agreement between
measured and predicted temperatures. For the steel, the solidification temperatures and solid
fraction curves required heat-to-heat modification, which also did not vary to a great degree due
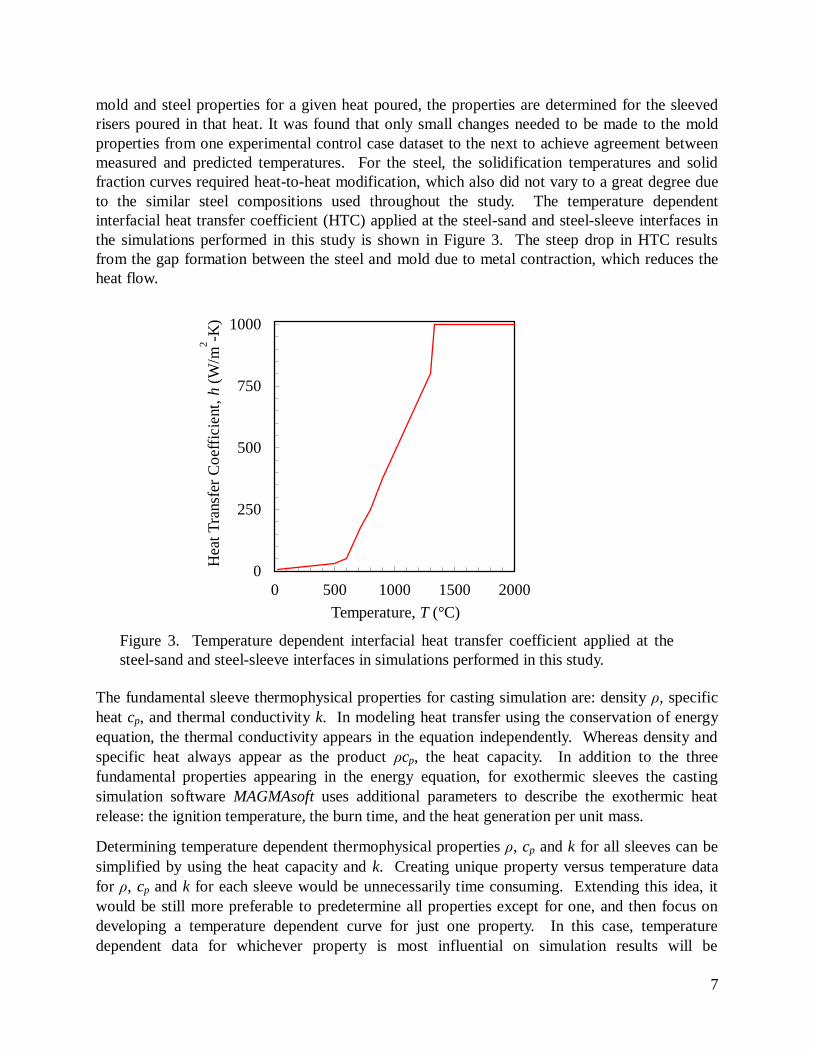
to the similar steel compositions used throughout the study. The temperature dependent
interfacial heat transfer coefficient (HTC) applied at the steel-sand and steel-sleeve interfaces in
the simulations performed in this study is shown in Figure 3. The steep drop in HTC results
from the gap formation between the steel and mold due to metal contraction, which reduces the
heat flow.
The fundamental sleeve thermophysical properties for casting simulation are: density ρ, specific
heat cp, and thermal conductivity k. In modeling heat transfer using the conservation of energy
equation, the thermal conductivity appears in the equation independently. Whereas density and
specific heat always appear as the product ρcp, the heat capacity. In addition to the three
fundamental properties appearing in the energy equation, for exothermic sleeves the casting
simulation software MAGMAsoft uses additional parameters to describe the exothermic heat
release: the ignition temperature, the burn time, and the heat generation per unit mass.
Determining temperature dependent thermophysical properties ρ, cp and k for all sleeves can be
simplified by using the heat capacity and k. Creating unique property versus temperature data
for ρ, cp and k for each sleeve would be unnecessarily time consuming. Extending this idea, it
would be still more preferable to predetermine all properties except for one, and then focus on
developing a temperature dependent curve for just one property. In this case, temperature
dependent data for whichever property is most influential on simulation results will be
0
250
500
750
1000
0 500 1000 1500 2000
Figure 3. Temperature dependent interfacial heat transfer coefficient applied at the
steel-sand and steel-sleeve interfaces in simulations performed in this study.
Temperature, T (°C)
Hea
t T
ransf
er C
oef
ficie
nt,
h (
W/m
2
-K)
8
developed, while all other properties are predetermined. The predetermined properties can be
considered to be representative of the effective average property values.
In order to determine which thermophysical property is the most influential on sleeve
performance and simulation results, a simple cylinder casting was simulated. The cylinder is
surrounded by a riser sleeve with base thermophysical properties k, ρ, and cp. The most
influential of the properties can be discerned by modifying the thermal conductivity, k, and heat
capacity, ρcp and determining the sensitivity of a measure of sleeve performance to the property
changes. The casting solidification time is taken as the measure of performance.
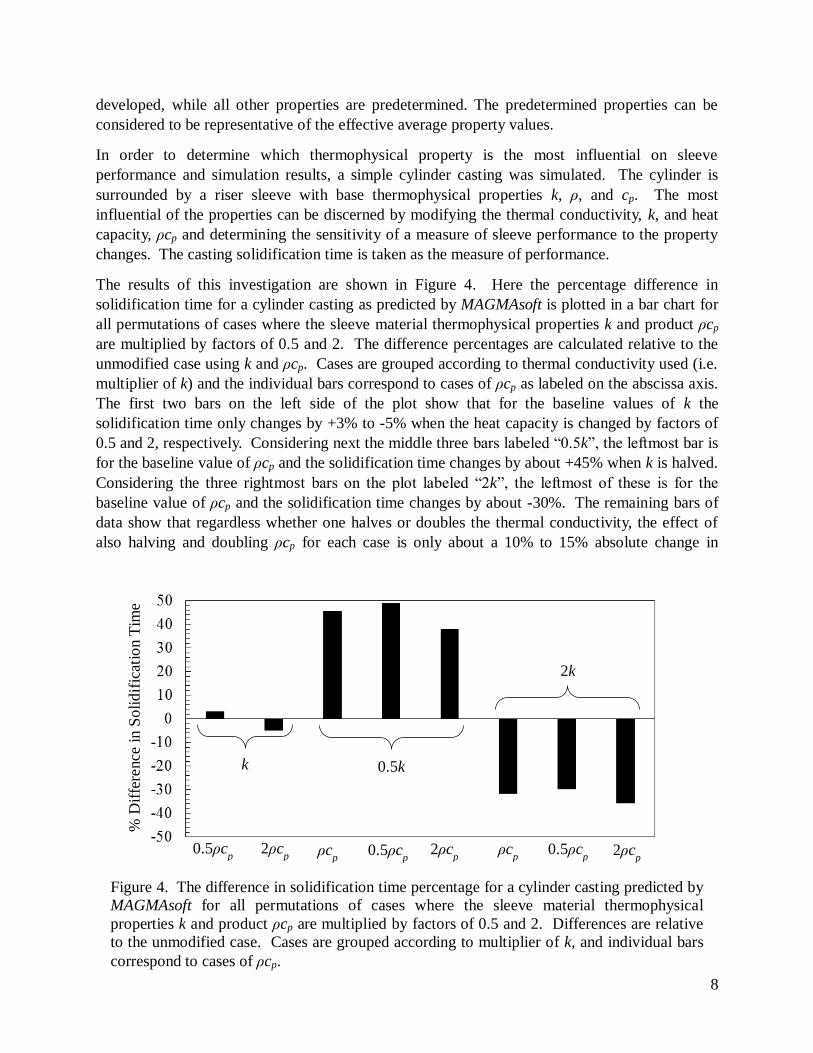
The results of this investigation are shown in Figure 4. Here the percentage difference in
solidification time for a cylinder casting as predicted by MAGMAsoft is plotted in a bar chart for
all permutations of cases where the sleeve material thermophysical properties k and product ρcp
are multiplied by factors of 0.5 and 2. The difference percentages are calculated relative to the
unmodified case using k and ρcp. Cases are grouped according to thermal conductivity used (i.e.
multiplier of k) and the individual bars correspond to cases of ρcp as labeled on the abscissa axis.
The first two bars on the left side of the plot show that for the baseline values of k the
solidification time only changes by +3% to -5% when the heat capacity is changed by factors of
0.5 and 2, respectively. Considering next the middle three bars labeled “0.5k”, the leftmost bar is
for the baseline value of ρcp and the solidification time changes by about +45% when k is halved.
Considering the three rightmost bars on the plot labeled “2k”, the leftmost of these is for the
baseline value of ρcp and the solidification time changes by about -30%. The remaining bars of
data show that regardless whether one halves or doubles the thermal conductivity, the effect of
also halving and doubling ρcp for each case is only about a 10% to 15% absolute change in
k 0.5k
2k
% D
iffe
rence
in S
oli
dif
icat
ion T
ime
0.5ρcp 2ρc
p ρc
p 0.5ρc
p 2ρc
p ρc
p 0.5ρc
p 2ρc
p
Figure 4. The difference in solidification time percentage for a cylinder casting predicted by
MAGMAsoft for all permutations of cases where the sleeve material thermophysical
properties k and product ρcp are multiplied by factors of 0.5 and 2. Differences are relative
to the unmodified case. Cases are grouped according to multiplier of k, and individual bars
correspond to cases of ρcp.
9
solidification time. The changes in solidification time are about 2 to 3 times more sensitive to
changes in k than they are to changes in ρcp. It is clear from this brief study that the thermal
conductivity is the most influential property. These findings are also supported by those of
Midea et al.6 who studied sensitivities of solidification times at the riser neck and near the
casting-riser interface to changes in k and ρ or cp. As a result, in this study the density and
specific heat were set to pre-determined or average values and the temperature dependent
property development is focused on determining appropriate thermal conductivity data.
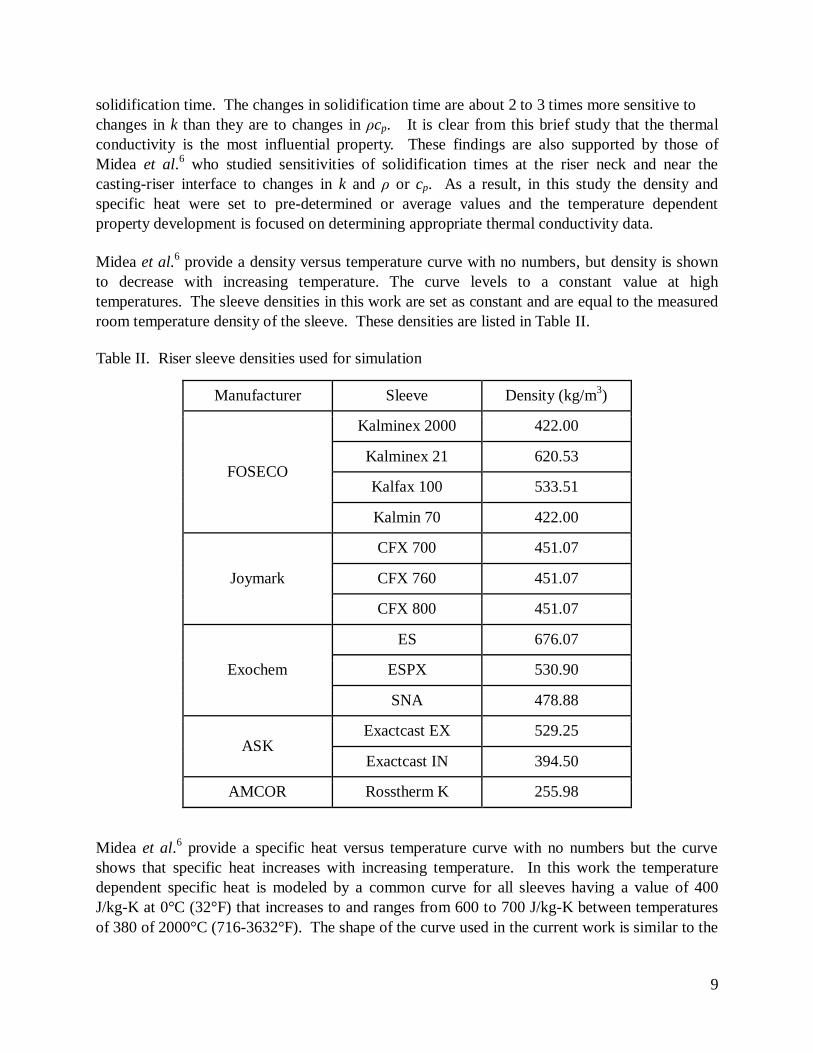
Midea et al.6 provide a density versus temperature curve with no numbers, but density is shown
to decrease with increasing temperature. The curve levels to a constant value at high
temperatures. The sleeve densities in this work are set as constant and are equal to the measured
room temperature density of the sleeve. These densities are listed in Table II.
Manufacturer Sleeve Density (kg/m3)
FOSECO
Kalminex 2000 422.00
Kalminex 21 620.53
Kalfax 100 533.51
Kalmin 70 422.00
Joymark
CFX 700 451.07
CFX 760 451.07
CFX 800 451.07
Exochem
ES 676.07
ESPX 530.90
SNA 478.88
ASK Exactcast EX 529.25
Exactcast IN 394.50
AMCOR Rosstherm K 255.98
Midea et al.6 provide a specific heat versus temperature curve with no numbers but the curve
shows that specific heat increases with increasing temperature. In this work the temperature
dependent specific heat is modeled by a common curve for all sleeves having a value of 400
J/kg-K at 0°C (32°F) that increases to and ranges from 600 to 700 J/kg-K between temperatures
of 380 of 2000°C (716-3632°F). The shape of the curve used in the current work is similar to the
Table II. Riser sleeve densities used for simulation

10
Tem
per
ature
, T
(°C
)
Tem
per
ature
, T
(°C
)
Time, t (s)
Measured
Sleeve TCs 2k
0.5k
k
Measured Mold TCs
2k
0.5k k
Tem
per
ature
, T
(°C
)
Time, t (s)
Measured
Steel TCs
Temperature, T (°C)
Ther
mal
Co
nduct
ivit
y, k
(W
/m-K
)
2k
k
0.5k
2k
0.5k
k
Figure 5. (a) Temperature dependent riser sleeve thermal conductivity curve determined for
the ASK Exactcast IN insulating sleeve material properties, as well as curves multiplied by
factors of 0.5 and 2. Measurements cooling curves (red curves) are compared to predicted
curves in the (b) steel, (c) sleeve, and (d) sand mold showing the effects of multiplying the
sleeve thermal conductivity by the corresponding factors of 0.5 and 2 in the blue and green
curves, respectively. In (d) there are two measured mold TC in the plot at 10 mm and 20 mm
from the sleeve-metal interface corresponding to the solid and dashed curves, respectively.
(a) (b)
(c) (d)
Ts=1380 °C
Time, t (s)
plot given by Midea et al.6 Setting ρ and cp leaves thermal conductivity data to be developed
using the inverse modeling method.
Development of the thermal conductivity data is accomplished by iteratively adjusting the
temperature dependency curve for k used in simulations. Depending on how a modification
during an iterative simulation run affects the agreement between simulated and measured
temperatures, further modifications are made to progressively improve the agreement. In Figure
5(a) an example of a final temperature dependent thermal conductivity curve for an insulating
sleeve is shown in black, labeled “k”. Also shown in Figure 5(a) are curves resulting from
11
multiplying the final thermal conductivities in the curve by factors of 0.5 and 2 corresponding to
the blue and green curves, respectively. Note that in the inverse modeling procedure, changes to
the curve were made that were much smaller than the factors of 0.5 and 2. Curves for these
relatively large factors are shown here to illustrate how changes to the thermal conductivity
curve affect the simulated temperatures in the steel, sleeve, and sand. Predicted temperature
versus time data at the thermocouple measurement locations are compared to the measurements
(red curves) in the steel, sleeve and sand mold in Figures 5(b), (c) and (d), respectively. In
Figure 5(d) two TCs curves are plotted at approximately 10 mm and 20 mm from the sleeve-
metal interface corresponding to the solid and dashed curves, respectively. These cooling curves
show the effect of modifying the sleeve thermal conductivity by factors of 0.5 and 2 on the
predicted temperature curves. These figures demonstrate the tradeoffs that are made in
determining the final sleeve thermal conductivity curve that gives reasonable agreement at all
thermocouple locations in the steel, sleeve and sand mold. Generally speaking though, achieving
agreement between measured and predicted temperatures in the steel is most important since
solidification time for the steel is a very important sleeve performance measure. The final
thermal conductivity curves for all sleeves were determined such that similar agreement between
measured and predicted cooling curves was obtained in the steel, sleeve and mold as that shown
in Figures 5(b), (c) and (d).
For exothermic sleeves the three exothermic properties are also determined by inverse modeling.
While there are three exothermic properties which must be determined, simulation studies with
them indicated they affect sleeve performance independently of each other. Exothermic sleeves
produce a noticeable heating spike in the sleeve temperature-time curve. Ignition temperature
was found to have an insignificant effect on the simulated temperature results in the range from
400°C to 800°C (752°F to 1472°F). It was found that setting it to 600°C (1112°F) produced
reasonable agreement with the heating temperature spike for the exothermic reaction in all
exothermic sleeves. The exothermic heat generation was found to influence the height of the
spike of the temperature-time curve, while the burn time influenced the width (time span) of the
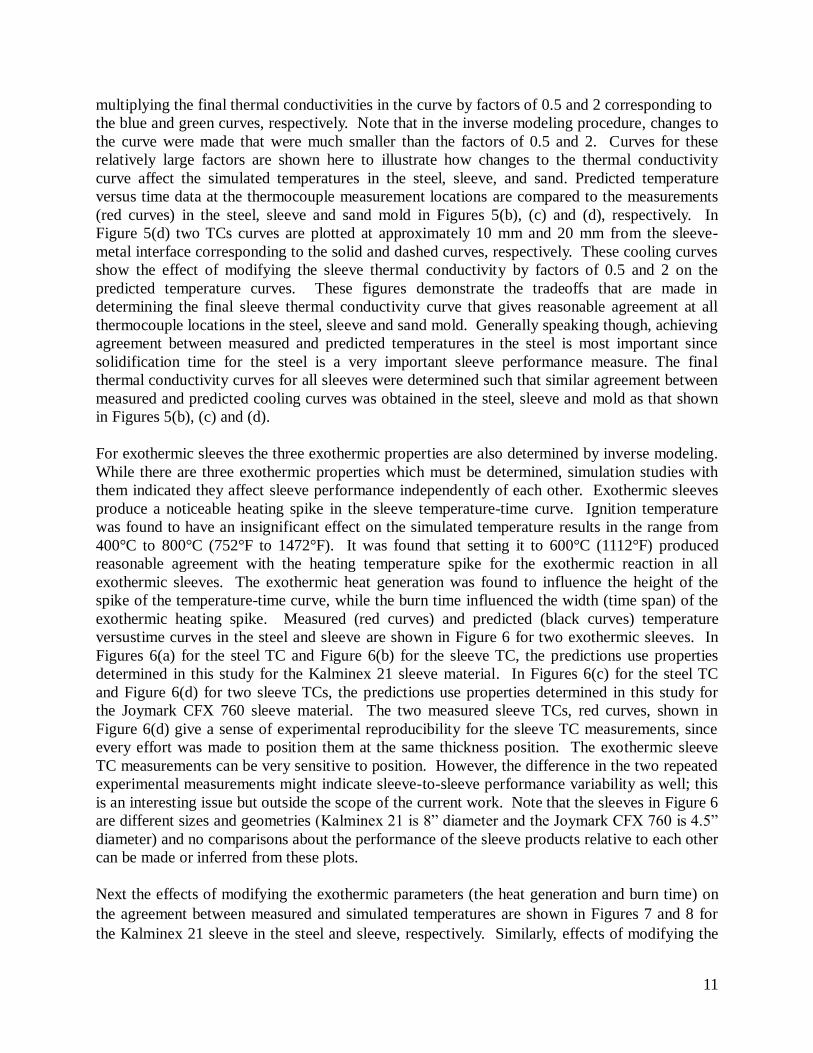
exothermic heating spike. Measured (red curves) and predicted (black curves) temperature
versustime curves in the steel and sleeve are shown in Figure 6 for two exothermic sleeves. In
Figures 6(a) for the steel TC and Figure 6(b) for the sleeve TC, the predictions use properties
determined in this study for the Kalminex 21 sleeve material. In Figures 6(c) for the steel TC
and Figure 6(d) for two sleeve TCs, the predictions use properties determined in this study for
the Joymark CFX 760 sleeve material. The two measured sleeve TCs, red curves, shown in
Figure 6(d) give a sense of experimental reproducibility for the sleeve TC measurements, since
every effort was made to position them at the same thickness position. The exothermic sleeve
TC measurements can be very sensitive to position. However, the difference in the two repeated
experimental measurements might indicate sleeve-to-sleeve performance variability as well; this
is an interesting issue but outside the scope of the current work. Note that the sleeves in Figure 6
are different sizes and geometries (Kalminex 21 is 8” diameter and the Joymark CFX 760 is 4.5”
diameter) and no comparisons about the performance of the sleeve products relative to each other
can be made or inferred from these plots.
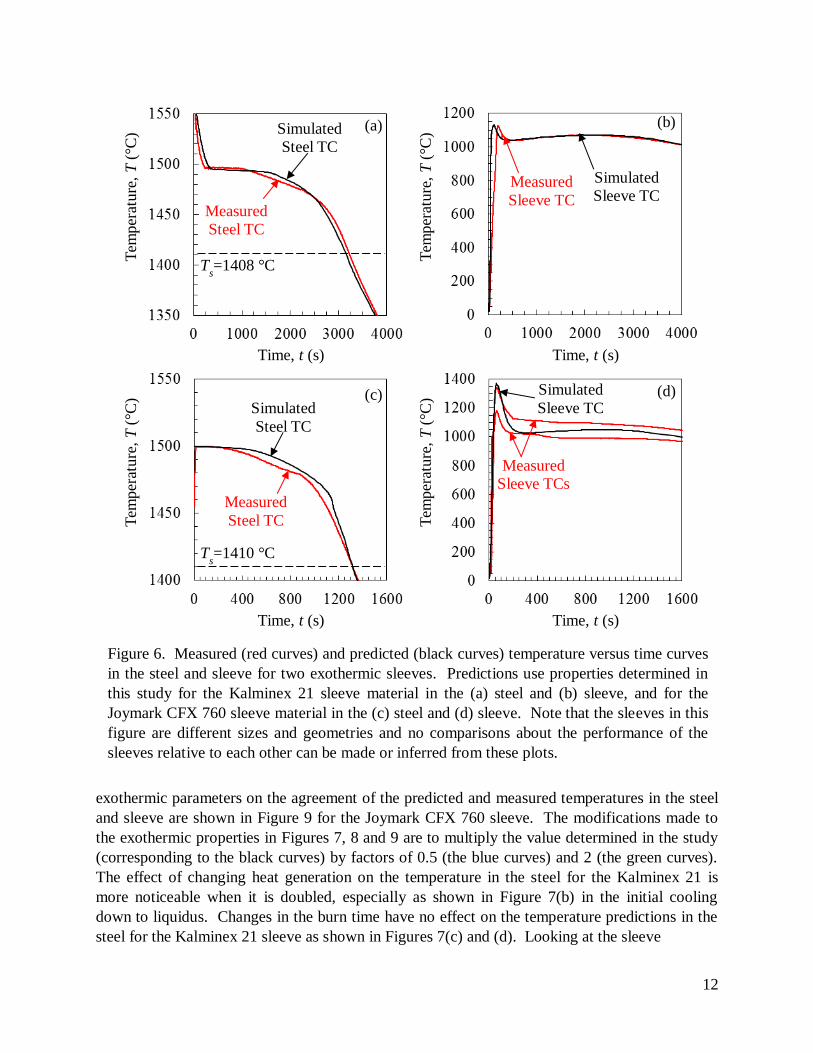
Next the effects of modifying the exothermic parameters (the heat generation and burn time) on
the agreement between measured and simulated temperatures are shown in Figures 7 and 8 for
the Kalminex 21 sleeve in the steel and sleeve, respectively. Similarly, effects of modifying the
12
exothermic parameters on the agreement of the predicted and measured temperatures in the steel
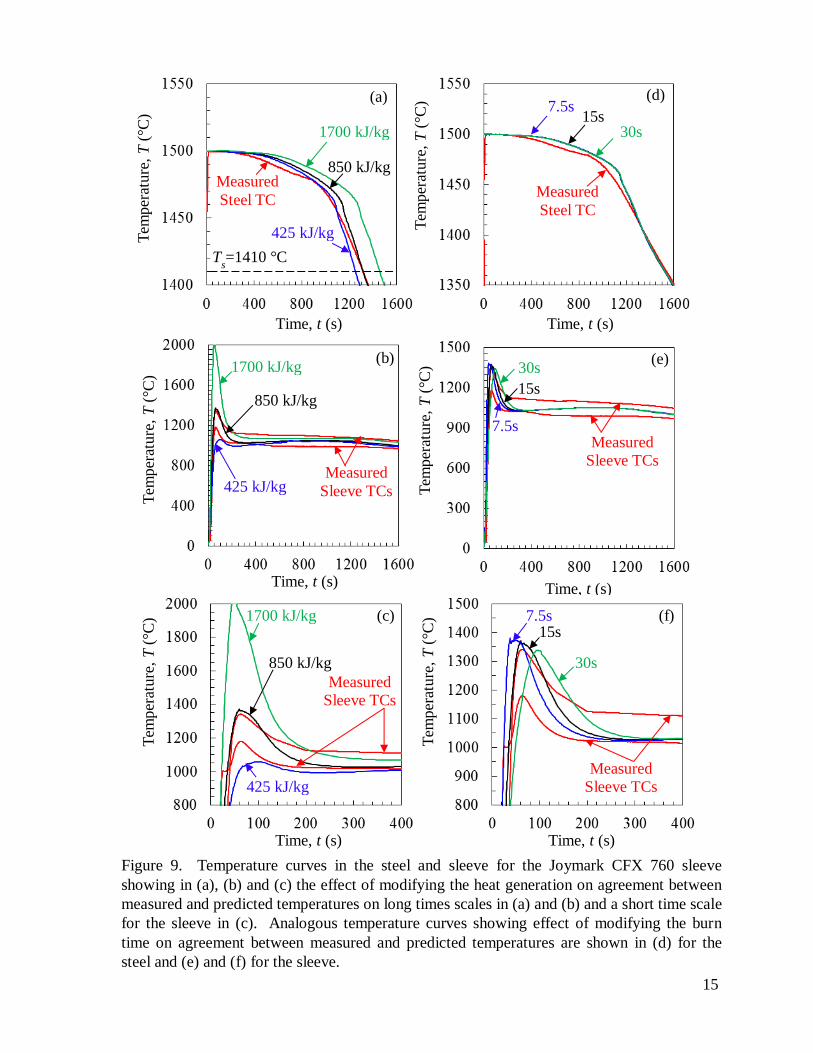
and sleeve are shown in Figure 9 for the Joymark CFX 760 sleeve. The modifications made to
the exothermic properties in Figures 7, 8 and 9 are to multiply the value determined in the study
(corresponding to the black curves) by factors of 0.5 (the blue curves) and 2 (the green curves).
The effect of changing heat generation on the temperature in the steel for the Kalminex 21 is
more noticeable when it is doubled, especially as shown in Figure 7(b) in the initial cooling
down to liquidus. Changes in the burn time have no effect on the temperature predictions in the
steel for the Kalminex 21 sleeve as shown in Figures 7(c) and (d). Looking at the sleeve
Figure 6. Measured (red curves) and predicted (black curves) temperature versus time curves
in the steel and sleeve for two exothermic sleeves. Predictions use properties determined in
this study for the Kalminex 21 sleeve material in the (a) steel and (b) sleeve, and for the
Joymark CFX 760 sleeve material in the (c) steel and (d) sleeve. Note that the sleeves in this
figure are different sizes and geometries and no comparisons about the performance of the
sleeves relative to each other can be made or inferred from these plots.
Tem
per
ature
, T
(°C
)
Time, t (s)
Tem
per
atu
re,
T (
°C)
Time, t (s)
Tem
per
ature
, T
(°C
)
Time, t (s)
Tem
per
ature
, T
(°C
)
Time, t (s)
Measured
Steel TC
Simulated
Steel TC
Simulated
Steel TC
Measured
Steel TC
Measured
Sleeve TC
Simulated
Sleeve TC
Measured
Sleeve TCs
Simulated
Sleeve TC
(a) (b)
(c) (d)
Ts=1408 °C
Ts=1410 °C
13
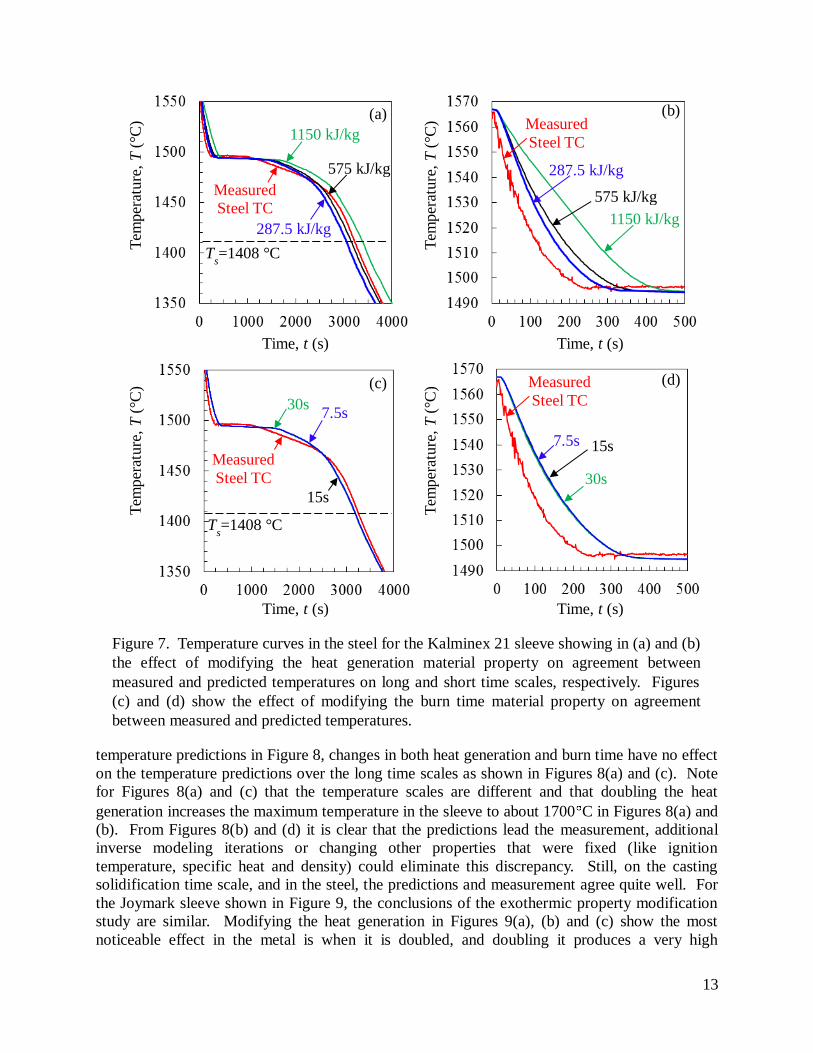
temperature predictions in Figure 8, changes in both heat generation and burn time have no effect
on the temperature predictions over the long time scales as shown in Figures 8(a) and (c). Note
for Figures 8(a) and (c) that the temperature scales are different and that doubling the heat
generation increases the maximum temperature in the sleeve to about 1700 C in Figures 8(a) and
(b). From Figures 8(b) and (d) it is clear that the predictions lead the measurement, additional
inverse modeling iterations or changing other properties that were fixed (like ignition
temperature, specific heat and density) could eliminate this discrepancy. Still, on the casting
solidification time scale, and in the steel, the predictions and measurement agree quite well. For
the Joymark sleeve shown in Figure 9, the conclusions of the exothermic property modification
study are similar. Modifying the heat generation in Figures 9(a), (b) and (c) show the most
noticeable effect in the metal is when it is doubled, and doubling it produces a very high
Figure 7. Temperature curves in the steel for the Kalminex 21 sleeve showing in (a) and (b)
the effect of modifying the heat generation material property on agreement between
measured and predicted temperatures on long and short time scales, respectively. Figures
(c) and (d) show the effect of modifying the burn time material property on agreement
between measured and predicted temperatures.
Tem
per
ature
, T
(°C
)
Time, t (s)
Tem
per
ature
, T
(°C
)
Time, t (s)
Tem
per
ature
, T
(°C
)
Time, t (s)
Tem
per
ature
, T
(°C
)
Time, t (s)
Measured
Steel TC
575 kJ/kg
Measured
Steel TC
575 kJ/kg
(a) (b)
(c) (d)
287.5 kJ/kg
1150 kJ/kg
1150 kJ/kg
287.5 kJ/kg
Measured
Steel TC
15s
7.5s 30s
15s
30s
7.5s
Ts=1408 °C
Ts=1408 °C
Measured
Steel TC
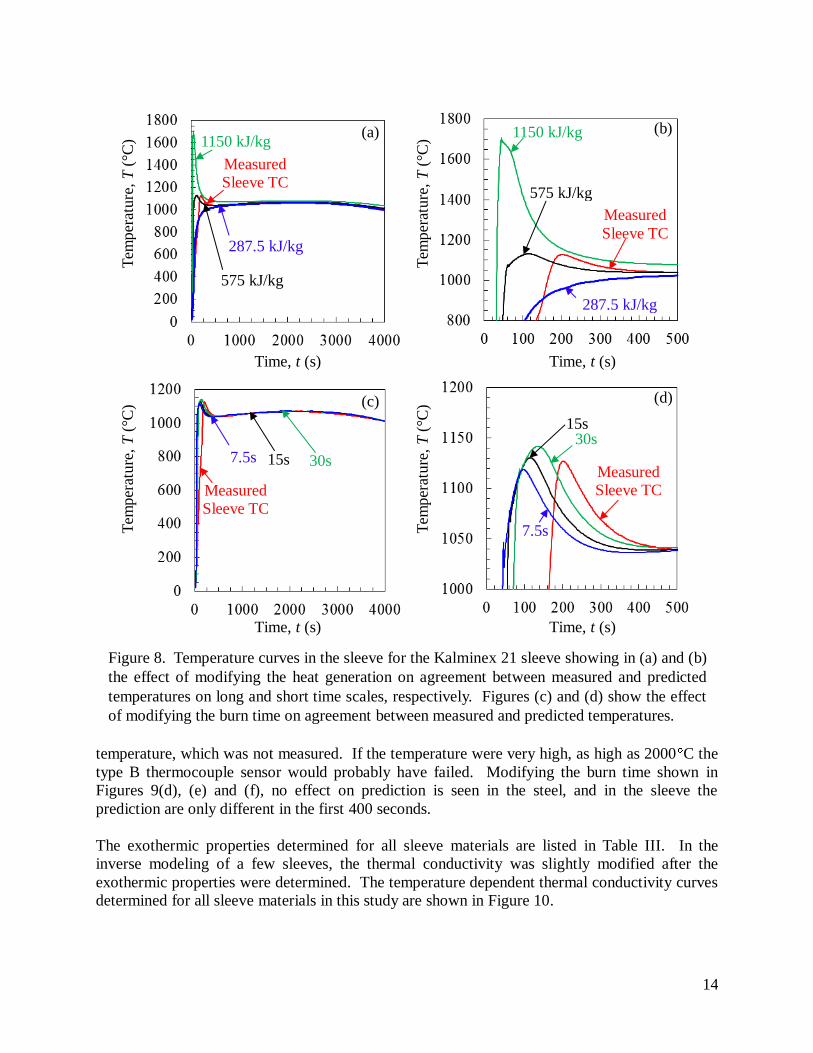
14
temperature, which was not measured. If the temperature were very high, as high as 2000 C the
type B thermocouple sensor would probably have failed. Modifying the burn time shown in
Figures 9(d), (e) and (f), no effect on prediction is seen in the steel, and in the sleeve the
prediction are only different in the first 400 seconds.
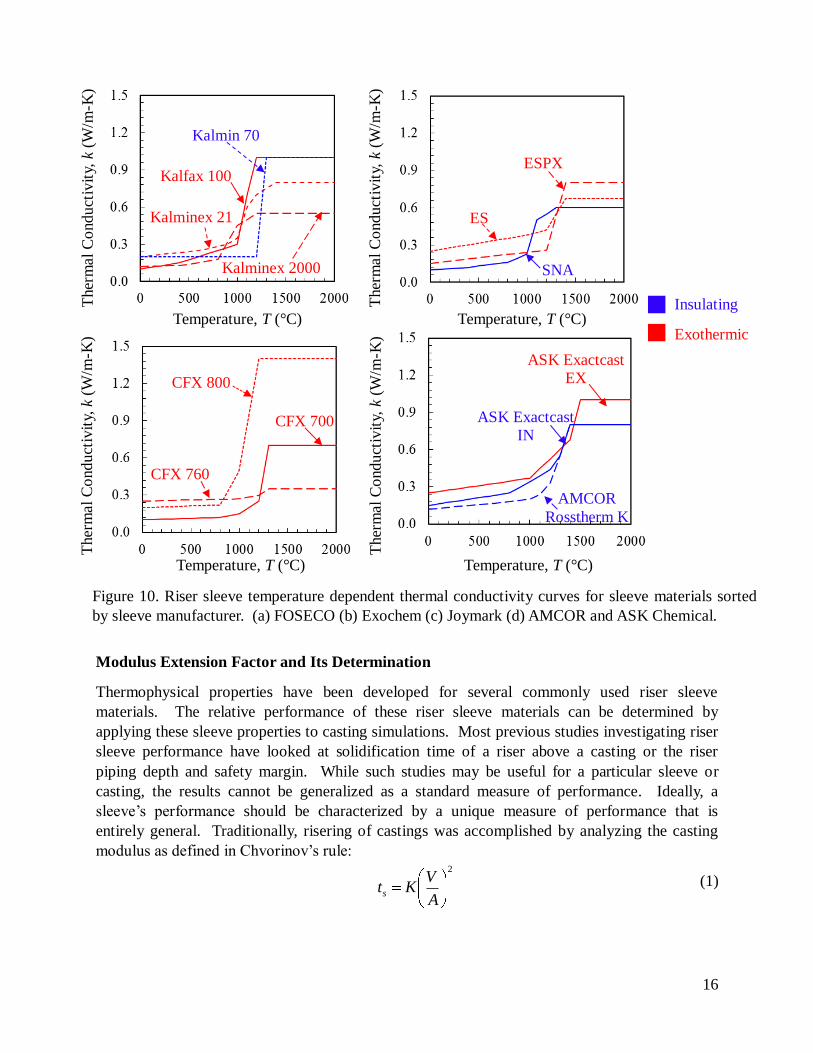
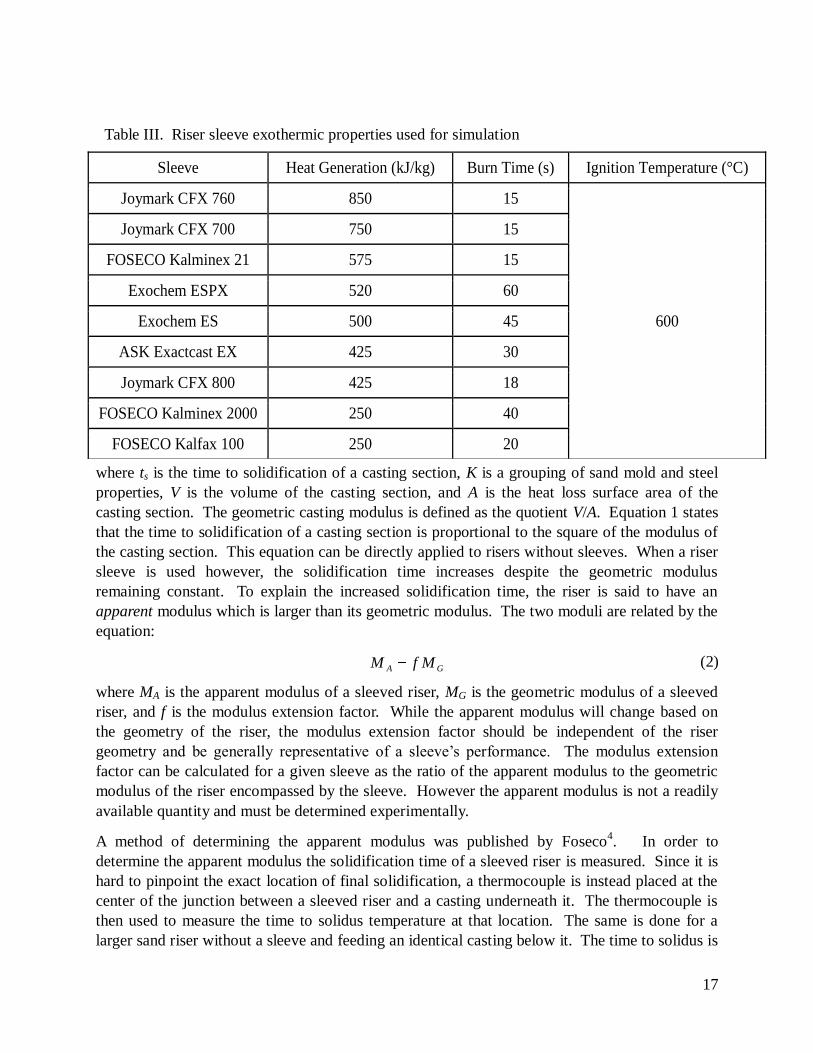
The exothermic properties determined for all sleeve materials are listed in Table III. In the
inverse modeling of a few sleeves, the thermal conductivity was slightly modified after the
exothermic properties were determined. The temperature dependent thermal conductivity curves
determined for all sleeve materials in this study are shown in Figure 10.
Tem
per
ature
, T
(°C
)
Time, t (s)
Tem
per
ature
, T
(°C
)
Time, t (s)
Tem
per
ature
, T
(°C
)
Time, t (s)
Tem
per
ature
, T
(°C
)
Time, t (s)
(a) (b)
(c) (d)
Measured
Sleeve TC
575 kJ/kg
287.5 kJ/kg
1150 kJ/kg
Measured
Sleeve TC
575 kJ/kg
287.5 kJ/kg
1150 kJ/kg
Measured
Sleeve TC
15s 7.5s 30s Measured
Sleeve TC
15s
7.5s
30s
Figure 8. Temperature curves in the sleeve for the Kalminex 21 sleeve showing in (a) and (b)
the effect of modifying the heat generation on agreement between measured and predicted
temperatures on long and short time scales, respectively. Figures (c) and (d) show the effect
of modifying the burn time on agreement between measured and predicted temperatures.
15
Tem
per
ature
, T
(°C
) 1700 kJ/kg
850 kJ/kg
425 kJ/kg
Measured
Steel TC
(a)
Tem
per
ature
, T
(°C
)
Time, t (s)
Measured
Steel TC
30s
7.5s 15s
(d)
Tem
per
ature
, T
(°C
)
Time, t (s)
1700 kJ/kg
850 kJ/kg
425 kJ/kg Measured
Sleeve TCs
(b)
Time, t (s)
Tem
per
ature
, T
(°C
)
Time, t (s)
Measured
Sleeve TCs
30s
7.5s
15s
(e)
Tem
per
ature
, T
(°C
)
Tem
per
ature
, T
(°C
)
Time, t (s) Time, t (s)
1700 kJ/kg
850 kJ/kg
425 kJ/kg
Measured
Sleeve TCs
Measured
Sleeve TCs
30s
7.5s 15s
(c) (f)
Figure 9. Temperature curves in the steel and sleeve for the Joymark CFX 760 sleeve
showing in (a), (b) and (c) the effect of modifying the heat generation on agreement between
measured and predicted temperatures on long times scales in (a) and (b) and a short time scale
for the sleeve in (c). Analogous temperature curves showing effect of modifying the burn
time on agreement between measured and predicted temperatures are shown in (d) for the
steel and (e) and (f) for the sleeve.
Ts=1410 °C
16
2
A
VKts
Modulus Extension Factor and Its Determination
Thermophysical properties have been developed for several commonly used riser sleeve
materials. The relative performance of these riser sleeve materials can be determined by
applying these sleeve properties to casting simulations. Most previous studies investigating riser
sleeve performance have looked at solidification time of a riser above a casting or the riser
piping depth and safety margin. While such studies may be useful for a particular sleeve or
casting, the results cannot be generalized as a standard measure of performance. Ideally, a
sleeve’s performance should be characterized by a unique measure of performance that is
entirely general. Traditionally, risering of castings was accomplished by analyzing the casting
modulus as defined in Chvorinov’s rule:
(1)
Figure 10. Riser sleeve temperature dependent thermal conductivity curves for sleeve materials sorted
by sleeve manufacturer. (a) FOSECO (b) Exochem (c) Joymark (d) AMCOR and ASK Chemical.
(c)
(a) (b)
(d)
Temperature, T (°C)
CFX 800
CFX 760
CFX 700
Temperature, T (°C)
Kalmin 70
Kalminex 2000
Kalfax 100
Kalminex 21
Temperature, T (°C)
SNA
ESPX
ES
Temperature, T (°C)
AMCOR
Rosstherm K
ASK Exactcast
IN
ASK Exactcast
EX
Insulating
Exothermic
Ther
mal
Co
ndu
ctiv
ity,
k (
W/m
-K)
K)
Ther
mal
Co
nduct
ivit
y, k
(W
/m-K
)
K)
Ther
mal
Co
ndu
ctiv
ity,
k (
W/m
-K)
K)
Ther
mal
Co
nduct
ivit
y, k
(W
/m-K
)
K)
17
GA MfM
where ts is the time to solidification of a casting section, K is a grouping of sand mold and steel
properties, V is the volume of the casting section, and A is the heat loss surface area of the
casting section. The geometric casting modulus is defined as the quotient V/A. Equation 1 states
that the time to solidification of a casting section is proportional to the square of the modulus of
the casting section. This equation can be directly applied to risers without sleeves. When a riser
sleeve is used however, the solidification time increases despite the geometric modulus
remaining constant. To explain the increased solidification time, the riser is said to have an
apparent modulus which is larger than its geometric modulus. The two moduli are related by the
equation:
(2)
where MA is the apparent modulus of a sleeved riser, MG is the geometric modulus of a sleeved
riser, and f is the modulus extension factor. While the apparent modulus will change based on
the geometry of the riser, the modulus extension factor should be independent of the riser
geometry and be generally representative of a sleeve’s performance. The modulus extension
factor can be calculated for a given sleeve as the ratio of the apparent modulus to the geometric
modulus of the riser encompassed by the sleeve. However the apparent modulus is not a readily
available quantity and must be determined experimentally.
A method of determining the apparent modulus was published by Foseco4. In order to
determine the apparent modulus the solidification time of a sleeved riser is measured. Since it is
hard to pinpoint the exact location of final solidification, a thermocouple is instead placed at the
center of the junction between a sleeved riser and a casting underneath it. The thermocouple is
then used to measure the time to solidus temperature at that location. The same is done for a
larger sand riser without a sleeve and feeding an identical casting below it. The time to solidus is
Sleeve Heat Generation (kJ/kg) Burn Time (s) Ignition Temperature (°C)
Joymark CFX 760 850 15
600
Joymark CFX 700 750 15
FOSECO Kalminex 21 575 15
Exochem ESPX 520 60
Exochem ES 500 45
ASK Exactcast EX 425 30
Joymark CFX 800 425 18
FOSECO Kalminex 2000 250 40
FOSECO Kalfax 100 250 20
Table III. Riser sleeve exothermic properties used for simulation
18
measured for increasingly larger sand risers until one is found to match the time to solidus in the
smaller riser with sleeve. The geometric modulus of this larger sand riser is then adopted as the
apparent modulus of the smaller sleeved riser. With the apparent modulus determined, the
modulus extension factor can then be easily calculated.
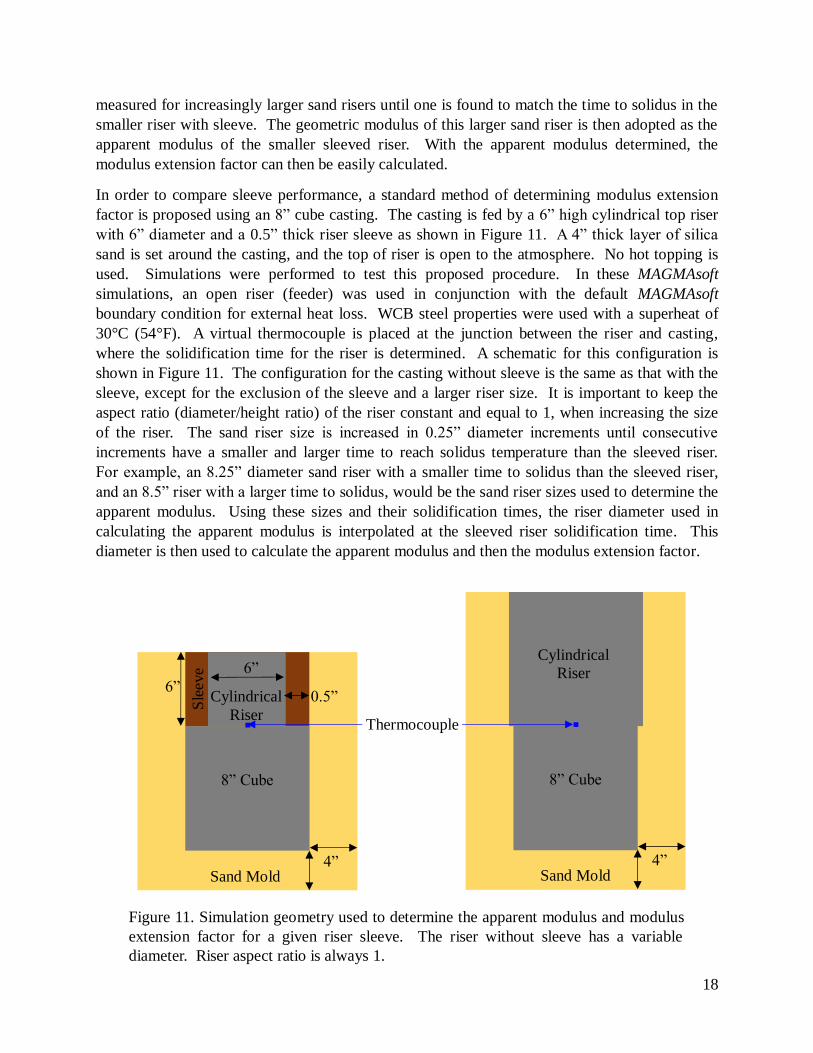
In order to compare sleeve performance, a standard method of determining modulus extension
factor is proposed using an 8” cube casting. The casting is fed by a 6” high cylindrical top riser
with 6” diameter and a 0.5” thick riser sleeve as shown in Figure 11. A 4” thick layer of silica
sand is set around the casting, and the top of riser is open to the atmosphere. No hot topping is
used. Simulations were performed to test this proposed procedure. In these MAGMAsoft
simulations, an open riser (feeder) was used in conjunction with the default MAGMAsoft
boundary condition for external heat loss. WCB steel properties were used with a superheat of
30°C (54°F). A virtual thermocouple is placed at the junction between the riser and casting,
where the solidification time for the riser is determined. A schematic for this configuration is
shown in Figure 11. The configuration for the casting without sleeve is the same as that with the
sleeve, except for the exclusion of the sleeve and a larger riser size. It is important to keep the
aspect ratio (diameter/height ratio) of the riser constant and equal to 1, when increasing the size
of the riser. The sand riser size is increased in 0.25” diameter increments until consecutive
increments have a smaller and larger time to reach solidus temperature than the sleeved riser.
For example, an 8.25” diameter sand riser with a smaller time to solidus than the sleeved riser,
and an 8.5” riser with a larger time to solidus, would be the sand riser sizes used to determine the
apparent modulus. Using these sizes and their solidification times, the riser diameter used in
calculating the apparent modulus is interpolated at the sleeved riser solidification time. This
diameter is then used to calculate the apparent modulus and then the modulus extension factor.
Thermocouple
Cylindrical
Riser
8” Cube
4”
Sle
eve
Cylindrical
Riser
8” Cube
Sand Mold 4”
0.5”
6”
6”
Figure 11. Simulation geometry used to determine the apparent modulus and modulus
extension factor for a given riser sleeve. The riser without sleeve has a variable
diameter. Riser aspect ratio is always 1.
Sand Mold
19
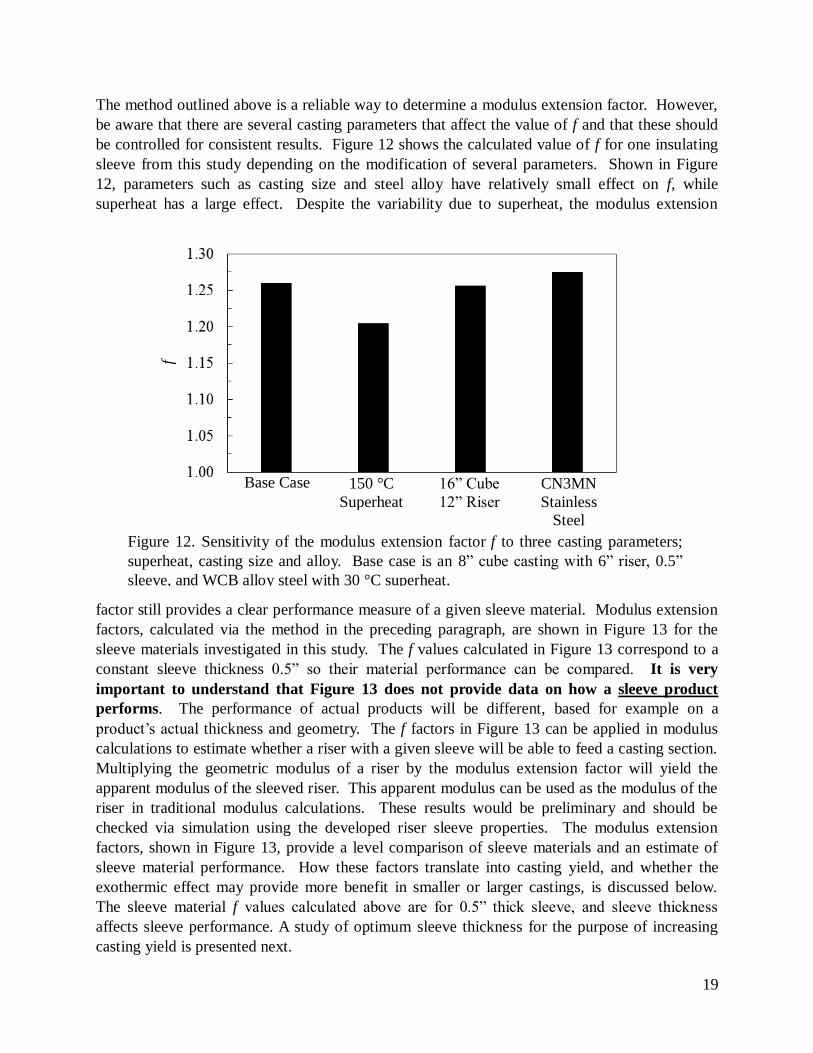
The method outlined above is a reliable way to determine a modulus extension factor. However,
be aware that there are several casting parameters that affect the value of f and that these should
be controlled for consistent results. Figure 12 shows the calculated value of f for one insulating
sleeve from this study depending on the modification of several parameters. Shown in Figure
12, parameters such as casting size and steel alloy have relatively small effect on f, while
superheat has a large effect. Despite the variability due to superheat, the modulus extension
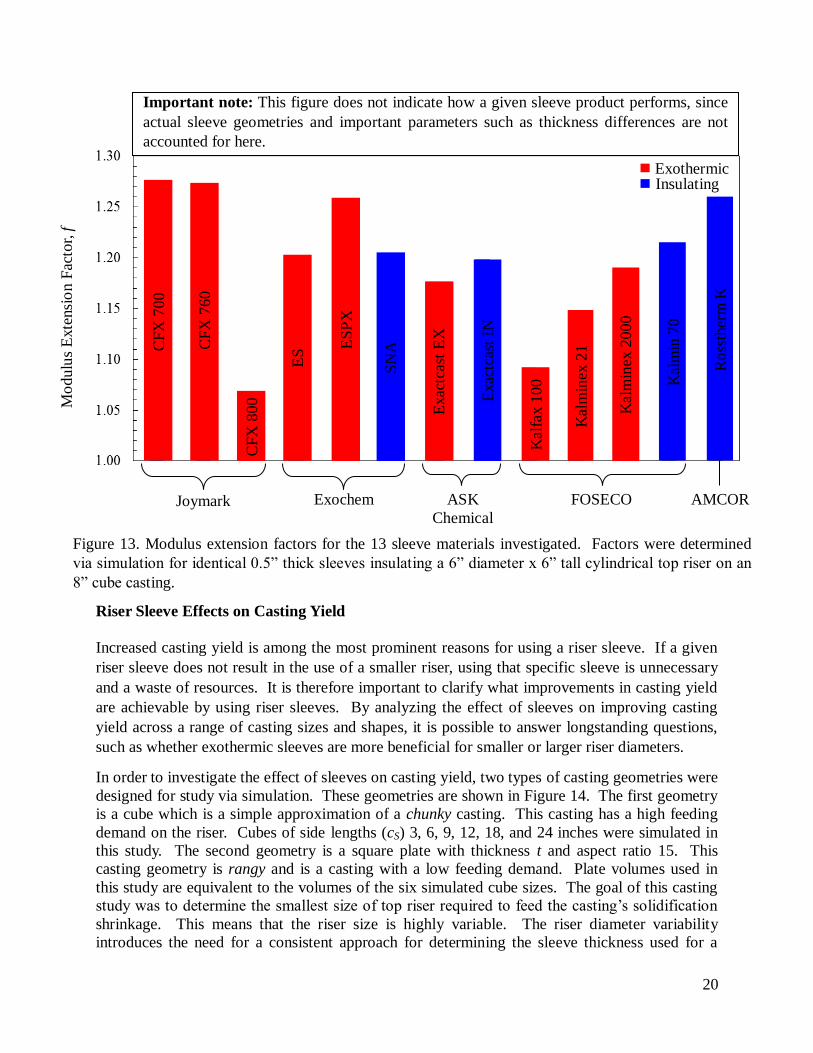
factor still provides a clear performance measure of a given sleeve material. Modulus extension
factors, calculated via the method in the preceding paragraph, are shown in Figure 13 for the
sleeve materials investigated in this study. The f values calculated in Figure 13 correspond to a
constant sleeve thickness 0.5” so their material performance can be compared. It is very
important to understand that Figure 13 does not provide data on how a sleeve product
performs. The performance of actual products will be different, based for example on a
product’s actual thickness and geometry. The f factors in Figure 13 can be applied in modulus
calculations to estimate whether a riser with a given sleeve will be able to feed a casting section.
Multiplying the geometric modulus of a riser by the modulus extension factor will yield the
apparent modulus of the sleeved riser. This apparent modulus can be used as the modulus of the
riser in traditional modulus calculations. These results would be preliminary and should be
checked via simulation using the developed riser sleeve properties. The modulus extension
factors, shown in Figure 13, provide a level comparison of sleeve materials and an estimate of
sleeve material performance. How these factors translate into casting yield, and whether the
exothermic effect may provide more benefit in smaller or larger castings, is discussed below.
The sleeve material f values calculated above are for 0.5” thick sleeve, and sleeve thickness
affects sleeve performance. A study of optimum sleeve thickness for the purpose of increasing
casting yield is presented next.
Figure 12. Sensitivity of the modulus extension factor f to three casting parameters;
superheat, casting size and alloy. Base case is an 8” cube casting with 6” riser, 0.5”
sleeve, and WCB alloy steel with 30 °C superheat.
f
Base Case 150 °C
Superheat
16” Cube
12” Riser
CN3MN
Stainless
Steel
20
Riser Sleeve Effects on Casting Yield
Increased casting yield is among the most prominent reasons for using a riser sleeve. If a given
riser sleeve does not result in the use of a smaller riser, using that specific sleeve is unnecessary
and a waste of resources. It is therefore important to clarify what improvements in casting yield
are achievable by using riser sleeves. By analyzing the effect of sleeves on improving casting
yield across a range of casting sizes and shapes, it is possible to answer longstanding questions,
such as whether exothermic sleeves are more beneficial for smaller or larger riser diameters.
In order to investigate the effect of sleeves on casting yield, two types of casting geometries were
designed for study via simulation. These geometries are shown in Figure 14. The first geometry
is a cube which is a simple approximation of a chunky casting. This casting has a high feeding
demand on the riser. Cubes of side lengths (cS) 3, 6, 9, 12, 18, and 24 inches were simulated in
this study. The second geometry is a square plate with thickness t and aspect ratio 15. This
casting geometry is rangy and is a casting with a low feeding demand. Plate volumes used in
this study are equivalent to the volumes of the six simulated cube sizes. The goal of this casting
study was to determine the smallest size of top riser required to feed the casting’s solidification
shrinkage. This means that the riser size is highly variable. The riser diameter variability
introduces the need for a consistent approach for determining the sleeve thickness used for a
Mo
dulu
s E
xte
nsi
on F
acto
r, f
Joymark Exochem ASK
Chemical
Exothermic Insulating
AMCOR
CF
X 8
00
CF
X 7
00
CF
X 7
60
ES
ES
PX
SN
A
Exac
tcas
t E
X
Exac
tcas
t IN
Kalf
ax 1
00
Kalm
inex 2
1
Kalm
inex 2
000
Kalm
in 7
0
Ro
ssth
erm
K
FOSECO
Figure 13. Modulus extension factors for the 13 sleeve materials investigated. Factors were determined
via simulation for identical 0.5” thick sleeves insulating a 6” diameter x 6” tall cylindrical top riser on an
8” cube casting.
Important note: This figure does not indicate how a given sleeve product performs, since
actual sleeve geometries and important parameters such as thickness differences are not
accounted for here.

21
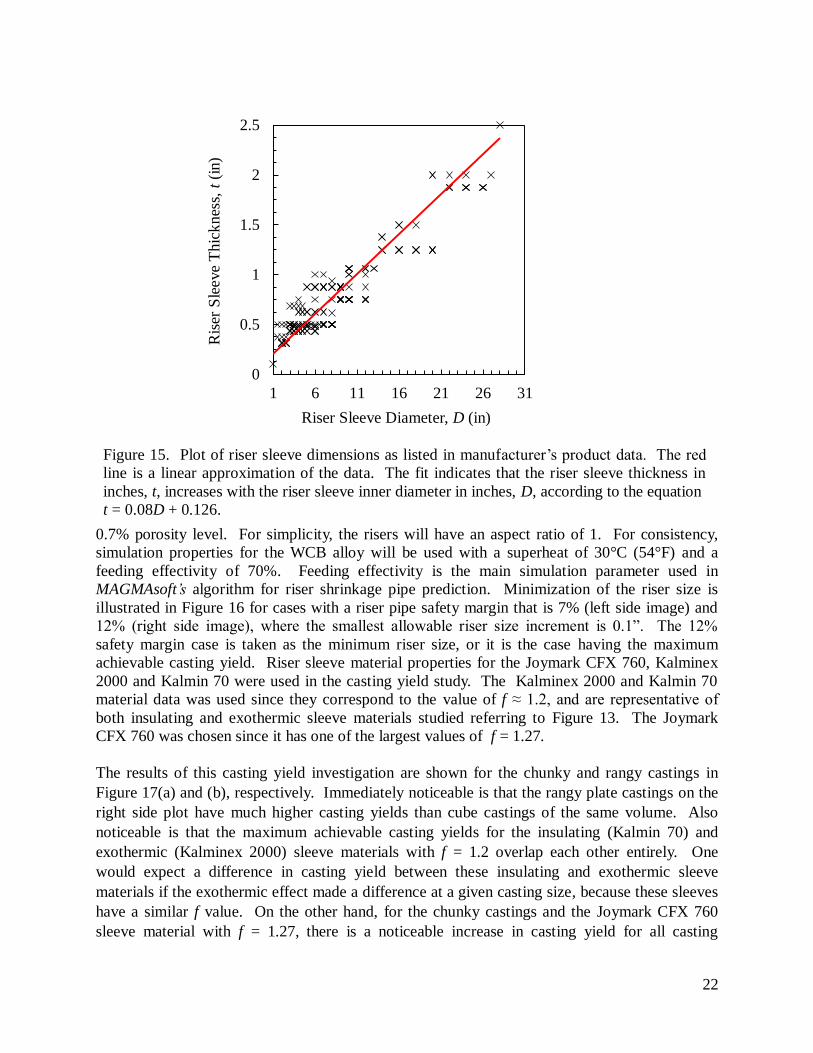
given riser size. To address this need, a linear approximation of commercially available sleeve
thickness based on riser diameter was created. The approximation can be seen in Figure 15
where sleeve thickness t versus riser diameter D values from manufacturer’s product data is
plotted. The linear fit, t = 0.08D + 0.126, indicates that the riser sleeve thickness increases with
the riser sleeve inner diameter with slope indicating the sleeve thickness is about 8% of the riser
diameter. With the sleeve thickness now determinable for any riser size, the size of the risers for
these chunky and rangy castings can be minimized.
The minimum riser size will be determined based on a 10% minimum margin of safety (based on
the riser height) between the casting surface and the closest region of porosity predicted in the
riser’s shrinkage pipe. Because the investigation will be performed using simulation software, it
is needed to define the edge of the riser’s shrinkage porosity region, and here it is defined at the
Cube
Riser
cS
cS + 1”
Square Plate (Aspect Ratio 15)
Riser
t
cS + 1”
(a)
(b)
Sand Mold
Sand Mold
Sle
eve
Sle
eve
Figure 14. General schematics of the simulation geometries used to study achievable casting
yield. (a) Schematic geometry for a cube of side length cS. Side lengths of 3, 6, 9, 12, 18,
and 24 inches were used. (b) Schematic geometry for a square plate of thickness t and aspect
ratio 15. The six plate castings studied have volumes equivalent to the six cube volumes.
22
0.7% porosity level. For simplicity, the risers will have an aspect ratio of 1. For consistency,
simulation properties for the WCB alloy will be used with a superheat of 30°C (54°F) and a
feeding effectivity of 70%. Feeding effectivity is the main simulation parameter used in
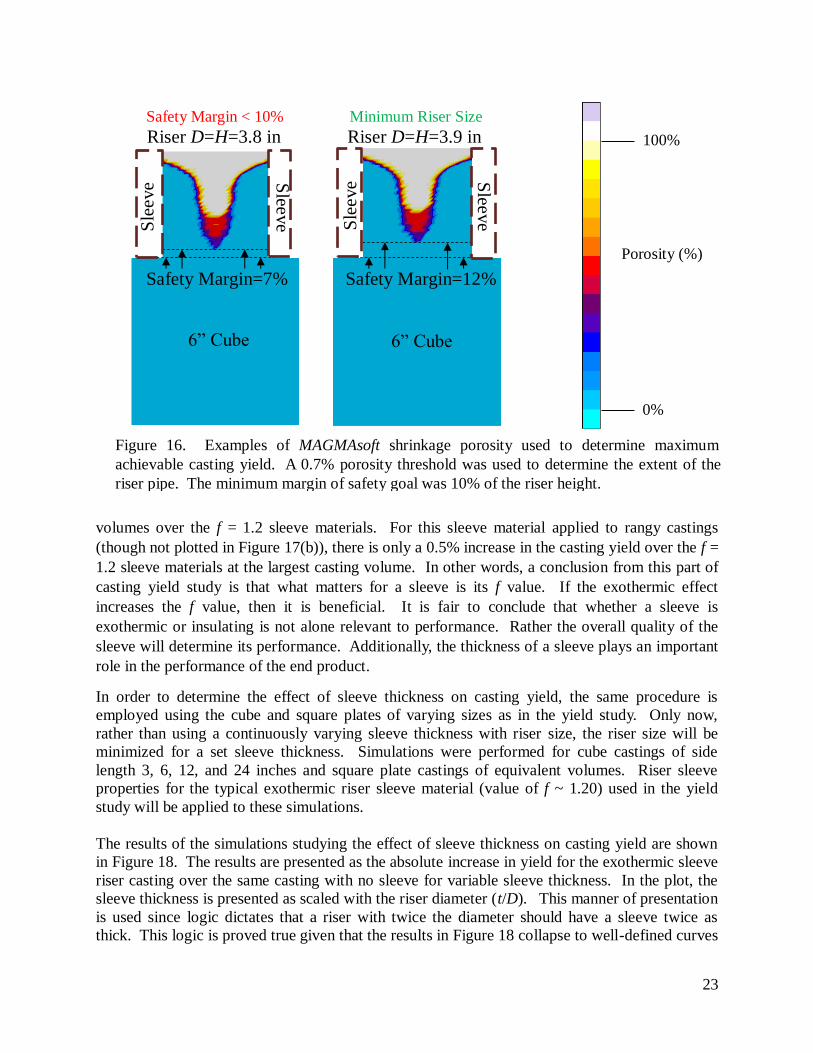
MAGMAsoft’s algorithm for riser shrinkage pipe prediction. Minimization of the riser size is
illustrated in Figure 16 for cases with a riser pipe safety margin that is 7% (left side image) and
12% (right side image), where the smallest allowable riser size increment is 0.1”. The 12%
safety margin case is taken as the minimum riser size, or it is the case having the maximum
achievable casting yield. Riser sleeve material properties for the Joymark CFX 760, Kalminex
2000 and Kalmin 70 were used in the casting yield study. The Kalminex 2000 and Kalmin 70
material data was used since they correspond to the value of f ≈ 1.2, and are representative of
both insulating and exothermic sleeve materials studied referring to Figure 13. The Joymark
CFX 760 was chosen since it has one of the largest values of f = 1.27.
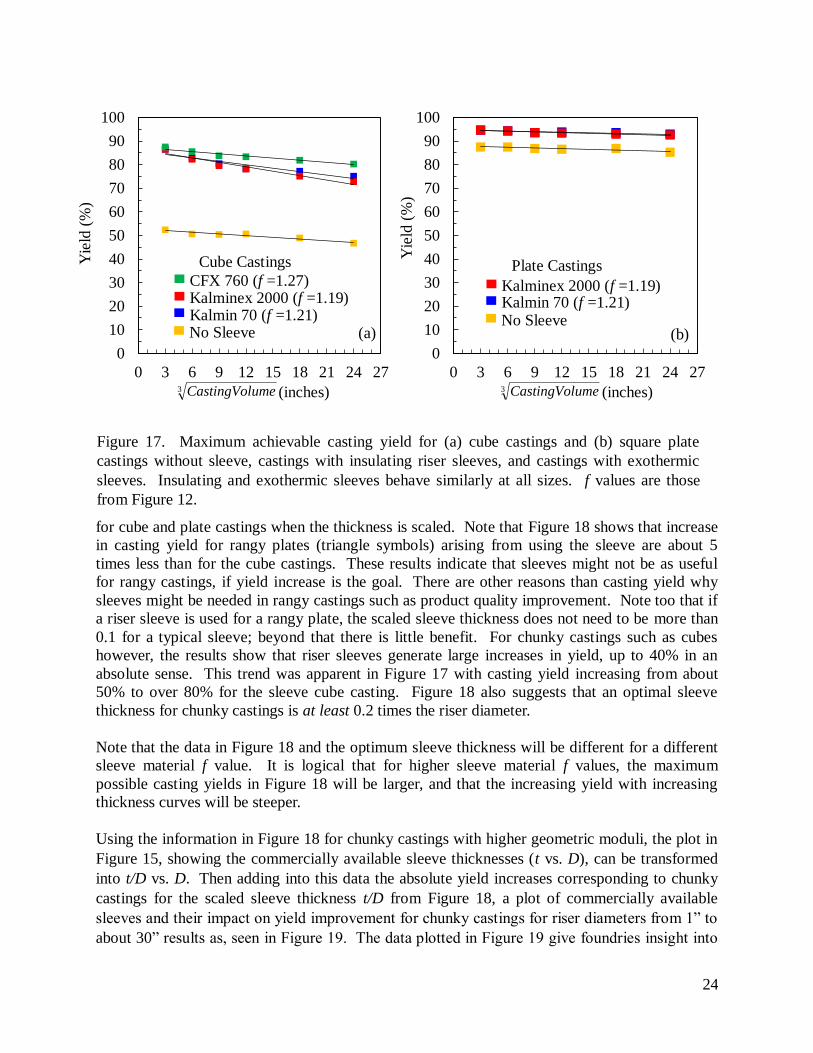
The results of this casting yield investigation are shown for the chunky and rangy castings in
Figure 17(a) and (b), respectively. Immediately noticeable is that the rangy plate castings on the
right side plot have much higher casting yields than cube castings of the same volume. Also
noticeable is that the maximum achievable casting yields for the insulating (Kalmin 70) and
exothermic (Kalminex 2000) sleeve materials with f = 1.2 overlap each other entirely. One
would expect a difference in casting yield between these insulating and exothermic sleeve
materials if the exothermic effect made a difference at a given casting size, because these sleeves
have a similar f value. On the other hand, for the chunky castings and the Joymark CFX 760
sleeve material with f = 1.27, there is a noticeable increase in casting yield for all casting
0
0.5
1
1.5
2
2.5
1 6 11 16 21 26 31
Figure 15. Plot of riser sleeve dimensions as listed in manufacturer’s product data. The red
line is a linear approximation of the data. The fit indicates that the riser sleeve thickness in
inches, t, increases with the riser sleeve inner diameter in inches, D, according to the equation
t = 0.08D + 0.126.
Riser Sleeve Diameter, D (in)
Ris
er S
leeve
Th
ick
nes
s, t
(in
)
23
volumes over the f = 1.2 sleeve materials. For this sleeve material applied to rangy castings
(though not plotted in Figure 17(b)), there is only a 0.5% increase in the casting yield over the f =
1.2 sleeve materials at the largest casting volume. In other words, a conclusion from this part of
casting yield study is that what matters for a sleeve is its f value. If the exothermic effect
increases the f value, then it is beneficial. It is fair to conclude that whether a sleeve is
exothermic or insulating is not alone relevant to performance. Rather the overall quality of the
sleeve will determine its performance. Additionally, the thickness of a sleeve plays an important
role in the performance of the end product.
In order to determine the effect of sleeve thickness on casting yield, the same procedure is
employed using the cube and square plates of varying sizes as in the yield study. Only now,
rather than using a continuously varying sleeve thickness with riser size, the riser size will be
minimized for a set sleeve thickness. Simulations were performed for cube castings of side
length 3, 6, 12, and 24 inches and square plate castings of equivalent volumes. Riser sleeve
properties for the typical exothermic riser sleeve material (value of f ~ 1.20) used in the yield
study will be applied to these simulations.
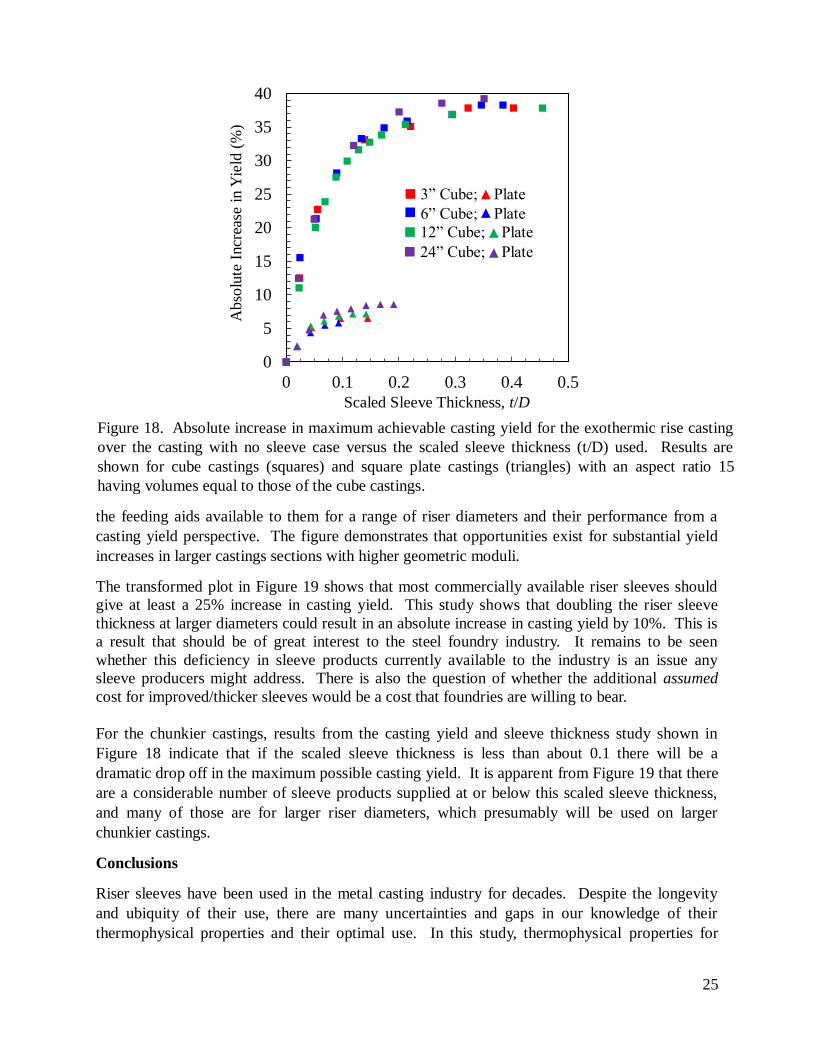
The results of the simulations studying the effect of sleeve thickness on casting yield are shown
in Figure 18. The results are presented as the absolute increase in yield for the exothermic sleeve
riser casting over the same casting with no sleeve for variable sleeve thickness. In the plot, the
sleeve thickness is presented as scaled with the riser diameter (t/D). This manner of presentation
is used since logic dictates that a riser with twice the diameter should have a sleeve twice as
thick. This logic is proved true given that the results in Figure 18 collapse to well-defined curves
6” Cube 6” Cube
Safety Margin=12% Safety Margin=7%
Riser D=H=3.8 in Riser D=H=3.9 in
0%
100%
Porosity (%)
Safety Margin < 10% Minimum Riser Size
Sle
eve S
leeve
Sle
eve S
leeve
Figure 16. Examples of MAGMAsoft shrinkage porosity used to determine maximum
achievable casting yield. A 0.7% porosity threshold was used to determine the extent of the
riser pipe. The minimum margin of safety goal was 10% of the riser height.
24
for cube and plate castings when the thickness is scaled. Note that Figure 18 shows that increase
in casting yield for rangy plates (triangle symbols) arising from using the sleeve are about 5
times less than for the cube castings. These results indicate that sleeves might not be as useful
for rangy castings, if yield increase is the goal. There are other reasons than casting yield why
sleeves might be needed in rangy castings such as product quality improvement. Note too that if
a riser sleeve is used for a rangy plate, the scaled sleeve thickness does not need to be more than
0.1 for a typical sleeve; beyond that there is little benefit. For chunky castings such as cubes
however, the results show that riser sleeves generate large increases in yield, up to 40% in an
absolute sense. This trend was apparent in Figure 17 with casting yield increasing from about
50% to over 80% for the sleeve cube casting. Figure 18 also suggests that an optimal sleeve
thickness for chunky castings is at least 0.2 times the riser diameter.
Note that the data in Figure 18 and the optimum sleeve thickness will be different for a different
sleeve material f value. It is logical that for higher sleeve material f values, the maximum
possible casting yields in Figure 18 will be larger, and that the increasing yield with increasing
thickness curves will be steeper.
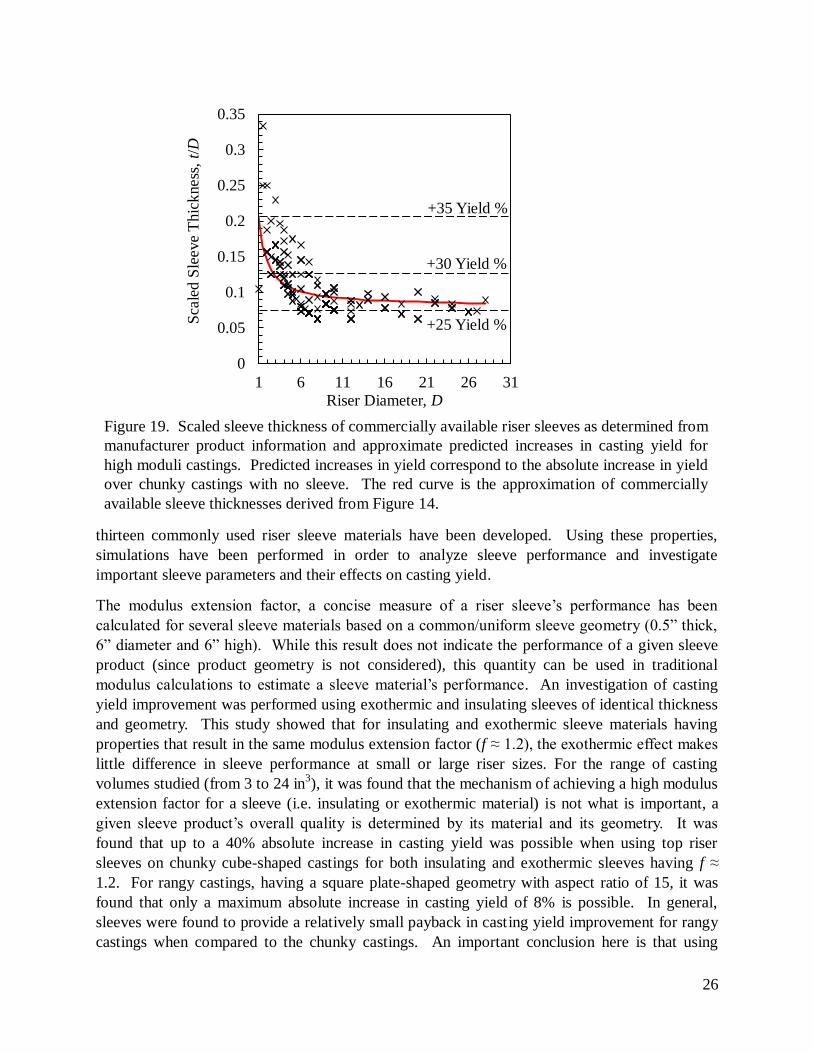
Using the information in Figure 18 for chunky castings with higher geometric moduli, the plot in
Figure 15, showing the commercially available sleeve thicknesses (t vs. D), can be transformed
into t/D vs. D. Then adding into this data the absolute yield increases corresponding to chunky
castings for the scaled sleeve thickness t/D from Figure 18, a plot of commercially available
sleeves and their impact on yield improvement for chunky castings for riser diameters from 1” to
about 30” results as, seen in Figure 19. The data plotted in Figure 19 give foundries insight into
Yie
ld (
%)
(inches) 3 umeCastingVol
Kalminex 2000 (f =1.19) Kalmin 70 (f =1.21) No Sleeve
Yie
ld (
%)
(inches) 3 umeCastingVol
Kalminex 2000 (f =1.19) Kalmin 70 (f =1.21) No Sleeve
CFX 760 (f =1.27)
Figure 17. Maximum achievable casting yield for (a) cube castings and (b) square plate
castings without sleeve, castings with insulating riser sleeves, and castings with exothermic
sleeves. Insulating and exothermic sleeves behave similarly at all sizes. f values are those
from Figure 12.
(b) (a)
0
10
20
30
40
50
60
70
80
90
100
0 3 6 9 12 15 18 21 24 27
0
10
20
30
40
50
60
70
80
90
100
0 3 6 9 12 15 18 21 24 27
Cube Castings Plate Castings
25
the feeding aids available to them for a range of riser diameters and their performance from a
casting yield perspective. The figure demonstrates that opportunities exist for substantial yield
increases in larger castings sections with higher geometric moduli.
The transformed plot in Figure 19 shows that most commercially available riser sleeves should
give at least a 25% increase in casting yield. This study shows that doubling the riser sleeve
thickness at larger diameters could result in an absolute increase in casting yield by 10%. This is
a result that should be of great interest to the steel foundry industry. It remains to be seen
whether this deficiency in sleeve products currently available to the industry is an issue any
sleeve producers might address. There is also the question of whether the additional assumed
cost for improved/thicker sleeves would be a cost that foundries are willing to bear.
For the chunkier castings, results from the casting yield and sleeve thickness study shown in
Figure 18 indicate that if the scaled sleeve thickness is less than about 0.1 there will be a
dramatic drop off in the maximum possible casting yield. It is apparent from Figure 19 that there
are a considerable number of sleeve products supplied at or below this scaled sleeve thickness,
and many of those are for larger riser diameters, which presumably will be used on larger
chunkier castings.
Conclusions
Riser sleeves have been used in the metal casting industry for decades. Despite the longevity
and ubiquity of their use, there are many uncertainties and gaps in our knowledge of their
thermophysical properties and their optimal use. In this study, thermophysical properties for
0
5
10
15
20
25
30
35
40
0 0.1 0.2 0.3 0.4 0.5
Figure 18. Absolute increase in maximum achievable casting yield for the exothermic rise casting
over the casting with no sleeve case versus the scaled sleeve thickness (t/D) used. Results are
shown for cube castings (squares) and square plate castings (triangles) with an aspect ratio 15
having volumes equal to those of the cube castings.
Abso
lute
Incr
ease
in Y
ield
(%
)
Scaled Sleeve Thickness, t/D
3” Cube; Plate
6” Cube; Plate
12” Cube; Plate
24” Cube; Plate
26
thirteen commonly used riser sleeve materials have been developed. Using these properties,
simulations have been performed in order to analyze sleeve performance and investigate
important sleeve parameters and their effects on casting yield.
The modulus extension factor, a concise measure of a riser sleeve’s performance has been
calculated for several sleeve materials based on a common/uniform sleeve geometry (0.5” thick,
6” diameter and 6” high). While this result does not indicate the performance of a given sleeve
product (since product geometry is not considered), this quantity can be used in traditional
modulus calculations to estimate a sleeve material’s performance. An investigation of casting
yield improvement was performed using exothermic and insulating sleeves of identical thickness
and geometry. This study showed that for insulating and exothermic sleeve materials having
properties that result in the same modulus extension factor (f ≈ 1.2), the exothermic effect makes
little difference in sleeve performance at small or large riser sizes. For the range of casting
volumes studied (from 3 to 24 in3), it was found that the mechanism of achieving a high modulus
extension factor for a sleeve (i.e. insulating or exothermic material) is not what is important, a
given sleeve product’s overall quality is determined by its material and its geometry. It was
found that up to a 40% absolute increase in casting yield was possible when using top riser
sleeves on chunky cube-shaped castings for both insulating and exothermic sleeves having f ≈
1.2. For rangy castings, having a square plate-shaped geometry with aspect ratio of 15, it was
found that only a maximum absolute increase in casting yield of 8% is possible. In general,
sleeves were found to provide a relatively small payback in casting yield improvement for rangy
castings when compared to the chunky castings. An important conclusion here is that using
Figure 19. Scaled sleeve thickness of commercially available riser sleeves as determined from
manufacturer product information and approximate predicted increases in casting yield for
high moduli castings. Predicted increases in yield correspond to the absolute increase in yield
over chunky castings with no sleeve. The red curve is the approximation of commercially
available sleeve thicknesses derived from Figure 14.
0
0.05
0.1
0.15
0.2
0.25
0.3
0.35
1 6 11 16 21 26 31
Sca
led S
leeve
Thic
kness
, t/
D
Riser Diameter, D
+25 Yield %
+30 Yield %
+35 Yield %
27
sleeves in rangy casting applications to increase casting yield might be unnecessary. It is
acknowledged though that there are reasons other than yield for using sleeves, such as increasing
casting soundness, quality improvement and addressing difficulties in feeding a particular
casting.
In another part of the casting yield and sleeve use investigation, the maximum achievable casting
yield was found to be highly dependent on sleeve thickness. Data on commercially available
riser sleeve product geometry was collected and presented as a plot of sleeve thickness t versus
diameter D. It was found that the best-fit curve t = 0.08D + 0.126 describes the overall
relationship between thickness and diameter. When the scaled thickness t/D for this data is
compared to the results of the casting yield study, it was found that many riser sleeve products
have below the optimum thickness for maximizing casting yield, particularly for larger risers in
the range of 10” to 30” diameter. The optimum scaled thicknesses for maximizing the casting
yield of rangy and chunky castings was found to be approximately 0.1 and 0.22, respectively.
These optimum sleeve thicknesses correspond to a sleeve material f ≈ 1.2. For higher sleeve
material f values, the maximum possible casting yields will be larger the 40% and 8% values
found for f ≈ 1.2 sleeve material applied to chunky and rangy castings, respectively. Also, with
larger values of f, it is a logical conclusion that the optimum thickness will be less than the scaled
thickness values of 0.1 for rangy castings, and 0.22 for chunky castings.
Acknowledgements
The authors gratefully acknowledge funding from the Iowa Energy Center to conduct this
research through Grant Number 12-01 for the project Riser Sleeve and Mold Ablation
Technologies for Improving Energy Efficiency in Steel Casting. The authors would like to thank
Jerry Thiel, Sairam Ravi and the staff at the University of Northern Iowa Metal Casting Center
for their help in performing the casting experiments. In addition, the authors acknowledge the
guidance and support of the Steel Founders’ Society of America and member foundries, and for
the donation of riser sleeves from its member foundries used in the experiments.
References
1. Blair, M., "Riser Sleeves-Insulating or Exothermic," in Proceedings of the 64th SFSA
Technical and Operating Conference, Paper No. 3.3, Steel Founders' Society of America,
Chicago, IL, 2010.
2. Sully, L., Wren, J.E., and Bates, C.E., Evaluation of Exothermic and Insulating Materials – A
Literature Review, SFSA Special Report No. 13, pp. 1-53, 1977.
3. Bates, C.E., Scott, W.D., Sully, L., and Wren, J.E., Evaluation of Riser Feeding Aids, SFSA
Research Report No. 83, pp. 1-21, 1977.
4. Foseco, “Measuring the Thermal Efficiency of Feeding Aids,” Foundry Practice, 205, June,
pp. 6-10, 1982.
5. Brown, J.R., “Feeding of Castings,” Chapter 19 in Foseco Ferrous Foundryman’s Handbook
11th
Ed., Butterworth-Heinemann, pp. 296-343, 2000.
28
6. Midea, A. C., Burns, M., Schneider, M., Wagner, I., “Advanced Thermo-physical Data for
Casting Process Simulation – The Importance of Accurate Riser Sleeve Properties,”
International Foundry Research, vol. 59, pp. 34-43, 2007.
7. MAGMA5 Release Notes (version 5.2), MAGMA GmbH, Aachen, Germany, 2014.
8. Ignaszak, Z., Popielarski, P., and Ciura, J. “Heat Source Description of Iso-Exothermic
Sleeves with the Use of Continuous Function,” Archives of Foundry, Vol. 5, No. 15, pp. 157-163,
2005.
9. Ignaszak, Z., and Popielarski, P., “Contribution to thermal properties of multi-component
porous ceramic materials used in high-temperature processes in the foundry industry,” in Heat
and Mass Transfer in Porous Media, (ed. J. Delgado), Advanced Structured Materials 13, Berlin,
Springer-Verlag pp. 187-218, 2012.
10. Hardin, R.A., Williams, T.J., and Beckermann, C., "Riser Sleeve Properties for Steel
Castings and the Effect of Sleeve Type on Casting Yield," in Proceedings of the 67th SFSA
Technical and Operating Conference, Paper No. 5.2, Steel Founders' Society of America,
Chicago, IL, 2013.