Embed Size (px)
Citation preview
6-1
Financial Statements Analysis and Long-
Term Planning
Financial Statements Analysis and Long-
Term Planning
6-2
Learning objectivesLearning objectivesLearning objectivesLearning objectives
Identify the ways that firms obtain and use cash as reported in the Cash Flow Statement.
Calculate and interpret key financial ratios.
Discuss the Du Pont identity as a method of financial analysis.
Understand the use of financial information for comparative purposes.
Outline the problems associated with using financial ratios.
6-3
CashCashCashCash
Cash is generated by selling a product or service, asset or security.
Cash is spent by paying for materials and labor to produce a product or service and by purchasing assets.
Recall:
Cash flow from assets = Cash flow to debt-holders + Cash flow to shareholders
6-4
Sources and Uses of CashSources and Uses of CashSources and Uses of CashSources and Uses of Cash
At the most fundamental level, firms do two things: generate cash and spend cash.
Activities that bring in cash are called sources of cash.
Activities that involve spending cash are called uses (or applications) of cash.
An increase in an asset account or a decrease in a liability or equity account is a use of cash.
A decrease in an asset account or an increase in a liability or equity account is a source of cash.
6-5
Financial StatementsFinancial StatementsFinancial StatementsFinancial Statements
A firm’s financial statement that summarizes its sources and uses of cash over a specified period.
The presentation of cash flows in annual reports is determined by an Accounting Standard.
Changes are divided into three main categories: Operating activities—includes net profit and changes
in most current accounts. Investment activities—includes changes in non-
current assets. Financing activities—includes changes in notes
payable, long-term debt and equity accounts, as well as dividends.
6-6
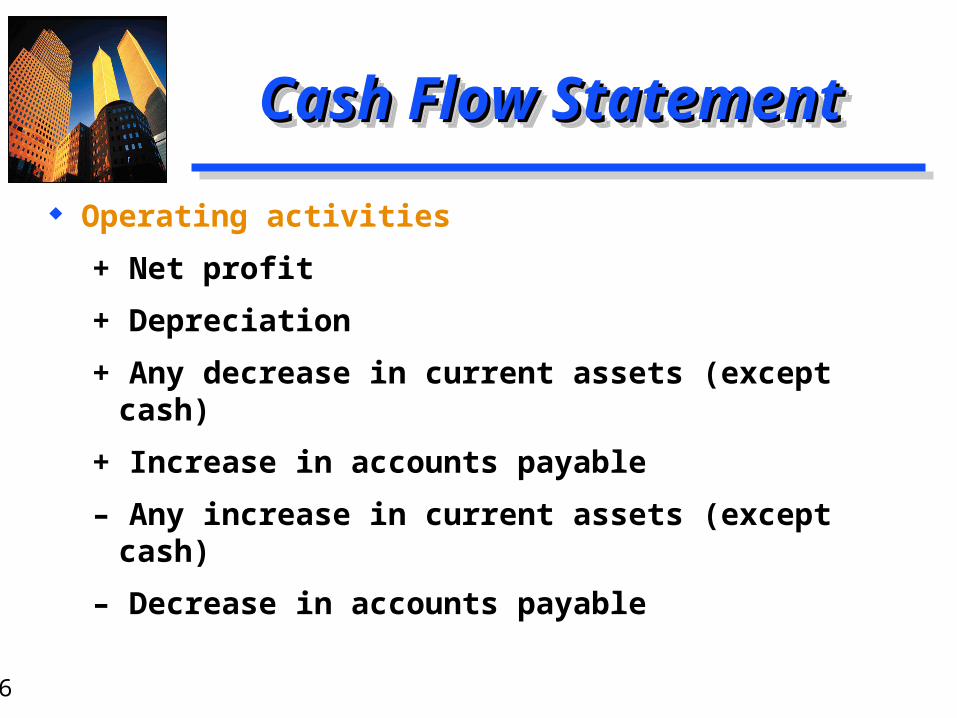
Operating activities
+ Net profit
+ Depreciation
+ Any decrease in current assets (except cash)
+ Increase in accounts payable
– Any increase in current assets (except cash)
– Decrease in accounts payable
Cash Flow StatementCash Flow StatementCash Flow StatementCash Flow Statement
6-7
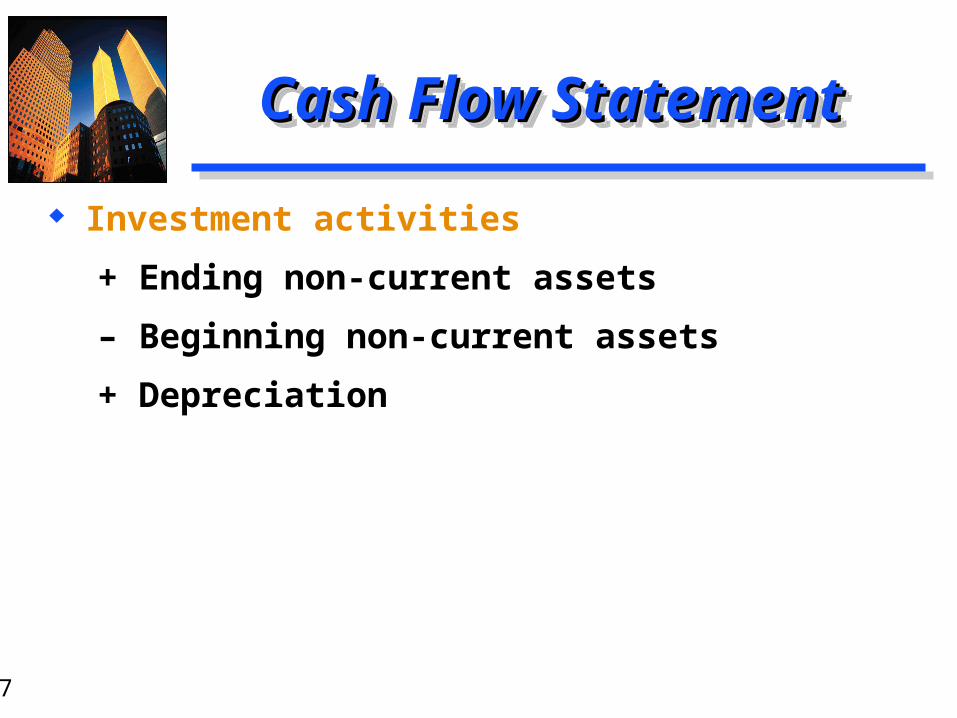
Investment activities
+ Ending non-current assets
– Beginning non-current assets
+ Depreciation
Cash Flow StatementCash Flow StatementCash Flow StatementCash Flow Statement
6-8
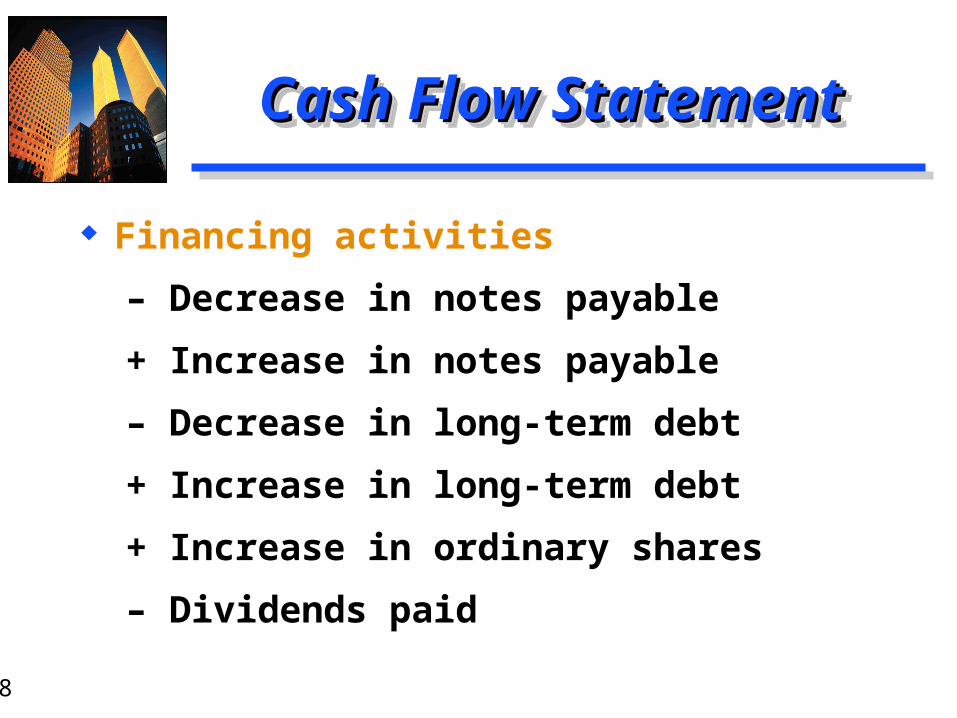
Financing activities
– Decrease in notes payable
+ Increase in notes payable
– Decrease in long-term debt
+ Increase in long-term debt
+ Increase in ordinary shares
– Dividends paid
Cash Flow StatementCash Flow StatementCash Flow StatementCash Flow Statement
6-9
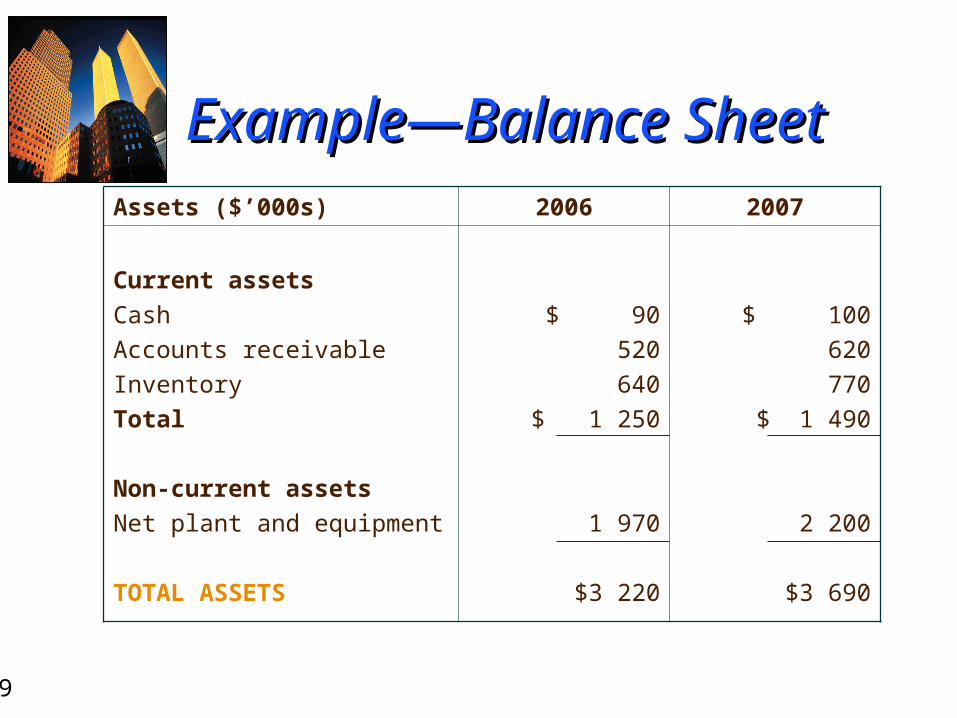
ExampleExample――Balance SheetBalance SheetAssets ($’000s) 2006 2007
Current assets
Cash
Accounts receivable
Inventory
Total
Non-current assets
Net plant and equipment
TOTAL ASSETS
$ 90
520
640
$ 1 250
1 970
$3 220
$ 100
620
770
$ 1 490
2 200
$3 690
6-10
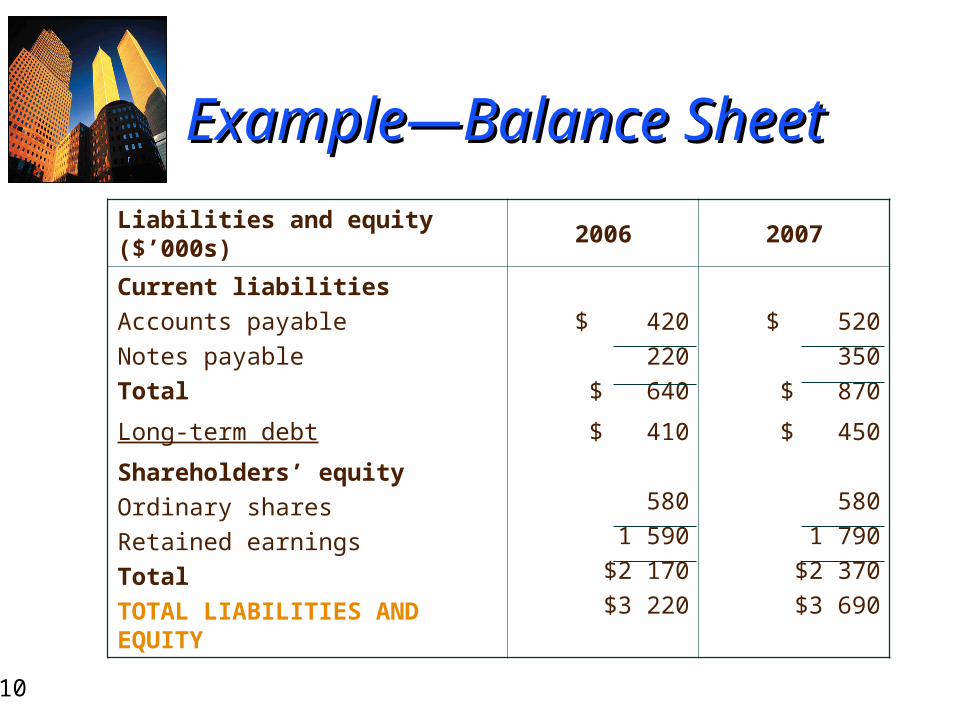
ExampleExample――Balance SheetBalance Sheet
Liabilities and equity ($’000s) 2006 2007
Current liabilities
Accounts payable
Notes payable
Total
Long-term debt
Shareholders’ equity
Ordinary shares
Retained earnings
Total
TOTAL LIABILITIES AND EQUITY
$ 420
220
$ 640
$ 410
580
1 590
$2 170
$3 220
$ 520
350
$ 870
$ 450
580
1 790
$2 370
$3 690
6-11
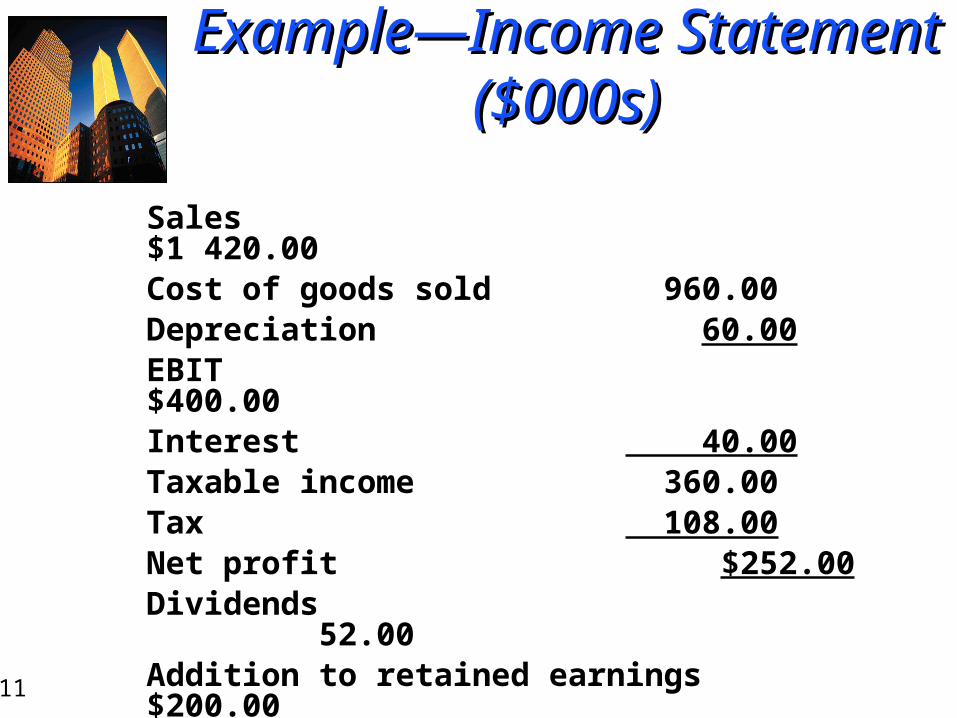
ExampleExample――Income Statement Income Statement ($000s)($000s)
Sales $1 420.00Cost of goods sold 960.00Depreciation 60.00EBIT $400.00Interest 40.00Taxable income 360.00Tax 108.00Net profit $252.00Dividends 52.00Addition to retained earnings $200.00
6-12
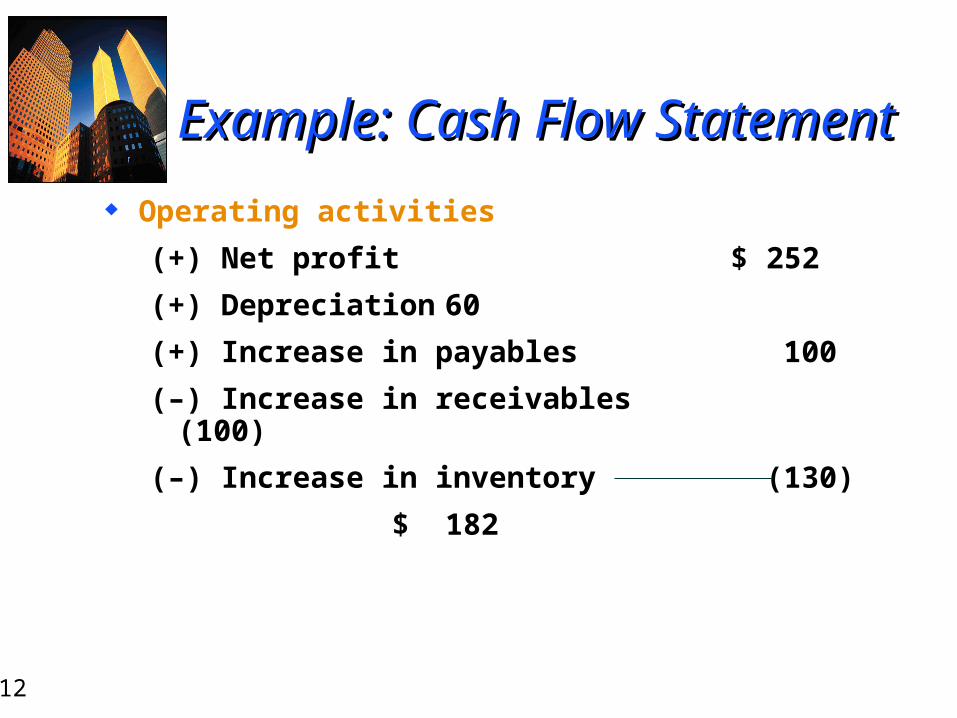
Example: Cash Flow StatementExample: Cash Flow Statement
Operating activities
(+) Net profit $ 252
(+) Depreciation 60
(+) Increase in payables 100
(–) Increase in receivables (100)
(–) Increase in inventory (130)
$ 182
6-13
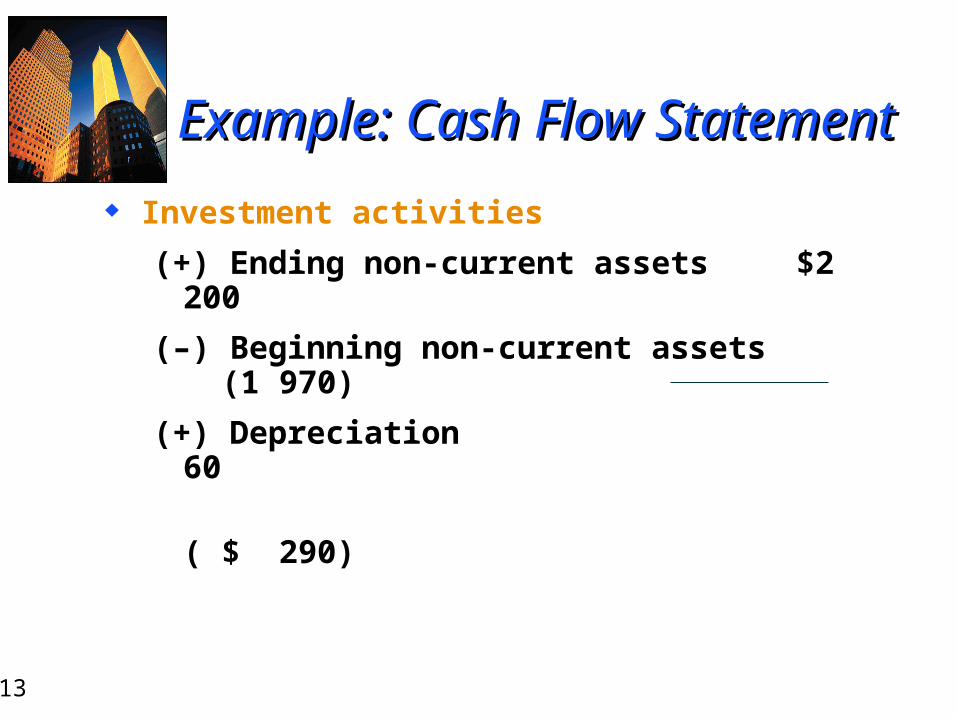
Example: Cash Flow StatementExample: Cash Flow Statement
Investment activities
(+) Ending non-current assets $2 200
(–) Beginning non-current assets (1 970)
(+) Depreciation 60
( $ 290)
6-14
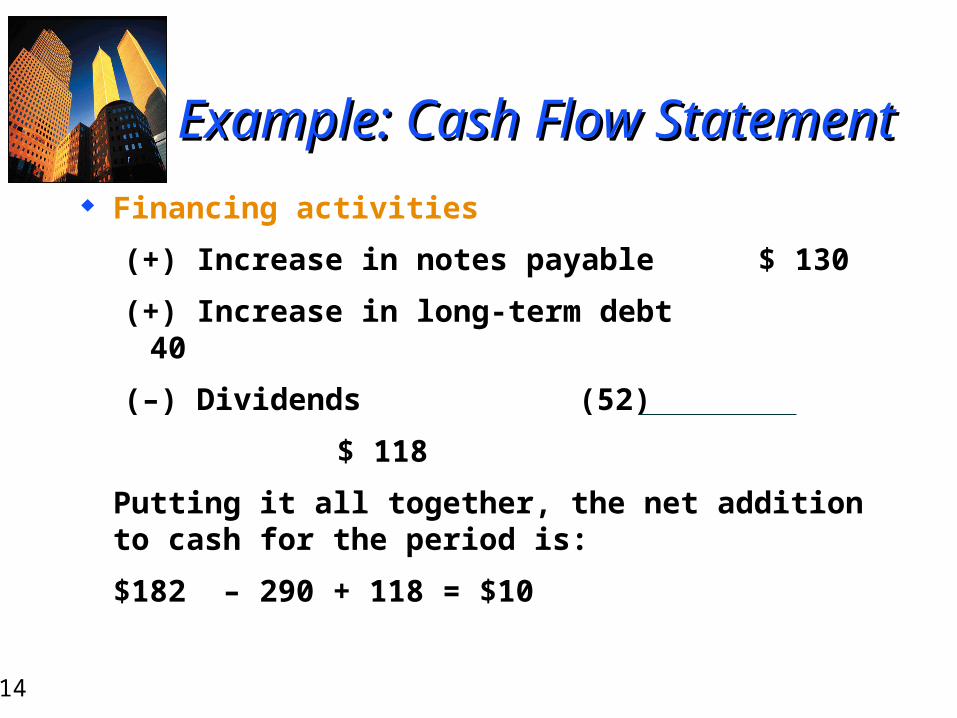
Financing activities
(+) Increase in notes payable $ 130
(+) Increase in long-term debt 40
(–) Dividends (52)
$ 118
Putting it all together, the net addition to cash for the period is:
$182 – 290 + 118 = $10
Example: Cash Flow StatementExample: Cash Flow Statement
6-15
Financial Ratio AnalysisFinancial Ratio Analysis
A Financial ratios is an index that relates two accounting numbers and is obtained by dividing one number by the other.
Used to compare and investigate relationships between different pieces of financial information, either over time or between companies. Types of Types of Comparisons: Comparisons: Internal Comparisons and Internal Comparisons and External External ComparisonsComparisons
Ratios eliminate the size problem.
6-16
Ratio Analysis: Questions Ratio Analysis: Questions to Consider for Each Ratioto Consider for Each Ratio
How is it computed?
What is it intended to measure, and why might we be interested?
What is the unit of measurement?
What might a high or low value be telling us? How might such values be misleading?
How could this measure be improved?
6-17
Liquidity Ratios
Leverage ratios (Capital Structure Ratios)
Profitability ratios
Valuation ratios
Turnover Ratios
Categories of Financial Categories of Financial RatiosRatios
6-18
Liquidity RatiosLiquidity Ratios
Current Ratio
Quick Ratio
Profit before depreciation and amortization to current liabilities (PDACL)
Operating cash flow to current liabilities (OCFCL)
Cash balance to total liabilities (CBTL)
6-19
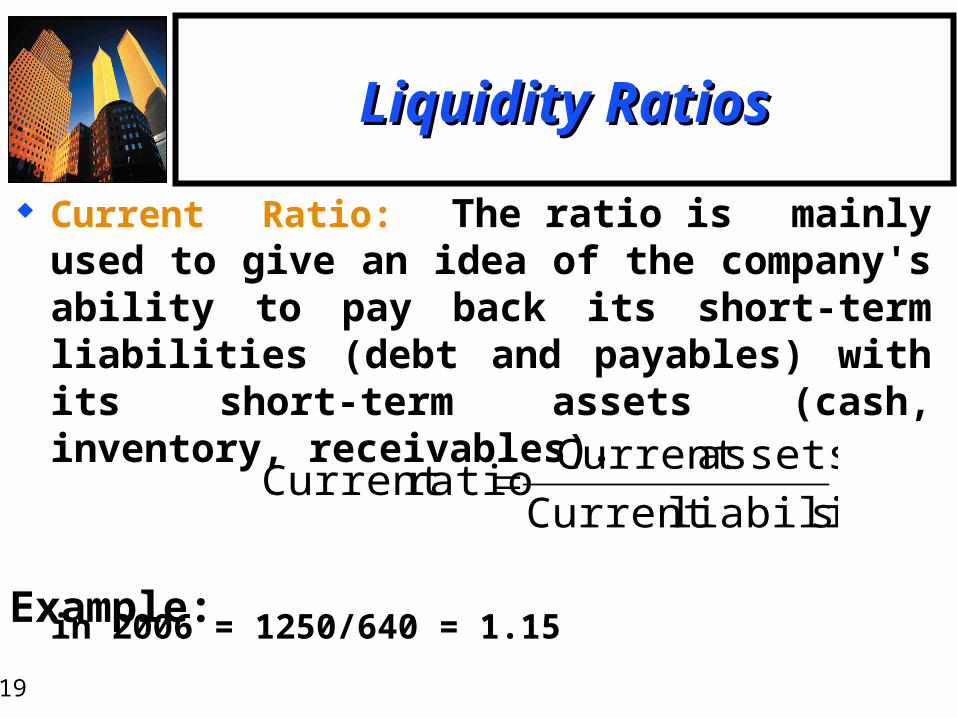
Current Ratio: The ratio is mainly used to give an idea of the company's ability to pay back its short-term liabilities (debt and payables) with its short-term assets (cash, inventory, receivables).
in 2006 = 1250/640 = 1.15
sliabilitieCurrent
assetsCurrent ratioCurrent
Liquidity RatiosLiquidity Ratios
Example:
6-20
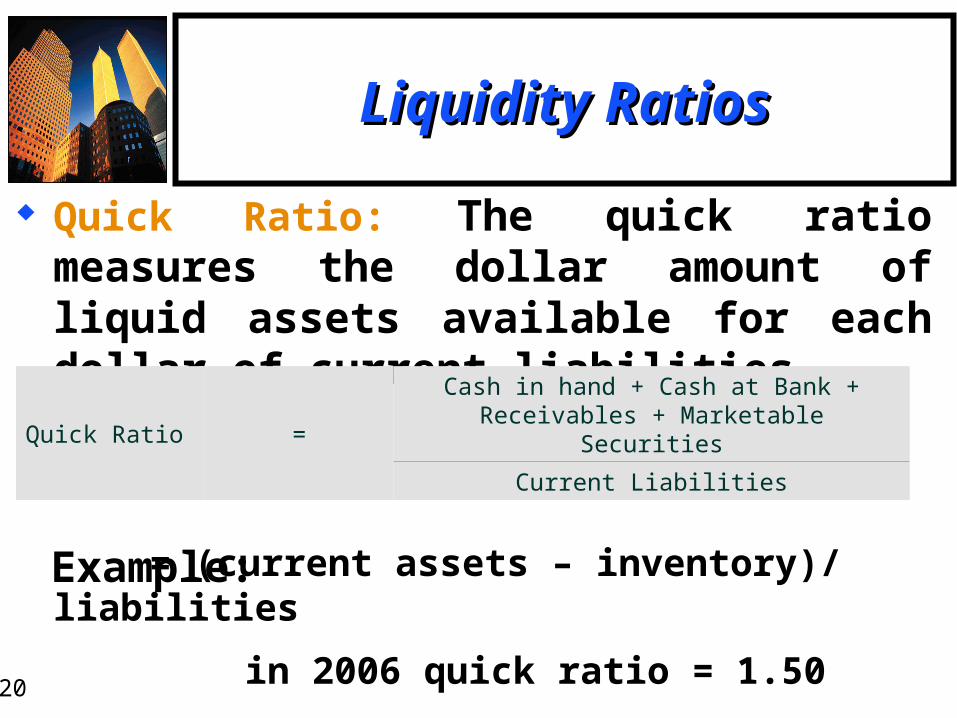
Quick Ratio: The quick ratio measures the dollar amount of liquid assets available for each dollar of current liabilities.
= (current assets – inventory)/ liabilities
in 2006 quick ratio = 1.50
Liquidity RatiosLiquidity Ratios
Example:
Quick Ratio =
Cash in hand + Cash at Bank + Receivables + Marketable Securities
Current Liabilities
6-21
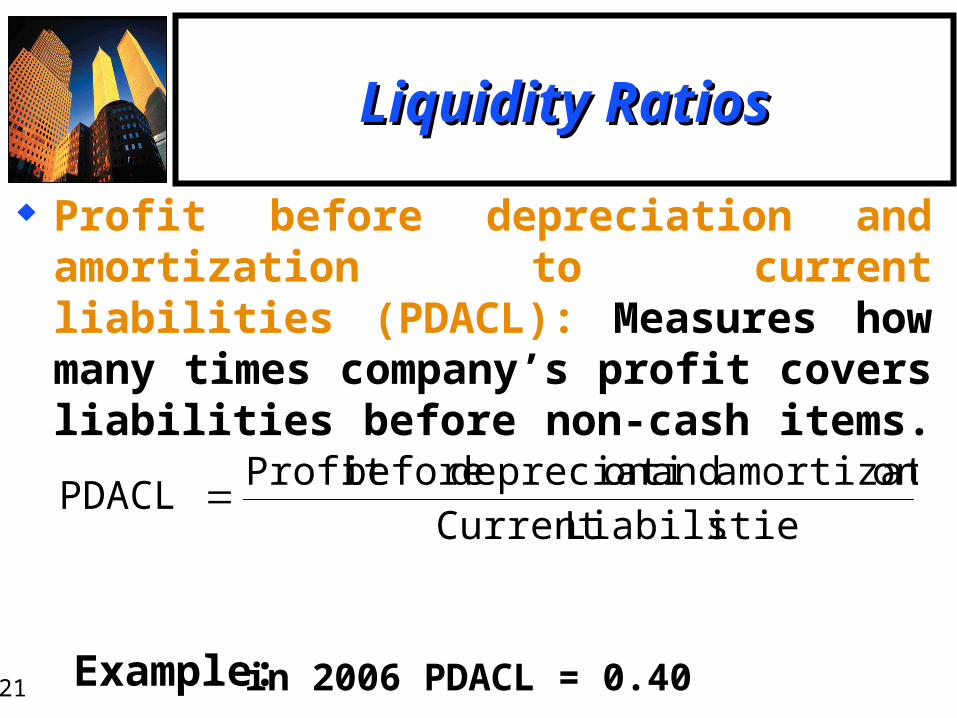
Profit before depreciation and amortization to current liabilities (PDACL): Measures how many times company’s profit covers liabilities before non-cash items.
in 2006 PDACL = 0.40
Liquidity RatiosLiquidity Ratios
Example:
sLiabilitieCurrent
onamortizati andon depreciati beforeProfit PDACL
6-22
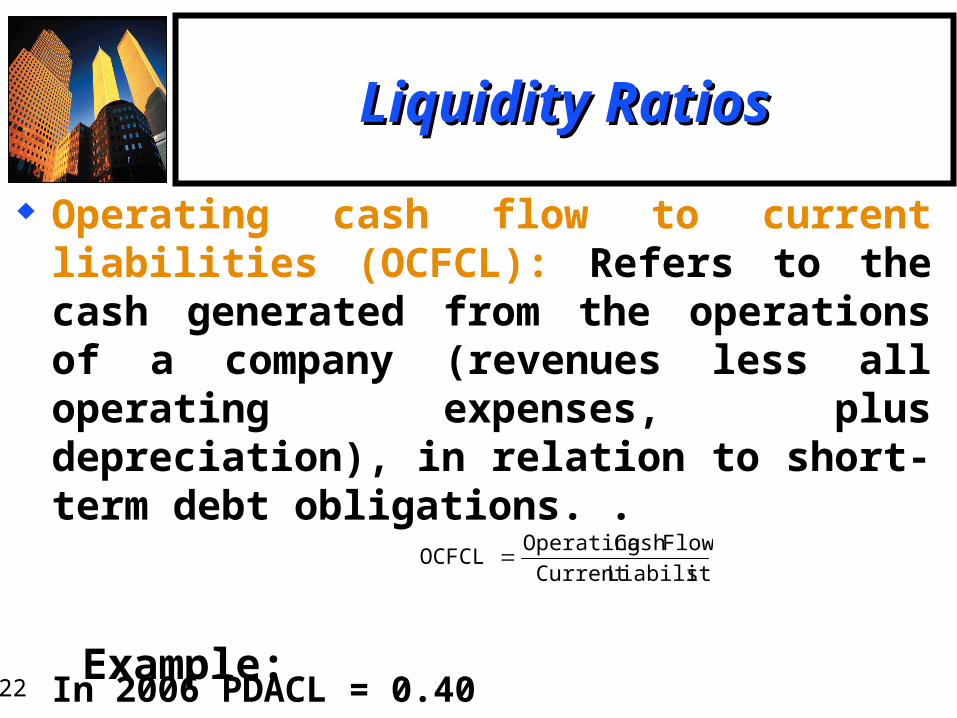
Operating cash flow to current liabilities (OCFCL): Refers to the cash generated from the operations of a company (revenues less all operating expenses, plus depreciation), in relation to short-term debt obligations. .
In 2006 PDACL = 0.40
Liquidity RatiosLiquidity Ratios
Example:
sLiabilitieCurrent
FlowCash Operating OCFCL
6-23
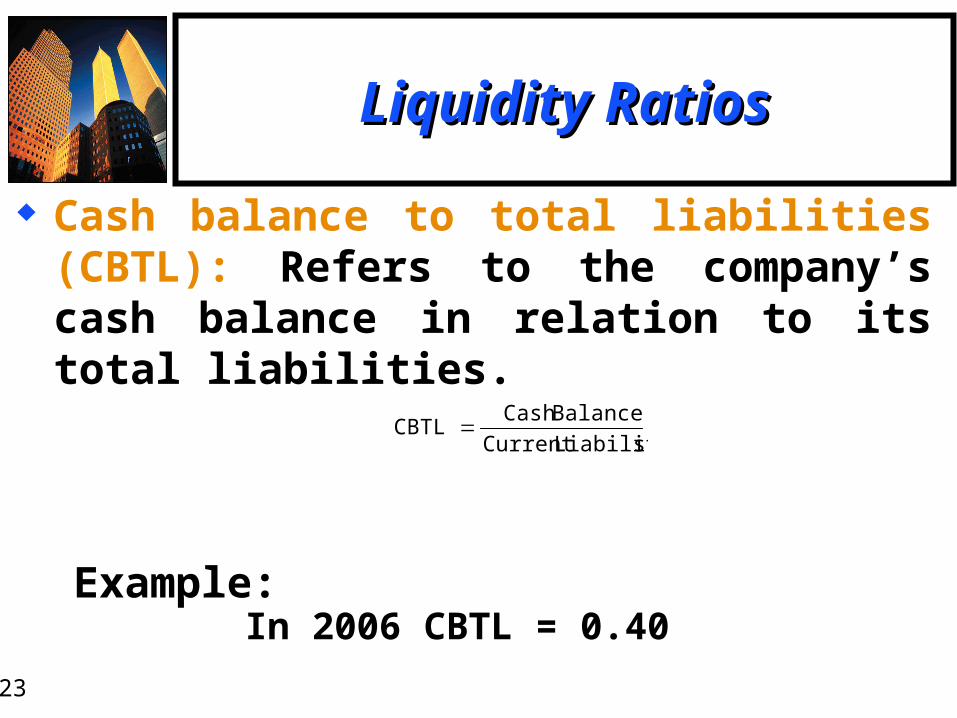
Cash balance to total liabilities (CBTL): Refers to the company’s cash balance in relation to its total liabilities.
In 2006 CBTL = 0.40
Liquidity RatiosLiquidity Ratios
Example:
sLiabilitieCurrent
BalanceCash CBTL
6-24
Leverage (Capital Leverage (Capital Structure) RatiosStructure) Ratios
Debt to equity ratio (DE ratio)
Total liabilities to total tangible assets (TLTAI)
Interest cover ratio
Net debt to equity ratio
Equity multiplier
6-25
Leverage (Capital Leverage (Capital Structure) RatiosStructure) Ratios
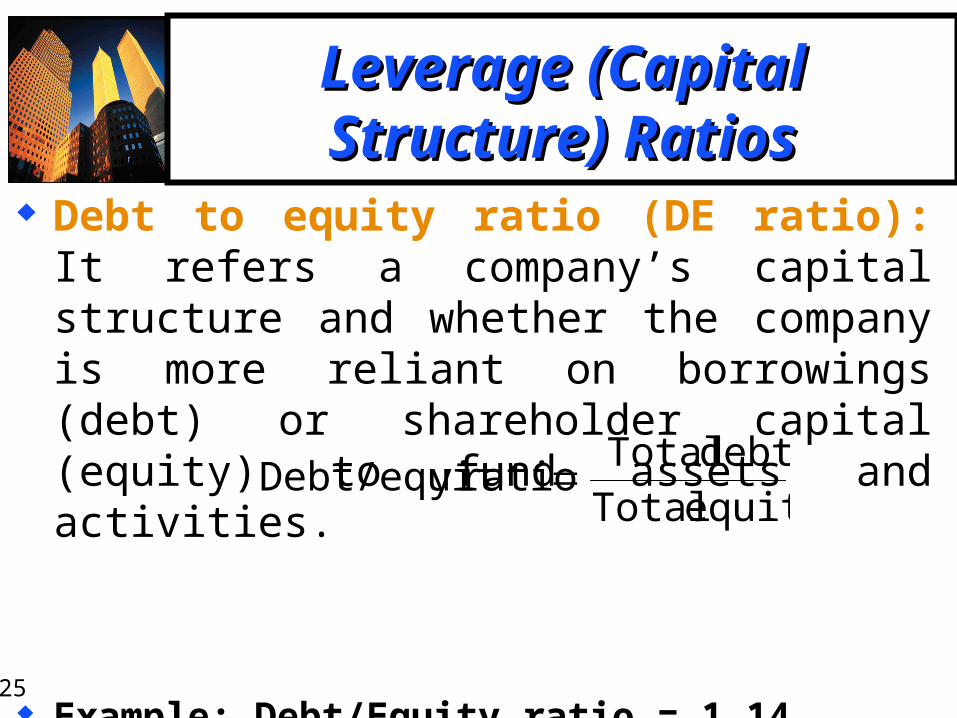
Debt to equity ratio (DE ratio): It refers a company’s capital structure and whether the company is more reliant on borrowings (debt) or shareholder capital (equity) to fund assets and activities.
Example: Debt/Equity ratio = 1.14
equity Total
debt Total ratioy Debt/equit
6-26
Leverage (Capital Leverage (Capital Structure) RatiosStructure) Ratios
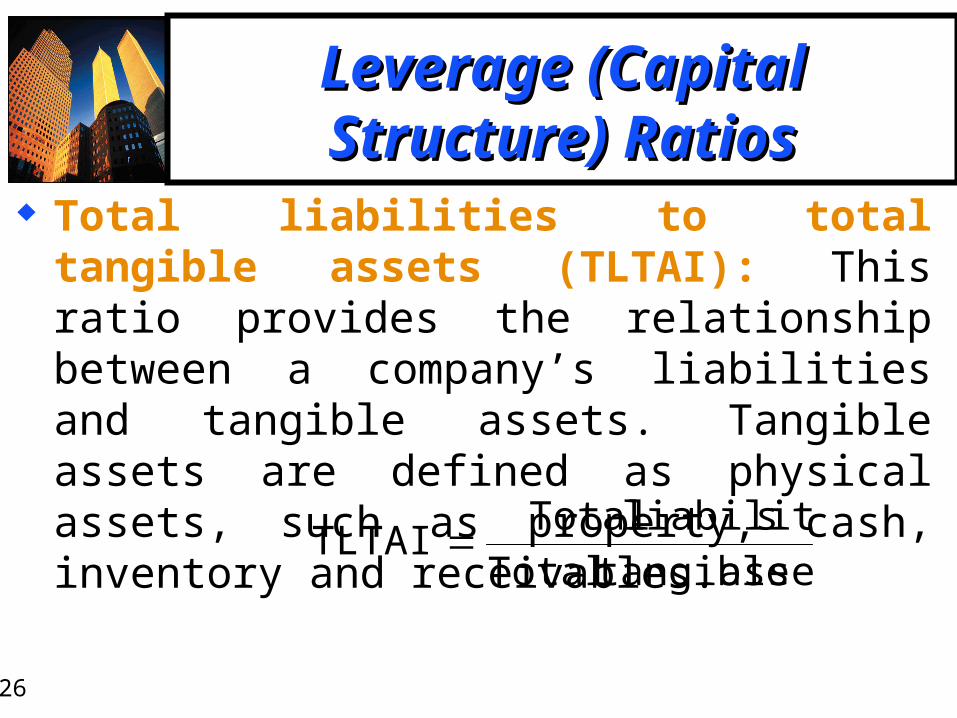
Total liabilities to total tangible assets (TLTAI): This ratio provides the relationship between a company’s liabilities and tangible assets. Tangible assets are defined as physical assets, such as property, cash, inventory and receivables.
Example: TLTAI = 1.60
assets tangibleTotal
sliabilitie Total TLTAI
6-27
Leverage (Capital Leverage (Capital Structure) RatiosStructure) Ratios
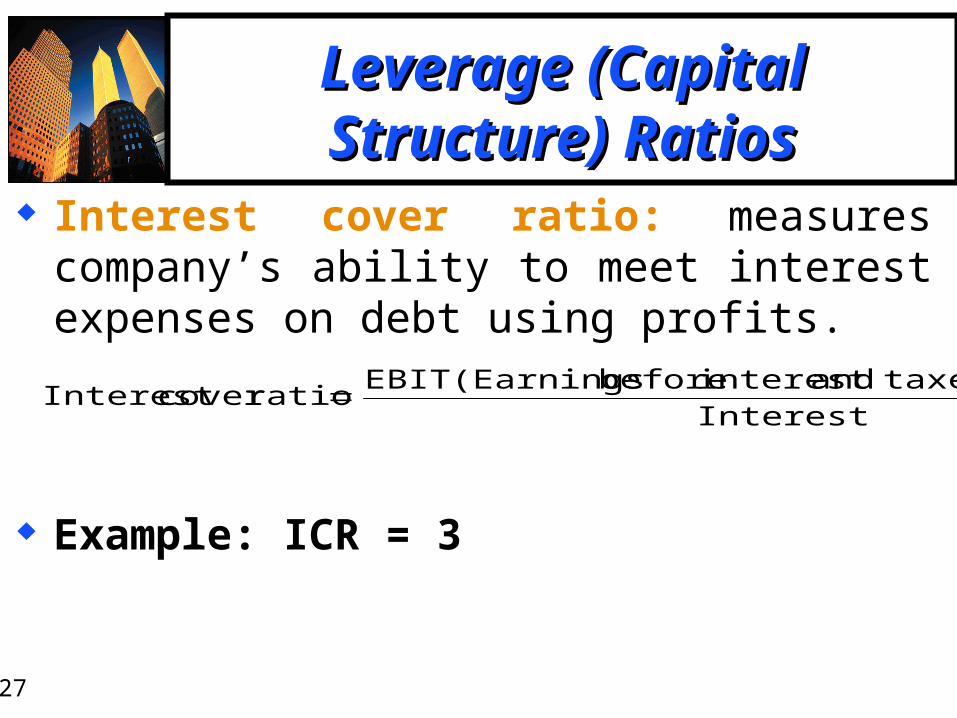
Interest cover ratio: measures company’s ability to meet interest expenses on debt using profits.
Example: ICR = 3
Interest
taxes)andinterest before (Earnings EBIT ratiocover Interest
6-28
Leverage (Capital Leverage (Capital Structure) RatiosStructure) Ratios
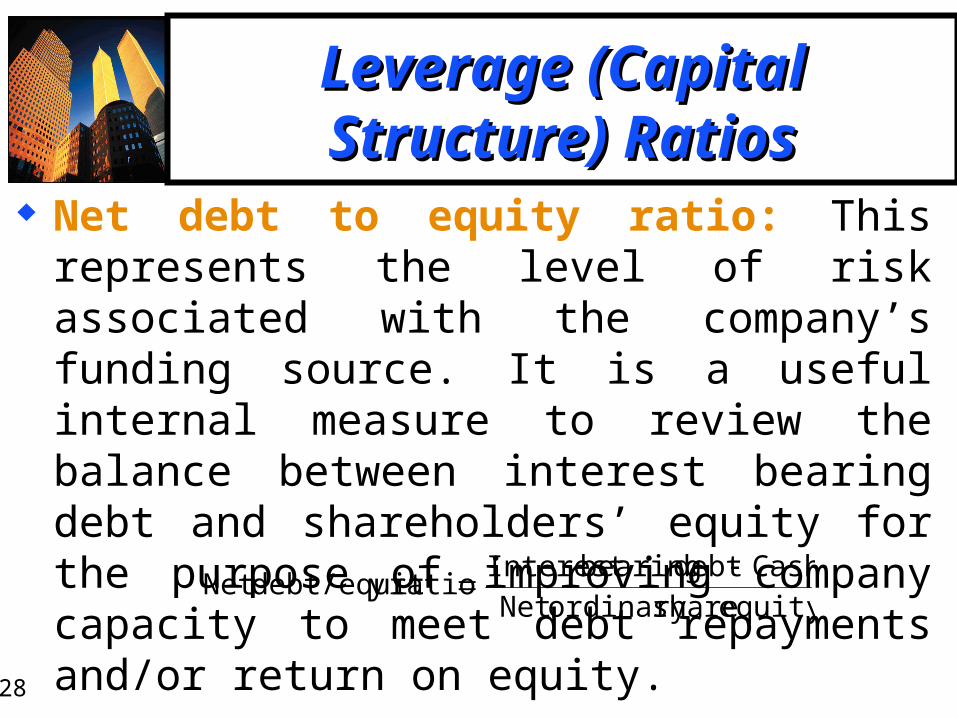
Net debt to equity ratio: This represents the level of risk associated with the company’s funding source. It is a useful internal measure to review the balance between interest bearing debt and shareholders’ equity for the purpose of improving company capacity to meet debt repayments and/or return on equity.
equity shareordinary Net
Cash debt bearingInterest ratioy debt/equitNet
6-29
Leverage (Capital Leverage (Capital Structure) RatiosStructure) Ratios
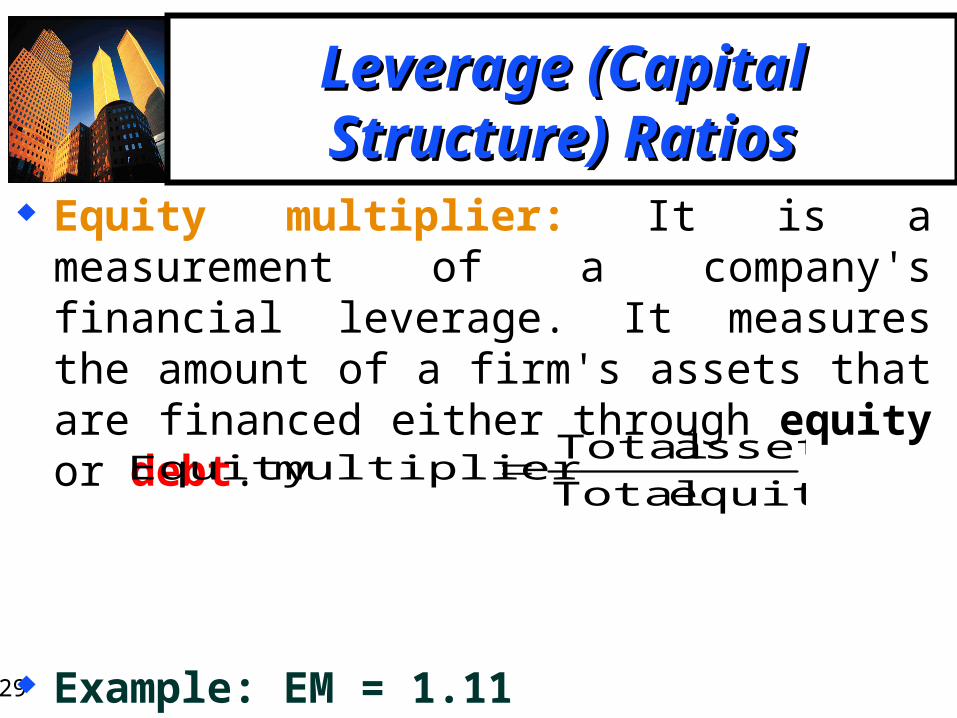
Equity multiplier: It is a measurement of a company's financial leverage. It measures the amount of a firm's assets that are financed either through equity or debt.
Example: EM = 1.11
equity Total
assets Total multiplierEquity
6-30
Profitability RatiosProfitability Ratios
Earnings per share (EPS )
Gross profit margin
Net profit margin
Return on assets (ROA )
Return on equity (ROE )
6-31
Profitability RatiosProfitability Ratios
Earnings per share (EPS): It shows the portion of a company’s profit that is allocated to each outstanding share of common stock. EPS figure is very important for shareholders because the payment of dividend and increase in the value of stock in future largely depends on it. EPS is the most widely quoted and relied figure by investors.
Example: EPS = $1.60shares goutstandin Total
incomeNet EPS
6-32
Profitability RatiosProfitability Ratios
Gross profit margin: Gross profit margin tells us what percentage of a company’s sales revenue would remain after deducting the cost of goods sold.
Example: Gross profit margin = 50%
100X Sales
cost)(direct sold goods ofCost Sales Margin Profit Gross
6-33
Profitability RatiosProfitability Ratios
Net profit margin: Net profit margin meanwhile indicates what percentage of a company’s sales revenue would remain after all costs have been taken into account.
Example: Net profit margin = 20%
100X Sales
IncomeNet Margin Profit Net
6-34
Profitability RatiosProfitability Ratios
Return on assets (ROA): It is a measurement of management performance. ROA tells the investor how well a company uses its assets to generate income. A higher ROA denotes a higher level of management performance.
Example: ROA = 13.3%
100% Assets Total Average
IncomeNet (ROA) assetson Return
6-35
Profitability RatiosProfitability Ratios
Return on equity (ROE): It is another measurement of management performance. ROE tells the investor how well a company has used the capital from its shareholders to generate profits. A higher ROE denotes a higher level of management performance.
Example: ROE = 22.22%
%100Equity Total Average
IncomeNet (ROE)equity on Return
6-36
Valuation RatiosValuation Ratios
Price to earnings ratio (PE)
Price/earnings to growth ratio (PEG)
Dividend yield
6-37
Valuation RatiosValuation Ratios
Price to earnings ratio (PE): It assess a company’s value. It measures company’s current share price relative to its per-share earnings.
Example: PE = 10
shareper Earnings
shareper Price PE
6-38
Valuation RatiosValuation Ratios
Price/earnings to growth ratio (PEG): The PEG ratio acts as a measure of company’s value that takes into account future growth.
Example: PEG = 0.625
rategrowth EPS
PE PEG
6-39
Valuation RatiosValuation Ratios
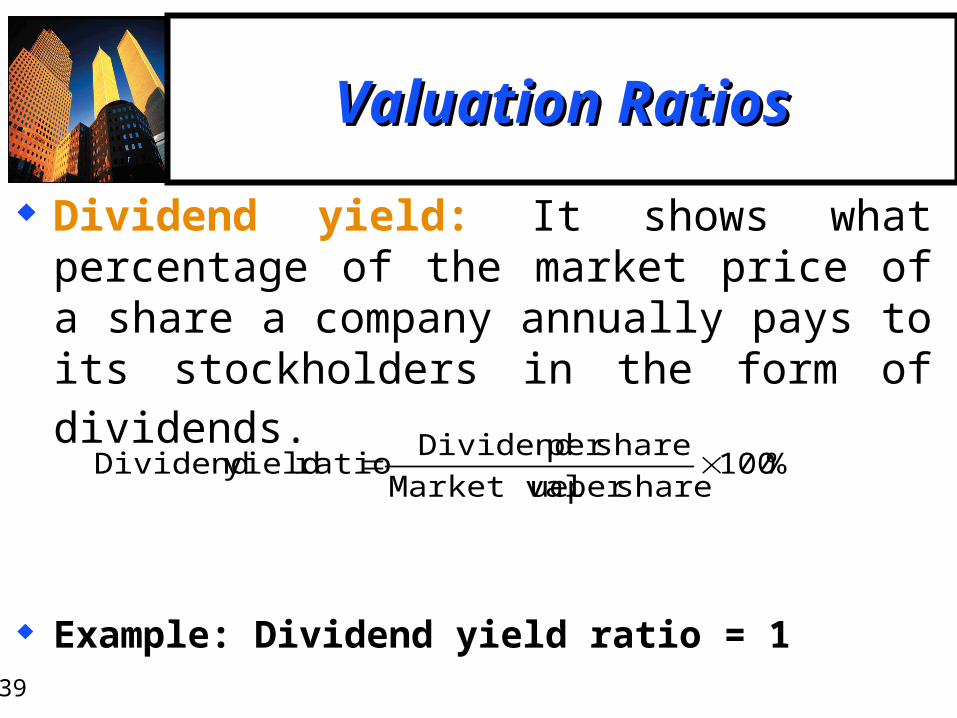
Dividend yield: It shows what percentage of the market price of a share a company annually pays to its stockholders in the form of dividends.
Example: Dividend yield ratio = 1
%100 shareper ueMarket val
shareper Dividend ratio yield Dividend
6-40
Turnover RatiosTurnover Ratios
Inventory turnover
Fixed asset turnover
Total asset turnover
Day’s sales in inventory
Receivables turnover
Day’s sales in receivable
6-41
Turnover RatiosTurnover Ratios
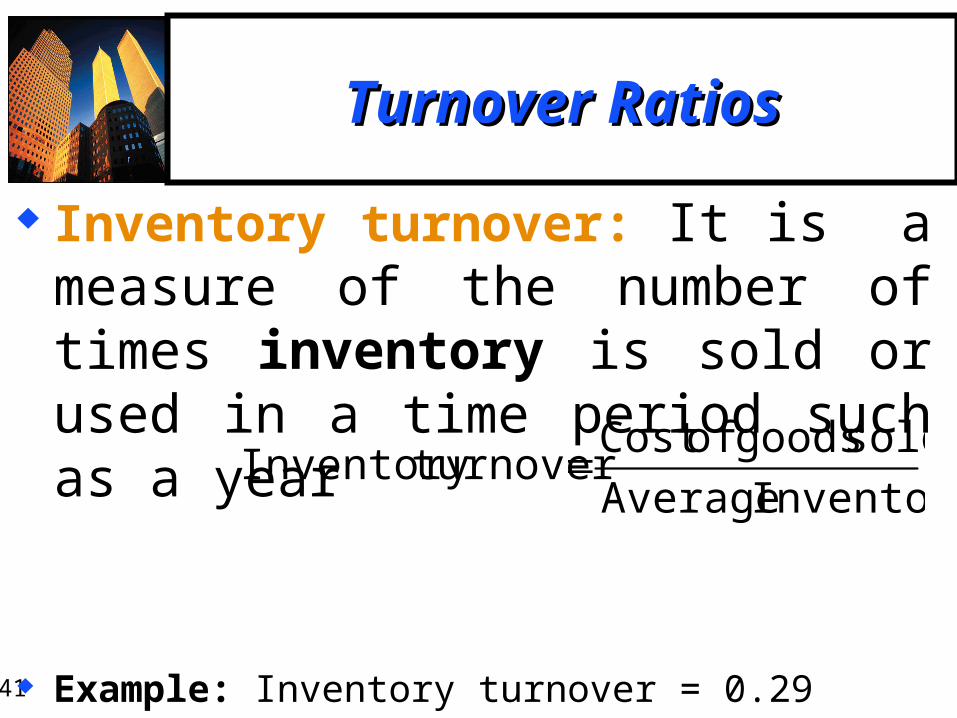
Inventory turnover: It is a measure of the number of times inventory is sold or used in a time period such as a year
Example: Inventory turnover = 0.29 times
Inventory Average
sold goods ofCost turnover Inventory
6-42
Turnover RatiosTurnover Ratios
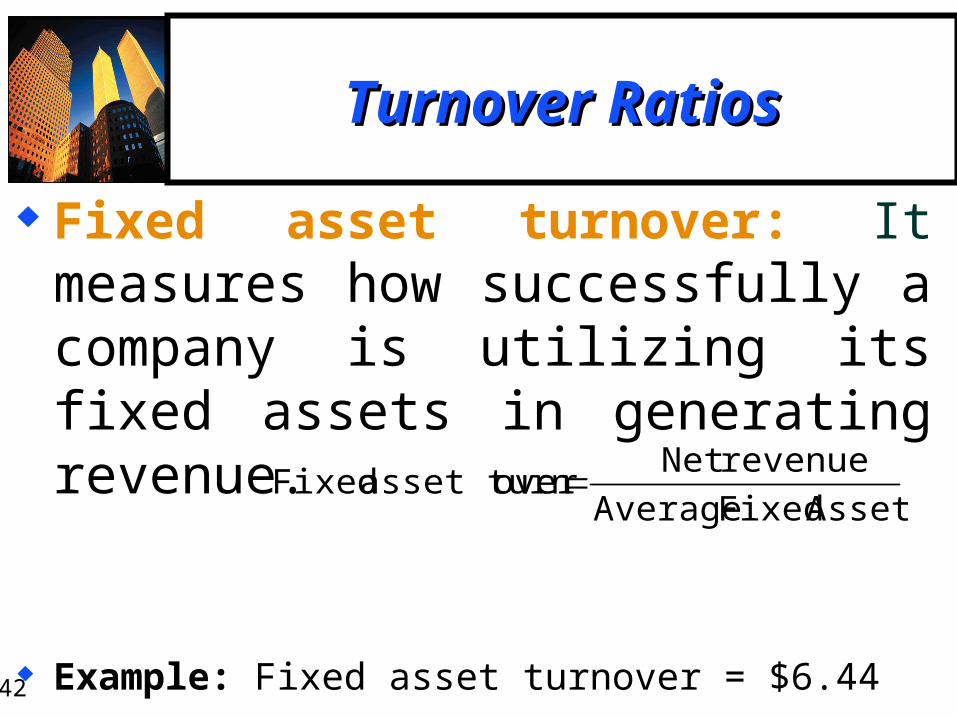
Fixed asset turnover: It measures how successfully a company is utilizing its fixed assets in generating revenue.
Example: Fixed asset turnover = $6.44
Assets Fixed Average
revenueNet over asset turn Fixed
6-43
Turnover RatiosTurnover Ratios
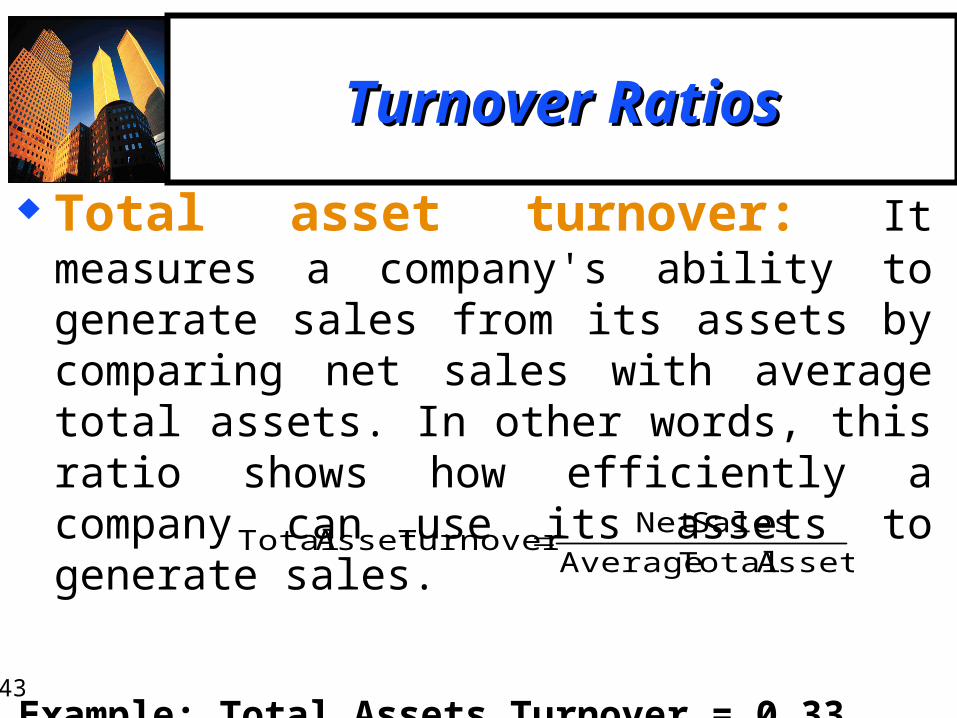
Total asset turnover: It measures a company's ability to generate sales from its assets by comparing net sales with average total assets. In other words, this ratio shows how efficiently a company can use its assets to generate sales.
Example: Total Assets Turnover = 0.33
Assets Total Average
SalesNet Turnover Asset Total
6-44
Turnover RatiosTurnover Ratios
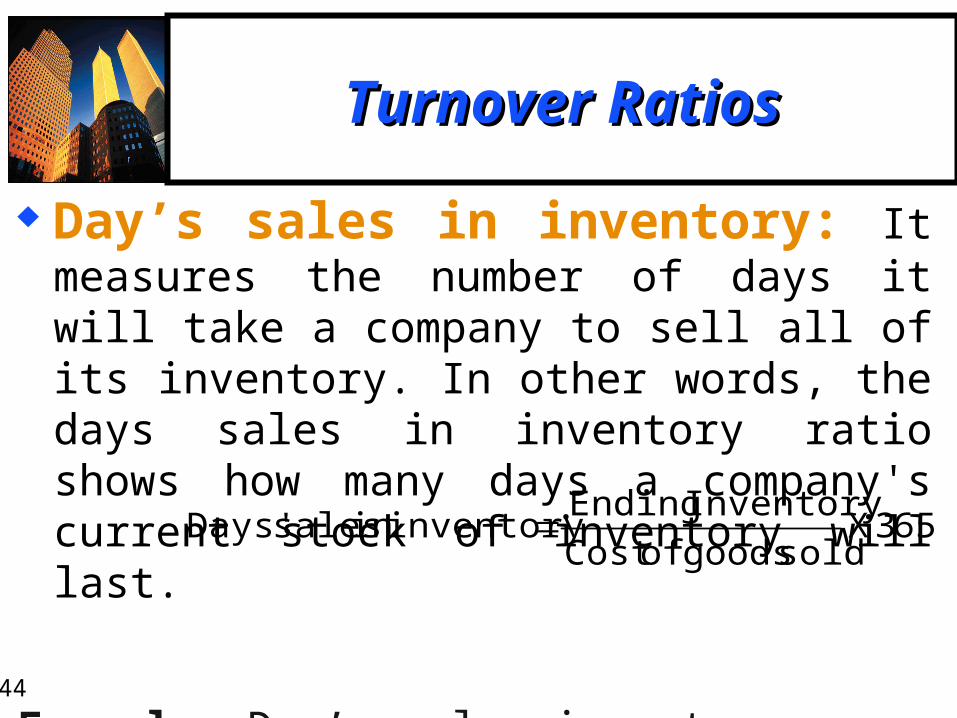
Day’s sales in inventory: It measures the number of days it will take a company to sell all of its inventory. In other words, the days sales in inventory ratio shows how many days a company's current stock of inventory will last.
Example: Day’s sales inventory = 122 days
653Xsold goods ofCost
Inventory Ending inventory in sales Days'
6-45
Turnover RatiosTurnover Ratios
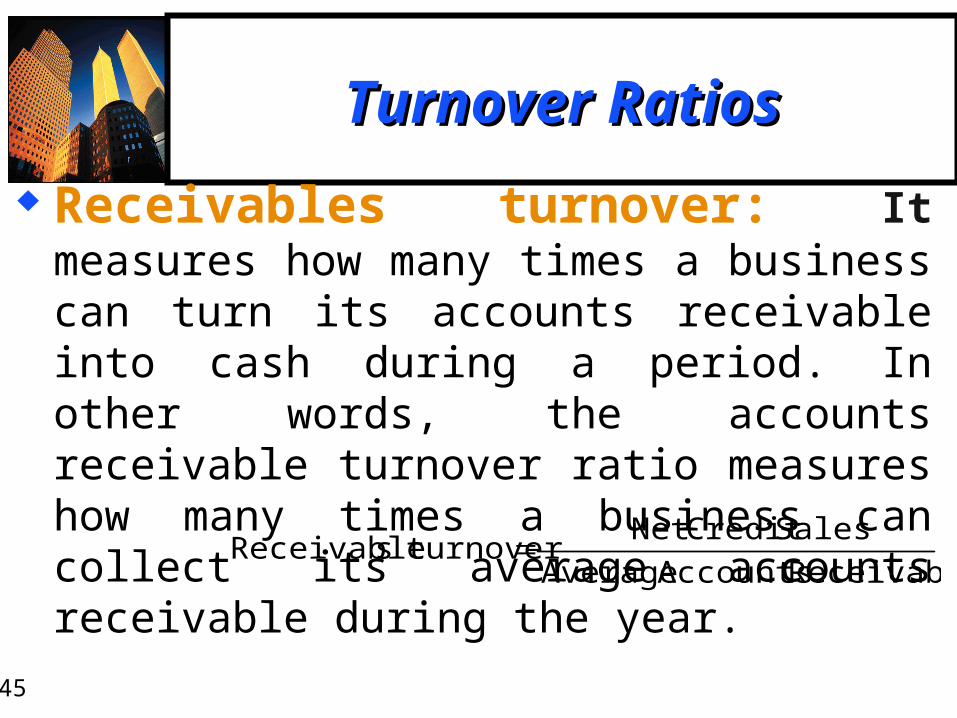
Receivables turnover: It measures how many times a business can turn its accounts receivable into cash during a period. In other words, the accounts receivable turnover ratio measures how many times a business can collect its average accounts receivable during the year.
Example: Receivable Turnover: 3.33
Receivable Accounts Average
SalesCredit Net turnover sReceivable
6-46
Turnover RatiosTurnover Ratios
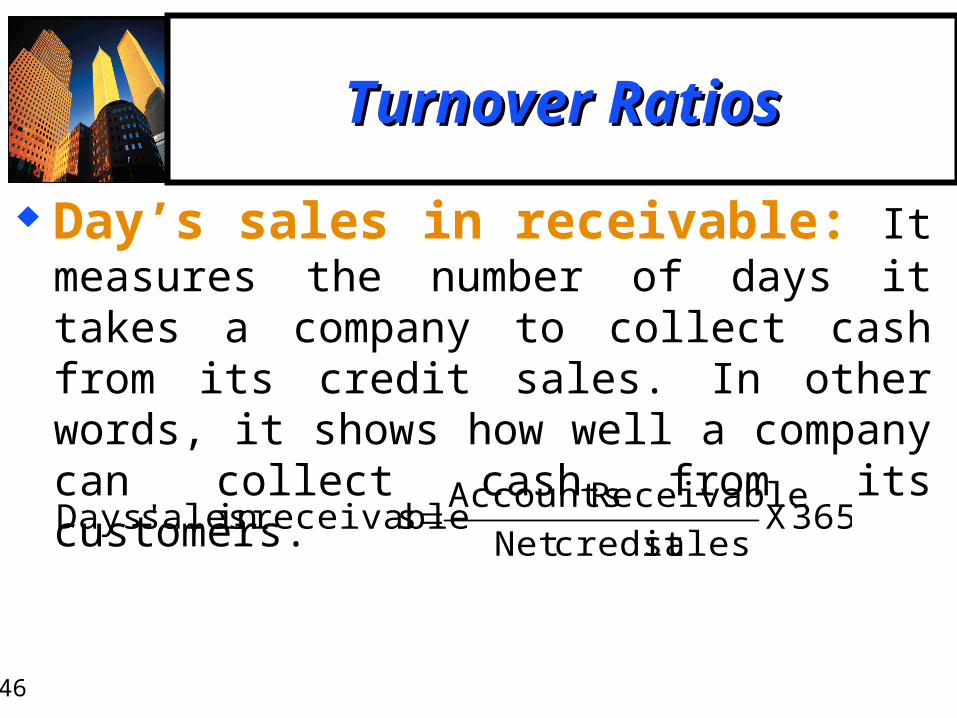
Day’s sales in receivable: It measures the number of days it takes a company to collect cash from its credit sales. In other words, it shows how well a company can collect cash from its customers.
Example: Days’ sales in receivables = 31
365Xsalescredit Net
Receivable Accounts sreceivablein sales Days'
6-47
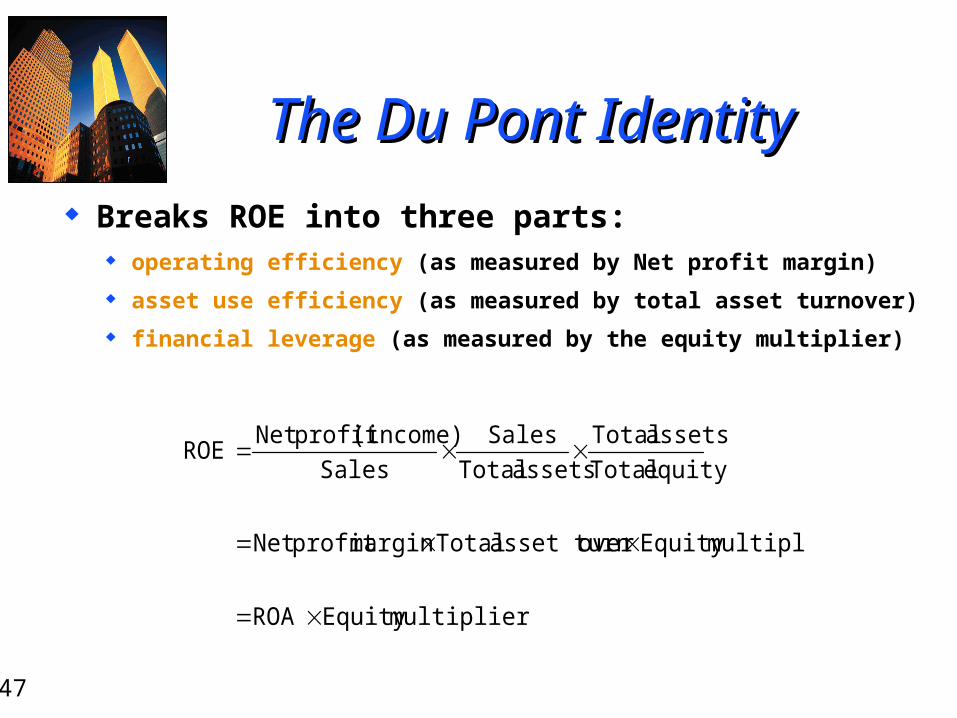
The Du Pont IdentityThe Du Pont Identity
Breaks ROE into three parts: operating efficiency (as measured by Net profit margin)
asset use efficiency (as measured by total asset turnover)
financial leverage (as measured by the equity multiplier)
multiplierEquity ROA
multiplierEquity over asset turn Total margin profit Net
equity Total
assets Total
assets Total
Sales
Sales
(income)profit Net ROE
6-48
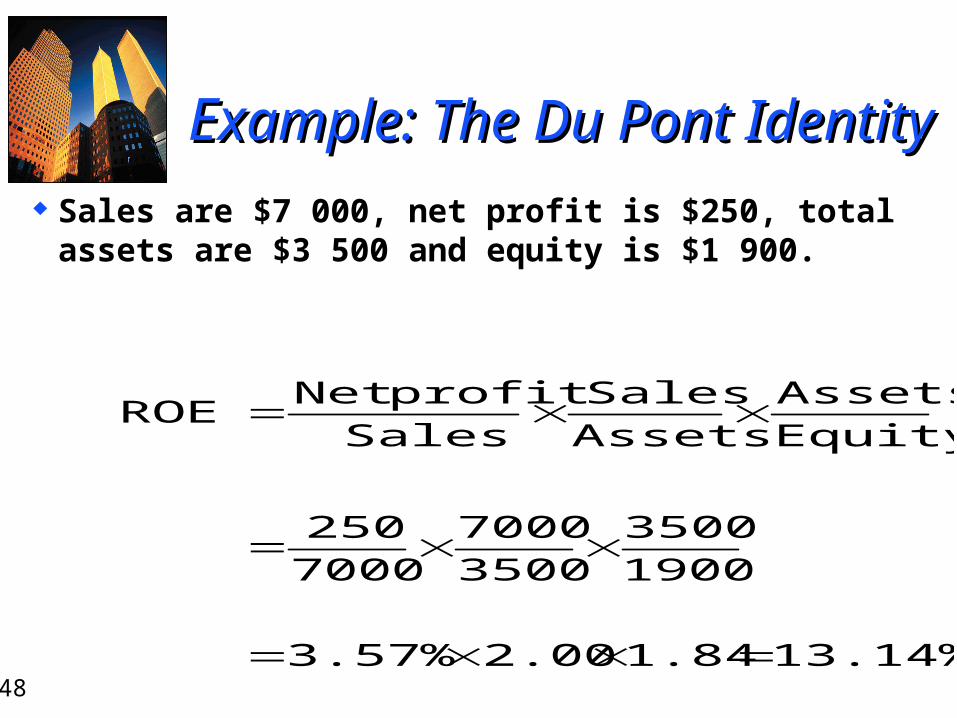
ExExample: The Du Pont Identityample: The Du Pont Identity
Sales are $7 000, net profit is $250, total assets are $3 500 and equity is $1 900.
13.14% 1.84 2.00 3.57%
1900
3500
3500
7000
7000
250
Equity
Assets
Assets
Sales
Sales
profitNet ROE
6-49
Why Evaluate Financial Why Evaluate Financial Statements?Statements?
Internal uses: performance evaluation
planning for the future
External uses: evaluation by outside parties
evaluation of main competitors
identifying potential takeover targets
6-50
Benchmarks for ComparisonBenchmarks for Comparison
Ratios are most useful when compared to a benchmark.
Time-trend analysis—examine how a particular ratio(s) has performed historically.
Peer group analysis—using similar firms (competitors) for comparison of results.
6-51
Benchmarks for ComparisonBenchmarks for Comparison One common way of identifying potential peers is
based on the Global Industry Classification Standard (GICS) used by the Australian Stock Exchange (ASX). GICS is a code used globally to classify a firm by its type
of business operations.
GICS consists of 23 industry groups, 59 industries, and 122 sub-industries; covering over 12 000 companies globally.
The basis of classification is the area from which most revenue is generated.
6-52
Problems with Financial Problems with Financial Statement AnalysisStatement Analysis
No underlying theory to identify correct ratios to use or appropriate benchmarks.
Benchmarking is difficult for diversified firms.
Firms may use different accounting procedures.
Firms may have different recording periods. One-off events can severely affect financial
performance.
6-53
Summary and ConclusionsSummary and Conclusions
Activities that bring in cash are called ‘sources of cash’, and activities that involve spending cash are called ‘uses of cash’.
A Cash Flow Statement summarises sources and uses of cash over a specified period.
Financial ratios are grouped together into five main categories: Liquidity, Capital Structure, Valuation, Profitability, and Turnover.
Ratios are most useful when compared to a benchmark (e.g. time-trend and peer group analysis).
Problems can arise in using financial statements.