Embed Size (px)
Citation preview

1
Implementation and Impact of Lean Redesigns in Primary Care
Dorothy Hung, Ph.D., M.A., M.P..H.Palo Alto Medical Foundation Research Institute
University of California at San Francisco
June 6, 2017Lean Healthcare Research Symposium
Lean Transformation in Health Care Summit
Funder: Agency for Healthcare Research and QualityAccelerating Change & Transformation in Organizations and Networks
(ACTION II)
Palo Alto Medical Foundation (PAMF)
• >900 physicians, 5000 non-MD staff
• Majority fee-for-service:
- 70% commercial FFS
- 12% commercial HMO
- 13% Medicare/Medicaid
- 5% Self-pay or Other
• Multispecialty, not-for-profit ambulatory care delivery system
• Serves over 1 million patients
• Operates in 6 counties in San Francisco Bay Area
2
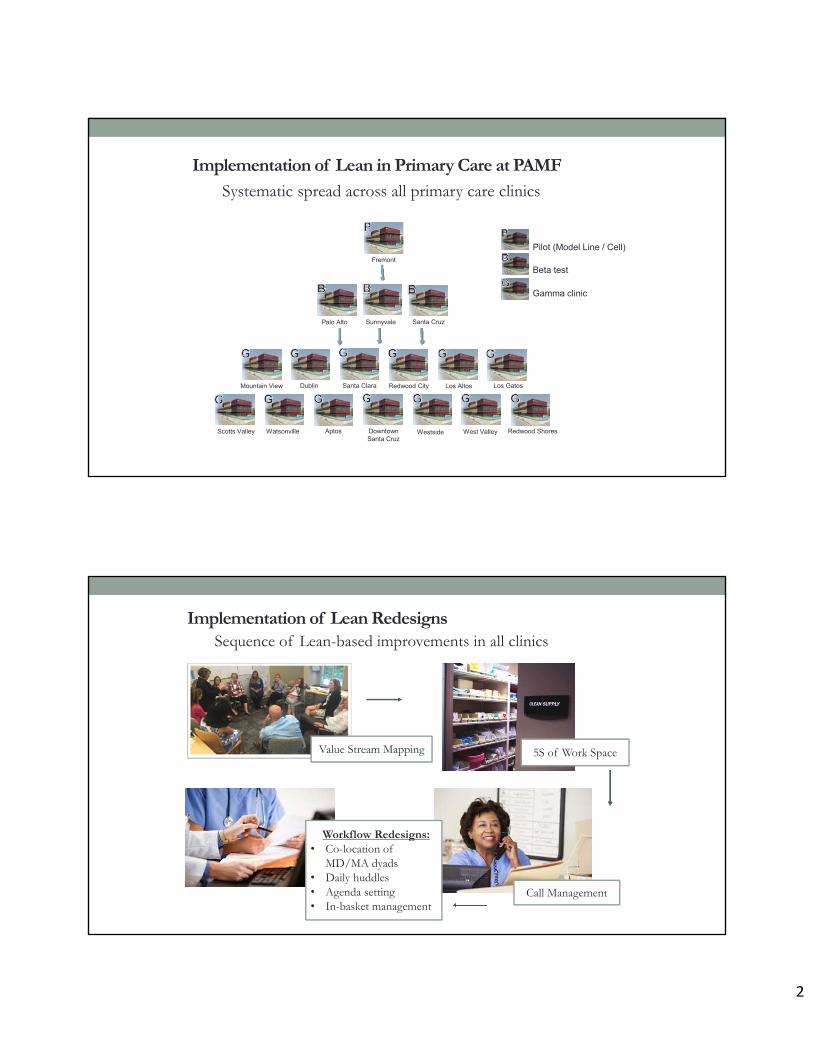
Systematic spread across all primary care clinics
Implementation of Lean in Primary Care at PAMF
Pilot (Model Line / Cell)
Beta test
Gamma clinic
Fremont
Palo Alto Sunnyvale Santa Cruz
Santa ClaraMountain View Los GatosRedwood City Los AltosDublin
Downtown Santa Cruz
Westside West Valley Redwood ShoresScotts Valley Watsonville Aptos
Implementation of Lean Redesigns
Workflow Redesigns:• Co-location of
MD/MA dyads• Daily huddles• Agenda setting• In-basket management
Sequence of Lean-based improvements in all clinics
Value Stream Mapping 5S of Work Space
Call Management

3
Qualitative Data Sources
In-depth interviews (N=113)- Physicians- Clinic leaders
Focus Groups (N=11 groups, 3-6 members each)- Medical Assistants
Observations (N=20)- Improvement events
- Workflows
Interviewed
Frontline Physicians
Family Practitioners 26
Internists 19
Pediatricians 24
Organizational Leaders
Physician Leaders 21
Operations Leaders 23
Total 113
In-depth Interviews by Professional Role
Implementation Measures
Study focused on two aspects ofimplementation:
• Acceptance – Degree to which those impacted by the Lean change effort viewed the changes as acceptable in principle
• Adoption – The reported adoption, attempt to adopt, or conversely, abandonment of Lean redesigns in practice
4
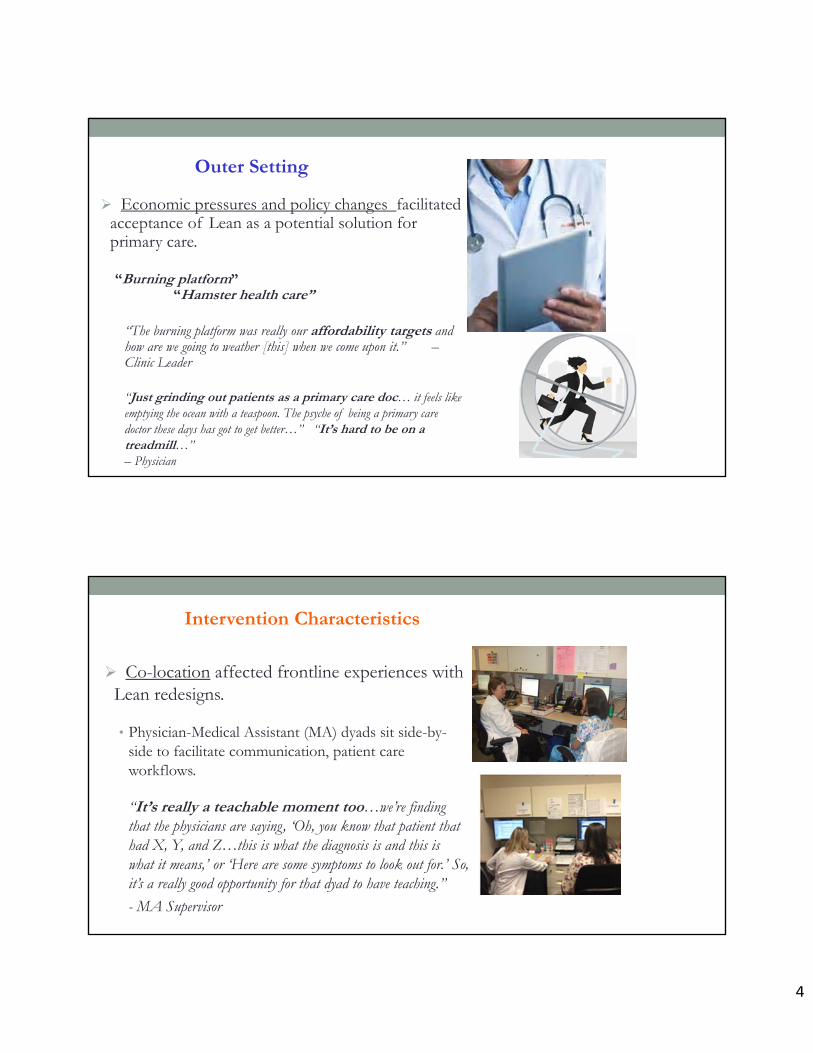
Outer Setting
Economic pressures and policy changes facilitated acceptance of Lean as a potential solution for primary care.
“Burning platform” “Hamster health care”
“The burning platform was really our affordability targets and how are we going to weather [this] when we come upon it.” –Clinic Leader
“Just grinding out patients as a primary care doc… it feels like emptying the ocean with a teaspoon. The psyche of being a primary care doctor these days has got to get better…” “It’s hard to be on a treadmill…” – Physician
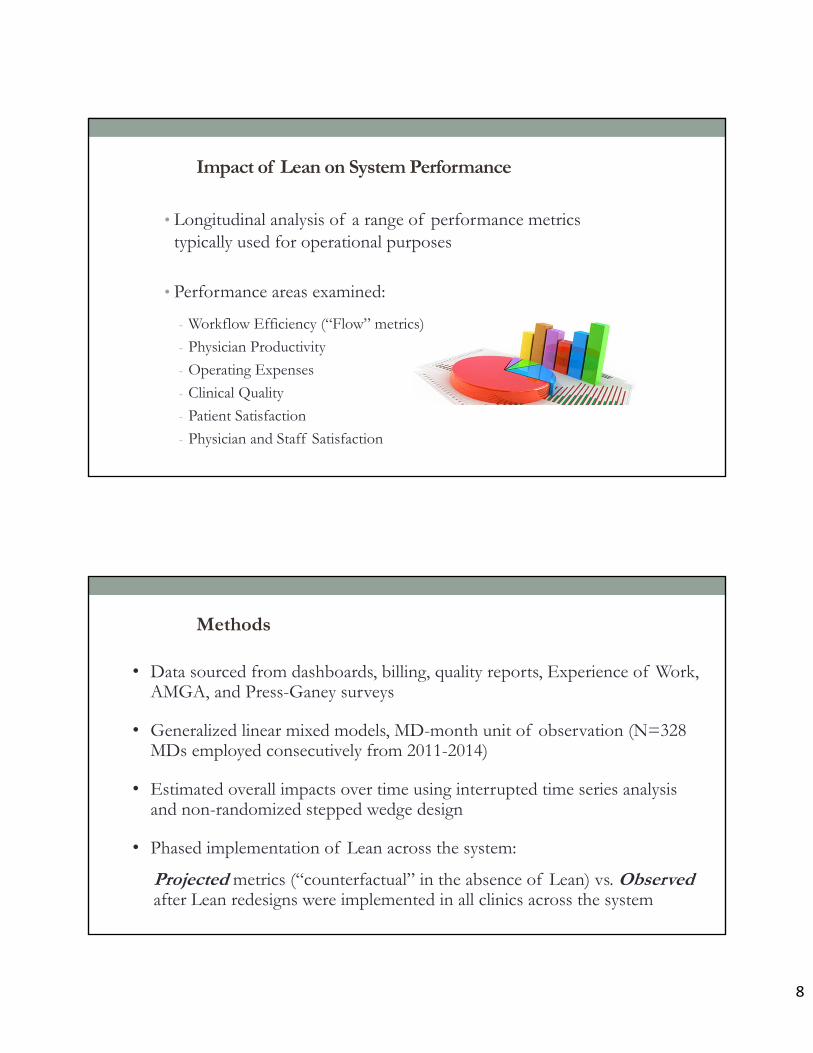
Intervention Characteristics
Co-location affected frontline experiences with Lean redesigns.
• Physician-Medical Assistant (MA) dyads sit side-by-side to facilitate communication, patient care workflows.
“It’s really a teachable moment too…we’re finding that the physicians are saying, ‘Oh, you know that patient that had X, Y, and Z…this is what the diagnosis is and this is what it means,’ or ‘Here are some symptoms to look out for.’ So, it’s a really good opportunity for that dyad to have teaching.”
- MA Supervisor

5
Intervention Characteristics
Challenges to accepting Lean standardization of workflows and care processes.
“You have to say please trust me because if we all do it the same way and we all follow the same rules…then the whole team can perform at an optimum levelfrom the patient service representative, to the doctor and everyone in between, and you not only get back more time, you build a better care, you can see more patients, and you feel better about coming to work.” – Clinical Director
Process of Implementation
“Top-down” vs. “Bottom-up”
• Some characterized Lean as a top-down effort led by “higher ups”
- At odds with Lean principle of“respect for people” doing thefrontline work
• Others described this as an “appropriateapproach”
- System-wide, complex changes likeLean may necessitate this style

6
Process of Implementation
Engaging frontline employees in developing Lean work designs is a critical aspect of “Process.”
“[I think for Lean to be successful] …make sure that the doctors and the staff continue to have a say in what happens. That's always a big concern is that… people are worried things just happen from above and we're losing control.” – Internist
• Leads to greater willingness to “try out” Lean redesigns.
Characteristics of Individuals and Teams
Changing work roles and relationships between care team members influenced uptake of redesigns.
• Required skillsets and work scope of medical assistants (MAs) as newly designated “Lean Flow Manager”
• Physician compliance with redesigns affected team’s ability to adopt the new workflows.

7
Characteristics of Individuals and Teams
Physician autonomy and adherence to Lean redesigns:
• Those most resistant to Lean believed they were “already highly efficient.”
• Some were concerned that Lean threatens their autonomy; others acknowledged they still had “authority where it matters” most—in exam room:
“I don't feel like my work has changed so much that I'm not in control. I still decide what I'm doing with my patients. It's just that Lean presents my patients to me in a nicer way so that I can do my work better.” – Physician
Summary
Similarities but also many differences between clinics in successful implementation of Lean redesigns
External environment impacted acceptance of Lean in principle• Market pressures, Patient demand in primary care
Local factors played critical roles in adoption of Lean in practice
Hung DY, Gray CP, Martinez MC, Schmittdiel J, Harrison MI. Acceptance of Lean Redesigns in Primary Care: A Contextual Analysis. Health Care Management Review. 2016 Mar 2. [Epubahead of print]
Intervention characteristics
• Co-location
• Standardization
Process of Implementation
• Top-down vs. Bottom-up
• Employee engagement
Inner setting
• Organizational culture
• Local leadership
Individuals and Teams
• Work roles & relationships
• Physician autonomy
8
• Longitudinal analysis of a range of performance metrics typically used for operational purposes
• Performance areas examined:
- Workflow Efficiency (“Flow” metrics)
- Physician Productivity
- Operating Expenses
- Clinical Quality
- Patient Satisfaction
- Physician and Staff Satisfaction
Impact of Lean on System Performance
Methods
• Data sourced from dashboards, billing, quality reports, Experience of Work, AMGA, and Press-Ganey surveys
• Generalized linear mixed models, MD-month unit of observation (N=328 MDs employed consecutively from 2011-2014)
• Estimated overall impacts over time using interrupted time series analysis and non-randomized stepped wedge design
• Phased implementation of Lean across the system:
Projected metrics (“counterfactual” in the absence of Lean) vs. Observedafter Lean redesigns were implemented in all clinics across the system

9
Phased Implementation of Lean Redesigns
Note: All listed Clinics (except 4 and 7) have additional satellite clinic sites that were included for analysis.
Pre‐Intervention period
Training/Implementation
Post‐Intervention period
Example: Office Visit Charts Closed < 2 hoursPilot Beta 1 Beta 2 Beta 3
Clinic 3 Clinic 4 Clinic 5
Clinic 1
Clinic 6
Clinic 2
Clinic 7

10
Workflow Efficiency
*p<0.05
Flow Metrics• Office visit charts closed within 2 hours• Electronic patient messages responded within 4 hours• Prescription refills renewed within 4 hours• Telephone encounters closed within 4 hours
Flow Metric Projected Value
ObservedValue
Mean Difference(95% bootstrap)
% Change from Baseline
Office Visit Charts < 2h 51.2% 56.2% -5.0% * 10.0%*
E-messaging < 4h 79.5% 77.7% -1.9% * -3.4%
Rx Renewal < 4h 63.4% 71.4% -8.0% * 12.6%*
Telephone Closed < 4h 57.3% 62.4% -5.1% * 8.9%*
Physician Productivity
wRVU: work Relative Value UnitcFTE: clinical Full-Time Equivalent
*p<0.05
• RVUs restated to CMS 2014 v2 valuation• wRVU/cFTE: Production per clinical FTE• wRVU/visit: Production per office visit (service intensity)
RVU Metric Projected Value
Observed Value Mean Difference(95% bootstrap)
% Changefrom Baseline
wRVU/cFTE 252.3 265.0 13.9* 5.5%*
wRVU/visit 1.5 1.5 0.0 0%

11
Clinical Quality
• IHA Pay-for-Performance clinical quality metrics for each physician
• Interrupted time series analysis on metrics that had an initial statistical difference pre- vs. post-Lean:
• Coordinated Diabetes Care: A1c < 8.0%
• Coordinated Diabetes Care: A1c < 7.0%
• Coordinated Diabetes Care: LDL-c < 100 mg/dL
• Coordinated Diabetes Care: Nephropathy Screening
• Cervical Cancer Screening, Asymptomatic Women
• Chlamydia Screening in Women (16-20 yo)
• Adolescent Immunizations: Meningococcal
Quality Metric ProjectedValue
ObservedValue
Mean Diff.(95%
bootstrap)
% Changefrom Baseline
Diabetes: A1c Control < 7.0% 64.5% 67.9% 3.4%* 5.3% *
Diabetes: A1c Control < 8.0% 35.5% 39.4% 3.9%* 11.0% *
Diabetes: LDL < 100 mg/dL 48.1% 53.1% 5.0%* 10.4% *
Diabetic Nephropathy Monitoring 75.7% 79.9% 4.2%* 5.5% *
Cervical Cancer Screening 71.9% 71.1% -0.8%* -1.1%
Chlamydia Screening 16-20 61.7% 60.7% -1.0%* -1.6%
Immunizations - Meningococcal 77.9% 69.0% -8.9%* -11.4% *
Clinical Quality
*p<0.05

12
• For each physician, examined proportion of satisfaction scores > 90% in each domain and in composite overall score
• Patient satisfaction domains:
- Composite Overall Score
- Access
- Care Provider
- Moving Through the Visit
- Nurse/Medical Assistant
- Handling of Personal Issues
Patient Satisfaction
Domain(proportion of 90% satisfied or higher)
Projected Value
ObservedValue
Mean difference(95% bootstrap)
% Changefrom Baseline
Composite Score 49.1% 63.2% 14.1% * 28.7% *
Access 37.4% 55.4% 18.1% * 48.4% *
Care Provider 79.0% 69.8% -9.2% * -11.6% *
Moving through Visit 50.9% 49.3% -1.6% -3.1%
Nurse/MA 66.2% 68.0% 1.7% 2.6%
Handling Personal Issues
69.0% 74.5% 5.5% * 8.0% *
Patient Satisfaction
*p<0.05

13
Physician Satisfaction % Differences (2011 vs. 2014) By phase of implementation
Staff Satisfaction % Differences (2011 vs. 2014) All primary care clinics system-wide
Pilot / Model Line
Beta test sites
All remaining clinics
Lean Implementation Phase
SummaryTopic Conclusions
Workflow
Efficiency
Increase in timeliness of completing 3 of 4 workflow measures: office visit chart closures, medication renewals, telephone responses.
Physician
Productivity
Higher wRVUs generated per physician per month. No change in wRVUs per office visit (service intensity).
Operating
Expenses
Lower total operating expenses (including staff compensation, and drugs and supply costs) standardized per tRVU. Not significant at p<0.05.
Clinical
Quality
Improvements in coordinated diabetes care metrics, no change in preventive screening metrics, and decreased meningococcal immunization among adolescents.
Patient
Satisfaction
Higher satisfaction overall and in specific domains, including access to care and handling of personal issues. Lower satisfaction with interactions with care providers.
Physician
Satisfaction
In pilot and beta clinics: Higher satisfaction overall and in specific domains, including time spent working and relationships with staff. Lower satisfaction overall in last phase of gamma clinics to implement Lean.
Staff Satisfaction Higher satisfaction overall and in specific domains, including credible leadership, employee engagement, growth / development, connection to purpose, healthy partnerships, empowerment and autonomy.
Hung DY, Harrison MI, Martinez MC, Luft HS. Scaling Lean in Primary Care: Impacts on System Performance. American Journal of Managed Care. 2017;23(3):294-301.

14
Conclusions
Importance of local context- Successful implementation & outcomes requires:
Engagement of all frontline staff
Alignment with internal clinic environments
Overall, there were beneficial effects of Lean redesigns on performance metrics without harm to clinical quality
Using Lean techniques to redesign care delivery- Strength of Lean’s attention to “Flow”
- Change management: involve providers and show results


![Lean Manufacturing Work Station Design in Silver Line Lean... · and increase production of their windows [1]. In order to identify problems in the 2300-1 Single Hung window line,](https://img.pdfslide.net/doc/110x75/5f5dda8d1a112e0c4e643048/lean-manufacturing-work-station-design-in-silver-line-lean-and-increase-production.jpg)