Embed Size (px)
Citation preview

United Nations International Expert Meeting on Crowdsource Mapping for Disaster Risk Management and Emergency Response Vienna, Austria, 03 – 05 December 2012
MAPPING THE SPATIO-TEMPORAL OCCURRENCES OF BUSHFIRE IN THE
CENTRE OF BENIN REPUBLIC
Joseph OLOUKOI
CENTRE OF BENIN REPUBLIC
Joseph OLOUKOI
Regional Centre For Training In Aerospace Surveys (RECTAS)Regional Centre For Training In Aerospace Surveys (RECTAS)Obafemi Awolowo University Campus, Ile-Ife, Nigeria,
[email protected] , [email protected]
1
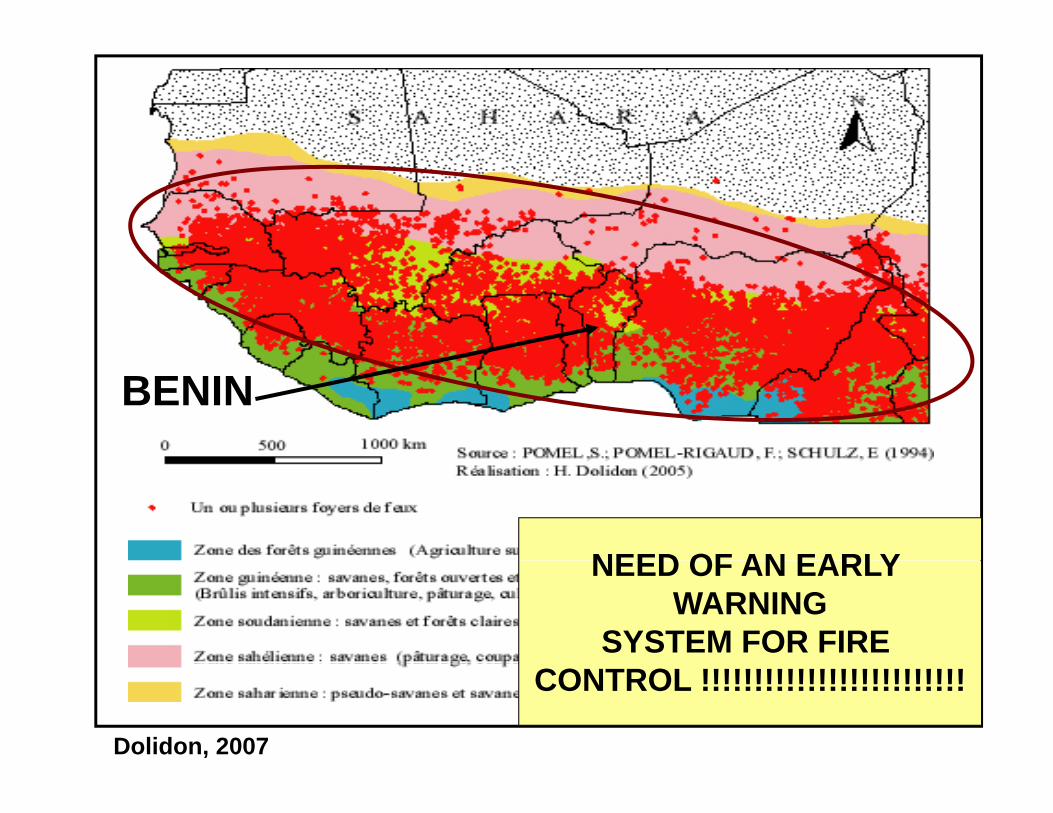
BENIN
NEED OF AN EARLYNEED OF AN EARLY WARNING
SYSTEM FOR FIRE
2
CONTROL !!!!!!!!!!!!!!!!!!!!!!!!!
Dolidon, 2007

Bush fire situation in Benin• Burning is a cultural tradition,
which is not easy toovercome.overcome.
• Fires serve for land clearingfor agricultural purposes,pasture management forpasture management forbreeding, and animaltracking for hunters.
• 95% of wildfires in forestland3
95% of wildfires in forestlandare human-caused.

Bush fire situation in Benin (cont)
• Habitual period for lighting fires:November and May.
• The majority of damaging fires areobserved from January onwards,y ,due to– High temperatures (30 to 35
°C)C)– Influence of Harmattan winds
flowing from North to Southbetween December andbetween December andMarch.
4

FIRE DAMAGES IN THE CENTRE OF BENINBENIN
• 30 to100 ha of plantations are devastated• 30 to100 ha of plantations are devastatedby fire per district every year
• Cost of damages: 1 800 000 à 6 000 000FCFA every year (Alimi, 2010).y y ( , )
5

Purpose
Map the spatio-temporal variability of vegetation fires in the Central part Benin
and provide adequate information for decision makers
6

STUDY AREA
7

DATA AND METHODS
• Data– MODIS (Moderate Resolution Imaging
Spectroradiometer) hotspots acquired fromNovember 2000 to December 2010
– Landsat ETM+ (Enhance Thematic Mapper) of2000 and NigeriaSat1 of November 2006.
8

Hotspots data processing and trend analysistrend analysis
• Analysis of the spatial distribution of hotspotslocating and presenting area of dense or lessg p gdense fire occurrences using Kriging techniques.
• Logarithmic trend of the evolution of fire hotspots toclearly show years where the frequency fireoccurrences was highoccurrences was high
• Augmented Dickey Fuller Test to appreciate the• Augmented Dickey Fuller Test to appreciate thestability in time and the existence of a trend invegetation burning using STATA statistical
9
software.

Results and Analyses
10

4500
Temporal occurrence of vegetation fires
y = 84.848Ln(x) + 249.323500
4000
4500
ux
The logarithmic trend shows a quiet increase of the hotspots
with a progression inR2 = 0.0097
2500
3000
poin
ts d
e fe
with a progression in serrated way
1000
1500
2000
Nom
bre
de
0
500
1000
ov ec an ev ars ril ai in let
ut pt ct ov ec an ev ars ril ai in let
ut pt ct ov ec an ev ars ril ai in let
ut pt ct ov ec an ev ars ril ai in let
ut pt ct ov ec an ev ars ril ai in let
ut pt ct ov ec an ev ars ril ai in let
ut pt ct ov ec an ev ars ril ai in let
ut pt ct ov ec an ev ars ril ai in let
ut pt ct ov ec an ev ars ril ai in let
ut pt ct ov ec an ev ars ril ai in let
ut pt ct ov ec
No D J F e Ma
Avr M Ju
Juil
lA
o Se O No D J Fe Ma
Avr M Ju
Juil
lA
o Se O No D J F e Ma
Avr M Ju
Juil
lA
o Se O No D J Fe Ma
Avr M Ju
Juil
lA
o Se O No D J F e Ma
Avr M Ju
Juil
lA
o Se O No D J Fe Ma
Avr M Ju
Juil
lA
o Se O No D J F e Ma
Avr M Ju
Juil
lA
o Se O No D J F e Ma
Avr M Ju
Juil
lA
o Se O No D J Fe Ma
Avr M Ju
Juil
lA
o Se O No D J F e Ma
Avr M Ju
Juil
lA
o Se O No D
2000 2001 2002 2003 2004 2005 2006 2007 2008 2009 2010
Années
Years 2002, 2003, 2004, 2005, 2007, 2008 and 2009 recorded a high
11
, , , , , gnumber of fires largely above the annual average estimated at 4411
hotspots. The highest number was observed in December 2002

Temporal occurrence of vegetation fires (C t’)(Cont’)
• According to the monthly and decennialAccording to the monthly and decennialvariations showcased, fires are intensified inJanuary and DecemberJanuary and December.
Thi i id th t fi ti iti• This is an evidence that fire activities arerelated to the dry season which extends fromN b t M h i th t f B iNovember to March in the centre of Benin.
12

Trend of vegetation fires: ADF Test• The augmented Dicker Fuller test shows that fires are not
stationary in time.C l l t d Z(t) l ( 6 309) if it i ti f th• Calculated Z(t) value (-6,309): no uniformity in time, of thefire activities.
Augmented Dickey-Fuller test for unit root Number of obs = 112
Z(t) -6.309 -4.036 -3.448 -3.148 Statistic Value Value Value Test 1% Critical 5% Critical 10% Critical Interpolated Dickey-Fuller
ug e ted c ey u e test o u t oot u be o obs
D.freq Coef. Std. Err. t P>|t| [95% Conf. Interval]
MacKinnon approximate p-value for Z(t) = 0.0000
_cons 206.7966 134.4577 1.54 0.127 -59.75016 473.3434 _trend 1.343444 1.973266 0.68 0.497 -2.568327 5.255214 L2D. .0545981 .0965349 0.57 0.573 -.136771 .2459673 LD. .31472 .1014908 3.10 0.002 .1135263 .5159137 L1. -.758569 .1202422 -6.31 0.000 -.9969351 -.5202029 freq
13
The test of the existence of trend shows an increase in fire activities in a nonsignificant way (t=0.68, which is lower than 1), confirming the quiet logarithmictrend observed

9˚00’
7˚ 30’
2000 – 2001 2002 2003 20041˚38’7 30
2˚46’ 1˚38’ 2˚46’ 1˚38’ 2˚46’ 1˚38’ 2˚46’
9˚00’
2005 2006 2008
2007 1˚38’ 2˚46’ 1˚38’ 2˚46’ 1˚38’ 2˚46’ 1˚38’ 2˚46’
7˚ 30’
9˚00’N
Zone de forte densité de feu
Bassila district: most affected14
2009 2010 7˚ 30’
1˚38’ 2˚46’ 1˚38’ 2˚46’ Analysis of the spatial density of fire
Bassila district: most affected area where fires always occur.

9˚N -1˚38’E 2˚46’E 2˚46’E1˚38’E
7˚30’N-
9˚N -
157˚30’N-
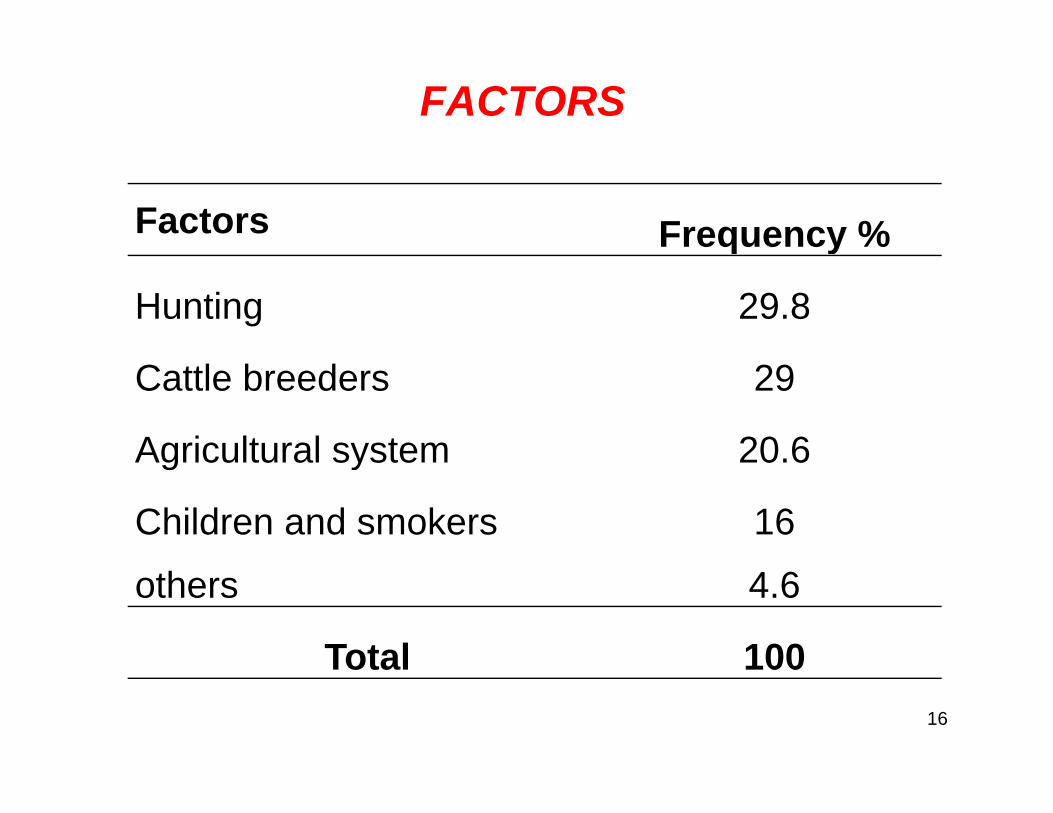
FACTORS
Factors Frequency %q y
Hunting 29.8
Cattle breeders 29
Agricultural system 20 6Agricultural system 20.6
Children and smokers 16
others 4.6
Total 10016
Total 100

ACTORS TO CONSIDER FOR SENSITIZATIONSENSITIZATION
HUNTERS• HUNTERS
• FARMERS
• PASTORALISTS
• CHILDREN AND SMOKERS
17
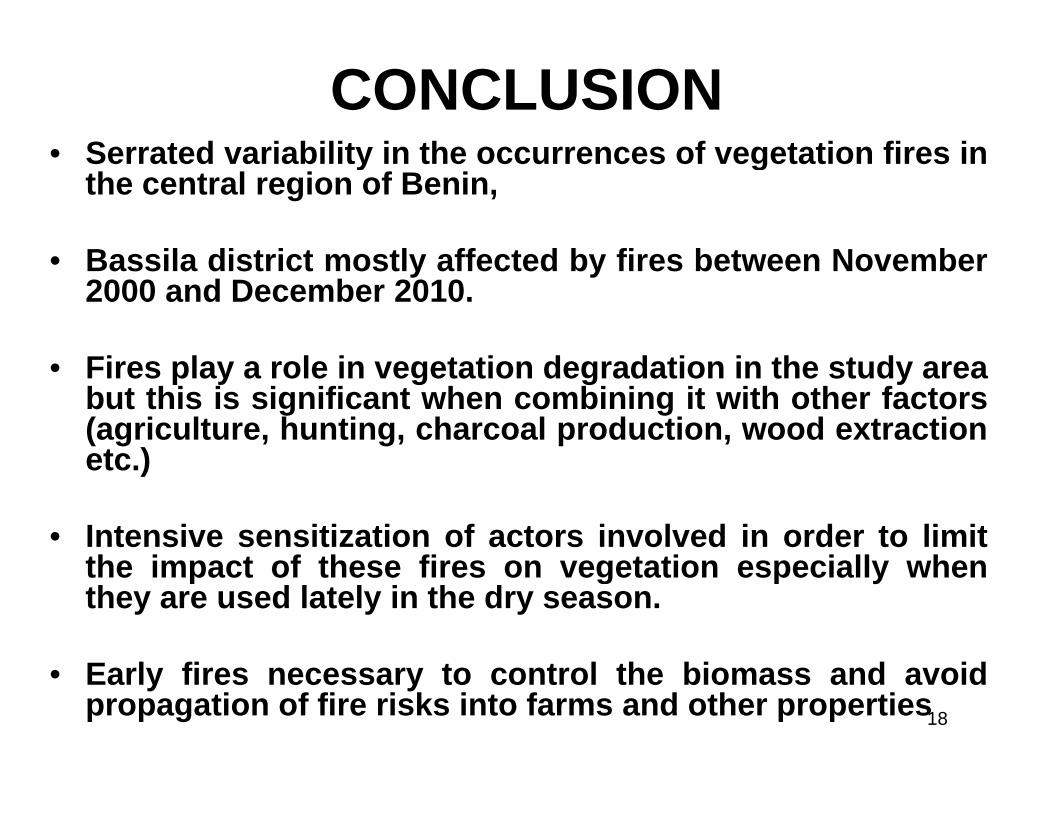
CONCLUSION• Serrated variability in the occurrences of vegetation fires in• Serrated variability in the occurrences of vegetation fires in
the central region of Benin,
B il di t i t tl ff t d b fi b t N b• Bassila district mostly affected by fires between November2000 and December 2010.
Fi l l i i d d i i h d• Fires play a role in vegetation degradation in the study areabut this is significant when combining it with other factors(agriculture, hunting, charcoal production, wood extractionetc )etc.)
• Intensive sensitization of actors involved in order to limitthe impact of these fires on egetation especiall henthe impact of these fires on vegetation especially whenthey are used lately in the dry season.
E l fi t t l th bi d id18
• Early fires necessary to control the biomass and avoidpropagation of fire risks into farms and other properties