Embed Size (px)
Citation preview

Chapter 6 Storage and Other I/O Topics
2 Rechnerstrukturen 182.092 6 — Storage & I/O
Introduction I/O devices can be characterized by
Behaviour: input, output, storage Partner: human or machine Data rate: bytes/sec, transfers/sec
I/O bus connections
§6.1 Introduction

3
I/O System Characteristics Dependability is important
Particularly for storage devices Performance measures
Latency (response time) Throughput (bandwidth) Desktops & embedded systems
Mainly interested in response time & diversity of devices
Servers Mainly interested in throughput & expandability of
devices
Rechnerstrukturen 182.092 6 — Storage & I/O

4
Dependability Measures Reliability: mean time to failure (MTTF) Service interruption: mean time to repair (MTTR) Mean time between failures
MTBF = MTTF + MTTR Availability = MTTF / (MTTF + MTTR) Improving Availability
Increase MTTF: fault avoidance, fault tolerance, fault forecasting
Reduce MTTR: improved tools and processes for diagnosis and repair
Rechnerstrukturen 182.092 6 — Storage & I/O

5
Disk Storage Nonvolatile, rotating magnetic storage
§6.3 Disk S
torage
Rechnerstrukturen 182.092 6 — Storage & I/O
6
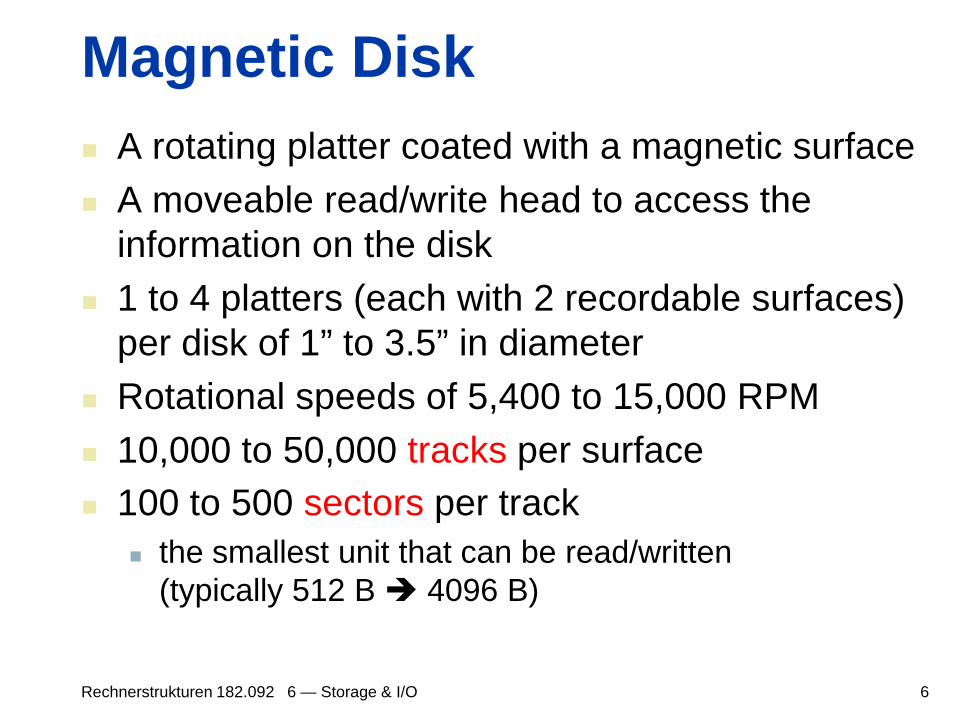
Magnetic Disk A rotating platter coated with a magnetic surface A moveable read/write head to access the
information on the disk 1 to 4 platters (each with 2 recordable surfaces)
per disk of 1” to 3.5” in diameter Rotational speeds of 5,400 to 15,000 RPM 10,000 to 50,000 tracks per surface 100 to 500 sectors per track
the smallest unit that can be read/written (typically 512 B 4096 B)
Rechnerstrukturen 182.092 6 — Storage & I/O

7
Disk Sectors and Access Each sector records
Sector ID Data (512 bytes, 4096 bytes proposed) Error correcting code (ECC)
Used to hide defects and recording errors Synchronization fields and gaps
Access to a sector involves Queuing delay if other accesses are pending Seek: move the heads Rotational latency Data transfer Controller overhead
Rechnerstrukturen 182.092 6 — Storage & I/O

8
Magnetic Disk Characteristic 1. Seek time: position the head over the proper track
(3 to 13 ms avg.) 2. Rotational latency: wait for the desired sector to rotate
under the head (½ of 1/RPM converted to ms) 0.5/5400 RPM = 5.6ms to 0.5/15000 RPM = 2.0ms
3. Transfer time: transfer a block of bits (one or more sectors) under the head to the disk controller’s cache (70 to 125 MB/s are typical disk transfer rates in 2008)
4. cache transfer rates are much faster (e.g., 375 MB/s)) 5. Controller time: the overhead the disk controller imposes
in performing a disk I/O access (typically < 0.2 ms)
Rechnerstrukturen 182.092 6 — Storage & I/O

9
Disk Access Example Given
512B sector, 15,000rpm, 4ms average seek time, 100MB/s transfer rate, 0.2ms controller overhead, idle disk
Average read time 4ms seek time
+ ½ / (15,000/60) = 2 ms rotational latency + 512 / 100 MB/s = 0.005 ms transfer time + 0.2 ms controller delay = 6.2 ms
If actual average seek time is 1 ms Average read time = 3.2 ms
Rechnerstrukturen 182.092 6 — Storage & I/O
10
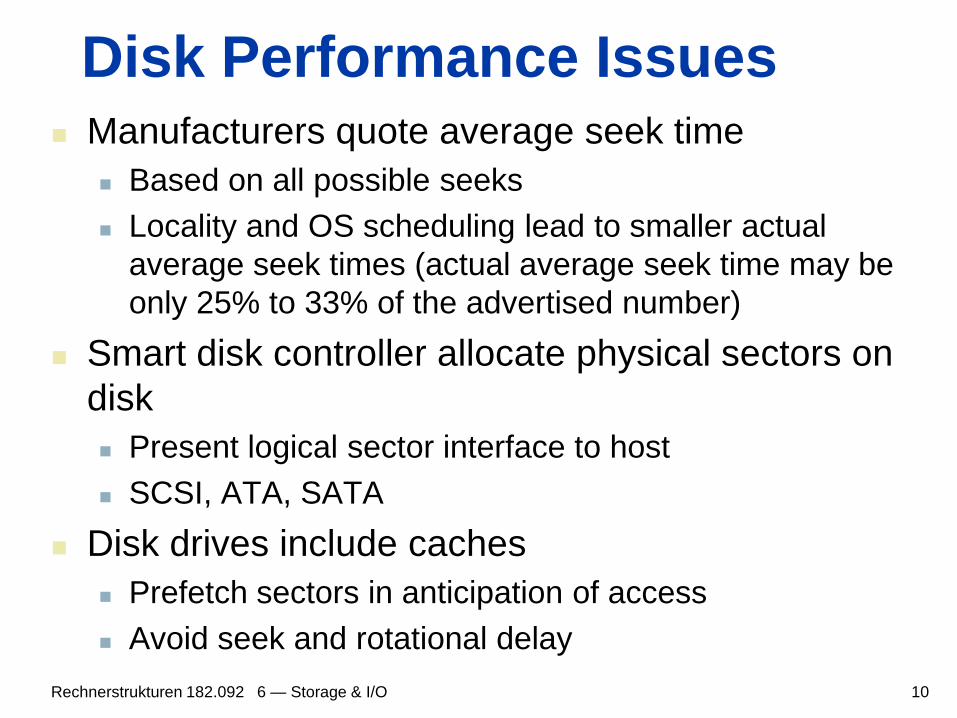
Disk Performance Issues Manufacturers quote average seek time
Based on all possible seeks Locality and OS scheduling lead to smaller actual
average seek times (actual average seek time may be only 25% to 33% of the advertised number)
Smart disk controller allocate physical sectors on disk Present logical sector interface to host SCSI, ATA, SATA
Disk drives include caches Prefetch sectors in anticipation of access Avoid seek and rotational delay
Rechnerstrukturen 182.092 6 — Storage & I/O

11
Flash Storage Nonvolatile semiconductor storage
100× – 1000× faster than disk Smaller, lower power, more robust But more $/GB (between disk and DRAM)
§6.4 Flash Storage
Rechnerstrukturen 182.092 6 — Storage & I/O

12
Flash Types NOR flash: bit cell like a NOR gate
Random read/write access Used for instruction memory in embedded systems
NAND flash: bit cell like a NAND gate Denser (bits/area), but block-at-a-time access Cheaper per GB Used for USB keys, media storage, …
Flash bits wears out after 1000’s of accesses Not suitable for direct RAM or disk replacement Wear leveling: remap data to less used blocks
Rechnerstrukturen 182.092 6 — Storage & I/O

13
Interconnecting Components Need interconnections between
CPU, memory, I/O controllers Bus: shared communication channel
Parallel set of wires for data and synchronization of data transfer
Can become a bottleneck Performance limited by physical factors
Wire length, number of connections More recent alternative: high-speed serial
connections with switches Like networks
§6.5 Connecting P
rocessors, Mem
ory, and I/O D
evices
Rechnerstrukturen 182.092 6 — Storage & I/O

14
Bus Types Processor-Memory buses
Short, high speed Design is matched to memory organization
I/O buses Longer, allowing multiple connections Specified by standards for interoperability Connect to processor-memory bus through a
bridge
Rechnerstrukturen 182.092 6 — Storage & I/O

15
Bus Signals and Synchronization Data lines
Carry address and data Multiplexed or separate
Control lines Indicate data type, synchronize transactions
Synchronous Uses a bus clock
Asynchronous Uses request/acknowledge control lines for
handshaking
Rechnerstrukturen 182.092 6 — Storage & I/O
16
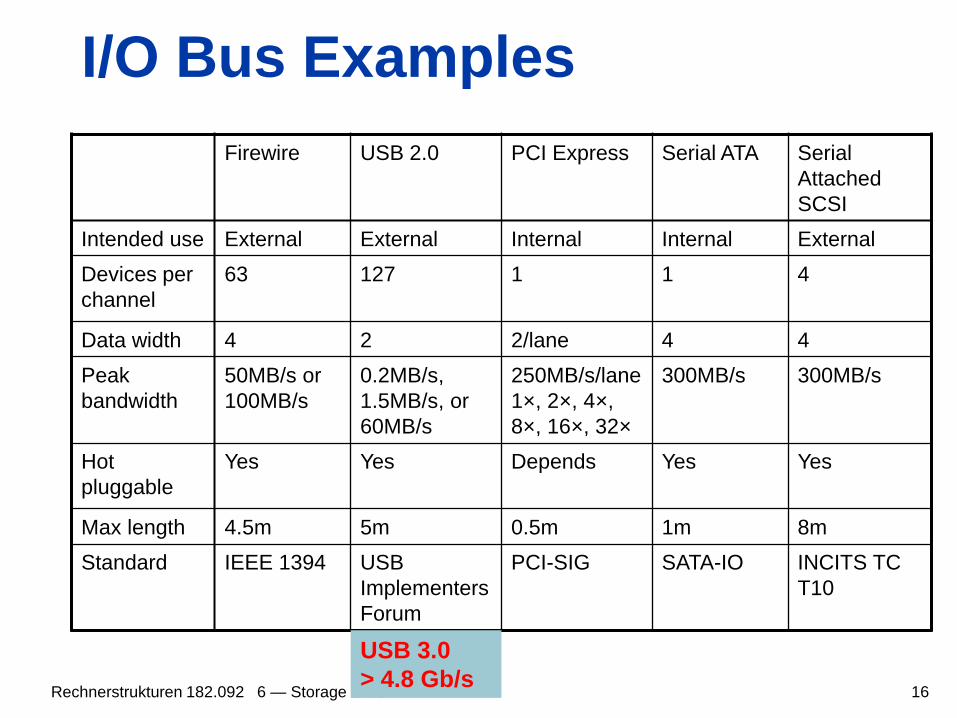
I/O Bus Examples Firewire USB 2.0 PCI Express Serial ATA Serial
Attached SCSI
Intended use External External Internal Internal External Devices per channel
63 127 1 1 4
Data width 4 2 2/lane 4 4 Peak bandwidth
50MB/s or 100MB/s
0.2MB/s, 1.5MB/s, or 60MB/s
250MB/s/lane 1×, 2×, 4×, 8×, 16×, 32×
300MB/s 300MB/s
Hot pluggable
Yes Yes Depends Yes Yes
Max length 4.5m 5m 0.5m 1m 8m Standard IEEE 1394 USB
Implementers Forum
PCI-SIG SATA-IO INCITS TC T10
Rechnerstrukturen 182.092 6 — Storage & I/O
USB 3.0 > 4.8 Gb/s

17
Typical x86 PC I/O System
Rechnerstrukturen 182.092 6 — Storage & I/O

18
I/O Management I/O is mediated by the OS
Multiple programs share I/O resources Need protection and scheduling
I/O causes asynchronous interrupts Same mechanism as exceptions
I/O programming is fiddly OS provides abstractions to programs
§6.6 Interfacing I/O D
evices …
Rechnerstrukturen 182.092 6 — Storage & I/O

19
I/O Commands I/O devices are managed by I/O controller
hardware Transfers data to/from device Synchronizes operations with software
Command registers Cause device to do something
Status registers Indicate what the device is doing and occurrence of
errors Data registers
Write: transfer data to a device Read: transfer data from a device
Rechnerstrukturen 182.092 6 — Storage & I/O

20
I/O Register Mapping Memory mapped I/O
Registers are addressed in same space as memory
Address decoder distinguishes between them OS uses address translation mechanism to
make them only accessible to kernel I/O instructions
Separate instructions to access I/O registers Can only be executed in kernel mode Example: x86
Rechnerstrukturen 182.092 6 — Storage & I/O

21
Polling Periodically check I/O status register
If device ready, do operation If error, take action
Common in small or low-performance real-time embedded systems Predictable timing Low hardware cost
In other systems, wastes CPU time
Rechnerstrukturen 182.092 6 — Storage & I/O

22
Interrupts When a device is ready or error occurs
Controller interrupts CPU Interrupt is like an exception
But not synchronized to instruction execution Can invoke handler between instructions Cause information often identifies the
interrupting device Priority interrupts
Devices needing more urgent attention get higher priority
Can interrupt handler for a lower priority interrupt
Rechnerstrukturen 182.092 6 — Storage & I/O

23
I/O Data Transfer Polling and interrupt-driven I/O
CPU transfers data between memory and I/O data registers
Time consuming for high-speed devices Direct memory access (DMA)
OS provides starting address in memory I/O controller transfers to/from memory
autonomously Controller interrupts on completion or error
Rechnerstrukturen 182.092 6 — Storage & I/O
24
DMA/Cache Interaction If DMA writes to a memory block that is cached
Cached copy becomes stale If write-back cache has dirty block, and DMA
reads memory block Reads stale data
Need to ensure cache coherence Flush blocks from cache if they will be used for DMA Or use non-cacheable memory locations for I/O
Rechnerstrukturen 182.092 6 — Storage & I/O

25
DMA/VM Interaction OS uses virtual addresses for memory
DMA blocks may not be contiguous in physical memory
Should DMA use virtual addresses? Would require controller to do translation
If DMA uses physical addresses May need to break transfers into page-sized
chunks Or chain multiple transfers Or allocate contiguous physical pages for
DMA Rechnerstrukturen 182.092 6 — Storage & I/O

26
Measuring I/O Performance I/O performance depends on
Hardware: CPU, memory, controllers, buses Software: operating system, database
management system, application Workload: request rates and patterns
I/O system design can trade-off between response time and throughput Measurements of throughput often done with
constrained response-time
§6.7 I/O P
erformance M
easures: …
Rechnerstrukturen 182.092 6 — Storage & I/O
27
File System & Web Benchmarks SPEC System File System (SFS)
Synthetic workload for NFS server, based on monitoring real systems
Results Throughput (operations/sec) Response time (average ms/operation)
SPEC Web Server benchmark Measures simultaneous user sessions,
subject to required throughput/session Three workloads: Banking, Ecommerce, and
Support
Rechnerstrukturen 182.092 6 — Storage & I/O

28
I/O vs. CPU Performance Amdahl’s Law
Don’t neglect I/O performance as parallelism increases compute performance
Example Benchmark takes 90s CPU time, 10s I/O time Double the number of CPUs/2 years
I/O unchanged
Year CPU time I/O time Elapsed time % I/O time now 90s 10s 100s 10% +2 45s 10s 55s 18% +4 23s 10s 33s 31% +6 11s 10s 21s 47%
§6.9 Parallelism
and I/O: R
AID
Rechnerstrukturen 182.092 6 — Storage & I/O

29
RAID Redundant Array of Inexpensive
(Independent) Disks Use multiple smaller disks (c.f. one large disk) Parallelism improves performance Plus extra disk(s) for redundant data storage
Provides fault tolerant storage system Especially if failed disks can be “hot swapped”
RAID 0 No redundancy
Just stripe data over multiple disks But it does improve performance
Rechnerstrukturen 182.092 6 — Storage & I/O

30
RAID 1 & 2 RAID 1: Mirroring
N + N disks, replicate data Write data to both data disk and mirror disk On disk failure, read from mirror
RAID 2: Error correcting code (ECC) N + E disks (e.g., 10 + 4) Split data at bit level across N disks Generate E-bit ECC Too complex, not used in practice
Rechnerstrukturen 182.092 6 — Storage & I/O

31
RAID 3: Bit-Interleaved Parity N + 1 disks
Data striped across N disks at byte level Redundant disk stores parity Read access
Read all disks Write access
Generate new parity and update all disks On failure
Use parity to reconstruct missing data
Not widely used Rechnerstrukturen 182.092 6 — Storage & I/O

32 Rechnerstrukturen 182.092 6 — Storage & I/O
sec1,b0 sec1,b2 sec1,b1 sec1,b3
1 0 0 1 (odd)
bit parity disk ⊕
sec1,b0 sec1,b2 sec1,b1 sec1,b3
1 0 0 1 (odd)
bit parity disk disk fails
1
⊕
33
RAID 4: Block-Interleaved Parity N + 1 disks
Data striped across N disks at block level Redundant disk stores parity for a group of blocks Read access
Read only the disk holding the required block
Write access Just read disk containing modified block, and parity disk Calculate new parity, update data disk and parity disk
On failure Use parity to reconstruct missing data
Not widely used
Rechnerstrukturen 182.092 6 — Storage & I/O

34
RAID 3 vs RAID 4
Rechnerstrukturen 182.092 6 — Storage & I/O
3 reads and 2 writes
involving all the disks
2 reads and 2 writes
involving just two disks

35
RAID 5: Distributed Parity N + 1 disks
Like RAID 4, but parity blocks distributed across disks Avoids parity disk being a bottleneck
Widely used
Rechnerstrukturen 182.092 6 — Storage & I/O
36
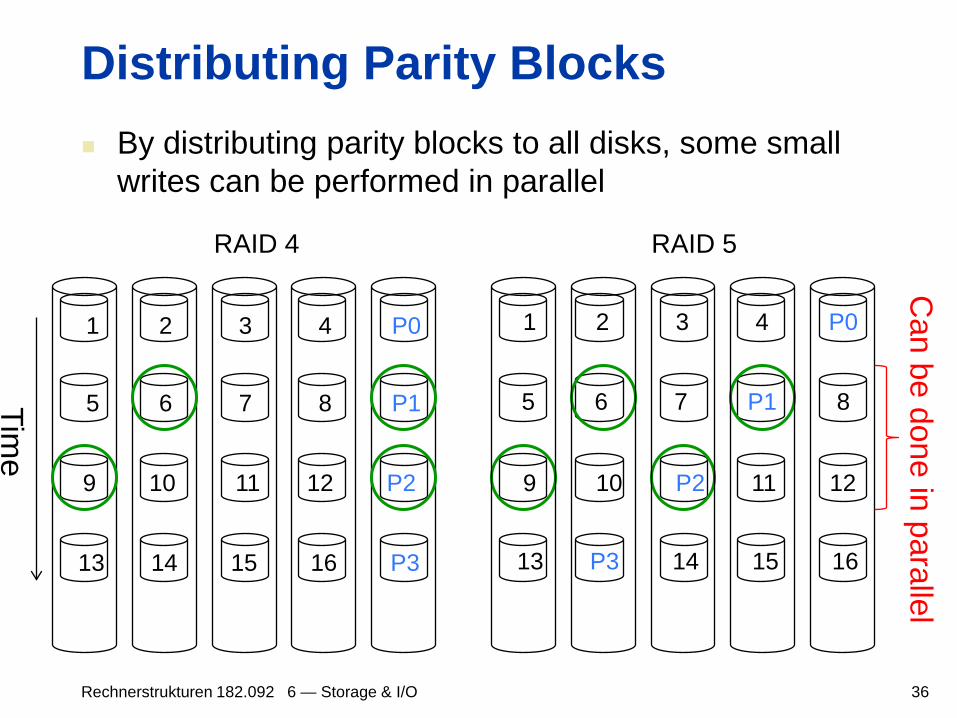
Distributing Parity Blocks By distributing parity blocks to all disks, some small
writes can be performed in parallel
Rechnerstrukturen 182.092 6 — Storage & I/O
1 2 3 4 P0
5 6 7 8 P1
9 10 11 12 P2
13 14 15 16 P3
RAID 4 RAID 5
1 2 3 4 P0
5 6 7 P1 8
9 10 P2 11 12
13 P3 14 15 16
Time
Can be done in parallel

37
RAID 6: P + Q Redundancy N + 2 disks
Like RAID 5, but two lots of parity Greater fault tolerance through more
redundancy Multiple RAID
More advanced systems give similar fault tolerance with better performance
Rechnerstrukturen 182.092 6 — Storage & I/O

38
RAID Summary RAID can improve performance and
availability High availability requires hot swapping
Assumes independent disk failures Too bad if the building burns down!
See “Hard Disk Performance, Quality and Reliability” http://www.pcguide.com/ref/hdd/perf/index.htm
Rechnerstrukturen 182.092 6 — Storage & I/O

39
I/O System Design Satisfying latency requirements
For time-critical operations If system is unloaded
Add up latency of components
Maximizing throughput Find “weakest link” (lowest-bandwidth component) Configure to operate at its maximum bandwidth Balance remaining components in the system
If system is loaded, simple analysis is insufficient Need to use queuing models or simulation
§6.8 Designing and I/O
System
Rechnerstrukturen 182.092 6 — Storage & I/O

40
Server Computers Applications are increasingly run on
servers Web search, office apps, virtual worlds, …
Requires large data center servers Multiple processors, networks connections,
massive storage Space and power constraints
Server equipment built for 19” racks Multiples of 1.75” (1U) high
§6.10 Real S
tuff: Sun Fire x4150 S
erver
Rechnerstrukturen 182.092 6 — Storage & I/O

41
Rack-Mounted Servers Sun Fire x4150 1U server
Rechnerstrukturen 182.092 6 — Storage & I/O

42
Sun Fire x4150 1U server
4 cores each
16 x 4GB = 64GB DRAM
Rechnerstrukturen 182.092 6 — Storage & I/O

43
I/O System Design Example Given a Sun Fire x4150 system with
Workload: 64KB disk reads Each I/O op requires 200,000 user-code instructions and
100,000 OS instructions Each CPU: 109 instructions/sec FSB: 10.6 GB/sec peak DRAM DDR2 667MHz: 5.336 GB/sec PCI-E 8× bus: 8 × 250MB/sec = 2GB/sec Disks: 15,000 rpm, 2.9ms avg. seek time, 112MB/sec
transfer rate What I/O rate can be sustained?
For random reads, and for sequential reads
Rechnerstrukturen 182.092 6 — Storage & I/O
44
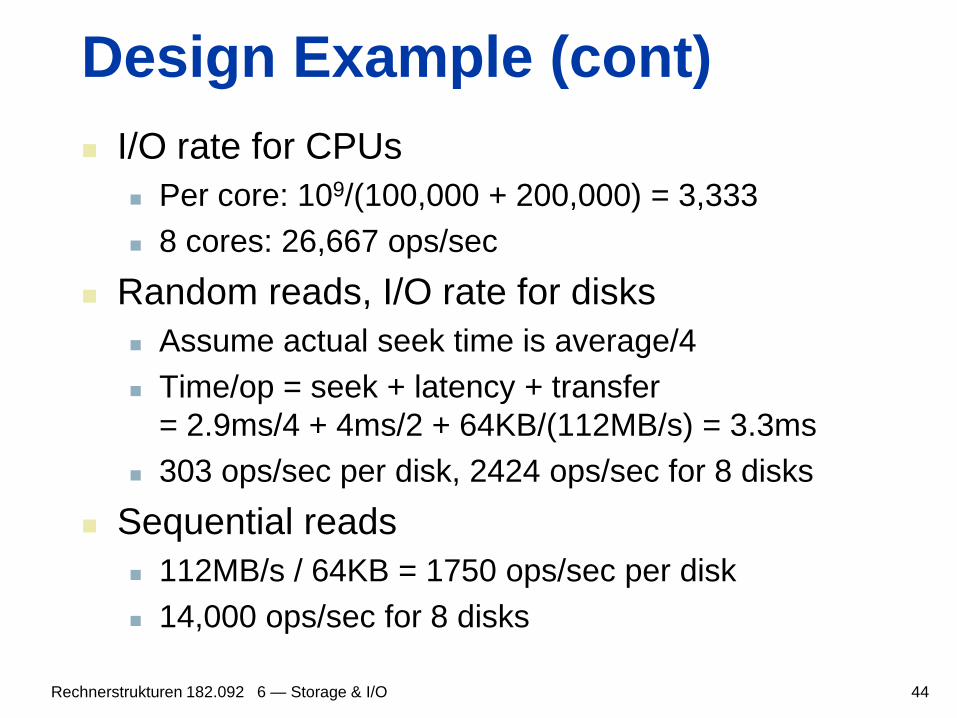
Design Example (cont) I/O rate for CPUs
Per core: 109/(100,000 + 200,000) = 3,333 8 cores: 26,667 ops/sec
Random reads, I/O rate for disks Assume actual seek time is average/4 Time/op = seek + latency + transfer
= 2.9ms/4 + 4ms/2 + 64KB/(112MB/s) = 3.3ms 303 ops/sec per disk, 2424 ops/sec for 8 disks
Sequential reads 112MB/s / 64KB = 1750 ops/sec per disk 14,000 ops/sec for 8 disks
Rechnerstrukturen 182.092 6 — Storage & I/O
45
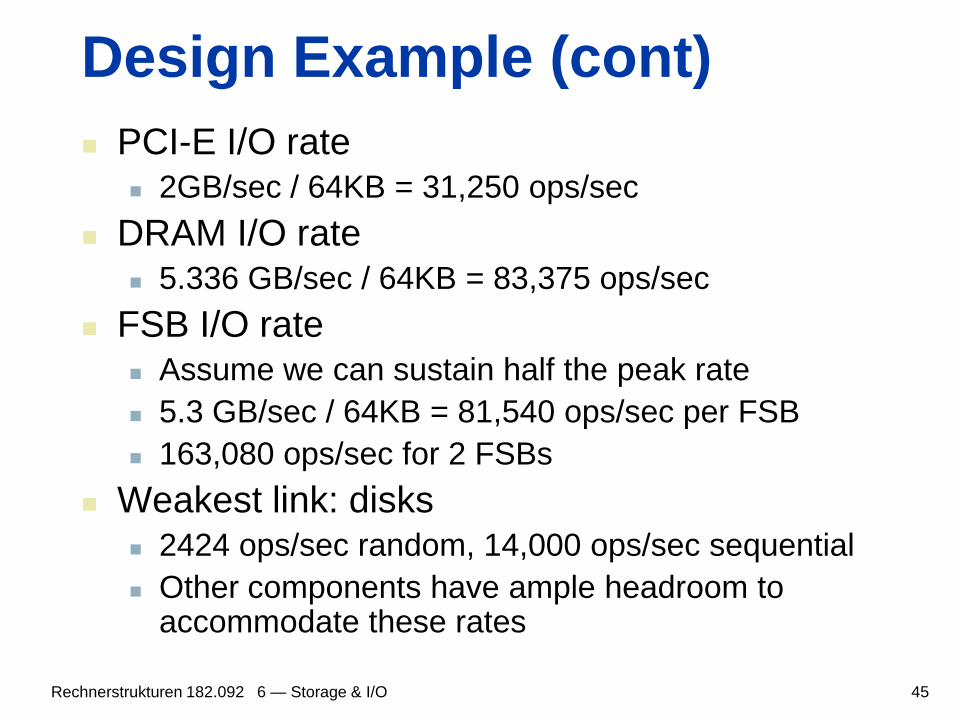
Design Example (cont) PCI-E I/O rate
2GB/sec / 64KB = 31,250 ops/sec DRAM I/O rate
5.336 GB/sec / 64KB = 83,375 ops/sec FSB I/O rate
Assume we can sustain half the peak rate 5.3 GB/sec / 64KB = 81,540 ops/sec per FSB 163,080 ops/sec for 2 FSBs
Weakest link: disks 2424 ops/sec random, 14,000 ops/sec sequential Other components have ample headroom to
accommodate these rates
Rechnerstrukturen 182.092 6 — Storage & I/O

46
Fallacy: Disk Dependability If a disk manufacturer quotes MTTF as
1,200,000hr (140yr) A disk will work that long
Wrong: this is the mean time to failure What is the distribution of failures? What if you have 1000 disks
How many will fail per year?
§6.12 Fallacies and Pitfalls
0.73%ehrs/failur 1200000
hrs/disk 8760disks 1000(AFR) Rate Failure Annual =×
=
Rechnerstrukturen 182.092 6 — Storage & I/O

47
Fallacies Disk failure rates are as specified
Studies of failure rates in the field Schroeder and Gibson: 2% to 4% vs. 0.6% to 0.8% Pinheiro, et al.: 1.7% (first year) to 8.6% (third year) vs. 1.5%
Why? A 1GB/s interconnect transfers 1GB in one sec
But what’s a GB? For bandwidth, use 1GB = 109 B For storage, use 1GB = 230 B = 1.075×10⁹ B So 1GB/sec is 0.93GB in one second
About 7% error
Rechnerstrukturen 182.092 6 — Storage & I/O
48
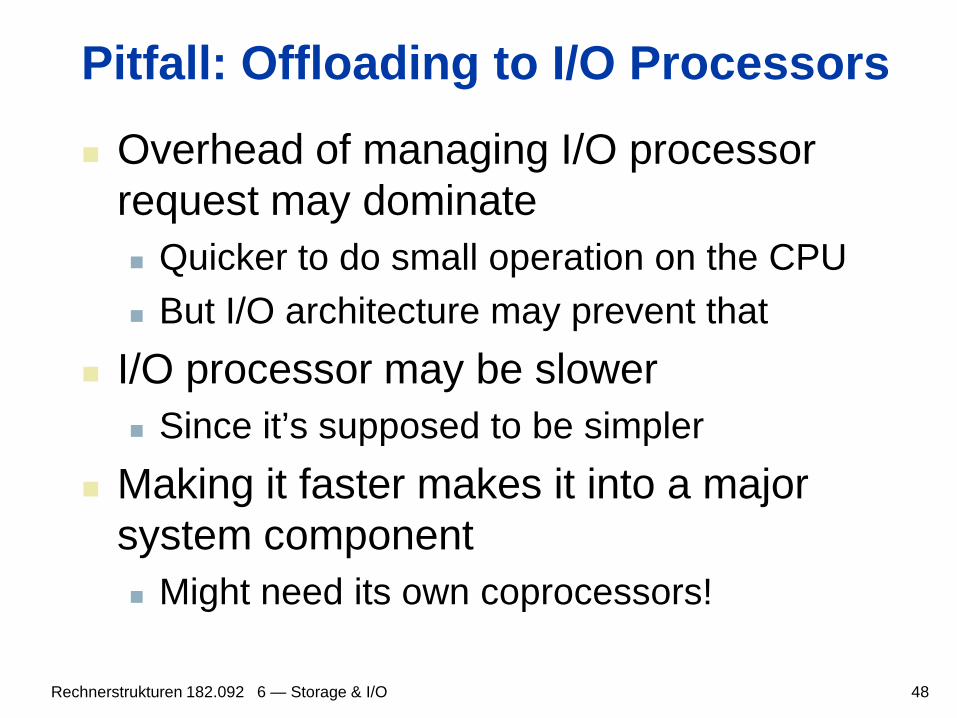
Pitfall: Offloading to I/O Processors
Overhead of managing I/O processor request may dominate Quicker to do small operation on the CPU But I/O architecture may prevent that
I/O processor may be slower Since it’s supposed to be simpler
Making it faster makes it into a major system component Might need its own coprocessors!
Rechnerstrukturen 182.092 6 — Storage & I/O
49
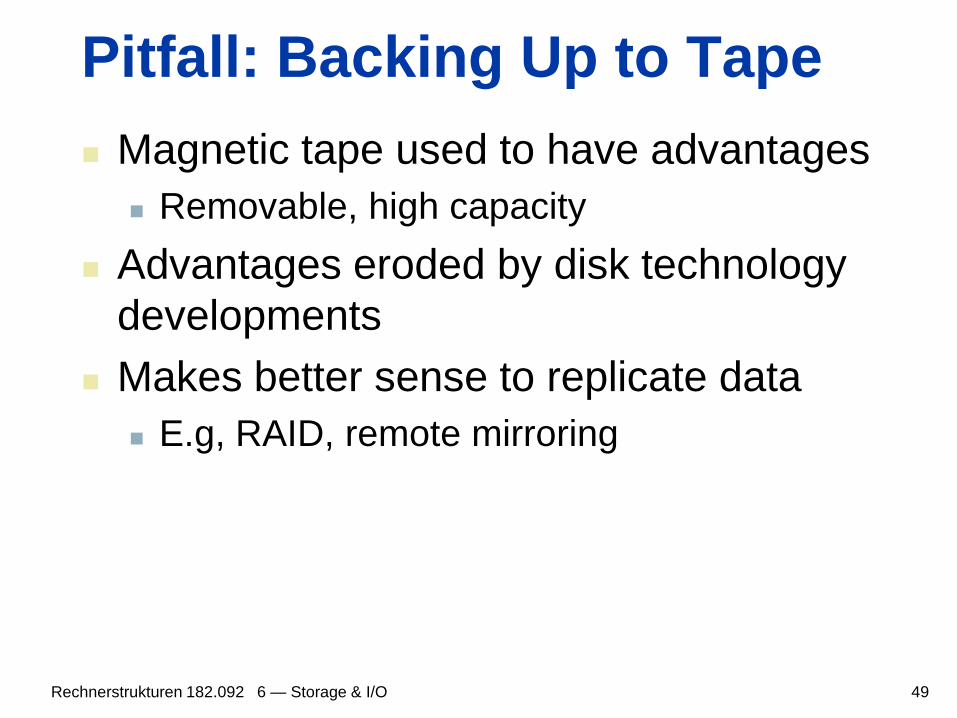
Pitfall: Backing Up to Tape Magnetic tape used to have advantages
Removable, high capacity Advantages eroded by disk technology
developments Makes better sense to replicate data
E.g, RAID, remote mirroring
Rechnerstrukturen 182.092 6 — Storage & I/O

50
Fallacy: Disk Scheduling Best to let the OS schedule disk accesses
But modern drives deal with logical block addresses Map to physical track, cylinder, sector locations Also, blocks are cached by the drive
OS is unaware of physical locations Reordering can reduce performance Depending on placement and caching
Rechnerstrukturen 182.092 6 — Storage & I/O

51
Pitfall: Peak Performance Peak I/O rates are nearly impossible to
achieve Usually, some other system component limits
performance E.g., transfers to memory over a bus
Collision with DRAM refresh Arbitration contention with other bus masters
E.g., PCI bus: peak bandwidth ~133 MB/sec In practice, max 80MB/sec sustainable
Rechnerstrukturen 182.092 6 — Storage & I/O

52
Concluding Remarks I/O performance measures
Throughput, response time Dependability and cost also important
Buses used to connect CPU, memory, I/O controllers Polling, interrupts, DMA
I/O benchmarks TPC, SPECSFS, SPECWeb
RAID Improves performance and dependability
§6.13 Concluding R
emarks
Rechnerstrukturen 182.092 6 — Storage & I/O