Embed Size (px)
Citation preview

6-1
6.0 Transit Technology Assessment 6.1 Introduction One of the first steps in the Southeast Corridor High Performance Transit Alternatives Study was to create a summary of the many different types of transit that could be used in the southeast corridor. This chapter provides a thorough listing of the various types of transit technology and their descriptions and operating characteristics. The intent of this chapter is to provide a general understanding of the various transit technologies, including some of the more recently developed technologies, and to provide a very broad overview of some of the costs associated with each technology. Transit technologies can be placed into several categories with each category serving different types of communities or providing different levels of service. For example, the local bus category is generally considered to be best suited for short distance travel in compact developments. Automated guideway transit (AGT), also called “people movers”, is best suited for short-distance travel in areas like airports that handle large numbers of people and require lots of walking. For medium and long distance travel, express buses, busways, light rail transit (LRT), and heavy rail can be solutions depending on the character of the corridor. For longer distances, commuter rail or high-speed rail may work best. Some of these technologies and applications will not be appropriate for providing efficient and convenient high performance transit throughout the southeast corridor. A potential transit system for the corridor should provide the capacity and flexibility required to connect activity centers, penetrate and serve the core of community centers, and circulate passengers to and from multiple urban cores. The technology must present a sense of permanence in order to encourage developers and local governments to invest in an efficient and sustainable growth pattern. The balance of this chapter examines the broad range of system technology categories, their general operating characteristics, and applications. Pedestrian and Transit Oriented Development Transit plays an important role in the types of development that can or will occur at existing and planned transit routes and stations. Transit-oriented development (TOD) is specifically designed to support both pedestrian and transit activities. Generally, it consists of moderate to highly compact development located within an easy walk of a major transit stop. TOD contains a mix of residential, employment and shopping opportunities designed primarily for use by pedestrians while still providing limited access by car. TOD is not just development located next to transit lines; it is development designed and constructed to facilitate and promote transit ridership through a number of specific design elements:
• Compact: moderate to highly compact development is constructed to ensure that a large number of people work, live and shop within a short walk of the transit line. Also, parking requirements are reduced or directed into multi-story parking structures.
• Mixed-use: development includes a variety of land uses (i.e., residential, commercial, retail, etc.) within easy walking distance of the transit line and of each other.
• Pedestrian-friendliness: all elements of the development are designed to promote active living, walking and transit use. This also includes details like the

6-2
orientation of buildings, the placement of doors, the design of landscaping, sidewalks and crosswalks, and the positioning and size of parking facilities. Although the development of many cities and suburbs up to the 1940’s was shaped, in part, by the existence of transit service, the term TOD is generally applied only to new development or redevelopment. With TOD development, the primary means of transportation is by walking. All of the retail shops, grocery stores, and homes are placed within a very short walk of each other. The result increases transit ridership and reduces people’s dependence on the automobile. This in turn improves air quality, saves tax dollars and improves the quality of life for everyone who uses the transportation system. A number of U.S. cities, most notably Portland, Oregon; San Diego and San Jose, California; and the communities served by the Hudson-Bergen Waterfront Line in northern New Jersey, have been the sites of a significant number of TODs. As an example of a city closer to Nashville, Atlanta’s MARTA has also begun to support TODs around its stations. The types of public policies needed to encourage TODs include:
• Changes to planning and zoning ordinances to allow mixed use, compact development, smaller land setbacks and lower parking requirements that require pedestrian improvements with access for transit.
• Funding for infrastructure improvements by local and state governments can require transit oriented-development policies and improvements through regulations. Some local programs have provided direct subsidies, preferred financing or tax abatements for TODs. Federal transportation funding, such as the Federal Transit Administration (FTA) Section 5309 New Starts program, supports the planning, design and construction of major fixed-guideway transit projects with a requirement of transit-oriented improvements to support new transit stations and services.
• Joint development of property owned by transit providers or governmental units can encourage the location of development near transit stations, help support that development and take advantage of the opportunity to shape the land-use development.
• Direct development of land around stations, by the transit provider or other governmental entity, has been employed in a few locations to provide an anchor around which other development can grow nearby.
6.2 Bus Transit Bus transit is the dominant mode of public transportation throughout the world. This mode is typified by large, multi-passenger, rubber-tired vehicles capable of operating in an exclusive or mixed traffic travel lane with other vehicles. Buses are typically powered by diesel engines, which have been proven effective and inexpensive to operate and maintain. In addition, over the past several years, the advancement of alternative fuels has resulted in more options for powering vehicles. There are also many vehicle models available, each with its own specific passenger capacities, travel speeds, style and level of comfort. Buses vary dramatically in terms of size and capacity, from small vans to large articulated vehicles 70 feet in length. Types of fuel and power sources include diesel-powered vehicles to experimental models using hydrogen fuels. Finally, amenities range from sturdy basic models to luxury motor coaches. Buses are usually operated according to fixed schedules and generally provide local (including shuttle services such as community bus and downtown shuttles), express
6-3
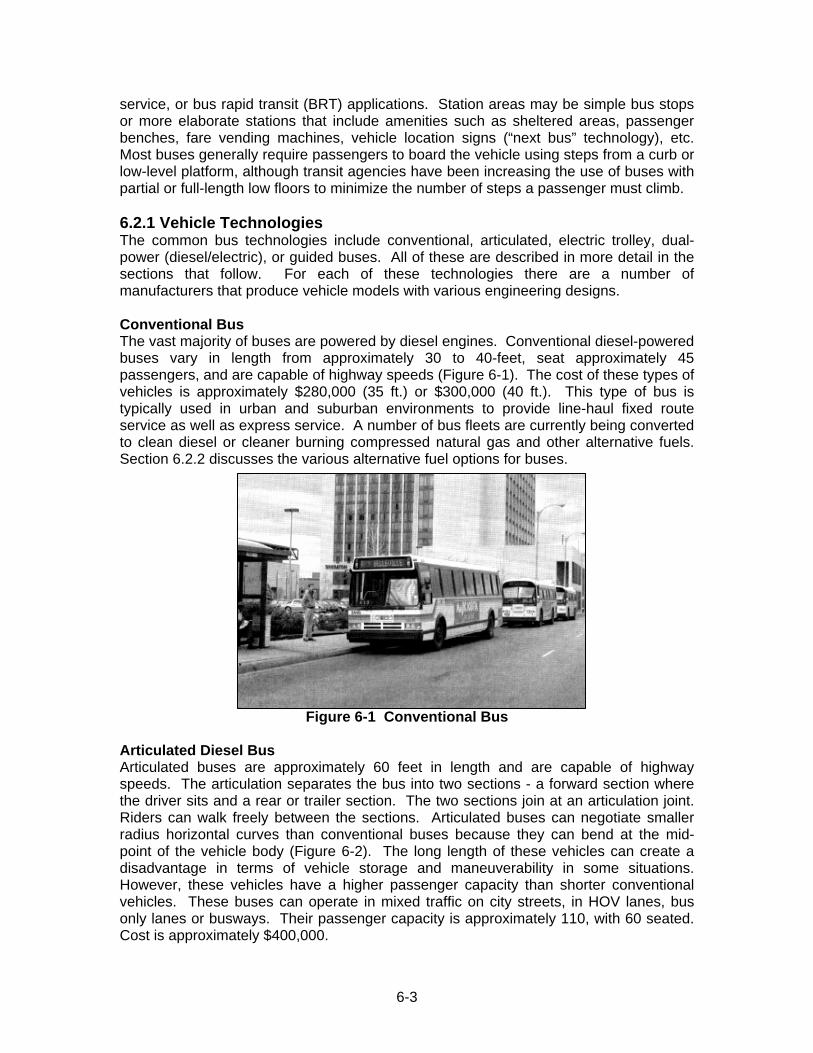
service, or bus rapid transit (BRT) applications. Station areas may be simple bus stops or more elaborate stations that include amenities such as sheltered areas, passenger benches, fare vending machines, vehicle location signs (“next bus” technology), etc. Most buses generally require passengers to board the vehicle using steps from a curb or low-level platform, although transit agencies have been increasing the use of buses with partial or full-length low floors to minimize the number of steps a passenger must climb. 6.2.1 Vehicle Technologies The common bus technologies include conventional, articulated, electric trolley, dual-power (diesel/electric), or guided buses. All of these are described in more detail in the sections that follow. For each of these technologies there are a number of manufacturers that produce vehicle models with various engineering designs. Conventional Bus The vast majority of buses are powered by diesel engines. Conventional diesel-powered buses vary in length from approximately 30 to 40-feet, seat approximately 45 passengers, and are capable of highway speeds (Figure 6-1). The cost of these types of vehicles is approximately $280,000 (35 ft.) or $300,000 (40 ft.). This type of bus is typically used in urban and suburban environments to provide line-haul fixed route service as well as express service. A number of bus fleets are currently being converted to clean diesel or cleaner burning compressed natural gas and other alternative fuels. Section 6.2.2 discusses the various alternative fuel options for buses.
Figure 6-1 Conventional Bus Articulated Diesel Bus Articulated buses are approximately 60 feet in length and are capable of highway speeds. The articulation separates the bus into two sections - a forward section where the driver sits and a rear or trailer section. The two sections join at an articulation joint. Riders can walk freely between the sections. Articulated buses can negotiate smaller radius horizontal curves than conventional buses because they can bend at the mid-point of the vehicle body (Figure 6-2). The long length of these vehicles can create a disadvantage in terms of vehicle storage and maneuverability in some situations. However, these vehicles have a higher passenger capacity than shorter conventional vehicles. These buses can operate in mixed traffic on city streets, in HOV lanes, bus only lanes or busways. Their passenger capacity is approximately 110, with 60 seated. Cost is approximately $400,000.

6-4
Figure 6-2 Articulated Diesel Bus Electric Trolley Bus Electric trolley buses are similar in passenger capacity to both conventional and articulated diesel powered buses, except that they are propelled by electric motors and obtain power from overhead wires along the route. They are available as either standard trolleys approximately 40-feet in length (Figure 6-3) or articulated trolleys approximately 60-feet in length. They are limited to approximately 40 miles per hour top speed. The trolley bus can be steered and does not need a guideway, although the reach of its trolley poles limits its movement. Some trolley buses are equipped with battery power to allow them to travel short distances when disconnected from the overhead wire. Trolley buses offer excellent traction and power at low speeds, making them very effective on steep grades. The electric propulsion option also allows these buses to operate inside tunnels without a build up of exhaust fumes. Trolley buses cost approximately twice as much as a diesel powered bus but have a longer useful life. Trolley buses are currently in operation in Boston, Seattle, San Francisco, Dayton, Ohio and Philadelphia.
Figure 6-3 E-800 Trolley Bus Dual-Power (Diesel/Electric Trolley) Bus Sometimes referred to as dual-mode buses, dual-power buses are similar to other buses in size and seating capacity. However, they differ in that they have both electric and diesel propulsion units. This dual-power feature enables them to operate as an electric trolley bus along sections with overhead power distribution wires and as a conventional diesel bus on other streets. Dual-power bus performance is similar to a diesel-powered bus when operating under diesel power and similar to a trolley bus when operating under electric power. Dual-power buses have been developed in both standard and articulated vehicles. Dual-power buses are currently in use in the Seattle bus tunnel (Figure 6-4).

6-5
Figure 6-4 Dual Mode Bus, Seattle, Washington 6.2.2 Alternative Fuels Bus technologies that are powered by alternative fuels such as clean diesel, natural gas, battery and electric power have been a popular trend for transit agencies worldwide. Additional technologies include hydrogen fuel cell technology, which is not yet available but is under development and testing. The first operational hydrogen fuel-cell bus was delivered to Madrid, Spain, in the summer of 2003. One goal of the Madrid test project was to demonstrate an effective and emission-free public transportation system, as well as prove the reliability of the hydrogen fuel technology. Many of these alternative fuels are compatible with the various types of common bus applications such as local bus, shuttle, express, and BRT. Clean Diesel and Biodiesel Clean diesel technology is a recently developed form of a standard diesel internal combustion engine. Clean diesel uses a number of new technological innovations to adapt the traditional diesel engine to reduce the volume of pollutants, especially particulate matter that a bus produces in operation. Clean diesel technology is mainly based on existing diesel technology. As such it does not require a special fuel or fueling facility, and engines closely resemble traditional diesel engines, reducing the need for retrained mechanics. Clean diesel is a relatively new technology and has yet to be proven to perform reliably over a long period. In addition, buses equipped with clean diesel technology are generally more costly to purchase and maintain than standard diesel buses. Biodiesel is another type of clean burning or low emission alternative fuel. It is made from renewable resources and contains no petroleum, but it can be blended at any level with petroleum diesel to create a biodiesel blend. It can be used in compression-ignition (diesel) engines and requires very little or no engine modifications. Blended biodiesel is somewhat more expensive than regular diesel but much less costly than other forms of clean fuel technologies. The Nashville MTA has been testing a biodiesel blend in approximately 18 of their buses. MTA has recently applied for a grant through TDOT to cover the additional cost of the fuel to switch the entire fleet to the biodiesel blend. Natural Gas Natural gas technologies including compressed natural gas (CNG), liquid natural gas (LNG) and propane have been used to power transit buses. Natural gas-powered vehicles have the appeal of producing less pollution than standard diesel buses and

6-6
have the added benefit of using a domestically produced fuel that is usually less expensive than diesel. However, natural gas buses have a lower travel speed, lower acceleration and can travel fewer miles between refueling stops than standard diesel buses. They are usually smaller than standard diesel buses for this reason. They are also more expensive to buy, operate and maintain, and their engines tend to wear out more quickly than standard diesel buses. As with any innovative technology other than standard diesel, natural gas vehicles require separate maintenance facilities, a separate set of spare parts, and specially trained maintenance staff. Natural gas has proven a volatile and potentially dangerous motor fuel, particularly at the point of refueling. Natural gas fueling facilities are separate from diesel facilities and are more expensive to build, operate and maintain, and they have different and more stringent safety and environmental requirements than diesel fueling facilities. Battery Powered Electric Battery-powered electric buses also have been implemented in several cities. Battery-powered vehicles are quieter and smoother running than diesel buses and produce no pollution at the location of the vehicle. However, because of the current limitations of battery power storage technology, battery-powered vehicles are generally smaller and slower than standard transit buses and are primarily applicable only for shorter trips. Vehicle batteries must be recharged after only a few hours service, and to provide continuous service with a single vehicle, batteries must be "swapped out" several times over the course of a service day. This requires a staffed maintenance facility located at a bus layover point. Battery powered buses use proven electric vehicle technology, but are more expensive to buy and maintain than standard diesel buses. Hybrid Electric Hybrid electric buses, related to dual-powered buses, are powered by a combination of diesel and natural gas or electrical power that reduces or eliminates air pollution and noise from the bus. In some configurations, a diesel or natural gas-powered engine is used to generate electricity that is stored to power an electric motor. Hybrid electric buses have the advantages of quieter and more environmentally friendly operations which produce less pollution. These types of vehicles also obtain greater fuel economy than conventional diesel engines. However, hybrid electric is not yet a proven technology for large transit vehicle power. Other factors associated with hybrid electric buses are that the vehicles are more costly to purchase and maintain, and they have a lower top speed and less acceleration power than standard diesel buses. In some cases, the electrical system must be recharged using an off-board electrical power source. 6.2.3 Bus Transit Operating Applications The following sections provide a summary of the typical operating modes for bus service. Local On-Street Bus Local on-street bus service is the most prevalent form of transit in urban areas throughout the United States, including the southeast corridor. This type of transit operates in existing public rights-of-way (in mixed traffic), making frequent stops and traveling at low speeds. It should therefore be used only for short to medium length trips that are contained within a single urban area. Local bus systems typically provide an essential grid or radial service from residential areas to various activity centers throughout a local community. They also serve major activity centers (e.g., hospitals,

6-7
regional attractions and large shopping centers). Some community-to-community service and cross-town connecting service are provided. Depending on the frequency of service, the density of corridors and other factors, local bus systems can serve light to heavy passenger volumes. These vehicles enable flexible routing and scheduling since they operate over the existing street network. However, since buses operate in mixed traffic, an increase in traffic volume and congestion requires more equipment and longer service hours to maintain scheduled headways and balances passenger loads. Local bus service is ideally suited to provide feeder service to a higher-speed, higher capacity line-haul, fixed guideway system (including BRT or busways) that operates over a long distance corridor. In this respect, local service can function as a collector system at the residential end of the trip and as a distribution system at the employment end of the trip. Local on-street bus service is particularly effective at serving the low-density development typically found throughout the Nashville area. Because local bus systems operate on existing streets, the only direct capital costs are the vehicles, passenger amenities and maintenance facilities. Express Bus Express bus service is geared primarily to peak travel periods over longer distances and at higher average speeds. Express buses usually collect passengers on local streets or at a park-and-ride facility at one end of a route, making few or no intermediate stops until reaching the other end of the route. In many locations, express service operates from the outer suburbs to the central business district, with stops at several locations at each end of the route. Express service can also be considered as a way to connect various cities and towns or provide a high-speed service from park-and-ride facilities to major activity centers. Express bus routes may use buses from the same vehicle fleet used by local bus services, or they could use special buses that provide amenities such as cushioned seats, reading lights, and tray tables. These amenities provide a higher level of comfort to better accommodate passengers during the longer express bus trips. In many cases, express buses operate on major roads and highways rather than local streets. Express buses can use priority technology, High Occupancy Vehicle (HOV) lanes or a busway for the express portion of the trip (Figure 6-5).
Figure 6-5 Los Angeles Express Bus/HOV Lane Buses used for express service are sometimes larger than buses used for local service and can include over-the-road coaches or articulated buses. Capital and operating costs can be similar to local buses or more than twice as much. Costs for physical improvements such as special bus stops or bus lanes and park-and-ride lots must also be included in the total cost of the express bus services.

6-8
Urban Arterial Service In an urban setting, express bus service may be limited stop or skip stop service running in urban arterial corridors alongside local bus service. Where local bus service in these corridors may stop at nearly every crossing street, with stop spacing of three, four or more stops per mile, express bus stops may be limited to major crossing arterials, with only one or two stops per mile. The purpose of express bus service is to provide passengers with a faster ride, one with fewer stops or detours off the direct route, and to benefit customers making longer trips or those transferring between bus routes at major transfer points. Typically express bus service in an urban setting is provided using the same fleet of buses used for local bus service. Express bus service in an urban setting can be enhanced through the development of queue jump lanes to allow buses to bypass congested intersections and remove buses from the congestion of the general traffic flow during peak-period or all day using HOV, Bus-Taxi, or exclusive bus lanes. In addition, signal priority or signal pre-emption systems, in which traffic signals are advanced or pre-empted by the approach of a bus, can also enhance express bus service. Without such improvements, express buses must operate in the same congested traffic conditions as auto traffic and local bus routes, and thus, time savings may not be significant when compared to local service. Limited Access Highway Service Many express bus routes operate from more distant suburban locations and use a freeway or highway alignment for part of their trip. Freeway operations provide a faster travel time that result from higher posted speed limits, a more linear alignment, and uninterrupted traffic flow. Buses typically operate in mixed highway traffic and serve limited stops between an origin and destination. HOV lanes enhance express transit service. These non-separated lanes on a freeway or highway are typically located on the inside lanes which have pavement markings and signs to indicate that use is restricted to HOVs such as buses, taxis, vanpools and carpools (Figure 6-6). HOV lanes provide buses with a speed advantage when compared to single-occupant cars operating in congested highway conditions. This tends to make bus service’s travel time competitive with driving; however, additional traffic from carpools and vanpools using the HOV lane can restrict its effectiveness for buses. Some examples of operating HOV facilities include an extensive network in Orange County, California; and I-95 through South Florida.
Figure 6-6 HOV Lane – I-495 Long Island Expressway, New York

6-9
Bus Rapid Transit Bus rapid transit (BRT) is a system of improvements to make bus service more attractive when compared to auto travel. The primary goals of BRT are to reduce transit travel time and increase service reliability. This application concept is a flexible one that encompasses physical, technological, operational and marketing improvements in response to congestion, operational needs, opportunities and market demand. The implementation of BRT service within a transportation corridor can be an evolutionary process in which transit amenities and infrastructure improvements are phased in over time as conditions and demand warrant them, and as funding becomes available. For example, an urban corridor supporting a high volume of bus service and ridership may designate the outside lanes as bus lanes during peak periods to increase travel speeds. In addition, station area enhancements and vehicle aesthetics can be implemented to identify a distinguishable transit mode. Later, as the corridor develops over time, a traffic signal priority system and queue jumps at congested intersections can further improve the bus system throughout, resulting in additional ridership gains. As ridership increases, a full-time curb-separated right-of-way and improved streetscape treatments on the BRT system could be implemented throughout the travel corridor. BRT systems provide communities with an excellent opportunity to upgrade service to transit users and thereby increase transit use. They also offer an opportunity to invest in streetscape and facility improvements that beautify and enhance the corridor. Developers and potential residential and commercial investors perceive these investments as a strong indication of the community’s commitment to an area. This perception of commitment can promote redevelopment opportunities and improved development in the corridor. BRT systems provide greater operational flexibility when compared to a system with a fixed alignment such as LRT or heavy rail. For example, BRT systems usually allow buses to leave their dedicated alignment at the beginning and end of the trip to provide their own collector and distributor services, potentially offering more passengers a one seat ride. This is accomplished by providing connections to major intersecting roads, thereby reducing the inconvenience associated with transfers from one mode or one vehicle to another. This feature is well suited to the residential end of the trip where densities are too low to provide transfer stations within convenient walking distance, as well as distribution systems to established employment centers such as central business districts, where the construction and operation of any form of fixed guideway transit may be difficult. Other bus routes operating partially over a common section can benefit from operation in the bus lanes over part of their trip. BRT service is presented according to levels of service implementation (initial, intermediate and full) as defined by the Federal Transit Administration (FTA). Each level of BRT service includes various technological, operational, and structural elements according to the specific implementation level. Initial BRT is a basic set of amenities for BRT service. Intermediate provides a more comprehensive application of transit infrastructure and technology. Full BRT is a developed system that applies the transit elements of initial and intermediate BRT service. Each level of BRT service benefits from upgraded marketing and the installation of service enhancements to provide passenger safety, comfort, and convenience, thereby upgrading a system’s image and increasing customer attractiveness.

6-10
Initial BRT Service Initial BRT service prescribes minimal improvements to existing bus services that include an increase in service frequency, a decrease in transit travel time and the implementation of passenger amenities for the purposes of developing a distinct mode of transportation. Initial BRT service is typically distinguishable from conventional bus service through vehicle aesthetic improvements and the installation of passenger station amenities. Vehicle improvements range from a color scheme different from existing conventional buses to purchasing new buses that are equipped to provide a more comfortable ride. Passenger stations are typically upgraded to include curbside concrete hard stands with covered seating areas, adequate lighting, highly visible signage and route information. This type of BRT service shares a travel lane to operate in mixed traffic on urban or suburban streets with some level of preferential treatment. The type of preferential treatment for initial BRT service is achieved through a deployment of Intelligent Transportation Systems (ITS) technology such as signal prioritization. A signal prioritization system improves transit travel times by allowing buses to advance, prioritize, or pre-empt traffic lights when approaching a signalized intersection. The components of the system involve a bus-mounted transponder that utilizes an electronic signal to correspond with an intersection’s traffic signalization system. A signal priority system allows an approaching bus and traffic to pass through an intersection without interruption by a stop signal. This improvement minimizes transit travel delays, improves reliability and allows buses to maintain schedule adherence. The installation of an enhanced signalization network may even reduce the number of buses required to operate on a route to meet existing schedules, and thus reduce operating costs. Intermediate BRT Service Intermediate BRT service utilizes a designated right-of-way that applies various types of infrastructure and technology to reduce dwell time and accelerate transit travel time within a transportation corridor. Intermediate BRT may utilize a designated lane during peak travel times, a fully dedicated lane or an HOV travel lane that may or may not be barrier separated from other vehicular traffic. This type of BRT service includes advanced upgrades to transit vehicles, bus stop amenities, and creation of bus “stations” at key locations in a corridor. Various improvements along a BRT service corridor are applied to speed up passenger boarding and reduce overall travel time. This is achieved using transit vehicles that are designed with low-floors and multiple, wider doors for faster passenger boardings and alightings. Signage and information system upgrades at bus stops typically utilize the deployment of ITS infrastructure such as passenger information systems to provide riders at bus stops with real-time route and schedule information. Improved fare collection systems include off-board fare collection and ticketing systems for this level of BRT. These types of service elements and information improvements increase passenger confidence in using the system, resulting in increased transit ridership. Intermediate BRT service also involves measures to improve pedestrian conditions through streetscape and landscaping improvements which facilitate connections to properties and land uses adjacent to stops.

6-11
Non-Barrier Separated Bus Lane A basic type of transit priority improvement is the designation of a specific bus lane for bus-only traffic. This type of bus lane designation restricts traffic from the use of that lane by separating traffic lanes through pavement markings and signs. The restriction may be limited to the peak direction and to peak periods, or it may be in both directions and at all times of day. The most common type of bus lane is the curbside bus lane, in which the right (outer) lane in each direction is designated for bus only use (Figure 6-7). Rarely, curbside bus lanes operate in the contra-flow direction. Curbside bus lanes allow bus stops to be easily accessible. Stopping buses do not block auto traffic, and auto traffic does not prevent buses from re-entering traffic after a stop. However, curbside bus lanes can rarely be separated from traffic lanes because access to driveways and deliveries must be maintained along the urban and suburban street front. Usually, curbside bus lanes allow taxis, bicyclists, and right-turning traffic to use the designated bus lane, which can cause delays to bus traffic. In addition, auto breakdowns and illegal parking can block the bus lane, and violations of the bus lane are frequent, particularly under congested conditions. The Forbes-Fifth one way bus lanes between the Squirrel Hill area and downtown Pittsburgh, the downtown bus loop in Toledo, Ohio and the Madison Avenue bus lanes in New York City are examples of systems using curbside bus lanes in U.S. cities.
Figure 6-7 Silver Line, Boston Non-barrier separated BRT bus lanes have also been developed in several cities in the right (outer) lanes of expressways that are designated as HOV lanes. These lanes also serve car pooling auto drivers in many cities. The restrictive use of HOV lanes and non separated bus lanes is violated by single-occupant drivers, breakdowns of vehicles and congestion from excessive numbers of high occupancy vehicles and buses. In addition, merging to and from median and inside-lane HOV facilities into the regular traffic stream can create delays for vehicles entering and exiting the expressway. Another component of intermediate BRT is the installation of dedicated segments of right-of-way in urban and/or suburban settings that increase travel time and allow BRT to receive priority over auto traffic. These are installed as a non-barrier BRT bus lane. One example of this is a queue jumping lane, which can be installed at major intersections to allow buses to bypass congested traffic conditions (Figure 6-8). A queue jumper provides transit vehicles with a segment of exclusive right-of-way using a programmed traffic signal that turns green ahead of the other signals. This enables a bus to “jump” ahead of the rest of the traffic, providing transit vehicles with a speed and time advantage over the normal traffic flow. These bypass lanes can speed up bus

6-12
service between 30 to 60 seconds at a typical signalized intersection. Bus stops at times are integrated into the design of queue jumps to create mini “stations” at major interchanges. This type of facility also helps to speed buses on expressways where full HOV or bus lanes have not been implemented. For example, queue jump lanes for buses (and HOVs) have been implemented in conjunction with ramp metering systems, allowing buses to bypass the ramp metering before cars may enter the entrance ramp. Queue jumps also have been installed at exit ramps. Many toll roads also have special bus lanes allowing them to bypass toll queues.
Typically, construction costs for this type of facility ranges from $200,000 to $500,000 per intersection. Queue jumpers are particularly useful along major roadways where lower-passenger volumes, a lack of financial resources, or available right-of-way prevent the installation of a continuous exclusive right-of-way for buses. Queue jumpers have been implemented in Charlotte, North Carolina, Montgomery County, Maryland and Santa Clara County, California. Figure 6-8 Queue Jump Lane Barrier Separated Bus Lane Intermediate BRT also includes barrier separated or limited–access roadways for buses. An example is an at-grade
separated median bus lane that operates in the center of an arterial roadway, with two bus lanes or occasionally a single bi-directional lane. Median bus lanes do not potentially block curbside access or remove curbside parking. They are often barrier separated from auto traffic, which makes them less subject to delays from drivers violating the bus lane restrictions, breakdowns or other mishaps. Median bus lanes, however, must accommodate bus stops or stations in each direction. Offsetting the stations can minimize the space they consume, but fitting the bus lanes, stations, and vehicle travel lanes into the roadway section can be challenging and costly, particularly because it often requires reconstruction of the entire roadway and/or adjacent sidewalks. In median bus lane applications, bus passengers must cross auto travel lanes to reach stations, requiring improvements to crosswalks and the implementation of fences and streetscape treatments to control pedestrian movements. Signage and signal systems must discourage motorists from accidentally entering the median bus lane during left turning movements from crossing streets. Through-bus movements on the alignment may require a separate traffic signal phase to prevent left-turning motorists on the roadway adjacent to the alignment from crossing the path of oncoming buses. The Canal Street bus lane in New Orleans, the Market Street bus lane in San Francisco, the busway on Number 3 Road in Richmond (Figure 6-9), the Euclid Corridor project in Cleveland, and the CATS busway on Independence Boulevard in Charlotte are examples of BRT systems employing median bus lanes in arterial corridors. Intermediate BRT service that operates on a separated individual right-of-way may employ bus technology that steers or guides buses over portions of their routes. This is accomplished by use of wayside-located guidance curbs or optical guidance systems that utilize a camera to follow painted tracks on the road. This technology relieves the driver of the responsibility of steering the bus when in the guideway. Optically-guided
6-13
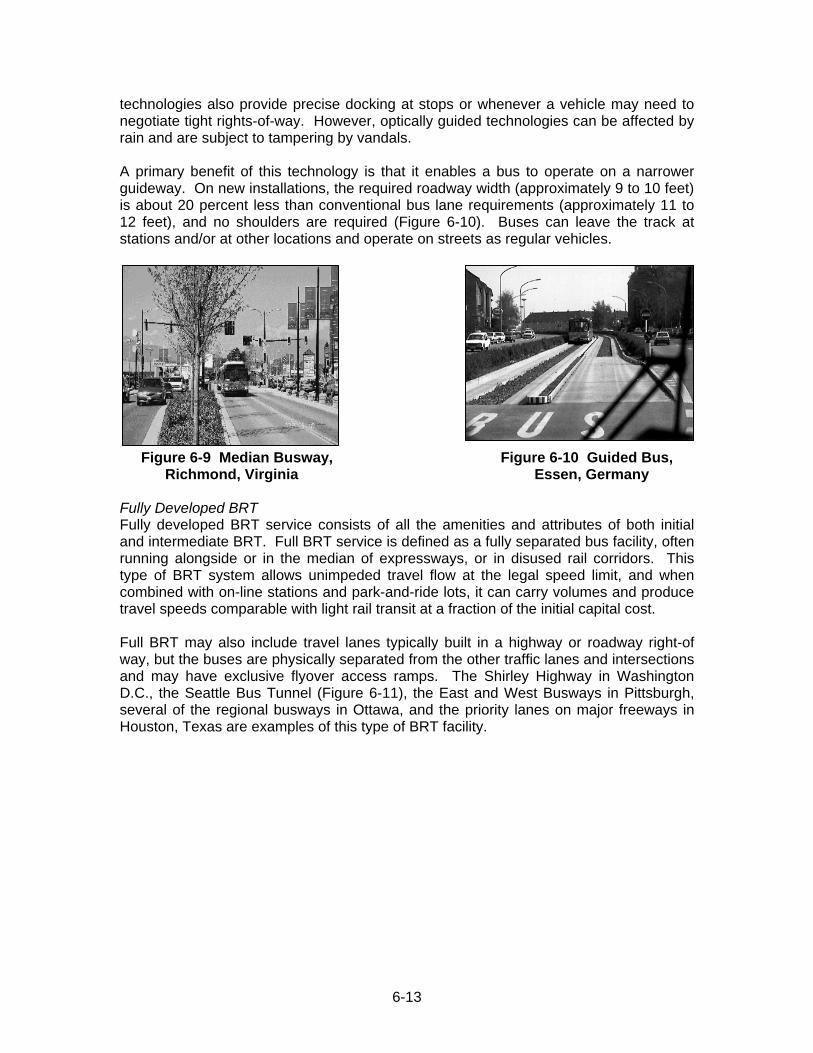
technologies also provide precise docking at stops or whenever a vehicle may need to negotiate tight rights-of-way. However, optically guided technologies can be affected by rain and are subject to tampering by vandals. A primary benefit of this technology is that it enables a bus to operate on a narrower guideway. On new installations, the required roadway width (approximately 9 to 10 feet) is about 20 percent less than conventional bus lane requirements (approximately 11 to 12 feet), and no shoulders are required (Figure 6-10). Buses can leave the track at stations and/or at other locations and operate on streets as regular vehicles.
Figure 6-9 Median Busway, Figure 6-10 Guided Bus, Richmond, Virginia Essen, Germany
Fully Developed BRT Fully developed BRT service consists of all the amenities and attributes of both initial and intermediate BRT. Full BRT service is defined as a fully separated bus facility, often running alongside or in the median of expressways, or in disused rail corridors. This type of BRT system allows unimpeded travel flow at the legal speed limit, and when combined with on-line stations and park-and-ride lots, it can carry volumes and produce travel speeds comparable with light rail transit at a fraction of the initial capital cost. Full BRT may also include travel lanes typically built in a highway or roadway right-of way, but the buses are physically separated from the other traffic lanes and intersections and may have exclusive flyover access ramps. The Shirley Highway in Washington D.C., the Seattle Bus Tunnel (Figure 6-11), the East and West Busways in Pittsburgh, several of the regional busways in Ottawa, and the priority lanes on major freeways in Houston, Texas are examples of this type of BRT facility.

6-14
Figure 6-11 Seattle Busway Tunnel Buses using this type of BRT facility normally collect passengers on local streets or at park-and-ride facilities and then enter the exclusive busway and operate much like a rail vehicle on a fixed guideway system. Busways permit the location of stations along the busway at major community origins and destinations. However, compared to HOV lanes, which are generally considered highway facilities, busways are exclusively transit facilities and often must be financed exclusively using local, state and Federal transit funding. On-line stations, particularly in the medians of expressways, may be less convenient for passengers. However, the characteristics of BRT allow passengers to board in their neighborhoods and alight near their destinations at off-line locations by buses that can then enter the bus lane for the express portion of the trip. A summary matrix that provides a comparison of each bus application is presented in Table 6-1. A summary matrix that presents key characteristics of each level of BRT service is presented in Table 6-2.

6-15
Table 6-1 Bus Service Summary Local on-Street Bus Express Bus BRT Passenger Volumes
Serves light to heavy passenger volumes
Serves medium to high passenger volumes
Serves medium to high passenger volumes
Passenger Capacity
Up to 2,000 to 4,000 passengers per hour per lane one-way
4,000 to 6,000 passengers per hour per lane one-way
6,000 to 12,000 passengers per hour per lane one-way
Speed Slow speed - 12 to 20 mph average with stops and peak hour traffic
Medium to high speed - up to the legal speed limit depending on traffic conditions
High speed - up to legal speed limit on the use of exclusive lanes
Type of Trips Dense area-wide network useful for short-to-medium length trips
Serves medium to long trips (depending on operating speed and bus stop spacing)
Primarily serves long distance commuter trips
Stop Frequency
Stops spaced 0.2 to 0.5 miles apart
Typically less frequent stops or point-to-point service; often uses limited access highways, HOV lanes
Typically infrequent stops; point-to-point service
Capital Costs Low capital cost Relatively low capital cost unless
HOV or park-and-ride facilities are included
Relatively low vehicle cost, but medium to high cost for exclusive busway lanes
Operations and Maintenance Costs
Moderate operating costs per vehicle mile or passenger mile basis. High vehicle maintenance costs.
Moderate operating costs on a vehicle mile or passenger mile basis Average vehicle maintenance costs
Moderate operating costs per vehicle mile or passenger mile basis. High vehicle maintenance cost -- exclusive guideway system is an additional maintenance cost
Right-of-Way Requirements
Uses existing rights-of-way Uses existing rights-of-way, with the exception of new park-and-ride lots
May require additional rights-of-way for new park-and-ride lots and lane expansions. Operates in mixed traffic HOV lanes or exclusive travel lanes

6-16
Table 6-2 Levels of BRT Summary
Initial BRT Intermediate BRT Full BRT
Right-of-way Shared lanes in Mixed Traffic
Designated lanes/HOV lanes Barrier separated dedicated lanes
Exclusive alignment with full grade separation
Stations
Improved passenger amenities –
lighting, shelter, signage etc.
Enhanced passenger
information and fare collection
Enhanced loading and land use
features
Service Improved service frequency
Skip stop service and express
services High frequency and
reliability
Convenient transfer options
Route Structure Single route with
transfers, connections and
color coding
Multiple route operations with transfer facilities Integration with regional transit
services
One seat rides Transfer reduction
Intelligent Transportation
Systems Signal priority
Automated passenger information
Vehicle location and system surveillance
Source: Federal Transit Administration

6-17
6.3 Rail Transit Rail transit is the term used to describe conventional fixed guideway transit systems that use a dual rail track, as historically used by railroads, for both support and guidance. Rail transit categories include light rail transit (LRT), heavy (or rapid) rail transit, commuter rail transit and high speed rail. 6.3.1 Light Rail Transit LRT is a flexible transportation mode that can operate in a variety of physical settings. As the modern technological descendent of the streetcar, a distinctive feature of LRT is that vehicles draw power from an overhead wire. This is in contrast to heavy rail vehicles that are usually powered by a track-level third rail. This overhead power collection feature allows LRT systems to integrate with other at-grade transportation modes and pedestrian areas. LRT (like streetcars) can operate in mixed traffic on tracks embedded at-grade with street and pedestrian crossings, or on a fully-segregated guideway.
Figure 6-12 Los Angeles Blue Line LRT LRT Operational Characteristics:
• Serves moderate to high passenger volume • Typically 3,600 to 22,000 per hour one-way • Low to medium speed – 30 to 65 mph (depending on degree of separation of
right-of-way and distance between stops) • May serve short to long distance trips • Stations spaced 0.5 to 1 miles apart • Normally uses overhead power collection • May operate in traffic, with cross-traffic, or on exclusive right-of-way • Can negotiate steep grades and small radius curves • Stations may be elaborate or simple. May use low platforms, high platforms, or
both • Vehicles may operate alone or in trains of up to four vehicles • Numerous vehicle suppliers • Cannot operate jointly with freight trains or other railroad equipment

6-18
• Moderate to high capital cost (more than commuter rail/less than heavy rail) • Moderate O&M cost on a vehicle mile or passenger mile basis
The most recent light rail systems in the U.S. operate vehicles that are 90 to 95 feet long and up to 9 feet 6 inches wide. Operator cabs at both ends of the vehicle (articulated and non-articulated) allow bi-directional operation. LRT systems can operate either as a single car or in multi-car trains. The capacity of a typical LRT vehicle ranges between 120 and 170 passengers. A three-unit train can carry up to 510 passengers, and the single direction, hourly capacity of a line can be up to 16,000 persons per hour per direction (pphpd). Figures 6-13 and 6-14 illustrate LRT systems in operation in Cleveland and Portland, respectively. The maximum operating speed of modern LRT systems generally ranges from 55 to 65 miles per hour, making it suitable for medium distance trips in suburbs or between central business districts. However, average operating speeds can be reduced to 10 to 25 miles per hour if operating in mixed traffic with frequent stops. Depending on the surrounding environment, LRT station design may incorporate high or low platforms. Generally, transit systems with on-street operations, where passengers can walk across tracks, use simple stations with low platforms, while systems with reserved right-of-way use high platforms. Figures 6-13 (Cleveland; left) and 6-14 (Portland; right) Entry into light rail vehicles (LRVs) has traditionally been provided in one of two ways: step entry or level boarding. Low-floor LRVs provide level boarding, which has become quite common, operating in Portland, OR and Hudson-Bergen County, NJ. With the passage of the Americans with Disabilities Act of 1990 (ADA), all new rapid transit stations must provide access for the disabled to every car unit. This means that all LRT systems opened after January 1993 must provide level boarding. Diesel light rail vehicles such as the Siemens “RegioSprinter” operate like light rail vehicles but are self-powered and thus do not require overhead catenary power. This reduces the initial capital cost of developing a light rail line but eliminates some of the noise reduction and pollution control benefits of electric light rail. Diesel light rail vehicles have been used successfully in Europe and are being considered for implementation in Santa Cruz, California, Harrisburg, Pennsylvania, and some other cities.

6-19
6.3.2 Heavy (or Rapid) Rail Transit Heavy rail transit (HRT) systems are at the upper end of the urban transit spectrum in terms of speed, capacity and reliability. Also referred to as rapid rail, metro, or subway, HRT operates in an exclusive, grade-separated right-of-way. Power is collected from a third-rail located adjacent to and parallel with the running rail. No at grade crossings of the right-of-way are permitted. HRT is characterized by a high capacity to carry passengers, which can range up to 60,000 pphpd with a maximum speed of 70 miles per hour. Average trip length is from 5 to 15 miles. Individual cars are typically 75 feet in length and can carry up to 170 passengers in normal loading situations; full load capacity is about 300 passengers. HRT vehicles are normally operated in married pairs (one unit of two cars) and multiple-unit trains of 4 up to 10 units which are coupled or uncoupled to meet varying travel demand conditions. Heavy rail is best suited for service in high density corridors that connect low-density suburbs to the central city area of large metropolitan areas. Station spacing typically ranges from 1 to 2 miles. Examples of HRT systems in the U.S. include:
• Atlanta-MARTA • Miami-MDT (Figure 6-15) • San Francisco - BART • Washington D.C. - WMATA
Figure 6-15 Miami Metro HRT system The capital cost for HRT systems range between $95 to $140 million per mile. With the possible exception of higher capacity people mover systems and high speed rail, HRT is at the upper end of the cost range for rail urban transport systems. This is largely the result of the exclusive and grade-separated right-of-way infrastructure requirements. Operation and maintenance cost for HRT systems on a per passenger or a passenger mile basis may be lower than those for bus or LRT alternatives. Heavy Rail Transit Operational Characteristics:
• Serves high passenger volume • Typically 42,000 to 60,000 per hour one-way • High speed - up to 70 mph • Serves medium to long trips

6-20
• Stations spaced 1 to 2 miles apart • Requires exclusive right-of-way • Must use high platforms • Power collection from “third rail” • Numerous vehicle suppliers • Can have long trains (usually 4 to 10 cars) • Moderate to low O&M cost on a vehicle mile or passenger mile basis • Very high capital cost
6.3.3 Commuter Rail Commuter rail is generally used for longer distance regional rail trips. For conventional commuter rail operations, single or bi-level passenger cars are pushed or pulled by diesel or electrically-powered locomotives. Typically these systems are operated by railroads under agreement with a transit agency on their own tracks or through a leased track usage agreement. A major advantage of commuter rail is its ability to use existing freight trackage in joint use with freight trains or Amtrak service. Generally, commuter rail operates to provide peak period and peak direction service. Due to federal regulations that require an automatic train control system for speeds in excess of 79 miles per hour, commuter rail generally operates at this maximum speed. The slower acceleration and longer braking distances of commuter rail when compared to the other rail technologies make it best suited to longer distance trips. Commuter rail vehicles can use high or low platform boarding. Individual cars can carry up to 160 seated passengers with a nominal standing load capacity of 300 passengers. Trains with 10 to 12 cars are not uncommon. Therefore, individual trains have a high capacity, but because headways are longer, the total line capacity is typically less than heavy rail (7,500 to 25,000 passengers per hour in a single direction). Capital costs range from $7 million to $25 million per mile. The operating cost, primarily due to union labor costs, can be relatively high. Due to the high passenger capacity potential and the long distances traveled, the cost per passenger mile for commuter rail is in the middle range for rail transit alternatives. Representative examples of U.S. commuter rail systems include:
• Cal Trans in San Francisco, California • Tri-Rail, Florida • MARC in Baltimore, Maryland • Metra in Chicago, Illinois
Commuter Rail Operational Characteristics:
• Serves moderate to high passenger volume • Non-powered passenger cars pulled by locomotives; or diesel multiple units (self
propelled) • Can use existing tracks jointly with other railroad equipment • Serves long distance trips • Typically 8,000 to 25,000 per hour one-way • High speed - up to 79 mph (without cab signals) • Stations spaced 5 to 7 miles apart

6-21
• Stations may be elaborate or simple, and use low platforms, high platforms or both.
• Can have long trains (usually 4 to 12 cars) • Diesel locomotives have air and noise quality impacts, and are maintenance-
intensive • Relatively low capital cost (when using existing tracks) • Moderate to low O&M cost on a vehicle mile or on a passenger mile basis
Diesel-Electric and Electric Locomotives Diesel-electric locomotives are the most common railroad locomotive in use in North America. They are used for both freight and passenger service. Traction power for these systems is either diesel or electric. Electric locomotives operate from electric power drawn from an overhead contact system. When a diesel locomotive is used, the locomotive is capable of pushing or pulling from one to eight cars (push-pull operation). Figure 6-17 depicts a locomotive-hauled commuter rail of double-decked passenger cars operating on Chicago’s Metra system.
Figure 6-16 Chicago Metra Locomotive-Hauled Commuter Rail Multiple Unit Cars (Diesel and Electric) Diesel and electric multiple unit cars are self-propelled commuter rail cars that do not require a locomotive to push or pull them. Multiple unit cars can operate as single cars or as trains of up to 10 cars. These cars are typically 85 feet in length and provide seating for 60 to 100 passengers. They are capable of speeds from 80 to 120 miles per hour. Figure 6-17 depicts an electric multiple unit vehicle in New York. Figure 6-18 illustrates the latest diesel multiple unit (DMU) prototype to meet the Federal Railroad Administration’s approval. The South Florida Regional Transportation Authority (Tri-Rail) is using this prototype as part of a demonstration project.

6-22
Figure 6-17 New York Commuter Rail EMU
Figure 6-18 Diesel Multiple Unit 6.3.4 High Speed Rail High speed rail is generally used for longer distance intra-urban travel in a region and serves to connect cities 100 to 500 miles apart. The trains are usually powered by one or more electric engine receiving power from an overhead catenary system. High speed rail requires an exclusive right-of-way in the form of separate tracks or on shared tracks with a temporal separation. Shared rights-of-way are becoming less practical due to the speed and construction of the rail, tolerances required and shared maintenance cost issues. This type of service addresses the need of moderate to high passenger volumes over long distances. Passenger volumes are generally in the range of 3,000 to 22,000 per hour. As passenger demand increases, the need for exclusive rights-of-way also increases. High speed trains are capable of cruising in excess of 200 miles per hour. Station spacing is generally 25 to 50 miles on average and train lengths vary from 8 to 14 cars. The seated capacity of a car ranges from 68 to 88 passengers. All passengers are typically seated for high speed rail service. Capital costs range between $60 and $100 million per mile. The cost of right-of-way, communications, control and rolling stock are the primary items of cost. In addition, the

6-23
operating cost, due to labor costs, can be relatively high. The cost per passenger mile is in the middle of the range for rail transit alternatives because of the speed and distances traveled,. Representative examples include the ICF in Germany; the TGV in France (Figure 6-19) and the SKS in Japan. While some limited 125 to 140 miles per hour service exists, there are no true high speed trains currently in operation in the U.S.
Figure 6-19 TGV High Speed Rail System, France 6.4 Other Fixed Guideway Transit This section describes other fixed guideway transit technologies not included in the rail transit categories previously discussed. Included in this section are automated guided transit systems (personal rapid transit, group rapid transit, and people movers) and monorail technologies. 6.4.1 Automated Guideway Transit Automated Guideway Transit (AGT) refers to a broad range of fixed guideway technology in which the most prominent feature is automatic train operation. AGT technology includes a wide range of service levels – from proven "people mover" systems such as the downtown Miami Metromover and numerous airport circulators – to experimental systems such as the personal rapid transit (PRT) system planned for a suburban commercial area near Chicago’s O’Hare Airport. Currently, the majority of AGT systems operate as local distribution systems in areas where many trips are concentrated over short distances. They typically are found at airports (e.g., Atlanta and Miami), zoos, amusement parks, and in major commercial centers or downtowns (e.g., Harbour Island in Tampa and the People Mover in downtown Detroit). However, AGT systems have been successfully used in urban line-haul applications in Vancouver, B.C. and Lille, France. AGT is increasingly being used in urban environments in line-haul applications.

6-24
The service characteristics of AGT vary considerably. Urban, medium capacity systems can reach speeds of 50 to 55 miles per hour. People movers are generally operated at 35 miles per hour. Airport and local circulators typically operate at speeds of 25 miles per hour or less. Passenger capacities are less than light or heavy rail systems. This lower passenger capacity is due to AGT’s tighter geometric tolerances and shorter station spacing. All AGT systems are proprietary and generally can be distinguished by their suspension devices or propulsion mechanisms. While some systems are suspended from an overhead “track” (somewhat similar to a cable car), most systems run on top of a track or multiple tracks. Vehicles can be rubber tired or steel wheeled. Power is supplied by a high voltage contact (third) rail located in the trackbed. AGT systems therefore require full grade separated rights-of-way from other traffic and pedestrians. The steel wheeled version requires conventional railroad-type steel rails to be affixed to the guideway, while the rubber-tired version have a concrete or steel running surface and a concrete and steel center or side rails for lateral guidance. AGT vehicles range between 20 and 55 feet in length, operate singly or in combination with other vehicles, and can accommodate 150 or more passengers. AGT systems have capacities of between 5,000 and 15,000 passengers per hour. One advantage of people movers is the typically narrow envelope requirement allows the system to be used in tight rights-of-ways (including through the interior of buildings), and negotiate small radius curves and relatively steep grades. Because most systems are fully automated (i.e., driverless), techniques must be employed to ensure that accidental intrusion or entry by pedestrians onto the right-of-way is prevented. These protection systems, in conjunction with the exclusive guideway and automated technology, can result in costs significantly higher than heavy rail on a per mile basis. Typical subclassifications of the AGT system technologies include people mover and personal rapid transit systems. Automated Guideway Transit Operational Characteristics:
• Serves medium to high passenger volumes • Typically 5,000 to 15,000 per hour one-way • Medium speed - up to 55 mph • Serves short to medium length trips • Stations spaced 0.25 to 0.5 miles apart • Automated train system with control/supervision from central control center • Complex guidance / switching systems • Right-of-way must be grade separated • Cars may operate alone or as trains • Proprietary vehicle and guideway designs with turnkey procurement • Varying levels of maturity, depending on individual system manufacturer • Highest capital cost • Highest O&M cost

6-25
Automated People Movers Automated People Movers (APMs) are a class of transport in which fully automated, medium sized vehicles operate on fixed guideways along an exclusive, grade-separated right-of-way. Vehicles may operate in single married-pair units or trains. Airport applications usually include barrier doors between the platform and track. Urban applications such as Downtown People Movers (DPMs) typically do not. The majority of APM systems usually operate as a local distribution system in an environment where there are many trips concentrated over short distances. They typically are found at airports such as Atlanta, Orlando and Dallas, zoos, and in the major commercial centers or downtown areas, like the Skyway in Jacksonville. Service may be provided according to a fixed schedule or on demand with stations configured for vehicles/trains stopping on-line. Automation and grade separation allow for higher service frequency and capacities for larger APMs range from 5,000 to 15,000 passengers per hour per direction (pphpd). Train envelope dimensions are about 10 to 12 feet in height, 8 to 10 feet in width and 40 to 240 feet in length for a single to six-car system. Representative examples of APM technology include:
Bombardier/UTDC Advanced Light Rail System (ALRT) – Fully automated, electrically powered vehicles operated as a 2.9-mile loop system in downtown Detroit, and as a line-haul system in both Toronto and Vancouver, BC (Figure 6-20).
Figure 6-20 Vancouver BC SkyTrain
Matra VAL (France) – Fully automated, rubber-tired guideway system at airports in Paris, France and Chicago O’Hare. Urban transit applications include Lille (Figure 6-21) and Toulouse, France, and Taipei, China.

6-26
Figure 6-21 VAL People Mover System, Lille, France
Personal Rapid Transit Personal Rapid Transit (PRT) systems are small, low speed systems that require an exclusive right of way and are designed to provide personalized service such as traveling to the desired stop without intermediate stops at other stations. The guideway is typically more expensive than those of conventional systems. The term “rapid’ in PRT is to enhance its image, but technically it is not justified because this mode does not perform at a level characteristic of rapid transit. The capacity of PRT systems is approximately 5,000 pphpd or less, and their speed is generally 25 miles per hour or less.
6.4.2 Monorail Monorail is a fixed guideway transit mode in which a series of electrically propelled vehicles straddle atop or suspend from a single guideway beam, rail, or tube. If fully automated, they are similar in operation to AGT systems but are classified separately due to their unique guideway configuration (Figure 6-22). The trains generally consist of permanently coupled cars having suspension, propulsion, and control equipment in common. Electric power is generally picked up by carbon collectors on the bottom of the vehicle in contact with a bus bar mounted on the side of the guideway beam. They can be operated either manually with fail-safe anti-collision systems or in a totally automated mode. Operating and maintenance costs vary according to the level of automation and the required capacity, but can be comparable to conventional grade-separated systems. The guideway for monorail systems is typically elevated since it must be totally grade separated from all other traffic. Emergency egress from vehicles on this elevated guideway has historically been a problem with monorail systems. Potential solutions have included the addition of emergency walkways to the guideway and on-board inflatable slides and emergency hatches to the vehicles to permit passenger movement from a disabled vehicle to adjacent vehicles and/or ground level. The main disadvantage with monorail systems is their inability to switch tracks efficiently. Whole sections of the guideway support beam must be physically moved from one guideway to another during switching – a slow and maintenance intensive operation.

6-27
Consequently, the applicability of monorail systems has usually been limited to simple loop and shuttle systems. Depending on the size of the vehicles and operating speed, monorail systems are defined as either small capacity or large capacity.
Figure 6-22 Walt Disney World Monorail Monorail Operational Characteristics:
• Serves medium to moderate passenger volumes • Electric powered, rubber-tired propulsion system • Typically 5,000 to 10,000 passengers per hour one-way • Medium speed- up to 45 mph • Serves short to medium length trips • Stations spaced 0.5 to 1 mile apart • Stations must have high-level platforms • Automated train control system with supervision from central control center • Complex guidance / switching systems • Right-of-way must be grade separated • Vehicles can be combined to form trains of up to 6 cars • Proprietary vehicle and guideway designs with turnkey procurement • Little experience in urban applications • High capital cost • Very high O&M cost on a vehicle mile or passenger mile basis

6-28
Small Size Monorail Small size monorails are the types of systems that are primarily found in airports, amusement parks, zoos, fairs, etc. They operate at low speeds and have simple suspension systems (no secondary suspension). Some small monorails have been provided with full automation. Passenger capacity is usually 100 or less, generally all seated. System line capacities for small-size monorails generally range from 500 to 5,000 pphpd. This technology includes the ADtranz (manufactured by ABB Daimler-Benz Transportation, Germany). An example of the straddle-beam, separate-car, medium vehicle system from Sydney, Australia can be seen in Figure 6-23.
Figure 6-23 ADtranz Monorail in Sydney, Australia . Large Size Monorail In large-sized monorail systems, the vehicles generally operate as trains under the control of an operator. The vehicles sit astride a heavy beam structure, riding on rubber tires, with additional stabilizing rubber tires providing guidance laterally. The power is taken from a collector system beneath the cars. System line capacities for large-size monorails generally range from 5,000 to 10,000 pphpd. One example of this technology includes the Hitachi Series 1000 (Japan) – a straddle-beam, large vehicle monorail. Figure 6-24 depicts the 10.5 mile system in operation between Hamamatsu-cho in Tokyo and the Haneda airport.
Figure 6-24 Hitachi Series 1000 Straddle Monorail Cars at the Tokyo Airport

6-29
6.4.3 Magnetic Levitation (Mag-Lev) Magnetic Levitation (Maglev) is a research and development stage technology that uses no wheels or rails for guidance or support. Instead, a concrete or steel guideway is used and the vehicle is magnetically levitated above the guideway, guided, and propelled by a wave of magnetic energy. During movement there is no contact between the vehicle and guideway. Levitating the train above the guideway eliminates most of the frictional drag inherent with other technologies, thus reducing the power required at high speeds and creating the opportunity for operating speeds at the high end of operations of up to 250 to 300 miles per hour. Two basic types of Maglev technology exist: the electrodynamic suspension (repulsive forces) or EDS and electromagnetic suspension (attractive forces) or EMS. The German Trans-Rapid system shown in Figure 6-25 and the South Korean HML system shown in Figure 6-26 are examples of the EMS (attractive force) technology.
Figure 6-25 German Trans-Rapid Maglev System
Figure 6-26 South Korean HML03 Maglev System at the Taejon Expo Maglev systems offer the latest evolution in high speed ground transportation, offering speeds that can exceed 300 miles per hour with the potential of low operating and maintenance costs, and minimum environmental intrusions. Although Maglev systems may prove to be promising in the future, they remain unproven technology and have technical obstacles to overcome such as train control and guideway switching design. There are no Maglev systems currently in revenue operation in the U.S. in a public transit application.

6-30
6.5 Other Technologies There is a new “Tram-On-Tires” (Figure 6-27) technology manufactured by Bombardier. This trolley bus concept features an electrically powered, modern and attractive vehicle. It is in use in Nancy, France, and looks like a modern light rail vehicle. It is a double articulated vehicle, with four trucks, rubber tires (i.e., no tracks), 100 percent low floor, 40-foot radius turning capability, 13 percent grade climbing capability and draws power from a dual wire overhead system. This electric bus may offer low-cost advantages not available with even at-grade LRT. It eliminates tearing up streets to move utilities and install rails; however it may require the installation of a centerline guide rail and traffic sensing loops. It precludes the concern with stray-current control and related corrosion, a design issue that must be addressed with LRT rail as a return path, especially with embedded rail. The dual-wire overhead power distribution system is more visually obvious than the single wire per track LRT system. It is smaller than an LRV at 80.3 feet long and 8.2 feet wide and seats 48 persons (including fold-down seats), with 50 standees (at 2.0 per square meter). It should be pointed out that design information is not definitive enough to be sure of its application—a single- sided configuration is shown. That means all loading in either direction must be from the right side, unless a two-sided version is made available. The system that was installed in Nancy, France had capital costs of approximately $16 million per mile excluding vehicles. Recently, this system has experienced incidents regarding operational safety and is undergoing further examination to determine the appropriate corrective action. There are no tram-on-tires systems in operation within the U.S.
Figure 6-27 Tram-On-Tires

6-31
6.6 Summary of Modal Characteristics A comparative summary of the modal characteristics for each of the transit technologies previously discussed is presented in Table 6-3. This table provides an overview of infrastructure requirements as well as approximate projections of capital and operating costs according to the technology. These estimates are meant for sketch level planning purposes only and could be significantly higher or lower depending on a number of factors. Table 6-3 reflects a summary of the candidate technologies’ operating characteristics. It generally addresses vehicle capacity, train capacity, one-way hourly capacity, minimum station spacing, maximum speed, desirable average operating speed, right-of-way requirements and capital and operating cost. Figure 6-28 illustrates the different types of technologies and associated passenger capacities.
Figure 6-28 Mobility Toolbox

6-32
Table 6-3 Summary of Available System Technology Operating Characteristics
Local Bus
Express Bus
Busway/ Priority
Bus Lane
Light Rail
transit Heavy Rail
Transit Commuter
Rail Diesel
Multiple Unit (DMU)
Automated Guideway
Transit Monorail
Vehicle Capacity (1) (passengers/vehicle 45-60 60-110 60-110 120-170 120-170 120-180 60-100 20-150 30-40
Vehicle Cost ($ millions) 0.31 0.39 0.39 1.5-3.2 2.0-2.9 1.0-1.7 2.5 1.5 6.0
Vehicle Life (years) 10 to 15 10 to 15 NA 30 30 30 Not Available 10 to 15 10 to 15 Train Capacity (maximum passengers/train)
N/A N/A N/A 680
(4-car unit)
1700 (10-car
unit)
1800 (10-car unit)
400 (4-car unit)
600 (6-car unit)
240 (6-car unit)
One Way Hourly Passenger Capacity
2,000-4,000
(per lane)
4,000-6,000
(per lane)
6,000-12,000 (per
lane)
3,600-22,000
42,000-60,000 7,500-25,000 2,400-4,000 5,000-15,000 5,000-10,000
Minimum Station Spacing (miles) .25 – .50 3 – 5 3 – 5 .50 – 1 1 – 2 5 – 7 .50 – 1 .25 – .50 .50– 1
Maximum Speed (mph) 45 65 65 65 70
79 (6) (w/o cab signals)
62 55 45
Average Operating Speed (mph) 10-30 30-50 50-65
(on busway) 20-35 35-50 40-60 25-40 25-40 25-35
Right-of-Way issues Operates
on city streets or busway
Operates on city
streets or busway
Operated on city streets
or in exclusive
right-of-way
Operates on city streets
Full Grade Separation
Operates on existing Railroad Tracks
Operates on Existing Railroad Tracks
Full Grade Separation
Full Grade Separation

6-33
Integration
Easy due to street level boarding and ability to operate in mixed traffic.
Relatively easy due to street level boarding and ability to operate in mixed traffic.
Relatively difficult due to elevated boarding platforms on separated rights of way.
Capital Cost (2) per mile of dual track) (millions $)
N/A N/A $26 – $33 $30 – $40 $95 – $140 $7 – $25 (5) Not Avail. $5 – $15
(est.) $70 – $100 $60 – $90
Operating Costs: - per vehicle mile - per passenger mile (4)
$4.10-$5.60 $0.35-$0.50
$3.50-$4.90 $0.45-$0.65
$4.80-
$7.00(3) $0.55-
$0.90(3)
$6.75-$9.60 $0.45-$0.55
$8.90-$9.40 $0.25-$0.35
$6.50-$14.00 $0.25-$0.30
Not Available
$18.70 $21.00
$2.25-$2.40
Not Available
Source: Parsons Brinckerhoff and Carter Burgess
1. All capacities include standing passengers (at 4 passengers per square meter), except for commuter rail and monorail technologies. 2. Costs are indicative only, and include total system costs with the exception of vehicles or right-of-way. 3. Includes maintenance costs for busway. 4. Operating cost per passenger mile assumes ridership levels justify type and capacity of system. 5. Commuter rail system capital costs assume at-grade operation with grade crossings. 6. With cab signals, speeds up to 120 miles per hour are obtainable with appropriate equipment and proper ROW permit. Note: Only typical system ranges are illustrated. Some existing systems have values outside the ranges shown.

6-34
6.7 Local and Regional Transit Agencies
Nashville Area Metropolitan Transit Authority (MTA)
MTA is a component unit of the Nashville-Davidison Metropolitan Government and was created in 1953 to supervise, regulate and maintain jurisdiction over public transit in the City of Nashville. MTA is governed by a five-member board appointed by the Mayor and approved by the Council. The Metropolitan Government partially funds MTA’s annual operating and capital budgets. MTA currently employs an active fleet of approximately 140 buses, vans and trolleys serving approximately seven million riders annually. MTA is the largest transit service provider in the Nashville region and also provides regional service through contract with the Regional Transit Authority (RTA).
Over the past several years MTA has begun to systematically update their infrastructure and capital assets by installing advanced fareboxes, overhauling their planning and operations software, and modernizing an aging fleet with new 40 foot buses. MTA has recently completed a 5 year operational plan which outlines their strategies to improve and increase bus services within Davidson county.
Regional Transit Authority (RTA)
Created by state statute in 1990, the RTA is a nine-county regional agency in the Nashville metropolitan area whose mission is to plan and develop a regional transit system including a region-wide commuter rail system.
RTA also administers a traditional vanpool program to area commuters as a viable option to driving their own cars. Currently, with 100 vanpools in operation, the program is one of the largest in the southeast. Drawing from a customer base primarily from the outlying counties surrounding Davidson County, downtown Nashville is the destination of a majority of vanpool customers, although many other destinations are also served. The agency administers a carpool database to complement the vanpool program.
RTA collaborates with MTA to deliver a number of commuter and employment related transportation services. MTA operates three regional bus routes under contract with RTA that deliver commuter services between downtown Nashville and Murfreesboro, Hendersonville, and Mount Juliet. These routes serve various park and ride locations in outlying counties and are supported by a guaranteed ride home program.
RTA has implemented the first segment of the planned regional rail transit sytem. The first spur a commuter rail alignment to connect Nashville and Lebanon and began operations in September 2006.

6-35
6.8 Conclusion As is evidenced by the multitude of transit options discussed in this chapter, there are many technologies and transit alternatives that could be used to satisfy the transportation needs of the southeast corridor. These various types of technologies are designed to serve various transportation needs, and each has its own costs and benefits. The Southeast Corridor High-Performance Transit Alternatives Study compared the transit needs of the corridor with the available transit technologies to determine, with input from the public and local officials, which systems would best serve the community.