Embed Size (px)
Citation preview
608RISK BUDGETING AND
INVESTMENT MANAGEMENT
Committee on Investments / Investment Advisory Committee
August 24, 2006
Page 1August 2006 Risk Budgeting and Investment Mgmt
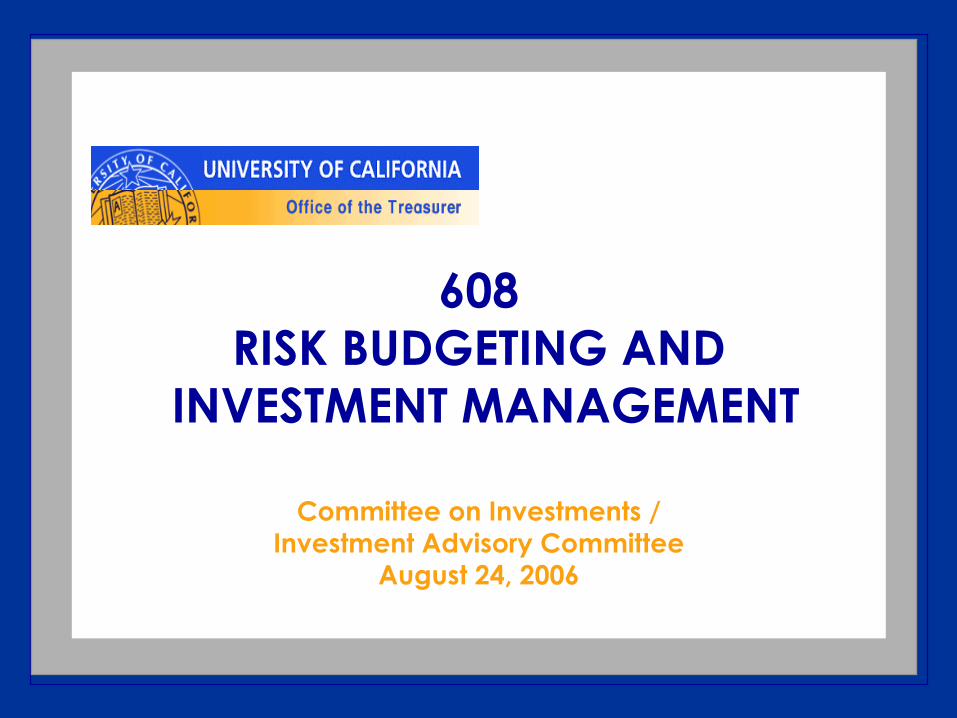
AGENDA
“Measuring” RiskActive Risk“Budgeting” RiskUCRP Risk BudgetsHow Risk Budgets are usedAppendix 1: A Detailed ExampleAppendix 2: How Risk Budgets are Determined

Page 2August 2006 Risk Budgeting and Investment Mgmt
OVERVIEW
Risk management is a critical part of investment management at UCIt is part of managing each asset class and the total fundThe first step is identifying and quantifying various risks in the portfoliosThe second step is to allocate, or budget risk to achieve the best expected return

Page 3August 2006 Risk Budgeting and Investment Mgmt
“MEASURING” RISK
Most investors “feel” that higher risk –potential for loss – should be compensated by higher returnsHigher risk is typically correlated with higher volatility of returnsVolatility (std. deviation) is a proxy for risk, not a measure of riskIt is a good approximation of loss potential for traditional portfolios (most of the assets)
Page 4August 2006 Risk Budgeting and Investment Mgmt
“MEASURING” RISK
For traditional portfolios, volatility tells us the likely range of outcomes, e.g., U.S. Stocks, 1946-2006, had a range of ±16.9% around their average annual return of 12.8%In any 2 out of 3 years, we expect the return on stocks to be between -4.2% and +29.7%
Actually occurred 62% of those years
Page 5August 2006 Risk Budgeting and Investment Mgmt
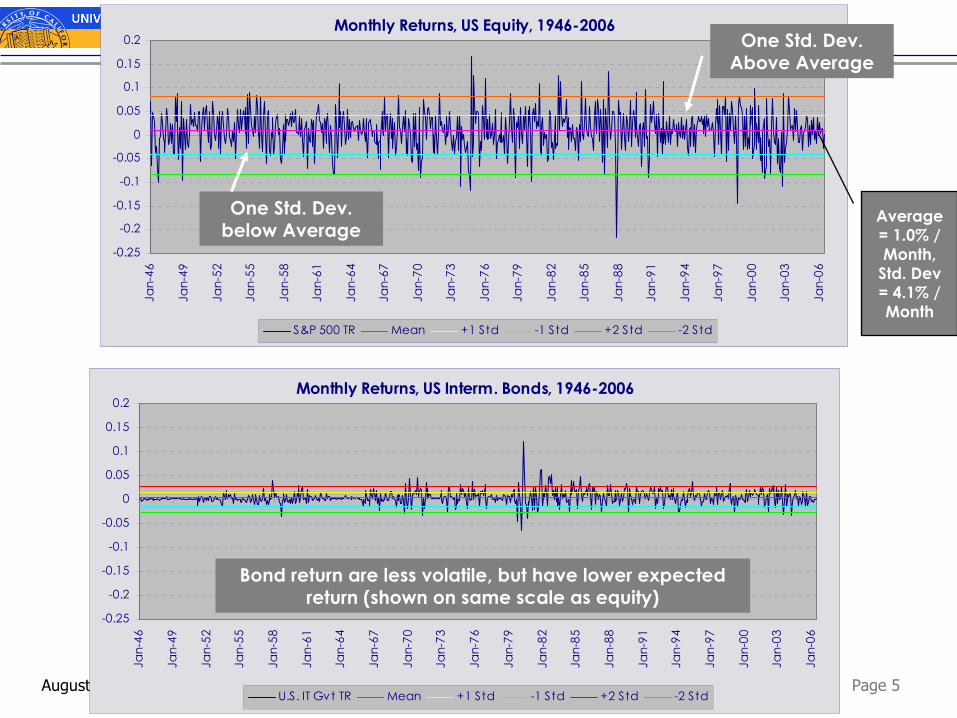
Monthly Returns, US Interm. Bonds, 1946-2006
-0.25
-0.2
-0.15
-0.1
-0.05
0
0.05
0.1
0.15
0.2
Jan-
46
Jan-
49
Jan-
52
Jan-
55
Jan-
58
Jan-
61
Jan-
64
Jan-
67
Jan-
70
Jan-
73
Jan-
76
Jan-
79
Jan-
82
Jan-
85
Jan-
88
Jan-
91
Jan-
94
Jan-
97
Jan-
00
Jan-
03
Jan-
06
U.S. IT Gvt TR Mean +1 Std -1 Std +2 Std -2 Std
Monthly Returns, US Equity, 1946-2006
-0.25
-0.2
-0.15
-0.1
-0.05
0
0.05
0.1
0.15
0.2
Jan-
46
Jan-
49
Jan-
52
Jan-
55
Jan-
58
Jan-
61
Jan-
64
Jan-
67
Jan-
70
Jan-
73
Jan-
76
Jan-
79
Jan-
82
Jan-
85
Jan-
88
Jan-
91
Jan-
94
Jan-
97
Jan-
00
Jan-
03
Jan-
06
S&P 500 TR Mean +1 Std -1 Std +2 Std -2 Std
One Std. Dev. Above Average
One Std. Dev. below Average
Bond return are less volatile, but have lower expected return (shown on same scale as equity)
Average = 1.0% / Month,
Std. Dev = 4.1% / Month
Page 6August 2006 Risk Budgeting and Investment Mgmt
“MEASURING” RISK
For non-traditional assets, we use other risk proxies which focus on potential for loss (“down-side”volatility)
“Value-at-Risk” measures expected loss given extreme events It is used to allocate capital to strategies with option-like returns
Risk measures are not forecasts of returns
Page 7August 2006 Risk Budgeting and Investment Mgmt
ACTIVE RISK
“Active risk” (aka, Tracking Error) is defined as the volatility of active returns (= portfolio less benchmark return)
Different than “total risk” (see above)It is a measure of how “different” theportfolio is from the benchmarkIt gives an indication of the likely range of active returns around the benchmark
Page 8August 2006 Risk Budgeting and Investment Mgmt
SOURCES OF ACTIVE RISK
Active risk results from any difference between a portfolio and benchmark, e.g., Over/(under) weight securities, industries, sectors, countries, regions, currencies, styles, capitalization size, etc.At the total fund level, it will result from over/(under) weighting an asset class relative to policy weights
Page 9August 2006 Risk Budgeting and Investment Mgmt
LINKING RISK AND RETURN
Managers take active risk – have exposures different than the benchmark – to earn active returnsAll else equal, expected active return is a function of active risk (the size of the differences)Risk (differences from benchmark) is thus the “input” to the investment process, and is carefully managed
Page 10August 2006 Risk Budgeting and Investment Mgmt
BUDGETING RISK
We manage active risk by setting a budget for risk (the investment plan)Similar to any organization which sets a budget for expensesThen we measure risk and compare realized risk to our budgets (plan)We explain variance between plan and actual, and recommend changes if needed
Page 11August 2006 Risk Budgeting and Investment Mgmt
UCRP ACTIVE RISK BUDGET
The active risk budget for the UCRPis 3% annualized tracking error
In every 2 of 3 years, the expected active return will be within +/-3% of the performance benchmark
This level of active risk is:Consistent with historical volatility of UCRPConsistent with other pension plans
Page 12August 2006 Risk Budgeting and Investment Mgmt
UCRP ACTIVE RISK BUDGET
This level of active risk is:Consistent with reasonable budgets for the risk of the asset classes which comprise the fundConsistent with the investment objectivesof the fund (modest value added)Sufficient to allow flexibility in allocating risk to strategies with higher expected return
Note, GEP active risk budget is higher, at 4.5%
Page 13August 2006 Risk Budgeting and Investment Mgmt
ACTIVE VS. TOTAL RISK
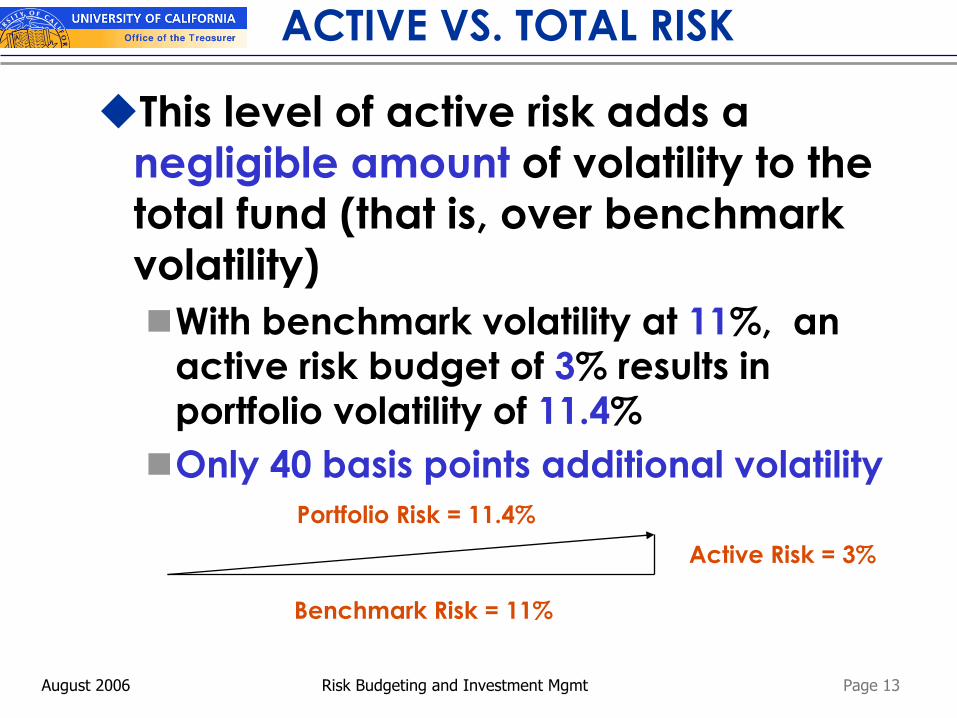
This level of active risk adds a negligible amount of volatility to the total fund (that is, over benchmark volatility)
With benchmark volatility at 11%, an active risk budget of 3% results in portfolio volatility of 11.4%Only 40 basis points additional volatility
Benchmark Risk = 11%
Active Risk = 3%Portfolio Risk = 11.4%

Page 14August 2006 Risk Budgeting and Investment Mgmt
UCRP Monthly Active Returns, 1986-2006
-6
-5
-4
-3
-2
-1
0
1
2
3
4
Jun-
86
Jun-
87
Jun-
88
Jun-
89
Jun-
90
Jun-
91
Jun-
92
Jun-
93
Jun-
94
Jun-
95
Jun-
96
Jun-
97
Jun-
98
Jun-
99
Jun-
00
Jun-
01
Jun-
02
Jun-
03
Jun-
04
Jun-
05
Jun-
06
UCRP Active Mean +1 Std -1 Std +2 Std -2 Std
SUMMARYUCRP Monthly Total Returns, 1986-2006
-20
-15
-10
-5
0
5
10
15
Jun-
86
Jun-
87
Jun-
88
Jun-
89
Jun-
90
Jun-
91
Jun-
92
Jun-
93
Jun-
94
Jun-
95
Jun-
96
Jun-
97
Jun-
98
Jun-
99
Jun-
00
Jun-
01
Jun-
02
Jun-
03
Jun-
04
Jun-
05
Jun-
06
UCRP Total Mean +1 Std -1 Std +2 Std -2 Std
UCRP total return volatility was 11.3% annually, or 3.3% monthly, over 20 year period
UCRP active return volatility was 2.8% annually, or 0.8% monthly, over 20 year period
NOTE DIFFERENT SCALES
Page 15August 2006 Risk Budgeting and Investment Mgmt
UC RISK BUDGETS
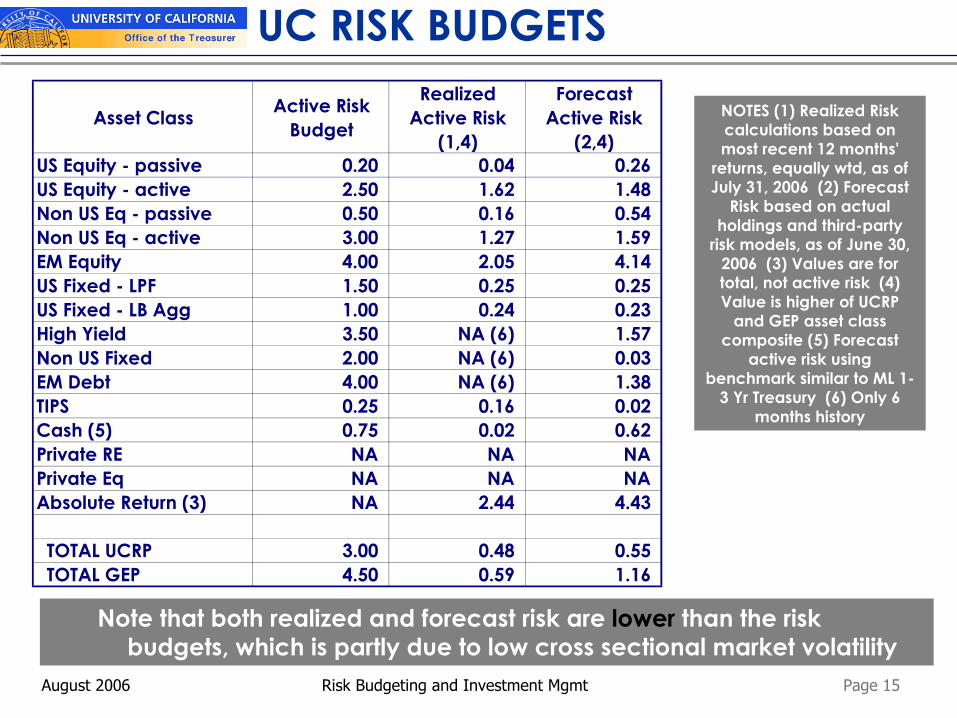
Note that both realized and forecast risk are lower than the risk budgets, which is partly due to low cross sectional market volatility
NOTES (1) Realized Risk calculations based on most recent 12 months'
returns, equally wtd, as of July 31, 2006 (2) Forecast
Risk based on actual holdings and third-party
risk models, as of June 30, 2006 (3) Values are for total, not active risk (4) Value is higher of UCRP
and GEP asset class composite (5) Forecast
active risk using benchmark similar to ML 1-
3 Yr Treasury (6) Only 6 months history
Asset Class Active Risk Budget
Realized Active Risk
(1,4)
Forecast Active Risk
(2,4)US Equity - passive 0.20 0.04 0.26 US Equity - active 2.50 1.62 1.48 Non US Eq - passive 0.50 0.16 0.54 Non US Eq - active 3.00 1.27 1.59 EM Equity 4.00 2.05 4.14 US Fixed - LPF 1.50 0.25 0.25 US Fixed - LB Agg 1.00 0.24 0.23 High Yield 3.50 NA (6) 1.57 Non US Fixed 2.00 NA (6) 0.03 EM Debt 4.00 NA (6) 1.38 TIPS 0.25 0.16 0.02 Cash (5) 0.75 0.02 0.62 Private RE NA NA NAPrivate Eq NA NA NAAbsolute Return (3) NA 2.44 4.43
TOTAL UCRP 3.00 0.48 0.55 TOTAL GEP 4.50 0.59 1.16
Page 16August 2006 Risk Budgeting and Investment Mgmt
CHANGING THE BUDGET
When would a risk budget change?Overall risk tolerance of the Committee changesOpportunities in active strategies expand or contractOverall level of market volatility or cross sectional volatility changes
Page 17August 2006 Risk Budgeting and Investment Mgmt
VALUE OF RISK BUDGETS
The innovation of risk management is a common framework and uniform metric to quantify all investment decisionsAllowing us to trade-off risk in one area with risk in anotherIf we have “used up” our risk budget, we must reduce risk in oneor more strategies in order to take risk in another one

Page 18August 2006 Risk Budgeting and Investment Mgmt
EXAMPLE: ACTIVE EQUITY
50% of US Equity allocation is actively managed
Assume passive has zero active risk Is that the right amount for active?Depends on the risk level of the active portfolios
Enhanced, risk controlled active3% tracking error –> total has 1.5% TE
Traditional, concentrated active10% tracking error –> total has 5.0% TE
Page 19August 2006 Risk Budgeting and Investment Mgmt
VALUE OF RISK BUDGETS
Enable more efficient use of risk, by linking expected return to risk
Better than traditional guidelines and constraints
Aid in asset allocation and manager structure decisionsEnsure risk is used intentionally and compensated adequatelyQuality control for the main input to the investment process
Page 20August 2006 Risk Budgeting and Investment Mgmt
SUMMARY
The essence of investment management is the management of risk, not the management of return
Benjamin Graham
APPENDIX 1: EXAMPLE OF RISK BUDGETING
Committee on Investments / Investment Advisory Committee
August 24, 2006
Page 22August 2006 Risk Budgeting and Investment Mgmt
WHY RISK BUDGETING?
Large institutional investors typically maintain a passive (core, low-cost) equity allocationWhat should be the percentage of passive vs. actively managed assets?Better question: what is desired amount of active risk in the fund?Assumes “amount of risk” can be quantified
Page 23August 2006 Risk Budgeting and Investment Mgmt
TRADITIONAL MGMT OF RISK
Managing investments has always been about managing riskTraditionally done with inefficient guidelines and constraints
E.g., position and sector limits; limits on manager size, long only constraint; no derivatives; credit limits
These are all examples of risk proxiesWhy not manage the risk factors directly, and link risk to expected return?
Page 24August 2006 Risk Budgeting and Investment Mgmt
WHY IS THIS INEFFICIENT?
Constraints are proxies for risk; crude(but sometimes effective) risk controlsThey don’t account for actual contribution to risk of different positionsConstraints don’t account for volatility, correlations, or hedgesConstraints cannot be combined or traded off against each other
Page 25August 2006 Risk Budgeting and Investment Mgmt
RISK BUDGETING APPROACH
Measure risk using a uniform metric for all types of decisionsSet overall limits on that metricFlow-down to underlying componentsor decisions
Based on contribution of each component or decision to total risk
Allows risk to be fungibleAnd for decision makers to shift riskexposures to capture expected returns
Page 26August 2006 Risk Budgeting and Investment Mgmt
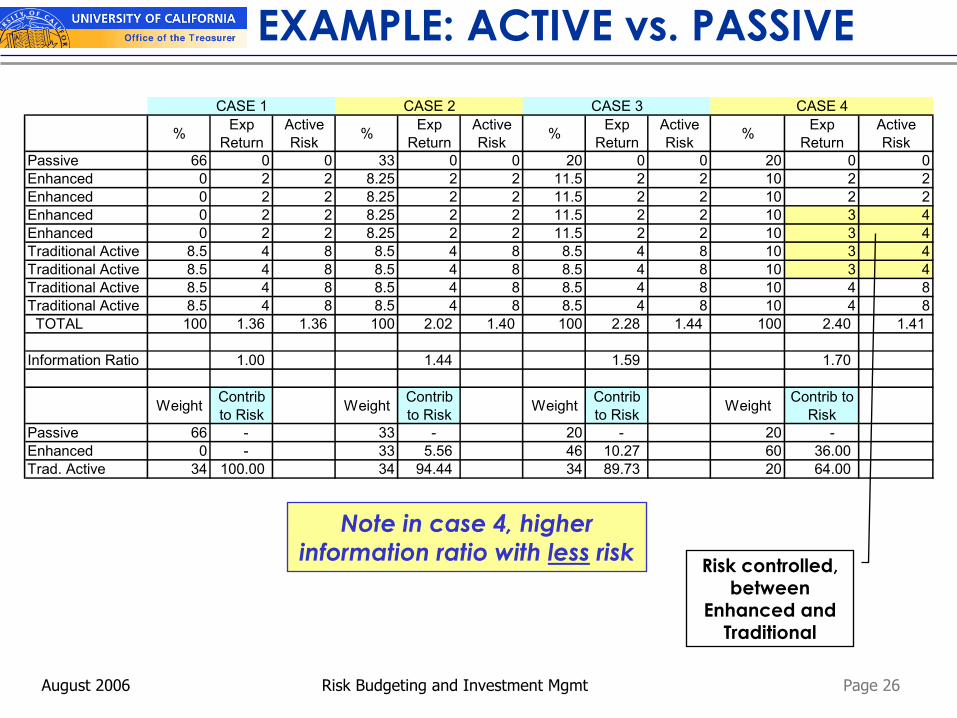
EXAMPLE: ACTIVE vs. PASSIVE
Note in case 4, higher information ratio with less risk
% Exp Return
Active Risk % Exp
ReturnActive Risk % Exp
ReturnActive Risk % Exp
ReturnActive Risk
Passive 66 0 0 33 0 0 20 0 0 20 0 0Enhanced 0 2 2 8.25 2 2 11.5 2 2 10 2 2Enhanced 0 2 2 8.25 2 2 11.5 2 2 10 2 2Enhanced 0 2 2 8.25 2 2 11.5 2 2 10 3 4Enhanced 0 2 2 8.25 2 2 11.5 2 2 10 3 4Traditional Active 8.5 4 8 8.5 4 8 8.5 4 8 10 3 4Traditional Active 8.5 4 8 8.5 4 8 8.5 4 8 10 3 4Traditional Active 8.5 4 8 8.5 4 8 8.5 4 8 10 4 8Traditional Active 8.5 4 8 8.5 4 8 8.5 4 8 10 4 8 TOTAL 100 1.36 1.36 100 2.02 1.40 100 2.28 1.44 100 2.40 1.41
Information Ratio 1.00 1.44 1.59 1.70
Weight Contrib to Risk Weight Contrib
to Risk Weight Contrib to Risk Weight Contrib to
RiskPassive 66 - 33 - 20 - 20 - Enhanced 0 - 33 5.56 46 10.27 60 36.00 Trad. Active 34 100.00 34 94.44 34 89.73 20 64.00
CASE 1 CASE 2 CASE 3 CASE 4
Risk controlled, between
Enhanced and Traditional
Page 27August 2006 Risk Budgeting and Investment Mgmt
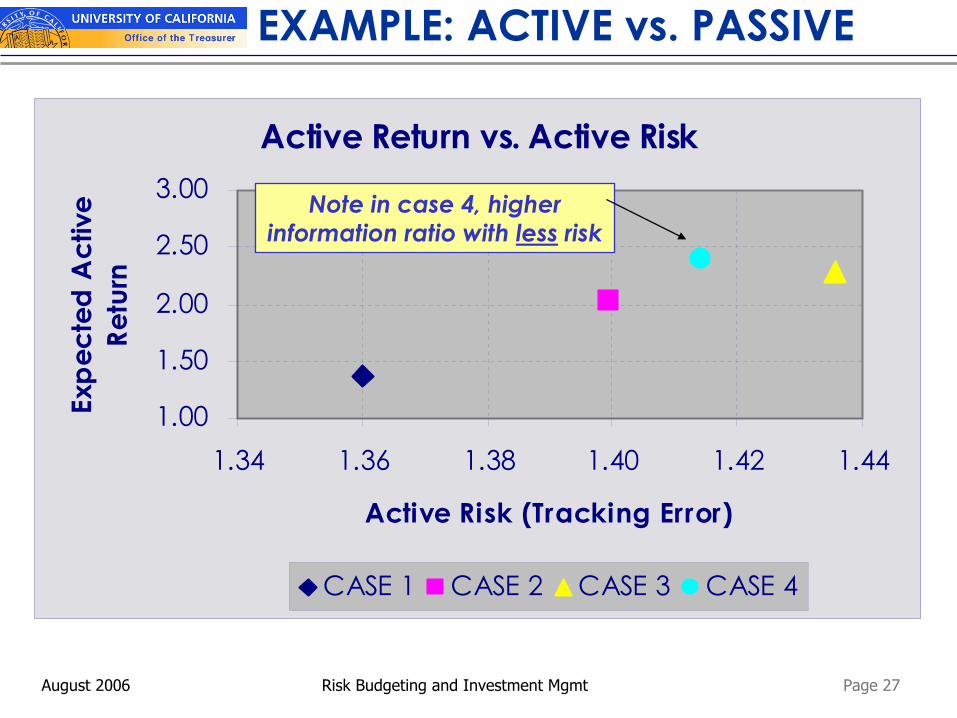
Active Return vs. Active Risk
1.00
1.50
2.00
2.50
3.00
1.34 1.36 1.38 1.40 1.42 1.44
Active Risk (Tracking Error)
Expe
cted
Act
ive
Retu
rn
CASE 1 CASE 2 CASE 3 CASE 4
EXAMPLE: ACTIVE vs. PASSIVE
Note in case 4, higher information ratio with less risk
Page 28August 2006 Risk Budgeting and Investment Mgmt
BASIC PRINCIPLE
Allocate risk to decisions / sectors in proportion to expected returnsResults in a more efficient use of risk
Suppose the ratio [return ÷ contrib. to risk] for first view is greater than ratio for second viewThen we can increase size of first view relative to second viewAnd have a higher expected return per unit of risk (“information ratio”)
Page 29August 2006 Risk Budgeting and Investment Mgmt
STEPS IN RISK BUDGETING
Determine desired active returnDetermine achievable information ratio
Based on skill in manager / security selection and degree of diversification
Calculate aggregate active risk budgetActive risk = Desired active return ÷ IR
Determine degree of skill in each component (e.g., asset class) of total fundAllocate active risk budget to each component
Based on expected return, risk, and correlations among strategies
Page 30August 2006 Risk Budgeting and Investment Mgmt
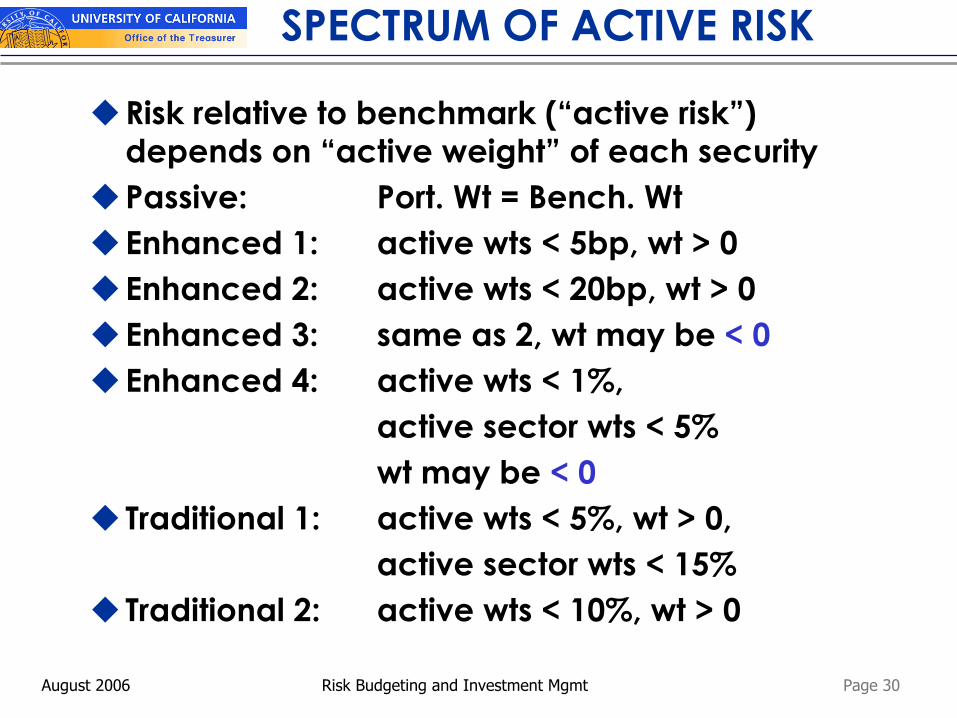
SPECTRUM OF ACTIVE RISK
Risk relative to benchmark (“active risk”) depends on “active weight” of each securityPassive: Port. Wt = Bench. WtEnhanced 1: active wts < 5bp, wt > 0Enhanced 2: active wts < 20bp, wt > 0Enhanced 3: same as 2, wt may be < 0Enhanced 4: active wts < 1%,
active sector wts < 5%wt may be < 0
Traditional 1: active wts < 5%, wt > 0,active sector wts < 15%
Traditional 2: active wts < 10%, wt > 0
APPENDIX 2: HOW RISK BUDGETS ARE DETERMINED
Committee on Investments / Investment Advisory Committee
August 24, 2006
Page 32August 2006 Risk Budgeting and Investment Mgmt
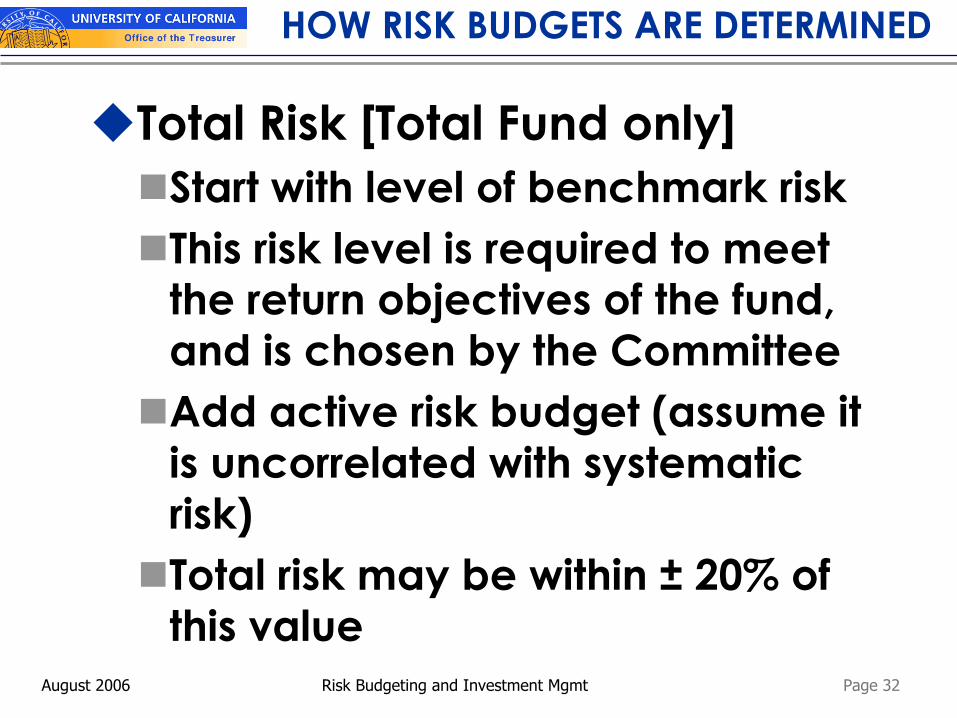
HOW RISK BUDGETS ARE DETERMINED
Total Risk [Total Fund only]Start with level of benchmark riskThis risk level is required to meet the return objectives of the fund, and is chosen by the CommitteeAdd active risk budget (assume it is uncorrelated with systematic risk)Total risk may be within ± 20% of this value

Page 33August 2006 Risk Budgeting and Investment Mgmt
HOW RISK BUDGETS ARE DETERMINED
Active Risk - Asset ClassConsider realized volatility and correlations of managers in each asset class over several cyclesConsider expected (or actual) number of managers in each asset classCombine current (or potential) managers’ risks and correlations at current (or potential) weightsRisk budget of combination will be smaller than average manager risk
Page 34August 2006 Risk Budgeting and Investment Mgmt
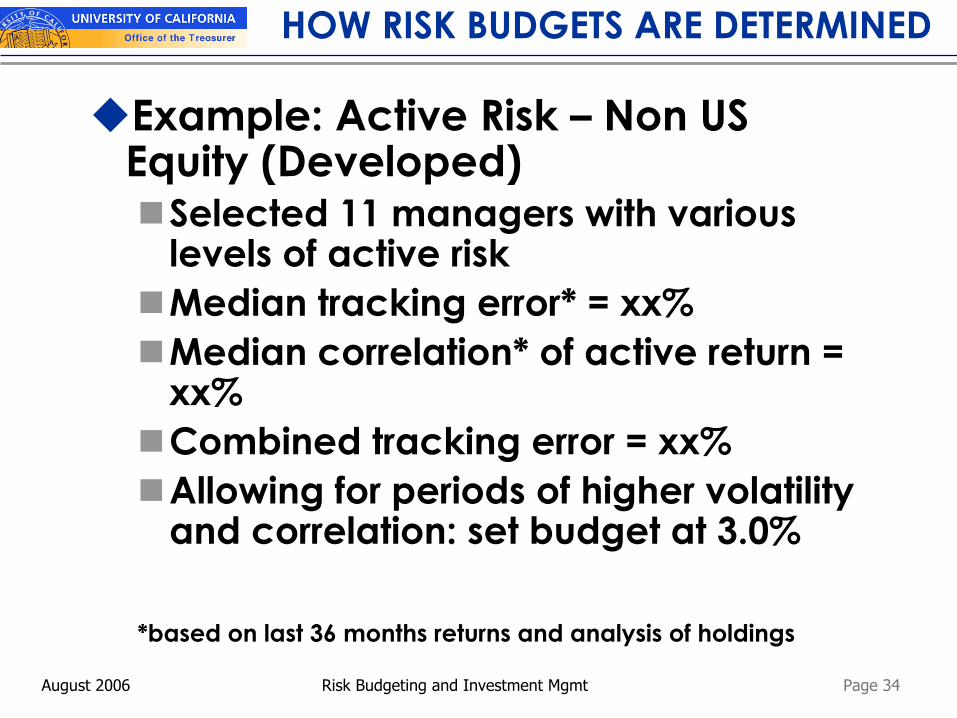
HOW RISK BUDGETS ARE DETERMINED
Example: Active Risk – Non US Equity (Developed)
Selected 11 managers with various levels of active riskMedian tracking error* = xx%Median correlation* of active return = xx%Combined tracking error = xx%Allowing for periods of higher volatility and correlation: set budget at 3.0%
*based on last 36 months returns and analysis of holdings
Page 35August 2006 Risk Budgeting and Investment Mgmt
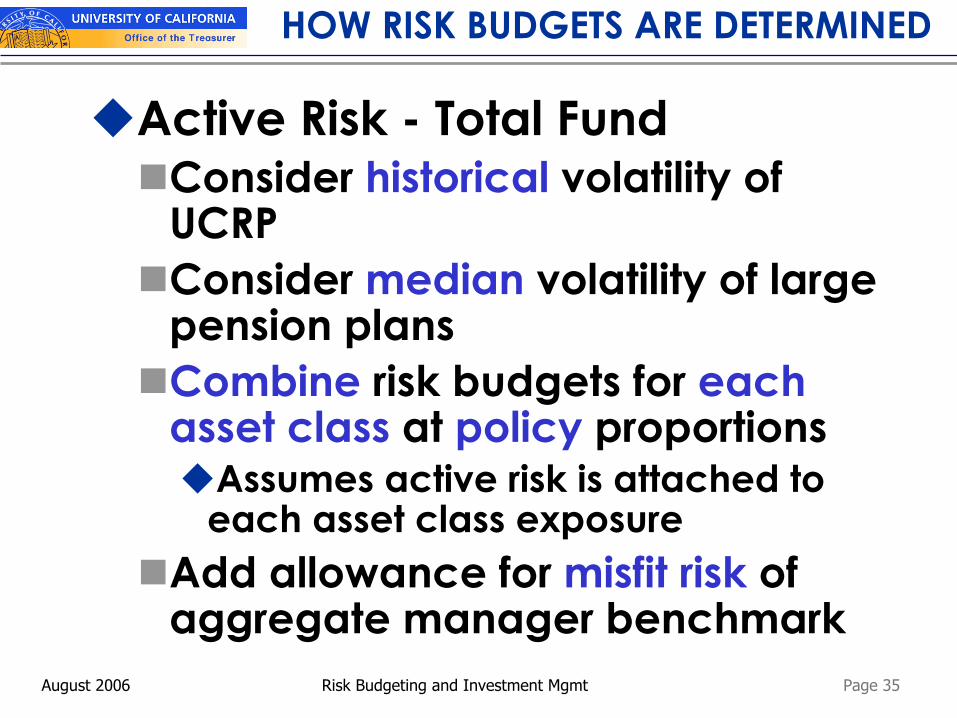
HOW RISK BUDGETS ARE DETERMINED
Active Risk - Total FundConsider historical volatility of UCRPConsider median volatility of large pension plansCombine risk budgets for each asset class at policy proportions
Assumes active risk is attached to each asset class exposure
Add allowance for misfit risk of aggregate manager benchmark
Page 36August 2006 Risk Budgeting and Investment Mgmt
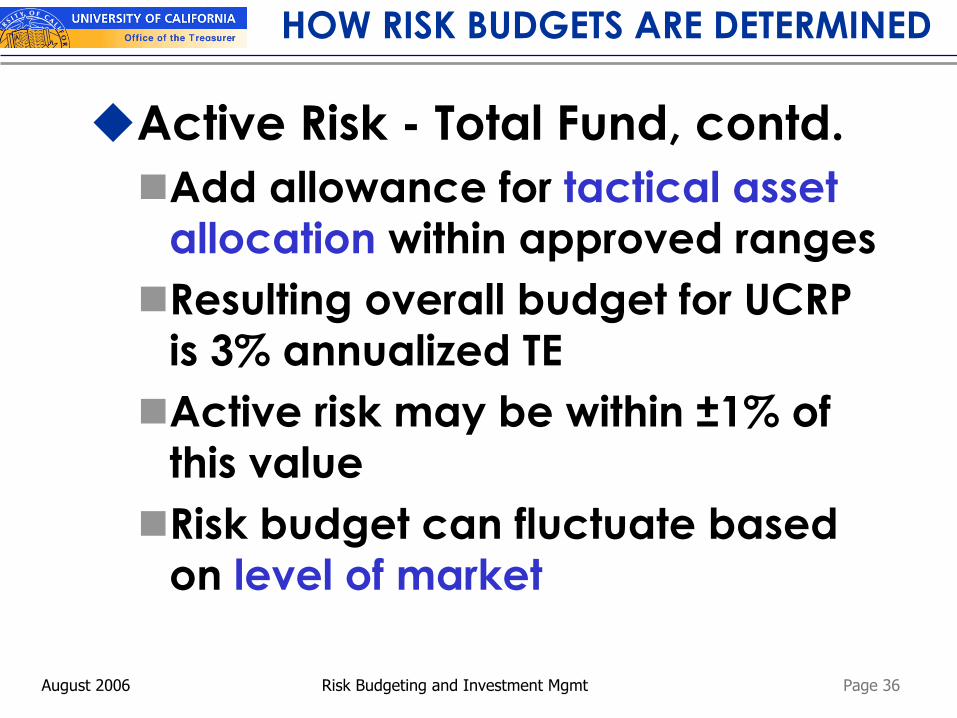
HOW RISK BUDGETS ARE DETERMINED
Active Risk - Total Fund, contd.Add allowance for tactical asset allocation within approved rangesResulting overall budget for UCRP is 3% annualized TEActive risk may be within ±1% of this valueRisk budget can fluctuate based on level of market


![3.3.5 Msa Kisangani Railway Ext Aug06 - En - Cleaned[1]](https://img.pdfslide.net/doc/110x75/577cdb651a28ab9e78a80ff5/335-msa-kisangani-railway-ext-aug06-en-cleaned1.jpg)