Embed Size (px)
Citation preview

163
Wadden Sea Ecosystem No. 19 - 2005
7. Salt Marshes
7.1 IntroductionSalt marshes form the upper parts of the intertid-al zone, the interface between land and sea, andare strongly controlled by geomorphological, phys-ical and biological processes, such as sedimenta-tion in interaction with the vegetation, tidal re-gime and wind-wave pattern. They constitute ahabitat for a wide range of organisms. On a Euro-pean scale, among 1,068 plant species that arebound to coastal habitats, nearly 200 are restrict-ed to salt marshes (van der Maarel and van derMaarel-Versluys, 1996). The highest species diver-sity in salt marshes is found among the inverte-brate fauna; about 1,500 arthropod species in-habit salt marshes of which a considerable num-ber are restricted to this habitat (Heydemann,1981). Salt marshes provide resting, breeding andfeeding grounds for a number of birds. Coastalwaders which feed on the intertidal flats use thesalt marshes as roost during high tide (Meltofteet al., 1994; Ens et al., 1999; Koffijberg et al., 2003).A number of migratory birds such as brent gooseand barnacle goose use the salt marshes to re-plenish their body reserves to reach their north-ern breeding grounds (Madsen et al., 1999; Blewet al., 2005). There are various human activitieswhich have or may have an impact on salt marsh-es, including coastal defense measures, land useand management (grazing, cutting), pollution andeutrophication, fisheries, hunting and tourism (fordetails see 1999 QSR).
7.1.1 Protection and managementMainland salt marshes have been embanked forcenturies and the extent today is only the relic ofa previous widespread transition zone betweenfresh, brackish and saline habitats. Nowadays, allsalt marshes in the Wadden Sea area are undernational nature protection. Besides the nationallegislation and nature protection regulations, theWadden Sea Plan with specific targets for the saltmarshes provides the framework for the habitatmanagement (Trilateral Wadden Sea Plan, 1997).The aim is to maintain and, where possible, toextend the area of salt marshes. In general, it isthe aim to reduce human interference with saltmarshes and to enhance natural development byreducing the intensity of drainage and grazing inorder to gain a high biodiversity in the entire Wad-den Sea Area. Coastal protection activities, suchas protection of salt marsh edges or seawall rein-
Jan P. BakkerJürn Bunje
Kees DijkemaJohn Frikke
Norbert HeckerBas Kers
Peter KörberJörn Kohlus
Martin Stock
Targets• An increased area of natural salt marshes
• An increased natural morphology and dynam-ics, including natural drainage patterns, ofartificial salt marshes, under the conditionthat the present area is not reduced
• An improved natural vegetation structure,including the pioneer zone, of artificial saltmarshes
• Favorable conditions for migrating and breed-ing birds
Salt marsh on Hallig Gröde(Photo: M. Stock)
164
Wadden Sea Ecosystem No. 19 - 2005
forcement, are carried out in coordination withnature protection needs, e.g. by applying Best En-vironmental Practice (Policy Assessment Report2001; see also chapter 2.1 ‘Coastal Defense’).
Salt marshes are also protected within the ECHabitats Directive (Annex I habitat types 1310 Sal-icornia, 1320 Spartina swards, 1330 Atlantic saltmeadows) which provides a European network ofspecial areas of conservation ‘Natura 2000’ (Balzeret al., 2002).
7.1.2 Outcome of the 1999 QSRThe salt marsh chapter of the QSR 1999 focusedon a description of the salt marsh types found inthe Wadden Sea area and on human influenceson the habitat. Data from Dijkema et al. (1984)concerning surface area, geomorphological type,management, threats and protection of all saltmarsh sites was updated (van Duin et al., 1999).The main conclusion was that progress has beenmade in improving the natural situation in (artifi-cial/man-made) salt marshes with respect to geo-morphology, dynamics and vegetation and a re-duction of livestock grazing has been achieved.De-embankment of summer polders was consid-ered a good practice to increase the salt marsharea and maintain the sediment balance of thetidal area. The 1999 QSR also observed that har-monized quality criteria for salt marshes and acomprehensive inventory of actual data were stillmissing.
7.2. Status7.2.1 Total area of salt marsh types
Salt marshes develop in close interaction of hy-drodynamic processes with vegetation develop-
ment and can be distinguished in relation to theirgeomorphologic features (Dijkema, 1987). On theislands, four types could be distinguished. Barri-er-connected salt marshes develop on the lee sideof the sand dune system of the barrier islands.Green beaches are salt marshes which developedon the North Sea side of the islands. In additionto the categories in the 1999 QSR, salt marshes insummer polders and in de-embanked summerpolders have been included.
On the mainland, foreland marsh (including theestuarine salt marshes), salt marshes in summerpolders and de-embanked (summer) polders arethe main salt marsh types. Most foreland marsheshave been developed from sedimentation fieldsprotected by brushwood groynes. As a special case,the salt marshes in St. Peter-Ording (Schleswig-Holstein) and Skallingen (Denmark) have beenadded as barrier-connected type, because theyhave developed in the shelter of a beach-barriersystem comparable to the barrier islands.
Hallig salt marshes have been accreted on sur-viving parts of marshes flooded in the past andare highly exposed to wave energy. They repre-sent a separate type as they resemble more themainland foreland type.
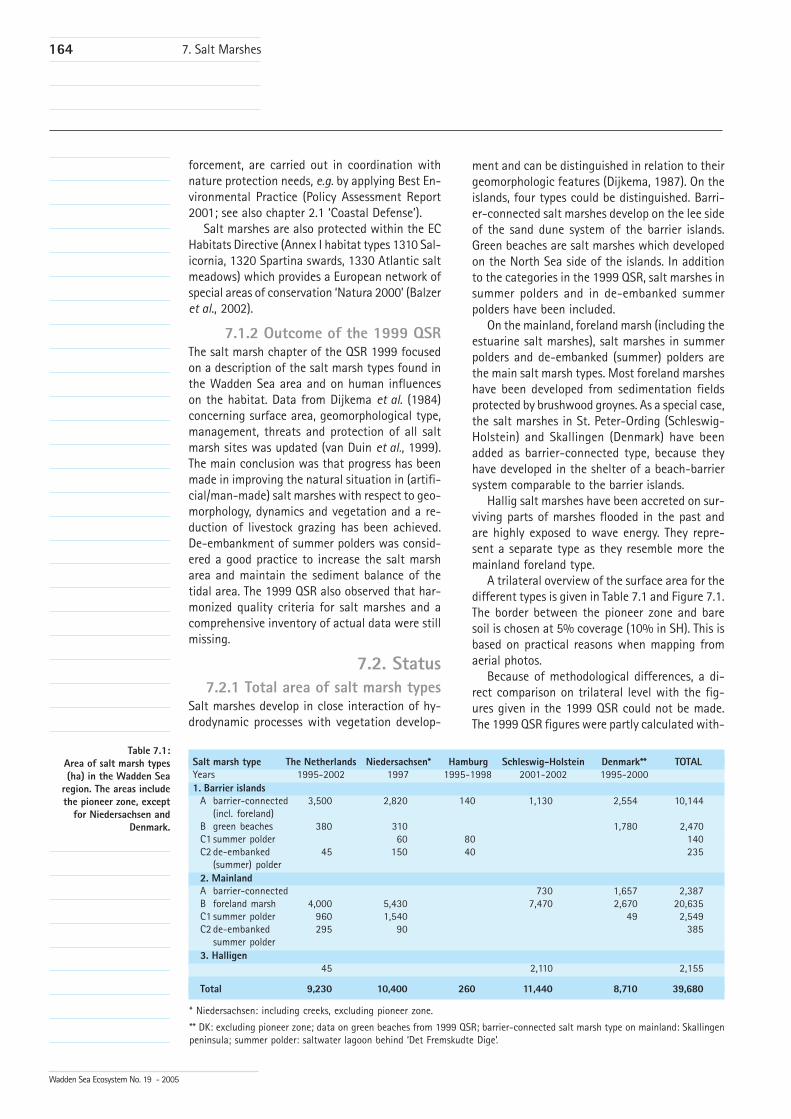
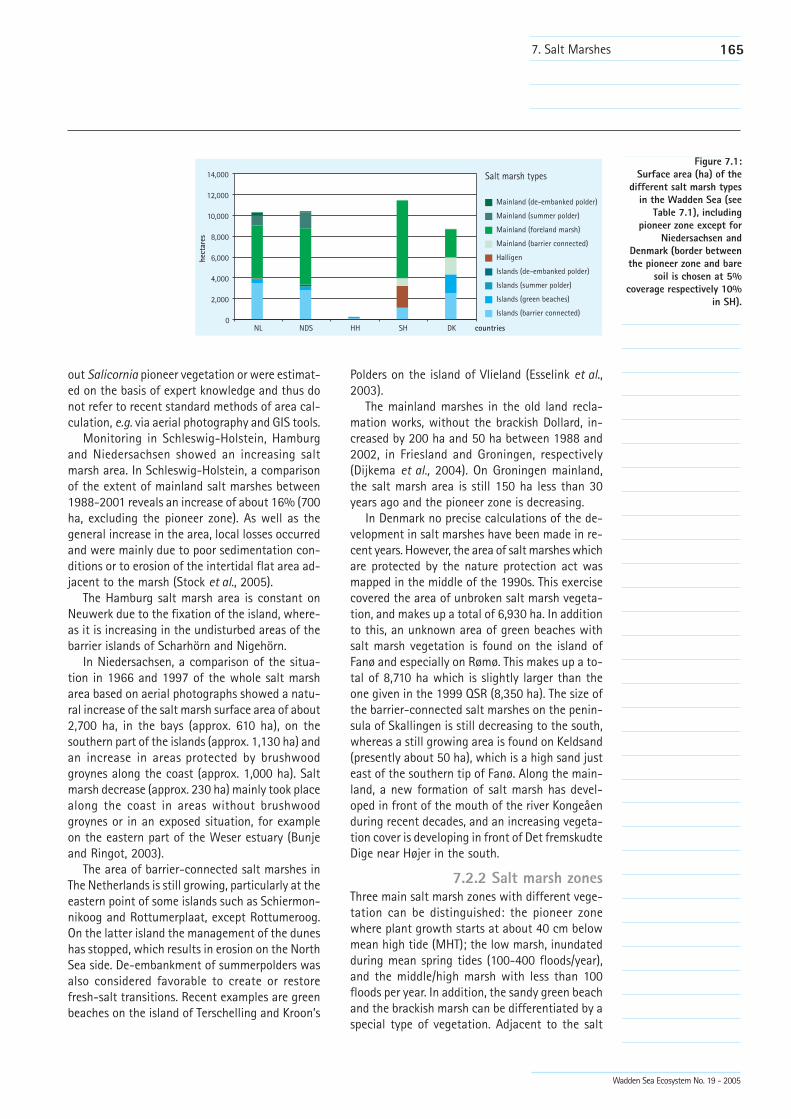
A trilateral overview of the surface area for thedifferent types is given in Table 7.1 and Figure 7.1.The border between the pioneer zone and baresoil is chosen at 5% coverage (10% in SH). This isbased on practical reasons when mapping fromaerial photos.
Because of methodological differences, a di-rect comparison on trilateral level with the fig-ures given in the 1999 QSR could not be made.The 1999 QSR figures were partly calculated with-
Salt marsh type The Netherlands Niedersachsen* Hamburg Schleswig-Holstein Denmark** TOTALYears 1995-2002 1997 1995-1998 2001-2002 1995-20001. Barrier islands
A barrier-connected 3,500 2,820 140 1,130 2,554 10,144(incl. foreland)
B green beaches 380 310 1,780 2,470C1 summer polder 60 80 140C2 de-embanked 45 150 40 235
(summer) polder2. MainlandA barrier-connected 730 1,657 2,387B foreland marsh 4,000 5,430 7,470 2,670 20,635C1 summer polder 960 1,540 49 2,549C2 de-embanked 295 90 385
summer polder3. Halligen 45 2,110 2,155
Total 9,230 10,400 260 11,440 8,710 39,680
* Niedersachsen: including creeks, excluding pioneer zone.
** DK: excluding pioneer zone; data on green beaches from 1999 QSR; barrier-connected salt marsh type on mainland: Skallingenpeninsula; summer polder: saltwater lagoon behind ‘Det Fremskudte Dige’.
Table 7.1:Area of salt marsh types(ha) in the Wadden Sea
region. The areas includethe pioneer zone, except
for Niedersachsen andDenmark.
7. Salt Marshes
165
Wadden Sea Ecosystem No. 19 - 2005
out Salicornia pioneer vegetation or were estimat-ed on the basis of expert knowledge and thus donot refer to recent standard methods of area cal-culation, e.g. via aerial photography and GIS tools.
Monitoring in Schleswig-Holstein, Hamburgand Niedersachsen showed an increasing saltmarsh area. In Schleswig-Holstein, a comparisonof the extent of mainland salt marshes between1988-2001 reveals an increase of about 16% (700ha, excluding the pioneer zone). As well as thegeneral increase in the area, local losses occurredand were mainly due to poor sedimentation con-ditions or to erosion of the intertidal flat area ad-jacent to the marsh (Stock et al., 2005).
The Hamburg salt marsh area is constant onNeuwerk due to the fixation of the island, where-as it is increasing in the undisturbed areas of thebarrier islands of Scharhörn and Nigehörn.
In Niedersachsen, a comparison of the situa-tion in 1966 and 1997 of the whole salt marsharea based on aerial photographs showed a natu-ral increase of the salt marsh surface area of about2,700 ha, in the bays (approx. 610 ha), on thesouthern part of the islands (approx. 1,130 ha) andan increase in areas protected by brushwoodgroynes along the coast (approx. 1,000 ha). Saltmarsh decrease (approx. 230 ha) mainly took placealong the coast in areas without brushwoodgroynes or in an exposed situation, for exampleon the eastern part of the Weser estuary (Bunjeand Ringot, 2003).
The area of barrier-connected salt marshes inThe Netherlands is still growing, particularly at theeastern point of some islands such as Schiermon-nikoog and Rottumerplaat, except Rottumeroog.On the latter island the management of the duneshas stopped, which results in erosion on the NorthSea side. De-embankment of summerpolders wasalso considered favorable to create or restorefresh-salt transitions. Recent examples are greenbeaches on the island of Terschelling and Kroon’s
Polders on the island of Vlieland (Esselink et al.,2003).
The mainland marshes in the old land recla-mation works, without the brackish Dollard, in-creased by 200 ha and 50 ha between 1988 and2002, in Friesland and Groningen, respectively(Dijkema et al., 2004). On Groningen mainland,the salt marsh area is still 150 ha less than 30years ago and the pioneer zone is decreasing.
In Denmark no precise calculations of the de-velopment in salt marshes have been made in re-cent years. However, the area of salt marshes whichare protected by the nature protection act wasmapped in the middle of the 1990s. This exercisecovered the area of unbroken salt marsh vegeta-tion, and makes up a total of 6,930 ha. In additionto this, an unknown area of green beaches withsalt marsh vegetation is found on the island ofFanø and especially on Rømø. This makes up a to-tal of 8,710 ha which is slightly larger than theone given in the 1999 QSR (8,350 ha). The size ofthe barrier-connected salt marshes on the penin-sula of Skallingen is still decreasing to the south,whereas a still growing area is found on Keldsand(presently about 50 ha), which is a high sand justeast of the southern tip of Fanø. Along the main-land, a new formation of salt marsh has devel-oped in front of the mouth of the river Kongeåenduring recent decades, and an increasing vegeta-tion cover is developing in front of Det fremskudteDige near Højer in the south.
7.2.2 Salt marsh zonesThree main salt marsh zones with different vege-tation can be distinguished: the pioneer zonewhere plant growth starts at about 40 cm belowmean high tide (MHT); the low marsh, inundatedduring mean spring tides (100-400 floods/year),and the middle/high marsh with less than 100floods per year. In addition, the sandy green beachand the brackish marsh can be differentiated by aspecial type of vegetation. Adjacent to the salt
Figure 7.1:Surface area (ha) of the
different salt marsh typesin the Wadden Sea (see
Table 7.1), includingpioneer zone except for
Niedersachsen andDenmark (border betweenthe pioneer zone and bare
soil is chosen at 5%coverage respectively 10%
in SH).
7. Salt Marshes
�� ��� �� �� �� ��������
������
�
����
���
����
����
����
����
��� ����������������
������������������ �������!
���������"������������!
����������#������ ����!
�����������$�����%���� ����!
�����"��
&������������������ �������!
&���������' ������������!
&����������#������ ����!
&�����������$�����%���� ����!
166
Wadden Sea Ecosystem No. 19 - 2005
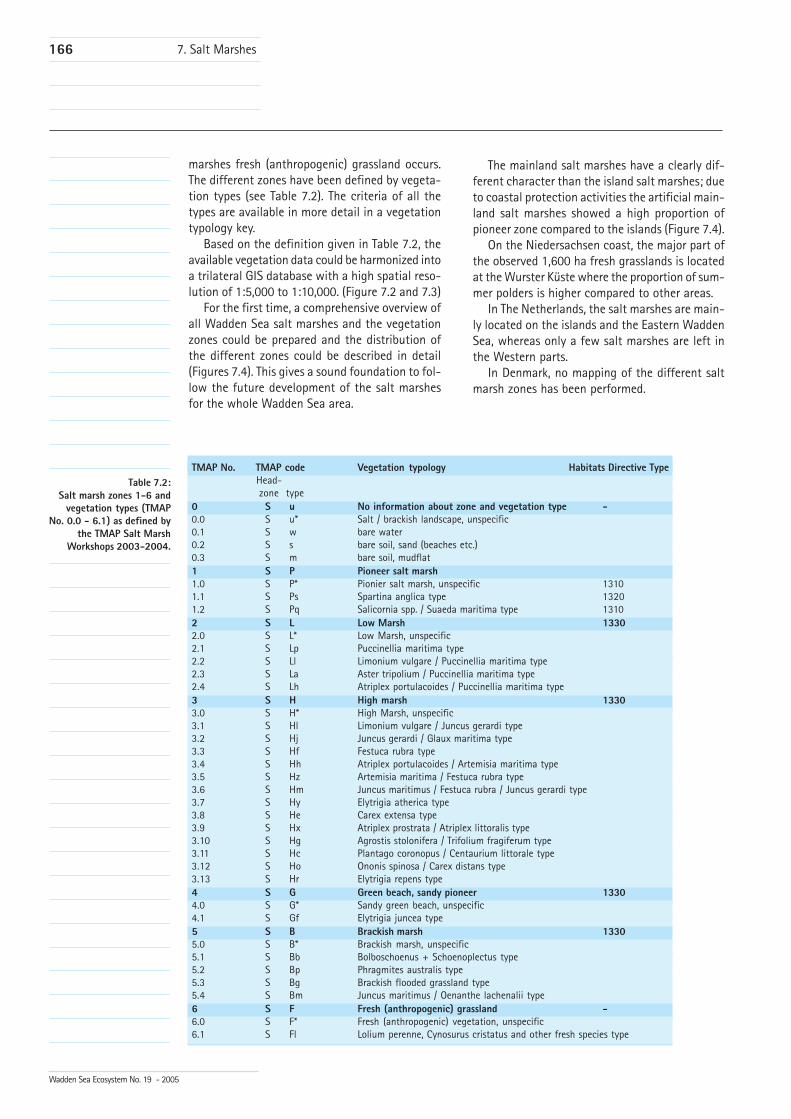
marshes fresh (anthropogenic) grassland occurs.The different zones have been defined by vegeta-tion types (see Table 7.2). The criteria of all thetypes are available in more detail in a vegetationtypology key.
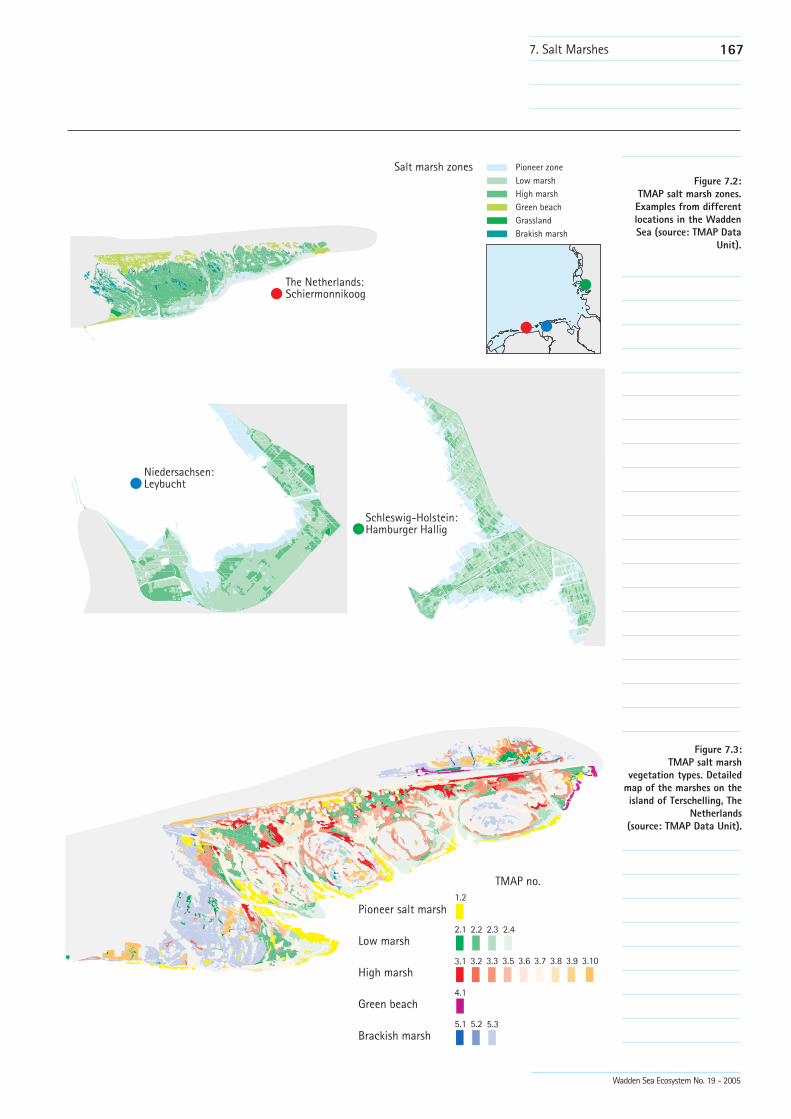
Based on the definition given in Table 7.2, theavailable vegetation data could be harmonized intoa trilateral GIS database with a high spatial reso-lution of 1:5,000 to 1:10,000. (Figure 7.2 and 7.3)
For the first time, a comprehensive overview ofall Wadden Sea salt marshes and the vegetationzones could be prepared and the distribution ofthe different zones could be described in detail(Figures 7.4). This gives a sound foundation to fol-low the future development of the salt marshesfor the whole Wadden Sea area.
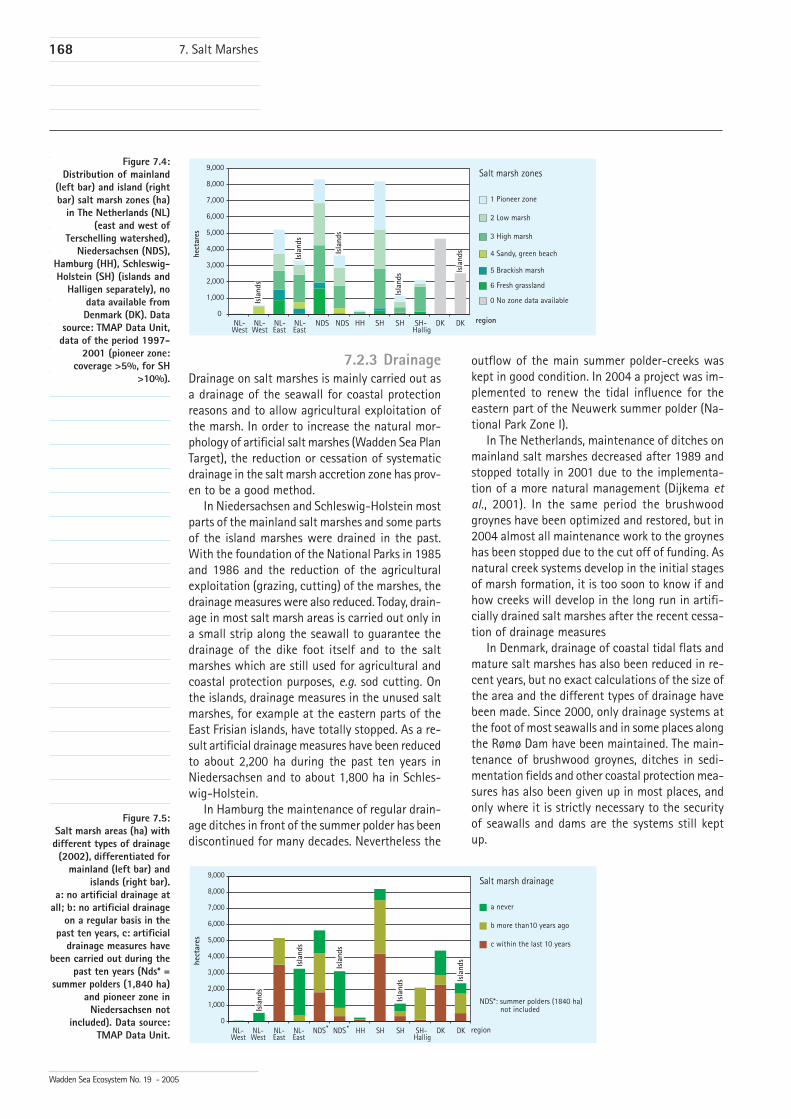
The mainland salt marshes have a clearly dif-ferent character than the island salt marshes; dueto coastal protection activities the artificial main-land salt marshes showed a high proportion ofpioneer zone compared to the islands (Figure 7.4).
On the Niedersachsen coast, the major part ofthe observed 1,600 ha fresh grasslands is locatedat the Wurster Küste where the proportion of sum-mer polders is higher compared to other areas.
In The Netherlands, the salt marshes are main-ly located on the islands and the Eastern WaddenSea, whereas only a few salt marshes are left inthe Western parts.
In Denmark, no mapping of the different saltmarsh zones has been performed.
TMAP No. TMAP code Vegetation typology Habitats Directive TypeHead-zone type
0 S u No information about zone and vegetation type -0.0 S u* Salt / brackish landscape, unspecific0.1 S w bare water0.2 S s bare soil, sand (beaches etc.)0.3 S m bare soil, mudflat1 S P Pioneer salt marsh1.0 S P* Pionier salt marsh, unspecific 13101.1 S Ps Spartina anglica type 13201.2 S Pq Salicornia spp. / Suaeda maritima type 13102 S L Low Marsh 13302.0 S L* Low Marsh, unspecific2.1 S Lp Puccinellia maritima type2.2 S Ll Limonium vulgare / Puccinellia maritima type2.3 S La Aster tripolium / Puccinellia maritima type2.4 S Lh Atriplex portulacoides / Puccinellia maritima type3 S H High marsh 13303.0 S H* High Marsh, unspecific3.1 S Hl Limonium vulgare / Juncus gerardi type3.2 S Hj Juncus gerardi / Glaux maritima type3.3 S Hf Festuca rubra type3.4 S Hh Atriplex portulacoides / Artemisia maritima type3.5 S Hz Artemisia maritima / Festuca rubra type3.6 S Hm Juncus maritimus / Festuca rubra / Juncus gerardi type3.7 S Hy Elytrigia atherica type3.8 S He Carex extensa type3.9 S Hx Atriplex prostrata / Atriplex littoralis type3.10 S Hg Agrostis stolonifera / Trifolium fragiferum type3.11 S Hc Plantago coronopus / Centaurium littorale type3.12 S Ho Ononis spinosa / Carex distans type3.13 S Hr Elytrigia repens type4 S G Green beach, sandy pioneer 13304.0 S G* Sandy green beach, unspecific4.1 S Gf Elytrigia juncea type5 S B Brackish marsh 13305.0 S B* Brackish marsh, unspecific5.1 S Bb Bolboschoenus + Schoenoplectus type5.2 S Bp Phragmites australis type5.3 S Bg Brackish flooded grassland type5.4 S Bm Juncus maritimus / Oenanthe lachenalii type6 S F Fresh (anthropogenic) grassland -6.0 S F* Fresh (anthropogenic) vegetation, unspecific6.1 S Fl Lolium perenne, Cynosurus cristatus and other fresh species type
Table 7.2:Salt marsh zones 1-6 and
vegetation types (TMAPNo. 0.0 - 6.1) as defined by
the TMAP Salt MarshWorkshops 2003-2004.
7. Salt Marshes
167
Wadden Sea Ecosystem No. 19 - 2005
7. Salt Marshes
Figure 7.2:TMAP salt marsh zones.Examples from differentlocations in the WaddenSea (source: TMAP Data
Unit).
Figure 7.3:TMAP salt marsh
vegetation types. Detailedmap of the marshes on theisland of Terschelling, The
Netherlands(source: TMAP Data Unit).
������(�"$� ������)����#�"��������"
*��������������)������� ���% "
�������������)����#���
�����������+ ��� ,� �����+ ��� (��������"�������
-��������.��%���������
-����������
/0 /0/ /01 /0� /02 /0� /03 /0 �/0�
0�
0
10 10� 10/
�0 �0� �0/ �0
,� ���������������
� (������
��"�������
-����������
.���%���������
*&4,�� 0
168
Wadden Sea Ecosystem No. 19 - 2005
7.2.3 DrainageDrainage on salt marshes is mainly carried out asa drainage of the seawall for coastal protectionreasons and to allow agricultural exploitation ofthe marsh. In order to increase the natural mor-phology of artificial salt marshes (Wadden Sea PlanTarget), the reduction or cessation of systematicdrainage in the salt marsh accretion zone has prov-en to be a good method.
In Niedersachsen and Schleswig-Holstein mostparts of the mainland salt marshes and some partsof the island marshes were drained in the past.With the foundation of the National Parks in 1985and 1986 and the reduction of the agriculturalexploitation (grazing, cutting) of the marshes, thedrainage measures were also reduced. Today, drain-age in most salt marsh areas is carried out only ina small strip along the seawall to guarantee thedrainage of the dike foot itself and to the saltmarshes which are still used for agricultural andcoastal protection purposes, e.g. sod cutting. Onthe islands, drainage measures in the unused saltmarshes, for example at the eastern parts of theEast Frisian islands, have totally stopped. As a re-sult artificial drainage measures have been reducedto about 2,200 ha during the past ten years inNiedersachsen and to about 1,800 ha in Schles-wig-Holstein.
In Hamburg the maintenance of regular drain-age ditches in front of the summer polder has beendiscontinued for many decades. Nevertheless the
outflow of the main summer polder-creeks waskept in good condition. In 2004 a project was im-plemented to renew the tidal influence for theeastern part of the Neuwerk summer polder (Na-tional Park Zone I).
In The Netherlands, maintenance of ditches onmainland salt marshes decreased after 1989 andstopped totally in 2001 due to the implementa-tion of a more natural management (Dijkema etal., 2001). In the same period the brushwoodgroynes have been optimized and restored, but in2004 almost all maintenance work to the groyneshas been stopped due to the cut off of funding. Asnatural creek systems develop in the initial stagesof marsh formation, it is too soon to know if andhow creeks will develop in the long run in artifi-cially drained salt marshes after the recent cessa-tion of drainage measures
In Denmark, drainage of coastal tidal flats andmature salt marshes has also been reduced in re-cent years, but no exact calculations of the size ofthe area and the different types of drainage havebeen made. Since 2000, only drainage systems atthe foot of most seawalls and in some places alongthe Rømø Dam have been maintained. The main-tenance of brushwood groynes, ditches in sedi-mentation fields and other coastal protection mea-sures has also been given up in most places, andonly where it is strictly necessary to the securityof seawalls and dams are the systems still keptup.
Figure 7.4:Distribution of mainland
(left bar) and island (rightbar) salt marsh zones (ha)
in The Netherlands (NL)(east and west of
Terschelling watershed),Niedersachsen (NDS),
Hamburg (HH), Schleswig-Holstein (SH) (islands and
Halligen separately), nodata available fromDenmark (DK). Data
source: TMAP Data Unit,data of the period 1997-
2001 (pioneer zone:coverage >5%, for SH
>10%).
Figure 7.5:Salt marsh areas (ha) withdifferent types of drainage(2002), differentiated for
mainland (left bar) andislands (right bar).
a: no artificial drainage atall; b: no artificial drainage
on a regular basis in thepast ten years, c: artificial
drainage measures havebeen carried out during the
past ten years (Nds* =summer polders (1,840 ha)
and pioneer zone inNiedersachsen not
included). Data source:TMAP Data Unit.
7. Salt Marshes
�
���
����
/���
���
1���
����
2���
����
3���
��$5���
��$5���
��$6���
��$6���
��� ��� �� �� �� ��$�����"
�� �� ������
������
����
����
����
����
����
�����������+ ���
��� �+ ���������7�������
��8�����"��������
1�.���%���������
�������"����������
/���"�������
��� (������
�,� �����+ ��
���9)��#������ ������� �����!� ������#���
�
���
����
/���
���
1���
����
2���
����
3���
������
� �
����
����
����
����
����
��"� ���� ��� �� �� �� ��$�����"
�� ����$6���
��$6���
��$5���
��$5���
�����������������"�
����7��
��� ������� ���������"
��(��������������� �������
169
Wadden Sea Ecosystem No. 19 - 2005
7. Salt Marshes
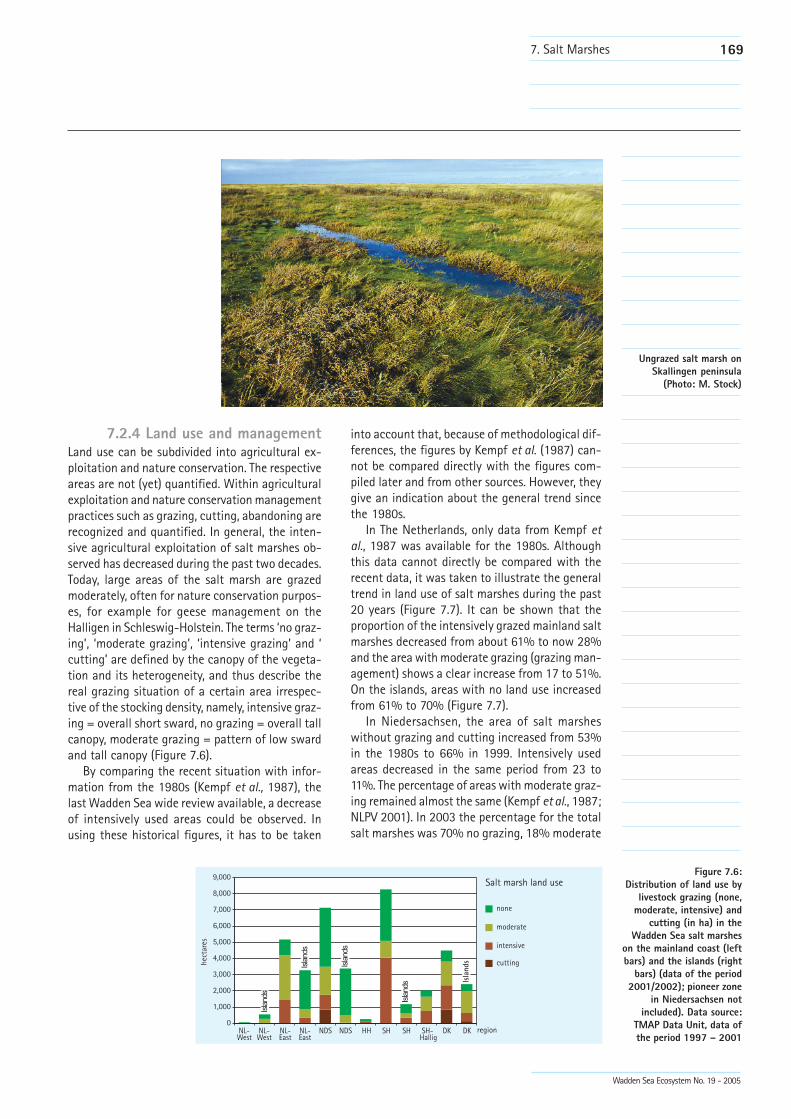
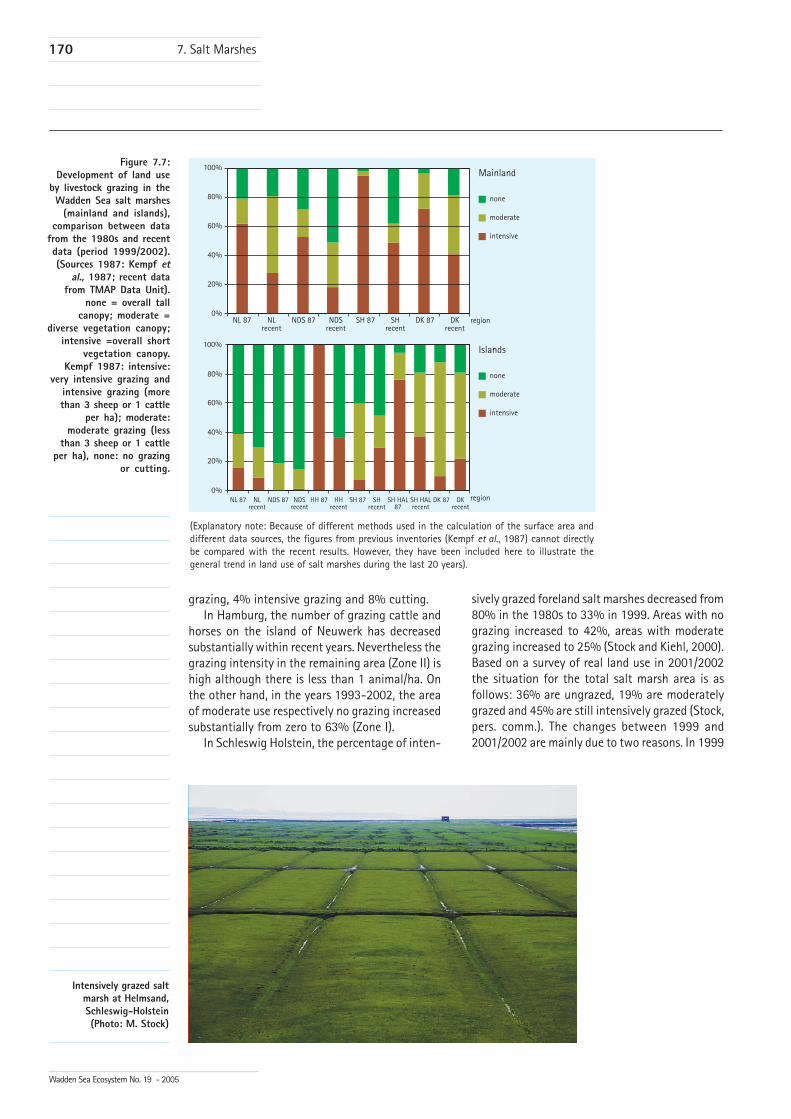
7.2.4 Land use and managementLand use can be subdivided into agricultural ex-ploitation and nature conservation. The respectiveareas are not (yet) quantified. Within agriculturalexploitation and nature conservation managementpractices such as grazing, cutting, abandoning arerecognized and quantified. In general, the inten-sive agricultural exploitation of salt marshes ob-served has decreased during the past two decades.Today, large areas of the salt marsh are grazedmoderately, often for nature conservation purpos-es, for example for geese management on theHalligen in Schleswig-Holstein. The terms ‘no graz-ing’, ‘moderate grazing’, ‘intensive grazing’ and ‘cutting’ are defined by the canopy of the vegeta-tion and its heterogeneity, and thus describe thereal grazing situation of a certain area irrespec-tive of the stocking density, namely, intensive graz-ing = overall short sward, no grazing = overall tallcanopy, moderate grazing = pattern of low swardand tall canopy (Figure 7.6).
By comparing the recent situation with infor-mation from the 1980s (Kempf et al., 1987), thelast Wadden Sea wide review available, a decreaseof intensively used areas could be observed. Inusing these historical figures, it has to be taken
into account that, because of methodological dif-ferences, the figures by Kempf et al. (1987) can-not be compared directly with the figures com-piled later and from other sources. However, theygive an indication about the general trend sincethe 1980s.
In The Netherlands, only data from Kempf etal., 1987 was available for the 1980s. Althoughthis data cannot directly be compared with therecent data, it was taken to illustrate the generaltrend in land use of salt marshes during the past20 years (Figure 7.7). It can be shown that theproportion of the intensively grazed mainland saltmarshes decreased from about 61% to now 28%and the area with moderate grazing (grazing man-agement) shows a clear increase from 17 to 51%.On the islands, areas with no land use increasedfrom 61% to 70% (Figure 7.7).
In Niedersachsen, the area of salt marsheswithout grazing and cutting increased from 53%in the 1980s to 66% in 1999. Intensively usedareas decreased in the same period from 23 to11%. The percentage of areas with moderate graz-ing remained almost the same (Kempf et al., 1987;NLPV 2001). In 2003 the percentage for the totalsalt marshes was 70% no grazing, 18% moderate
Figure 7.6:Distribution of land use by
livestock grazing (none,moderate, intensive) and
cutting (in ha) in theWadden Sea salt marshes
on the mainland coast (leftbars) and the islands (right
bars) (data of the period2001/2002); pioneer zone
in Niedersachsen notincluded). Data source:
TMAP Data Unit, data ofthe period 1997 – 2001
��������
�
���
����
/���
���
1���
����
2���
����
3���
��"� ���� ��� �� �� �� ��$�����"
�� ����$6���
��$6���
��$5���
��$5���
������
�
������
�
������
�
������
� ����
����������������#��
� ��
� ������
�������7�
�#����"
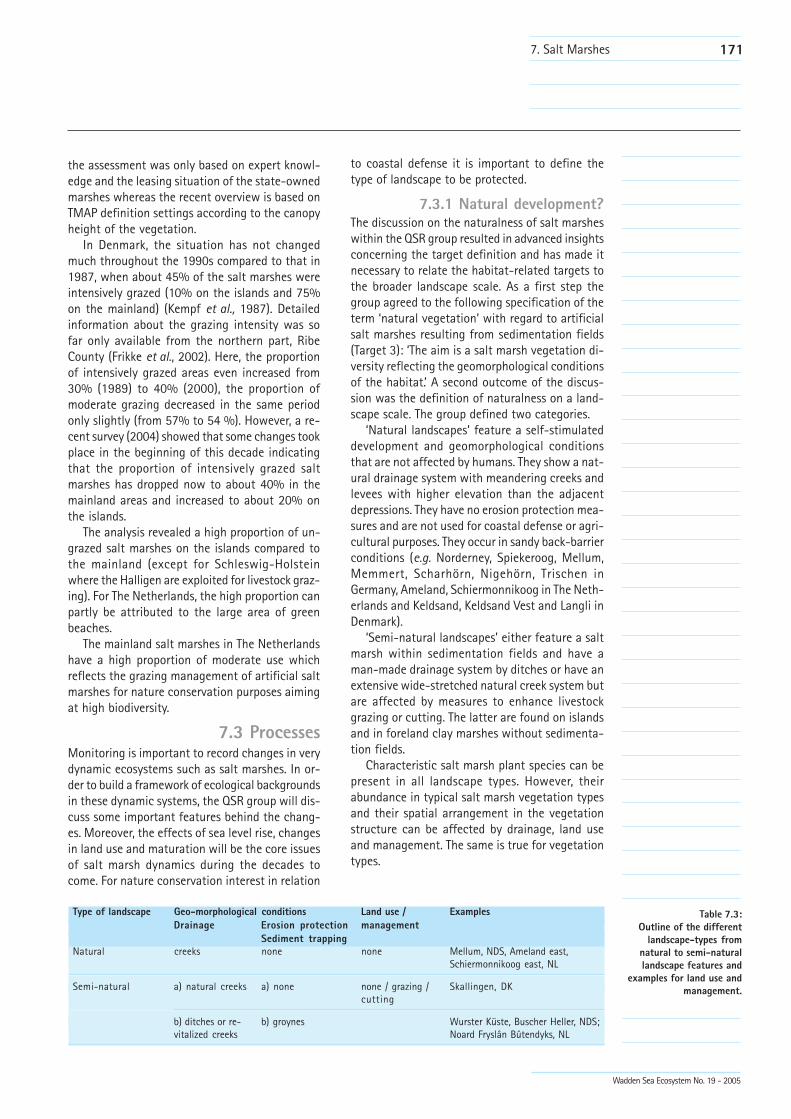
Ungrazed salt marsh onSkallingen peninsula
(Photo: M. Stock)
170
Wadden Sea Ecosystem No. 19 - 2005
grazing, 4% intensive grazing and 8% cutting.In Hamburg, the number of grazing cattle and
horses on the island of Neuwerk has decreasedsubstantially within recent years. Nevertheless thegrazing intensity in the remaining area (Zone II) ishigh although there is less than 1 animal/ha. Onthe other hand, in the years 1993-2002, the areaof moderate use respectively no grazing increasedsubstantially from zero to 63% (Zone I).
In Schleswig Holstein, the percentage of inten-
sively grazed foreland salt marshes decreased from80% in the 1980s to 33% in 1999. Areas with nograzing increased to 42%, areas with moderategrazing increased to 25% (Stock and Kiehl, 2000).Based on a survey of real land use in 2001/2002the situation for the total salt marsh area is asfollows: 36% are ungrazed, 19% are moderatelygrazed and 45% are still intensively grazed (Stock,pers. comm.). The changes between 1999 and2001/2002 are mainly due to two reasons. In 1999
(Explanatory note: Because of different methods used in the calculation of the surface area anddifferent data sources, the figures from previous inventories (Kempf et al., 1987) cannot directlybe compared with the recent results. However, they have been included here to illustrate thegeneral trend in land use of salt marshes during the last 20 years).
Figure 7.7:Development of land use
by livestock grazing in theWadden Sea salt marshes
(mainland and islands),comparison between data
from the 1980s and recentdata (period 1999/2002).(Sources 1987: Kempf et
al., 1987; recent datafrom TMAP Data Unit).
none = overall tallcanopy; moderate =
diverse vegetation canopy;intensive =overall short
vegetation canopy.Kempf 1987: intensive:
very intensive grazing andintensive grazing (morethan 3 sheep or 1 cattle
per ha); moderate:moderate grazing (less
than 3 sheep or 1 cattleper ha), none: no grazing
or cutting.
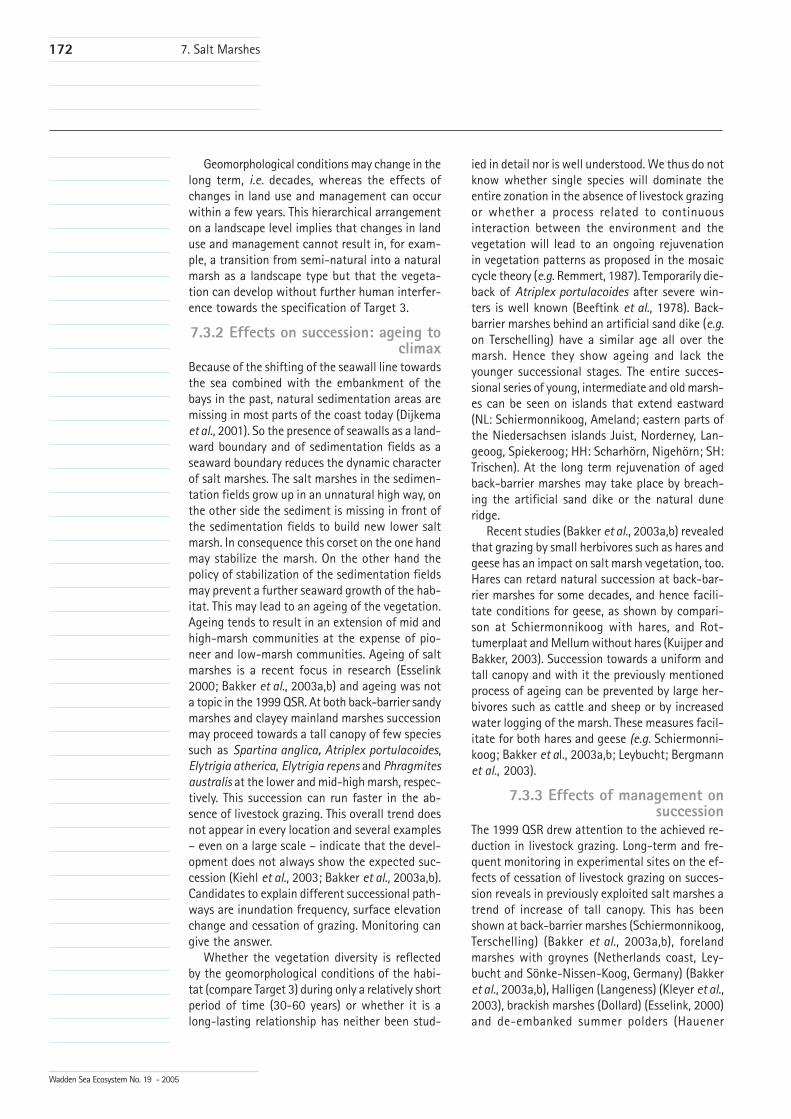
Intensively grazed saltmarsh at Helmsand,Schleswig-Holstein(Photo: M. Stock)
7. Salt Marshes
�:
��:
�:
��:
��:
��:
����2 ��������
�����2 ���������
����2 ��������
����2 ��������
&�������
� ��
� ������
�������7�
��"� �
����2 ��������
�����2 ���������
����2 ��������
����2 ��������
��������
����2 ����4��2
����4�������
�:
��:
�:
��:
��:
��: �������
� ��
� ������
�������7�
��"� �
171
Wadden Sea Ecosystem No. 19 - 2005
the assessment was only based on expert knowl-edge and the leasing situation of the state-ownedmarshes whereas the recent overview is based onTMAP definition settings according to the canopyheight of the vegetation.
In Denmark, the situation has not changedmuch throughout the 1990s compared to that in1987, when about 45% of the salt marshes wereintensively grazed (10% on the islands and 75%on the mainland) (Kempf et al., 1987). Detailedinformation about the grazing intensity was sofar only available from the northern part, RibeCounty (Frikke et al., 2002). Here, the proportionof intensively grazed areas even increased from30% (1989) to 40% (2000), the proportion ofmoderate grazing decreased in the same periodonly slightly (from 57% to 54 %). However, a re-cent survey (2004) showed that some changes tookplace in the beginning of this decade indicatingthat the proportion of intensively grazed saltmarshes has dropped now to about 40% in themainland areas and increased to about 20% onthe islands.
The analysis revealed a high proportion of un-grazed salt marshes on the islands compared tothe mainland (except for Schleswig-Holsteinwhere the Halligen are exploited for livestock graz-ing). For The Netherlands, the high proportion canpartly be attributed to the large area of greenbeaches.
The mainland salt marshes in The Netherlandshave a high proportion of moderate use whichreflects the grazing management of artificial saltmarshes for nature conservation purposes aimingat high biodiversity.
7.3 ProcessesMonitoring is important to record changes in verydynamic ecosystems such as salt marshes. In or-der to build a framework of ecological backgroundsin these dynamic systems, the QSR group will dis-cuss some important features behind the chang-es. Moreover, the effects of sea level rise, changesin land use and maturation will be the core issuesof salt marsh dynamics during the decades tocome. For nature conservation interest in relation
to coastal defense it is important to define thetype of landscape to be protected.
7.3.1 Natural development?The discussion on the naturalness of salt marsheswithin the QSR group resulted in advanced insightsconcerning the target definition and has made itnecessary to relate the habitat-related targets tothe broader landscape scale. As a first step thegroup agreed to the following specification of theterm ‘natural vegetation’ with regard to artificialsalt marshes resulting from sedimentation fields(Target 3): ‘The aim is a salt marsh vegetation di-versity reflecting the geomorphological conditionsof the habitat.’ A second outcome of the discus-sion was the definition of naturalness on a land-scape scale. The group defined two categories.
‘Natural landscapes’ feature a self-stimulateddevelopment and geomorphological conditionsthat are not affected by humans. They show a nat-ural drainage system with meandering creeks andlevees with higher elevation than the adjacentdepressions. They have no erosion protection mea-sures and are not used for coastal defense or agri-cultural purposes. They occur in sandy back-barrierconditions (e.g. Norderney, Spiekeroog, Mellum,Memmert, Scharhörn, Nigehörn, Trischen inGermany, Ameland, Schiermonnikoog in The Neth-erlands and Keldsand, Keldsand Vest and Langli inDenmark).
‘Semi-natural landscapes’ either feature a saltmarsh within sedimentation fields and have aman-made drainage system by ditches or have anextensive wide-stretched natural creek system butare affected by measures to enhance livestockgrazing or cutting. The latter are found on islandsand in foreland clay marshes without sedimenta-tion fields.
Characteristic salt marsh plant species can bepresent in all landscape types. However, theirabundance in typical salt marsh vegetation typesand their spatial arrangement in the vegetationstructure can be affected by drainage, land useand management. The same is true for vegetationtypes.
7. Salt Marshes
Type of landscape Geo-morphological conditions Land use / ExamplesDrainage Erosion protection management
Sediment trappingNatural creeks none none Mellum, NDS, Ameland east,
Schiermonnikoog east, NL
Semi-natural a) natural creeks a) none none / grazing / Skallingen, DKcutting
b) ditches or re- b) groynes Wurster Küste, Buscher Heller, NDS;vitalized creeks Noard Fryslân Bûtendyks, NL
Table 7.3:Outline of the different
landscape-types fromnatural to semi-naturallandscape features and
examples for land use andmanagement.
172
Wadden Sea Ecosystem No. 19 - 2005
Geomorphological conditions may change in thelong term, i.e. decades, whereas the effects ofchanges in land use and management can occurwithin a few years. This hierarchical arrangementon a landscape level implies that changes in landuse and management cannot result in, for exam-ple, a transition from semi-natural into a naturalmarsh as a landscape type but that the vegeta-tion can develop without further human interfer-ence towards the specification of Target 3.
7.3.2 Effects on succession: ageing toclimax
Because of the shifting of the seawall line towardsthe sea combined with the embankment of thebays in the past, natural sedimentation areas aremissing in most parts of the coast today (Dijkemaet al., 2001). So the presence of seawalls as a land-ward boundary and of sedimentation fields as aseaward boundary reduces the dynamic characterof salt marshes. The salt marshes in the sedimen-tation fields grow up in an unnatural high way, onthe other side the sediment is missing in front ofthe sedimentation fields to build new lower saltmarsh. In consequence this corset on the one handmay stabilize the marsh. On the other hand thepolicy of stabilization of the sedimentation fieldsmay prevent a further seaward growth of the hab-itat. This may lead to an ageing of the vegetation.Ageing tends to result in an extension of mid andhigh-marsh communities at the expense of pio-neer and low-marsh communities. Ageing of saltmarshes is a recent focus in research (Esselink2000; Bakker et al., 2003a,b) and ageing was nota topic in the 1999 QSR. At both back-barrier sandymarshes and clayey mainland marshes successionmay proceed towards a tall canopy of few speciessuch as Spartina anglica, Atriplex portulacoides,Elytrigia atherica, Elytrigia repens and Phragmitesaustralis at the lower and mid-high marsh, respec-tively. This succession can run faster in the ab-sence of livestock grazing. This overall trend doesnot appear in every location and several examples– even on a large scale – indicate that the devel-opment does not always show the expected suc-cession (Kiehl et al., 2003; Bakker et al., 2003a,b).Candidates to explain different successional path-ways are inundation frequency, surface elevationchange and cessation of grazing. Monitoring cangive the answer.
Whether the vegetation diversity is reflectedby the geomorphological conditions of the habi-tat (compare Target 3) during only a relatively shortperiod of time (30-60 years) or whether it is along-lasting relationship has neither been stud-
ied in detail nor is well understood. We thus do notknow whether single species will dominate theentire zonation in the absence of livestock grazingor whether a process related to continuousinteraction between the environment and thevegetation will lead to an ongoing rejuvenationin vegetation patterns as proposed in the mosaiccycle theory (e.g. Remmert, 1987). Temporarily die-back of Atriplex portulacoides after severe win-ters is well known (Beeftink et al., 1978). Back-barrier marshes behind an artificial sand dike (e.g.on Terschelling) have a similar age all over themarsh. Hence they show ageing and lack theyounger successional stages. The entire succes-sional series of young, intermediate and old marsh-es can be seen on islands that extend eastward(NL: Schiermonnikoog, Ameland; eastern parts ofthe Niedersachsen islands Juist, Norderney, Lan-geoog, Spiekeroog; HH: Scharhörn, Nigehörn; SH:Trischen). At the long term rejuvenation of agedback-barrier marshes may take place by breach-ing the artificial sand dike or the natural duneridge.
Recent studies (Bakker et al., 2003a,b) revealedthat grazing by small herbivores such as hares andgeese has an impact on salt marsh vegetation, too.Hares can retard natural succession at back-bar-rier marshes for some decades, and hence facili-tate conditions for geese, as shown by compari-son at Schiermonnikoog with hares, and Rot-tumerplaat and Mellum without hares (Kuijper andBakker, 2003). Succession towards a uniform andtall canopy and with it the previously mentionedprocess of ageing can be prevented by large her-bivores such as cattle and sheep or by increasedwater logging of the marsh. These measures facil-itate for both hares and geese (e.g. Schiermonni-koog; Bakker et al., 2003a,b; Leybucht; Bergmannet al., 2003).
7.3.3 Effects of management onsuccession
The 1999 QSR drew attention to the achieved re-duction in livestock grazing. Long-term and fre-quent monitoring in experimental sites on the ef-fects of cessation of livestock grazing on succes-sion reveals in previously exploited salt marshes atrend of increase of tall canopy. This has beenshown at back-barrier marshes (Schiermonnikoog,Terschelling) (Bakker et al., 2003a,b), forelandmarshes with groynes (Netherlands coast, Ley-bucht and Sönke-Nissen-Koog, Germany) (Bakkeret al., 2003a,b), Halligen (Langeness) (Kleyer et al.,2003), brackish marshes (Dollard) (Esselink, 2000)and de-embanked summer polders (Hauener
7. Salt Marshes
173
Wadden Sea Ecosystem No. 19 - 2005
Hooge, Peasemerlannen) (Bakker et al., 2002), thusmimicking the long-term succession at never ex-ploited back-barrier marshes as could be found atthe eastern points of Ameland (Eysink et al., 2000),Schiermonnikoog, Terschelling (Bakker et al.,2003a,b), Rottumerplaat, Mellum (Kuijper andBakker, 2003) and Spiekeroog. Exceptions aremarshes that have been excluded from livestockgrazing during a period of less than 15 years, andsites with a very low rate of sedimentation andhence nitrogen input at a back-barrier marsh(Skallingen) (Bakker et al., 2003a,b), or forelandmarsh with groynes (locally Hamburger Hallig)(Schröder et al., 2002). In semi-natural saltmarshes, both heavy grazing (overall short canopy)and no grazing (overall tall canopy) show lessstructural variation than intermediate grazing(Friedrichskoog, Langeness, Leybucht, Groningenmainland coast) (e.g. Bakker et al., 2003a,b; Esselink,2000, Kiehl et al., 2003; Kleyer et al., 2003).
7.3.4 Effects of sea level riseBy a combination of natural sedimentation andperennial vegetation the elevation of salt marsh-es is able to follow a much increased rise in sealevel compared to the current 0.25 cm/yr. Pub-lished figures are 5 mm/yr for barrier island marsh-es and 10 mm/yr for mainland marshes (Dijkema,1997). Based on the monitoring of 17 years of soilsubsidence due to the extraction of natural gason the barrier island of Ameland even double fig-ures seem possible for the marsh zones closest tothe Wadden Sea (Eysink et al., 2000). On theGroningen mainland coast local problems arosein the pioneer zone in front of the marsh, due,amongst other reasons, to soil subsidence (Sloch-teren gas extraction). A low vegetation cover, par-ticularly of annual species, provided less protec-tion of new sediment, with a subsequently lowernet sedimentation. The effect was cliff erosion ofthe salt marsh, in other words the vertical accre-tion of the marsh zone, continued, but its areadecreased due to lateral erosion. Brushwoodgroynes with a maximum fetch of 200 m solvedthe problem, preventing erosion by waves andcurrents and allowing free exchange of water withsediment to form a gradual transition from theintertidal flats to the marsh (Dijkema et al., 2001).
In general, the natural salt marsh processesfeature a knife cutting both ways in forming highlyvaluable nature and in a self-regulating protec-tion in front of the seawalls, because the eleva-tion of the marshes keeps pace with the increasein sea level and with soil subsidence. The thresh-old value for the intertidal flats seems to be a rela-
tive sea level rise of 0.6 cm/yr. Beyond this thresh-old intertidal flats start to disappear and evenbrushwood groynes will no longer be sufficient tomaintain a pioneer zone and thus protect a saltmarsh in that circumstances. Stone is an unat-tractive but simple alternative to protect the saltmarsh zone at the most exposed parts under thestrict precondition that all the creeks remain opento the Wadden Sea to allow free import of sedi-ment. One more natural alternative practice is anincreased nourishment with sand of the right grainsize to the barriers, to the outer delta or even tothe inner delta to allow more sand transport tothe intertidal flats.
7.4. Salt marsh monitoringThe status of the Wadden Sea salt marshes has tobe discussed in the framework of the trilateral saltmarsh Targets and the EC Habitats Directive. Adetailed monitoring program, as implementedwithin the TMAP and adjusted by the proposedvegetation typology is an essential pre-requisiteto fulfill the normative requirements. The habitattypes 1310 Salicornia and 1320 Spartina includethe pioneer zone, whereas the remainder of thesalt marsh habitats (low marsh, high marsh, sandy,green beach and brackish marsh) are included ina single habitat 1330 Atlantic salt meadows.
7.4.1 Salt marsh monitoring andtrilateral Targets
The Targets of the Wadden Sea Plan include theissues of natural and artificial marshes, morphol-ogy, drainage, vegetation structure and zonation,as well as conditions for migrating and breedingbirds. Within the TMAP Common Package, the fol-lowing salt marsh parameters are monitored:• location and area of salt marshes (every five
years),• vegetation types (every five years),• information concerning land use/management
at least every five years,• information concerning geomorphology and
artificial drainage of salt marshes (every fiveyears).
The vegetation on salt marshes continuouslychanges as a result of natural succession, chang-es in drainage and sedimentation, and in land useand management such as abandoning, grazing,cutting. The changes will occur at various timescales: 1) changes in geomorphology such aslevees/depressions and meandering creeks will takeat least decades to happen; 2) some changes inthe vegetation can occur in a relatively short peri-
7. Salt Marshes
174
Wadden Sea Ecosystem No. 19 - 2005
od of time, i.e. within a few years. Other changestake their time: once a threshold has surpassedafter for instance 20 years, rapid changes havebeen recorded. The long-term changes will affectboth the total area of the habitats and the area ofthe different zones. Short-term changes and year-to-year variation within the different vegetationtypes and abiotic conditions can only be moni-tored by annual recording of permanent plots.
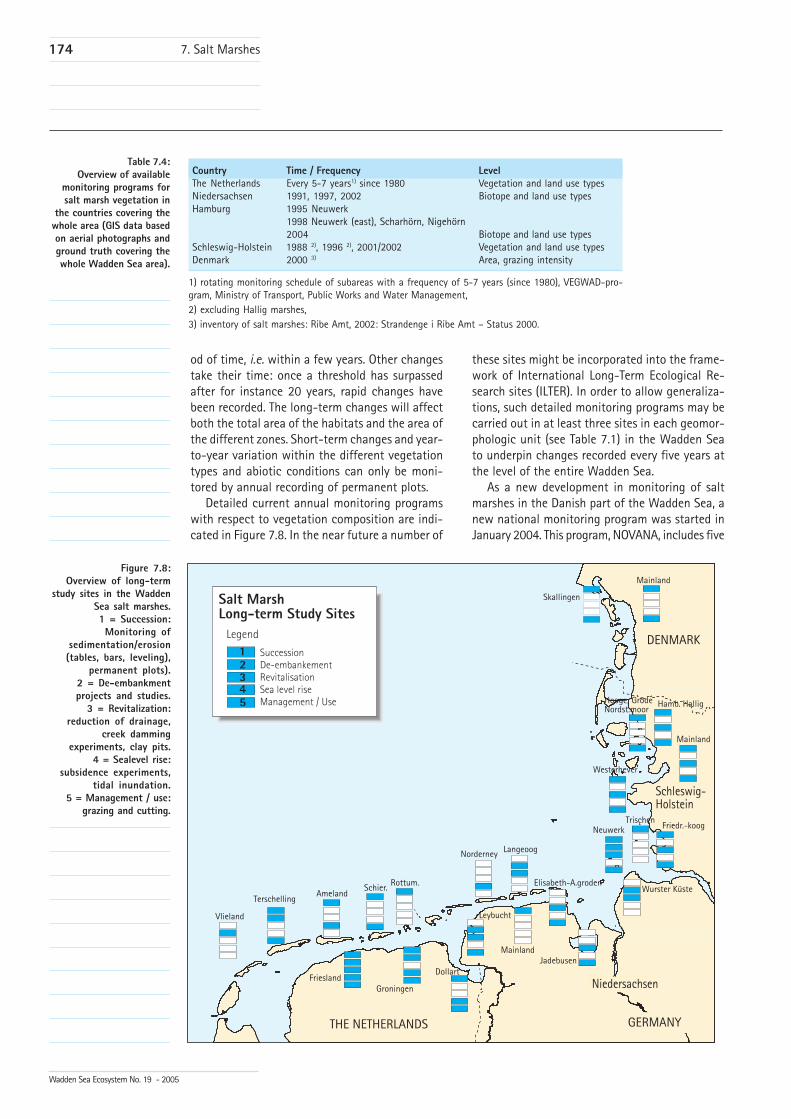
Detailed current annual monitoring programswith respect to vegetation composition are indi-cated in Figure 7.8. In the near future a number of
these sites might be incorporated into the frame-work of International Long-Term Ecological Re-search sites (ILTER). In order to allow generaliza-tions, such detailed monitoring programs may becarried out in at least three sites in each geomor-phologic unit (see Table 7.1) in the Wadden Seato underpin changes recorded every five years atthe level of the entire Wadden Sea.
As a new development in monitoring of saltmarshes in the Danish part of the Wadden Sea, anew national monitoring program was started inJanuary 2004. This program, NOVANA, includes five
Country Time / Frequency LevelThe Netherlands Every 5-7 years1) since 1980 Vegetation and land use typesNiedersachsen 1991, 1997, 2002 Biotope and land use typesHamburg 1995 Neuwerk
1998 Neuwerk (east), Scharhörn, Nigehörn2004 Biotope and land use types
Schleswig-Holstein 1988 2), 1996 2), 2001/2002 Vegetation and land use typesDenmark 2000 3) Area, grazing intensity
1) rotating monitoring schedule of subareas with a frequency of 5-7 years (since 1980), VEGWAD-pro-gram, Ministry of Transport, Public Works and Water Management,2) excluding Hallig marshes,3) inventory of salt marshes: Ribe Amt, 2002: Strandenge i Ribe Amt – Status 2000.
Figure 7.8:Overview of long-term
study sites in the WaddenSea salt marshes.1 = Succession:Monitoring of
sedimentation/erosion(tables, bars, leveling),
permanent plots).2 = De-embankmentprojects and studies.
3 = Revitalization:reduction of drainage,
creek dammingexperiments, clay pits.
4 = Sealevel rise:subsidence experiments,
tidal inundation.5 = Management / use:
grazing and cutting.
Table 7.4:Overview of available
monitoring programs forsalt marsh vegetation in
the countries covering thewhole area (GIS data basedon aerial photographs andground truth covering thewhole Wadden Sea area).
7. Salt Marshes
�6�&4;�
*�6��6*�6;�4���
������(�"$� ������
-6;&4�<
�������������
����������� �����������������
������
����������� �
����� ����������������������� �������������� �
�
��
��
4������
8��������-� ���"��
������0 ; ��#�0
*����������"
� �����
����#���
=����#���
� ������� ���"� "
&�������
6��������$40"� ���5#�������>���
��#(��% 8�����0$% "
����0������"
&�������
� "��-�?��� ����0� �
5�������7��
*�������
�%�����"��
@�������
&�������
-6;&4�<
175
Wadden Sea Ecosystem No. 19 - 2005
intensive and a larger number of extensive studysites (lower monitoring frequency) in Wadden Seasalt marshes. The intensive stations are going tobe monitored every year and the extensive everysixth year. The NOVANA program for salt marshesincludes vegetation analyses and managementdata for each of the 40 plots in each station.
Comprehensive information about the devel-opment of salt marsh vegetation and area for thewhole Wadden Sea has been made available dur-ing the past decade from interpretation of aerialphotographs combined with field mapping (Tab.7.4) and from several long-term study sites (Fig-ure 7.8).
Within the TMAP, a common trilateral classifi-cation scheme for the salt marshes has been de-veloped. The classification is based on the SALT97typology (de Jong et al., 1998) and covers six saltmarsh zones (pioneer zone, low marsh, high marsh,green beach, brackish marsh, fresh grassland).
Additionally, common criteria for areas withhigh and medium stocking rates for livestock graz-ing and no land use as well as for drainage inten-sity have been defined. Thus, for the first time, up-to-date trilateral salt marsh maps for differentthemes (zonation, grazing, drainage) could bemade available covering the whole Wadden Seato assess the implementation of the Wadden SeaPlan Targets.
This information can also be used as basic datafor reporting under the Habitats and Water Frame-work Directives.
7.4.2 Salt marsh monitoring and ECDirectives
The Habitats Directive groups the entire marsh intothe habitat types 1310 Salicornia and 1320 Spar-tina (pioneer zone), whereas the remainder of thesalt marsh habitats (low marsh, high marsh, sandygreen beach and brackish marsh) are included in asingle habitat, 1330 Atlantic salt meadows. Theaim of the Habitats Directive is to ‘maintain orrestore, at a favorable conservation status, natu-ral habitats and species of wild fauna and flora ofCommunity interest’.
Vegetation zonation is not enough to definehabitats and a favorable conservation status. Abi-otic conditions such as inundation frequency trig-ger the vegetation, but the structure of the vege-tation and the species composition also charac-terize habitats. A tall canopy of dominant plantsaffects the occurrence of smaller plants. The struc-ture and species composition of plant communi-ties affect animal populations such as birds andinsects. The vegetation reflects the important zo-nation types, including pioneer zone, low marsh,
high marsh, green beach and brackish marsh, andhuman interference including drainage, groynesand land use. Hence, to fulfill the requirements ofthe Habitats Directive the landscape type as wellas habitat features such as geomorphology, plantcommunities, vegetation structure and the func-tioning of the habitat with respect to animal lifemust be included.
In order to compare areas of different habitatsand changes in habitats, a uniform vegetationclassification for the entire Wadden Sea saltmarshes is an indispensable tool. The TMAP saltmarsh group thus has developed a detailed de-scription of vegetation types covering the six saltmarsh zones. This detailed key, comprising 31 veg-etation types, is needed, for example, to find ac-curate answers about short-term and small-scalechanges of the different vegetation types withinthe marsh, to describe long-term changes in areaand place of vegetation types within the vegeta-tion zones, to analyze the functioning of the veg-etation with respect to animal life, especially be-tween the habitat and vegetation requirementsof certain bird species, such as the barnacle goose.Furthermore the detailed vegetation key is need-ed to analyze the development of single vegeta-tion types, e.g. those belonging to ‘Red Lists’, andto allow a critical analysis of distribution patternsof the vegetation in relation to land use withinand between countries. Zonation data can givethe required answers.
Within the Water Framework Directive (WFD),salt marshes are grouped under the biologicalquality element ‘angiosperms’ for which a ‘goodecological status’ has to be reached by 2015. Moredetailed assessment criteria are currently beingprepared within the WFD intercalibration processwhich will be completed by the end of 2006. Thedeveloped TMAP vegetation key can also be usedas a basis for an assessment within the WFD.
7.5 Conclusionsa. Monitoring and data basis
Significant progress has been made since the 1999QSR in compiling a comprehensive inventory ofall salt marshes in the Wadden Sea based on de-tailed surveys and GIS data analysis. For Denmarkrecent surface data is still lacking. The data couldbe assessed based on harmonized criteria for saltmarsh zones and land use including drainage andgrazing. A more detailed vegetation analysis cannow be carried out by using trilaterally harmo-nized criteria for vegetation types. This tool willallow a more consistent analysis of the salt marshvegetation with regard to the Targets.
7. Salt Marshes
176
Wadden Sea Ecosystem No. 19 - 2005
b. Changes of salt marsh areaAlthough inconsistencies occur between thedatasets from different areas and time periods andtherefore exact figures cannot be given, an in-crease of the Wadden Sea salt marsh area has beenobserved in most areas during the past decades.
In The Netherlands and Germany, roughly 56%of the salt marshes on the islands, and roughly7% of the salt marshes on the mainland have neverbeen artificially drained and are not grazed by live-stock and thus can be regarded as natural. In theHamburg Wadden Sea, about 35% of the saltmarshes have never been influenced by any landuse or artificial drainage. For Danish salt marshesinformation on drainage is not available.
c. De-embankmentAbout 620 ha of salt marshes (240 Niedersachs-en, 40 Hamburg and 340 in NL) have been de-embanked and the possible development of newsalt marsh areas and vegetation development arebeing monitored.
d. Detailed information on land useSince the 1980s, livestock grazing has generallydecreased in the entire Wadden Sea area. A re-duction of 50% of areas with intensive grazingcould be observed on the mainland salt marshesin The Netherlands and Germany whereas in Den-mark the situation has not changed much com-pared to the situation in 1987 (about 70% inten-sive grazing on the mainland). For the northernpart (Ribe County) even an increase of the inten-sively grazed areas could be observed.
In about 39% of the mainland salt marshes, nodrainage measures have been taken during thepast 10 years. In about 60% of the island saltmarshes there were no drainage measures at all,
and in an additional 31% of the island salt marshesno artificial drainage measures have been carriedout during the past 10 years.
e. Ageing of salt marshesAgeing to climax vegetation was observed in someparts of the Wadden Sea which led to the exten-sion of mid and high-marsh communities at theexpense of low-marsh communities on the main-land salt marshes in The Netherlands.
There may be a relation between rate of sedi-mentation, long-term cessation of grazing and thespread of single species such as Spartina anglica,Atriplex prostata, Elytrigia atherica, Elytrigiarepens and Phragmites australis.
f. Common data set for EC DirectivesThe proposed vegetation typology, in combinationwith the other already implemented TMAP param-eters, is a pre-requisite to fulfill the requirementsof describing the ‘favorable conservation status’of the Habitats Directive and the ‘good ecologicalstatus’ of the Water Framework Directive.
7.5.1 Recommendations formonitoring and research
The TMAP Salt Marsh Workshops have furtherspecified the TMAP guidelines for salt marsh mon-itoring as follows:• Location and area of salt marshes can be de-
rived from remote sensing without mappingof vegetation zones or vegetation types,
• Within the habitat ‘salt marsh’, vegetationtypes have to be monitored according to theguidelines. This should be based on the pro-posed classification system in Table 7.2. Theclassification allows harmonization of differ-ent ways of vegetation mapping in the trilat-
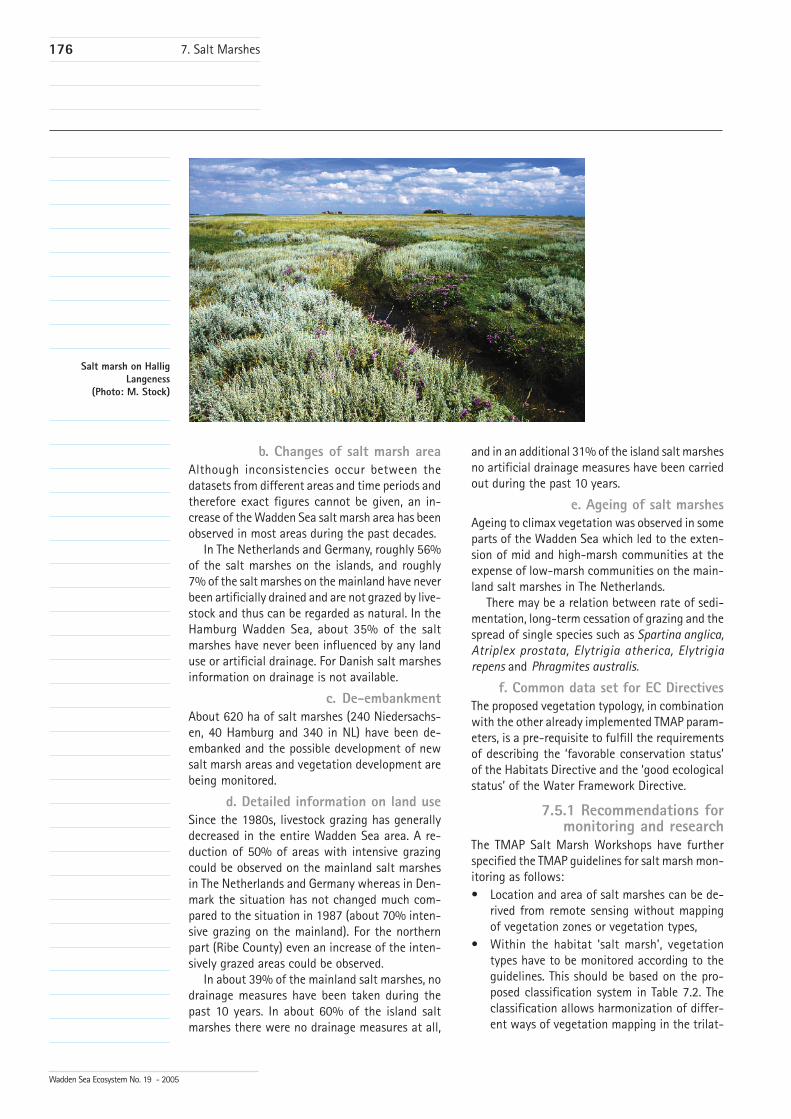
Salt marsh on HalligLangeness
(Photo: M. Stock)
7. Salt Marshes
177
Wadden Sea Ecosystem No. 19 - 2005
eral Wadden Sea area (every five years). Thespecified vegetation classification (31 types)is sufficient to fulfill the requirements of theHabitats Directive.
• An aggregation of the vegetation types are thevegetation zones (pioneer, low, high, brackishmarsh, green beach and fresh grassland).
• To assess the processes, ‘vegetation types’should be monitored at several permanent siteson an annual basis in relation to surface ele-vation changes and management data (Figure7.8).
Because the average frequency for mapping thecomplete area is 5-7 years, it may take 10-14 yearsbefore changes can be detected for the whole area.Therefore, additional long-term study sites withhigher monitoring frequency are required. Long-term study sites are also necessary to understandsalt marsh processes and new developments andto adapt monitoring and management. The resultsof the de-embankment projects (nine sites in theWadden Sea with a total area of 620 ha of saltmarshes, 240 ha Niedersachsen, 40 ha Hamburgand 340 ha in NL) and the results of cessation ofdrainage measures and new groynes have to bemonitored during the coming years, as develop-ments may take several years. In order to evaluatethe results of de-embankments, criteria for suc-cess with respect to tidal amplitude, salinity, plantspecies, plant communities, animal groups needto be developed.
It is recommended that Denmark also shouldprovide comparable data on zonation, grazing anddrainage.
The Wadden Sea may be incorporated into theframework of the International Long-Term Eco-logical Research sites (ILTER) (www.ilternet.edu).
7.5.2 Recommendations formanagement
a. Increased area of natural salt marshesIt is recommended not to disturb the geomorphol-ogy of naturally developing marshes in such plac-es nor as well as in front of sedimentation fields.Mainland salt marsh area is extremely low com-pared to historic references.
Increase of the area of (semi-)natural saltmarshes may take place by breaching summerdikes or sand dikes protecting summer polders.Wherever possible this technique should be ap-plied further. It is under discussion as to whethernew marshes resulting from de-embankment mayinclude man-made creek-systems and livestockgrazing regime.
Rejuvenation of natural salt marshes on barrierislands can be done by removing the artificial sanddikes (and allowing wash-over processes to takeplace).
b. Increased natural morphology anddynamics of artificial salt marshes
Increase of natural geomorphology and dynamicsof artificial marshes can be achieved by the ces-sation of drainage by ditches. Reduction or cessa-tion of drainage by ditches in mainland marshesmay locally result in more natural drainage pat-terns and increased water logging of the marshwith subsequent secondary pioneer vegetation,even within sedimentation fields. It also may re-sult in the development of depressions and levees.
Reduction in artificial drainage accommodatesthe natural situation more and more and can leadto a secondary pioneer zone within marsh depres-sions. In sedimentation fields that have not yetbeen drained by ditches, meandering creeks maydevelop. It is recommended to stop artificial drain-age in all marshes without any land use withoutaffecting the drainage of dike foots. Dug clay pits(as long as they remain separated from the inter-tidal flats) can show a sedimentation and devel-opment of a natural drainage pattern, dependenton their position and their connection to an ex-isting creek system (Metzing and Gerlach, 2003).
c. An improved natural vegetation struc-ture, including the pioneer zone, of
artificial salt marshesIt is recommend to specify Target 3 on ‘naturalvegetation structure’ of artificial salt marshes asfollows: ‘The aim is a salt marsh vegetation diver-sity reflecting the geomorphological conditions ofthe habitat’.
Improved natural vegetation structure in arti-ficial marshes reflecting geomorphological pat-terns can be reached by cessation of drainage inlower sedimentation fields.
On existing salt marshes with a high rate ofsedimentation, ageing may result in monotonousclimax vegetation without livestock grazing. Dif-ferences in geomorphology will be masked by sucha homogeneous vegetation. In such marshes mod-erate grazing may result in high variation of thevegetation structure, if this is the aim. In marsheswith a low rate of sedimentation (1-3 mm/year) adiverse vegetation structure may develop on itsown.
Reduction or cessation of drainage by ditchesin mainland marshes may locally result in morenatural drainage patterns and increased water log-
7. Salt Marshes
178
Wadden Sea Ecosystem No. 19 - 2005
ging of the marsh with subsequent secondary pio-neer vegetation, even within sedimentation fields.
Whether livestock grazing regimes will be ap-plied clearly depends on the target settings forcertain areas. Within national parks a vegetationdevelopment in relation to the geomorphologicalstructure of the habitat is the aim. There is nodefinite aim for a certain composition of flora orfauna. Even within the artificial ‘sedimentationfield’ the habitat should develop by its own andwithout further human interference. In some ar-eas, e.g. outside the national parks, a management
7. Salt Marshes
regime aiming at favorable conditions for migrat-ing and breeding birds via livestock grazing may beapplied. In The Netherlands and Denmark, livestockgrazing is part of salt marsh management toprevent ageing of salt marshes.
d. Favorable conditions for birdsManagement of salt marshes can be a tool toachieve favorable conservation status for birds.Detailed recommendations can be found in chap-ter 12.
ReferencesAndresen, H., Bakker, J.P., Brongers, M., Heydemann, B. andIrmler, U., 1990. Long-term changes of salt marsh communi-ties by cattle grazing. Vegetatio 89: 137-148.
Bakker, J.P., Esselink, P., Dijkema, K.S., van Duin, W.E. and deJong, D.J., 2002. Restoration of salt marshes in The Nether-lands. Hydrobiologia 478: 29-51.
Bakker, J.P., D. Bos and De Vries, Y., 2003a. To graze or not tograze: that is the question. In: Wolff, W.J., Essink, K., Keller-man, A. and Van Leeuwe, M.A. (Eds.). Proceedings of the 10th
International Scientific Wadden Sea Symposium, pp. 67-88.Ministry of Agriculture, Nature Management and Fisheriesand Department of Marine Biology, University of Groningen.
Bakker, J.P., Bos, D., Stahl, J., de Vries, Y. and Jensen, A., 2003b.Biodiversität und Landnutzung in Salzwiesen. Nova Acta Leo-poldina NF 87, 328: 163-194.
Bakker, J.P., Kuijper, D.P.J., van Wijnen, H.J., de Groot, A.V.and de Vries, Y., 2004. Spatio-temporal variation in surfaceelevation changes in back barrier salt marshes in the Wad-den Sea. Geografisk Tidsskrift (submitted).
Balzer, S., D. Boedecker and Hauke, U., 2002. Interpretation,Abgrenzung und Erfassung der marinen und Küstenlebens-raumtypen nach Anhang I der FFH-Richtlinien in Deutschland.Natur und Landschaft 77 (1): 20-28.
Bartholdy, J., Christiansen, C. and Kunzendorf, H., 2004. Longterm variations in backbarrier salt marsh deposition on theSkallingen peninsula - the Danish Wadden Sea. Marine Geol-ogy 203:1-21.
Beeftink, W.G., Daane. M.C., de Munck, W. and Nieuwenhuize,J., 1978. Aspects of population dynamics in Halimione portu-lacoides. Vegetatio 36: 31-43.
Bergmann, H.H., Borbach-Jaene, J., Kruckenberg, H. andWeight. H., 2003. Die Leybucht: Kein Platz für Gänse? EinForschungsprojekt zum Einfluss der Beweidung auf die rast-enden Wildgänse in der Leybucht. Schriftenreihe National-park Niedersächsisches Wattenmeer, Band 5, Nationalparkver-waltung Wilhelmshaven, pp. 40.
Blew, J., Günther, K., Laursen, K., Van Roomen, M., and Süd-beck, P., 2005. Overview on trend and numbers of migratorywaterbirds in the Wadden Sea 1992/93-1999/2000. In Blew,J. and Südbeck, P. (Eds.), 2004. Migratory waterbirds in theWadden Sea 1992/1993-1999/2000. Wadden Sea EcosystemNo. 20 (in press), Common Wadden Sea Secretariat, Wilhelms-haven, Germany.
Bos, D., Drent, R.H., Ebbinge, B.S., Frikke, J., de Jong, D.J.,Koffijberg, K., Madsen, J., Potel, P., Guenther, K., Stock, M. andSüdbeck, P., 2004. Capacity of Wadden Sea coastal grasslandsfor Dark-bellied Geese. Journal of Wildlife Biology (submit-ted).
Bunje, J. and Ringot, J.L., 2003. Lebensräume im Wandel.Flächenbilanz von Salzwiesen und Dünen imniedersächsischen Wattenmeer zwischen den Jahren 1966und 1997. Eine Luftbildauswertung. SchriftenreiheNationalpark Niedersächsisches Wattenmeer, Band 7,Nationalparkverwaltung Wilhelmshaven, pp. 48.
Dijkema, K.J., 1987. Geography of salt marshes in Europe. Z.Geomorph. N.F. 31: 489-499.
Dijkema, K.S., 1997. Impact prognosis for salt marshes fromsubsidence by gas extraction in the Wadden Sea. Journal ofCoastal Research 13: 1294-1304.
Dijkema, K.S. (Ed.), Beeftink, W.G., Doody, J.P., Gehu, J.M. Hey-demann, B. and Rivas Martinez, S., 1984. Salt marshes in Eu-rope. Council of Europe. Nature and Environment Series 30,Strasbourg, pp. 178.
Dijkema, K.S., Nicolai, A., de Vlas, J., Smit, C.J., Jongerius, H.and Nauta, H., 2001. Van landaanwinning naar kwelderwerken.Leeuwarden, Rijkswaterstaat Noord-Nederland en Texel, Al-terra, Research Instituut voor de Groene Ruimte, pp. 68.
Dijkema, K.S., Nicolai, A., Frankes, J. , Haan, K. , Jongerius, H.and Riesenkamp, W., 2004. Jaarverslag 2004. Monitoring enbeheer van de kwelderwerken in Friesland en Groningen (No-vember 2003 - Oktober 2004). Werkgroep Onderzoek Kwel-derwerken. Alterra, Rijkswaterstaat, Texel, Leeuwarden, Delfzijl,pp. 33.

179
Wadden Sea Ecosystem No. 19 - 2005
Duin, W.E. van, Dijkema, K.S., Bunje, J., Pedersen, T.F. andStock, M., 1999. Salt marshes. In: Jong, F. de, Bakker, J.F., vanBerkel, C.J.M., Dankers, N.M.J.A., Dahl, K., Marencic, H. andPotel, P. (Eds.). Wadden Sea Quality Status Report. WaddenSea Ecosystem No. 9, Common Wadden Sea Secretariat,Trilateral Monitoring and Assessment Group, Quality StatusReport Group. Wilhelmshaven, Germany, 165-170.
Ens, B.J., Piersma, T., Zwarts, L. and van de Kam, J., 1999. Ecol-ogische Atlas van de Nederlandse Wadvogels. Schuyt and Co.,Haarlem, pp. 368.Esselink, P., 2000. Nature management ofcoastal salt marshes. Interactions between anthropogenic in-fluences and natural dynamics. Ph.D. thesis, University ofGroningen, 256 p.
Esselink, P., De Leeuw, C., Graveland, J., and Berg, G.J., 2003.Ecologische herstelmaatregelen in zoute wateren. Een ecolo-gische evaluatie over de periode 1990 – 2000. rapport RIKZ/2003.028, Rijksinstituut voor Kust en Zee, Middelburg.
Eysink, W.D., Dijkema, K.S., van Dobben, H.F., Slim, P.A., Smit,C.J., de Vlas, J., Sanders, M.E., Wiertz, J. and Schouwenberg,E.P.A.G., 2000. Monitoring effecten bodemdaling op Ameland-Oost. Evaluatie na 13 jaar gaswinning. Begeleidingscommis-sie Monitoring Bodemdaling Ameland.
Freund, H., Petersen, J. and Pott, R., 2002. Investigations onrecent and subfossil salt marsh vegetation of the East Frisianbarrier islands in the southern North Sea (Germany). Phyto-coenologia 33: 349-375
Frikke, J,. Witt, P., and Ejbye-Ernst, M., 2002. Naturovervågn-ing i Ribe Amt. Strandenge i Ribe Amt. Status 2002. Ribe Amt.
Hellwig-Krüger, L. and Hellwig, U., 1995. Biotoptypenkar-tierung Neuwerk. In: Nationalpark Hamburgisches Watten-meer - Nationalpark-Plan. Arbeitsabschnitt 1995. 54 pp., un-published survey.
Hellwig-Krüger, L. and Hellwig, U., 1997. Biotoptypenkar-tierung Scharhörn und Nigehörn. In: Nationalpark Hamburg-isches Wattenmeer - Nationalpark-Plan. Arbeitsabschnitt1997. 88 pp., unpublished survey.
Heydemann, B., 1981. Ecology of arthropods of the lower saltmarsh. In: Dankers, N, Kühl, H. and Wolff, W.J. (Eds.). Inverte-brate fauna of the Wadden Sea. Report 4 of the Wadden SeaWorking Group. Balkema, Rotterdam, pp. 35 – 57.
Jong, D.J. de, Dijkema, K.S., Bossinade, J.H. and Janssen, J.A.M.,1998. SALT97, een programma voor toedeling van vegetatieop-namen aan vegetatietypen op de kwelder. Rijkswaterstaat(RIKZ, directie Noord-Nederland, Meetkundige Dienst) / In-stituut voor Bos and Natuuronderzoek, Middelburg/Texel.
Kiehl, K., Jensen, K. and Stock, M., 2003. Langfristige Vegeta-tionsveränderungen in Wattenmeer-Salzwiesen in Abhän-gigkeit von Höhenlage und Sedimentation. Kieler Notizen zurPflanzenkunde in Schleswig-Holstein und Hamburg 30: 50-68.
Kleyer, M., Feddersen, H. and Bockholt, R., 2003. Secondarysuccession on a high salt marsh at different grazing intensi-ties. J. Coastal Conservation 9: 123-134.
Koffijberg, K., Blew, J., Eskildsen, K., Günther, K., Koks, B., Laurs-en, K., Rasmussen, L.-M., Südbeck, P. and Potel, P., 2003. Hightide roosts in the Wadden Sea: A review of bird distribution,protection regimes and potential sources of anthropogenicdisturbance. A report of the Wadden Sea Plan Project 34.Wadden Sea Ecosystems No. 16, Common Wadden Sea Sec-retariat, Trilateral Monitoring and Assessment Group, JMMBWilhelmshaven, pp. 119.
Kuijper, D.P.J. and Bakker, J.P., 2003. Large-scale effects of asmall herbivore on salt marsh vegetation succession - A com-parative study on three Wadden Sea islands. J. Coastal Con-servation 9: 179-188.
Maarel, E. van der and van der Maarel-Versluys, M., 1996.Distribution and conservation status of littoral vascular plantspecies along the European coasts. J. Coastal Conservation 2:73-92.
Madsen, J., Cracknell, G. and Fox, T. (Eds.), 1999. Goose popu-lation of the Western Palearctic. A review of status and distri-bution. Wetland International, Wageningen, pp. 344.
Meltofte, H., Blew, J., Frikke, J., Rösner, H.-U. and Smit, C.J.,1994. Numbers and distribution of waterbirds in the WaddenSea. Results and evaluation of 36 simultaneous counts in theDutch-German-Danish Wadden Sea 1980-1991. IWRB Publ.34 / Wader Study Group Bull. 74, Special Issue. CommonWadden Sea Secretariat, Wilhelmshaven, pp. 192.
Metzing,D. and Gerlach,G., 2003. Vegetationsökologie. In:Fleming, B.W. (Ed.). Untersuchung der ökologischen Entwick-lung einer Aussendeichskleipütte als Ergänzung der quanti-tativen Beweissicherung des Wiederverlandungsprozesses.Abschlussbericht. Senckenberg am Meer. Bericht 03-1: 24-48.
Petersen, J., 2001. Die Vegetation der Wattenmeer-Inseln imraumzeitlichen Wandel. Ein Beispiel für den Einsatz modernervegetationsanalytischer Methoden. Ber. d. Reinh.-Tüxen-Ges.13: 139-155.
Petersen, J., 2003. Vegetationskundliche Erfassung nach demVerschluss von Gräben im Salzwiesenbereich auf Norderney.Anlage von Dauerflächen, Vegetationskartierung, Vegetations-vergleich und Bewertung. Unveröffentlichtes Gutachten imAuftrag der Nationalparkverwaltung Nds. Wattenmeer.
Policy Assessment Report, 2001. In: Esbjerg Declaration 2001.Ministerial Declaration of the Ninth Trilateral GovernmentalConference on the Protection of the Wadden Sea. Esbjerg,2001. Common Wadden Sea Secretariat, Wilhelmshaven,pp. 55–109.
Remmert, H., 1987. Sukzessionen im Klimax-Stadium. Verh.Ges. Ökol. XVI: 27-34.
Schröder, H.K., Kiehl, K. and Stock, M., 2002. Directional andnon-directional vegetation changes in a temperate salt marshin relation to biotic and abiotic factors. Applied VegetationScience 5: 33-44.
Stock, M., 2002. Salzwiesenschutz im Wattenmeer. In: Lozán,J. L., Rachor, E., Reise, K., Sündermann, J. and Westernhagen,H. v. (Hrsg.). Warnsignale aus Nordsee and Wattenmeer - Eineaktuelle Umweltbilanz. Wissenschaftliche Auswertungen,Hamburg. 364-368.
Stock, M., 2003. Salzwiesenschutz im Schleswig-Holstein-ischen Wattenmeer. Vogelkdl. Ber. Niedersachs. 35: 115-124.
Stock, M. and Hofeditz, F., 2003. Impact of sheep grazing onhabitat utilisation of barnacle geese (Branta leucopsis) on saltmarshes – implications for management. In: Wolff, W.J., K.Essink, A. Kellerman and M.A. van Leeuwe (Eds.). Proceedingsof the 10th International Scientific Wadden Sea Symposium,pp. 89-106. Ministry of Agriculture, Nature Management andFisheries and Department of Marine Biology, University ofGroningen.
Stock, M., Gettner,S., Hagge, H., Heinzel, K., Kohlus, J. andStumpe, H., 2005. Salzwiesen an der Westküste von Schles-wig-Holstein 1988 - 2001. Schriftenreihe des NationalparksSchleswig-Holsteinisches Wattenmeer, Heft 15, pp. 239.
Trilateral Wadden Sea Plan, 1997. In: Ministerial Declarationof the Eighth Trilateral Governmental Conference on the Pro-tection of the Wadden Sea, Stade, 1997, Annex 1. CommonWadden Sea Secretariat, Wilhelmshaven, pp. 13-83.
7. Salt Marshes

180
Wadden Sea Ecosystem No. 19 - 2005